Article

Revealing the Impact of Investment Benefits on Marketing Decision in Public Infrastructures Based on Game Theory: Case Study of Large-Scale Exhibition Infrastructures in China

1
School of Architecture, South China University of Technology, Guangzhou 510640, China
2
Architectural Design and Research Institute of SCUT, South China University of Technology, Guangzhou 510641, China
3
National Key Laboratory of Subtropical Building Science, South China University of Technology, Guangzhou 510640, China
4
School of Visual Arts Design, Guangzhou Academy of Fine Arts, Guangzhou 510261, China
*
Author to whom correspondence should be addressed.
Buildings 2024, 14(3), 715; https://doi.org/10.3390/buildings14030715
Submission received: 11 January 2024 / Revised: 20 February 2024 / Accepted: 5 March 2024 / Published: 7 March 2024
(This article belongs to the Section Construction Management, and Computers & Digitization)

Abstract

:
Investing in large-scale public infrastructures is vital for urban renewal and development, often relying on specific types of buildings to drive investment in municipal infrastructure and supporting service buildings. However, the complex interplay of interests among investors introduces unpredictability, hindering the effectiveness of such investments. This study employs evolutionary game theory to explore how investment benefits influence investor behavior. Using China’s large-scale exhibition infrastructures as a case study, a tripartite evolutionary game model is developed, involving the government, investors in exhibition buildings, and investors in supporting services. The strategies of the three parties are analyzed, and simulations explore the effects of different initial strategy values, costs, subsidies, and profits. Five research outcomes are identified, indicating that favorable initial investments and optimal subsidies encourage proactive investment, while high initial costs deter it. Consequently, five recommendations for promoting coordinated investment in exhibition facilities are proposed, including the establishment of communication platforms to enhance stakeholder cooperation. These findings offer insights for decision making in other large-scale infrastructure investments, such as sports facilities and transportation hubs.

1. Introduction

Under the context of marketization, government involves social capital in the investment and construction of large-scale public infrastructures, which are considered as some of the pivotal means for the modern renewal and development of cities. Large-scale public infrastructures possess a potent ability to drive investments, often encompassing a range of related construction projects. For instance, Spain’s Bilbao, leveraging the Guggenheim Museum, and China’s Hangzhou, utilizing the International Exhibition Center, have successfully promoted a series of coordinated investments in urban public infrastructures. This approach has effectively spurred urban renewal and development, generating substantial returns for both the government and market investors.
Investment in large-scale public infrastructures involves complex interrelations of interests among the primary investors. The most typical trio of investors includes local government, investors in large-scale public buildings, and investors in supporting service buildings. As an urban administrator, the local government bears the responsibility for constructing and operating municipal infrastructure, enhancing transportation accessibility, and ensuring the efficient utilization of large-scale public buildings and their ancillary services, thereby reaping extensive benefits in tax revenue, politics, and public welfare [1]. With the successful promotion of public–private partnership (PPP) models [2,3], large-scale public buildings are primarily funded by venue investors [4] who seek to generate revenue through their operation. However, conventional returns often fail to cover the costs of public infrastructures [1], leading local governments to typically provide subsidies, such as financial support and tax incentives, to encourage investment behaviors [1,5]. Meanwhile, investors in supporting service buildings devise construction strategies to earn profits by providing various supporting services to the large-scale public buildings [6].
However, investors exhibit dynamic adjustments in their investment throughout the infrastructure development process. Based on fluctuating risks of market investment and benefit assessments, their commitment to investments is not steadfast, potentially leading to hesitant or even canceled investments, which, in turn, cause significant delays in the progress of large-scale public infrastructure investments, diminishment of investment benefits, and suboptimal urban renewal outcomes [7]. Therefore, by investigating the complex interrelations of benefits and the dynamic investment of investors in large-scale public infrastructures investments, guiding them towards scientific and coordinated investment practices is conducive to enhancing the urban renewal impact of large-scale public infrastructures and increasing the returns for all investors involved.
The literature on the PPP Investment model for large-scale public infrastructure lacks research on the dynamic investment behavior involving the government, investors in large-scale exhibition buildings, and investors in supporting service buildings. Most of the literature primarily explores the application areas, government influence, and operational benefits of public–private partnerships (PPPs) in the development of large public infrastructure in different countries and regions. For example, Akomea-Frimpong (2023) analyzed 60 PPP-related articles, revealing that PPP research mainly focuses on areas such as poverty alleviation, urban development, waste management, and risk management [8]. Zhou (2021) used the investment in the subway project in Nantong, China as an example and found that the continuously changing policy interventions of local governments have had long-term effects on the approval and implementation of large public infrastructure projects [9]. Ke (2014) emphasized, through the case of the Beijing National Stadium (Bird’s Nest), the importance of considering the overall value return of the entire project lifecycle when implementing PPP projects, including holistic consideration during the operational stage [7].
Large-scale public infrastructure investment exhibits both abundance and continuity characteristics. Firstly, in terms of abundance, almost every medium- to large-sized city has large-scale public infrastructure investment projects, and a single city may simultaneously undertake multiple large-scale public infrastructure projects, such as exhibition infrastructures, sports infrastructures, and airport infrastructures, among others. Secondly, in terms of continuity, as cities progress through different stages of development, they will continuously generate varying demands for large-scale public infrastructure investment construction.
Evolutionary game theory is apt for analyzing complex interrelations of interests and investment behaviors. Originating in the field of species biology [10], evolutionary game theory possesses two distinct characteristics [11,12,13]: (1) it emphasizes that the stakeholders, akin to local government, exhibition building investors, and supporting service building investors possess bounded rationality, reflecting their roles realistically. The understanding of each other’s decision-making intentions and information about the market, economy, and pandemics is not entirely accurate. (2) Evolutionary game theory underscores dynamic rather than static equilibrium, assuming that participants seek evolutionary stable strategies through continuous trial and error, imitation, and learning [12], which aligns with the scenario where the three types of investors repeatedly adjust their strategies based on the profit analysis. Thus, evolutionary game theory can effectively manage the intricate relationships between multiple stakeholders [14] and provide a reliable analytical paradigm for studying dynamic decision-making behaviors [13].
Evolutionary game theory has been widely employed to enhance the accuracy and scientificity of investment decisions and policy formulation, and it has been extensively utilized in various investment fields, such as new energy [15], electricity [16], agriculture [17], and industry [18]. For instance, Y. Chen et al. (2023) investigated how strategic choices and related parameters among the Chinese government, banks, and automobile manufacturers in the post-subsidy era affect the evolution of system equilibrium, providing theoretical foundations and policy recommendations for promoting the development of China’s NEV industry [15]. L. Xu et al. (2021) analyzed the strategic choice interaction mechanisms among the government, port enterprises, and shipping companies in the implementation of shore power systems using evolutionary game theory. They explored the impact of shore power implementation on the evolutionarily stable strategies (ESS) of multiple stakeholders, contributing to the reduction of marine environmental pollution [16]. Additionally, R. Zhang et al. (2020) investigated the effects of different subsidy policies on agricultural production, environmental innovation investment, and pollution emissions using evolutionary game theory. They also analyzed the impact of these policies on corporate profits, consumer surplus, and social welfare, providing decision support for the government to formulate reasonable subsidy policies and promoting the sustainable development of agricultural production and environmental protection [17].
Evolutionary game theory has gradually made its way into the realm of construction research. Currently, it is primarily used in studies on investments in sustainable constructions [19,20,21,22,23]. Liu et al. (2022) constructed a tripartite evolutionary game model involving the government, suppliers, and developers to explore the incentive mechanisms and decision-making behaviors of stakeholders in the supply market of sustainable construction [19]. Li et al. (2023) developed an evolutionary game model involving financial institutions, developers, and consumers in the context of investments in sustainable construction to examine measures that promote the development of sustainable constructions [20]. Furthermore, Yang et al. established an evolutionary game model for government and private sector decisions regarding the renovation of sustainable constructions, aiming at encouraging the private sector’s investment in the refurbishment of high-energy-consuming constructions [21].
Therefore, this paper provides innovative perspectives and subjects and holds significant practical guidance value for governments and market investors participating in large-scale public infrastructure investments.

2. Case Study

In recent years, China has witnessed a surge in the construction of large-scale exhibition infrastructures, aiming to promote the political, economic, and cultural development of cities through the development of the meetings, incentives, conventions, and exhibitions (MICE) industry [24]. Initially, investment in exhibition facilities was limited to Beijing, Shanghai, and Guangzhou, but it has since expanded to over 100 other cities. Despite China’s exhibition building area being only 5 million square meters in 2011, it is projected to exceed 15.85 million square meters by 2025, making it the country with the largest aggregate exhibition building area in the world.
Large-scale exhibition infrastructures involve a series of investment activities, encompassing not only investments in large exhibition buildings, but also in urban infrastructure, such as roads, airports, and electricity. Additionally, they include investments in related supporting service facilities, like hotels, restaurants, and shopping malls [25,26,27].
Different investors have different investment benefits. For instance, local governments may gain extensive comprehensive benefits, including political, economic, social, and cultural benefits. Investors in exhibition buildings primarily receive government subsidies and rental income from venues, while investors in supporting services earn income by providing services to exhibition visitors. When these three parties invest together, it helps enhance the local exhibition competitiveness, potentially increasing the investment returns for all parties involved [28,29].
The investors’ investment decisions are not simply about investing or not investing but are rather a dynamic process of change. Due to intense market competition, complex interrelations of interests, and asymmetric investment information, the three parties will undergo dynamic evaluations of investment returns. As a result, the three parties may repeatedly adjust their investment behaviors, potentially leading to delays in the progress of facility investments centered around exhibition buildings, reduced investment returns, and unsatisfactory urban renewal effects [1].
In summary, the variety of facility types, multiple investment entities, diverse investment return objectives, and dynamic investment decision-making behaviors associated with large-scale exhibition facilities have increased the difficulty of coordinated investment. This paper takes investment in exhibition buildings and related facilities as an example, utilizing evolutionary game theory to examine the interests and behaviors of governments, investors in exhibition buildings, and investors in supporting services. The aim is to explore strategies that promote scientific collaboration among the three parties, thereby facilitating urban renewal development and enhancing investment benefits.
Research Steps
(1)
Analyze the complex interrelations of interests among the main investors involved in the construction of exhibition infrastructures. Utilize evolutionary game theory to construct a decision-making model for local government, exhibition building investors, and supporting service building investors, and analyze stable strategies.
(2)
Investigate the mutual influences and evolutionary trends of the three types of investors’ investment decisions, clarifying the extent to which different factors impact their investment choices.
(3)
Based on the research findings, propose countermeasures and recommendations to promote more scientific and rational investments in exhibition infrastructures by the three types of investors. These guidelines aim at directing the investment in other similar large-scale public infrastructures.

3. Research Methodology

3.1. Assumptions and Key Variables

Hofbauer, J. and Sigmund, K. (1998) provided a comprehensive introduction to evolutionary game theory, covering aspects such as strategy sets, payoff matrices, genetic algorithms, dynamic games, and evolutionarily stable strategies (ESS) [30]. Hofbauer, J. offers readers an in-depth understanding of evolutionary game theory, encompassing many important concepts and methods in the field.
Research on the economic benefits associated with the exhibition industry helps to hypothesize key parameters for the tripartite evolutionary game model. For instance, Kim et al. (2010) utilized the multiplier effect of an input–output model to estimate the economic impact of hosting the convention [31]. Mody et al. (2016) demonstrated that destinations with well-equipped exhibition facilities will have greater competitiveness, thereby gaining more synergistic benefits [32]. Whitfield et al. (2014) introduced government subsidies and policy support for exhibition investors [33]. Through these studies, key parameters such as basic profits, synergistic benefits, and subsidy policies for different investors can be set.
Therefore, this paper constructs an evolutionary game model among local governments, venue operators, and service providers as follows:
Assumption 1.
Each stakeholder may undertake two strategies with the following probabilities: the probability of local governments investing in exhibition infrastructures is assumed to be x, and the probability of them not investing is 1 − x. The probability of exhibition building investors investing in an exhibition building is assumed to be y, and the probability of them not investing is 1 − y. Finally, the probability of supporting service building investors investing in supporting infrastructures is assumed to be z, and the probability of them not investing is 1 − z. These probabilities are such that 0 ≤ x, z, y ≤ 1 and respectively denote the likelihood of the stakeholder adopting a certain strategy. All three stakeholders are risk-neutral and aim to maximize their own interests.
Assumption 2.
In the context where local governments invest in the infrastructures, they will incur an upfront cost of Cg to improve the municipal infrastructures and operation management, leading to an elementary earning of Bg1. At this time, if the exhibition building investors invest in the exhibition building, the local governments will earn an additional earning of Bg2. If the supporting service building investors upgrade the supporting infrastructures, the local governments will earn an additional earning of Bg3. Lastly, if both the exhibition building investors and supporting service building investors invest proactively, the local governments will receive an additional earning of Bg4, where Bg4 > Bg2 + Bg3. In turn, the local governments will provide subsidies Ct to the exhibition building investors and Cp to the supporting service building investors to promote proactive investments by both of them.
Conversely, in the context where the local governments do not invest, they will neither bear any upfront costs, nor provide subsidies to the exhibition building investors and supporting service building investors. At this time, if the exhibition building investors invest in the exhibition building, the local governments will earn an additional earning of Bg5. If the supporting service building investors invest in supporting infrastructures, the local governments will earn an additional earning of Bg6. Lastly, if both the exhibition building investors and supporting service building investors invest proactively, the local governments will earn an additional earning of Bg7, where Bg7 > Bg5 + Bg6.
Assumption 3.
In the context where the exhibition building investors invest in the exhibition building, an upfront cost of Ct is incurred for its construction and operation, leading to an elementary earning of Bt1. At this time, if the local governments invest in the infrastructures, the exhibition building investors will earn an additional earning of Bt2. If the supporting service building investors invest in the supporting infrastructures, the exhibition building investors will earn an additional earning of Bt3. Lastly, if both the local governments and supporting service building investors invest proactively, the exhibition building investors will earn an additional earning of Bt4, where Bt4 > Bt2 + Bt3. Conversely, in the context where the exhibition building investors do not invest, there will be neither upfront costs nor earnings.
Assumption 4.
In the context where the supporting service building investors build or upgrade supporting infrastructures on existing ones, an upfront cost of Cp is incurred, leading to an elementary earning of Bp1. At this time, if the local governments invest in the infrastructures, the supporting service building investors will earn an additional earning of Bp2. If the exhibition building investors invest in the exhibition building, the supporting service building investors will earn an additional earning of Bp3. If both the local governments and exhibition building investors invest proactively, the supporting service building investors will earn an additional earning of Bp4, where Bp4 > Bp2 + Bp3.
Conversely, in the context where the supporting service building investors do not build or upgrade supporting infrastructures, no upfront costs will be incurred. At this time, if the local governments invest in the infrastructures, the supporting service building investors will earn an additional earning of Bp5. If the exhibition building investors invest in the exhibition building, the supporting service building investors will earn an additional earning of Bp6. If both the local governments and exhibition building investors invest proactively, the supporting service building investors will earn an additional earning of Bp7, where Bp7 > Bp5 + Bp6. Table 1 describes the preceding parameters.

3.2. Establishing and Solving the Evolutionary Game Model

Based on the assumptions above and related variables, the pay-off matrix for the tripartite evolutionary game is obtained (Table 2).
Expected earnings from local government’s investments, Eg1:
Eg1 = (Bg4 − Bg3 − Bg2)·y·z + Bg2·y + Bg3·z + Bg1 − Rt·y − Rp·z − Cg
Expected earnings from local government’s non-investment decision, Eg2:
Eg2 = (Bg7 − Bg6 − Bg5)·y·z + Bg5·y + Bg6·z
Mean expected earnings for local government, Eg3:
Eg3 = x·Eg1 + (1 − x)·Eg2
Iterative dynamic equation for local government’s investments F(x) = x·(Eg1 − Eg3), where
F(x) = x·(1 − x)·[(Bg4 + Bg5 + Bg6 − Bg2 − Bg3 − Bg7)·y·z + (Bg2 − Bg5)·y + (Bg3 − Bg6)·z + Bg1 − Rt·y − Rp·z − Cg]
Expected earnings from exhibition building investors’ investments, Et1:
Et1 = (Bt4 − Bt3 − Bt2)·x·z + Bt2·x + Bt3·z + Bt1 + Rt·x − Ct
Expected earnings from exhibition building investors’ non-investment decision, Et2: Et2 = 0
Mean expected earnings for exhibition building investors, Et3:
Et3 = x·Eg1 + (1 − x)·Eg2
Iterative dynamic equation for exhibition building investors’ investments F(y) = y·(Et1 − Et3), where:
F(y) = y·(1 − y)·[(Bt4 − Bt3 − Bt2)·x·z + Bt2·x + Bt3·z + Bt1 + Rt·x − Ct]
Expected earnings from supporting service building investors’ investments, Ep1:
Ep1 = (Bp4 − Bp3 − Bp2)·x·y + Bp2·x + Bp3·y + Bp1 + Rp·x − Cp
Expected earnings from supporting service building investors’ non-investment decision, Ep2:
Ep2 = (Bp7 − Bp6 − Bp5)·x·y + Bp5·x + Bp6·y
Mean expected earnings for supporting service building investors, Ep3:
Ep3 = x·Ep1 + (1 − x)·Ep2
Iterative dynamic equation for supporting service building investors’ investments F(z) = z·(Ep1 − Ep3), where:
F(z) = z·(1 − z)·[(Bp4 − Bp3 − Bp2 + Bp5 + Bp6 − Bp7)·x·y + (Bp2 − Bp5)·x + (Bp3 − Bp6)·y + Bp1 + Rp·x − Cp]

3.3. Analysis of Points of Equilibrium under Evolutionarily Stable Strategy

Setting Equations (4), (7), and (11) as 0 yields eight possible points of equilibrium: E1 (1, 1, 1), E2 (1, 1, 0), E3 (1, 0, 1), E4 (1, 0, 0), E5 (0, 1, 1), E6 (0, 1, 0), E7 (0, 0, 1), and E8 (0, 0, 0). For the differential system-based points of equilibrium, their stability can be determined from the Jacob eigenvalues. The Jacob matrix for the tripartite evolutionary game is as follows:
J = F ( x ) d x F ( x ) d y F ( x ) d z F ( y ) d x F ( y ) d y F ( y ) d z F ( z ) d x F ( z ) d y F ( z ) d z = ( 1 2 x ) · g ( 1 ) x · ( 1 x ) · g ( 2 ) ( 1 2 x ) · g ( 3 ) y · ( 1 y ) · g ( 4 ) ( 1 2 y ) · g ( 5 ) y · ( 1 y ) · g ( 6 ) z · ( 1 z ) · g ( 7 ) z · ( 1 z ) · g ( 8 ) ( 1 2 z ) · g ( 9 )
where:
  • g(1) = (Bg4 + Bg5 + Bg6 − Bg2 − Bg3 − Bg7)·y·z + (Bg2 − Bg5)·y + (Bg3 − Bg6)·z + Bg1 − Rt·y − Rp·z − Cg
  • g(2) = (Bg4 + Bg5 − Bg2 − Bg7)·z + (Bg2 − Bg5) − Rt
  • g(3) = (Bg4 + Bg5 + Bg6 − Bg2 − Bg3 − Bg7)·y + (Bg3 − Bg6) − Rp
  • g(4)= (Bt4 − Bt3 − Bt2)·z + Bt2 + Rt
  • g(5) = (Bt4 − Bt3 − Bt2)·x·z + Bt2·x + Bt3·z + Bt1 + Rt·x − Ct
  • g(6) = (Bt4 − Bt3 − Bt2)·x + Bt3
  • g(7) = (Bp4 − Bp3 − Bp2 + Bp5 + Bp6 − Bp7)·y + (Bp2 − Bp5)·x + Rp
  • g(8) = (Bp4 − Bp3 − Bp2 + Bp5 + Bp6 − Bp7)·x + Bp3 − Bp6
  • g(9) = (Bp4 − Bp3 − Bp2 + Bp5 + Bp6 − Bp7)·x·y + (Bp2 − Bp5)·x + (Bp3 − Bp6)·y + Bp1 + Rp·x − Cp
Within the tripartite evolutionary game dynamic equation system, the stability of the eight possible points of equilibrium is analyzed through the commonly used Jacobi eigenvalue algorithm. Any points of equilibrium for which all three eigenvalues are less than 0 are considered as an evolutionarily stable strategy (ESS). Conversely, any points of equilibrium for which at least one eigenvalue is greater than 0 are considered as unstable points. The eigenvalues λ of the eight points are outlined in Table 3.
An examination of the eight points of equilibrium above reveals that differences in the upfront costs, subsidies, elementary earnings, and additional earnings will govern the three stakeholders’ decision making. It should be noted that investments in exhibition infrastructures represent an industrial investment subjected to industrial life cycles. Since the exhibition industry is still rapidly developing, scholarly attention has chiefly revolved around its initiation phase, growth phase, and maturation phase [34], during each of which the stakeholders adopt different stable strategies.

3.3.1. Initiation Phase

During the initiation phase, the municipal infrastructures and the supporting service buildings for a given city are relatively poor, and the exhibition market is very poor. The local government focuses on improving such municipal infrastructures. Although this involves high upfront costs, improved infrastructures will promote urban development. In pursuit of the substantial benefits from the prospective exhibition industry, the local government tends to prioritize proactive investments. For exhibition building investors and supporting service building investors, their individual earnings and additional earnings are far less than their upfront capitals, and governmental subsidies are limited. This scenario may be denoted, respectively, as Ct > Bt1 + Bt4 + Rt and Cp > Bp1 + Bp4 + Rp, leading to inaction among both providers. Accordingly, the three-way evolutionarily stable strategy tends towards Point E4 (1, 0, 0) (Figure 1a).

3.3.2. Growth Phase

During the growth phase, the municipal infrastructures and the supporting service buildings are gradually improved. With growing economic activities and outward influences of the city, the exhibition market is gradually developing. For the local government, despite its objective of financially benefiting from the exhibition economy, budgetary constraints cause it to prioritize promoting investments from exhibition building investors in exhibition buildings as the engine for developing the industry. Although Bg1 is less than Cg, Bg2 is anticipated to significantly increase such that when Bg1 + Bg2 is greater than Cg + Rt, the government will then tend to invest. For the exhibition building investors, their cost (Ct) is greater than the earnings (Bt1 and Bt2); however, the incoming subsidies (Rt) are anticipated to increase. When Bt1 + Bt2 + Rt is greater than Ct, the exhibition building investors will tend to invest. Lastly, for the supporting service building investors, the newly built exhibition buildings in this incipient stage lack the appeal to draw in visitors in large numbers. Moreover, governmental subsidies (Rp) are limited, resulting in Cp being greater than Bp1 + Bp4 + Rp. Thus, the supporting service building investors will adopt the position of not investing. On the whole, the implications are twofold: the three parties tend not to invest, i.e., Point E8 (0, 0, 0), or only the local government and exhibition building investors invest together, i.e., Point E2 (1, 1, 0) (Figure 1b).

3.3.3. Maturation Phase

In the maturation phase, the municipal infrastructures and the supporting service buildings are more developed. The upfront costs are reduced not only for the local government’s investments in basic infrastructures, but also for the supporting service building investors’ investments in high-end service infrastructures, leading to greater competitiveness of the exhibition building. With a growing number of visitors to the venue, the elementary earnings of the three stakeholders will be improved. Nonetheless, the stakeholders’ upfront costs may still be higher than their elementary earnings (i.e., Cg > Bg1, Ct > Bt1, and Cp > Bp1), leading to their avoidance of investments, i.e., Point E8 (0, 0, 0). On the other hand, given the increasing outward influences of the city in this phase, additional earnings from the stakeholders’ proactive investments rise significantly: when Bg1 + Bg4 > Cg + Rt + Rp, Bt1 + Bt4 + Rt > Ct and Bp1 + Bp4 + Rp > Cp, they tend to invest and stabilize at Point E1 (1, 1, 1) (Figure 1c).

4. Simulation Results and Analysis

The goals of exhibition cities in China are manifold: to promote coordinated investment and construction of exhibition infrastructures; to develop a mature exhibition industry; and to expand the investment returns of all investors. Against this background, this paper adopts the stable Point E1 (1, 1, 1) as the scenario of interest and uses Matlab2021(b) to numerically simulate each stakeholder’s evolutionary trajectory. This enables us to more intuitively demonstrate the influences of key elements in an iterative dynamic system on the evolution and results of the tripartite game [19].
To ensure more reasonable parameter settings, this paper not only refers to studies related to China’s overall exhibition economy [24,35], but also incorporates detailed research on the exhibition economic data of specific Chinese cities, such as Hangzhou [36], Macau [37], and the Pearl River Delta region [38]. Additionally, it appropriately integrates research on the exhibition economy from other regions [6,31,39,40], resulting in parameter assignments, as shown in Table 4.

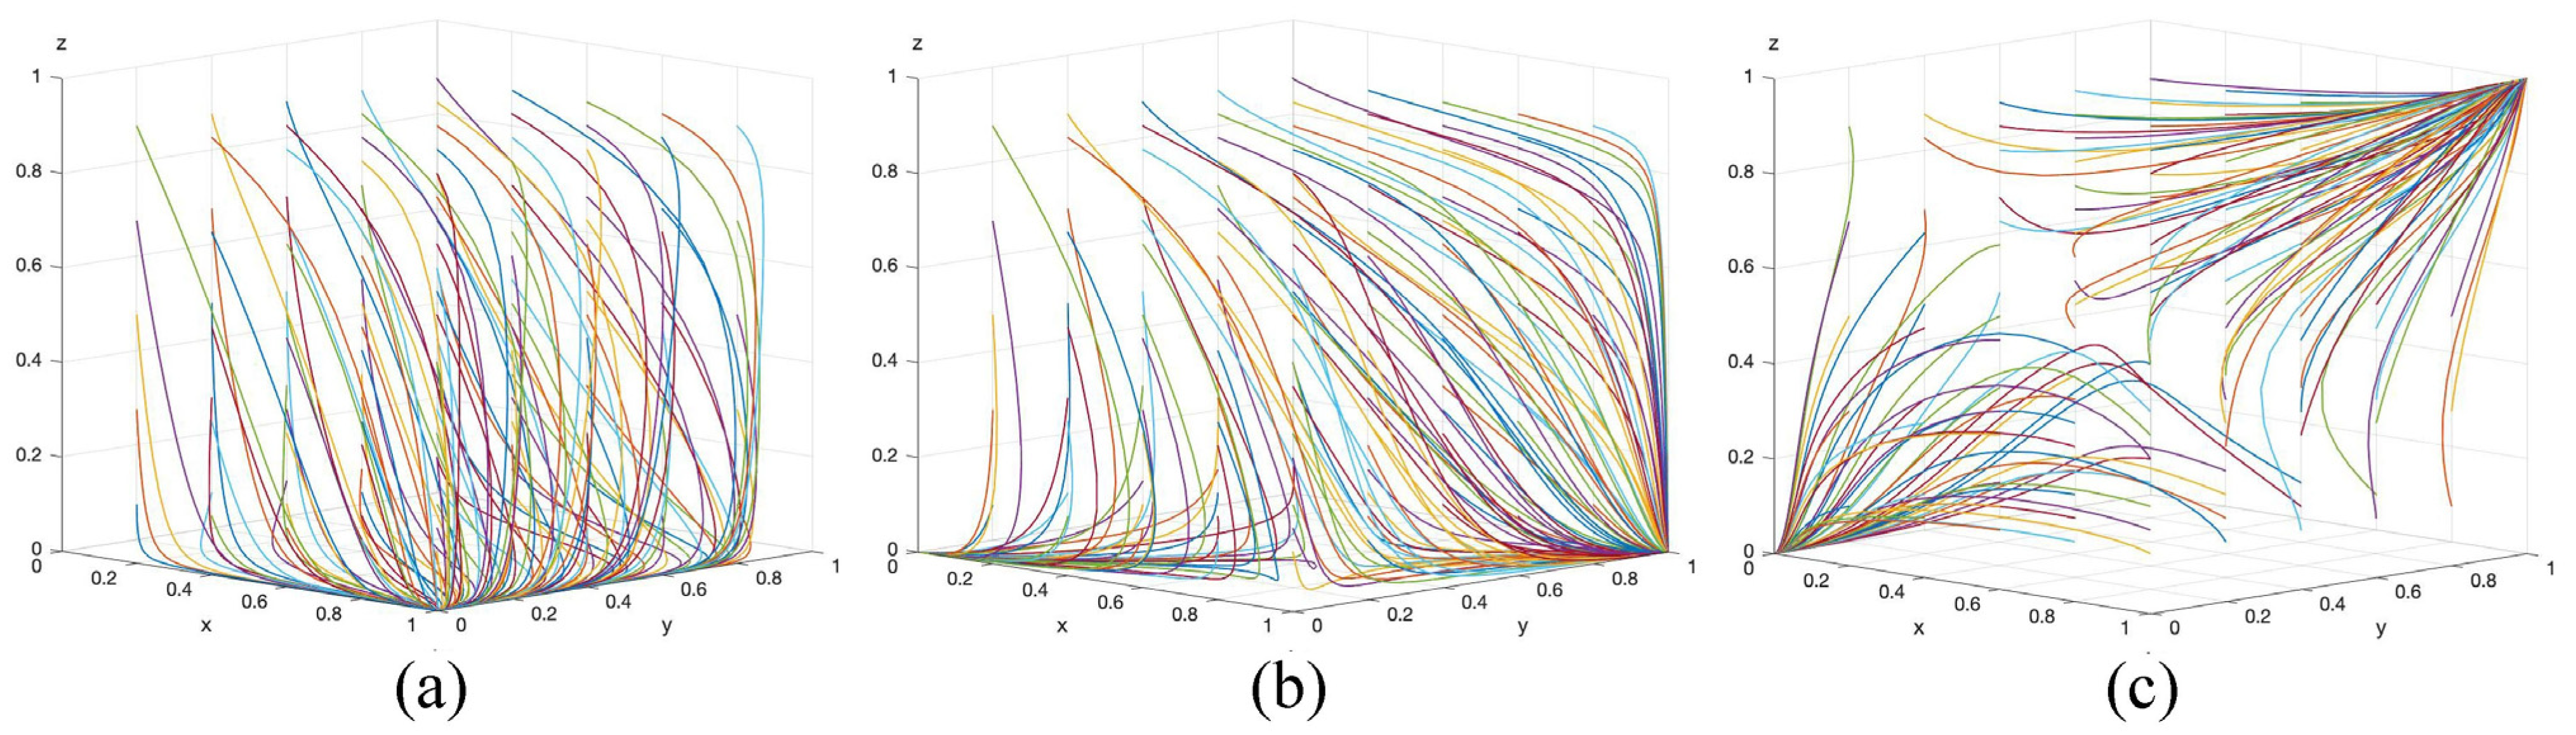
4.1. Analysis of Initial Strategies

To examine the effects of initial strategies on the tripartite evolutionary game, the three stakeholders’ initial values of x0, y0, and z0 are simulated to begin their trajectories from 0.5, 0.6, and 0.7. Figure 2a shows the effect of x0 = y0 = z0 = 0.5 on the evolutionary trajectories of x, y, and z. Figure 2b shows the effect of x0 = y0 = z0 = 0.6 on the evolutionary trajectories of x, y, and z. Figure 2c shows the effect of x0 = y0 = z0 = 0.7 on the evolutionary trajectories of x, y, and z. It can be observed that increasing initial values promote the evolution of the stakeholders’ investment decisions.
For initial values lower than 0.5, the three stakeholders’ exhibit evolution towards non-investment behaviors, among which the exhibition building investors most rapidly evolve towards 0.
(1)
For initial values of 0.6, the scenario is threefold. In the early stage, the local government and exhibition building investors rise steadily, whereas the supporting service building investors decline. In the intermediate stage, the supporting service building investors abruptly rise in a rapid manner. Meanwhile, the local government exhibits a heightened rate of increase, whereas the exhibition building investors modestly increase its rate of increase. In the late stage, the supporting service building investors surpass the exhibition building investors, reaching 1 at the same time as the local government.
(2)
For an initial value of 0.7, the local government most rapidly evolves towards 1, while both exhibition building investors and supporting service building investors demonstrate comparable rates of evolving towards to 1.
Investments in exhibition infrastructures are characterized by high upfront costs and high risks. In this context, the three stakeholders are mutually reliant, none of whom may invest independently of the other two. Given their wait-and-see behaviors, any one stakeholder’s changes in decision making will induce the other two to promptly adjust their strategies. When all three stakeholders demonstrate a strong willingness in initial investments, it is easier for the local government to assume the leading role in investing, and the exhibition building investors and supporting service building investors will then accordingly be more inclined to likewise commit their investments.

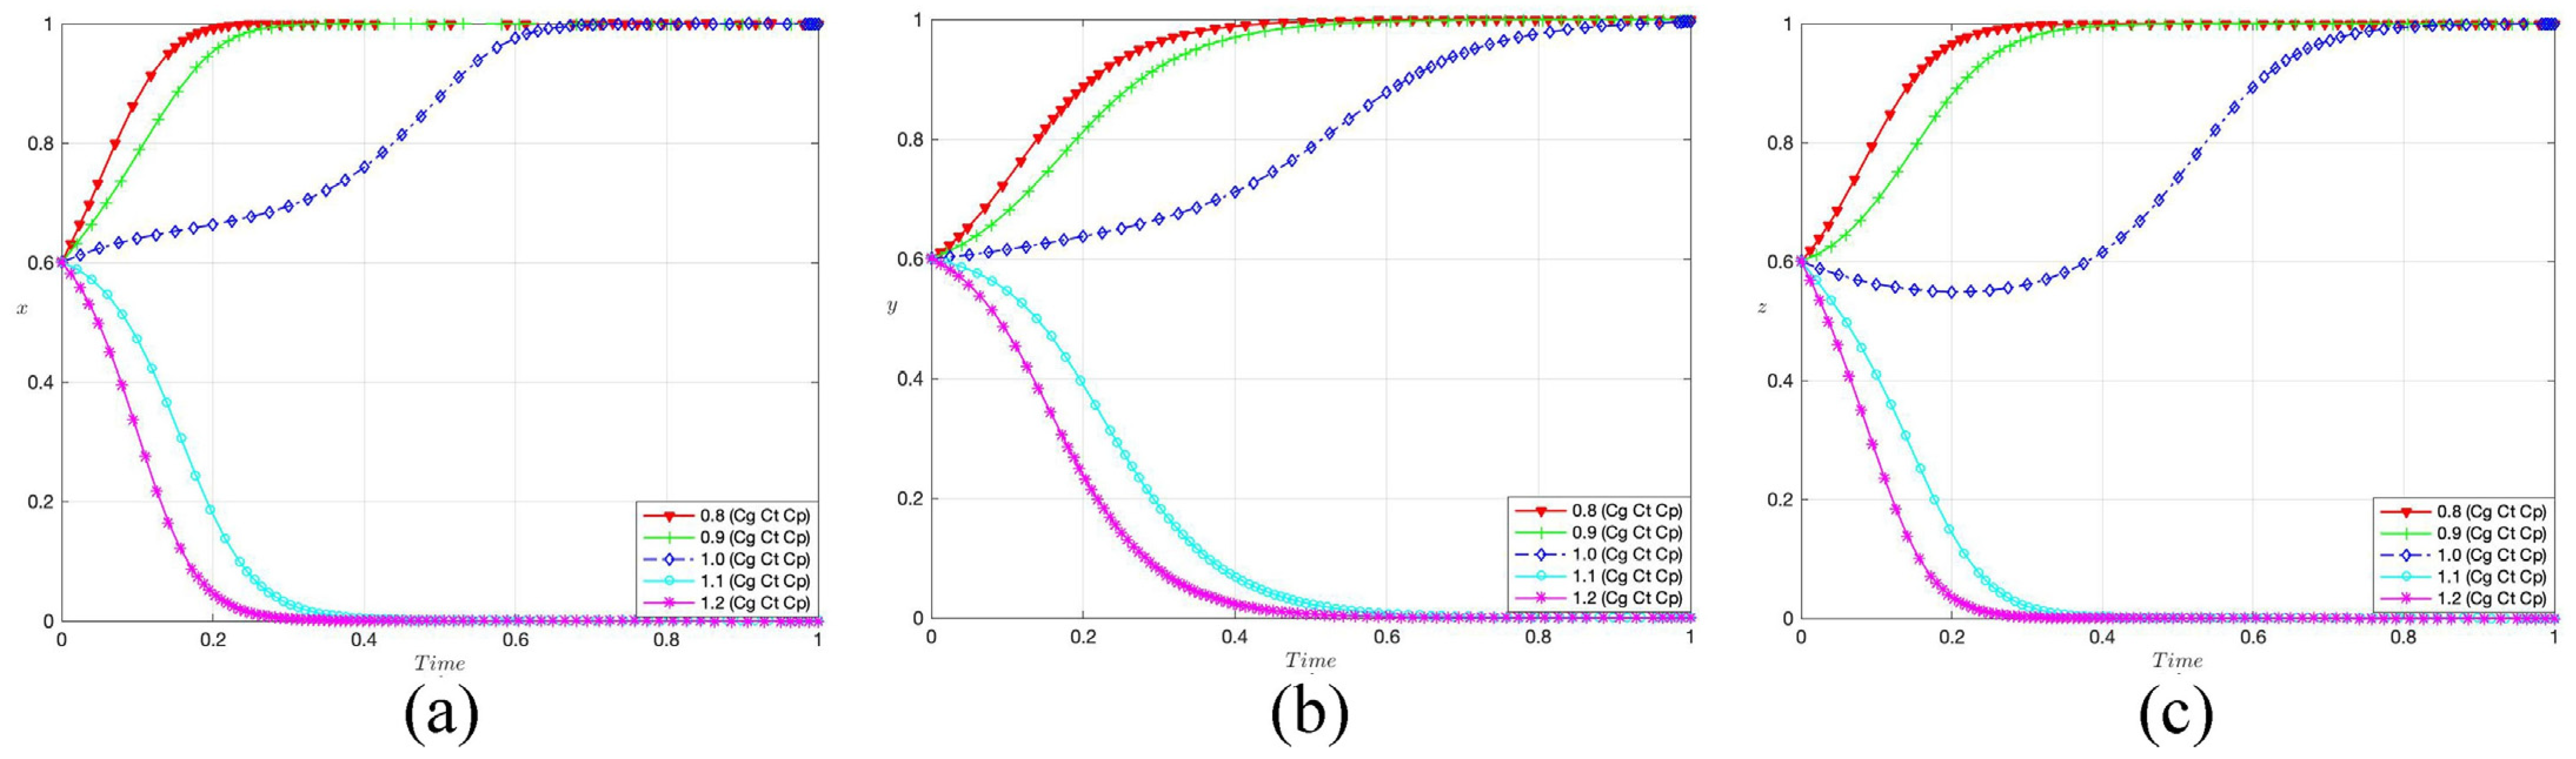
4.2. Analysis of Upfront Costs

To examine the effects of upfront costs on the three stakeholders’ evolving strategies on different scales of construction, Cg, Ct, and Cp are varied by different factors (0.8, 0.9, 1.0, 1.1, and 1.2 times the original parameters), while the earnings are kept constant. Figure 3a shows the evolutionary trajectories of x when changing the values of Cg, Ct, and Cp to 0.8 to 1.2 times their original parameters. Figure 3b shows the evolutionary trajectories of y when changing the values of Cg, Ct, and Cp to 0.8 to 1.2 times their original parameters. Figure 3c shows the evolutionary trajectories of z when changing the values of Cg, Ct, and Cp to 0.8 to 1.2 times their original parameters. Increased upfront costs cause all three stakeholders to rapidly evolve towards non-investment behaviors, whereas decreased costs cause them to rapidly evolve towards proactive investments. Nonetheless, the stakeholders’ sensitivity to such costs is different. When the upfront costs are increased, supporting service building investors (z) evolve towards 0 most rapidly, while exhibition building investors (y) evolve towards 0 at the slowest pace. Conversely, when the costs are decreased, the local government (x) evolves towards 1 most rapidly, while exhibition building investors (z) evolve towards 0 at the slowest pace.
Upfront costs based on the scale of construction crucially govern all three stakeholders’ decision making. Any expansion of the scale of construction will heighten the financial pressure and investment risks for the stakeholders. Accordingly, reducing the scale will allay their concerns and drive them to evolve towards proactive investments. Among the stakeholders, the local government demonstrates the greatest interest in constructions. The exhibition building investors are the least cost-sensitive, probably because substantial governmental subsidies can mitigate their cost concerns. Contrarily, given their highly market-oriented operations, the supporting service building investors are the most cost-sensitive in that they are more risk-averse in investing when upfront costs are higher, and vice versa.

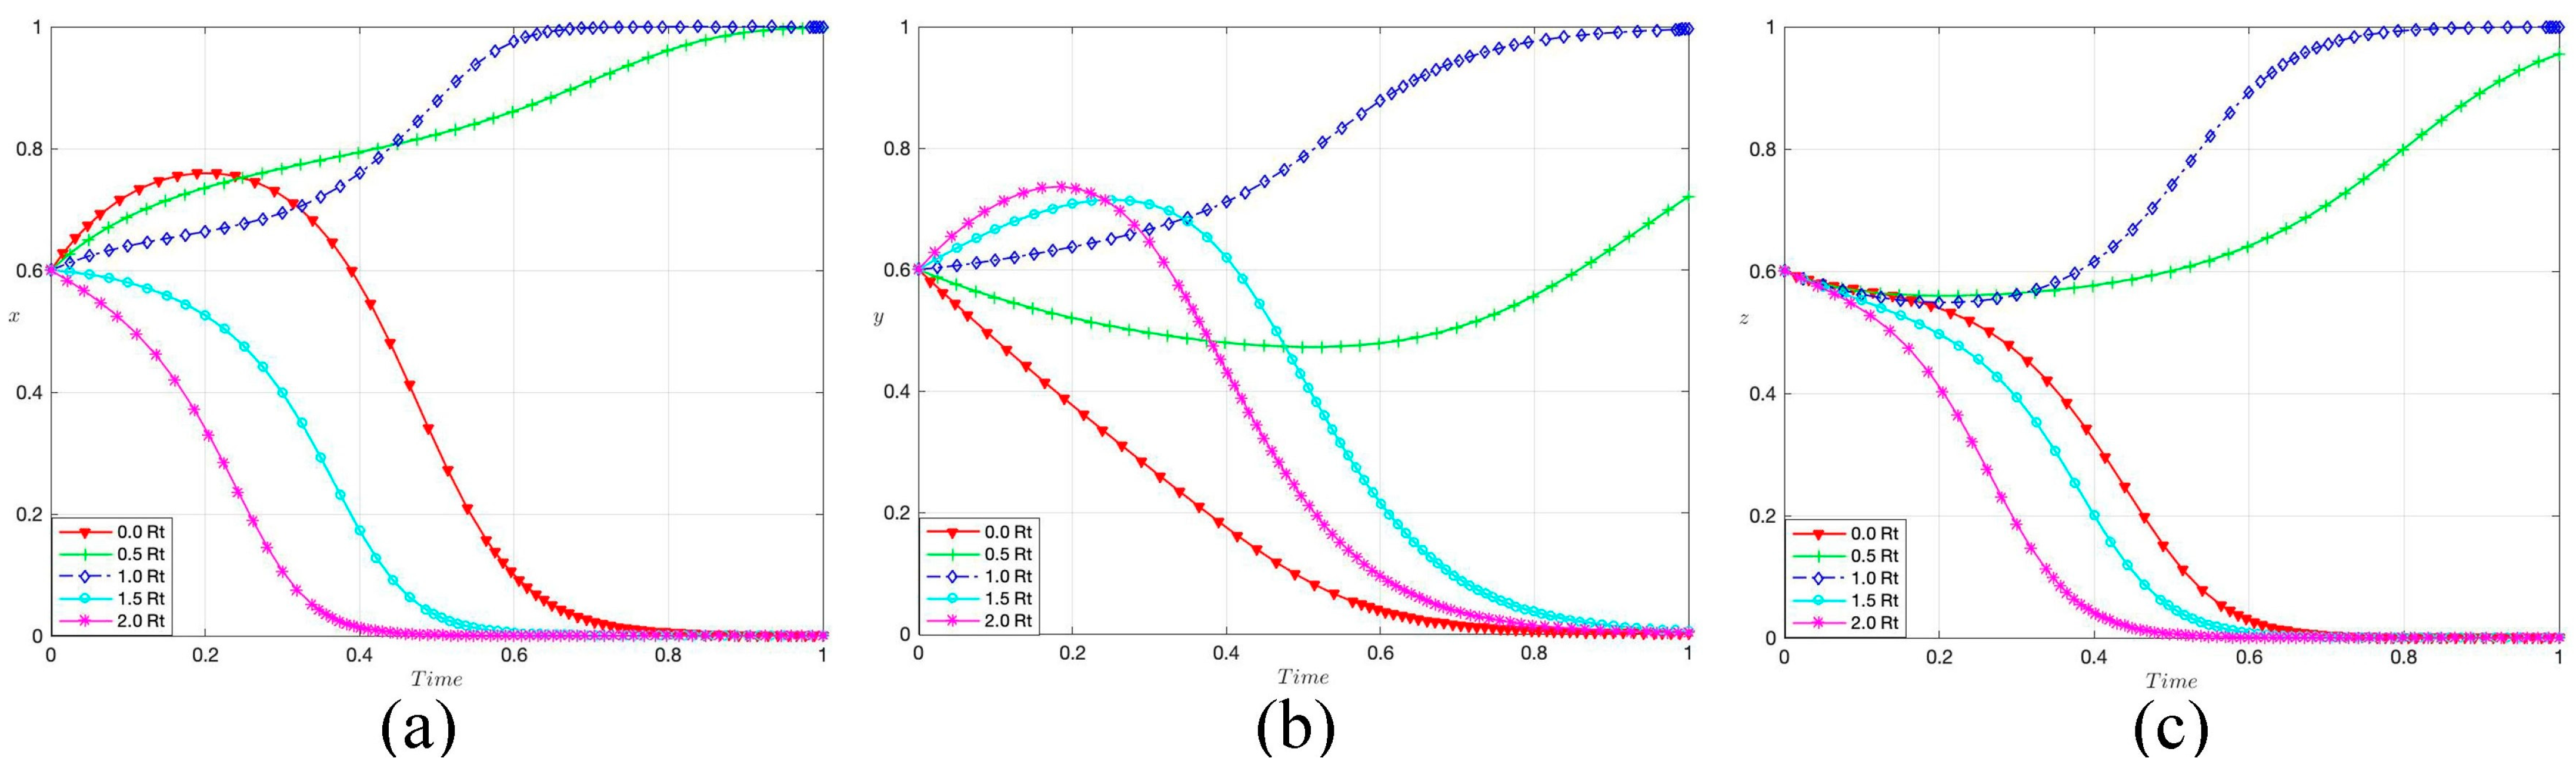
4.3. Analysis of Subsidies

To examine the effects of governmental subsidies for exhibition building investors on the tripartite evolutionary game, the parameter denoting subsidies (Rt) is varied by different factors (0, 0.5, 1.0, 1.5, and 2.0 times of the original parameters). Figure 4a shows the evolutionary trajectories of x when changing the values of Rt to 0 to 2 times its original parameters. Figure 4b shows the evolutionary trajectories of y when changing the values of Rt to 0 to 2 times its original parameters. Figure 4c shows the evolutionary trajectories of z when changing the values of Rt to 0 to 2 times its original parameters. Increasing the factor for Rt from 0 to 1 induces the three stakeholders to evolve towards proactive investments. However, increasing it further to 1.5 and to 2 induces them to evolve towards non-investment decisions. It is crucial to recognize the role of the subsidies in influencing the initial behaviors of the local governments and the investors. With a rising Rt, the exhibition building investors grow increasingly enthusiastic in the initial phase, whereas the local government becomes progressively uninterested. The quantitative implications are as follows.
(a)
When the subsidy is lower than 0.5 Rt, the exhibition building investors will not be adequately motivated, leading to their non-investment behaviors and, by extension, all three stakeholders’ evolution towards 0.
(b)
When the subsidy is 0.5 Rt, the appeal to the exhibition building investors remains limited. Despite their unwillingness in the initial phase, proactive investments from the local government and supporting service building investors drive them to likewise evolve towards committing to investments.
(c)
When the subsidy is 1.0 Rt, this represents an ideal condition aligned with the expectations of both the local government and the exhibition building investors. Their proactive investments hence underpin the rapid evolution of the tripartite system towards 1.
(d)
When the subsidy exceeds 1.0 Rt, the local government is disinclined to invest since they are unwilling to accept such an excessively high subsidy, driving the evolution of the tripartite decision making towards 0.
Additionally, to examine the effects of governmental subsidies for supporting service building investors on the tripartite evolutionary game, Rp is varied by similar factors. Figure 5a shows the evolutionary trajectories of x when changing the values of Rp to 0 to 2 times its original parameters. Figure 5b shows the evolutionary trajectories of y when changing the values of Rp to 0 to 2 times its original parameters. Figure 5c shows the evolutionary trajectories of z when changing the values of Rp to 0 to 2 times its original parameters. Adjustments for Rp yield evolutionary results similar to those for Rt. In other words, there is a certain range within which increasing Rp will support all stakeholders’ evolution towards proactive investments. However, beyond the upper bound of this range, increasing Rp will lead them to refuse investments. Moreover, a comparison between Figure 4b and Figure 5c shows that the angle of convergence between 0 Rt and 2.0 Rt of the exhibition building investors is greater than that between 0 Rp and 2.0 Rp of the supporting service building investors. This suggests the exhibition building investors are more cost-sensitive than the supporting service building investors. This may be because subsidies account for a larger proportion of the exhibition building investors’ total earnings, hence their greater dependence on the upfront costs.

4.4. Analysis of Elementary Earnings

To examine the effects of different elementary earnings on the tripartite evolutionary game, Bg1, Bt1, and Bp1 are varied by different fact Rp ors (0.6, 0.8, 1.0, 1.2, and 1.4 times the original parameters). Figure 6a shows the evolutionary trajectories of x when changing the values of Bg1 to 0.6 to 1.4 times its original parameters. Figure 6b shows the evolutionary trajectories of y when changing the values of Bt1, to 0.6 to 1.4 times its original parameters. Figure 6c shows the evolutionary trajectories of z when changing the values of Bp1 to 0.6 to 1.4 times its original parameters. Increasing elementary earnings cause the three stakeholders to rapidly evolve towards 1, whereas decreasing earnings drive them towards 0. However, they exhibit different response speeds: the local government and supporting service building investors respond relatively promptly, whereas the exhibition building investors are the slowest. In this context, the elementary earnings critically affect the stakeholders’ decision making in that raising such earnings will drive their evolution towards proactive investments. The local government and supporting service building investors pay more attention to their elementary earnings, which accounts for a larger proportion of their total earnings. Contrarily, the exhibition building investors are less affected by elementary earnings, probably because substantial governmental subsidies lessen their need to strive for such earnings.

4.5. Analysis of Additional Earnings through Clustered Construction

To examine the tripartite evolutionary game under different incremental returns of coordinated investment, Bg4, Bt4, and Bp4 are varied by different factors (0.6, 0.8, 1.0, 1.2, and 1.4 times the original parameters). Figure 7a shows the evolutionary trajectories of x when changing the values of Bg4, Bt4, and Bp4 to 0.6 to 1.4 times their original parameters. Figure 7b shows the evolutionary trajectories of y when changing the values of Bg4, Bt4, and Bp4 to 0.6 to 1.4 times their original parameters. Figure 7c shows the evolutionary trajectories of z when changing the values of Bg4, Bt4, and Bp4 to 0.6 to 1.4 times their original parameters. Increasing additional earnings cause the three stakeholders to rapidly evolve towards 1, whereas decreasing earnings drive them towards 0. One noteworthy comparison is that when increased by a given factor, additional earnings can drive the tripartite evolution towards 1 more substantially than elementary ones (Figure 6). Similarly, when decreased by a given factor, the additional earnings can more substantially drive it towards 0.
Another noteworthy comparison is that the three stakeholders are more sensitive to changes in the additional earnings than in the elementary ones; thus, maximizing such additional earnings represents a pursuit of their common interests. In this context, coordinated investment in exhibition infrastructures projects a positive image, enabling the stakeholders to attract high-quality customers in large numbers and elevate service premiums in an increasingly competitive market. By this time, the additional earnings will account for the largest proportion of the aggregate earnings of each of the stakeholders, all of whom thus prioritize such collaborative yields. Moreover, a coordinated investment in exhibition infrastructures improves the operational efficiency of exhibition infrastructures, lowers upfront costs, and augments the stakeholders’ additional earnings.

5. Discussion

In order to promote the coordinated investment of exhibition infrastructures by local government, exhibition building investors, and supporting service building investors, based on the analyses above, the following suggestions are proposed.
(a)
Establishing a platform for communication
The data from Figure 2, Figure 3, Figure 4, Figure 5, Figure 6 and Figure 7 indicate that the proactive actions of one stakeholder frequently have a positive influence on the evolutionary investment decisions of the other two. This underscores the significance of information dissemination for achieving harmonized investment in exhibition infrastructures. In practical applications, improving communication can effectively mitigate the hesitancy among the three stakeholders, facilitating quicker and more synchronized investment decisions, thereby conserving time. The local government is pivotal in this communication framework, and it is imperative that it establishes strong relationships with the investors in both supporting service buildings and exhibition buildings. This will enhance information flow and improve the coordination of investment strategies, ensuring that all parties share in the rewards and risks associated with such investments.
(b)
Enhancing the regulatory mechanism for construction scale management
An analysis derived from Figure 3 indicates that prudent management of the construction scale and a reduction in initial capital outlays can effectively motivate stakeholder investment and encourage collaborative funding. In certain Chinese cities, intense competition has resulted in the overdevelopment of exhibition infrastructures, far surpassing local demand, which poses significant financial risks to stakeholders and contributes to substantial carbon emissions and resource wastage. As the primary stakeholder, the local government should provide strategic direction to the conventions and exhibitions sector by controlling the scope of construction and setting appropriate development objectives. This strategic alignment with urban growth requirements aims to minimize unnecessary capital expenditures.
(c)
Establishing a dynamic subsidy mechanism
As depicted in Figure 4 and Figure 5, insufficient subsidies do not adequately motivate investors, while overly generous ones place a significant financial strain on the local government, leading to a disinclination to invest. In this scenario, the judicious application of subsidies at the outset is expected to accelerate the stakeholders’ transition towards investment. Therefore, the local government should establish sensible subsidy parameters through the communication platform to ensure that the subsidies align with the expectations of both the government and the exhibition building investors. This approach will hasten the progression of the tripartite dynamic towards active investment, thereby reducing the period of indecision among stakeholders.
However, prolonged reliance on substantial subsidies may lead exhibition building investors to become fiscally dependent on the local government, diminishing their incentive to seek market-oriented profits and hindering their ability to fully capitalize on the exhibition buildings to draw in visitors. Consequently, the local government should strategically phase out the subsidies (Rt) for exhibition building investors in tandem with the industry’s developmental phases. This approach will foster ongoing vitality, motivate the operators to proactively engage more visitors, and ultimately enhance the financial outcomes for all parties involved, contributing to the industry’s expansion.
(d)
Expanding market-oriented operations
An analysis from Figure 6 reveals that enhanced basic earnings act as a catalyst for the three stakeholders to engage in synchronized investments. It is important to acknowledge that traditional exhibition facilities are predominantly aimed at non-local clientele, with peak periods alternating with extended off-peak seasons. Consequently, stakeholders should not only enhance the attractiveness of these facilities during peak times, but also tap into the local market during quieter periods. They should diversify the services offered by the infrastructure to include activities that cater to the community’s recreational, sports, and cultural needs, such as weddings and concerts. This approach will boost the stakeholders’ basic earnings and maximize the social utility of the existing exhibition infrastructures.
(e)
Establishing a mechanism of coordinated investment
As depicted in Figure 7, enhanced additional earnings encourage the three stakeholders to engage in proactive investment strategies. In this scenario, the establishment of a tripartite coordinated investment and communication system can enhance the competitiveness of exhibition infrastructures, reduce initial capital expenditures, and subsequently increase additional earnings. Here are some illustrative examples: firstly, under this new system, enhanced stakeholder collaboration will foster a comprehensive array of infrastructure types, facilitating the integrated development of services such as exhibition halls, hotels, catering, offices, and entertainment venues. This approach prevents the dominance of any single infrastructure type, ensuring a balanced ecosystem. Secondly, the mechanism ensures consistency in scale and quality across exhibition buildings, service infrastructures, and basic facilities. This dual benefit prevents the dilution of the overall infrastructure appeal due to the suboptimal use of individual components and avoids resource wastage and excessive carbon emissions from overqualified infrastructures. Lastly, the mechanism facilitates better integration of exhibition infrastructures with urban spaces, including strategic site selection and efficient transportation planning, both of which enhance operational efficiency and reduce operational costs.

6. Conclusions

In order to promote the behavior of coordinated investment of investors under the development of large-scale urban public infrastructures, this paper selects large-scale exhibition infrastructures as a typical case and constructs a tripartite evolutionary game model of local government, exhibition building investors, and supporting service building investors. Drawing on data on earnings ratios from multiple cities in China, we have not only set reasonable simulation parameters, but also dynamically simulated and analyzed the effects of initial strategies, upfront costs, subsidies, elementary earnings, and additional earnings on three-way evolutionary decision making. Finally, according to the results, five suggestions are offered to provide a reference for other types of large-scale public infrastructure investment.
The study’s simulations reveal that initial investment strategies, upfront costs, subsidies, elementary earnings, and additional earnings significantly influence the investment decisions of stakeholders in large-scale exhibition infrastructures. Higher initial investment probabilities and optimal subsidy levels encourage proactive investment, while high upfront costs and low elementary earnings deter it. The sensitivity to these factors varies among stakeholders, with local governments being most responsive to construction scale and exhibition building investors being less cost-sensitive due to government subsidies. Additional earnings from coordinated investments have a more pronounced impact on investment decisions, highlighting the importance of collaborative strategies for maximizing returns and enhancing urban renewal outcomes.
To foster coordinated investment in exhibition infrastructures, this paper recommends establishing a communication platform to enhance stakeholder collaboration, implementing a dynamic subsidy mechanism to balance investor motivation and government fiscal health, and expanding market-oriented operations to diversify revenue streams. It also suggests a regulatory framework for construction scale management to align with urban development goals and a coordinated investment mechanism to integrate infrastructure with urban spaces, ensuring efficient operations and cost reduction.
However, some shortcomings in this paper merit further research. Firstly, this paper classifies investors into three categories, of which the supporting service building investors may further be differentiated into hotels, catering, offices, entertainments, and others. Additionally, this paper draws on several exhibition economics to obtain the simulation parameters. Further validation and research of these parameters may be performed in the future to improve their accuracy.

Author Contributions

Conceptualization, methodology, writing—original draft preparation, Z.C.; validation, formal analysis, investigation, C.M.; writing—review and editing, visualization, supervision, project administration, funding acquisition, C.L. All authors have read and agreed to the published version of the manuscript.

Funding

Financial support was received from the State Key Laboratory of Subtropical Building Science, South China University of Technology (Grant No. 2019ZB11) and the State Key Laboratory of Subtropical Building Science, South China University of Technology (Grant No. 2022ZB11).

Data Availability Statement

Data are contained within the article.

Conflicts of Interest

The authors declare no conflicts of interest.

References

  1. Clark, J.D. Considering a Convention Center. J. Conv. Event Tour. 2005, 6, 5–21. [Google Scholar] [CrossRef]
  2. Cai, J.; Lin, J.; Yang, Z.; Zhou, X.; Cheng, Z. Retro or Renewal: An Assessment of PPP Management and Policy in China Since 2014. Public Work. Manag. Policy 2020, 26, 359–380. [Google Scholar] [CrossRef]
  3. Chan, A.P.C.; Lam, P.T.I.; Chan, D.W.M.; Cheung, E.; Ke, Y. Critical Success Factors for PPPs in Infrastructure Developments: Chinese Perspective. J. Constr. Eng. Manag. 2010, 136, 484–494. [Google Scholar] [CrossRef]
  4. Liu, T.; Wilkinson, S. Large-scale public venue development and the application of Public–Private Partnerships (PPPs). Int. J. Proj. Manag. 2014, 32, 88–100. [Google Scholar] [CrossRef]
  5. Hong Kong: Government to Extend Convention and Exhibition Industry Subsidy Scheme and to Provide Immediate Relief to Convention and Exhibition Industry. MENA Report. 8 October 2021. Available online: https://www.proquest.com/docview/2580246201/citation/9DE34455B6A74863PQ/1 (accessed on 15 June 2022).
  6. Kim, D.-K.; Kim, H.-J.; Lee, S.-M.; Choe, Y.; Song, S.-Y. An Estimation of the Contribution of the International Meeting Industry to the Korean National Economy Based on Input—Output Analysis. Tour. Econ. 2015, 21, 649–667. [Google Scholar] [CrossRef]
  7. Ke, Y. Is public–private partnership a panacea for infrastructure development? The case of Beijing National Stadium. Int. J. Constr. Manag. 2014, 14, 90–100. [Google Scholar] [CrossRef]
  8. Akomea-Frimpong, I.; Jin, X.; Osei-Kyei, R.; Kukah, A.S. Public–private partnerships for sustainable infrastructure development in Ghana: A systematic review and recommendations. Smart Sustain. Built Environ. 2021, 12, 237–257. [Google Scholar] [CrossRef]
  9. Zhou, S.; Zhai, G.; Lu, Y.; Shi, Y. The development of urban mega-projects in China: A case study of Nantong’s metro project. Environ. Plan. B Urban Anal. City Sci. 2019, 48, 759–774. [Google Scholar] [CrossRef]
  10. Smith, J.M.; Price, G.R. The Logic of Animal Conflict. Nature 1973, 246, 15–18. [Google Scholar] [CrossRef]
  11. Hofbauer, J.; Sandholm, W.H. Evolution in games with randomly disturbed payoffs. J. Econ. Theory 2007, 132, 47–69. [Google Scholar] [CrossRef]
  12. Friedman, D. On economic applications of evolutionary game theory. J. Evol. Econ. 1998, 8, 15–43. [Google Scholar] [CrossRef]
  13. Huang, X.; Lin, Y.; Lim, M.K.; Zhou, F.; Ding, R.; Zhang, Z. Evolutionary dynamics of promoting electric vehicle-charging infrastructure based on public–private partnership cooperation. Energy 2022, 239, 122281. [Google Scholar] [CrossRef]
  14. Shan, S.-N.; Duan, X.; Ji, W.-Y.; Zhang, T.-T.; Li, H. Evolutionary game analysis of stakeholder behavior strategies in ‘Not in My Backyard’ conflicts: Effect of the intervention by environmental Non-Governmental Organizations. Sustain. Prod. Consum. 2021, 28, 829–847. [Google Scholar] [CrossRef]
  15. Chen, Y.; Zhan, M.; Liu, Y. Promoting the Development of China’s New-Energy Vehicle Industry in the Post-Subsidy Era: A Study Based on the Evolutionary Game Theory Method. Energies 2023, 16, 5760. [Google Scholar] [CrossRef]
  16. Xu, L.; Di, Z.; Chen, J.; Shi, J.; Yang, C. Evolutionary game analysis on behavior strategies of multiple stakeholders in maritime shore power system. Ocean. Coast. Manag. 2021, 202, 105508. [Google Scholar] [CrossRef]
  17. Zhang, R.; Ma, W.; Liu, J. Impact of government subsidy on agricultural production and pollution: A game-theoretic approach. J. Clean. Prod. 2020, 285, 124806. [Google Scholar] [CrossRef]
  18. Zhang, C.; Zhang, X. Evolutionary game analysis of air pollution co-investment in emission reductions by steel enterprises under carbon quota trading mechanism. J. Environ. Manag. 2022, 317, 115376. [Google Scholar] [CrossRef] [PubMed]
  19. Liu, Y.; Zuo, J.; Pan, M.; Ge, Q.; Chang, R.; Feng, X.; Fu, Y.; Dong, N. The incentive mechanism and decision-making behavior in the green building supply market: A tripartite evolutionary game analysis. J. Affect. Disord. 2022, 214, 108903. [Google Scholar] [CrossRef]
  20. Li, S.; Zheng, X.; Zeng, Q. Can Green Finance Drive the Development of the Green Building Industry?—Based on the Evolutionary Game Theory. Sustainability 2023, 15, 13134. [Google Scholar] [CrossRef]
  21. Yang, X.; Zhang, J.; Shen, G.Q.; Yan, Y. Incentives for green retrofits: An evolutionary game analysis on Public-Private-Partnership reconstruction of buildings. J. Clean. Prod. 2019, 232, 1076–1092. [Google Scholar] [CrossRef]
  22. Yang, Y.; Yang, W.; Chen, H.; Li, Y. China’s energy whistleblowing and energy supervision policy: An evolutionary game perspective. Energy 2020, 213, 118774. [Google Scholar] [CrossRef]
  23. Cohen, C.; Pearlmutter, D.; Schwartz, M. A game theory-based assessment of the implementation of green building in Israel. Build. Environ. 2017, 125, 122–128. [Google Scholar] [CrossRef]
  24. Zhang, Y.; Qu, H.; Guo, Y. A Study of the Agglomeration of China’s Convention Industry: An Economic and Neo-Economic Geography Framework Approach. Tour. Econ. 2011, 17, 305–319. [Google Scholar] [CrossRef]
  25. Crouch, G.I.; Del Chiappa, G.; Perdue, R.R. International convention tourism: A choice modelling experiment of host city competition. Tour. Manag. 2019, 71, 530–542. [Google Scholar] [CrossRef]
  26. Jo, D.; Park, H.-Y.; Choe, Y.; Kim, D.-K. Destination-selection attributes for international association meetings: A mixed-methods study. J. Destin. Mark. Manag. 2019, 13, 61–72. [Google Scholar] [CrossRef]
  27. Jin, X.; Weber, K.; Bauer, T. Impact of clusters on exhibition destination attractiveness: Evidence from Mainland China. Tour. Manag. 2012, 33, 1429–1439. [Google Scholar] [CrossRef]
  28. Isler, T. Convention Center Performance Review-Has “New and Improved” Paid Off for Cities Vying for Meeting Business? Meetings and Conventions. Meetings and Conventions. 1 March 2008. Available online: https://www.meetings-conventions.com/News/Third-Party/Convention-Center-Performance-Review (accessed on 1 January 2024).
  29. Breiter, D.; Milman, A. Attendees’ needs and service priorities in a large convention center: Application of the importance–performance theory. Tour. Manag. 2006, 27, 1364–1370. [Google Scholar] [CrossRef]
  30. Holmes, S.; Hofbauer, J.; Sigmund, K. Evolutionary Games and Population Dynamics. J. Am. Stat. Assoc. 2000, 95, 688. [Google Scholar] [CrossRef]
  31. Kim, S.S.; Park, J.Y.; Lee, J. Predicted Economic Impact Analysis of a Mega-Convention Using Multiplier Effects. J. Conv. Event Tour. 2010, 11, 42–61. [Google Scholar] [CrossRef]
  32. Mody, M.; Gordon, S.; Lehto, X.; So, S.-I.; Li, M. The Augmented Convention Offering: The Impact of Destination and Product Images on Attendees’ Perceived Benefits. Tour. Anal. 2016, 21, 1–15. [Google Scholar] [CrossRef]
  33. Whitfield, J.; Dioko, L.D.A.N.; Webber, D.; Zhang, L. Attracting Convention and Exhibition Attendance to Com-plex MICE Venues: Emerging Data from Macao: Exhibition Attendance at Complex MICE Venues. Int. J. Tour. Res. 2014, 16, 169–179. [Google Scholar] [CrossRef]
  34. Bernini, C. Convention industry and destination clusters: Evidence from Italy. Tour. Manag. 2009, 30, 878–889. [Google Scholar] [CrossRef]
  35. Chen, Q. Analysis of the Path of Exhibition Economy Development in the Background of the “One Belt One Road”. Bus. Manag. Res. 2020, 48, 4. [Google Scholar]
  36. Hua, G. International Conference Destination Competitiveness: Measures and Promotion Strategies for Hangzhou. For. Chem. Rev. 2022, 1109, 20. [Google Scholar]
  37. Dioko, L.A.; Whitfield, J. Price competitiveness and government incentives for simulating the meetings industry. Int. J. Event Festiv. Manag. 2015, 6, 39–53. [Google Scholar] [CrossRef]
  38. Li, P.; Lv, Y.; Yao, D. Calculation and Analysis of Synergy Potential of Exhibition Economy in the PRD Urban Agglomerations. Mod. Econ. 2017, 08, 1580–1593. [Google Scholar] [CrossRef]
  39. Lee, M.J.; Back, K. A review of economic value drivers in convention and meeting management research. Int. J. Contemp. Hosp. Manag. 2005, 17, 409–420. [Google Scholar] [CrossRef]
  40. Hanly, P.A. Measuring the economic contribution of the international association conference market: An Irish case study. Tour. Manag. 2012, 33, 1574–1582. [Google Scholar] [CrossRef]
Figure 1. Path diagrams based on tripartite evolutionary game in the (a) initiation phase, (b) growth phase, and (c) maturation phase.
Buildings 14 00715 g001
Figure 2. Effects of different initial values for x0, y0, and z0 on the evolutionary trajectories of x, y, and z. (a) Effect of x0 = y0 = z0 = 0.5 on the evolutionary trajectories of x, y, and z. (b) Effect of x0 = y0 = z0 = 0.6 on the evolutionary trajectories of x, y, and z. (c) Effect of x0 = y0 = z0 = 0.7 on the evolutionary trajectories of x, y, and z.
Buildings 14 00715 g002
Figure 3. Effects of changes in Cg, Ct, and Cp on the evolutionary trajectories of x, y, and z. (a) evolutionary trajectories of x when changing the values of Cg, Ct, and Cp to 0.8 to 1.2 times their original parameters. (b) evolutionary trajectories of y when changing the values of Cg, Ct, and Cp to 0.8 to 1.2 times their original parameters. (c) evolutionary trajectories of z when changing the values of Cg, Ct, and Cp to 0.8 to 1.2 times their original parameters.
Buildings 14 00715 g003
Figure 4. Effects of changes in Rt on the evolutionary trajectories of x, y, and z. (a) evolutionary trajectories of x when changing the values of Rt to 0 to 2 times its original parameters. (b) evolutionary trajectories of y when changing the values of Rt to 0 to 2 times its original parameters. (c) evolutionary trajectories of z when changing the values of Rt to 0 to 2 times its original parameters.
Buildings 14 00715 g004
Figure 5. Effects of changes in Rp on the evolutionary trajectories of x, y, and z. (a) evolutionary trajectories of x when changing the values of Rp to 0 to 2 times its original parameters. (b) evolutionary trajectories of y when changing the values of Rp to 0 to 2 times its original parameters. (c) evolutionary trajectories of z when changing the values of Rp to 0 to 2 times its original parameters.
Buildings 14 00715 g005
Figure 6. Effects of changes in Bg1, Bt1, and Bp1 on the evolutionary trajectories of x, y, and z. (a) evolutionary trajectories of x when changing the values of Bg1 to 0.6 to 1.4 times its original parameters. (b) evolutionary trajectories of y when changing the values of Bt1 to 0.6 to 1.4 times its original parameters. (c) evolutionary trajectories of z when changing the values of Bp1 to 0.6 to 1.4 times its original parameters.
Buildings 14 00715 g006
Figure 7. Effects of changes in Bg4, Bt4, and Bp4 on the evolutionary trajectories of x, y, and z. (a) evolutionary trajectories of x when changing the values of Bg4, Bt4, and Bp4 to 0.6 to 1.4 times their original parameters. (b) evolutionary trajectories of y when changing the values of Bg4, Bt4, and Bp4 to 0.6 to 1.4 times their original parameters. (c) evolutionary trajectories of z when changing the values of Bg4, Bt4, and Bp4 to 0.6 to 1.4 times their original parameters.
Buildings 14 00715 g007
Table 1. Assumed parameters in the evolutionary game model.
StakeholderNotationDefinition
Local governmentBg1Elementary earnings through investments in basic infrastructures
Bg2Additional earnings when both local government and exhibition building investors invest proactively
Bg3Additional earnings when both local government and supporting service building investors invest proactively
Bg4Additional earnings when all three stakeholders invest proactively
Bg5Additional earnings when only exhibition building investors invest proactively in exhibition building
Bg6Additional earnings when only supporting service building investors invest proactively in exhibition infrastructures
Bg7Additional earnings when both exhibition building investors and supporting service building investors invest proactively but not the local government itself
CgUpfront costs or capitals for investments in basic infrastructures
RtSubsidies for exhibition building investors
RpSubsidies for supporting service building investors
Exhibition building investorsBt1Elementary earnings through investments in exhibition building
Bt2Additional earnings when both local government and exhibition building investors invest proactively
Bt3Additional earnings when both exhibition building investors and supporting service building investors invest proactively
Bt4Additional earnings when all three stakeholders invest proactively
CtUpfront costs or capitals for construction of exhibition building
Supporting service building investorsBp1Elementary earnings through establishing or upgrading service infrastructures
Bp2Additional earnings when both local government and supporting service building investors invest proactively
Bp3Additional earnings when both exhibition building investors and supporting service building investors invest proactively
Bp4Additional earnings when all three stakeholders invest proactively
Bp5Additional earnings for supporting service building investors when only local government invests
Bp6Additional earnings for supporting service building investors when only exhibition building investors invest
Bp7Additional earnings when both local government and exhibition building investors invest proactively but not the supporting service building investors themselves
CpUpfront costs or capitals for construction of service infrastructures
Table 2. Tripartite pay-off matrix.
Exhibition Building InvestorsInvestment (y)Non-Investment (1 − y)
Supporting service building investorsInvestment (z)Non-investment (1 − z)Investment (z)Non-investment (1 − z)
Local governmentInvestment (x)Bg1 + Bg4 − Cg − Rt − RpBg1 + Bg2 − Cg − RtBg1 + Bg3 − Cg − RpBg1 − Cg
Bt1 + Bt4 + Rt − CtBt1 + Bt2 + Rt − Ct00
Bp1 + Bp4 + Rp − CpBp7Bp1 + Bp2 + Rp − CpBp5
Non-invest-ment (1 − x)Bg7Bg5Bg60
Bt1 + Bt3 − CtBt1 − Ct00
Bp1 + Bp3 − CpBp6Bp1 − Cp0
Note: 0 ≤ x, z, y ≤ 1.
Table 3. Eigenvalue of points of equilibrium.
Point of Equilibriumλ1λ2λ3
E1 (1, 1, 1)Cg + Rt + Rp + Bg7 − Bg1 − Bg4Ct − Rt − Bt1 − Bt4Cp − Rp − Bp1 − Bp4 + Bp7
E2 (1, 1, 0)Cg + Rt − Bg1 − Bg2 + Bg5Ct − Rt − Bt1 − Bt2Bp1 + Bp4 − Bp7 + Rp − Cp
E3 (1, 0, 1)Cg + Rp − Bg1 − Bg3 + Bg6Bt1 + Bt4 + Rt − CtCp − Rp − Bp1 − Bp2 + Bp5
E4 (1, 0, 0)Cg − Bg1Bt1 + Bt2 + Rt − CtBp1 + Bp2 − Bp5 + Rp − Cp
E5 (0, 1, 1)Bg1 + Bg4 − Bg7 − Cg − Rt − RpCt − Bt1 − Bt3Cp − Bp1 − Bp3 + Bp6
E6 (0, 1, 0)Bg1 + Bg2 − Bg5 − Cg − RtCt − Bt1Bp1 + Bp3 − Bp6 − Cp
E7 (0, 0, 1)Bg1 + Bg3 − Bg6 − Cg − RpBt1 + Bt3 − CtCp − Bp1
E8 (0, 0, 0)Bg1 − CgBt1 − CtBp1 − Cp
Table 4. Assumptions of initial parameter values before simulation.
ParameterBg1Bg2Bg3Bg4Bg5Bg6Bg7CgRtRpBt1Bt2
Assigned value2515259015525409953
ParameterBt3Bt4CtBp1Bp2Bp3Bp4Bp5Bp6Bp7Cp
Assigned value3101520151045861840
Disclaimer/Publisher’s Note: The statements, opinions and data contained in all publications are solely those of the individual author(s) and contributor(s) and not of MDPI and/or the editor(s). MDPI and/or the editor(s) disclaim responsibility for any injury to people or property resulting from any ideas, methods, instructions or products referred to in the content.

