Article

Study on the Characteristics of Spatial Evolution and Influencing Factors of Green Buildings in China

School of Architecture and Planning, Yunnan University, Kunming 650504, China
*
Author to whom correspondence should be addressed.
Buildings 2024, 14(3), 714; https://doi.org/10.3390/buildings14030714
Submission received: 24 October 2023 / Revised: 4 December 2023 / Accepted: 12 December 2023 / Published: 7 March 2024
(This article belongs to the Section Architectural Design, Urban Science, and Real Estate)

Abstract

:
Utilizing panel data pertaining to green building across 333 prefecture-level administrative units in China (excluding Hong Kong, Macao, and Taiwan) during the period spanning 2008–2020, an exhaustive examination of the evolution of China’s spatial pattern in green building is conducted employing the nearest neighbor index method, spatial autocorrelation analysis method, and kernel density analysis method. Furthermore, geographic probes are employed to scrutinize the determinants influencing China’s spatial configuration of green buildings. The findings reveal that: (1) An alteration in the density distribution from a “unipolar nucleus and double sub-nuclei” configuration to a “triple polar nuclei and multiple sub-nuclei” manifestation has been discerned in the spatial agglomeration of green buildings in China, exhibiting annual growth. Additionally, the center of green building development has shifted from the northwest to the southwest. (2) Pronounced agglomerations are predominantly situated in the eastern, central, and western regions of the country. High-high agglomerations have gradually dissipated over time in the central provincial capitals of China, the Yangtze River Delta, the Pearl River Delta, and the city clusters of Beijing-Tianjin-Hebei along the eastern seaboard. The western regions manifest a concentration of low-low and low-high aggregates, with high-low agglomeration primarily observed in the provincial capitals of the western regions. (3) The spatial differentiation of green buildings in China is attributable to a multitude of variables encompassing the environment, economy, society, and policies. Among these factors, economic, social, and innovative elements exert the most significant influence on the explicable degree of spatial differentiation.

1. Introduction

How to deal with climate change has become a crucial area of research for academics both domestically and internationally due to global warming, the rise in harsh weather, and the frequent occurrence of significant natural disaster phenomena. At the 75th United Nations General Assembly, the Chinese government suggested that “carbon dioxide emissions strive to peak by 2030 and work towards carbon neutrality by 2060”. The construction industry’s unique characteristics dictate its contribution to achieving China’s “dual-carbon goals”, which will play a crucial role in China’s aggressive implementation of dual-carbon emission reduction [1,2]. According to the Research Report on Energy Consumption and Carbon Emission of Buildings in China (2022), 2.27 billion tce, or 45.5% of the country’s total energy consumption, was consumed by buildings and constructions in China in 2020 [3]. The endorsement of green construction characterized by diminished energy consumption constitutes a consequential advancement in the contemporary modernization and metamorphosis of the conventional construction sector. It also serves as an elemental prerequisite for China’s sustainable progress, critically underpinning the attainment of the “dual-carbon goal”. China has witnessed a consistent elevation in the quantity of green building labeling initiatives in recent years, propelled by the national green building policy. As of the conclusion of 2020, the nation recorded 24,700 projects bearing the green building label, encompassing a total area exceeding 6.6 billion square meters, according to available statistics. The efficacy of green building policies and resource allocation has encountered impediments attributable to pronounced disparities in the developmental status of green buildings across China’s diverse regions since the official initiation of the green building evaluation process in 2008. In addressing this matter, Chou Baoxing utilized data spanning 2006 to 2014 to scrutinize spatial distinctions among provinces in terms of green building spatial differentiation, agglomeration, and correlation degrees. Chou Baoxing’s investigation disclosed a noteworthy agglomeration tendency in green buildings across various scales [4]. Li Donghong conducted a comparative analysis of green building development scales, geographic differentiation, and other characteristics between China and the United States. This analysis unveiled considerable geographic heterogeneity in the extent of green building advancement, coupled with a substantial correlation to the overall economic activity in each city [5]. Based on panel data on China’s green building area, Liu et al. evaluated temporal and regional incongruities, as well as the driving forces behind variations in the green building area [6]. Based on Markov chain analysis in various dimensions, Hu Tao revealed the spatiotemporal variations and evolutionary characteristics of green building development in China. He believes that green building development in the Western region is unstable and highly susceptible to the influence of the surrounding economy, environment, and policies. Overall, the development of green buildings in China has improved with the evolution of time, and spatial aggregation has intensified [7]. Yong Hua Zou et al., utilizing the least squares estimate method, scrutinized the drivers of China’s green building landscape. He believes that China’s green buildings need to break through the technology of research and development, develop green building demonstration zones, and work together to build a green industry chain to promote the development of green building intelligence and architecturalization [8].
Most earlier research examined the spatial disparities of green buildings. Still, they lacked a multi-dimensional investigation of such differences and the influencing factors from the perspective of the municipal area. Based on previous research, this paper divides China’s green building development into the 11th Five-Year Plan (2010), the 12th Five-Year Plan (2015), and the 13th Five-Year Plan (2020) as the three five-year planning time cutoffs. This paper focuses on the aggregate count of China’s green building assessment and labeling initiatives spanning the period 2008 to 2020 as the subject of investigation. Furthermore, the analytical framework encompasses the utilization of the nearest neighbor index analysis, standard deviation ellipse analysis, kernel density analysis, and spatial auto-correlation analysis to scrutinize the geographical distribution pattern, directional aggregation, density of aggregation, and spatial correlation characteristics inherent in green buildings. To address the dearth of theoretical investigation regarding the determinants influencing the spatial distribution characteristics of green buildings in China, geodetectors are employed to elucidate the origins of this spatial configuration, considering factors encompassing natural, economic, social, environmental, innovative, and policy dimensions. This endeavors to furnish a scientifically grounded foundation for governmental judicious allocation of green building resources and the advancement of green building promotion initiatives.

2. Data Sources and Methods

2.1. Data Sources

Since the green building labeling certification in 2008, before September 2016, the statistics on the number of green building labeling projects in China were publicized by the Ministry of Housing and Urban-Rural Development of China, and the green building labeling projects in the country were approved and certified by the Ministry of Housing and Construction of China, and therefore, the green building labeling projects in this phase came from this department only, and the projects were unique and the data were reliable. After October 2015, the Ministry of Housing and Construction of China no longer carries out unified certification and approval of the national green building labeling projects, but rather the certification and approval are carried out by the subordinate departments of the respective provinces in China. Therefore, the green building sample data from October 2016 to the end of December 2020 come from the economic and social development bulletins of the provinces, cities, autonomous regions, and municipalities directly under the central government, the Department of Housing and Construction, the Green Building Energy Conservation Association, and the China Green Building Series. The number of green building labeling projects at this stage is obtained from the data published by various municipal government departments, such as the Department of Housing and Construction, the Green Building Energy Conservation Association, and so on, and the quality and credibility are relatively high. In order to improve the data, we consulted green building-related books and literature to supplement the data, and for the duplicated data, we adopted the screening function in EXCEL to screen and eliminate the duplicated green building labeling projects, carried out on-site research on the green building labeling projects and interviews and consultations with the staff of the provincial and municipal departments to ensure the completeness of the data, and finally obtained the cumulative number of green building labeling projects. Ultimately, the cumulative count of green building labeling projects was established at 24,000. Information pertaining to the indicators of natural, economic, social, innovative, environmental, and policy factors was sourced from the 2009–2021 China Urban Statistical Yearbook, the China Environmental Statistical Yearbook, the China Real Estate Statistical Yearbook, the China Provincial Statistical Yearbooks, and the most recent National Economic and Social Development Statistical Bulletin for each prefectural-level city.

2.2. Methods

2.2.1. Index of Closest Neighbor

The spatial distribution pattern of green buildings in China can be ascertained by analyzing the Nearest Neighbor Index, which depicts the spatial distribution of point elements and reflects the degree of proximity of green buildings to each other in geospatial space. The formula is as follows [9]:
R = r 1 r E ,   r E = 1 2 n A
where A is the study area, n is the total number of green buildings in China, and R is the nearest neighbor index. r E is the theoretical nearest neighbor distance under a random distribution pattern. r 1 is the actual closest neighbor distance. Geographic distribution patterns can be broadly classified into four types: (a) random distribution of point-like elements ( R = 1 ); (b) uniform distribution of China’s green buildings ( R > 1 ); (c) agglomeration and distribution of China’s green buildings ( R < 1 ); and (d) total concentration of China’s green buildings ( R = 0 ).

2.2.2. Elliptic Analysis Standard Deviation

The standard deviation ellipse serves as an indicator of the comprehensive structure and prevailing distribution orientation of spatially arranged nodes. Variations in the standard deviation across the ellipse’s center of gravity, corners, and long and short axes delineate the direction of concentration in the distribution of green buildings. Concurrently, the migration of the ellipse’s center of gravity elucidates the fundamental distribution characteristics of the sample point pattern. The extent of dispersion among green building sample points can be ascertained through the elliptical area [10]. The diminished areas correspond to heightened aggregation in distribution.
(1)
The following formula is used to get the center of gravity coordinates:
P i = ( x ¯ = i = 1 n w i x i i = 1 n w i , y ¯ = i = 1 n w i y i i = 1 n w i )
P i is the green building center of gravity, x i and y i are the horizontal and vertical coordinates of element i , n is the total number of green buildings in China, and w i is the weight of element i .
(2)
The following formula is used to determine the S D E long and short axes:
S D E x = i = 1 n ( x i x ¯ ) n ,   S D E y = i = 1 n ( y i y ¯ ) n
S D E x and S D E y are the centers of green building ellipses for different years, respectively; x i and y i are the spatial location coordinates of each green building, and x i and y i are the coordinates of plot i ; x ¯ and y ¯ are the mean centers of the plots, respectively; and n is the total number of green buildings in China.
(3)
The following is the formula for determining the angle of rotation:
tan θ = [ ( i = 1 n Δ x i 2 i = 1 n Δ y i 2 ) + ( ( i = 1 n Δ x i 2 i = 1 n Δ y i 2 ) 2 + 4 ( i = 1 n Δ x i Δ y i ) 2 ) ] [ 2 i = 1 n Δ x i Δ y i ]
θ is the direction angle of the ellipse; the north-south direction coordinate axis X-axis is taken as the base, and the due north is 0 degree, and it is rotated in the clockwise direction, n is the total number of green buildings in China. Δ x i and Δ y i are the deviations from the mean center X-axis and Y-axis, respectively.
(4)
The following formula is used to get the standard deviation for the X-axis and axis Y:
δ x = [ i = 1 n ( Δ x i cos θ Δ y i sin θ ) 2 ] n ,   δ y = [ i = 1 n ( Δ y i cos θ Δ x i sin θ ) 2 ] n
δ x and δ y are the standard deviation of the coordinate axes X-axis and Y-axis, respectively; θ is the direction angle of the ellipse; the north-south direction coordinate axis X-axis is taken as the base; n is the total number of green buildings in China. Δ x i and Δ y i are the deviations from the mean center X-axis and Y-axis, respectively.

2.2.3. Analysis of the Kernel Density

Kernel density estimation stands as a nonparametric technique for spatially analyzing point elements, employing a mobile unit to estimate density variations in point distribution. Its utility extends to discerning the pattern of point element changes and visualizing the spatial clustering of these elements. The present study employs kernel density analysis to examine the spatial agglomeration features and distribution patterns of green buildings in China. The determination of kernel density values is carried out as follows [9]:
f ( x ) = 1 n h i = 1 n K ( x x i h )
f x is the kernel density calculation function at spatial location x ; n is the number of points in the analyzed range; h is the range threshold; K is the default weight kernel function; and ( x x i ) is the distance from point x to point x i . The geometric meaning of the equation space is that the density value decreases outward at the center point of each analysis window, and when the distance from the center reaches a certain threshold range, the function value is 0.

2.2.4. Analysis of Spatial Autocorrelation

Using spatial autocorrelation, one may examine if observations inside a single space cell and those within its adjacent cells are correlated or not. The Moran’s I index is utilized in this study to examine if the distribution of green buildings in China exhibits geographical correlation and variability. The formula is as follows [11]:
I = n i = 1 n j = 1 n W i j × i = 1 n j = 1 n W i j ( x i x ¯ ) ( x j x ¯ ) i = 1 n ( x i x ¯ ) 2
where n is the number of green buildings in China; x 1 and x 2 denote the observed values at regional units i and j , respectively; and W i j is the spatial weight matrix. The value of I , or Moran’s index, is in the range 1 ,   1 . I > 0 denotes the spatial agglomeration of green buildings in China, I < 0 denotes the discrete distribution of green buildings in China, and I = 0 denotes the random distribution of green buildings in China.

2.2.5. Geodetector

Geodetectors represent a statistical methodology designed for discerning spatial variability and probing the foundational factors that contribute to significant correlations. In this investigation, the geodetector is employed to scrutinize the spatial distribution pattern of both dependent and independent variables. Additionally, it assesses the explicative efficacy of independent variables concerning dependent variables and identifies pivotal factors influencing the spatial differentiation of green buildings in China. The formula is articulated as follows [12]:
q = 1 i = 1 L N i σ i 2 N σ 2
where L denotes the stratification of the variable Y or impact factor X , N i and N denote the number of cells in stratum i and the entire region, respectively, and σ i 2 and σ 2 denote the variance of the sample size for the variable and factor in stratum i , respectively. q is the detection index of influencing factors on the distribution of green building projects, its value domain is 0 ,   1 , and the higher its value, the more pronounced the geographical differentiation of y is. The explanatory power of the independent variable X on the dependent variable Y increases with the size of the value of q , and decreases with decreasing size, respectively.

3. Characteristics of China’s Evolution of Green Building Spatial Patterns

3.1. Spatial Distribution Patterns’ Characterization

The closest neighbor indices of green buildings in China were calculated using ArcGIS software to be 0.27, 0.211, and 0.154 ( R < 1 ) in 2010, 2015, and 2020, respectively. All of these values passed the significance test with a 99% degree of confidence. The closest neighbor index R typically declines over time, which shows that the spatial clustering distribution pattern of green buildings in China is becoming increasingly obvious and has significant clustering distribution characteristics that are unlikely to produce a random distribution.

3.2. Spatial Direction Distribution Characteristics

This article employs three temporal divisions to classify China’s green buildings: 11th Five-Year Plan (2010), 12th Five-Year Plan (2015), and 13th Five-Year Plan (2020). Spatial distribution analysis utilizing the standard deviation ellipse method (Figure 1) discloses a dynamic trajectory in the distribution of green buildings in China, characterized by a “northwest and then southwest” trend. During the 11th Five-Year Plan period, the ellipse’s center of gravity resides northeast of Hefei, Anhui Province, with a turning angle of 146.676°, a long axis of 946.557 km, a short axis of 831.227 km, and nearly identical long and short axes. The nearly circular ellipse suggests the nascent stage of China’s green building development from 2008 to 2010. In the subsequent 12th Five-Year Plan period, green buildings in China dispersed in a northeast-southwest direction, progressively extending from the eastern coast into the interior. The ellipse’s center of gravity shifts 192.573 km northwest, with a turning angle of 23.845° and rotating 122.831° clockwise. Throughout the 13th Five-Year Plan period, China’s green buildings remain concentrated in the northeast-southwest axis, albeit with a narrowed ellipse angle of 18.287°. The ellipse’s center of gravity relocates 275.051 km southwest, adjacent to the intersection of Huanggang and Huangshi, signaling the ongoing expansion of China’s green building distribution from the East to the Midwest. The elliptical area exhibits a pattern of “increasing and then decreasing” over the three five-year planning periods, indicative of temporal variations in the concentration of spatial distribution of green buildings in China.

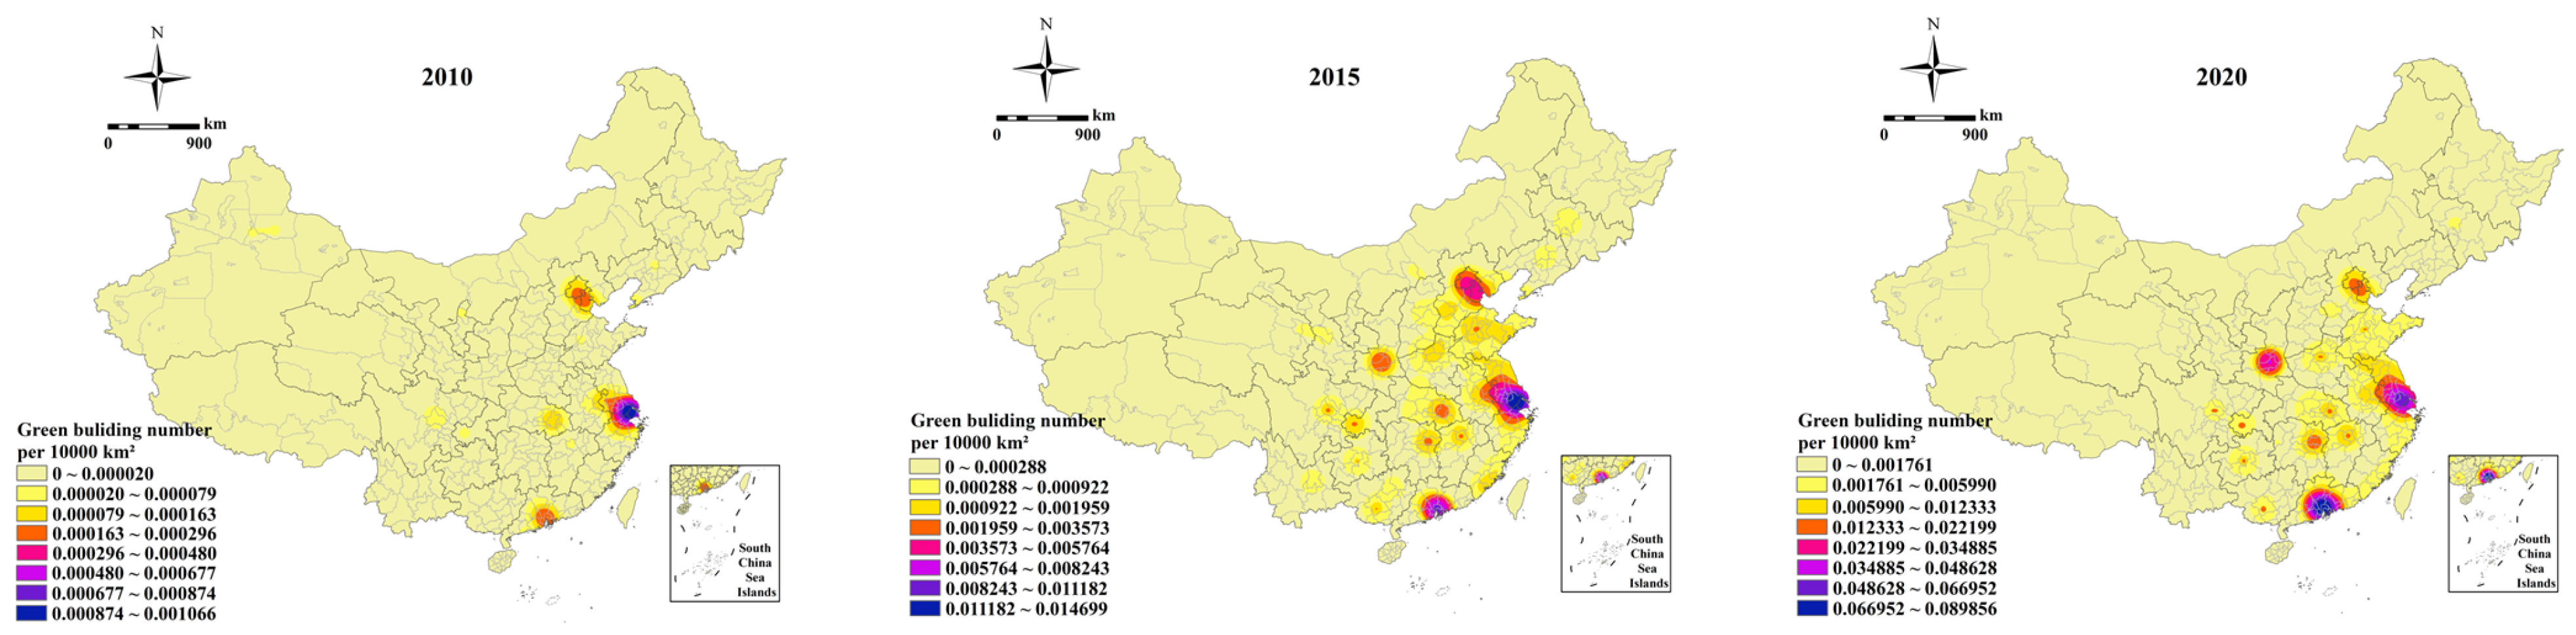
3.3. Spatial Distribution’s Density Features

The kernel density analysis of green buildings in China for the years 2010, 2015, and 2020 was conducted using the kernel density analysis tool within the ArcGIS 10.8 software. The results, as depicted in Figure 2, reveal substantial variances in the geographical distribution density of green buildings across China, indicating the emergence of distinct agglomerations. Broadly, the spatial density demonstrates a diffusion trajectory from the east to the central regions and subsequently to the west. Various regions have undergone stages of balanced development, polar core development, and diffusion development.
In 2010, the spatial distribution of China’s green buildings exhibited a discernible “unipolar core and double sub-nuclear” configuration. Predominantly, the “unipolar core” is concentrated in the Yangtze River Delta (YRD) region, centering around Shanghai, Jiangsu, and Zhejiang. Notably, Shanghai attains the highest nuclei density interval value, ranging from 8.74 to 10.66 nuclei per 10,000 km2. Meanwhile, the “double sub-nuclear” entities are predominantly distributed evenly across the Pearl River Delta (PRD) region and the Beijing-Tianjin-Hebei region, centering around Beijing, Tianjin, and Hebei. The density of these entities ranges from 1.63 to 2.96 per 10,000 km2. This distribution pattern suggests that during the 11th Five-Year Plan, China’s green buildings were predominantly centered on the three main coastal city clusters with well-established economies, influenced to some extent by the level of economic growth. With ongoing policy encouragement and an escalating degree of green innovation, China’s green building development exhibited a gradual inland progression from coastal regions by the year 2015. The density of green buildings is notably more concentrated in areas where the initial green building development occurred. Moreover, the spatial density progressively assumes a distribution pattern characterized by “three polar nuclei and many subnuclei”. The formerly distinct “sub-nuclear” agglomerations in the Beijing-Tianjin-Hebei (BTH) and Pearl River Delta (PRD) regions evolved into the Polar Nuclear Region (PNR), amalgamating with the Yangtze River Delta (YRD) to constitute the three PNRs. Under the influential role of Beijing-Tianjin-Hebei, the Yangtze River Delta, the Pearl River Delta, and provincial capitals, several “sub-nuclear” agglomerations, such as the Chengdu-Chongqing urban agglomeration, city agglomerations in the middle and lower reaches of the Yangtze River, city agglomerations of the Guanzhong Plain, and city agglomerations in the Central Plains, are progressively emerging in the central and western regions. In 2015, the aggregation zone expanded compared to 2010, with the maximum kernel density interval reaching 111.82–146.99 units per 10,000 km2, indicating a pronounced acceleration in the development of China’s green buildings.
By the year 2020, the trajectory of green building expansion in China from the East Coast to the Midwest will become more pronounced. A considerable concentration and a slight decentralized tendency persist, maintaining the distribution pattern characterized by “three polar nuclei and many subnuclei”. The configuration of the “three polar nuclei and sub-nuclei” in Beijing-Tianjin-Hebei has transitioned to a sub-nuclear arrangement, with western cities such as Xi’an, Baoji, Xianyang, Tongchuan, etc., emerging as a new core over time. Discrepancies in green building development persist between the East and the Midwest when compared to the years 2010 and 2015. Simultaneously, noticeable regional variations in the degree of spatial agglomeration of green buildings are apparent in the eastern, central, and western regions of the nation.
Green in eastern China is also concentrated in the Yangtze River Delta, Pearl River Delta, and Beijing-Tianjin-Hebei urban agglomerations due to their early start in green building, well-developed infrastructures, and increasingly concentrated populations. Its kernel density ranges from 669.52 to 898.56 per 10,000 km2. Although agglomeration levels are rising in the central and western areas, with the maximum value reaching 221.99–348.85 per 10,000 km2, the concentration is primarily observed in provincial capital cities and cities along crucial transportation corridors. At this juncture, the eastern high-density “extreme core” area has gradually extended to the surrounding prefecture-level administrative units, while the central and western regions of the country remain in a phase of balanced development relative to the extensive development of the extreme core, attributed to the delayed initiation of green building endeavors.

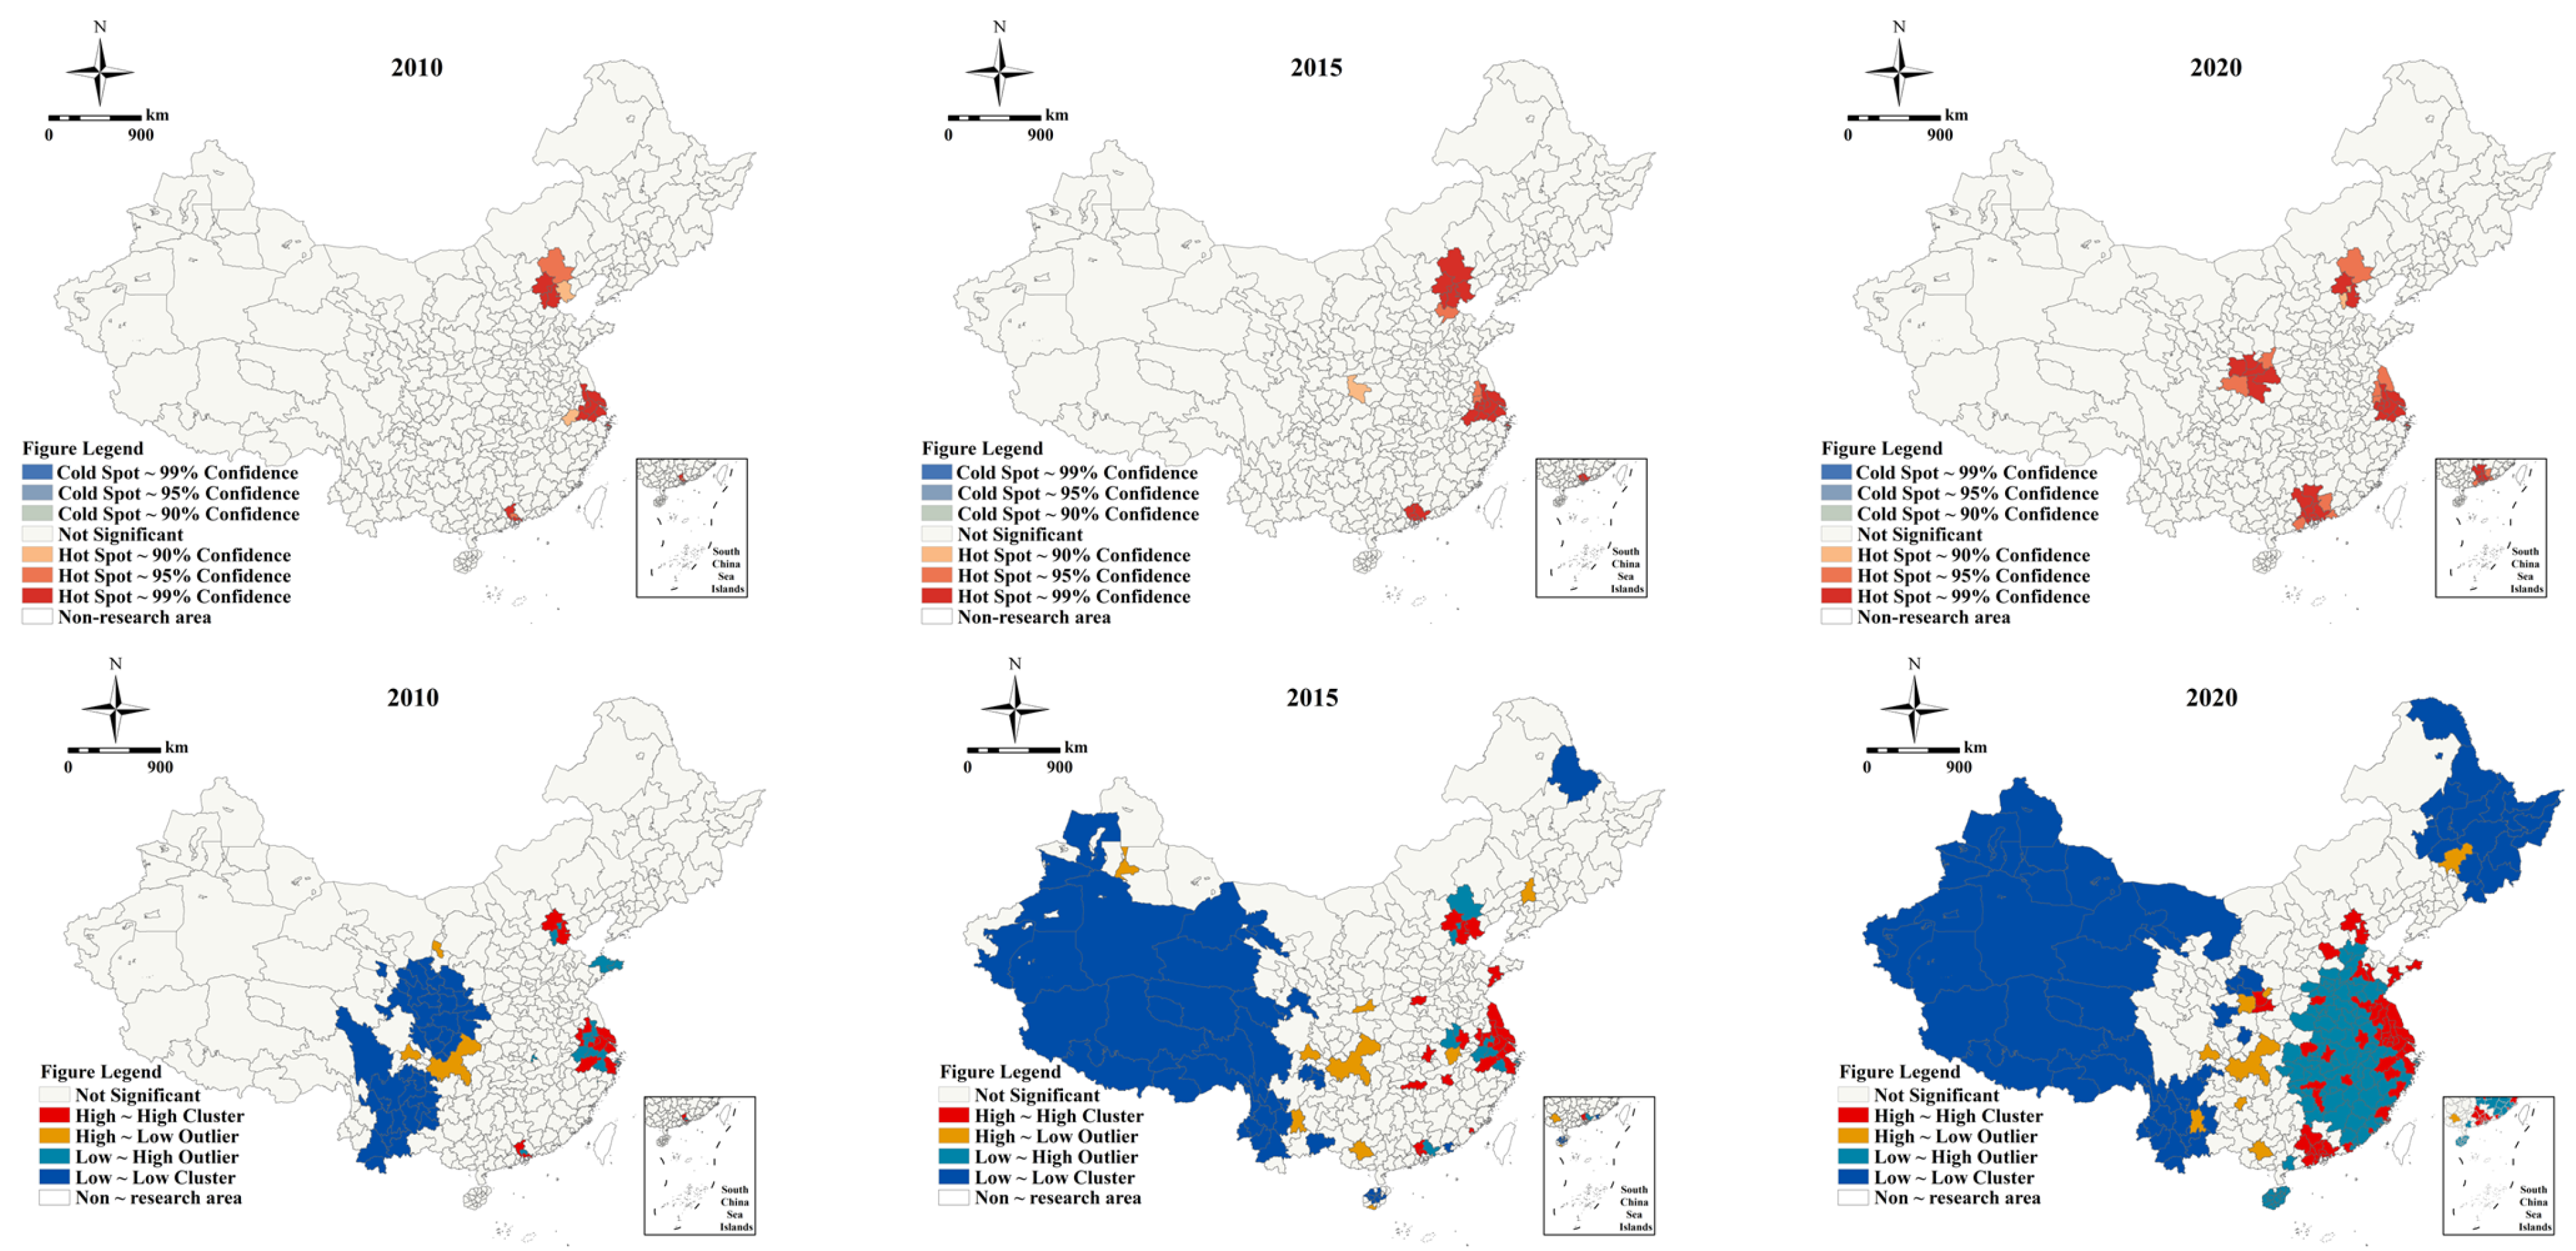
3.4. Spatial Correlation Distribution Characteristics

The Global Moran’s I index values for Chinese green construction in the years 2010, 2015, and 2020 are 0.049, 0.076, and 0.12, respectively. All global Moran’s I indexes passed the test of significance at the level of 0.01 and had p-values of 0.00. They were all between [−1, 1]. Additionally, the Z-scores for each year are 7.166, 9.519, and 12.247, respectively (Table 1), showing that the geographical distribution of green buildings in China demonstrates a substantial positive connection overall. There is an absence of random homogeneity in the geographical distribution of green buildings across diverse regions. Furthermore, the annually increasing Global Moran’s I index indicates a progressive strengthening of the degree of agglomeration in China’s spatial distribution of green buildings.
To elucidate the spatial clustering of green buildings in Chinese prefecture-level cities more distinctly, this study employs cold and hot spot analysis (Getis-Ord Gi) and clustering and outlier analysis (Local Moran’s I) as an extension of global autocorrelation analysis for each prefecture-level administrative unit. The objective is to provide a more refined portrayal of the spatial agglomeration of green buildings in Chinese prefecture-level cities, including autonomous regions and municipalities directly under the central government. As illustrated in Figure 3, in 2010, numerous cities along the east coast, such as Beijing, Tianjin, the Yangtze River Delta urban agglomeration, Guangzhou, and Shenzhen, evolved into hotspots of green building agglomerations. By 2015, these hotspot agglomerations along the Eastern Seaboard demonstrated a proclivity to extend into neighboring cities. For instance, Beijing and Tianjin exhibited gradual enlargement to the south, the Yangtze River Delta expanded towards the Shanghai-Suzhou and Shanghai-Hangzhou axes, and the Pearl River Delta (PRD) exhibited a more measured spread, with Huizhou and Dongguan emerging as the newest hotspot concentration areas in the PRD. The most notable distinction in the hotspot concentration areas between 2020 and 2015 is the emergence of Xi’an, Xianyang, and other prefecture-level cities in the western Guanzhong City Cluster as the latest hotspot concentration areas. Concurrently, hotspot areas on the eastern coast maintain a slow diffusion trend, and hotspot areas in the Pearl River Delta have disseminated across the region. In the Beijing-Tianjin-Hebei region, fewer hotspot concentration regions are observed, with the confidence in concentration in neighboring prefecture-level cities declining from 99% to 95%. According to an analysis of the clustered anomalies (Figure 3), the majority of the prefecture-level administrative units for green buildings have low-low and low-high clusters, whereas there are fewer prefecture-level administrative units for green buildings with high-high and high-low clusters. From a localized viewpoint on the analysis, China’s green buildings are in a high-high concentration of areas concentrated in the east coast of the Beijing-Tianjin-Hebei, Yangtze River Delta, and Pearl River Delta urban agglomerations, and the low-low cluster area is mostly found in western China, including the whole regions of Xinjiang, Tibet, and Qinghai, as well as portions of Yunnan, Guizhou, Gansu, and Sichuan. From a temporal perspective on the analysis, high-high clusters were primarily concentrated in the urban agglomerations of Beijing-Tianjin-Hebei and the Yangtze River Delta in 2010, whereas high-high clusters in Guangzhou and Shenzhen in the Pearl River Delta (PRD) region were not significant during this time period. This observation posits that the local economy’s degree and the green building technologies in neighboring cities exert influence on the local spatial correlation within the Pearl River Delta (PRD). The Chengdu-Chongqing area exhibits a high-low cluster distribution, whereas low-low and low-high clusters predominantly concentrate in regions encompassing Tibet, Yunnan, and Sichuan. As national policies and the framework of green construction norms and standards continue to advance, the high-high aggregation range of green buildings in China witnessed an expansion in 2015 and 2020, proliferating from the eastern to the central regions compared to 2010, albeit with some distribution variations. The Yangtze River Delta has comprehensively encompassed Jiangsu Province, while the Pearl River Delta, the Eastern Seaboard Beijing-Tianjin-Hebei, has extended across the entire metropolitan agglomeration. In contrast to the eastern part of the nation, the low-high cluster manifests in non-capital cities in central China, whereas the high-high cluster predominantly concentrates in the capital cities of the region and a select few cities along favorable transit routes. For example, Hefei and Nanchang on the Beijing-Kowloon Railway line, and Zhengzhou, Changsha, and Zhuzhou on the Beijing-Guangzhou Railway line. This discrepancy is primarily attributed to the heightened economic and innovation levels, coupled with robust policy support in the capital cities. Low-low clusters are chiefly distributed throughout Tibet, Qinghai, Xinjiang, Gansu, and Yunnan, while high-low clusters primarily concentrate in the capital cities of the western provinces exhibiting a higher economic level, such as Chengdu, Chongqing, Kunming, Guiyang, and the like.

4. Analysis of Chinese Green Buildings’ Spatial Differences and Influencing Factors

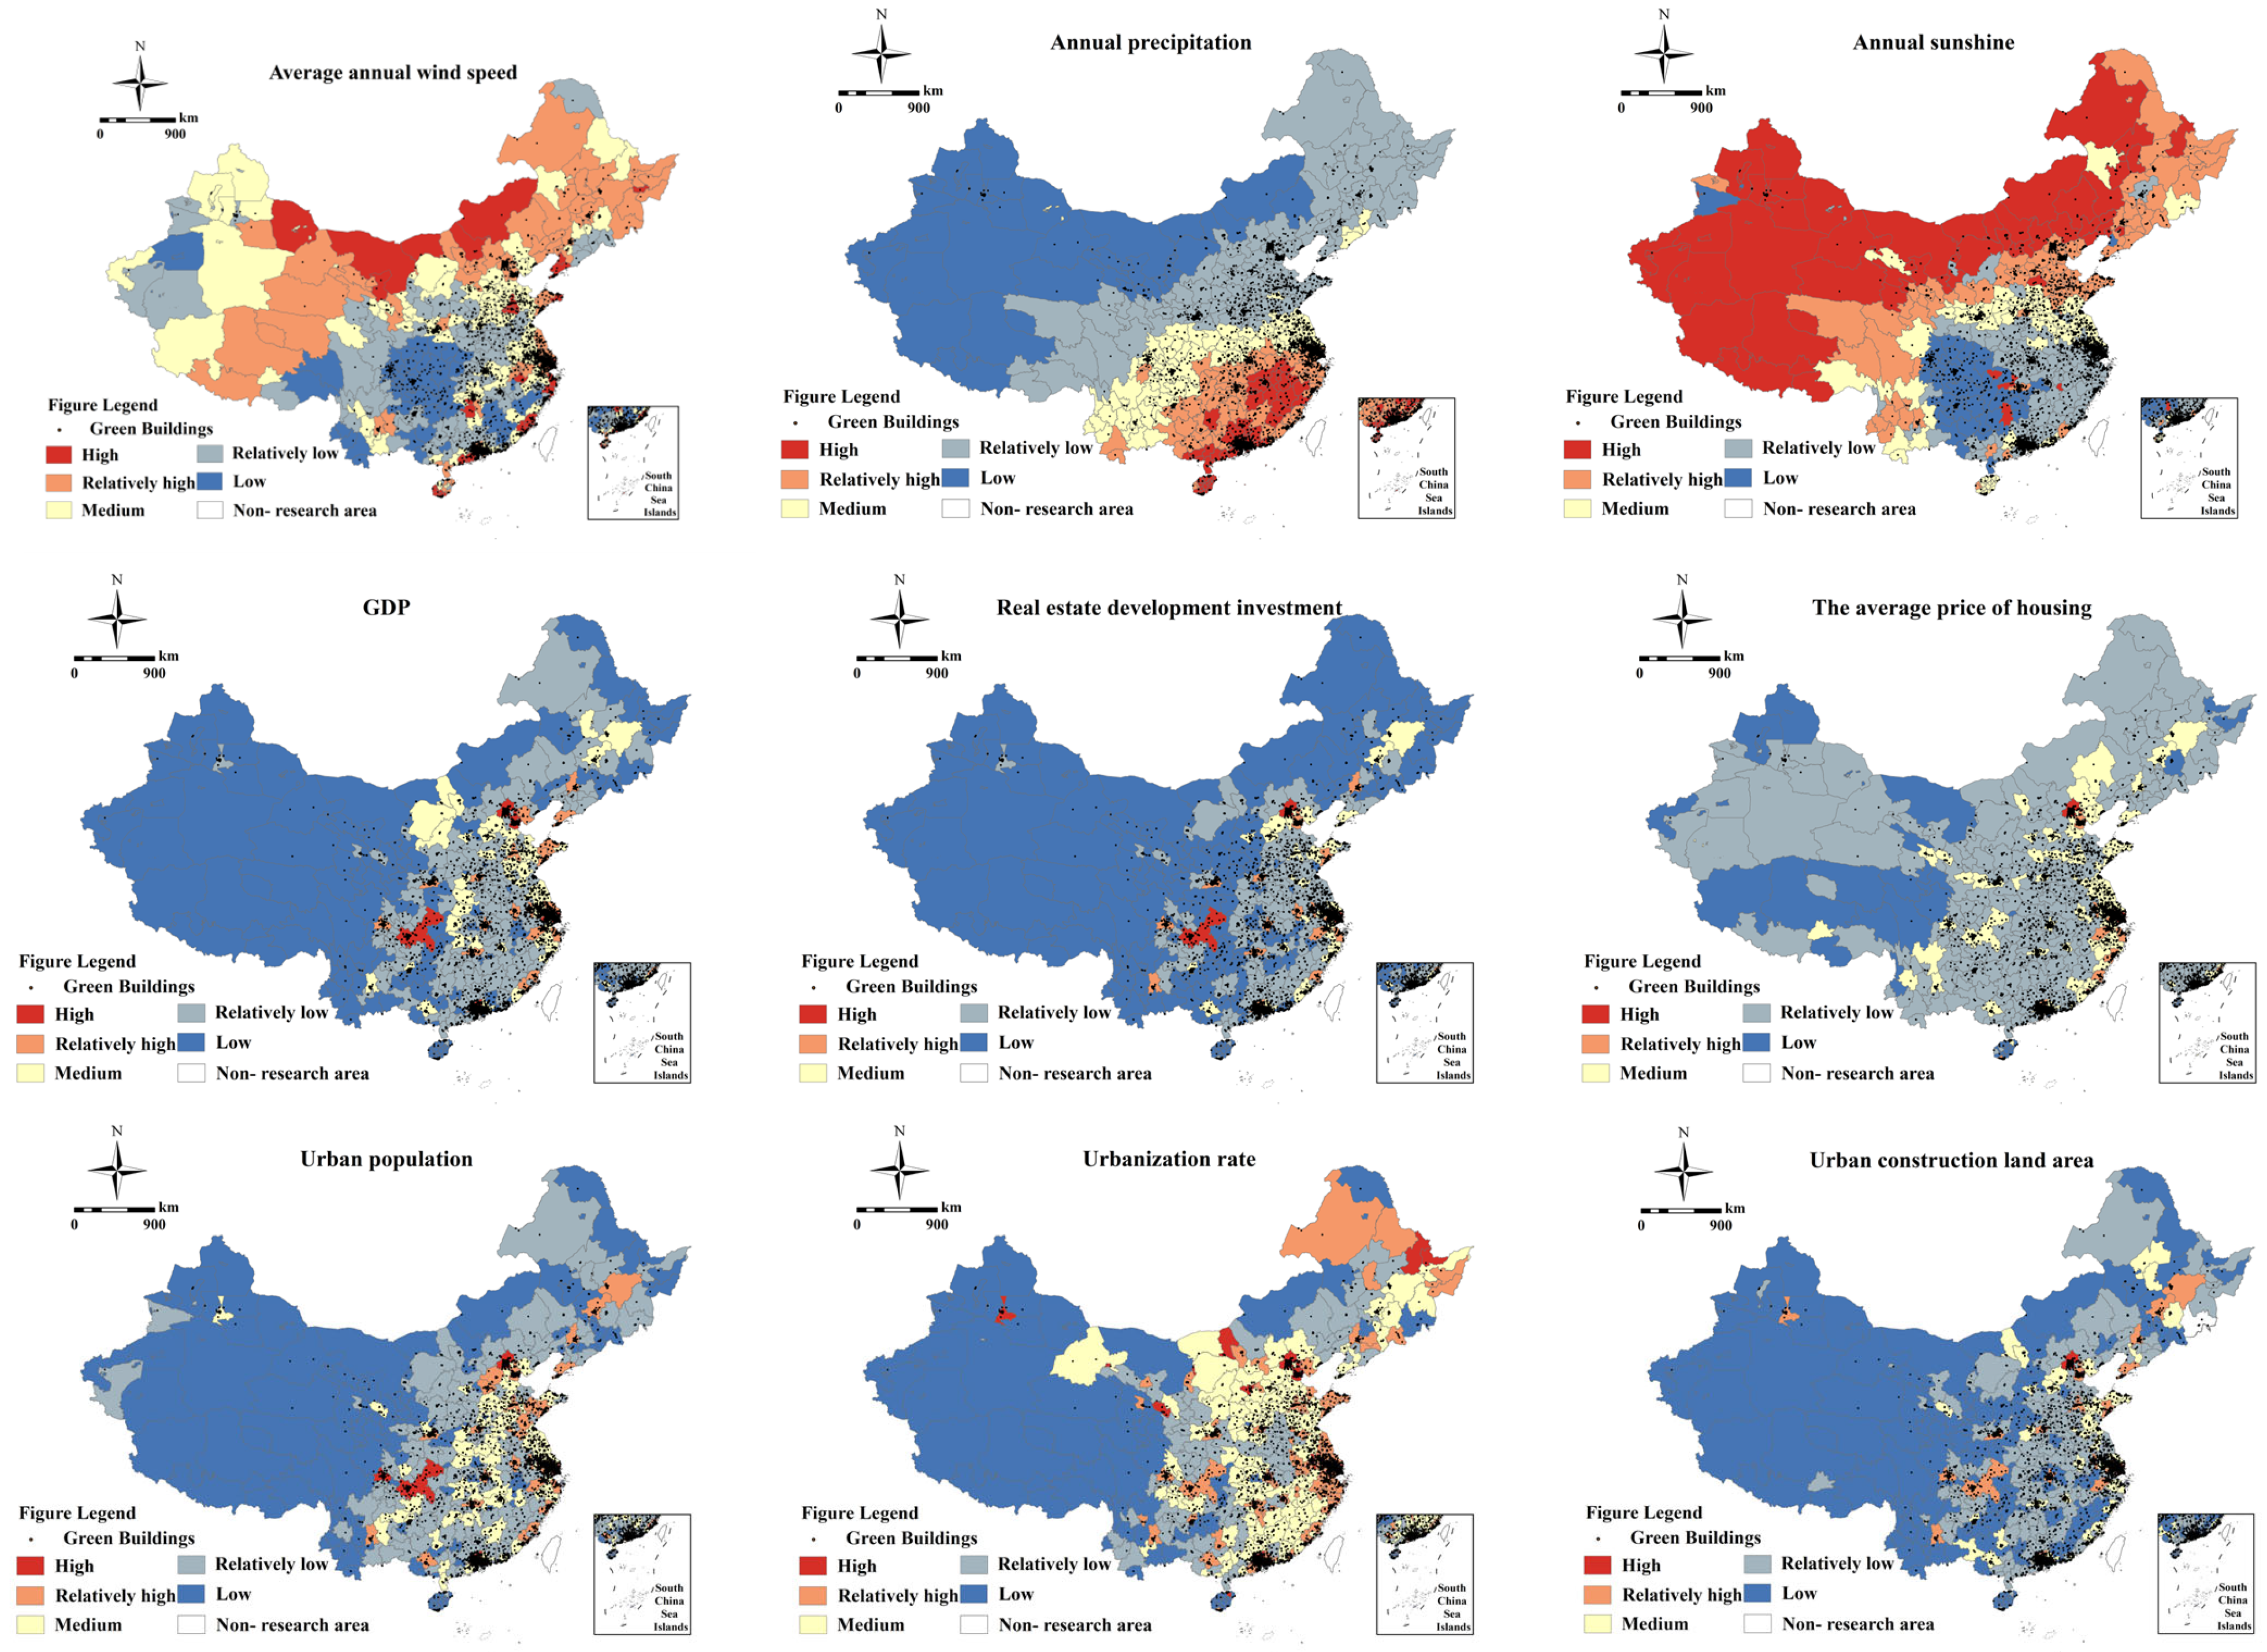
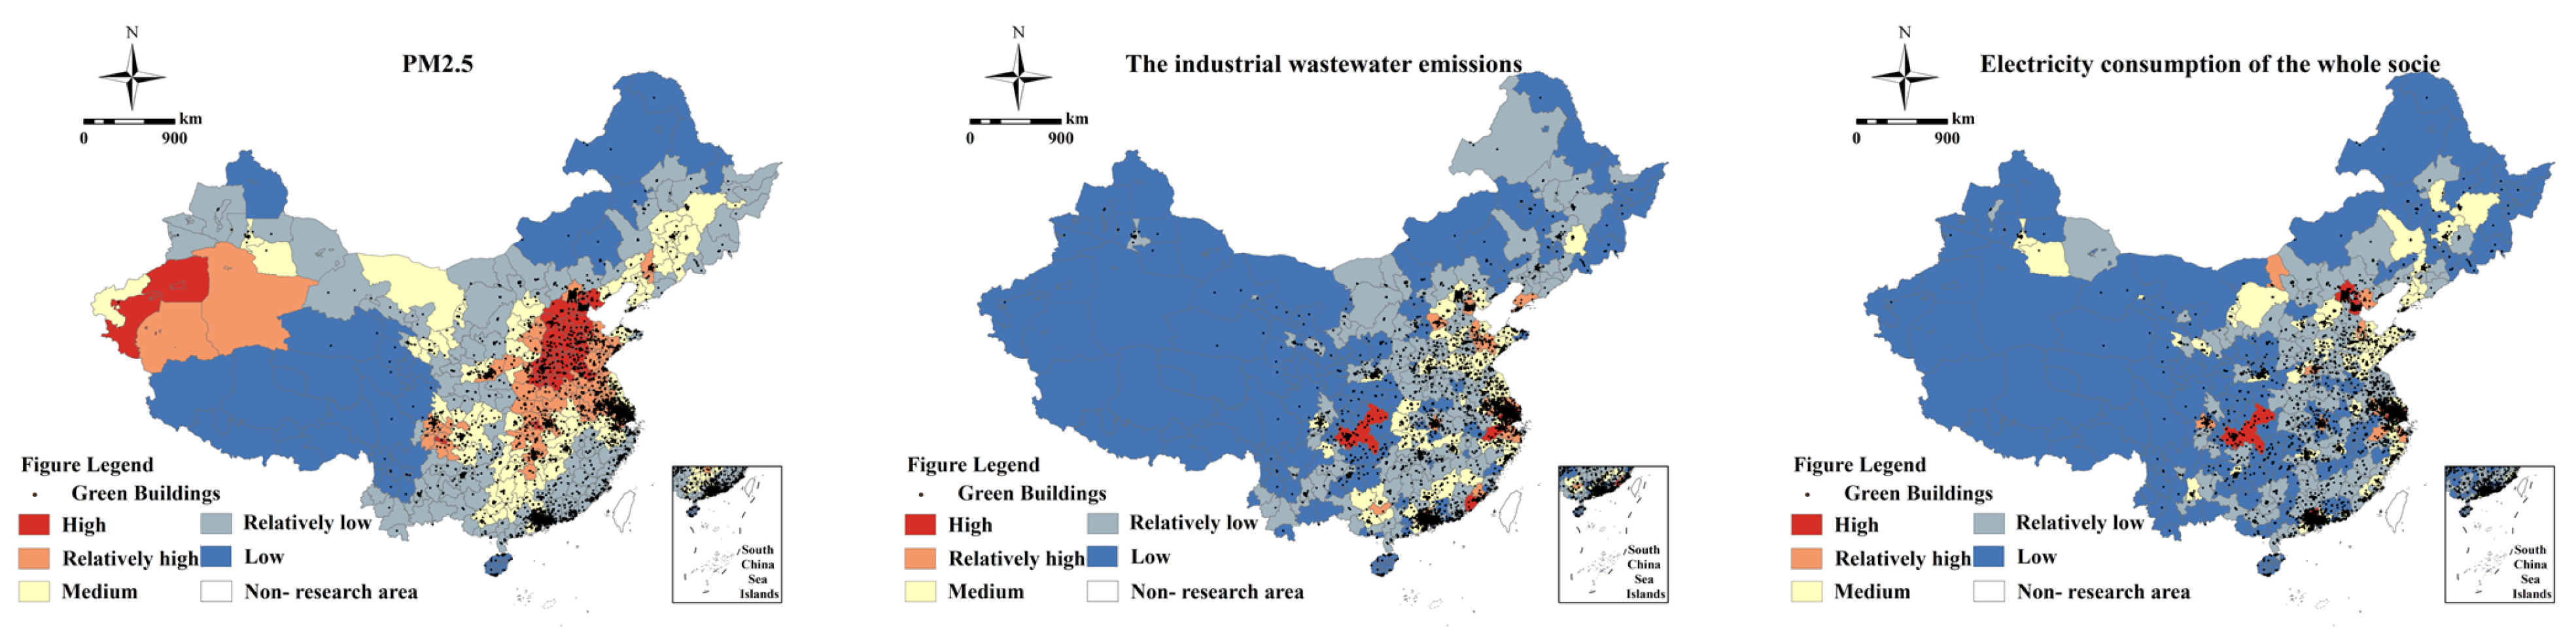
4.1. Identification of Influencing Factors

The spatial differentiation of green buildings in China is the result of multiple factors. To explore the strength of influence factors on the spatial differentiation of green buildings in China, this study chose 17 indicators in six dimensions, namely, climatic factors, economic factors, social factors, environmental factors, innovation factors, and policy factors, as the independent variables to detect the impact of the spatial pattern of green building in China (Table 2), in accordance with the principle of scientificity of indicators and data accessibility, combined with the actual green building and previous scholars who have been related to the study [13,14,15,16,17]. Acknowledging that the quantity of green buildings can delineate spatial evolution processes, the dependent variable chosen for analysis is the quantity of green buildings. The data, overlayed onto geospatial space using ArcGIS 10.8, underwent categorization into five tiers through the application of the natural breakpoint grading method to selected indicator data. Subsequently, the numerical quantities of the indicators were converted into categorical quantities. The investigation into the strength and intensity of the impact of influencing factors on the spatial distribution characteristics of green buildings in China was conducted utilizing geodetector methodology.

4.2. Analysis of Affecting Factors Based on Geodetector

This study utilizes 17 indicators as independent variables, with the number of green buildings in China in 2010, 2015, and 2020 serving as the dependent variables. The independent variables underwent discretization through the natural break method [18], and geodetectors were applied to assess the explanatory efficacy of these independent variables. The investigation revealed that (Table 3), in 2010, 2015, and 2020, 13 indicators representing economic, social, innovation, policy, and partially environmental factors consistently surpassed the 95% significance threshold. This indicates the significant influence of all 13 indicator factors on the spatial differentiation of green buildings in China. Subsequently, after 2015 and 2020, three indicators related to climatic factors and PM2.5 within environmental factors met the 95% significance criteria, signifying the growing significance of PM2.5 over time in the context of natural and environmental elements for green buildings.
In 2010, the following delineated the degree of importance attributed to indicators of spatial differentiation in green buildings in China: X9 > X4 > X5 > X15 > X14 > X12 > X13 > X17 > X6 > X7 > X16 > X11 > X8 > X1 (only for significance test indications comparison); in 2015, the strength of the function of indicators is in the following order: X14 > X4 > X15 > X12 > X5 > X7 > X9 > X13 > X6 > X17 > X16 > X11 > X8 > X3 > X10 > X2 (X1 fails the test of significance); and in 2015, the strength of the function of indicators is in the following order: X4 > X14 > X15 > X9 > X12 > X7 > X5 > X13 > X6 > X11 > X17 > X16 > X8 > X1 > X10 > X3 > X2.
From a lateral viewpoint, indicators related to economic, innovation, and social factors consistently occupy the top three positions, followed by environmental and policy factors. In contrast, indicators gauging the magnitude of climatic factors are consistently positioned at the bottom. This implies that the regional degree of innovation and economic advancement exerts a more pronounced influence on the spatial differentiation characteristics of green buildings. This correlation aligns with the findings derived from hotspot analysis and spatial kernel density analysis. In a longitudinal context, the impact of natural, economic, social, environmental, innovative, and policy indicators has exhibited a progressive amplification over time. Moreover, the influence of two-factor interactions surpasses that of one-factor interactions, underscoring that the spatial differentiation of green buildings in China results from the collaborative interplay of multiple variables. To elaborate further on the impact of each influencing factor indicator on the spatial differentiation of green buildings in China, the data for each factor indicator in this study underwent overlay with a map of China’s green buildings utilizing the natural breakpoint approach (Figure 4 and Figure 5).

5. Discussion

5.1. Climatic Factor

The climatic factor, serving as foundational elements in shaping the spatial arrangement of green buildings [8], exhibits interpretation strengths for wind speed, precipitation, and sunshine ranging from 0 to 0.05. These factors exert a positive influence on the spatial distribution of green buildings in China, albeit with a relatively modest impact. Figure 4 delineates that cities such as Xi’an in Shaanxi Province and Urumqi in Xinjiang, with abundant sunshine, can harness solar energy to achieve energy conservation effects. Conversely, eastern coastal provinces, including Guangdong, Fujian, Jiangsu, Zhejiang, and Shanghai, characterized by higher wind speeds, have the potential to develop wind energy for resource conservation. Consequently, the proliferation of green buildings and the increasing significance of spatial aggregation are evident. While China’s precipitation is depicted in isopach lines at intervals of 800 mm, 400 mm, 200 mm, and others, the spatial aggregation of green buildings does not manifest a stepwise decrease from the eastern to the inland regions. Furthermore, the wind and solar energy resources in western provinces such as Inner Mongolia, Qinghai, Tibet, Gansu, and Heijiliao surpass those in the eastern coastal regions. However, the concentration of green buildings and hotspots is primarily centered on the capital cities of these provinces. This observation signifies that, although climatic factors positively contribute to the spatial distribution of green buildings in China, their interpretative strength is constrained by economic, population, and innovation limitations.

5.2. Economic Factors

Economic factors are the core elements influencing the spatial distribution of green buildings in China [19]. In various historical periods, economic factors have had a very strong influence on how green buildings are differentiated spatially in China. GDP consistently ranks first among economic factors, followed by the volume of investment in real estate development, and finally the average house price [8,20]. Figure 4 illustrates that cities with the highest Gross Domestic Products (GDPs) predominantly reside on the eastern coast, encompassing the Beijing-Tianjin-Hebei, Yangtze River Delta, and Pearl River Delta urban agglomerations. In contrast, cities with the highest GDPs in the central and western regions are typically provincial capitals. Consequently, the east coast exhibits a dense concentration of green construction, whereas, in central China, the density of green buildings is initially focused on provincial capitals before progressively extending to nearby prefecture-level cities in alignment with the progression of the 12th and 13th Five-Year Plans. Developers pursue an expedited development approach, emphasizing efficiency, as green building, being a facet of real estate, entails a longer design and construction phase compared to conventional structures. If the sales price lacks a spillover effect, it diminishes developers’ motivation and somewhat influences the geographical distribution of green buildings. Notably, the development of a high-high cluster trend in non-provincial capital cities in central and southwest China has been lacking in green buildings. In the realm of housing, an inverse relationship between price and purchasing power is evident. Green buildings, in contrast to traditional structures, involve substantial incremental costs in the pre-construction phase, ultimately borne by the consumer. Elevated housing costs impact consumers’ affordability of green buildings, subsequently influencing developers’ inclination to construct green structures [21].

5.3. Social Factors

Social factors significantly influence the spatial distribution of green buildings in China. Key indicators reflecting the level of urban modernization, namely urban built-up land area, urban population, and urbanization rate, play crucial roles in this context. Notably, urban building land area exhibits the most substantial influence among social factor variables, registering at 0.567 (p < 0.05). Following closely are urban population and urbanization rate, with coefficients of 0.431 and 0.190, respectively (p < 0.05). A discernible and positive correlation exists between green building agglomeration in China and the urban population as well as the urbanization rate. Cities such as Beijing, Shanghai, Guangzhou, and Shenzhen, characterized by higher urban populations and urbanization rates, emerge as hotspots for the concentration of green buildings, as depicted in Figure 4. The “12th Five-Year Plan” (2015) and the “13th Five-Year Plan” (2020) are anticipated to witness a rise in the urban population and urbanization rate of central provincial capitals, consequently leading to a swift increase in green buildings. This surge will result in a gradual elevation in spatial aggregation, causing high-high cluster and hotspot cities to extend to central and western provincial capitals. The land utilized for urban construction, a crucial component of urban development, significantly influences the spatial distribution of green buildings in China. Notably, coastal cities in the east, including Beijing, Shanghai, Guangzhou, and Shenzhen, consistently lead the nation in urban development land areas, contributing to a heightened spatial aggregation of green buildings.

5.4. Environmental Factors

Environmental factors play a pivotal role in shaping the spatial configuration of green buildings in China. Central to the evaluation of green buildings are considerations of durability and safety, comfort and health, ease of living, resource conservation, environmental livability, and the realization of energy, land, water, and material savings throughout the building’s life cycle [22,23]. The most influential factor among environmental indicators in explaining the spatial distribution of green buildings in China is the total energy consumption of the entire community, reaching an average of 0.475 (p < 0.05). Subsequently, industrial wastewater and PM2.5 exhibit significant explanatory power. Preceding and following the 11th Five-Year Plan (FYP), environmental factors displayed limited explanatory capacity. However, in the context of contemporary global warming, environmental degradation, and escalating PM2.5 levels, the populace’s escalating demands for health, comfort, and environmental preservation indirectly enhance their purchasing power for green buildings. This heightened demand has spurred developers’ eagerness to engage in green building projects, leading to the rapid proliferation of green buildings during the 12th and 13th Five-Year Plan periods. Furthermore, there exists a significant negative correlation between environmental factors and the development of green buildings in China. Figure 5 illustrates cities in the North China Plain, notably Shanxi, and Hebei, characterized as prominent secondary production provinces, that exhibit elevated PM2.5 levels, thereby constraining the expansion of green buildings and influencing the spatial aggregation and distribution of green buildings in China.

5.5. Innovative Factors

Green construction, as an innovative economic endeavor, is significantly influenced by innovative factors, thereby shaping the spatial distribution of green buildings in China. Among these innovation factors, the most influential is the number of inventions related to green building, which exhibits an explanatory factor of 0.568. Subsequently, financing for research and experimental development and the number of college students enrolled also play substantial roles. As depicted in Figure 5, cities along the eastern coast, such as Guangdong, Jiangsu, Zhejiang, Shanghai, Beijing, and Tianjin, consistently rank at the forefront nationally in terms of expenditures on research and experimental development (R&E) and the enrollment of college students. This dynamic contributes to a high level of spatial agglomeration for green buildings along the eastern coast, persisting across planning stages and progressively extending to neighboring cities [24]. Concurrently, there is a rise in innovation aimed at reducing the incremental cost of green building, exemplified by the maturation and consistent promotion of technologies related to rainwater collection as well as solar and wind power production [25,26]. Hence, as time progresses, there is a continuous development and application of innovative green technologies, leading to a gradual increase in the quantity of green buildings in China. This growth is characterized by geographical clustering hotspots and a gradual expansion toward the central and western regions of the country.

5.6. Policy Factors

The spatial arrangement of green buildings in China is significantly shaped by the strength of support from local and national governmental entities. In terms of explanatory influence, both indicators related to policy factors have demonstrated considerable enhancement annually, with expenditures on energy conservation and environmental protection as well as urban maintenance expenditures registering at 0.32 and 0.256, respectively. Given that traditional buildings exert substantial pressure on urban and ecological environments through high resource consumption and significant waste generation during construction, there has been a consistent annual increase in government allocations toward energy conservation, environmental protection, and urban maintenance expenditures [27]. Consequently, the government has implemented strategies, including policy subsidies, tax incentives, and other measures, to facilitate the transition and advancement of the conventional construction sector towards green building practices. These policies are conducive to fostering heightened interest among green building developers. Furthermore, the green building evaluation standard system continues to evolve in tandem with the consistent expansion of green building initiatives. In 2014 and 2019, the nation promulgated the 14th and 19th editions of green building assessment standards [28]. The green building star rating system has progressed from the one, two, and three-star classifications in the 14th edition to the four grades of basic level, one, two, and three-star in the 19th edition over time. The green building basic level assessment designation is conferred upon meeting the fundamental requirements for the basic control score. Consequently, throughout the 13th Five-Year Plan period, there was a substantial surge in the number of green buildings in China, with the spatial density and clustering of hotspot cities gradually expanding to encompass the central and western regions of the country, as well as the provincial capitals and adjacent prefecture-level cities.

6. Conclusions

This investigation scrutinizes the spatial distribution patterns, orientations, densities, and spatial interconnections of green buildings in China. It further analyzes the origins of these patterns, considering factors such as natural elements, economic dynamics, societal aspects, environmental influences, innovative elements, and policy variables. The ensuing findings are as follows: (1) The spatial distribution of green buildings in China exhibits notable characteristics. The geographical aggregation patterns of green buildings from 2008 to 2020 consistently display major aggregation tendencies. The overall geographical distribution density of green buildings in China follows a pattern of aggregation along the eastern coast and dispersion in the central and western regions. A three-phase development pattern, characterized by balanced development, extreme nuclear development, and diffuse development, is observed across various locations over time. As the three 5-Year Plans progress, the spatial density distribution of green buildings undergoes a steady transition from “unipolar nucleus and double sub-nuclei” to the spatial features of “tripolar nucleus and multiple sub-nuclei”. In terms of spatial distribution, the northwest-southeast direction of green building spatial distribution in China has undergone a significant shift to the northeast-southwest over time. The center of gravity of green building development is progressively moving westward. The geographical aggregation gap between the east coast and the middle and western regions of the nation is diminishing, and the degree of spatial aggregation is transitioning from weak to strong. Regarding spatial correlation, the spatial correlation and aggregation of China’s green buildings are on a progressive rise. Hotspot agglomerations, high-high, and high-low clusters are predominantly situated in the east coast urban agglomerations of Beijing-Tianjin-Hebei, the Yangtze River Delta, and the Pearl River Delta. However, over time, hotspot agglomerations have gradually extended to western and central cities such as Xi’an and Xianyang in Shaanxi Province, while high-high and high-low clusters have shifted from the eastern seaboard to western and central provincial capitals, subsequently spreading to nearby prefecture-level cities. The presence of low-low clusters is consistently observed in the West across all administrative unit levels due to physical, economic, and demographic constraints.
(2) The spatial differentiation characteristics of green buildings in China are shaped by a confluence of factors, with economic elements playing a pivotal role in this spatial variation. Economic dynamics are inherently intertwined with all industries, including green building. The economic vigor and resilience of a city can stimulate the adoption of green building materials, encourage green innovation, attract talent, and foster green markets. Key indicators of a city’s modernization level, such as urban population, urbanization rate, and urban building land area, serve as significant metrics in assessing the potential for green building development. Higher levels of urban population and urbanization correlate with increased impetus for green building development. Furthermore, the maturity of green technology plays a crucial role in mitigating the additional costs associated with green buildings, thereby promoting their growth. The innovation factor acts as a catalyst, propelling the spatial agglomeration of green buildings. The energy consumption of green buildings during utilization and maintenance is influenced by climatic factors, such as wind intensity, precipitation volume, and sunlight exposure. These climatic factors represent the fundamental determinants shaping the geographical distribution of green buildings in China. Elevated standards for residents’ living conditions, emphasizing quality, safety, comfort, and health, indirectly contribute to an increase in their purchasing power. Concurrently, ongoing enhancements in government green building standards and regulations, coupled with the provision of subsidies to facilitate the transformation and upgrading of the traditional construction industry, significantly heighten developers’ incentives to create green buildings. Consequently, environmental and policy considerations function as external catalysts influencing the geographical distribution of green buildings in China.

7. Suggestion

The development of green building is an important initiative to achieve the dual-carbon goal. In order to promote and develop green building and realize the reasonable dispatch of green building resources in space, combining with the geographical differences, suggestions are made for the optimization of the spatial layout of green building:
(1)
Reasonably utilize the advantages of the natural environment to develop green buildings. Especially for the central and western regions where wind energy, solar energy, and water resources are abundant, it is necessary to maximize the natural geographical advantages, make use of the strengths, and avoid the weaknesses to provide the basic conditions for the development of green buildings. For example, cities in Xinjiang, Tibet, Qinghai, and the three northeastern provinces can give full play to local solar energy advantages; cities in Inner Mongolia, Ningxia, and Shaanxi can give full play to the advantages of wind energy, and Yunnan, Guizhou, Sichuan, and Chongqing can make full use of the terrain difference, optimize the layout of the transportation network, make full use of the water resources, and reduce the thermal power generation, so as to achieve the goal of green building energy-saving, land-saving, water-saving, and material-saving, thus promoting the development of green buildings.
(2)
Accelerate the development of the economy and the transformation and upgrading of the construction industry, and promote the transformation of green buildings from quantity to quality. For eastern coastal regions with economic development advantages, it is necessary to accelerate the transformation of green buildings from quantity to quality. For eastern coastal regions with economic development advantages, it is necessary to accelerate the transformation of green buildings from quantity to quality and to give full play to the advantages of the green building industry and green building technology cluster to increase the number of high-star green buildings. The number of high-star green buildings should be increased by giving full play to the advantages of the green building industry and green building technology clusters. Due to the gradual slowdown of urbanization in the east, the area of urban construction land is gradually reaching the red line. As the rate of urbanization in eastern China is gradually slowing down and the land area for urban construction is reaching the red line, the improvement of the quantity and quality of green buildings should not only focus on new buildings but also accelerate the energy-saving and green transformation of existing buildings. The quality and quantity of green buildings should not be improved by focusing only on new buildings. For cities in central and western China, where the development process is relatively slow, it is necessary to accelerate economic development and narrow the economic gap with the east. Capital cities should play a central role and take the lead in the economy for other prefecture-level non-capital cities, giving full play to the market’s “invisible hand” and the government’s “visible hand”. The market’s “invisible hand” and the government’s “visible hand” should be brought into full play to rationally regulate land prices and housing prices.
(3)
Strengthening the role of the population as a driver of green buildings and accelerating new urbanization. The government needs to accelerate multiple goals, such as the dual-carbon goal, the ecological goal of city building, and the goal of new urbanization construction in conjunction with green building development. Governmental organizations and enterprises actively conduct surveys on residents’ housing demand satisfaction and scientifically and reasonably provide residents with green buildings of different star ratings, household types, health, and comfort. City development and urbanization not only need to increase the urban population but also need to promote industrial development. The central and western regions should accelerate the upgrading of the green industry chain, and at the same time, accelerate the upgrading of green technology, green building materials, green construction, and green design in line with the developed countries in the eastern and western coasts. At the same time, it is also necessary to accelerate the docking of green technology, green building materials, green construction, and green design with developed cities on the east coast and the docking of non-provincial capitals with provincial capitals, so as to gradually narrow the space between the east, middle, and west, and between provincial capitals and non-provincial capitals.
(4)
Improve green building research and experimental development funding, and make full use of higher education schools to enhance green innovation capacity. Cities in central and western provinces are constrained by topography, transportation, and other factors; the economic development of non-capital cities is slow; the level of innovation is low; and there are relatively few colleges and universities, but there are many colleges and universities in provincial capital cities, such as Wuhan, Changsha, Nanchang, Chengdu, Xi’an, Chongqing, Kunming, and other cities. Therefore, the innovation ability of teachers and students in universities in the capital cities of the center should be brought into play to increase the number of inventions and innovations made by teachers and students in green building technology, and materials. The government and universities also need to increase funding for green building research and experimental development, increase support for green building innovation, and reduce the cost of green building innovation. The government and universities also need to increase funding for green building research and experimental development, increase support for green building innovation, reduce the incremental cost of green buildings, and increase the purchasing power of residents and the enthusiasm of developers to develop green buildings.
(5)
The government continues to increase energy-saving and environmental protection expenditures and policy support and continuously improves the green building evaluation standard system. Regardless of East, Central, and West, it is necessary to rationally formulate tax incentives and penalties, taking into account the actual situation of green building development in local cities. Dynamic adjustment of green building promotion policies is necessary. For example, in Shenzhen, the provincial green building evaluation standard has been gradually replaced by the national standard in the transformation of green building “quality” development. In addition to policy support, on the other hand, green building standards are gradually replaced by national standards. In addition to policy support, on the other hand, the government also needs to increase the market supervision of green buildings. On the other hand, the government needs to increase the supervision of the green building market and strengthen the review and inspection of the indexes of the existing green buildings every year.

Author Contributions

Z.X. was principally responsible for the paper’s conception, methodology, initial manuscript writing, database setup, collection, writing, and review. H.H. was principally responsible for the paper’s design, data collection and analysis, formal analysis, original manuscript writing, review, editing, supervision, and funding acquisition. J.Z. was principally engaged in the writing and review, editing, supervision, and methodology. Resources, formal analysis, and database construction were W.C.’s main areas of involvement. W.W. was mostly responsible for gathering and analyzing data. Y.W. and Z.W. were mostly responsible for discussion and revision. All authors have read and agreed to the published version of the manuscript.

Funding

This study was supported by a grant from the National Social Science Foundation of Yunnan Province, “Research on the Concept of Bai Decorative Arts in Yunnan Province” (Grant No. K804103007521), and Project of Practice and Innovation Fund for Professional Degree Graduates of Yunnan University, “Study on the Vulnerability of Construction Safety Management System for Old Industrial Buildings Renovation Project” (Grant No. ZC-23234946).

Data Availability Statement

The data presented in this study are available on request from the corresponding author. The data are not publicly available in order to safeguard the information of the survey respondents.

Conflicts of Interest

The authors declare no conflict of interest.

References

  1. Chen, Y.; Pan, Y.H.; Zhao, Y. Study on assembly building economic compensation based on revenue loss. Math. Pract. Theory 2020, 50, 292–301. [Google Scholar]
  2. Zhang, K.; Lu, Y.M.; Lu, H.S. Countermeasures for High Quality Development of Green Buildings in China under the Background of “Double Carbon” Goal. Constr. Econ. 2022, 43, 14–20. [Google Scholar]
  3. China Building Energy Consumption and Carbon Emission Research Report (2022). Building 2023, 2, 57–69.
  4. Chou, B.X.; Li, D.H.; Wu, Z.Q. Characterizing the Spatial Evolution of Green Buildings in China. Urban Dev. Res. 2017, 24, 149–152. [Google Scholar]
  5. Li, D.H.; Chou, B.X.; Wu, Z.Q. A comparative Study of Green Building Development Models and Their Evolutionary Characteristics in China and the United States. Urban Dev. Res. 2017, 24, 115–124. [Google Scholar]
  6. Liu, X.J.; Li, P. Study on the spatio-temporal evolution and driving mechanism of green building area in China. Ecol. Econ. 2021, 37, 88–94. [Google Scholar]
  7. Hu, T. Research on the spatio-temporal evolution law of green buildings in China based on Markov chain analysis method. Proj. Manag. Technol. 2022, 20, 26–30. [Google Scholar]
  8. Zou, Y.H.; Zhao, W.X.; Zhong, R.J. The spatial distribution of green buildings in China: Regional imbalance, economic fundamentals, and policy incentives. Appl. Geogr. 2017, 88, 38–47. [Google Scholar] [CrossRef]
  9. He, L.; Jiang, W.B.; Song, J.Y. Types, Spatial Distribution and Their Influencing Factors of Thematic Creative Farm Gardens in Jiangsu Province. Econ. Geogr. 2021, 41, 214–222. [Google Scholar]
  10. Zhao, L.K.; Zhang, C.B.; Tian, J.S. Evolution of spatio-temporal pattern of green building development and its spatial correlation analysis-Based on the time series data of green buildings in China from 2008 to 2015. Sci. Technol. Manag. Res. 2018, 37, 253–260. [Google Scholar]
  11. Duan, D.Z.; Du, D.B. Spatio-temporal Distribution Characteristics and Influencing Factors of Green Technology Innovation in Chinese Cities. J. Geogr. 2022, 77, 3125–3145. [Google Scholar]
  12. Wang, J.F.; Xu, C.D. Geodetectors: Principles and Prospects. J. Geogr. 2017, 72, 116–134. [Google Scholar]
  13. Liu, Y.F.; Yuan, Z.H. Analysis of spatial and temporal evolution characteristics and influencing factors of green growth level in Shaanxi Province cities. J. Nat. Resour. 2022, 37, 200–220. [Google Scholar]
  14. Huang, N.; Bai, L.; Wang, H. Social network analysis of factors influencing green building development in China. Int. J. Environ. Res. Public Health 2018, 15, 2684. [Google Scholar] [CrossRef] [PubMed]
  15. Gao, Y.; Yang, G.; Xie, Q. Spatial-Temporal Evolution and Driving Factors of Green Building Development in China. Sustainability 2020, 12, 2773. [Google Scholar] [CrossRef]
  16. Guo, K.; Yuan, Y. Research on Spatial and Temporal Evolution Trends and Driving Factors of Green Residences in China Based on Weighted Standard Deviational Ellipse and Panel Tobit Model. Appl. Sci. 2022, 12, 8788. [Google Scholar] [CrossRef]
  17. Yang, H.; Chen, L.; Huang, H.; Tang, P. Measurement and Spatial-Temporal Evolution Characteristics of Low-Carbon Cities with High-Quality Development: The Case Study of the Yangtze River Economic Belt, China. Sustainability 2022, 14, 9686. [Google Scholar] [CrossRef]
  18. Zhao, S.L.; Leng, M.X.; Sun, C.Z. Analysis of Total Factor Water Green Efficiency and Potential of the Water-saving and Emission-abating in Provinces of China. Areal Res. Dev. 2021, 40, 123–128. [Google Scholar]
  19. Chen, L.W.; Zhao, S.H.; Zhang, Z.J. Research on Related Drivers for Green Building Development—A Literature Review. Resour. Dev. Mark. 2018, 34, 1229–1236. [Google Scholar]
  20. Zhu, W.; Zhang, J.; Wang, D.; Ma, C.; Zhang, J.; Chen, P. Study on the Critical Factors Influencing High-Quality Development of Green Buildings for Carbon Peaking and Carbon Neutrality Goals of China. Sustainability 2023, 15, 5035. [Google Scholar] [CrossRef]
  21. Kumah, V.M.A.; Agyekum, K.; Botchway, E.A.; Pittri, H.; Danso, F.O. Examining Built Environment Professionals′ Willingness to Pay for Green Buildings in Ghana. Buildings 2022, 12, 2097. [Google Scholar] [CrossRef]
  22. Dong, X.Z.; Bao, J.H.; Christine, J.; Ben, M. Social problems of green buildings: From the humanistic needs to social acceptance. Renew. Sustain. Energy Rev. 2015, 51, 1594–1609. [Google Scholar]
  23. Fu, Y.; Wang, H.; Sun, W.; Zhang, X. New Dimension to Green Buildings: Turning Green into Occupant Well-Being. Buildings 2021, 11, 534. [Google Scholar] [CrossRef]
  24. Feng, D.; Yang, F.L.; Xiao, Y.Z.; Jiao, Z.; Lu, Z. How does industrial convergence affect the energy efficiency of manufacturing in newly industrialized countries? Fresh evidence from China. J. Clean. Prod. 2021, 316, 128316. [Google Scholar]
  25. Liu, S.Y.; Chen, R.H.; Chiu, Y.R.; Lai, C.M. Building Energy and Children: Theme-oriented and Experience-based Course Development and Educational Effects. J. Asian Arch. Build. Eng. 2012, 11, 185–192. [Google Scholar] [CrossRef]
  26. Wang, W.; Tian, Z.; Xi, W.; Tan, Y.R.; Deng, Y. The influencing factors of China’s green building development: An analysis using RBF-WINGS method. Build. Environ. 2020, 188, 107425. [Google Scholar] [CrossRef]
  27. Zhi, J.; Xu, Q. Operation and management practice of Shanghai public building energy consumption monitoring platform. Constr. Sci. Technol. 2016, 4, 17–20. [Google Scholar]
  28. Ding, Z.K.; Fan, Z.; Tam, V.V.Y.; Bian, Y.; Li, S.H.; Illankoon, I.M.C.S.; Sungkon, M. Green building evaluation system implementation. Build. Environ. 2018, 133, 32–40. [Google Scholar] [CrossRef]
Figure 1. Ellipse of the standard deviation of green buildings in China.
Buildings 14 00714 g001
Figure 2. Kernel density analysis of the spatial distribution of green buildings in China.
Buildings 14 00714 g002
Figure 3. Analysis of cold and hot spots and cluster outliers in green buildings in China.
Buildings 14 00714 g003
Figure 4. Categorized spatial distribution of natural, economic, and social influencing factors.
Buildings 14 00714 g004
Figure 5. Categorized spatial distribution of environmental and innovation influencing factors.
Buildings 14 00714 g005aBuildings 14 00714 g005b
Table 1. China’s Global Moran’s I Index for Green Buildings.
Specific YearMoran’s IScore/ZDegree of Significance/pExpectation IndexVariance
20100.0497.1660.00−0.0030.00
20150.0769.5190.00−0.0270.00
20200.12012.2470.00−0.0420.00
Table 2. Indicators of China’s green building impacting variables.
FactorIndicator NameCalculation MethodSources of Data
Climatic factorWind velocity X1Mean annual average wind speed for each gridChina Meteorological Data Service Centre
Precipitation X2Average annual cumulative precipitation for each gridChina Meteorological Data Service Centre
Sunshine X3Average annual cumulative insolation for each gridChina Meteorological Data Service Centre
Economic factorsGDP X4Average GDP per gridChina Urban Construction Statistical Yearbook
Investment in real-estate development X5Average value of real estate development investment by gridChina Statistical Yearbook
Average housing price X6Average sales area of commercial properties by gridChina Urban Construction Statistical Yearbook
Social factorsPopulation in urban areas X7Average urban population by gridChina Urban Construction Statistical Yearbook
Urbanization ratio X8Average urbanization rate by gridChina Urban Construction Statistical Yearbook
Developed Area of City Construction X9Average urban built-up land area by gridChina Urban Construction Statistical Yearbook
Environmental factorsPM2.5 X10Average PM2.5 values by gridChina Urban Construction Statistical Yearbook
Industrial wastewater discharge X11Average value of industrial wastewater discharges by gridChina Urban Construction Statistical Yearbook
The total amount of electricity consumed by society X12Average value of electricity consumption for society as a whole by gridChina Urban Construction Statistical Yearbook
Innovative factorsNumber of students enrolled * X13Mean value of the number of students enrolled in each gridChina Urban Construction Statistical Yearbook
Number of Green technology patents *** X14Average number of green inventions per gridChina Statistical Yearbook
Research and experimental development funding X15Average value of research and experimental development funding by gridChina Statistical Yearbook
Policy factorsExpenditures on urban maintenance and construction ** X16Expenditures on urban maintenance and construction by grid AverageChina Statistical Yearbook
Expenditures on energy conservation and environmental protection X17Average value of energy efficiency and environmental protection expenditures by gridChina Statistical Yearbook
* Number of students enrolled; The number of students enrolled in college refers to undergraduate and graduate students. ** Expenditures on urban maintenance and construction: it refers to the expenditures for urban utilities, maintenance, and construction of public facilities arranged by the state budget with the “urban maintenance and construction tax” and local motorized financial resources. *** Green technology patents; Green technology patents refer to emerging technology patents that reduce consumption, reduce pollution, improve ecology, promote the construction of ecological civilization, and realize the harmonious coexistence of man and nature.
Table 3. Based on geodetectors, the explanatory power of variables influencing the spatial evolution pattern of green buildings in China.
FactorIndicator Name201020152020
qpqpqp
Climatic factorWind velocity X10.02840.04170.02370.07420.04100.0059
Precipitation X20.01590.21510.03590.01300.02410.0191
Sunshine X30.00960.47760.06480.00000.02970.0297
Economic factorsGDP X40.61970.00000.55470.00000.72960.0000
Investment in real-estate development X50.58910.00000.45240.00000.52740.0000
Average housing price X60.32300.00000.35930.00000.40620.0000
Social factorspopulation in urban areas X70.32000.00000.43140.00000.54160.0000
urbanization ratio X80.12850.00000.21880.00000.21950.0000
Developed Area of City Construction X90.69550.00000.37660.00000.62870.0000
Environmental factorsPM2.5 X100.01440.26740.03950.00720.03840.0090
Industrial wastewater discharge X110.21070.00000.23570.00000.37690.0000
The total amount of electricity consumed by society X120.41260.00000.46290.00000.55010.0000
Innovative factorsNumber of students enrolled X130.34100.00000.36330.00000.42520.0000
Number of green technology patents X140.46320.00000.55780.00000.68360.0000
Research and experimental development funding X150.56250.00000.55350.00000.63380.0000
Policy factorsExpenditures on urban maintenance and construction X160.25230.00100.26220.00000.25370.0000
Expenditures on energy conservation and environmental protection X170.32420.00200.30160.00000.33620.0000
Note: At the 0.05 level, p-values exhibit a substantial correlation.
Disclaimer/Publisher’s Note: The statements, opinions and data contained in all publications are solely those of the individual author(s) and contributor(s) and not of MDPI and/or the editor(s). MDPI and/or the editor(s) disclaim responsibility for any injury to people or property resulting from any ideas, methods, instructions or products referred to in the content.

