Abstract
Concerning the double carbon national strategy, the energy-saving renovation of old buildings has become one of the most important tasks of energy conservation and emission reduction in construction in China. There are many problems, such as high energy consumption, thermal environment, and poor thermal comfort. Taking Lhasa as an example, this study adopts field research, questionnaire interviews, on-site measurements, numerical simulations, and other methods to propose suitable energy-saving potential excavation points and thermal optimization strategies for office building envelopes in Lhasa through software simulation. Additionally, typical office buildings are selected to carry out the energy-saving renovation of envelopes with the goal of improving indoor thermal comfort to validate the feasibility of the energy-saving renovation strategies. The results show the following: (1) The measured and predicted thermal neutral temperatures of the office population in Lhasa are 16.5 °C and 18.9 °C, respectively. The 90% acceptable temperature range is from 16.10 °C to 21.77 °C, and the occupants of the office buildings in Lhasa have a higher tolerance for cold than predicted. (2) The passive measures adapted to Lhasa are prioritized in the order of passive solar energy, high-heat-capacity materials, and nighttime ventilation. (3) Through the optimization of the enclosure structure of existing office buildings, the improvement of the heat storage capacity of the outer enclosure structure, and the increase in the window opening area to increase natural ventilation, the indoor thermal comfort of the renovated buildings is effectively improved.
1. Introduction
1.1. Background of the Study
Regarding global carbon emissions, China’s carbon emissions in urban areas accounted for up to 80% [1], and the carbon emissions from the construction industry accounted for 50.9% of the total national carbon emissions [2], of which the carbon emissions from public buildings accounted for 38% of the carbon emissions of buildings [2]. Therefore, energy saving in urban buildings is a key aspect of realizing the double carbon goal. The 14th Five-Year Plan period is a critical period for China to realize low-carbon development. The 14th Five-Year Plan clearly requires that the goal of a steady decline in carbon emissions after reaching the peak be realized before 2035 [3]. The energy-saving renovation of existing old buildings has been an important component of China’s energy-saving and emission reduction plan in the field of construction. Among existing buildings, office buildings account for a large stock of high energy consumption, but they have also become a key component of the energy-saving and carbon reduction plan.
In Xizang, due to its early economic development level and relatively backward technology, the construction of the early reference design specifications is not sound, so office buildings frequently have the disadvantages of high energy consumption, uncomfortable spaces, and other issues. However, due to the cold and long winter, regional architectural culture, and economic development level in Lhasa, the mainland imported building energy-saving technology and energy support system in Lhasa City is difficult to apply [4]. Therefore, there is an urgent need to develop suitable office building energy-saving renovation design strategies and methods for high-altitude cold climate zones, which must be based on the local climatic characteristics to select appropriate renovation technologies and maximize the balance between human comfort requirements and saving energy.
1.2. Review of Chinese and International Literature
At present, Chinese and foreign research on existing building renovation strategies has mostly been based on the economy, energy consumption, operating costs, environmental protection, and other issues, and it is often easy to ignore the thermal comfort environment of a building. As a result, owners are not satisfied with the actual renovation results [5]. Chantrelle et al. showed that regarding customer satisfaction after renovation, the actual energy consumption level is closely related to the indoor thermal comfort level of the building [6]. At present, scholars have conducted abundant research on both the effect of energy-saving renovation and the level of indoor thermal comfort in buildings, but the level of indoor thermal comfort has been less often used as a basis for renovation decision-making.
In terms of indoor thermal comfort, in order to scientifically evaluate the thermal comfort performance of buildings, Danish scholar P.O. Fanger proposed the predicted mean vote-predicted percentage of dissatisfied (PMV-PPD) model based on the subjective thermal sensation in an artificial climate chamber test [7]. Nicol and Humphreys proposed the adaptive thermal comfort model in 1973 [8]. In addition to environmental parameters, individual differences and geographical characteristics also affect human thermal sensation and thermal comfort. To address this phenomenon, scholars in China and abroad have carried out many studies on different climate zones, different populations, different building types, and so on. China’s climate is complex, and the current research on tropical and temperate regions is more comprehensive. In cold climate regions, Zhu et al. proposed that the use of a high heat capacity envelope and night ventilation passive combination strategy in Turpan can significantly improve the thermal comfort of office buildings in summer [9]. The concept of indoor thermal comfort energy efficiency (Bureau of Energy Efficiency-PMV, BEE-PMV) has also been proposed in related studies. Wang et al. proposed an evaluation model of indoor thermal comfort energy efficiency (BEE-PMV) for office buildings in Beijing as an example, and their results showed that renovated elements, such as the building window-to-wall area ratio and heating design temperatures, have a greater impact on building energy consumption and indoor thermal comfort [10]. In terms of the indoor thermal neutral temperature, for example, Xu [11], Zhu [12], He [13], Sun [14], Xing [15], and Xing [16] explored the thermal comfort expectations of residents in residential buildings and public buildings in hot summer and cold winter climates, hot summer and warm winter climates, cold climates, and severely cold climates. Their results showed that the geographic location and climatic characteristics, as well as the type of building, all affect the thermal expectations of residents.
In terms of the renovation of existing buildings, Selvaraj et al. found that the application of photovoltaic windows on sunny days in temperate climatic zones can achieve both power-generating components and passive energy savings, as well as reduce glare, compared to conventional double-glazed windows [17]. Shakila et al. showed that the shape of the building and the ratio of the window to the wall affect the thermal comfort of a building in tropical climates [18]. Ehab et al. showed that in the hot, arid climate zone, strategies such as using external shading devices, improving building airtightness, and using external wall and roof insulation are effective in reducing the annual energy consumption rate of buildings [19]. In the hot summer and cold winter climate zones of China, Han [20] and Wang [21] confirmed that envelope materials and construction features have significant impacts on building energy consumption. In the cold climate zone, Liu et al. carried out an energy-saving renovation of the envelope of an office building in Beijing, and their results showed that the energy-saving renovation of the envelope can significantly reduce the winter heat load. Moreover, the energy-saving effect on the renovation of the building’s external windows and the external wall is obvious among envelope renovation measures, while the energy-saving effect of roof renovation is weaker [22]. Cui et al. conducted experimental tests on the thermal insulation characteristic parameters of the envelope of a public building, and the coefficient, airtightness, thermal performance, and other thermal insulation characteristic coefficients of the building envelope can achieve a comprehensive energy-saving rate of 50.2% after reaching the standard [23]. Yu et al. similarly confirmed that the total building load of office buildings decreases with increasing insulation thickness [24]. In addition, in order to select ideal energy-saving renovation solutions, Chen et al. proposed the concept of the demand–response effect (DRE) and constructed a corresponding evaluation index system for energy-saving renovation solutions for existing buildings. They proposed that the gray correlation projection method based on the improvement of discrimination coefficients not only achieves the preference for energy-saving renovation solutions for existing buildings but also analyzes the strengths and deficiencies of each solution [25].
Through analysis and summary of Chinese and foreign literature, it was found that abundant research has been carried out on energy-saving building renovation in different climatic zones, especially retrofitting to reduce the winter heat load in cold climatic zones. However, although Xizang has the same cold climate zone, its geographic location is special, and thus, it has its own system of climate characteristics. Therefore, the results of the current research on other cold climate zones cannot be fully applied to the Xizang region. In this study, Lhasa, a representative city in high-altitude cold climate zones, was taken as the research object. This area has a long sunshine duration and strong solar irradiance. We explored the energy-saving potential excavation points and thermal optimization strategies for the office building envelope in Xizang using the indoor thermal comfort of the office workers as the basis of the renovation decisions. Specifically, the objectives of this study were the following: (1) to summarize the current characteristics of the existing office buildings in Lhasa and their thermal environment and thermal comfort problems; (2) to clarify the indoor thermal neutral temperature of office buildings in Lhasa; and (3) to propose the potential points of envelope energy-saving and thermal optimization strategies for office buildings in Lhasa. (4) Typical office buildings were selected for envelope energy-saving renovation with the goal of improving indoor thermal comfort to verify the feasibility of energy-saving renovation strategies.
2. Materials and Methods
2.1. Overview of the Study Area
2.1.1. Geographic Location and Climatic Characteristics of Lhasa City
Lhasa is located on the southwestern border of China. According to the Köppen climate zone (Figure 1), Lhasa has a warm summer and a dry, cold winter (Dwb) [26] and is characterized by thin air, distinct dry and rainy seasons, low temperatures with small annual differences and large daily differences, and the precipitation is low throughout the year, and it is concentrated in July and August and mostly at night. Lhasa City has strong solar radiation and long sunshine hours. The annual sunshine hours can reach more than 3000 h, providing very rich solar energy resources (Figure 2) [27].

Figure 1.
Geographical location of Lhasa.
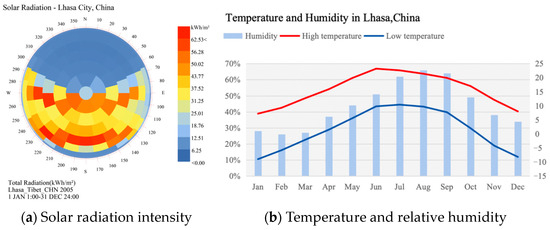
Figure 2.
Climatic conditions in Lhasa.
2.1.2. Characteristics of the Current Situation of Office Buildings in Lhasa City
Lhasa City has a pleasant summer climate, indoor shade, and basically no cooling requirements; therefore, in this study, we focused on the winter indoor thermal comfort of office buildings. A nearly one-month field visit was conducted to investigate the heating types of nearly 20 office buildings, and it was found that the heating systems of the existing old office buildings in Lhasa City were mainly passive type systems. The passive type systems were divided into direct benefit, heat collection and storage wall, and additional sun room types.
This study comprehensively considered factors such as the age of the building, the heating form, and the potential for energy-saving renovations and then selected the corresponding typical buildings to be analyzed for the four types of heating forms. The south side of the comprehensive office building of the Department of Housing and Urban and Rural Development (A), the north side of the comprehensive office building of the Department of Housing and Urban and Rural Development (B), the Lhasa Municipal Bureau of Land and Resources (C), and the Xizang Autonomous Region Association for Science and Technology (D) were selected as the typical representatives of the direct beneficial type, the active type of heating, the thermal storage wall, and the additional sunroom, respectively, in this study. The characteristics of the buildings, the heat collection method, the heat utilization process, and the specifications are shown in Table 1.

Table 1.
Basic information for typical office buildings in Lhasa.
2.2. Research Framework
The research framework of this study is shown in Figure 3. In the first step, the current characteristics and heating forms of existing office buildings in Lhasa are understood through field research. In the second step, three typical office buildings in Lhasa are selected to evaluate the current status of the indoor thermal environment and thermal comfort characteristics through questionnaire surveys combined with thermal environment tests and to identify energy-saving renovation objects. At the same time, the demands of the local office workers for thermal comfort are clarified, and the indoor thermal neutral temperature is determined, which provides a basis for setting boundary conditions in the subsequent numerical simulation. The third step is to simulate the changes in the comfort zone of different passive energy-saving solutions in Lhasa through the Weather Tool (vision 3.0) simulation software to determine the appropriate local passive building design strategies and then propose the appropriate energy-saving potential of the envelope of office buildings for the Lhasa area. Based on this, we propose a suitable energy-saving potential excavation point and thermal optimization strategy for office buildings in the Lhasa area. In the fourth step, we carry out the energy-saving renovation of the enclosure structure of the renovation object and comprehensively evaluate the energy-saving renovation plan with the goal of improving indoor thermal comfort to verify the feasibility of the energy-saving renovation strategy.
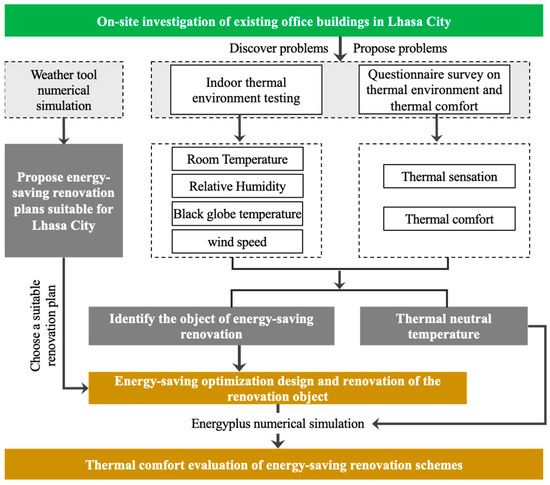
Figure 3.
Research framework.
2.3. Objects for Energy-Saving Optimization and Renovation
For the energy efficiency of buildings in cold regions, the body shape coefficient and the window-wall area ratio are two very important controlling indexes, but the energy-saving renovation of existing buildings cannot be optimized and strengthened from the two aspects of the body shape and the window-wall area ratio. It can only be renovated based on the aspect of changing the thermal insulation measures of the enclosure structure [28]. Therefore, enclosure structures such as walls, roofs, doors, and windows were the focus of this study on energy-saving renovation.
Based on the results of field research and questionnaire interviews, it is concluded that among the three typical buildings, mainly building D has problems with the two aspects of enclosure structure and thermal comfort. So, this study selects building D as the object of energy-saving optimization and renovation. This office building is a single corridor type, with a height of four floors; the building heating method is an additional sunroom, the main entrance of the building faces south, the south side mainly contains offices, and the stairwell is in the north part of the building. In order to capture more sunlight, a south-facing glass curtain wall was constructed from the second floor to the fourth floor, and the glass curtain wall had a certain tilt (Figure 4). However, the problem is that there is no separation between each floor and the glass curtain wall. It was found that the room temperature of the office has a large temperature difference between day and night, and this difference is far greater than the thermal comfort range of the human body in office buildings in Lhasa City. In addition, the glass curtain wall has a small number of openings and a small area, causing serious ventilation deficiencies and a stuffy indoor space in summer.
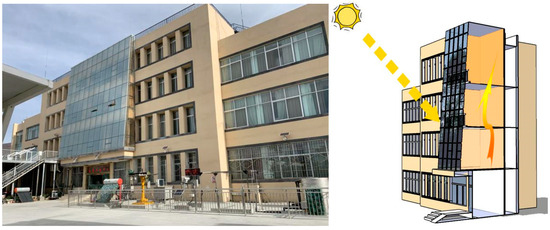
Figure 4.
Map of the current status of the study population.
The envelope construction practice of building D is shown in Table 2, and based on the corresponding thermal conductivity values of each material in the second edition of the Architectural Design Sourcebook [29], the envelope construction values are substituted into Equation (1) to calculate the thermal resistance value of the envelope, and then the obtained thermal resistance value is substituted into Equation (2) to calculate the heat transfer coefficient of the envelope. The heat transfer coefficient of the envelope of building D is shown in Table 3, and the limitation of the heat transfer coefficient in Table 3 refers to the “Xizang Autonomous Region Energy Saving Design Standard for Civil Buildings” (DBJ540001-2016) [30].
where R is the thermal resistance of the material ((m2·K)/W); d is the thickness of the material (m); and λ is the thermal conductivity of the material (W/(m·K)).
where K is the heat transfer coefficient of the material (W/(m2·K)).
R = d/λ,
K = 1/R,
Table 2.
Characteristics of the enclosure structure construction of building D.
Table 3.
Heat transfer coefficients and limit values of the enclosure structure of building D.
Through field research and thermal calculations, the values of the heat transfer coefficient of the exterior walls, roofs, and windows of building D exceed 1.5–3.5 times the limit value stipulated in the standard, and there is a large amount of energy-saving space for the renovation of the building’s exterior enclosure structure.
2.4. Data Collection
2.4.1. Questionnaires
In this study, a questionnaire survey combined with a flow test was used to understand the thermal sensation and thermal comfort condition of the subjects and then determine the indoor thermal neutral temperature of the subjects during the test period to clarify the needs of the local office workers for thermal comfort and to provide a basis for the setting of boundary conditions for the numerical simulation discussed in the following section. However, conducting only questionnaire interviews with building D would result in a smaller sample size, and it would be difficult to accurately reflect the indoor thermal neutral temperature of the office population in Lhasa. Therefore, in this study, questionnaire interviews were conducted with the office populations of buildings A, B, C, and D.
The questionnaire consisted of three parts. The first part consisted of the subject’s basic information, including age, gender, height, weight, ethnicity, and time living in Lhasa. The second part consisted of the subject’s current attire. Table 4 shows the thermal resistance values of common clothing in Lhasa [31]. The third part consisted of the subject’s thermal sensation and thermal comfort condition, which were measured using the American Society of Heating, Refrigerating and Air-Conditioning Engineers (ASHARE) 55-201 seven-level thermal sensation scale of the ASHRAE, i.e., cold (−3), cool (−2), slightly cool (−1), neutral (0), slightly warm (1), warm (2), and hot (3), and the five-level thermal comfort scale, i.e., intolerable (−2), very uncomfortable (−1), uncomfortable (0), slightly uncomfortable (1), and comfortable (2) [32]. The questionnaire is shown in Appendix A.
Table 4.
Thermal resistance values of common garments in Lhasa.
The questionnaire interviews were conducted from 15 January 2019 to 31 January 2019, and the questionnaires were distributed during four time slots: 10:00, 13:00, 16:00, and 19:00. The questionnaires were filled out while the current thermal environment parameters were recorded, and these parameters were used to evaluate the indoor thermal environment of the office and the thermal comfort condition, as well as calculate the indoor heat. The thermal neutral temperature of the office population in Lhasa was also calculated.
2.4.2. Field Measurements
Field Measurement Program
The environmental parameter data mainly consists of outdoor environmental parameters and indoor environmental parameters. The outdoor meteorological parameters were adopted from the hour-by-hour observation data of the ground meteorology of the Lhasa Meteorological Bureau, and the selected data are meteorological data from the Lhasa National Basic Meteorological Station (Station No.: 55591). The acquisition of indoor thermal environment data was divided into two stages. In the first stage, the mobile observation method was used, combined with questionnaire interviews and the recording of thermal environment data from buildings A, B, C, and D, and the test period was from 15 January 2019 to 31 January 2019, at 10:00, 13:00, 16:00, and 19:00. The thermal environment data for the environment in which the respondents were located at the time of filling out the questionnaire were recorded, and these data were used to evaluate the indoor thermal environment of the office and the thermal comfort condition to determine the object of energy-saving renovation and to calculate the thermal neutral temperatures of the office population of Lhasa. In the second stage, the fixed-point observation method was used, and the test object was our renovation object, building D, to further understand the indoor thermal environment change characteristics of the renovation object. The test was conducted from 9:00 to 21:00 on 23 January 2019 and 24 January 2019. The thermal environment parameters located 1.5 m above the ground were collected at 15 min intervals, and the measured indoor environment parameters included indoor temperature, relative humidity, black sphere temperature, and wind speed. The average radiant temperature was calculated from the temperature, relative humidity, black sphere temperature, and wind speed using a formula from a previous study [33].
Layout of Measurement Points
As illustrated in Figure 5, for building D of the standard floor plan, for the third floor, the fourth floor on the south side to the middle of the office, a measurement point was set up, and a control GSP-958 automatic temperature and humidity recorder and WFWZY-1 universal wind speed and wind temperature recorder were deployed to test the changes in the thermal environment parameters of the selected room.
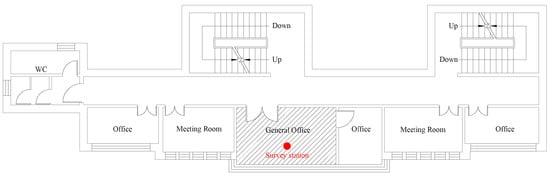
Figure 5.
Arrangement of standard layer measurement points.
Testing Instruments
In this test, a GSP-958 recorder was used to measure the room temperature and relative humidity, a JTR04 black globe temperature tester was used to measure the black globe temperature, and a WFWZY-1 universal wind speed and wind temperature recorder was used to measure the indoor wind speed. The parameters of each instrument are presented in Table 5. The instruments used are in accordance with the ISO 10551 (2019) standard [34].
Table 5.
Instrument Information.
2.5. Indoor Thermal Comfort Evaluation Indicators
In this study, the PMV-PPD index was chosen as the indoor thermal comfort evaluation index. The PMV-PPD thermal comfort model is the earliest mathematical model for human thermal regulation. The PMV value, proposed by Prof. P. O. Fanger from Denmark, is an evaluation index that characterizes the human thermal response and represents the average of the hot and cold sensations of the majority of people in the same environment. The PPD index is the average voting rate of the group expected to be dissatisfied with the thermal environment in a hot environment, and it is the average turnout of the group of people who are dissatisfied with the thermal environment. The PMV-PPD has been widely used in the evaluation of indoor thermal comfort. It is flexible, provides a more intuitive reflection of the thermal environment, and can be combined with dynamic thermal comfort [10,24,32,35].
China’s relevant norms and standards also define the PMV-PPD values, in which the determination of the PMV and PPD indices of medium thermal environments and the provisions of thermal comfort conditions GB/T18049 designates the thermal comfort range suitable for the population in China when −1 ≤ PMV ≤ +1 for the relative comfort range [36]. In addition, Article 4.2.4 of the Evaluation Standard for the Indoor Thermal and Humid Environment of Civil Buildings GB/T50785-2012 states the overall evaluation indexes of the PMV-PPD (Table 6) [37].
Table 6.
Overall evaluation criteria for PMV-PPD under artificial heat source conditions.
There have been complete formulas for the calculation of PMV and PPD values for many years, but since the calculation of PMV equations is a complex nonlinear process, most researchers at this stage use software to calculate PMV, and some commonly used software tools are the “Matlab 2018b” and “Chenguang HVAC Calculator Tools Version 3.00 (CGTools)” [38]. Chenguang HVAC Calculator Tools are composed of seven commonly used HVAC calculation tools: the PMV value calculation of the thermal comfort index, the wet air state parameter calculation, the air treatment process calculation, enthalpy and humidity diagrams, the water pipe resistance calculation, and the air duct resistance calculation. The software is programmed in Windows with a user-friendly interface and is easy to use. Therefore, Chenguang HVAC Calculator Tools were selected for this study to calculate the PMV-PDD values.
3. Results
A total of 150 questionnaires were distributed, and 133 questionnaires were returned, with a validity rate of 88.6%. The interviewees were mainly young and middle-aged, with an age range of 22–55 years old and an average age of 36 years old. Overall, 60.1% of the respondents were male, and 39.9% were female, and the results of the questionnaire could reflect the thermal sensation and thermal comfort of the existing office buildings in Lhasa in winter.
3.1. Analysis of Indoor Thermal Comfort of Office Buildings in Lhasa City
The indoor thermal environment of buildings A, B, C, and D was evaluated. The average PMV and PPD values of the four periods of 10:00, 13:00, 16:00, and 19:00 are shown in Table 7. The evaluation grade of building A is II in the morning and evening, and the evaluation grade of the office reaches I at noon and in the afternoon, from which it can be seen that the passive solar building is strongly dependent on solar radiation. The indoor thermal comfort rating of the building B office is also lower than that of the south office because of the lower solar radiation received by the office. The PMV and PPD values of the tested office in building C are within an acceptable range, the evaluation grade is II in the morning and I in the afternoon and evening, and the overall thermal comfort is the best. The indoor thermal comfort of our renovation object is the worst; the evaluation grade of the morning office is III, and the evaluation grade of the noon and afternoon office is II. This once again explains the reason why we chose building D as the object of transformation.
Table 7.
Calculation of PMV and PPD in the office.
3.2. Thermal Neutral Temperature
In this paper, the room temperature, as an important indicator of the indoor thermal comfort level, is used as the independent variable, and the mean of the actual thermal sensation vote (MTS) and the mean of the predicted thermal sensation (PMV) of the subjects are used as the dependent variables. The linear regression analyses are performed using the SPSS 26.0 statistical analysis software. The results are shown in Figure 6.
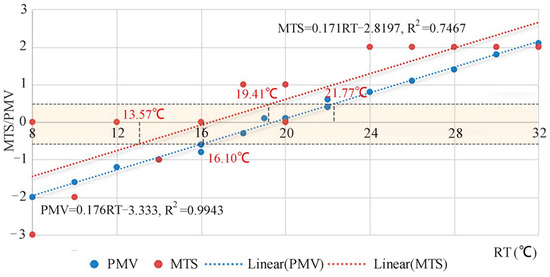
Figure 6.
Thermal neutral temperature and the acceptable temperature range for subjects in office buildings.
The regression equations used to calculate the mean room temperature and the subjects’ actual thermal sensation voting mean MTS and predicted thermal sensation mean PMV are as follows:
MTS = 0.171RT − 2.819, R2 = 0.7467,
PMV = 0.176 RT − 3.333, R2 = 0.9943.
The closer the R2 value of the regression equation is to one, the better the fit of the square program is. The R2 values of both equations are greater than 0.5, indicating that the regression equations can better reflect the relationships between the RT and the MTS and PMV and that the RT has significant positive influences on the MTS and PMV. When MTS = 0 and PMV = 0, the measured and predicted thermal neutral temperatures are 16.5 °C and 18.9 °C, respectively, and the 90% acceptable temperature range is 16.10–21.77 °C. The predicted thermal neutral temperatures are higher than the measured thermal neutral temperatures, which indicates that the occupants of the office buildings in Lhasa City have a higher tolerance to cold than the predicted tolerance. In terms of the slope of the fitted curve, the MTS slope k = 0.171 is slightly smaller than the PMV slope k = 0.176, indicating that the sensitivity of the office workers to temperature changes is slightly smaller than the predicted sensitivity and that none of the investigated offices had a standard heating system, the indoor thermal environment was in a nonsteady-state condition, and the office workers regulated themselves to adapt to the cold environment by drinking hot water, adding clothes, and other artificial means.
In summary, the human body’s adaptation to the environment makes the actual comfort temperature of office workers in winter lower than the theoretical comfort temperature, which indicates that the people who use the office buildings in Lhasa City are more adaptable to the cold environment. Moreover, the office workers easily feel contented with the environment, so the range of comfort in the actual environment is also wider.
3.3. Analysis of the Indoor Thermal Environment of the Renovation Object
To further characterize the indoor thermal environment of building D, which is the object of our energy-saving renovation, due to the cold climate in Lhasa, the number of window openings for air exchange in the test office is not high, and the window opening area is very small. Hence, the indoor wind speed is very small and tends to be close to zero. In addition, the average ambient radiant temperature in winter is roughly equal to the average indoor temperature in terms of numerical value, so the study takes the air temperature and relative humidity as the main indicators to analyze [38].
As shown in Table 8, the outdoor weather conditions were stable during the test period, and the difference between the average values of outdoor air temperature and relative humidity was very small, so the thermal environment test conditions indoors in the office of building D were basically unaffected by the outdoor weather change. The difference between the average values of indoor air temperature and relative humidity on the two days was small, and the changing trend was largely the same. As shown in Figure 7, the daily difference in indoor temperatures of these two offices was larger, and the indoor temperatures peaked at around 15:00. This is due to the fact that the indoor warming of the office mainly relies on heat gain from solar radiation, which is weaker in the morning and evening and reaches its maximum value around 13:00. Since it takes some time for the heat gained indoors to be converted into air temperature, the peak indoor temperature is delayed by approximately 2 h compared to the peak solar radiation intensity. As shown in Table 8, the standard deviation (SD) of the indoor relative humidity is smaller, and the variation in relative humidity is relatively more stable compared to the indoor temperature. This is due to the generally low relative humidity during winter in Lhasa, and the indoor RH variations are largely the result of people’s self-regulating behaviors, such as the use of humidifiers, the installation of additional greenery, and other measures. We found that the temperature in the office on the fourth floor was lower than that in the office on the third floor, but the humidity was higher than that in the office on the third floor. This is presumed to have occurred because the frequency of use of the office on the third floor and the number of office workers during the test period was higher than that of the office on the fourth floor, and the higher frequency of use of the heating equipment caused the temperature to rise, while at the same time increasing the indoor humidity loss.
Table 8.
Descriptive statistics of room temperature and relative humidity in the office.
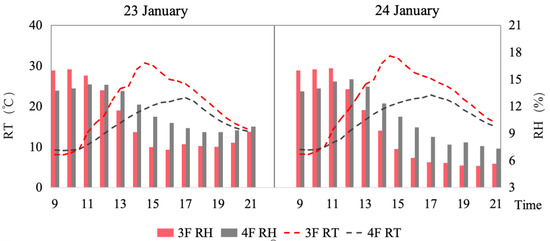
Figure 7.
Variations in temperature and relative humidity in an office room.
3.4. Enclosure Optimization and Simulation Verification Analysis
3.4.1. Optimization Objectives and Optimization Scheme
Selection of Optimization Measures
Weather Tool is an ecological design software program for buildings that was developed by Square One in the UK. It can analyze the climate data for a certain region for 8760 h in a year and then convert the data into a variety of graphical vocabularies that are easier to understand. The enthalpy and humidity diagrams can visualize the appropriate passive building design strategies in the region [39,40,41]. In this study, Weather Tool software was used to simulate the comfort zone changes of different passive building design strategies in the Lhasa area to determine the suitable local passive building design strategies and, based on this, to identify the suitable energy-saving potential excavation points of the envelope and thermal optimization strategies for office buildings in the Lhasa area. The meteorological data used in this simulation are from the CSWD (Chinese Standard Weather Data) of the China Meteorological Administration [42].
The effect of various passive measures on the thermal comfort of the building is shown in Figure 8. The yellow column indicates the percentage of thermal comfort before the adoption of the relevant technology, and the red column indicates the percentage of thermal comfort after the modification with the relevant technology. From the figure, it can be seen that the passive measures applicable to the local climate of Lhasa City are prioritized as passive solar energy (a), high heat capacity materials (b), and night ventilation (c). The use of passive solar energy and other means to increase the heat gain of the building, the use of high heat capacity materials to increase the heat storage capacity of the enclosure structure and thus reduce heat loss, and the night ventilation can ensure the indoor temperature during the day and increase indoor air circulation, which can improve the thermal comfort of the office space to a large extent.
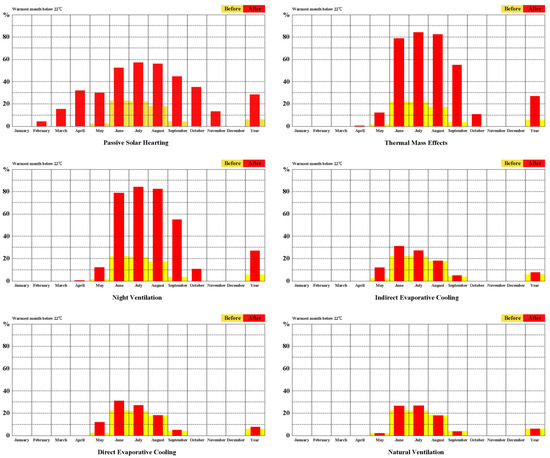
Figure 8.
Results of the passive design simulation analysis for Lhasa City.
Enclosure Optimization Scheme
Based on the passive measures suitable for the local climate of Lhasa, with the premise of indoor thermal comfort being guaranteed, it was determined that the envelope optimization measures of our energy-saving renovation object are as follows: adding a heat preservation layer to the external wall, replacing the roof with an inverted roof with strong heat storage capacity, replacing the single-layer glass curtain wall with a hollow double-layer curtain wall, and increasing the window area. The architectural effect of the renovated building is shown in Figure 9a. By calculating the heat transfer coefficient of the renovated enclosure, it can be seen from Table 9 that the heat transfer coefficient of the renovated enclosure becomes smaller and more variable, which meets the limit value of the heat transfer coefficient stipulated in the Xizang Autonomous Region Civil Building Energy-Saving Design Standard [30].
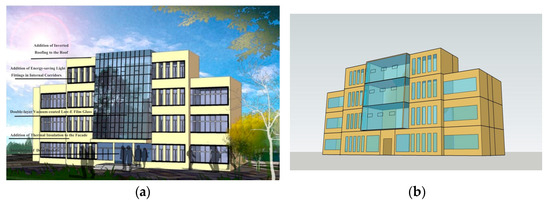
Figure 9.
Schematic diagram of the office building renovation program. (a) Rendering of the renovated office building. (b) Simplified model of the office building.
Table 9.
Office building envelope energy-saving renovation program.
3.4.2. Validation Modeling
A simplified model is built with Energyplus Version 8.9.0, as shown in Figure 9b, for the simulation of the indoor thermal environment and thermal comfort, and the simulation parameters need to be set up first before the simulation. For the outdoor parameters, the meteorological data for Lhasa city in a typical meteorological year are chosen, and the data are obtained from the official website of Energyplus. The indoor parameter settings need to be set for different room functions, and the office building is divided into the three categories of meeting rooms, offices, and transportation spaces according to the plan function. The indoor thermal disturbance settings refer to the relevant provisions of the “Energy-Saving Design Standards for Public Buildings (GB 50189-2015)” [43]. The indoor design parameters are set in combination with the results of the thermal environment test, the thermal comfort questionnaire, and the clothing thermal resistance. The relative humidity is taken as the average value of the test, and the maintenance temperature is based on the value of the thermal neutral temperature calculated as discussed in Section 3.2. Since the measured wind speed value is small and tends to be close to zero, the wind speed is set with reference to the standard of indoor wind speed in winter stipulated in the book of Building Climatology, which is 0.15 m/s to 0.3 m/s [44], and in this study, the wind speed is set to 0.2 m/s. The specific parameter settings are shown in Table 10.
Table 10.
Indoor parameter settings.
3.4.3. Simulation Software Validation
Indoor and outdoor temperature simulations were performed throughout the year by Energyplus Version 8.9.0 simulation software, extracting the third-floor information on 23 January and 24 January.
The simulation data for the southward middle office are compared and analyzed with the measured data, and the calibration is carried out in the following aspects:
- (1)
- The daily trends of measured and simulated values over the test period are plotted, and the correlation between the two is studied.
- (2)
- The absolute and relative errors between the measured and simulated values of the measurement points were calculated. The root mean square error (RMSE) and consistency index (d) [45] were introduced to quantitatively evaluate the absolute and relative errors of the numerical simulation during the test period. The formulas for calculating the RMSE and d values are shown in Equations (5) and (6):
Since experimental data obtained from field measurements inevitably contain inherent errors, the error range of the instrument also needs to be considered in the process of calibration and verification.
As shown in Figure 10, the measured and simulated indoor and outdoor temperature fluctuations roughly coincide with the curve, but the measured value is lower than the simulated value, which is partly due to the fact that building D is a passive heating building, the indoor temperature is highly correlated with the outdoor temperature, and the measured outdoor temperature is slightly lower than the simulated value. However, this is due to the fact that the simulated state is more ideal, but the actual state of the office has dynamic changes in daily office conditions. Internal disturbances in the office are in a state of dynamic change in the daily office, and to maintain the indoor temperature, most of the time, the office staff will not open windows, so this causes differences in the ventilation condition in the office. Overall, the difference between the simulated and measured average daytime indoor and outdoor air temperatures is approximately 2.5 °C. Considering the instrument’s error (±0.5 °C), it can be proved that the Energyplus simulation software can respond well to the actual indoor thermal environment condition of the building.
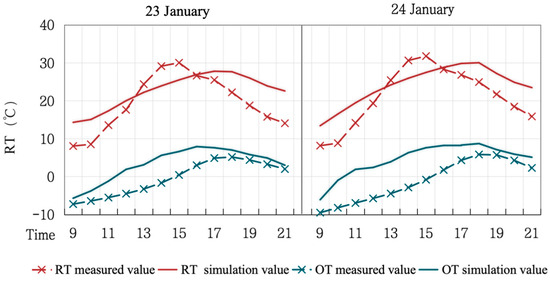
Figure 10.
Comparison of measured and simulated indoor and outdoor temperatures.
As shown in Table 11, the root mean squared error RMSE of the simulated prediction on 23 January is approximately 5.40, the consistency index d is approximately 0.97, the root mean squared error RMSE of the simulated prediction on 24 January is approximately 5.02, and the consistency index d is approximately 0.99. The consistency indices d are all greater than 0.9, which shows that the Energyplus simulated values are in relatively good agreement with the actual measured values.
Table 11.
Quantitative evaluation of simulated and measured values.
3.5. Comparison of Results before and after Optimization
3.5.1. Analysis of Thermal Environment Parameters
For the simulation of the room temperature of the office building before and after the renovation, we selected the room temperature data at 9:00–21:00 on 23–24 January in the test office for comparative analysis. The results are shown in Figure 11. After the renovation of the office, the room temperature increased, and it was higher than the measured and simulated room temperatures before the renovation. In particular, in the morning and evening, the difference between the curves is smaller, and the temperature difference between day and night is obviously reduced. The temperature increase in the fourth-floor office after renovation is greater than that in the third-floor office, which is due to the fact that the improvement in the thermal insulation performance after the change in the roof construction is more significant on the fourth floor than on the third floor. The results show that increasing the wall insulation layer, improving the airtightness of the windows, and changing the order of the roof structure improve the heat storage capacity of the building to a large extent, and the overall thermal insulation effect of the remodeled office building is better than that of the original building.
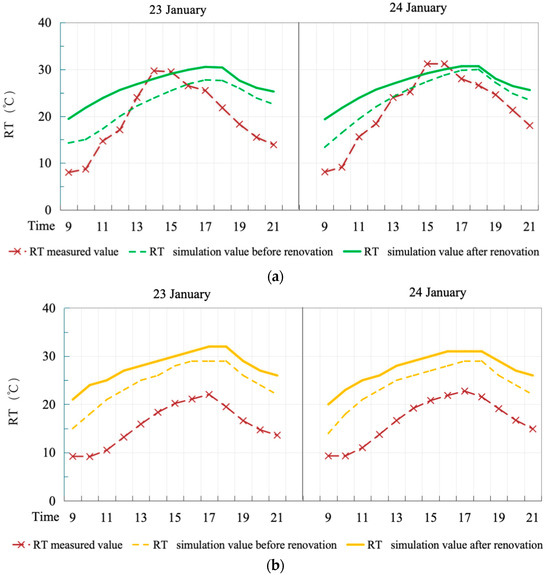
Figure 11.
Comparison of room temperatures in offices before and after remodeling. (a) Comparison of room temperatures before and after remodeling of the third-floor offices. (b) Comparison of room temperatures before and after remodeling of the fourth-floor offices.
3.5.2. Indoor Thermal Comfort Analysis
The PMV and PPD results for the office building before and after the renovation are presented in Table 12. By comparing the measured and simulated PMV-PPD values before the renovation, it can be seen that the people who use the office building in Lhasa City have a relatively strong tolerance for colder environments. We found that the office workers adjusted to the colder environments by drinking hot water, adding clothes, and other artificial means during the research period. This also proves that the judgment standard of thermal comfort is not only related to the indoor thermal parameters, but it is a comprehensive result jointly influenced by the human body’s physical quality, subjective feelings, and the current state of the subject. By combining the definition criteria of the PMV-PPD values and evaluating the simulated PMV-PPD values before and after the renovation, it was found that after the renovation, the evaluation level reached level II during office use time, which greatly improves the thermal comfort satisfaction of the office building.
Table 12.
Comparison of PMV and PPD results for office buildings before and after remodeling.
4. Discussion
In this study, we explored the energy-saving potential and thermal optimization of the envelope of the existing office buildings under high-altitude cold climate conditions. Through field visits and research, it was found that the heating system types of the existing old office buildings in Lhasa City were mainly passive type systems, which were divided into direct beneficiary type, collector heat storage wall type, and additional sun room type. In new office buildings, in order to enhance indoor comfort, heating systems mostly use active–passive synergistic technology. This is different from cities such as Tianjin [15], Xi’an [46], and Harbin [47], which are also in the cold climate zone, where centralized heating and fan coil heating are mostly used. This is due to the geographic location of Lhasa City, which has a unique advantage of solar energy resources, so maximizing the potential of solar energy utilization in winter to enhance the thermal storage capacity of the building can improve the indoor thermal comfort of the building to a large extent.
In this study, questionnaire interviews combined with thermal environment tests yielded actual and predicted thermal neutral temperatures of 16.5 °C and 18.9 °C, respectively, within the office buildings in Lhasa, with a 90% acceptable temperature range of 16.10–21.77 °C. The occupants of the office buildings in Lhasa have a higher tolerance for cold than predicted. Shi et al. showed that in Xi’an, the actual and predicted indoor thermal neutral temperatures of office buildings were 21.4 °C and 20.8 °C, respectively, with a 90% acceptable temperature range of 18.8–23 °C [46]. Xing et al. showed that in Tianjin, the thermal neutral temperature of office buildings in winter was 21.3 °C and that the comfort zone was 15.8–27.0 °C [15]. Through fitting, Sun et al. calculated that in Dalian, the human thermal neutral temperature is 19.8 °C, the acceptable temperature range for 80% of the personnel is 16.0–23.5 °C, and the acceptable temperature range for 90% of the personnel is 17.6–22.0 °C [48]. In the Design Code for Heating, Ventilation, and Air Conditioning of Civil Buildings (GB50736-2016), it is recommended that the room temperature in cold regions should reach 20 °C [49], indicating that within the same cold climate zone, there are some differences in the demand for indoor thermal comfort among the residents, and the office workers in Lhasa City are more tolerant of cold. In other climatic zones, many studies have also been conducted on the indoor thermal neutral temperature of office buildings. Xu [11] showed that in the hot summer and cold winter climatic zones, the measured thermal neutral temperature in winter is 22.1 °C, and the upper limit of the acceptable temperature for the entire year is 27.5 °C. Wu et al. showed that in the hot summer and warm winter regions, regarding the thermal comfort of unheated office buildings, the measured thermal neutral temperature in winter is 23.3 °C [50]. It can be seen that there are also large differences in people’s thermal expectations in different climate zones. In addition to the differences in thermal comfort brought about by climatic differences, there are also differences in people’s thermal expectations within different building types. For example, Wei [51] investigated the thermal comfort needs of residential buildings in cold regions and reported an indoor thermal neutral temperature of 17.4 °C in winter and a heat-expectation temperature of 22.4 °C. Due to the varying duration and behavior of people in different types of buildings, there are also differences in their demand for thermal comfort.
In this study, passive measures adapted to the Lhasa region were prioritized, i.e., passive solar, high heat capacity materials, and night ventilation, using enthalpy and humidity diagram simulation and the Weather Tool simulation software. Many studies have been conducted in cold climate zones to confirm that the energy-saving renovation of the envelope can significantly reduce the winter heat load [22,23,24]. However, in Xizang, due to the differences brought about by its geographic location and climatic conditions, the type of winter heating in local office buildings is very different from that used in other cold climate zones. Suitable local passive measures are predominantly preferred compared to passive solar energy, so how to use its own advantages, i.e., using passive solar energy technology, to enhance the thermal storage capacity of the envelope, as a way to reduce the building energy consumption and enhance indoor thermal comfort, is more important than in other regions.
Finally, by optimizing the envelope of a typical office building, enhancing the heat storage capacity of the envelope, and increasing the natural ventilation, the results of this study show that the renovated office building not only meets the limit value of the heat transfer coefficient stipulated in the Energy-Saving Design Standard for Civil Buildings in the Xizang Autonomous Region but also improves the indoor thermal comfort to a greater extent.
5. Conclusions
This study proposes energy-saving potential excavation points and thermal optimization strategies for office building envelopes in Lhasa by using field research, questionnaire interviews, on-site measurements, and numerical simulations. The feasibility of the energy-saving strategies is verified by carrying out the energy-saving renovation of envelopes in typical existing office buildings with the goal of improving indoor thermal comfort. Specifically, the following conclusions are drawn:
- (1)
- The heating system type of established old office buildings in Lhasa is mainly passive, and the passive type systems are categorized into the direct beneficiary type, thermal collector wall type, and additional sunroom type, unlike in other cities in cold climate zones.
- (2)
- The measured and predicted thermal neutral temperatures in Lhasa are 16.5 °C and 18.9 °C, respectively, with a 90% acceptable temperature range of 16.10 °C to 21.77 °C, so the population of the office building occupants in Lhasa has a higher tolerance for cold than predicted.
- (3)
- Passive measures adapted to the Lhasa area are prioritized as follows: passive solar energy, high heat capacity materials, and night ventilation.
- (4)
- Optimizing the envelope of existing office buildings, enhancing the heat storage capacity of the external envelope, and increasing the window area’s natural ventilation can effectively improve the indoor thermal comfort of the renovated building.
Due to the limited conditions, this study has some shortcomings. Because of the limited testing instruments and personnel, we only collected thermal environment data for the middle-floor office of the selected objects, and we did not test the side offices, leading to a lack of lateral data comparison. In addition, we only conducted basic research on the indoor space thermal comfort of the existing office buildings in Lhasa City, as well as the feasibility of renovating the enclosure to regulate thermal comfort. In the future, it will be necessary to continue to explore and study more in-depth issues and to simulate, analyze, and compare more energy-saving renovation technologies.
Author Contributions
Conceptualization, W.S. and B.S.; methodology, W.S., B.S. and L.C.; software, W.S.; validation, W.S.; formal analysis, W.S. and L.C.; writing—original draft preparation, W.S. and L.C.; writing—review and editing, W.S., B.S., L.C. and K.L.; writing—original draft preparation, W.S. and L.C.; supervision, B.S. All authors have read and approved the manuscript.
Funding
This study was supported by the National Natural Science Foundation of China’s “Research on Theory and Key Technologies of Zero Energy Consumption Livable Building Design in Plateau Tibetan Areas” project (No. 51578453), the Natural Science Foundation of Xizang Autonomous Region’s “Energy-saving Retrofit of the Enclosure Structure of Existing Office Buildings in Lhasa” project (No. XZ202301ZR0006G), the Lhasa Science and Technology Plan Project of the Xizang Autonomous Region titled “Research and demonstration of key technologies for zero energy solar building cogeneration in high-altitude and cold regions” (No. LSKJ202308), and the Sichuan Provincial Regional Innovation Cooperation Project titled “Key Technologies and Demonstration Applications for Improving the Living Environment of Tibetan Villages under Extreme Climate and Fragile Ecological Environment Constraints” (No. 2021YFQ0040).
Data Availability Statement
The data presented in this study are available in the article.
Acknowledgments
This study was carried out with the support and cooperation of the Lhasa Municipal Department of Housing and Construction, the Bureau of Land and Resources, and the Xizang Autonomous Region Association for Science and Technology. We thank the Lhasa Meteorological Bureau for providing the meteorological data on Lhasa for this study and LetPub for its linguistic assistance during the preparation of this manuscript.
Conflicts of Interest
The authors declare that they have no conflicts of interest.
Appendix A
- Questionnaire on Indoor Thermal Comfort for Office Workers in Winter
Thermal environment parameters:
Air temperature:__________ Black sphere temperature:__________
Relative air humidity:__________ Indoor air speed:__________
- Basic information:
- Gender:__________ Age:__________ Height (cm):__________ Weight (kg):__________
- How many years have you lived in Xizang:__________
- 2.
- Current dressing situation:
Tops: Shirt□, Autumn clothes□, Underwear□, Thin sweater□, Thick sweater□, Thin coat□, Thick coat□, Down jacket□, Cotton jacket□, Tweed coat□, Trench coat□, Jumper□, Jacket□, Tibetan shirt□.
Bottoms: Autumn trousers□, Wool trousers□, Trousers□, Long loose-fitting sweatpants□, Cotton trousers□, Dresses□, Skirts□.
Footwear: Sports shoes□, Leather shoes□, Casual shoes□, Boots□.
Hosiery: Thick cotton socks□, Thin cotton socks□, Ankle socks□, Knee socks□, Pantyhose□.
- 3.
- Your activity status during the 30 min prior to the survey (single choice):
Sitting and relaxing□, Sedentary in the office□, Resting in place□, Standing, slow walking, or relaxing□, Fast walking□, Running or intense activities□.
- 4.
- Are you taking steps to cool or warm your room at this time (multiple choice)?
Cooling: Central air-conditioning□, Wall-mounted air-conditioning□, Electric fan□, Window ventilation□, Humidifier□, Water in pots□, Green plants□.
Heating: Electric heater□, Small sun□, Air conditioner□, Local heating measures (hand warmers, foot warmers, electric blankets)□, No measures□, Others. __________
- 5.
- Your heat sensation at this time is (single choice):
Hot and cold sensation: Hot□, Warm□, Slightly warm□, Moderate□, Slightly cool□, Cool□, Cold□
Moisture sensation: Very damp□, Damp□, A little damp□, Comfortable□, A little dry□, Dry□, Very dry□
Feeling of wind blowing: Very stuffy□, Stuffy□, A little stuffy□, Comfortable without wind□, Comfortable with wind□, A little windy□, A lot of wind□.
- 6.
- Your thermal comfort at this time (single choice):
Extremely uncomfortable□, Slightly uncomfortable□, Fairly comfortable□, Very comfortable□.
- 7.
- Your acceptance of indoor hot and cold environments (single choice):
Totally unacceptable□, Unacceptable□, Slightly unacceptable□, Acceptable□, Totally acceptable□.
- 8.
- How would you like to see the parameters of the indoor thermal environment improved at this time (multiple choice)?
Temperature: Increase□, No change□, Decrease□.
Humidity: Increase□, No change□, Decrease□.
Wind speed: Increase□, No change□, Decrease□.
- 9.
- What would you use to enhance thermal comfort (multiple choice)?
Existing environment is comfortable and does not require adjustment□, Open windows and doors for ventilation□, Close windows and doors to keep warm□, Add more clothes□, Subtract more clothes□, Drink hot water□, Light activity□, Increase heating/air conditioning temperature□, Reduce activity level□, Other□.
References
- Ribeiro, H.V.; Rybski, D.; Kropp, J.P. Effects of Changing Population or Density on Urban Carbon Dioxide Emissions. Nat. Commun. 2019, 10, 3204. [Google Scholar] [CrossRef]
- China Association of Building Energy Efficiency. Research Report on Energy Consumption and Carbon Emission of Buildings in China (2022). Int. J. Archit. 2023, 57–69. [Google Scholar]
- Song, X.Y. Research on the Influencing Factors of Energy Consumption and Energy-Saving Renovation Strategies of Existing office Buildings in Shenyang Area. Master’s Thesis, Shenyang Architecture University, Shenyang, China, 2021. [Google Scholar] [CrossRef]
- Zhao, T.R.; Qi, X.J. Energy-saving renovation of a middle school office building in Lhasa. Build. Energy Effic. 2016, 44, 88–91. [Google Scholar]
- Evins, R. A review of computational optimization methods applied to sustainable building design. Renew. Sustain. Energy Rev. 2013, 22, 230–245. [Google Scholar] [CrossRef]
- Chantrelle, F.P.; Lahmidi, H.; Keilholz, W.; El Mankibi, M.; Michel, P. Development of a multi criteria tool for optimizing the renovation of buildings. Appl. Energy 2011, 88, 1386–1394. [Google Scholar] [CrossRef]
- Fanger, P.O. Thermal Comfort Analysis and Applications in Environmental Engineering; Danish Technical Press: Copenhagen, Denmark, 1970. [Google Scholar]
- Nicol, J.F.; Humphreys, M. Understanding the adaptive approach to thermal comfort. ASHRAE Trans. 1998, 104, 991–1004. [Google Scholar]
- Zhu, Y.R.; Wang, W.J. Research on thermal environment testing of office buildings in Turpan. Build. Energy Sav. Energy 2018, 46, 85–88. [Google Scholar]
- Wang, J.L.; Wang, Q.Q.; Yu, W.; Li, G.Z.; Yuan, Y. Analysis of green retrofit strategies for existing office buildings based on indoor thermal comfort energy efficiency. Heat. Vent. Air Cond. 2015, 45, 22–28+47. [Google Scholar]
- Xu, C.; Zhai, Y.C.; Zhou, X.; Zhang, H.; Yang, L.; Liu, J. Thermal comfort site study of a centrally air-conditioned office building in Changsha area. Heat. Vent. Air Cond. 2019, 49, 121–128. [Google Scholar]
- Zhu, B. Research on Thermal Comfort of Shopping Malls in Hot Summer and Warm Winter Areas Based on Machine Learning. Master’s Thesis, South China University of Technology, Guangzhou, China, 2018. [Google Scholar]
- He, W.F.; Chen, Y.J.; Wang, D.J.; Chen, G.X. Research on indoor thermal comfort grading of existing residential buildings in cold regions—Taking Xi’an as an example. Build. Sci. 2019, 35, 61–65+117. [Google Scholar]
- Sun, Y.C.; Lu, S.L.; Wang, R. Research on summer air conditioning thermal comfort of green office buildings in Guangzhou area. Heat. Vent. Air Cond. 2019, 49, 18–22. [Google Scholar]
- Xing, J.C.; Li, Z.Q.; Ling, J.H.; Wang, J.B. Research on human thermal comfort of office buildings in Tianjin area. Heat. Vent. Air Cond. 2018, 48, 97–101. [Google Scholar]
- Xing, K.; Shao, Y.; Sun, H.X. Measured research on thermal comfort of office buildings in transition season in severe cold regions. J. Archit. 2017, 3, 118–122. [Google Scholar]
- Prabhakaran, S.; Aritra, G.; Tapas, K.; Mallick, S. Investigation of semi-transparent dye-sensitized solar cells for fenestration integration. Renew. Energy 2019, 141, 516–525. [Google Scholar]
- Shakila, P.; Asanka, R.; Rangika, H. Effect of building shape, orientation, window to wall ratios and zones on energy efficiency and thermal comfort of naturally ventilated houses in tropical climate. Int. J. Energy Environ. Eng. 2019, 10, 107–120. [Google Scholar]
- Ehab, R.; Maha, A. Energy retrofitting strategies for office buildings in hot arid climate. Int. J. Low-Carbon Technol. 2022, 17, 506–512. [Google Scholar]
- Han, T.Y. Optimization Research on Energy-Saving Retrofit of Existing Office Buildings Based on Regional Climate. Master’s Thesis, Anhui University of Architecture, Hefei, China, 2023. [Google Scholar] [CrossRef]
- Wang, H. Research on Optimization of Building Envelope Energy Saving Based on Energy Simulation Technology. Master’s Thesis, Wuhan University of Science and Technology, Wuhan, China, 2015. [Google Scholar]
- Liu, Z. Analysis of energy-saving retrofit effect of an office building envelope. Build. Technol. 2023, 54, 163–166. [Google Scholar]
- Cui, J.K.; Chen, J.; Bao, W.Z. Analysis of Envelope Retrofit and Energy Saving of Public Buildings in Cold Regions. Build. Technol. 2020, 51, 381–384. [Google Scholar]
- Yu, J.; Yang, Z.W.; Wang, C.; Li, K.B. Simulation and analysis of office building energy consumption based on Dest-C. J. Shenyang Univ. Archit. 2015, 31, 689–697. [Google Scholar]
- Chen, W.G.; Zhang, Y.; Zhang, N.; Cheng, Z. Selection of energy-saving retrofit scheme for existing buildings based on improved gray correlation projection method. J. Shenyang Univ. Nat. Sci. Ed. 2022, 34, 306–313. [Google Scholar] [CrossRef]
- Zhang, Y.Z.; Chen, L.X.; Sun, C.; Fu, Y.; Xie, Y. An investigation of the influence of the morphological indexes of trees on the outdoor microclimate at high altitude in summer. Front. Environ. Sci. 2023, 11, 1098966. [Google Scholar] [CrossRef]
- Ma, L.; Zhang, J.; Chen, L.; Xiao, S.; Zhang, Y. A field research on the impact of underlying surface configuration on street thermal environment in Lhasa. AIMS Environ. Sci. 2019, 6, 483–503. [Google Scholar] [CrossRef]
- He, X.H. Research on the Relationship between Public Building Design Parameters and Building Energy Efficiency in Lhasa. Master’s Thesis, Chongqing University, Chongqing, China, 2014. [Google Scholar]
- Architectural Design Sourcebook, 3rd ed.; China Construction Industry Press: Benjing, China, 2019; p. 41.
- DBJ540001-2016; Energy-Saving Design Standards for Civil Buildings in Xizang Autonomous Region. Department of Housing and Urban-Rural Development of Xizang Autonomous Region: Lasha, China, 2016.
- Chen, L.; Zhang, Y.; Han, J.; Li, X. An investigation of the influence of ground surface properties and shading on outdoor thermal comfort in a high-altitude residential area. Front. Archit. Res. 2021, 10, 432–446. [Google Scholar] [CrossRef]
- ISO 10551:2019; Ergonomics of the Physical Environment—Subjective Judgment Scales for Assessing Physical Environments. ISO: Geneva, Switzerland, 2019.
- Li, L.; Wang, F.H.; Shen, J.; Wang, Q. Analysis of thermal comfort test results in microcomputer laboratories of Harbin University. For. Eng. 2009, 25, 49–52. [Google Scholar] [CrossRef]
- ASHRAE Standard 55; Thermal Environmental Conditions for Human Occupancy. American Society of Heating, Refrigerating and Air-Conditioning Engineering: Atlanta, GA, USA, 2017.
- Wang, S.C.; Di, Y.H. Evaluation and analysis of indoor thermal comfort of office buildings comparing different thermal comfort indicators. Refrig. Air Cond. 2012, 26, 592–596. [Google Scholar]
- GB/T18049-2000; Determination of PMV and PPD Indices of Medium Thermal Environment and Provisions for Thermal Comfort Conditions. China Standard Press: Beijing, China, 2000.
- GB/T50785-2012; Evaluation Standard for Indoor Heat and Humidity Environment of Civil Buildings. China Building Industry Press: Beijing, China, 2012.
- Xin, X. Research on Energy-Saving Renovation of Existing Secondary School Buildings in Hohhot Based on Thermal Comfort Conditions. Master’s Thesis, Xi’an University of Architecture and Technology, Xi’an, China, 2016. [Google Scholar]
- Dang, X.H.; Fang, B.W.; Jia, L.F. Climate-adaptive design strategy for Tianshui residential houses based on software analysis. Shanxi Archit. 2022, 48, 49–52. [Google Scholar] [CrossRef]
- Liu, L.; Li, L.L. Analysis of passive energy-saving technologies in the context of geographical differences—An example of comparison between Jilin Architecture University and South China University of Technology. Build. Energy Sav. 2019, 47, 17–21, 38. [Google Scholar] [CrossRef]
- Chen, X.Y.; Li, T. Analysis of indoor thermal environment testing of rural residential houses in transition season. Resid. Sci. Technol. 2017, 37, 50–56. [Google Scholar] [CrossRef]
- ASHRAE. Chapter 8, Thermal Comfort. In ASHRAE Handbook of Fundamentals; ASHRAE, Tnc.: Atlanta, GA, USA, 2005. [Google Scholar]
- GB 50189-2015; Energy-Saving Design Standards for Public Buildings. China Building Industry Press: Beijing, China, 2015.
- Yang, L. Building Climatology; China Construction Industry Press: Beijing, China, 2010. [Google Scholar]
- Willmott, C.J. Some comments on the evaluation of model performance. Bull. Am. Meteorol. Soc. 1982, 63, 1309–1313. [Google Scholar] [CrossRef]
- Shi, J.Y.; Hao, B.N.; Zhang, Q.; Zheng, X.; Ni, Q. Investigation of winter thermal comfort of office buildings in cold climate zones. J. Xi’an Univ. Sci. Technol. 2020, 40, 629–636. [Google Scholar] [CrossRef]
- Wang, Z.J.; Ren, J.; Ji, Y.C.; Ning, H.R. Research on thermal environment and thermal adaptation of residential and office buildings in severe cold regions. Build. Sci. 2016, 32, 60–65. [Google Scholar] [CrossRef]
- Sun, B.; Duanmu, L.; Li, X.L.; Cui, B.B. Research on human thermal comfort of office buildings in Dalian area in winter. Build. Therm. Vent. Air Cond. 2021, 40, 1–6. [Google Scholar]
- GB50736-2016; Design Code for Heating, Ventilation and Air Conditioning of Civil Buildings. China Construction Industry Press: Beijing, China, 2016.
- Wu, T.L.; Cao, B.; Zhu, Y.X. A field study on thermal comfort and air-conditioning energy use in an office building in Guangzhou. Energy Build. 2018, 168, 428–437. [Google Scholar] [CrossRef]
- Wei, N.; Zheng, W.X.; Zhang, N.; Zhao, S.K.; Zhai, Y.C.; Yang, L. A field study of seasonal thermal comfort and adaptation behavior of residential buildings in Xi’an, China. J. Cent. S. Univ. 2022, 29, 2403–2414. (In English) [Google Scholar] [CrossRef]

Disclaimer/Publisher’s Note: The statements, opinions and data contained in all publications are solely those of the individual author(s) and contributor(s) and not of MDPI and/or the editor(s). MDPI and/or the editor(s) disclaim responsibility for any injury to people or property resulting from any ideas, methods, instructions or products referred to in the content. |
© 2024 by the authors. Licensee MDPI, Basel, Switzerland. This article is an open access article distributed under the terms and conditions of the Creative Commons Attribution (CC BY) license (https://creativecommons.org/licenses/by/4.0/).