1. Introduction
Türkiye is located in a seismically active zone of convergence between the Arabian, African, and Eurasian plates. Approaching the African and Arabian tectonic plates to the Eurasian plate causes high seismic activity in this region.
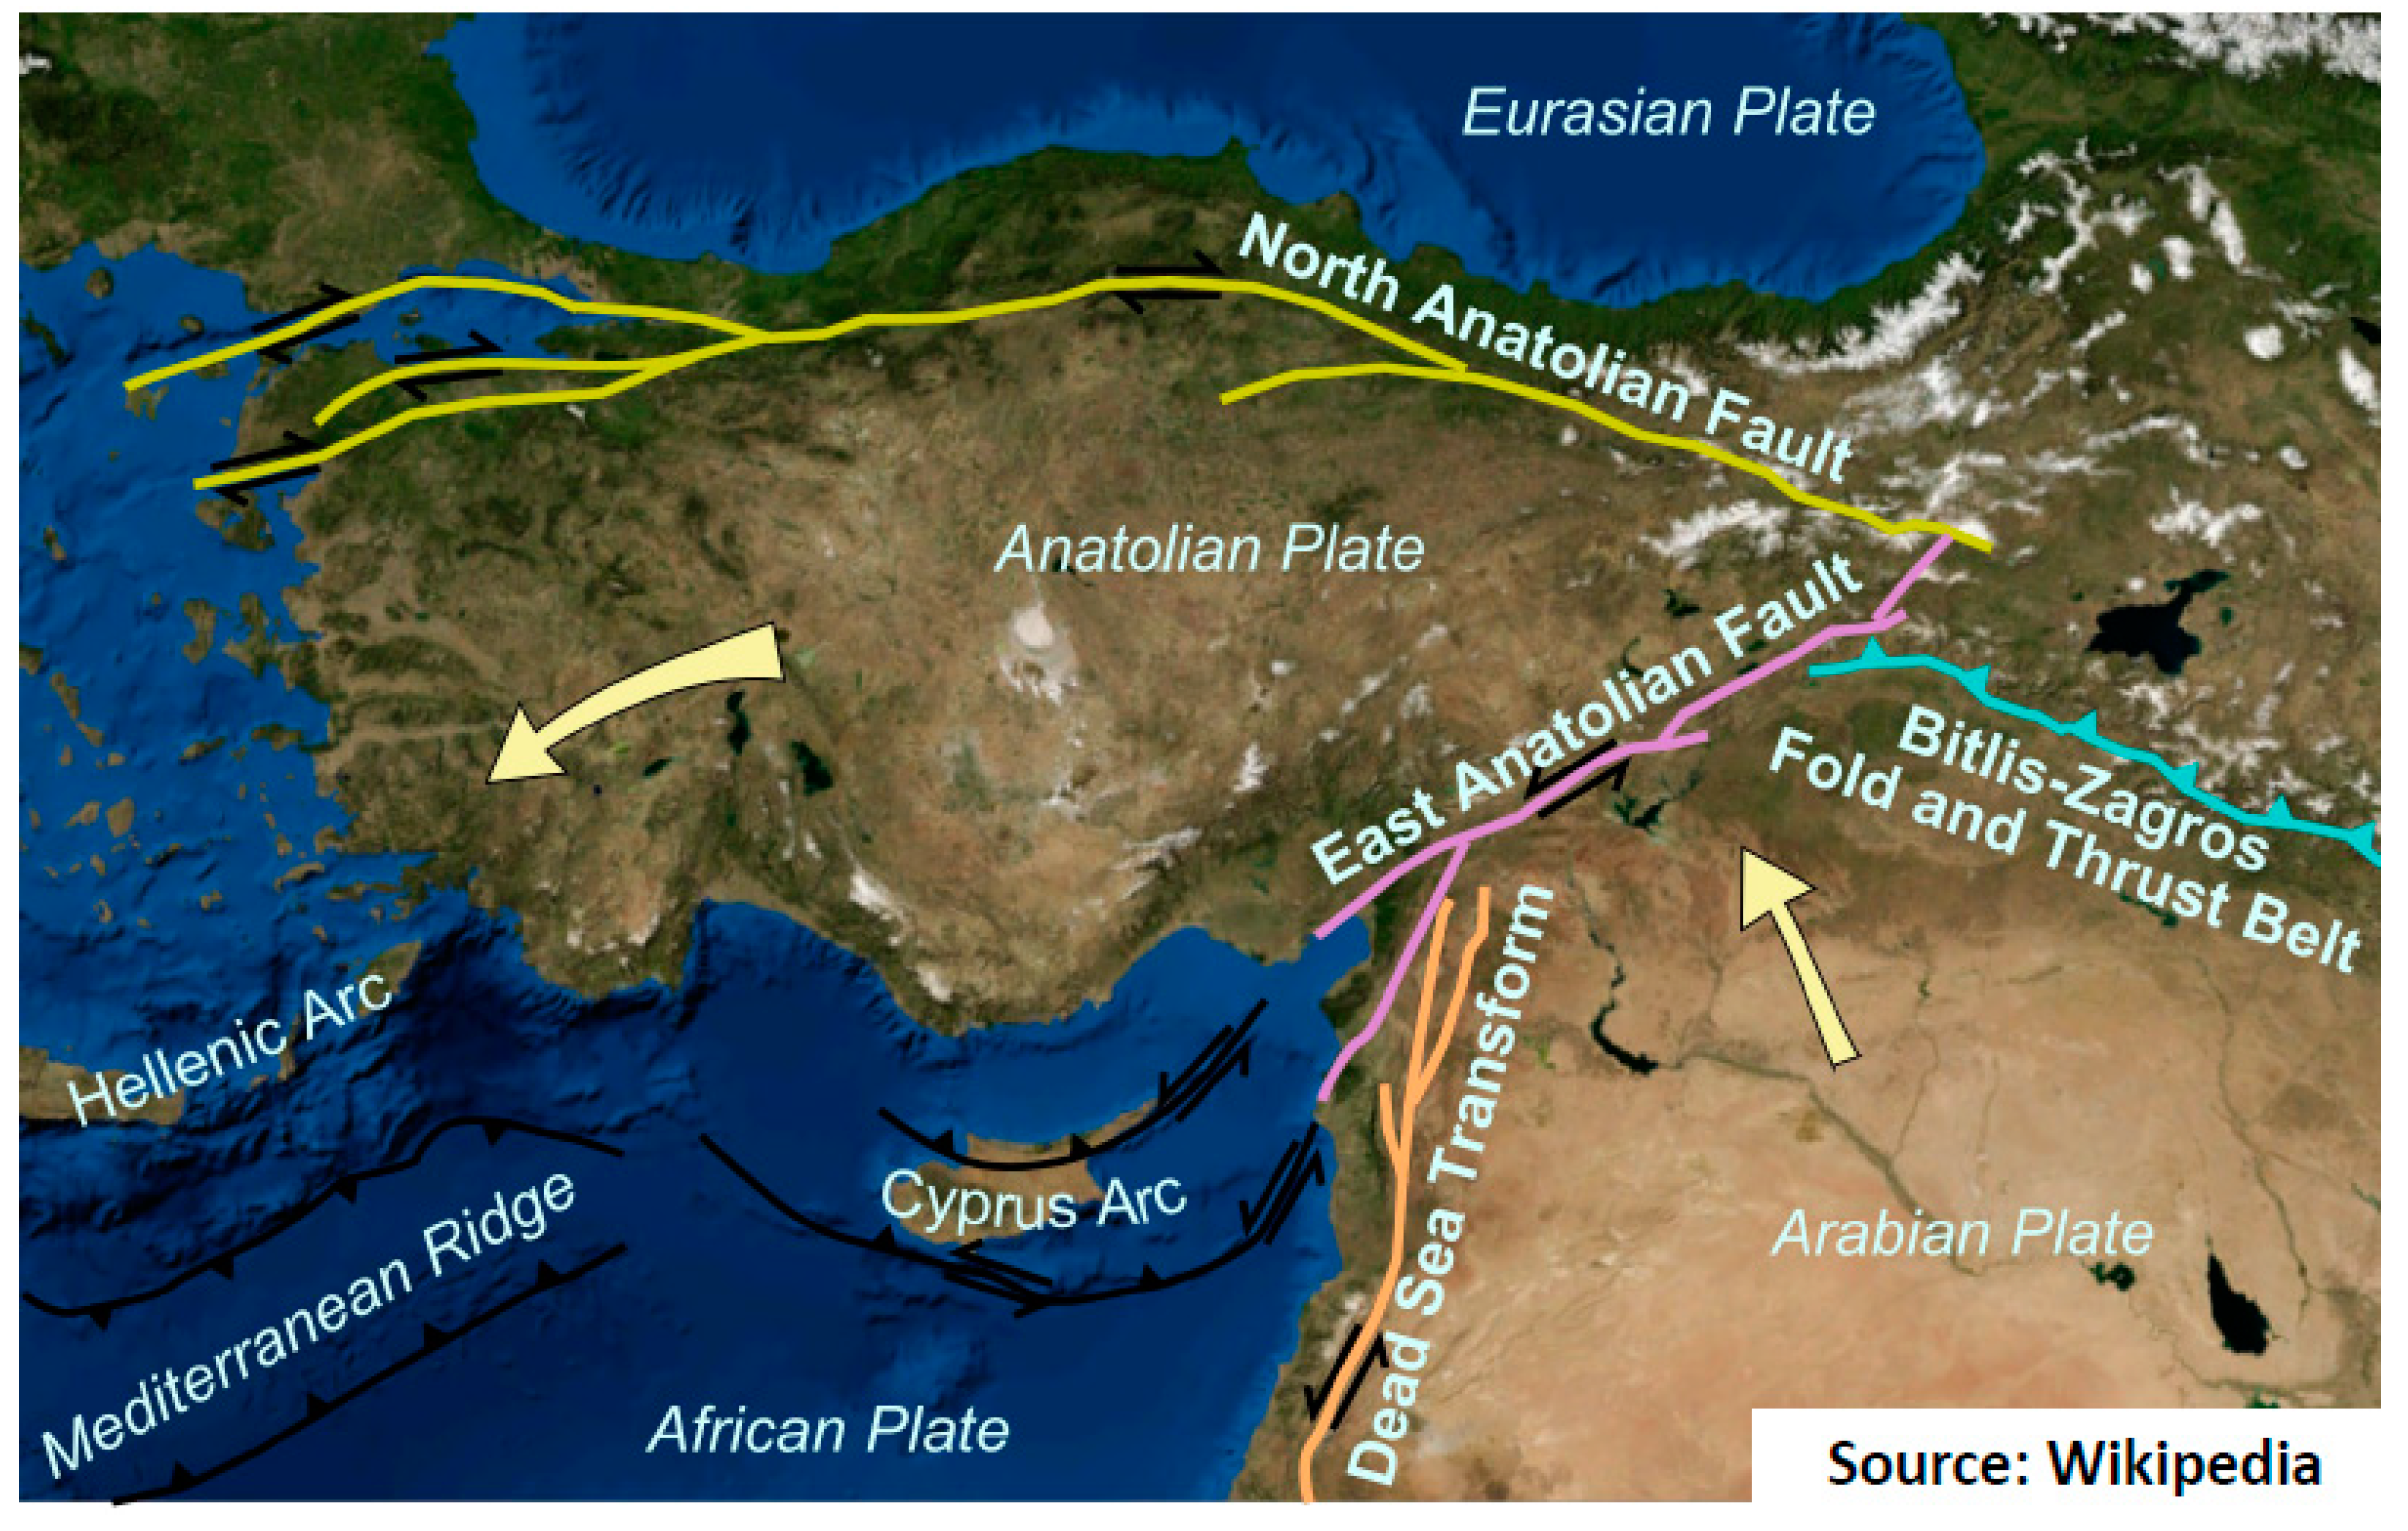
Figure 1 shows the main tectonic structures around the Anatolian Plate. Here, the arrows show the displacement vectors of the Anatolian and Arabian plates relative to the Eurasian plate [
1]. The westward motion of the Anatolian plate is accommodated by the North and East Anatolian faults. The North and East Anatolian faults connect at Karlıova in Eastern Anatolia and make the Karlıova triple junction. The North Anatolian Fault (NAF) is an almost east–west (E–W) trending right-lateral strike-slip fault for a length of about 1200 km and forms the transform boundary between Eurasia and Anatolian plates. The East Anatolian Fault (EAF) is a northwest–southeast (NW–SE) trending left-lateral strike-slip fault for a length of about 550 km long [
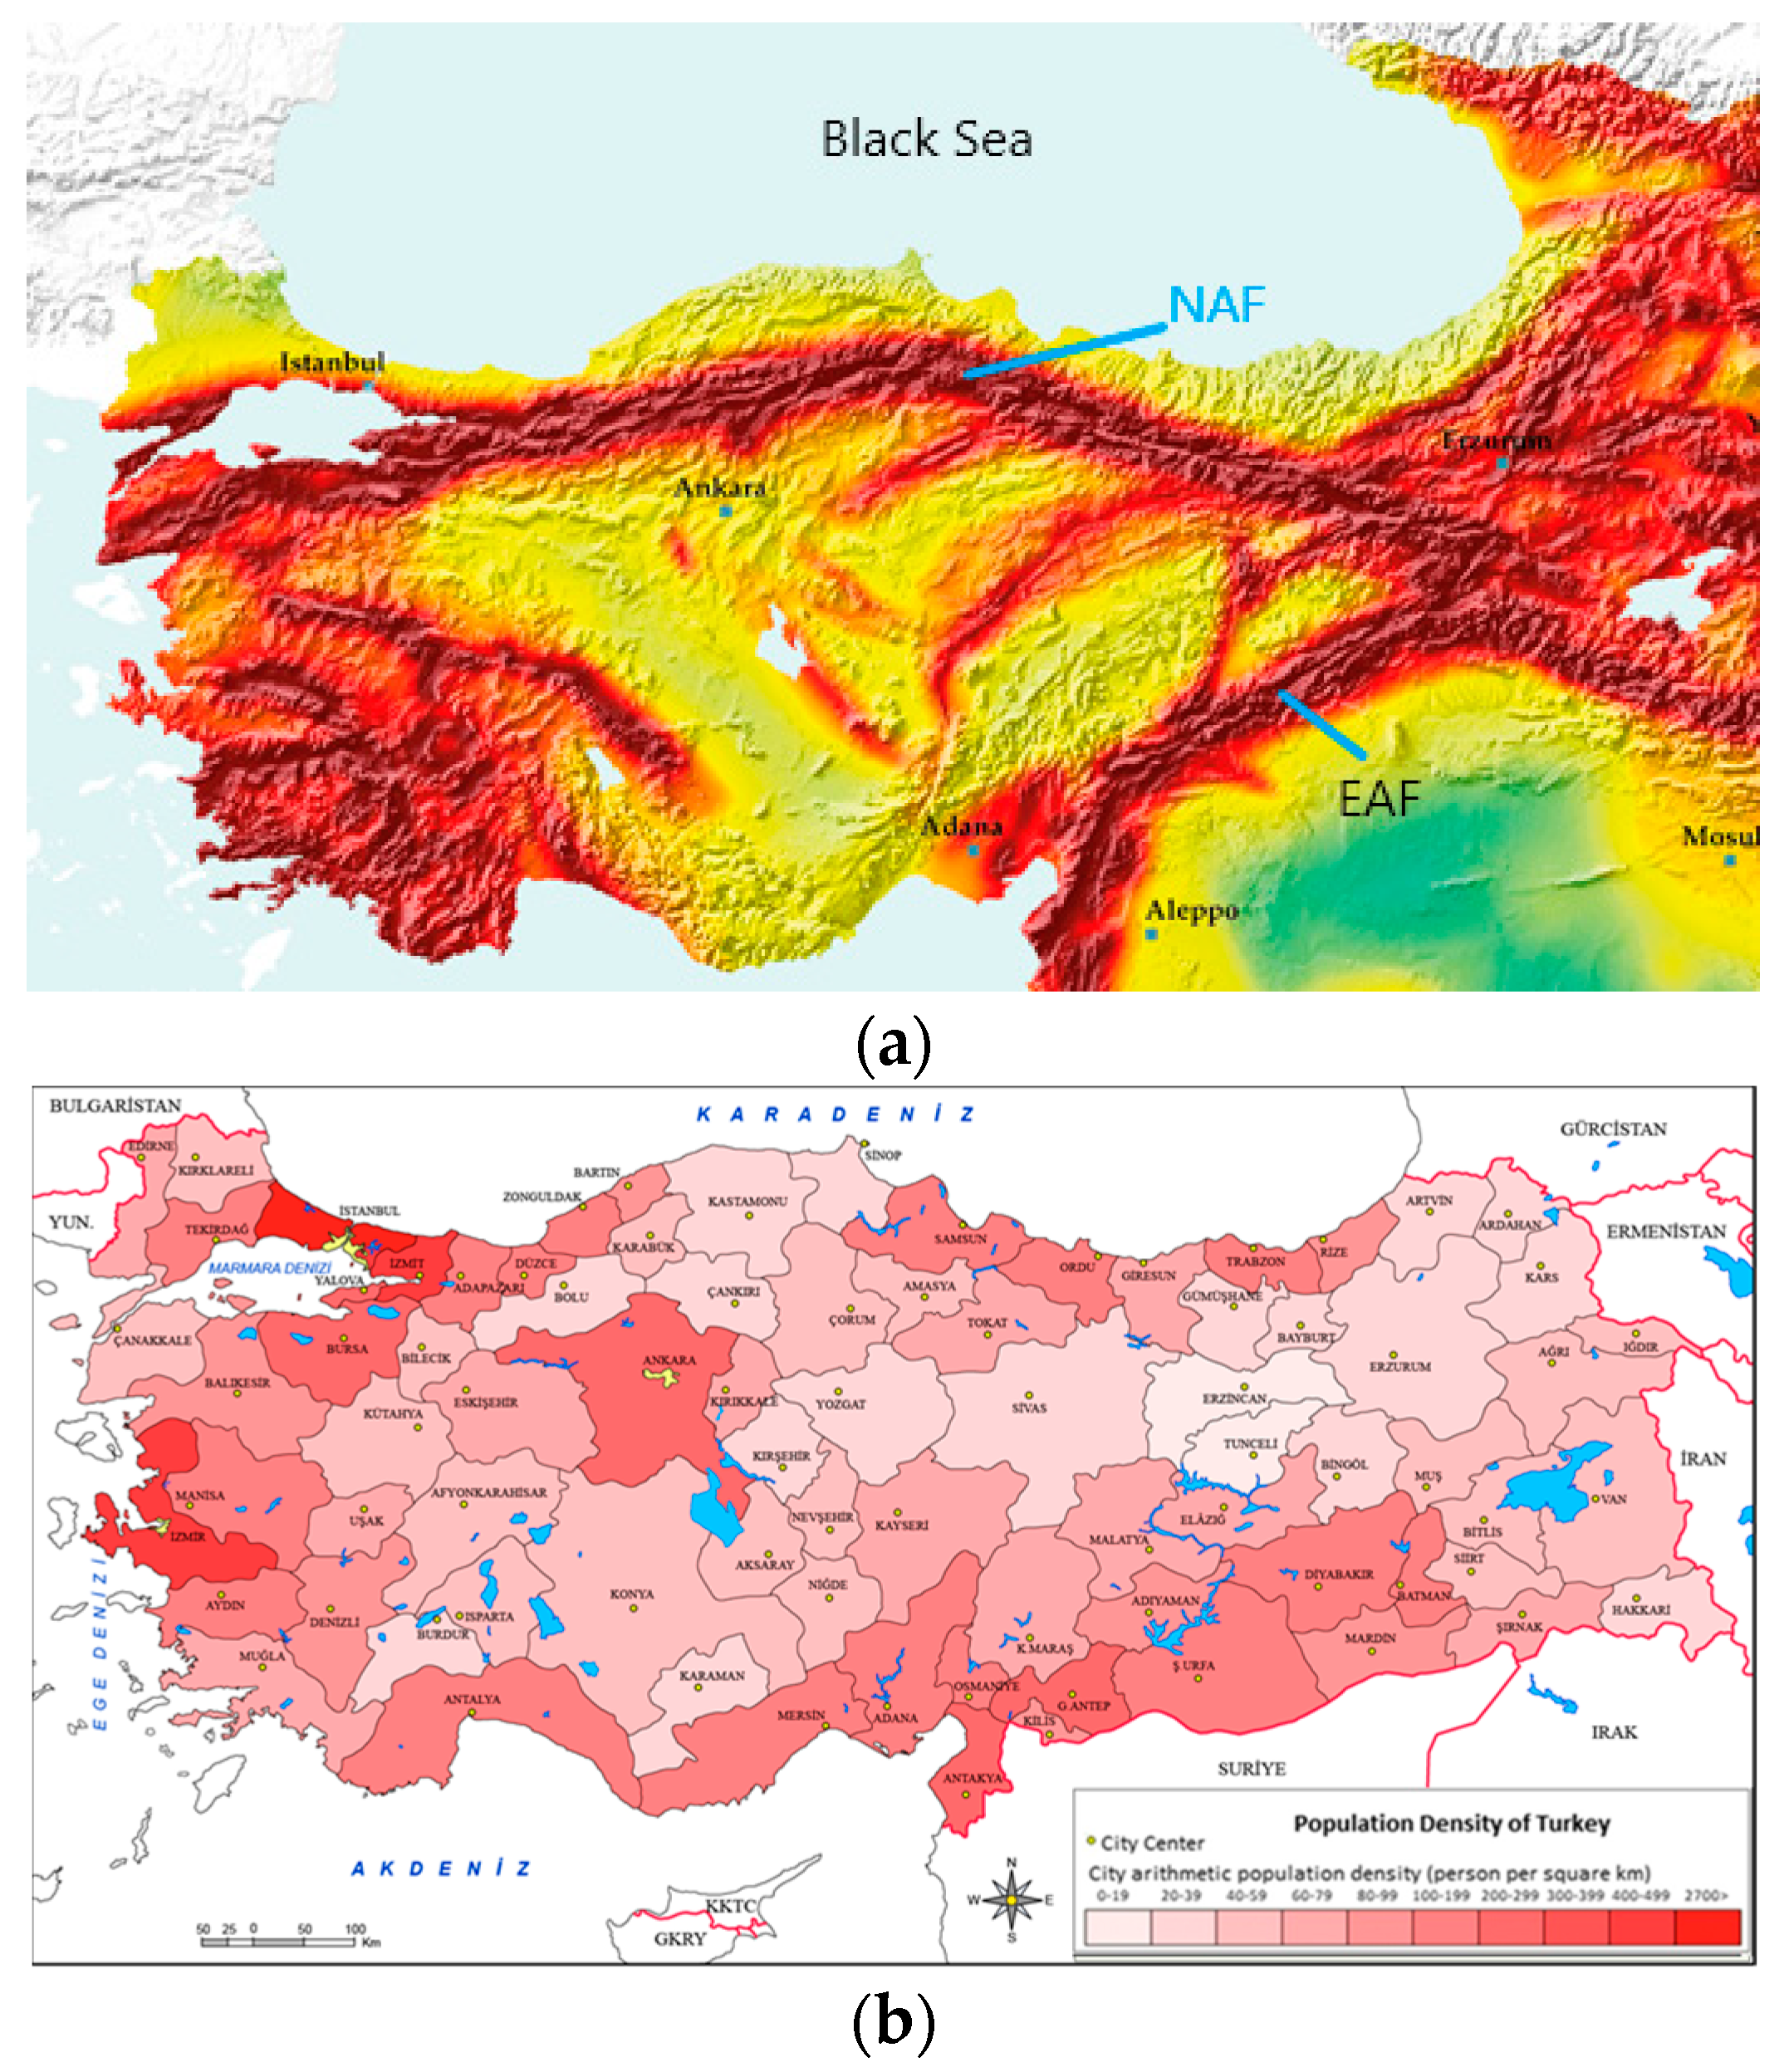
2], and starts from Hatay and continues through Kahramanmaraş, Adıyaman, Malatya, and Elazığ provinces until Bingöl. The EAF is divided into three main sections with several subsegments: (i) the main (southern) branch, (ii) the northern strand (Sürgü–Misis fault), and (iii) the Karasu trough. The southern (main) strand includes the Karlıova, Ilıca, Palu, Pütürge, Erkenek, Pazarcık, and Amanos segments. Another major fault line is the West Anatolian Fault (WAF), which is an earthquake area in the west of Anatolia extending from east to west and consisting of many faults lined up from north to south. The NAF, EAF, and WAF are responsible for several significant earthquakes which caused loss of life and property. The earthquake risk of Türkiye is further compounded by the presence of major cities with high population densities located in seismically active areas. The Earthquake Hazard Map of Türkiye given in
Figure 2 clearly shows that a significant part of the population and building stock of the country is at risk of earthquakes and that measures should be taken. The arrows in the figure represent terrestrial mass movements.
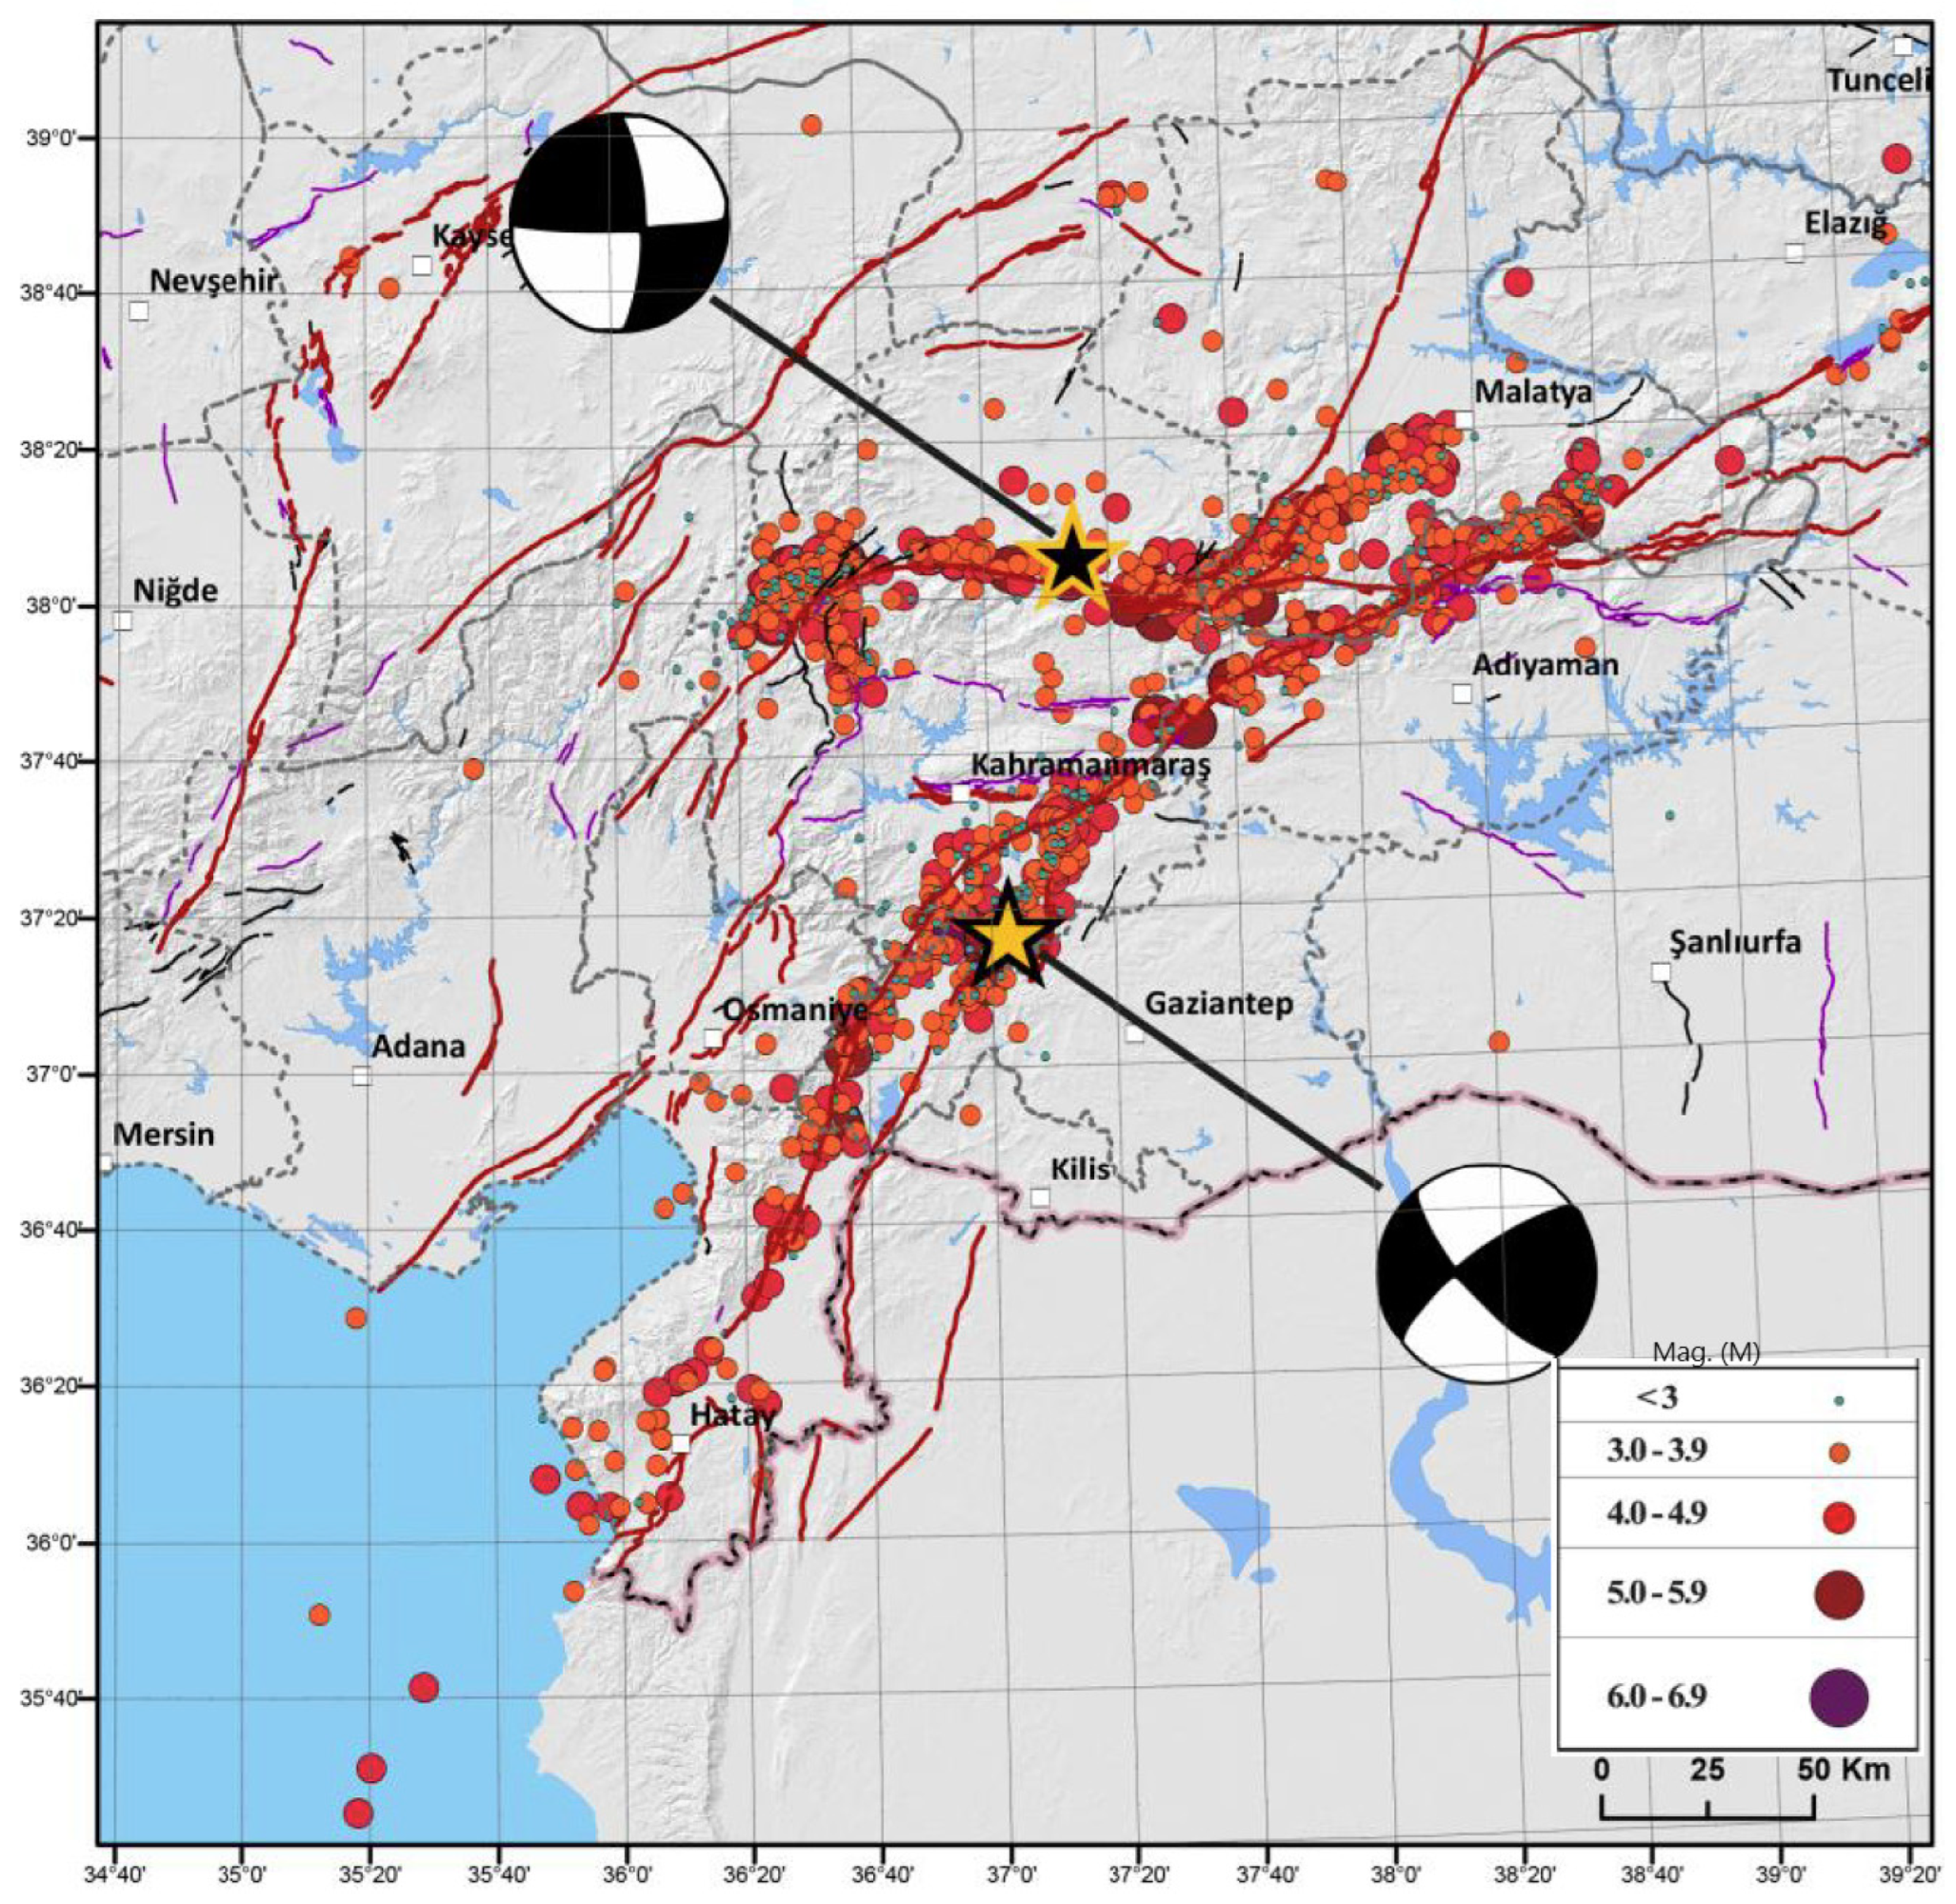
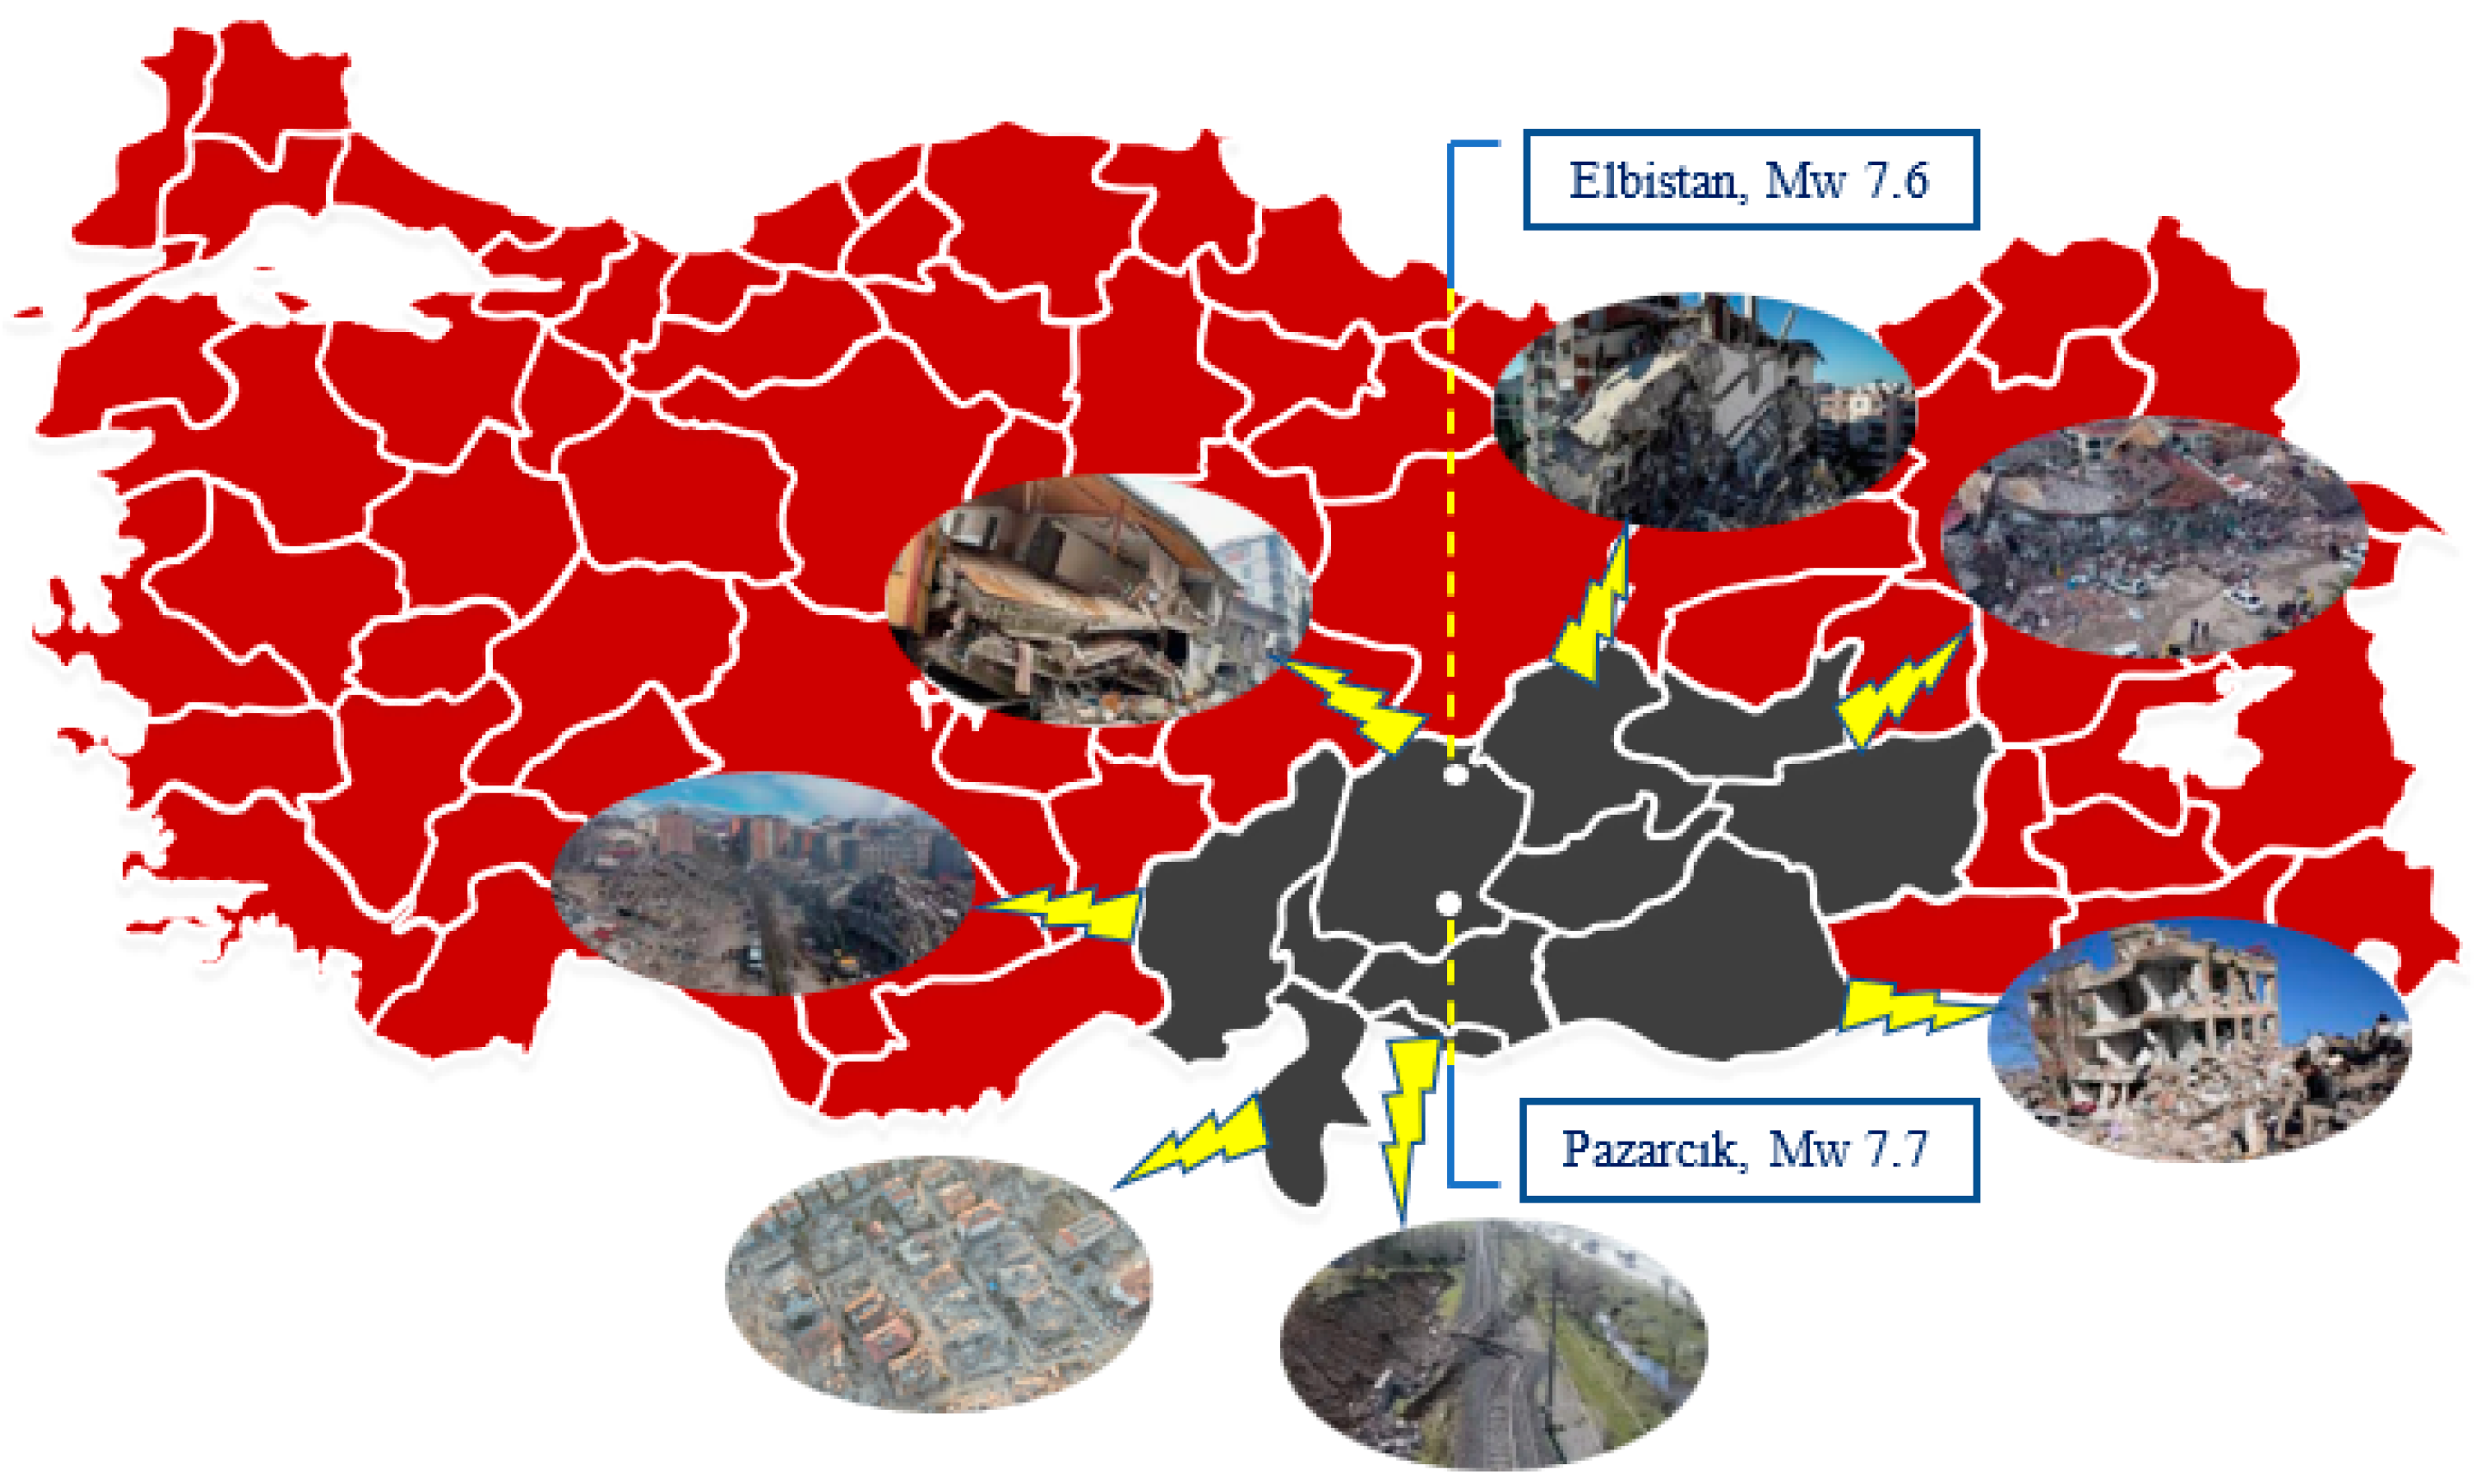
On 6 February 2023, two great earthquakes struck southern Türkiye. The first earthquake with a magnitude of Mw 7.7 occurred in Pazarcık (Kahramanmaraş) at 04:17:32 (UTC + 03:00) at a depth of 8.6 km. Nine hours later, at 13:24:47 (UTC + 03:00), a second earthquake of Mw 7.6 occurred 100 km to the north in Elbistan (Kahramanmaraş) at a depth of 7.0 km. While the Mw 7.7 Pazarcık earthquake coincides with the Narlı Segment at the northern end of the left lateral strike-slip Dead Sea Fault Zone, the Mw 7.6 Elbistan earthquake coincides with the Çardak Fault, a branch that separates from the EAF. These earthquakes that occurred on the EAF are recorded as two of the strongest earthquakes to hit the Republic of Türkiye in more than 100 years.
Table 1 presents the characteristics of these events. Seismic activity in the region after two mainshocks is shown in
Figure 3 and
Figure 4. As of 15 February 2023, approximately 4520 aftershocks were recorded in the region, including earthquakes greater than Mw 6.0. [
4].
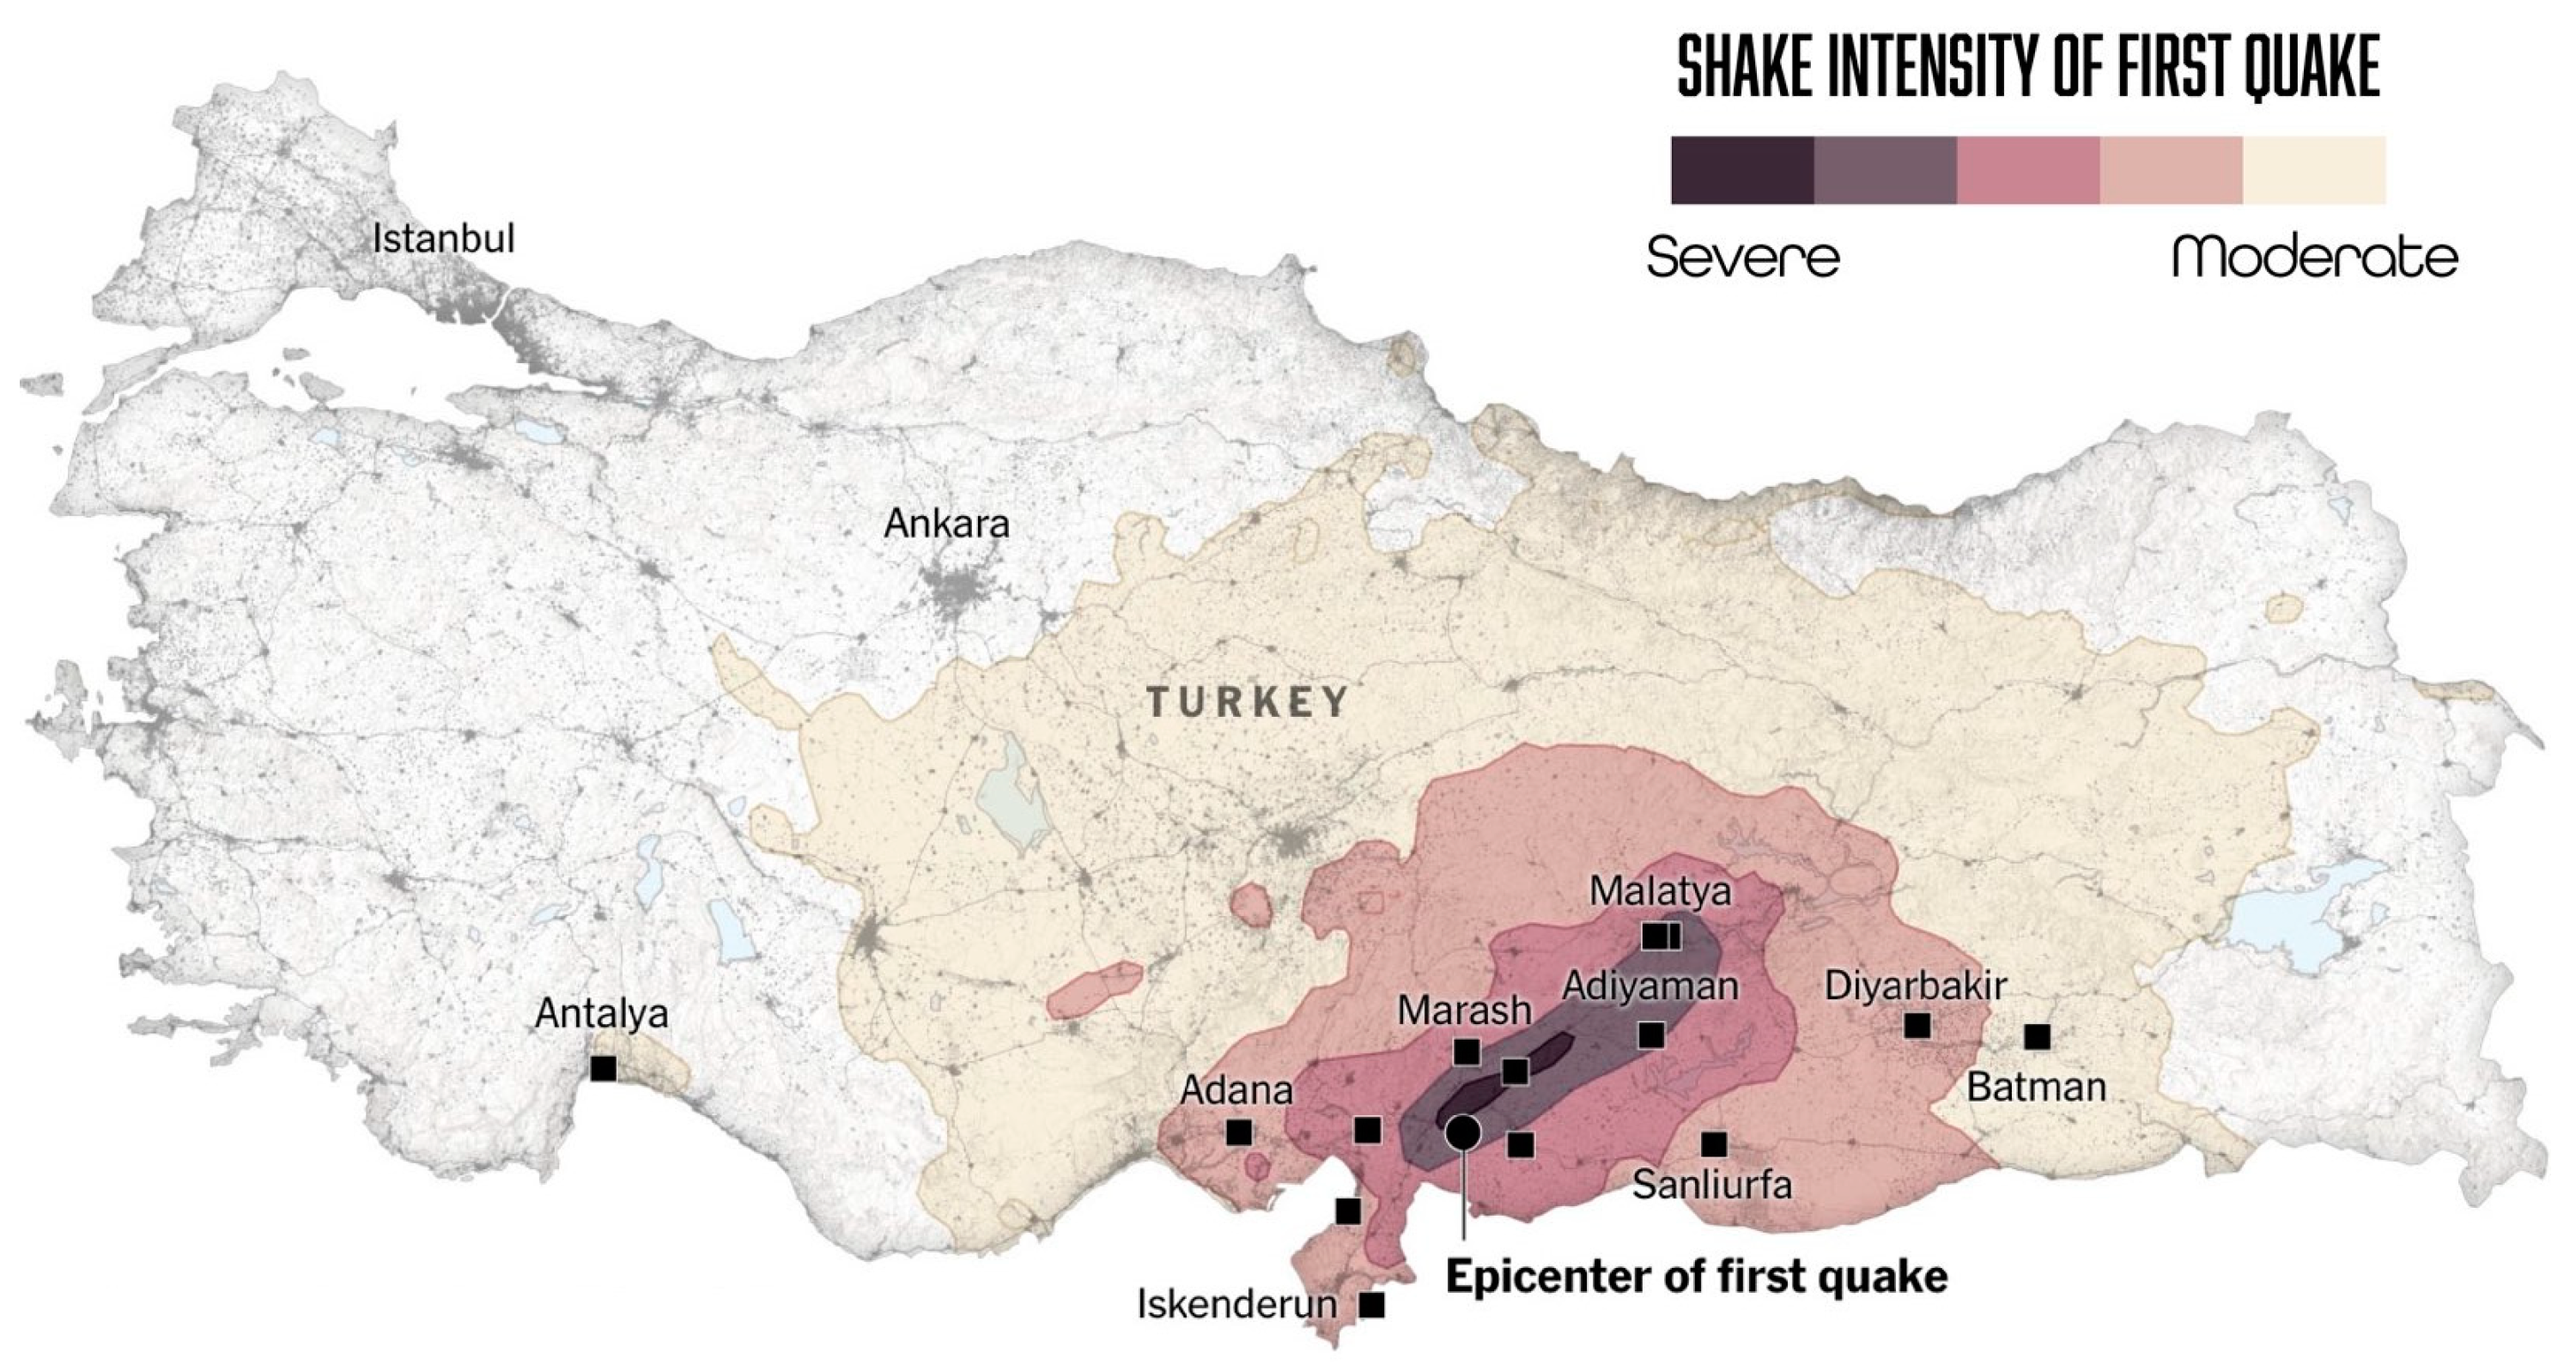
The earthquakes were felt in a wide area covering Southeastern Anatolia, Eastern Anatolia, Central Anatolia, and Mediterranean regions (
Figure 5). A great destruction/collapse occurred in eleven provinces located in southern Türkiye, and thousands of buildings collapsed.
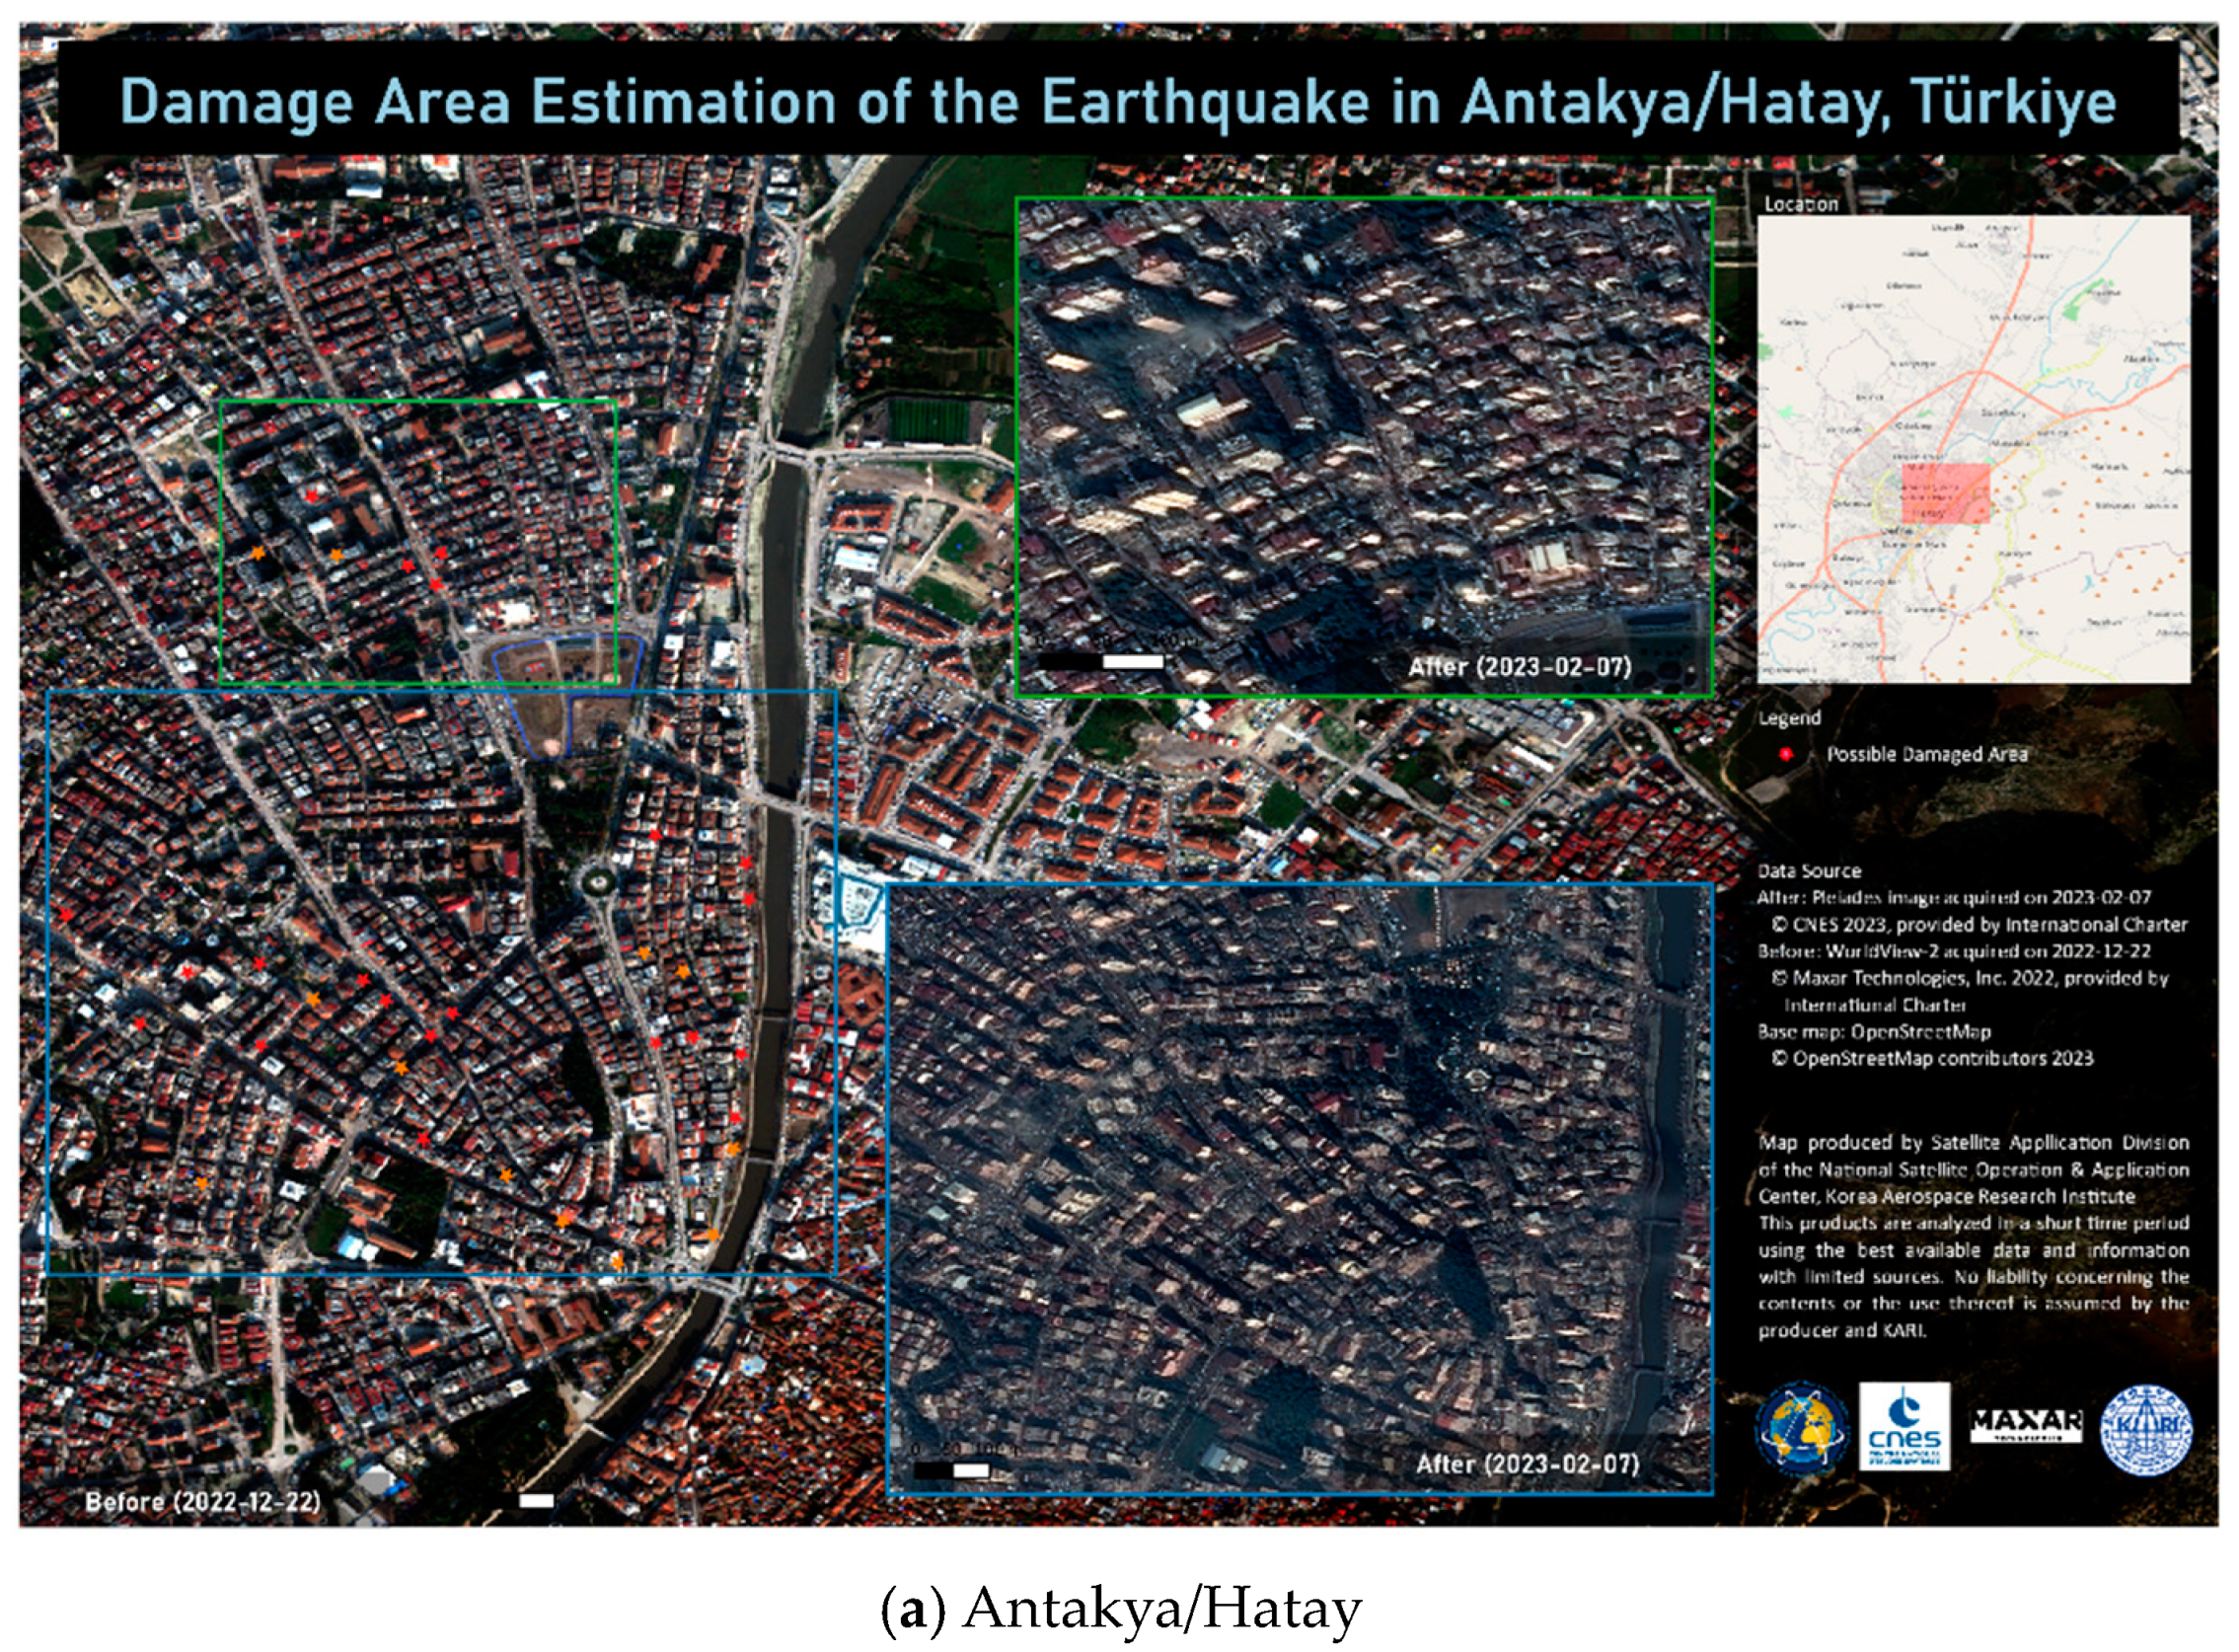
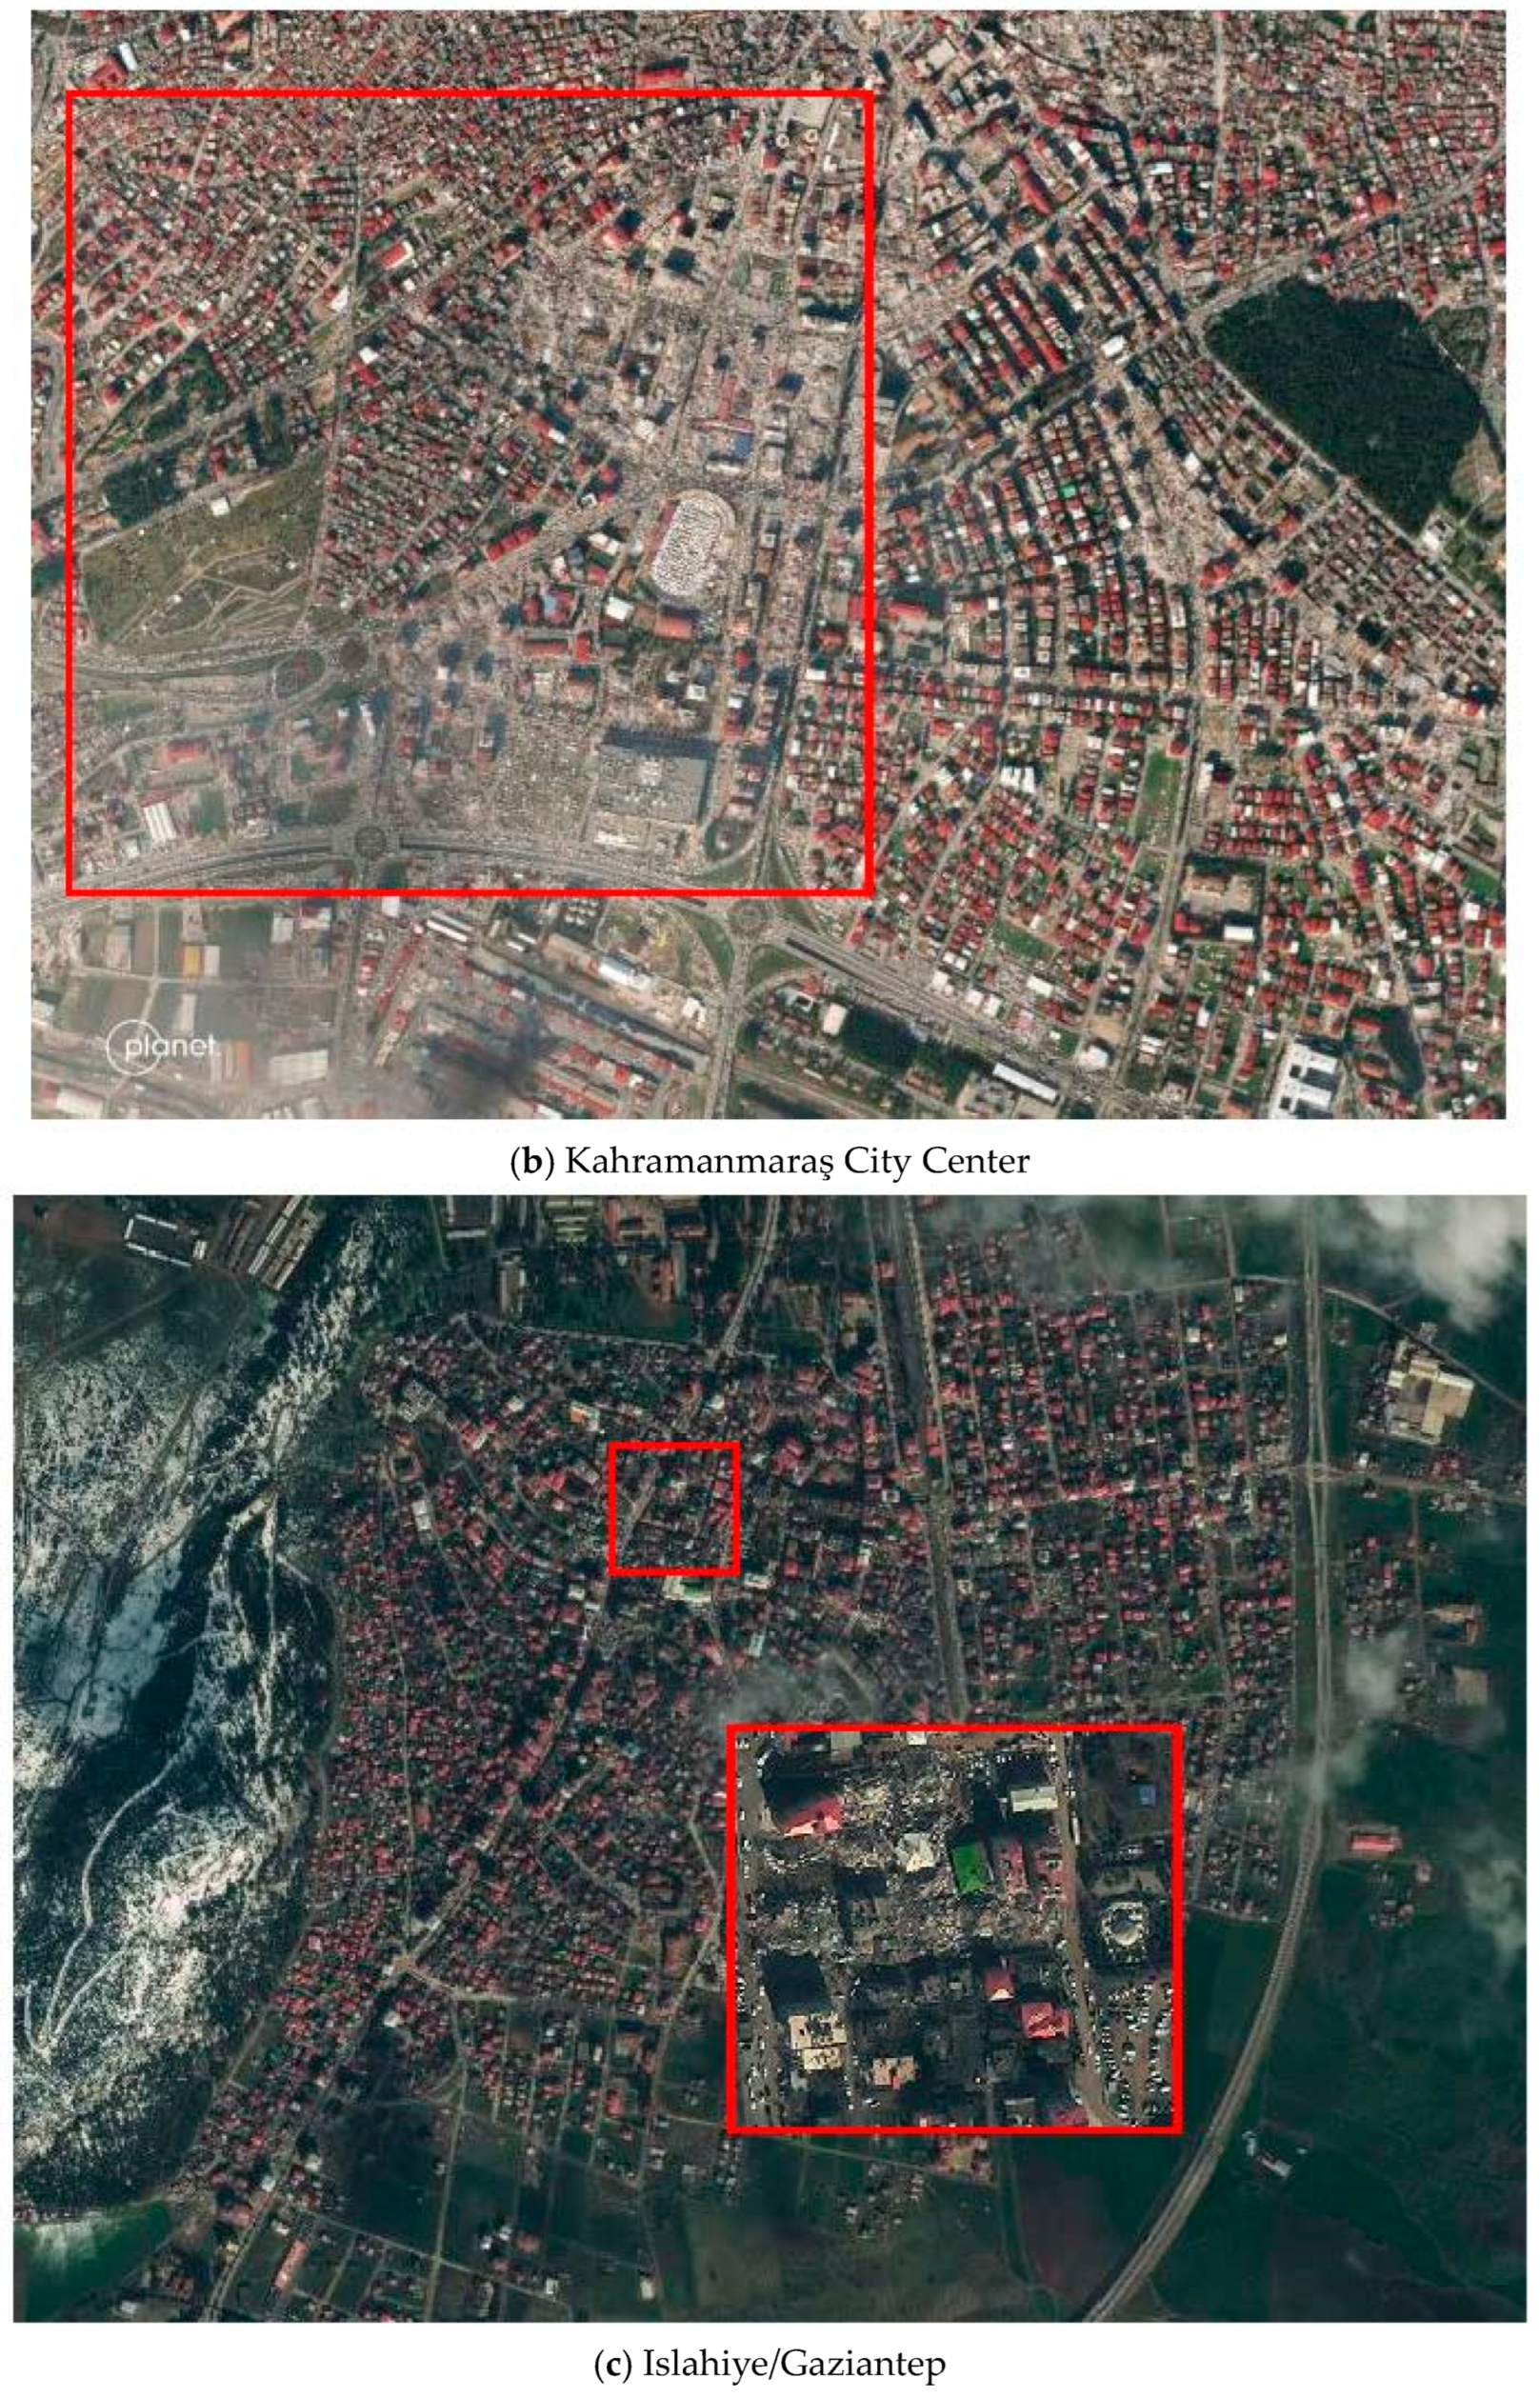
Figure 6 illustrates the extent of destruction in some of the cities most affected by these earthquakes.
Table 1.
Characteristics of the 6 February 2023 Türkiye earthquakes [
5].
Table 1.
Characteristics of the 6 February 2023 Türkiye earthquakes [
5].
| Epicenter | Pazarcık/Kahramanmaraş | Elbistan/Kahramanmaraş |
|---|
| Latitude | 37.288 N | 38.089 N |
| Longitude | 37.043 E | 37.239 E |
| Date/Time | 6 February 2023 04:17:34 (UTC + 03:00) | 6 February 2023 13:24:47 (UTC + 03:00) |
| Magnitude (Mw) | 7.7 | 7.6 |
| Depth (km) | 8.6 | 7.0 |
Figure 3.
Epicenters of 6 February 2023 Mw 7.7 Pazarcık (Kahramanmaraş) and Mw 7.6 Elbistan (Kahramanmaraş) earthquakes and aftershock activity [
6].
Figure 3.
Epicenters of 6 February 2023 Mw 7.7 Pazarcık (Kahramanmaraş) and Mw 7.6 Elbistan (Kahramanmaraş) earthquakes and aftershock activity [
6].
Figure 4.
Aftershocks of the 6 February 2023 earthquakes [
4].
Figure 4.
Aftershocks of the 6 February 2023 earthquakes [
4].
Figure 5.
Shakemap related to Mw 7.7 Pazarcık (Kahramanmaraş) earthquake [
7].
Figure 5.
Shakemap related to Mw 7.7 Pazarcık (Kahramanmaraş) earthquake [
7].
Figure 6.
Satellite view of some parts of cities destroyed by the earthquakes of 6 February 2023 (The first image was taken from [
8] while the latter two from [
9]).
Figure 6.
Satellite view of some parts of cities destroyed by the earthquakes of 6 February 2023 (The first image was taken from [
8] while the latter two from [
9]).
Seismic hazard assessment is a critical aspect of risk reduction in seismically active regions. The EAF is one of the most significant active faults in the world, and Türkiye is located in a highly active earthquake zone. The occurrence of destructive earthquakes in the past underscores the potential for large-scale earthquakes in the future. In the aftermath of earthquakes, post-earthquake search and rescue efforts are crucial in mitigating fatalities. However, the extent of damage caused by the earthquakes on 6 February 2023, highlights the need for rapid and reliable damage assessment. To address this challenge, the use of deep learning (DL) algorithms, U-Net [
10], LinkNet [
11], PSPNet [
12], and FPN [
13], particularly semantic segmentation models, is becoming increasingly popular for object recognition and classification in the field of image processing. The primary aim of this study is to develop an automated approach for identifying collapsed buildings resulting from the destruction caused by the Pazarcık (Mw 7.7) and Elbistan (Mw 7.6) earthquakes that occurred in Türkiye on 6 February 2023.
2. Related Work
Computer technology advancements have led to revolutionary developments in image processing techniques and damage detection studies. Studies have demonstrated the ability of DL techniques in damage evaluation, and more advanced techniques continue to be developed with new studies.
Various studies have been carried out to determine the damage types or areas of structures after earthquakes using DL with close-up photographs. Lin et al. [
14] developed an automatic damage extraction method that detects structural damage through DL. Cha and Choi [
15] conducted a study on the detection of damage in reinforced concrete structures using Convolutional Neural Networks (CNNs). The proposed method was tested on 55 images taken from different structures. The results showed that cracks that occur because of damage to the structures can be detected with this method. Avcı et al. [
16] conducted a study on DL for the detection of structural damage in steel frames using one-dimensional CNNs. Patterson et al. [
17] showed that DL methods are useful for the classification of building earthquake damage and claim that the system can achieve more complex classifications if more images are provided for training. Pathirage et al. [
18] conducted a study on damage detection in steel structures based on DL. It has been argued that the accuracy and efficiency of the DL methods are better than traditional Artificial Neural Networks (ANNs), namely, Stochastic Gradient Descent (SGD) and Scaled Conjugate Gradient (SCG), which are used for training the ANN model. Cha et al. [
19] achieved the detection of different damages simultaneously such as concrete cracking, steel corrosion, bolt corrosion, and steel delamination using the location-based DL method.
Satellite and aerial images, which are the most important tools in remote sensing, are used to quickly finalize post-earthquake emergency response or damage assessment studies. Automatic due diligence based on DL methods using these images has been widely used in recent years. Abdeljaber et al. [
20] used CNNs for the detection of seismic-based structural damages. They classified buildings according to their degree of damage and showed that the approach they developed successfully predicted the amount of damage. Li et al. [
21] applied an image-based damage detection method to a coastal area affected by Hurricane Sandy in 2012 and showed that their method produced an overall accuracy of 88.3%. Duarte et al. [
22] studied the image classification of building damages from satellite images using CNN. Hamdi [
23] developed an algorithm for the automatic detection and mapping of damaged forests subjected to storms with an accuracy of 92% using CNNs in an ArcGIS environment. Mangalathu and Burton [
24] carried out a study on the damage assessment of buildings affected by the earthquake with a method based on DL using the data set consisting of the damages that occurred in 3423 buildings because of the California earthquake in 2014. They succeeded in classifying the damaged buildings with a great approximation. Ci et al. [
25] proposed a novel method using aerial images acquired from the 2014 Ludian earthquake and achieved an overall accuracy of 77.39%. Moradi et al. [
26] achieved to identify the damage to buildings caused by an earthquake with an overall accuracy of 68.71% using VHR satellite images of Haiti and U-Net, which is a convolution network. Xiong et al. [
27] introduced an automated building seismic damage assessment method using a UAV and a CNN. They demonstrated the effectiveness of the proposed method via a case study of the old Beichuan town and obtained the damage distribution of the area with an accuracy of 89.39%. Zhao et al. [
28] focused on the task of building damage level evaluation, which is a key step for maximizing the deployment efficiency of post-event rescue activities. They classified buildings with different damage levels, i.e., no damage, minor damage, major damage, and collapsed using the pre- and post-disaster satellite images. Cheng et al. [
29] developed a model to improve post-disaster preliminary damage assessment (PDA) using Artificial Intelligence (AI) and Unmanned Aerial Vehicle (UAV) imagery. The trained model achieves 65.6% building localization precision and 61% classification accuracy. The authors proposed a new CNN method in combination with ordinal regression aiming at assessing the degree of building damage caused by earthquakes with aerial imagery. Callantropio et al. [
30] used a DL tool to assess and map the damages that occurred in Pescara del Tronto village.
3. Materials and Methods
The focus of this study is the comparative analysis and evaluation of four predefined deep architectures used to segment collapsed buildings after an earthquake: U-Net, LinkNet, PSPNet, and FPN. The work aims to determine the most suitable architecture for the task using evaluation metrics such as accuracy, IoU (Intersection over Union), and dice score. We use the images belonging to the area affected by the 6 February 2023 Mw 7.7 Kahramanmaraş/Pazarcık and Mw 7.6 Kahramanmaraş/Elbistan earthquakes, which are obtained from Maxar [
9], Planet [
31], and other satellites.
3.1. Dataset
The study aims to identify collapsed buildings following earthquakes using DL techniques. Satellite images from the southern and southeastern regions of Turkey, spanning eleven provinces (Kahramanmaraş, Hatay, Gaziantep, Adıyaman, Malatya, Diyarbakır, Şanlıurfa, Kilis, Osmaniye, Adana, and Elazığ) heavily affected by the Mw 7.7 Pazarcık (Kahramanmaraş) and Mw 7.6 Elbistan (Kahramanmaraş) earthquakes, were utilized for this purpose (see
Figure 7).
The images used in the study were obtained from the sources provided by the Maxar and Planet companies. Details about the image properties are given in
Table 2. An example of the images used (satellite image provided by Planet) is given in
Figure 8. The image covers a very large part of the city center of Hatay and includes buildings with different damage levels. This study aims to find only collapsed structures and other types of damage are not considered. To do this, only collapsed buildings are masked in the images. The success of training in DL is directly proportional to the number of images used and the correct and/or clear display of the object to be detected in the image. Therefore, orthophoto images were converted to 512 × 512 images to increase the number of images to be used in the analysis and to make clearer masking. The 27,824 pieces of data obtained were examined one by one and the images without collapsed buildings were eliminated.
This study did not employ data augmentation techniques. This decision was based on the nature of our dataset and the specific objectives of our research. The aim is to assess the models’ performance based strictly on the original, unaltered dataset to maintain the integrity and authenticity of the images, which is particularly important in the context of structural damage assessment.
The 80/20 split between training and testing data is a widely accepted standard in the field of machine learning and data science, particularly in the context of supervised learning tasks. This distribution is chosen to ensure that the model has access to a sufficiently large amount of data for learning (the 80% training set), while still reserving a significant portion of data for validating and testing the model’s performance (the 20% testing set).
In our specific context, the dataset comprises 377 images. By assigning approximately 80% (approximately 302 images) for training, we ensure that our model has a robust and diverse set of examples to learn from. This extensive training dataset is crucial for the model to effectively learn the intricate patterns and features relevant to identifying and categorizing structural damages in buildings.
The remaining 20% (approximately 75 images) is used as the test dataset. This set provides an unbiased evaluation of the model, as it consists of images that the model has not seen during the training phase. Testing on this separate dataset helps us assess the model’s generalization capabilities and ensures that the performance metrics we report are not overly optimistic or tailored to the specificities of the training data. Analyses were made and verified on these data. In
Figure 9, examples of the pictures that were eliminated and used in the training are given.
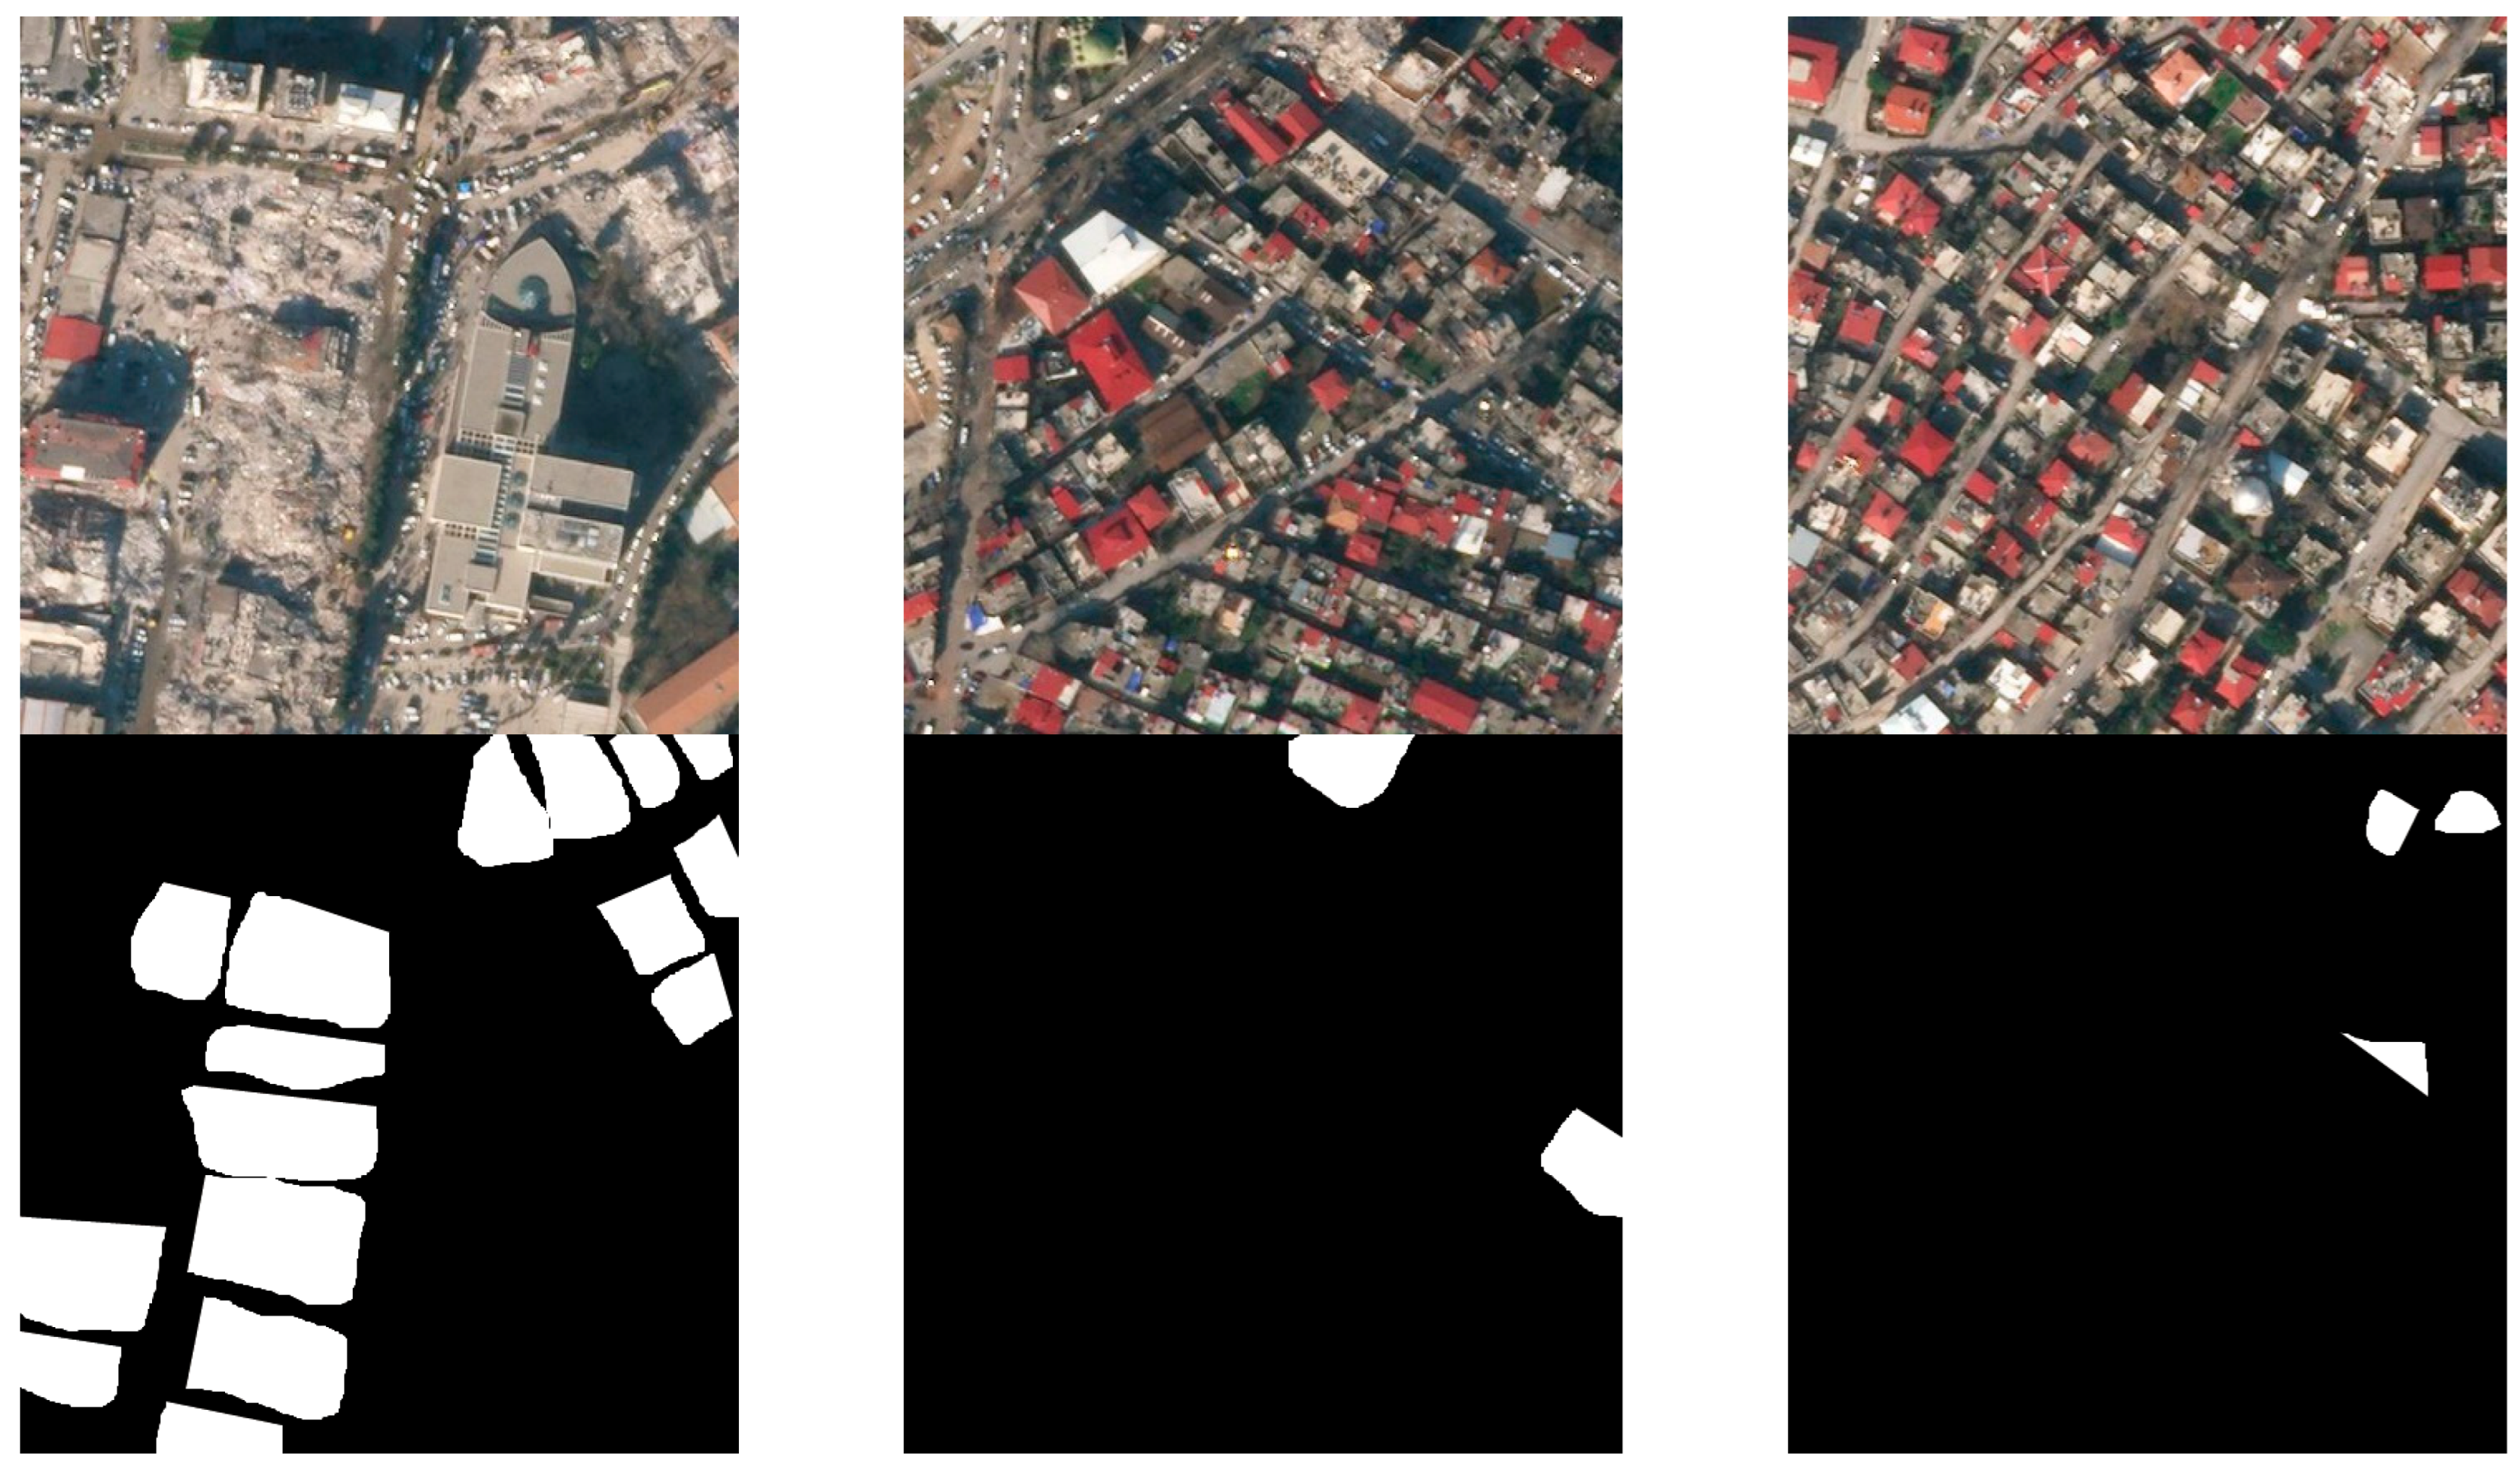
A segmentation method based on deep learning was used to find collapsed buildings. In this method, the image used as training data is converted into two colors: white for objects to be found (masking) and black for the rest. The original and masked versions of two of the images used in the training data are given in
Figure 10 as an example.
3.2. Semantic Segmentation Architectures
In recent years, there has been an increase in the use of DL techniques for image segmentation tasks. Semantic segmentation has become an important task in various fields, including medical imaging and disaster management. The goal of semantic segmentation is to label each pixel in an image with the corresponding class of the object it belongs to. This task is challenging due to the variability in object shapes, sizes, and orientations. Moreover, for disaster management applications, the images captured may be of low quality or have occlusions, which further increases the difficulty of the task.
To address these challenges, various DL architectures have been proposed for semantic segmentation. In this study, four different encoder–decoder-based basic semantic segmentation models (SSMs), namely U-Net, LinkNet, PSPNet, and FPN were used to segment collapsed buildings after an earthquake.
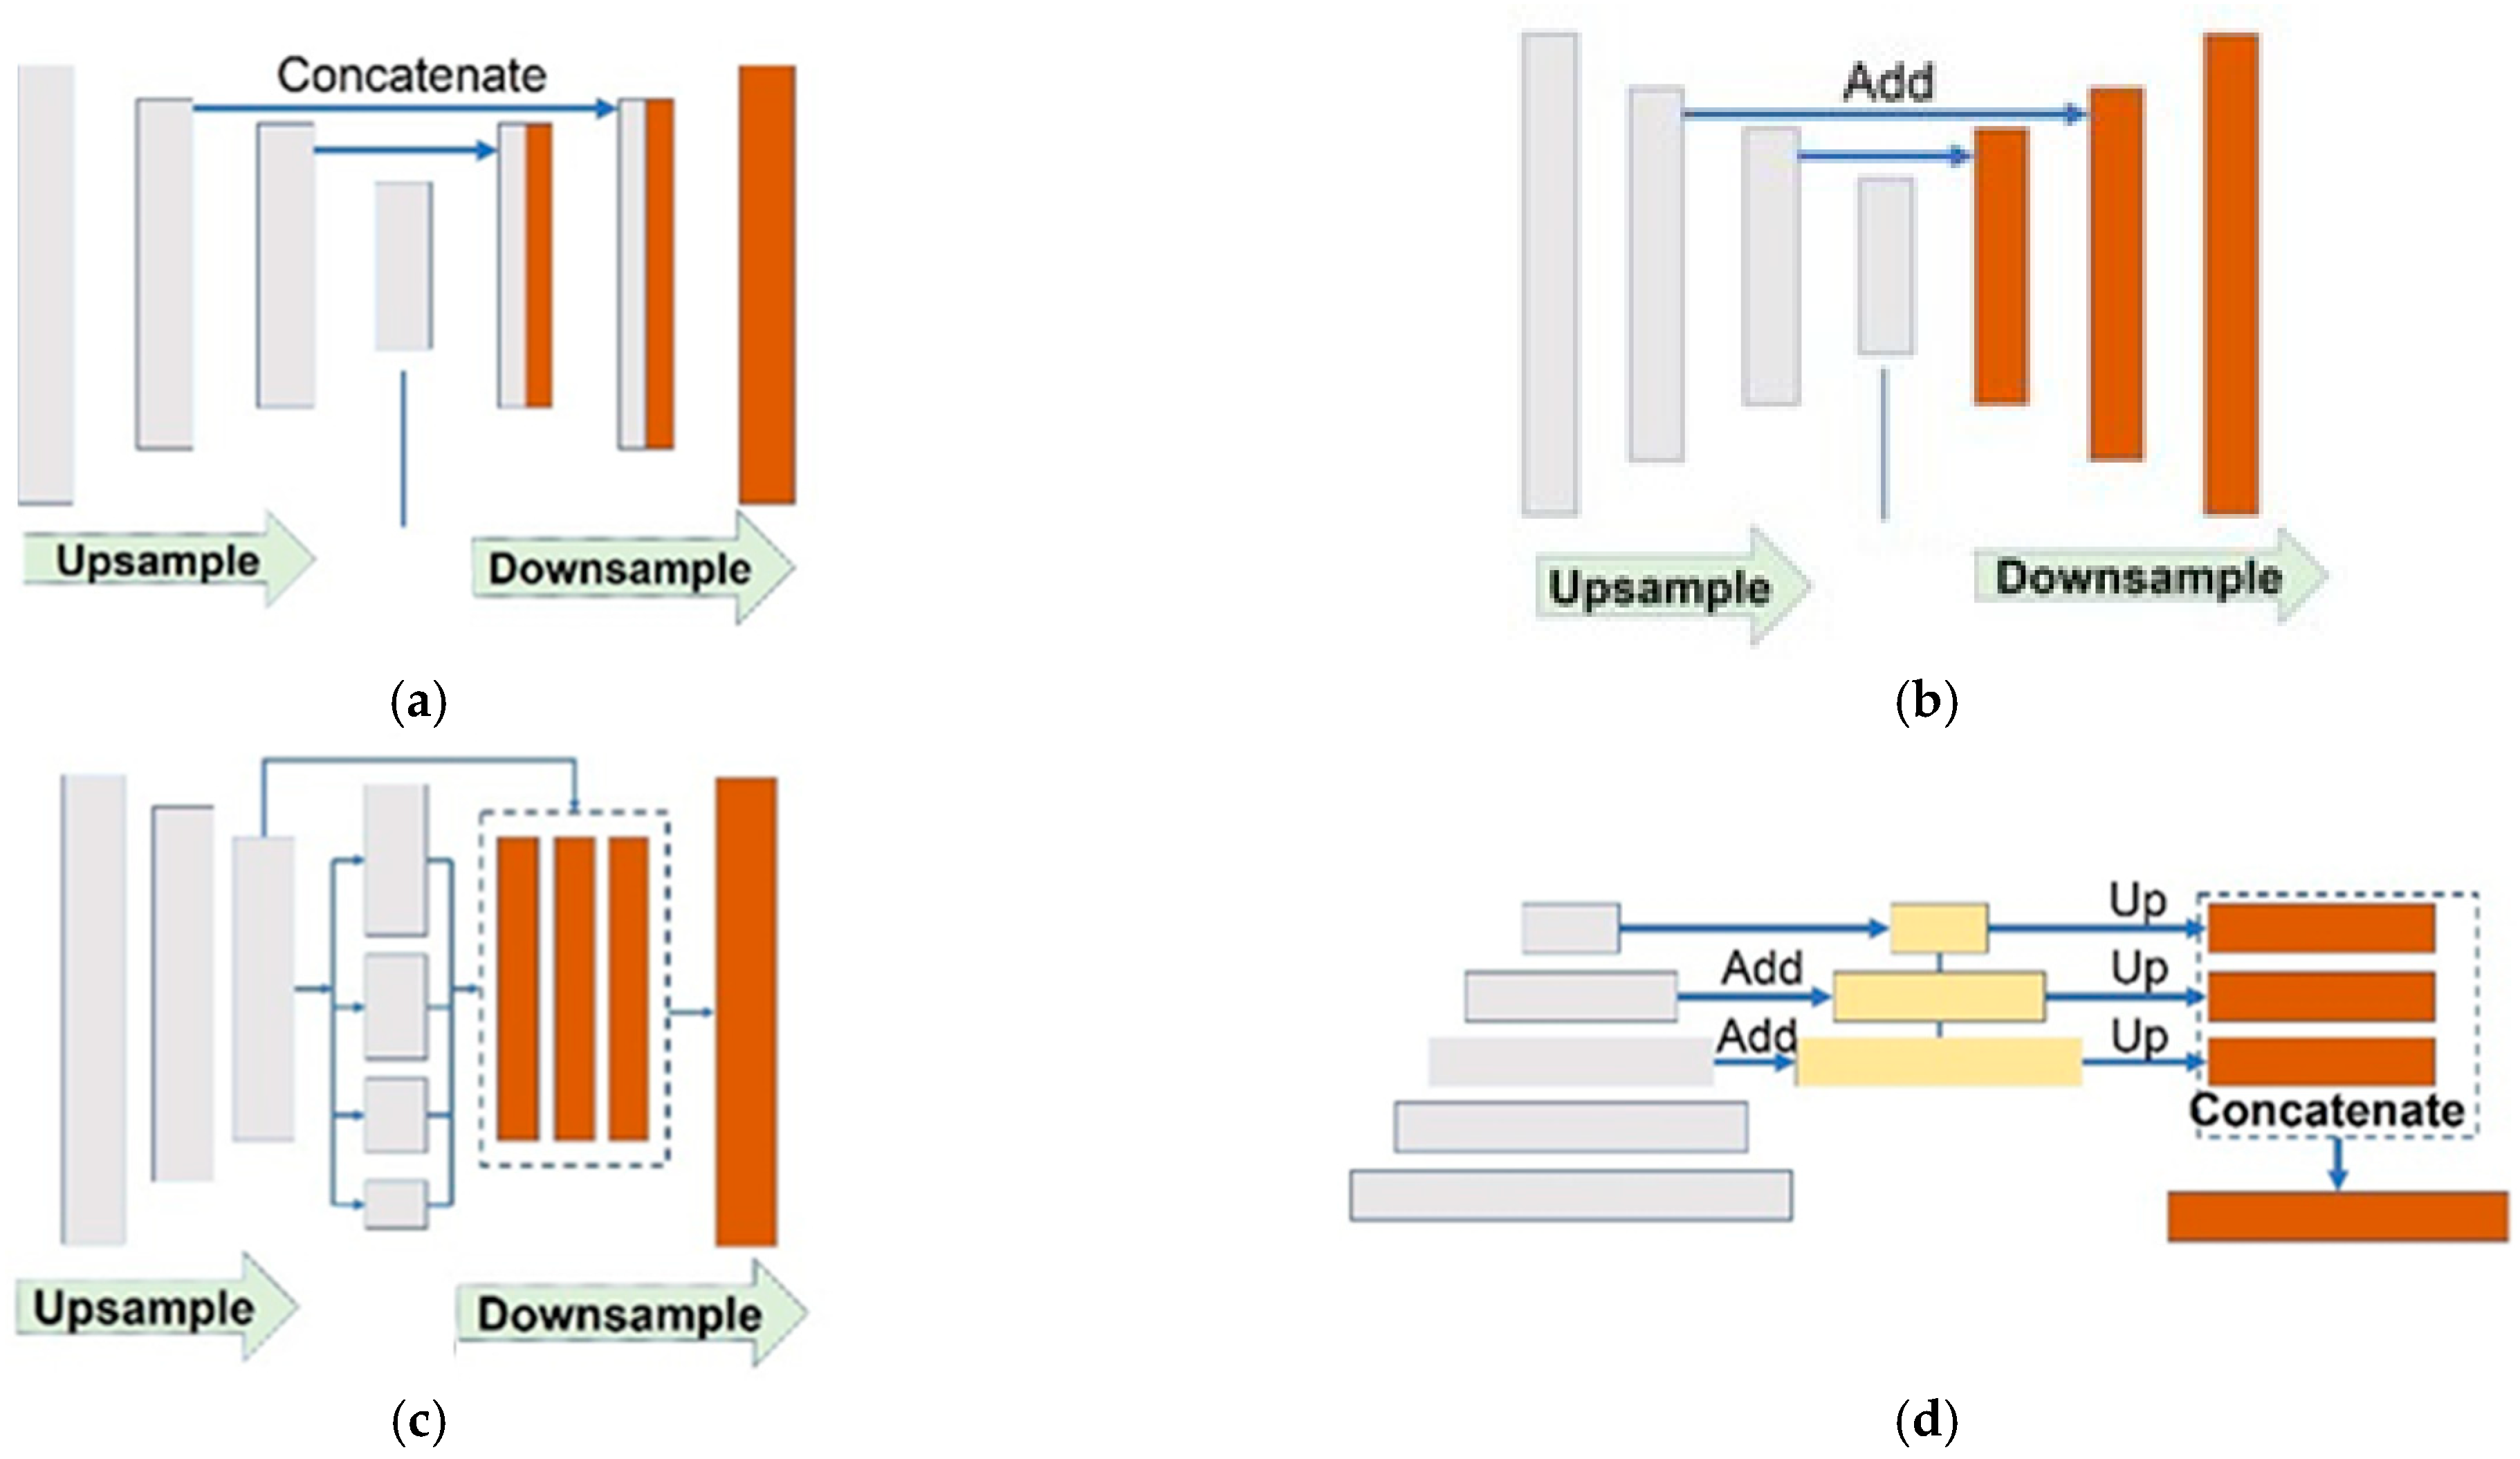
The four architectures used in this study have different features and were selected for their suitability for the task of semantic segmentation. U-Net combines an encoder that scales down the features to a lower dimensional bottleneck and a decoder that scales them up to the original dimensions. It also uses skip connections that were proven to improve image segmentation results. LinkNet is similar to U-Net but uses residual instead of convolutional blocks in its encoder and decoder networks. FPN is also similar to U-Net but applies a 1×1 convolution layer and adds the features instead of copying and appending them as in the U-Net architecture. The PSPNet exploits a pyramid pooling module to aggregate the global context information of an image with an auxiliary loss [
32]. The architecture of the semantic segmentation models considered in this paper is explained in
Figure 11.
In addition to the architectures, various encoders were used in the study. The encoders were selected for their ability to extract features from the images. ResNet (Residual Network) [
33] revolutionized deep neural networks by addressing the challenge of vanishing gradients in deep architectures. It introduces residual connections that enable effective training of networks with numerous layers. So, in this study, ResNet was chosen for its proven ability to capture intricate image features. The selection of ResNet variations considered their performance in prior studies and their adaptability to the specific demands of the task at hand, making them an ideal choice among the diverse encoders evaluated in this study. Architecture hyperparameters detailing the network configurations are presented in
Table 3.
The study found that U-Net and FPN architectures are more suitable for semantic segmentation of collapsed buildings after an earthquake compared to the other architectures evaluated. The study also showed that the choice of the encoder has a significant impact on the performance of the models. The study found that using a pre-trained ImageNet backbone network such as ResNet18 in the encoder improves the performance of the models.
The results of this study have several implications for disaster management applications. Semantic segmentation of collapsed buildings can be used to identify areas where search and rescue operations should be prioritized. The results of this study can be used to develop a state-of-the-art noninvasive image processing-based anemia detection system. Additionally, the study highlights the importance of choosing the appropriate architecture and encoder for semantic segmentation tasks. The choice of architecture and encoder should be based on the specific requirements of the task at hand.
3.3. Evaluation Metrics
In image segmentation, various metrics have been established to evaluate the performance of segmentation models. These metrics include accuracy, precision, recall, F1 score, specificity, and IoU. They are commonly used to measure the accuracy and effectiveness of the segmentation models in dividing an image into distinct regions or objects. These metrics provide valuable insights into the quality of the segmentation results and enable researchers and practitioners to compare and select the most suitable segmentation models for their specific applications.
TP, FP, and FN, which are defined in
Table 4, are used in the computation of performance metrics.
For assessing accuracy, we calculated the proportion of correctly identified pixels (both segmenting damaged areas and identifying undamaged areas) concerning the total number of pixels in each image. This provides a general indicator of the model’s overall performance in segmentation tasks. The accuracy is written by
Precision is a metric that measures the accuracy of a model in identifying relevant instances and avoiding false positives. It is calculated by dividing the number of correctly detected instances by the total number of instances retrieved by the model. This metric helped assess the model’s accuracy in specifically identifying damage without over-segmenting. A high precision score indicates that the model is better at accurately identifying relevant instances. The precision is defined by
Recall, given by Equation (2), is a metric that measures the ability of a model to detect all relevant data points in a dataset. It is calculated by dividing the number of correctly identified abnormal samples by the total number of true abnormal samples. This metric is crucial for understanding the model’s sensitivity in detecting damaged areas. A high recall score indicates that the model is effective in detecting all the relevant data points in the dataset, even if it results in a higher number of false positives.
F1-score is a widely used performance metric in machine learning that considers both precision and recall providing a more comprehensive evaluation of the model’s effectiveness. It is a harmonic mean of precision and recall, where a high F1 score indicates a good balance between precision and recall. The F1 score is particularly useful in binary classification tasks where the dataset is imbalanced, and it provides a more reliable estimate of the model’s robustness than precision or recall alone. This metric is particularly important in scenarios where both false positives and false negatives are critical. F1 score is defined as
Specificity measures the proportion of actual negative samples that are correctly identified as negative by the model. The metrics are important to consider when evaluating the overall performance of a segmentation model, as they provide insights into its ability to accurately identify both positive and negative samples. This helped evaluate the model’s ability to correctly identify areas without damage, reducing false alarms. The sensitivity and specificity metrics calculation are given by
IoU is a common evaluation metric used for measuring the similarity between predicted and ground truth segmentation masks. This metric is a direct measure of how well the model’s predictions conform to the true damaged areas. It measures the overlap between the predicted and ground truth regions by computing the ratio of the intersection area to the union area of the two regions. IoU ranges from 0 to 1, where 1 indicates a perfect match between the predicted and ground truth masks. The IoU is defined as
AUC (Area Under the Curve) is a commonly used evaluation metric for binary classifiers that plots the true positive rate against the false positive rate for different classification thresholds. The AUC value indicates the overall performance of the classifier. Unlike accuracy, which can be misleading in some cases, AUC evaluates all possible classification thresholds and provides a more comprehensive evaluation of the performance of the classifier. This metric provided a comprehensive view of the model’s ability to differentiate between damaged and undamaged areas across different thresholds.
4. Experimental Evaluation
4.1. Implementation Details
The proposed method is implemented within Jupyter notebooks. The experiments are conducted on a desktop with an Intel(R) i7-7700 3.6 GHz CPU and a GPU of Nvidia GeForce GTX 1070Ti with 8GB memory. The networks are trained with Adam optimizer with a learning rate and momentum depth hyperparameters set to 1 × 10⁻⁵ and 0.90, respectively. The batch size is chosen as 8 and the training process is limited to 100 epochs for the proposed models. The segmentation models are trained on the resized image of the original image size, 512 × 512 for U-net, LinkNet, 256 × 256 for FPN, and 384 × 384 for PSPNet. The possible choices of training parameters to be used were optimization algorithm, epoch, batch size, weight initialization, and learning rate. Based on the Keras framework, segmentation model libraries were used to perform the experiments in this study.
For training our segmentation architectures (U-Net, LinkNet, FPN, PSPNet), we used a consistent set of hyperparameters. These included a learning rate of 0.00001, a batch size of 8, and Adam optimization algorithm. Each model was trained for 100 epochs to ensure adequate learning while preventing overfitting.
4.2. Evaluation Results
This research primarily targets the rapid and accurate identification of structural damages, particularly in post-disaster scenarios. This focus stems from the critical need for a timely and effective response in such situations, where identifying the extent and severity of damages is paramount for rescue and recovery operations. By concentrating on damaged structures, the model is specifically tailored to assist in these high-stakes environments.
Training the model exclusively on images of damaged structures has significantly enhanced its ability to identify and categorize various levels of structural damage. This specificity has resulted in a high degree of precision in distinguishing between minor and severe damages. However, it is acknowledged that this approach may limit the model’s ability to generalize to undamaged structures or other types of objects. This limitation is justified given the specific, critical objectives of the study.
In
Section 3.2, various combination of segmentation models with a ResNet18 backbone, including U-Net, LinkNet, FPN, and PSPNet, were evaluated for their segmentation performance in identifying collapsed buildings from satellite images. The models were analyzed using several metrics, including accuracy, precision, recall, F1 Score, specificity, AUC, and IoU, to provide a comprehensive evaluation. The results were then tabulated in
Table 5 for further analysis. Among the four architectures evaluated, FPN achieved the highest accuracy score of 0.97333, followed closely by U-Net with a score of 0.97021. In terms of precision, FPN also outperformed the other architectures with a score of 0.76992, representing an improvement of 22.48% compared to LinkNet, which has the second-highest precision score. U-Net, on the other hand, achieved the best recall and F1 score values with 0.46554 and 0.56480, respectively. Finally, in terms of specificity, FPN achieved the highest score of 0.99539, while in terms of AUC and IoU, U-Net achieved the best scores with values of 0.72881 and 0.39354, respectively. Overall, these results suggest that FPN and U-Net are the best-performing architectures for detecting collapsed buildings in satellite images after earthquakes, depending on the performance metric of interest. However, the choice of the best architecture ultimately depends on the specific needs and goals of the project, as well as the available resources and computational constraints.
Figure 12 shows the training and validation accuracy and loss curves for four different image segmentation models: U-Net, LinkNet, FPN, and PSPNet, all with a ResNet18 backbone. The accuracy and loss curves provide a visual representation of the performance of the model during the training process. The training curves show how the model’s performance improves over time, while the validation curves indicate how well the model generalizes to new data. These plots can help in comparing the performance of different models and selecting the best one for a given task.
Based on the results presented in
Table 5 and
Figure 12, it can be observed that all four image segmentation models achieved an accuracy value of over 96%. However, among the evaluated models, the FPN model demonstrated the best loss value. These findings indicate that the FPN model with ResNet18 backbone outperformed the other models in terms of its ability to accurately segment images while maintaining a low loss value.
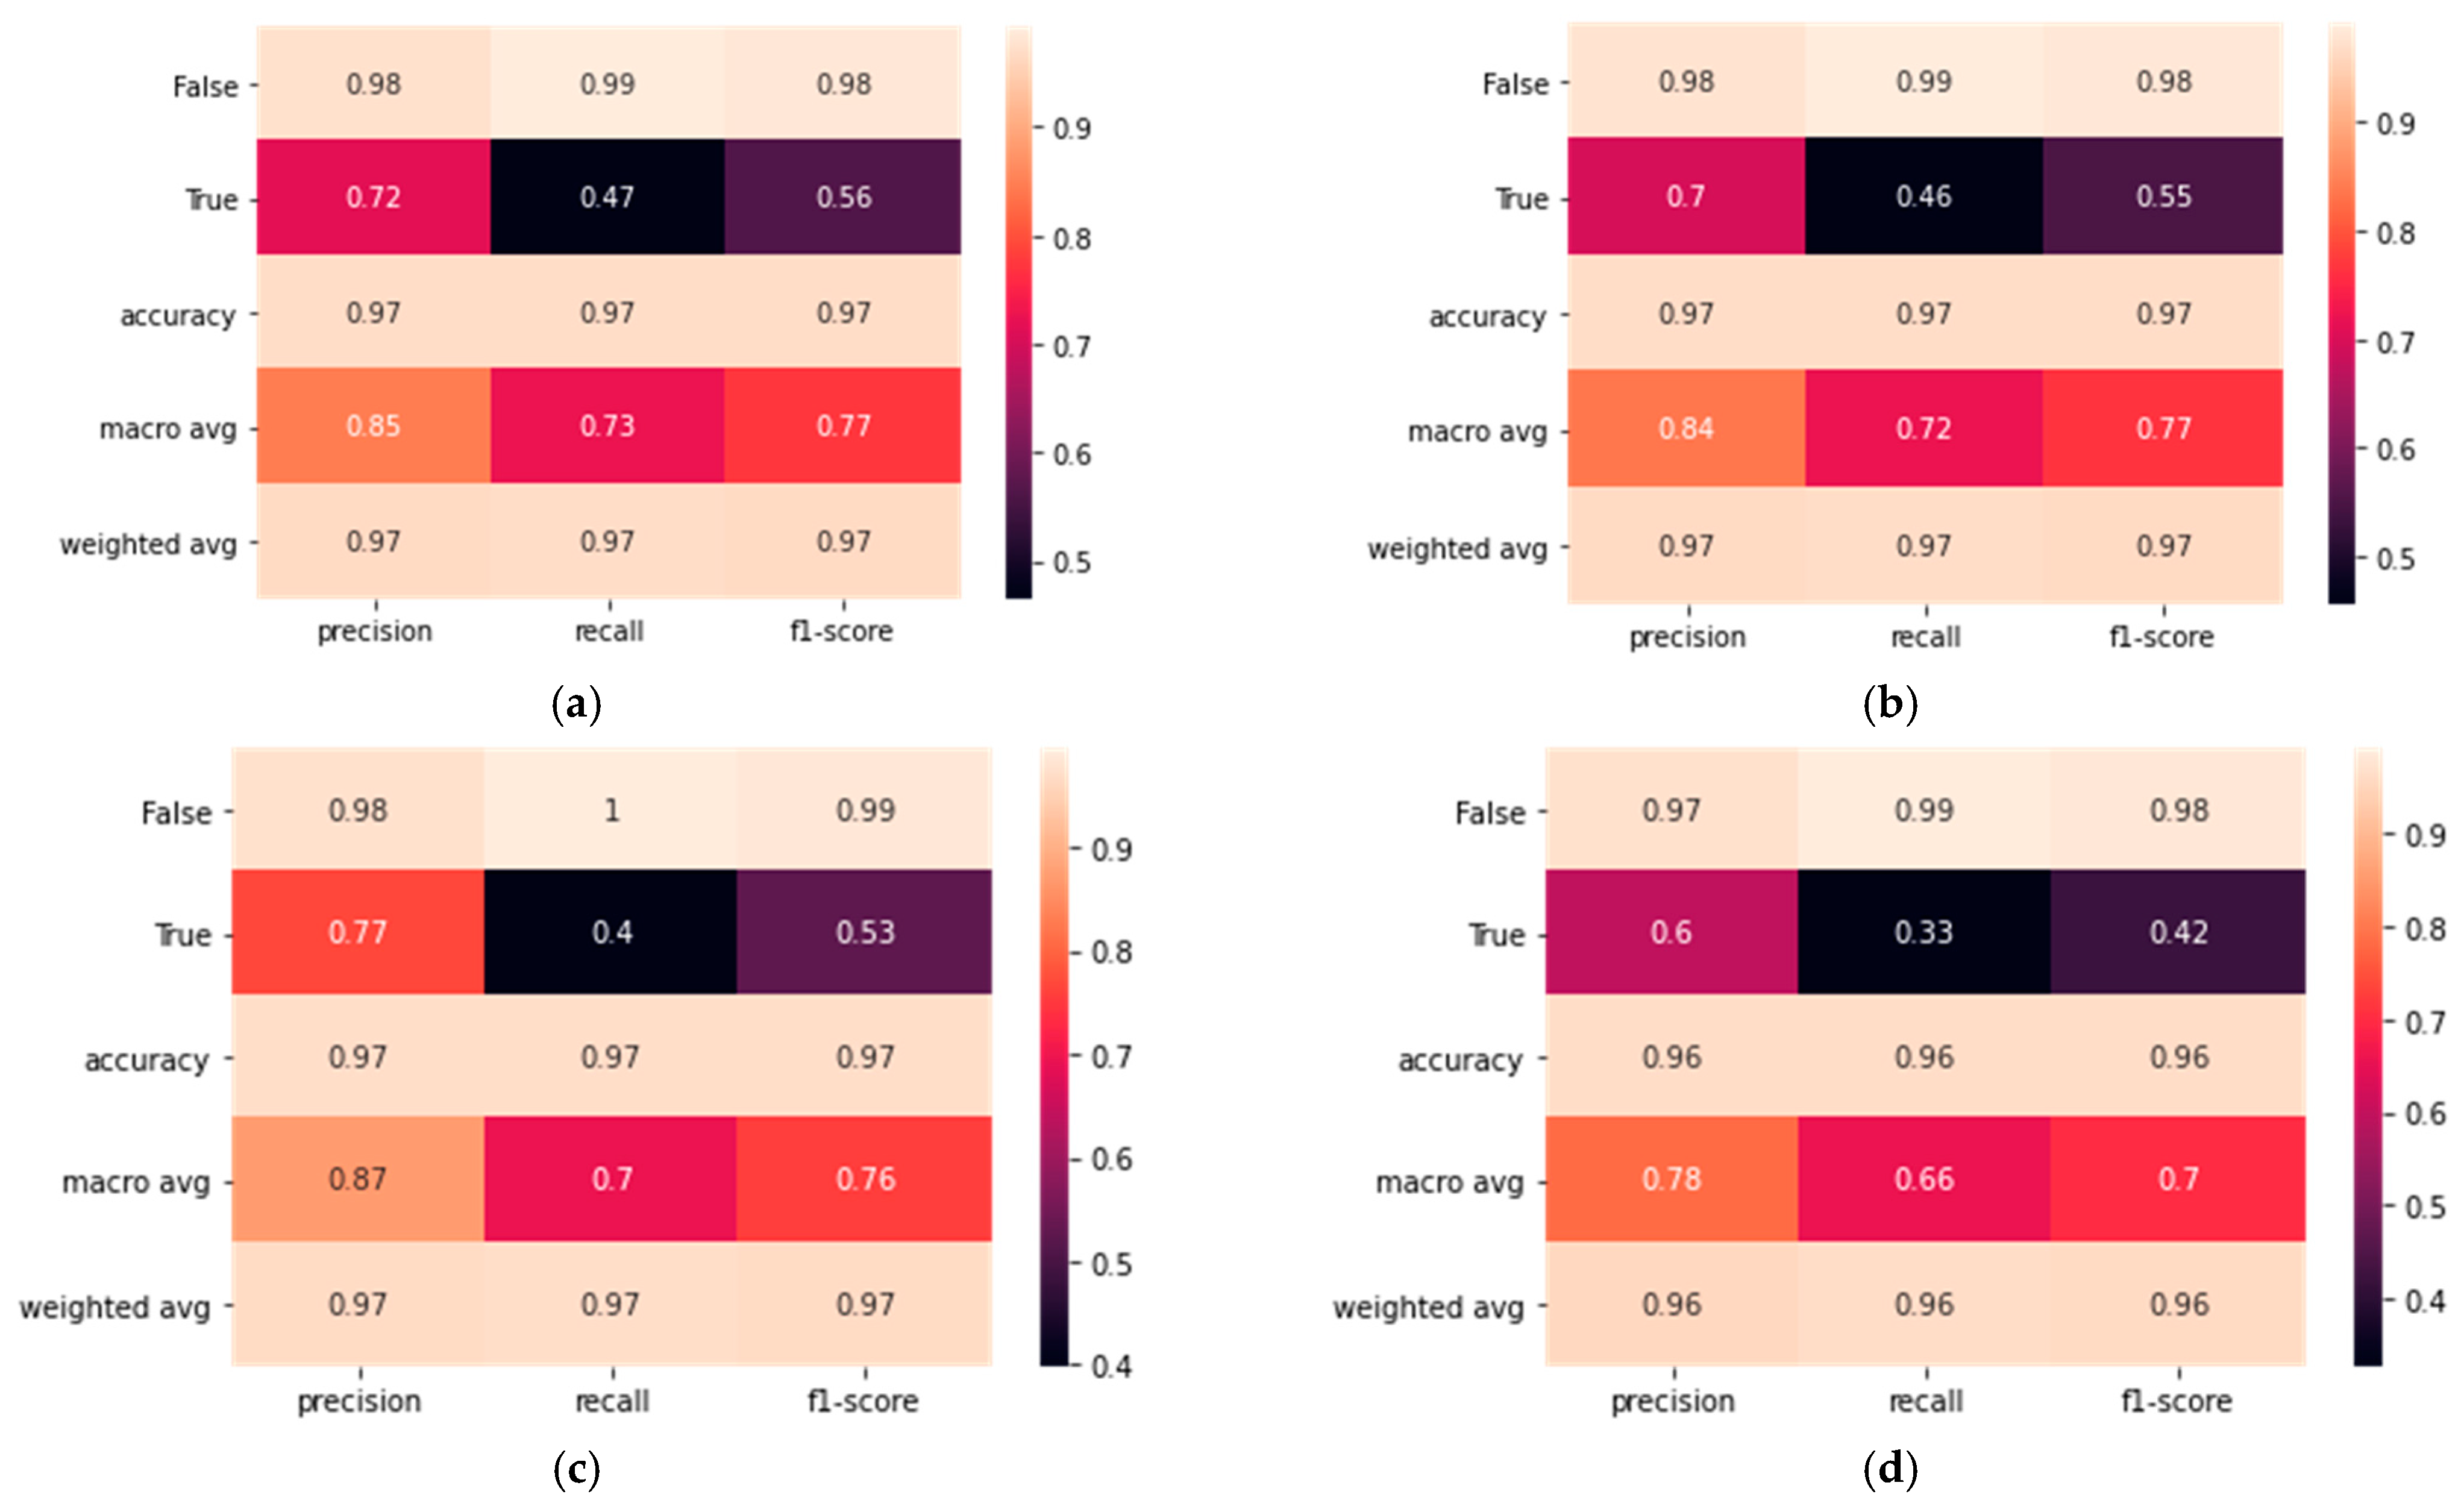
Figure 13 has been designed to convey the comparative performance of the U-Net, LinkNet, FPN, and PSPNet models across several key metrics. These metrics, namely precision, recall, and F1 score, are critical indicators of a model’s ability to accurately classify data points in the context of image segmentation. The ‘True’ row under each model represents the true positive rate, indicating the model’s success in correctly identifying positive cases. Conversely, the ‘False’ row signifies the false positives rate, showing how often the model incorrectly identifies a negative case as positive. Accuracy is represented as a single value for each model, reflecting the overall rate of correct predictions out of all predictions made. The macro average is presented to reflect the unweighted mean of the precision, recall, and F1 scores across the classes. This average is useful for understanding the model’s performance across the dataset without giving additional weight to any class. In contrast, the weighted average accounts for the imbalance in the dataset by considering the number of samples in each class. This gives us insight into how the model’s performance is influenced by the prevalence of each class in the dataset.
To further aid in interpretation, we have ensured that the table is color-coded based on the metric values, with warmer colors indicating higher values and cooler colors indicating lower values. This visual aid complements the numerical data and helps to quickly grasp the comparative performance of the models.
From a glance at the heatmaps:
U-Net and FPN models (a and c) show relatively higher values in most performance metrics compared to LinkNet and PSPNet (b and d), suggesting that they may perform better in segmenting images for this dataset or task.
The precision seems generally high across all models, indicating a lower rate of false positives.
Recall varies more noticeably between the models, with U-Net and FPN having higher values, suggesting they are better at capturing true positives.
The F1 score, which balances precision and recall, also appears to be higher for U-Net and FPN, indicating a more balanced performance between identifying relevant instances and avoiding false positives.
4.3. Visualization Results
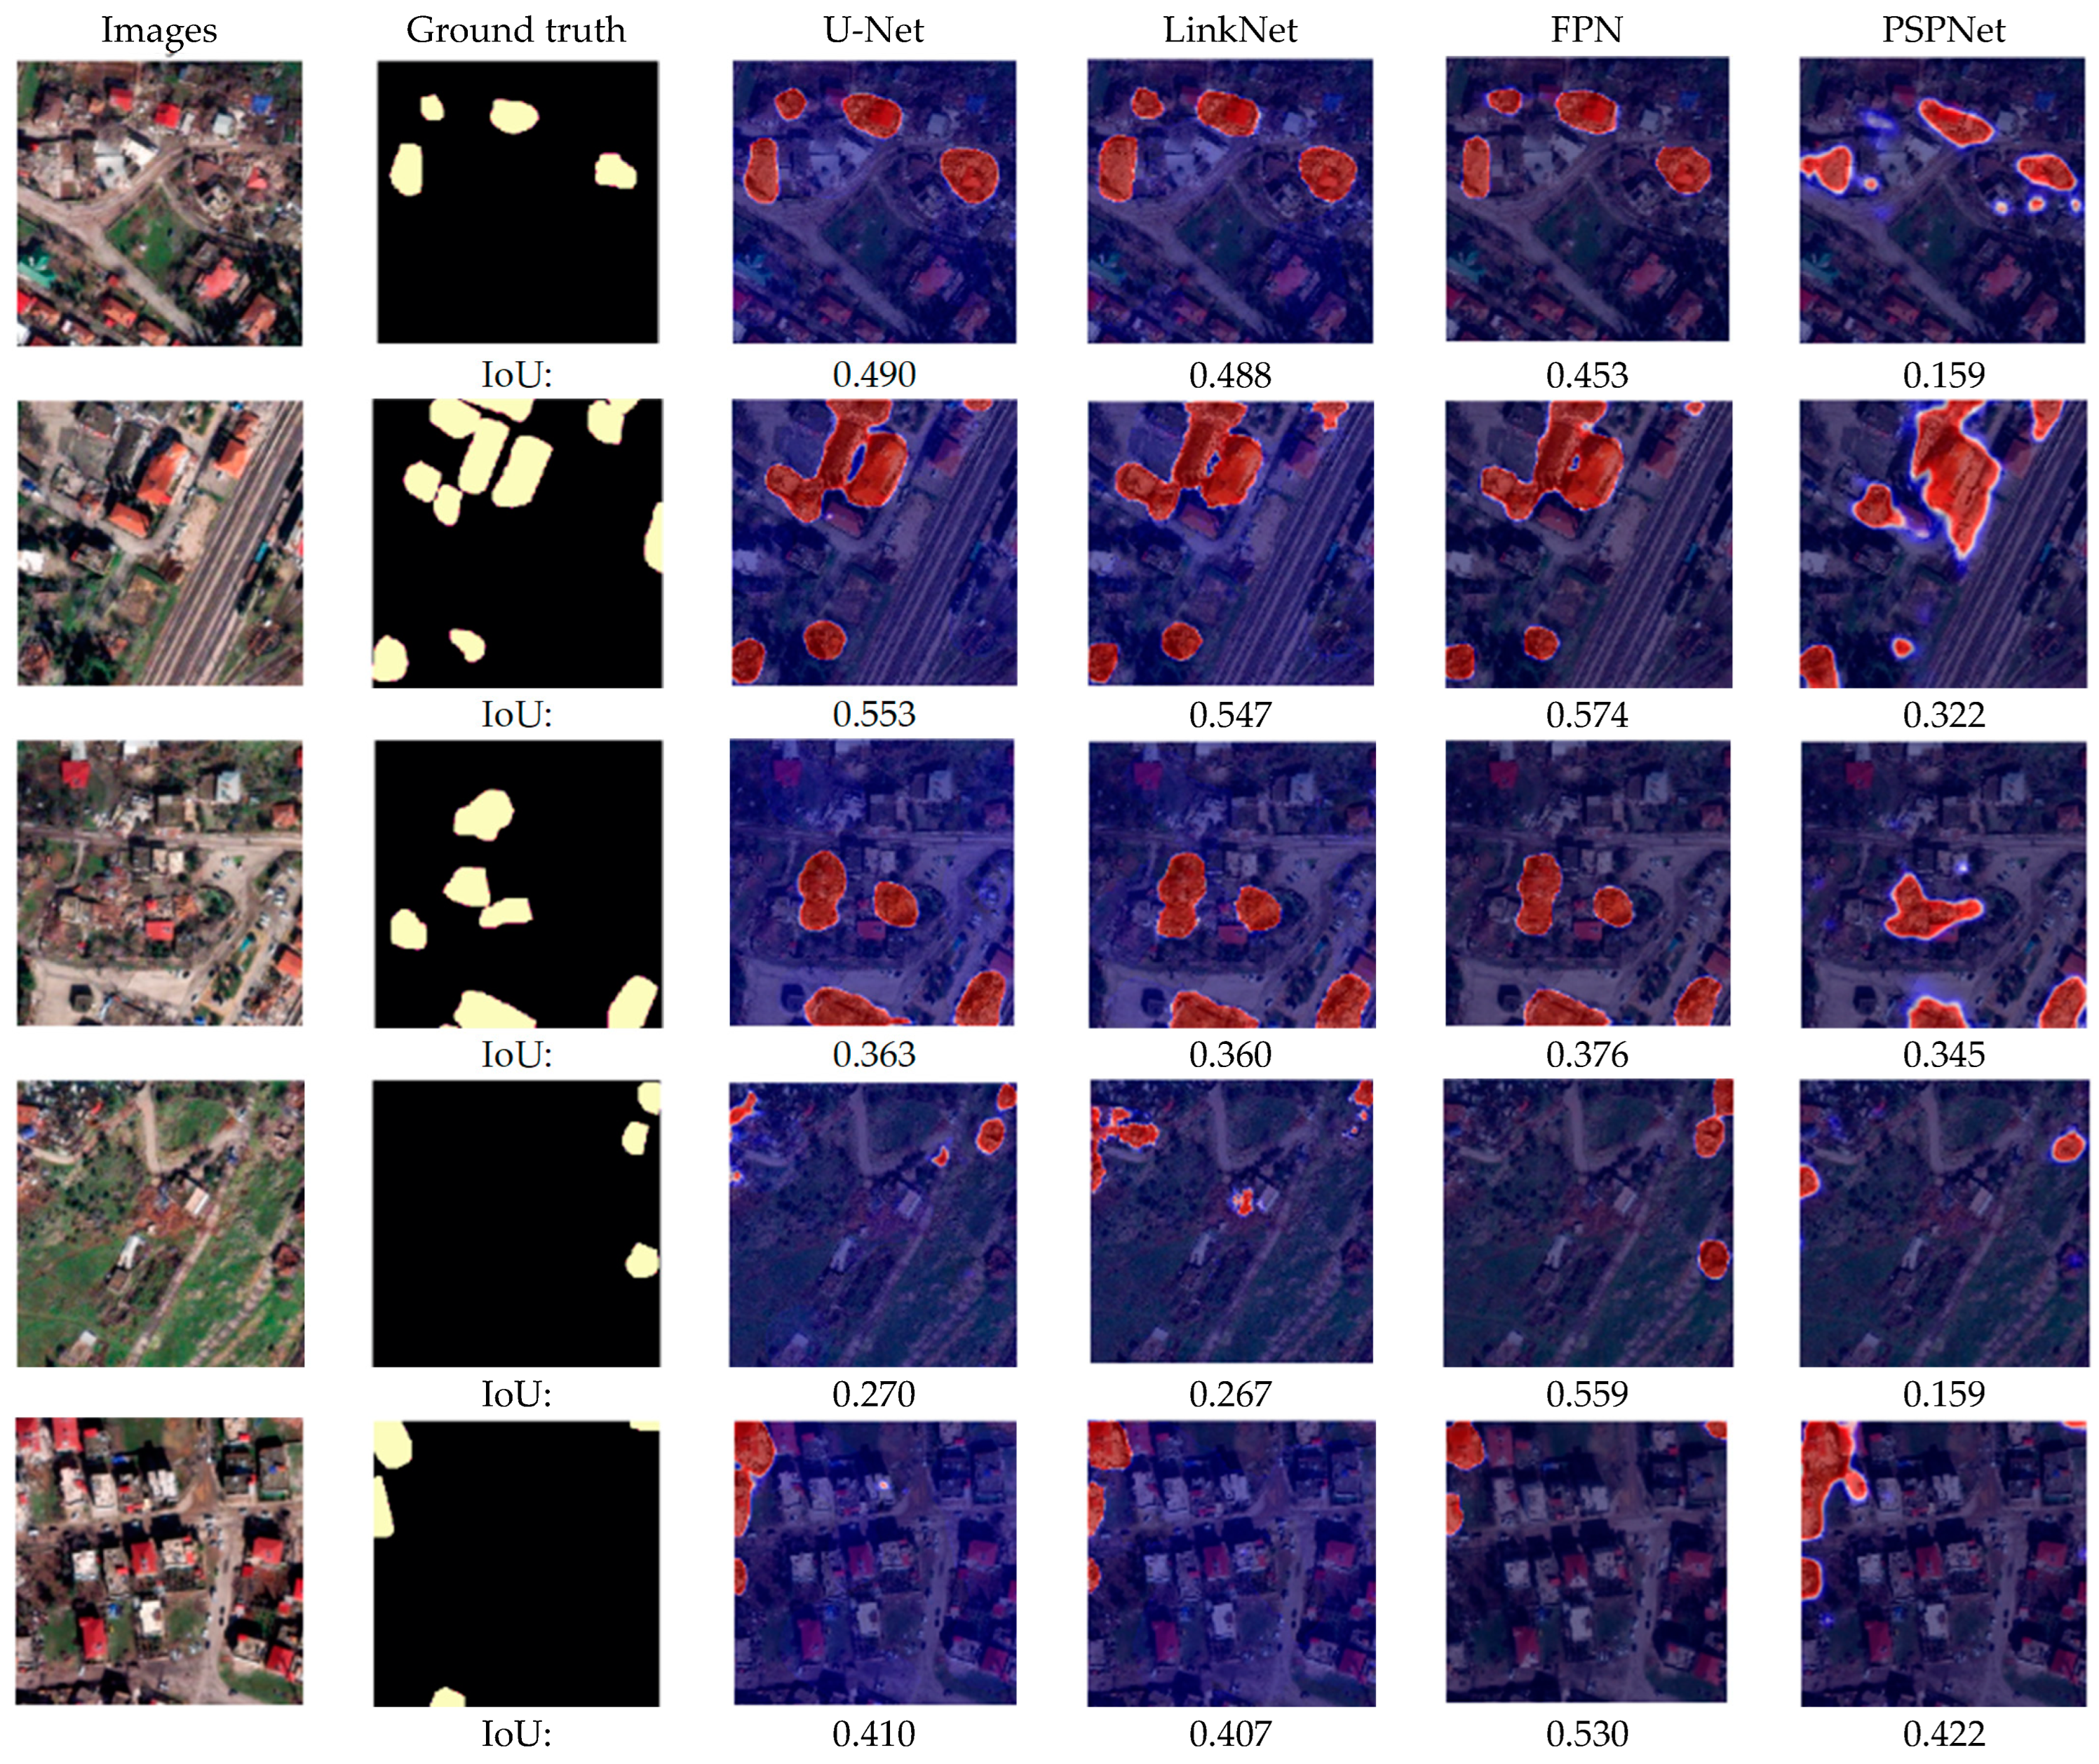
Figure 14 illustrates the comparative analysis results of four image segmentation models (U-Net, LinkNet, FPN, and PSPNet) applied to five sample satellite images. The depicted data includes Intersection over Union (IoU) values for each model across the five images, providing a comprehensive overview of their performance. The IoU metric is used to evaluate the overlap between the predicted segmentation and the ground truth. The results indicate that the performance of the models varies across the different images. For example, the U-Net and LinkNet models demonstrate similar performance in terms of IoU for Image 1 and Image 2, while the FPN model outperforms the other models for Image 3 and Image 4. However, for Image 5, all models demonstrate similar IoU values, with the FPN and PSPNet models achieving the highest IoU values.
The analysis reveals that the FPN and U-Net models demonstrate the best performance in terms of visualization results. These findings suggest that FPN and U-Net models are more effective in accurately segmenting satellite images compared to LinkNet and PSPNet models. Overall, the results suggest that the performance of the models depends on the specific characteristics of the images being analyzed. Therefore, it may be necessary to select the most appropriate segmentation model depending on the nature of the data and the objectives of the analysis.
5. Discussion
The high accuracy score of FPN indicates that it can accurately identify collapsed buildings from satellite images. This is important because accurate identification of collapsed buildings can help in developing effective strategies for the rescue and recovery of survivors. Additionally, the high specificity score indicates that FPN has a low false positive rate, which is important for reducing the number of false alarms and focusing resources on areas where they are needed most.
The high AUC score of U-Net indicates that it has good discriminatory power in identifying collapsed buildings. Discriminatory power is important because it indicates the ability of the segmentation architecture to distinguish between collapsed and non-collapsed buildings. The high discriminatory power of U-Net suggests that it can identify collapsed buildings with high precision while minimizing the number of false positives.
The performance of LinkNet and PSPNet was also evaluated, but their scores were not as good as FPN and U-Net. U-Net has the highest scores for recall, F1 score, sensitivity, and IoU. This suggests that U-Net is better at identifying collapsed buildings that are smaller in size or have less visible damage. However, its lower accuracy, specificity, and AUC scores indicate that it may have a higher false positive rate, which can lead to unnecessary resource allocation.
In the observed discrepancy between the Intersection over Union (IoU) and other performance metrics for the segmentation models, it is suggested that the lower IoU values are due to limitations in the models’ ability to precisely delineate the boundaries of damage. High accuracy, precision, and recall scores indicate successful identification of collapsed structures but not an accurate segmentation at a granular level.
Contributing factors are identified as follows:
Segmentation Granularity: The presence of damage is detected, but the exact spatial extent is not captured accurately, leading to reduced IoU scores.
Class Imbalance: Damaged structures, which occupy a smaller area in the dataset, result in the IoU being disproportionately affected by segmentation inaccuracies.
Object Size Variability: A heightened ability to detect smaller or less visible damages increases recall but may not align with precise boundary segmentation, thus impacting IoU.
The results of this study suggest that U-Net and FPN are the best segmentation architectures for identifying collapsed buildings from satellite images taken after the earthquakes considered. The high accuracy, specificity, and AUC scores of U-Net and FPN indicate that it can accurately identify collapsed buildings with a low false positive rate, while its high discriminatory power suggests that it can distinguish between collapsed and non-collapsed buildings with high precision. This information can be used to develop effective strategies for rescue and recovery efforts, as well as for future disaster planning and prevention.
These findings highlight the importance of refining the models to improve the spatial precision of segmentation for damaged structures, a critical factor for resource allocation in post-disaster scenarios.
At the current stage of research, the model has not been extensively tested with images of undamaged structures. This was due to the focus on disaster-affected areas where detecting damage rather than verifying intact structures was of primary importance. However, the necessity of such tests in understanding all the capabilities and limitations of the model is obvious. This is suggested as a potential direction for future research to further refine and evaluate the model’s performance in a wider range of scenarios.
6. Conclusions
The detection of collapsed buildings in satellite images after natural disasters such as earthquakes is a critical task for assessing the damage and planning recovery efforts. This study’s focused evaluation of deep learning-based image segmentation models, namely U-Net, LinkNet, FPN, and PSPNet, has revealed significant insights for disaster management applications, specifically in the context of the 6 February 2023 Pazarcık and Elbistan earthquakes in Türkiye.
The four architectures were rigorously assessed using a comprehensive set of performance metrics, including accuracy, precision, recall, F1 score, specificity, AUC, and IoU. Among these, FPN and U-Net emerged as the top performers, with FPN achieving the highest accuracy and specificity scores, and U-Net excelling in recall, F1 score, and IoU. These metrics collectively indicate the robustness of these models in accurately identifying and categorizing collapsed structures amid the debris.
However, the nuanced performance of each model, characterized by their respective precision-recall balances and IoU scores, underscores the complex nature of segmentation tasks in disaster-stricken environments. While FPN showed a remarkable ability to segment with high precision, U-Net demonstrated superior recall, suggesting its potential to detect collapsed buildings that are smaller or exhibit less visible damage.
The analysis of training and validation accuracy and loss curves further substantiated the models’ efficiency, with all models achieving an accuracy of over 96%. The FPN model, in particular, demonstrated outstanding performance in terms of loss values, suggesting its efficacy in segmenting images with lower error margins.
While the classification report provided a granular view of the models’ precision, recall, and F1 score, it is the comprehensive evaluation that illuminates the potential of deep learning in rapidly and reliably identifying collapsed buildings—a critical component in the orchestration of rescue and recovery operations.
This study not only contributes to the existing body of knowledge by highlighting the capabilities of deep learning models in post-disaster scenarios but also sets the stage for future research directions. It accentuates the need for testing with undamaged structures to enhance the models’ generalizability and underscores the potential of these models to be integrated into real-time disaster response systems, ultimately aiding in the development of more resilient infrastructures and communities.
The significance of these findings lies in their contribution to the advancement of disaster management strategies, facilitating quicker and more informed decision-making in the wake of catastrophic events. The potential for these models to be adapted for various disaster scenarios can lead to their incorporation into standard operational procedures, thereby enhancing the efficacy of response and recovery efforts globally.
Author Contributions
Conceptualization, K.H.; methodology, K.H. and H.B.B.; validation, V.K.; formal analysis, K.Ö.; investigation, K.H. and V.K.; resources, H.B.B.; data curation, K.H. and H.B.B.; writing—original draft preparation, K.H. and V.K.; writing—review and editing, A.C.A.; visualization, H.B.B.; supervision, K.H.; project administration, K.H.; funding acquisition, H.B.B. and V.K. All authors have read and agreed to the published version of the manuscript.
Funding
This work was supported by Scientific Research Projects Unit of Karadeniz Technical University. Project number: FBA-2021-9635.
Data Availability Statement
The data presented in this study are available on request from the corresponding author. The data are not publicly available due to privacy.
Acknowledgments
This work has been carried out with the contributions of the “Earthquake and Structural Health Monitoring Research Center” at Karadeniz Technical University. We extend our gratitude to the university for their support in this research.
Conflicts of Interest
Author Ahmet Can Altunışık was the founder of Dynamic Academy Software, Construction Ind. Trade. Co., Ltd. Şti. The remaining authors declare that the research was conducted in the absence of any commercial or financial relationships that could be construed as a potential conflict of interest.
References
- Garini, E.; Gazetas, G. The 2 Earthquakes of 6 February 2023 in Turkey Preliminary Report. Available online: https://learningfromearthquakes.org/images/earthquakes/2023_02_05_Turkey/M7.8_Turkey-Syria_EQ_6_February_2023.pdf (accessed on 20 February 2023).
- Özmen, A.; Maraş, M.M.; Ayaz, Y.; Sayın, E. Assessments of Masonry Buildings and Historical Structures during the 2020 Sivrice-Elazığ Earthquake. Period. Polytech. Civ. Eng. 2023, 67, 530–544. [Google Scholar] [CrossRef]
- AFAD. Türkiye Deprem Tehlike Haritaları İnteraktif Web Uygulaması (In Turkish). Available online: https://tdth.afad.gov.tr/TDTH/main.xhtml (accessed on 20 February 2023).
- KOERI-Kandilli Observatory & Earthquake Research Institute. 06 Şubat 2023 Sofalaca Şehitkamil-Gaziantep Depremi Basın Bülteni; Regional Earthquake-Tsunami Monitoring Center: İstanbul, Türkiye, 2023. [Google Scholar]
- AFAD. Available online: https://deprem.afad.gov.tr/event-catalog (accessed on 20 February 2023).
- AFAD. 06 Şubat 2023 Pazarcık (Kahramanmaraş) Mw 7.7 ve Elbistan (Kahramanmaraş) Mw 7.6 Depremlerine İlişkin Ön Değerlendirme Raporu. Available online: https://deprem.afad.gov.tr/assets/pdf/Arazi_Onrapor_28022023_surum1_revize.pdf (accessed on 20 February 2023).
- Field, K. Maps of the Turkey/Syria Earthquakes. Available online: https://cartoblography.com/2023/02/15/maps-of-the-turkey-syria-earthquakes/ (accessed on 20 February 2023).
- International Disasters Charter. 2023. Available online: https://disasterscharter.org/image/journal/article.jpg?img_id=18612500&t=1676279552802 (accessed on 20 February 2023).
- Maxar. Available online: https://www.maxar.com/open-data/turkey-earthquake-2023 (accessed on 20 February 2023).
- Ronneberger, O.; Fischer, P.; Brox, T. U-net: Convolutional networks for biomedical image segmentation. In Lecture Notes in Computer Science (including Subseries Lecture Notes in Artificial Intelligence and Lecture Notes in Bioinformatics); Springer: Berlin/Heidelberg, Germany, 2015; Volume 9351, pp. 234–241. [Google Scholar] [CrossRef]
- Chaurasia, A.; Culurciello, E. LinkNet: Exploiting encoder representations for efficient semantic segmentation. In 2017 IEEE Visual Communications and Image Processing, VCIP 2017; Institute of Electrical and Electronics Engineers Inc.: New York, NY, USA, 2018; pp. 1–4. [Google Scholar] [CrossRef]
- Zhao, H.; Shi, J.; Qi, X.; Wang, X.; Jia, J. Pyramid scene parsing network. In Proceedings-30th IEEE Conference on Computer Vision and Pattern Recognition, CVPR 2017; Institute of Electrical and Electronics Engineers Inc.: New York, NY, USA, 2017; pp. 6230–6239. [Google Scholar] [CrossRef]
- Lin, T.Y.; Dollár, P.; Girshick, R.; He, K.; Hariharan, B.; Belongie, S. Feature pyramid networks for object detection. In Proceedings-30th IEEE Conference on Computer Vision and Pattern Recognition, CVPR 2017; Institute of Electrical and Electronics Engineers Inc.: New York, NY, USA, 2017; pp. 936–944. [Google Scholar] [CrossRef]
- Lin, Y.; Nie, Z.; Ma, H. Structural Damage Detection with Automatic Feature-Extraction through Deep Learning. Comput.-Aided Civ. Infrastruct. Eng. 2017, 32, 1025–1046. [Google Scholar] [CrossRef]
- Cha, Y.-J.; Choi, W. Deep Learning-Based Crack Damage Detection Using Convolutional Neural Networks. Comput.-Aided Civ. Infrastruct. Eng. 2017, 32, 361–378. [Google Scholar] [CrossRef]
- Avci, O.; Abdeljaber, O.; Kiranyaz, S.; Inman, D. Structural damage detection in real time: Implementation of 1D convolutional neural networks for SHM applications. In Conference Proceedings of the Society for Experimental Mechanics Series; Springer: Berlin/Heidelberg, Germany, 2017; pp. 49–54. [Google Scholar]
- Patterson, B.; Leone, G.; Pantoja, M.; Behrouzi, A. Deep Learning for Automated Image Classification of Seismic Damage to Built Infrastructure. Eleventh U.S. National Conference on Earthquake Engineering. 2018. Available online: https://digitalcommons.calpoly.edu/aen_fac/126 (accessed on 20 February 2023).
- Pathirage, C.S.N.; Li, J.; Li, L.; Hao, H.; Liu, W.; Ni, P. Structural damage identification based on autoencoder neural networks and deep learning. Eng. Struct. 2018, 172, 13–28. [Google Scholar] [CrossRef]
- Cha, Y.J.; Choi, W.; Suh, G.; Mahmoudkhani, S.; Büyüköztürk, O. Autonomous Structural Visual Inspection Using Region-Based Deep Learning for Detecting Multiple Damage Types. Comput. -Aided Civ. Infrastruct. Eng. 2018, 33, 731–747. [Google Scholar] [CrossRef]
- Abdeljaber, O.; Avci, O.; Kiranyaz, M.S.; Boashash, B.; Sodano, H.; Inman, D.J. 1-D CNNs for structural damage detection: Verification on a structural health monitoring benchmark data. Neurocomputing 2018, 275, 1308–1317. [Google Scholar] [CrossRef]
- Li, Y.; Ye, S.; Bartoli, I. Semisupervised classification of hurricane damage from post-event aerial imagery using deep learning. J. Appl. Remote Sens. 2018, 12, 045008. [Google Scholar] [CrossRef]
- Duarte, D.; Nex, F.; Kerle, N.; Vosselman, G. Satellite image classification of building damages using airborne and satellite image samples in a deep learning approach. ISPRS Ann. Photogramm. Remote Sens. Spat. Inf. Sci. 2018, IV–2, 89–96. [Google Scholar] [CrossRef]
- Hamdi, Z.M.; Brandmeier, M.; Straub, C. Forest Damage Assessment Using Deep Learning on High Resolution Remote Sensing Data. Remote Sens. 2019, 11, 1976. [Google Scholar] [CrossRef]
- Mangalathu, S.; Burton, H.V. Deep learning-based classification of earthquake-impacted buildings using textual damage descriptions. Int. J. Disaster Risk Reduct. 2019, 36, 101111. [Google Scholar] [CrossRef]
- Ci, T.; Liu, Z.; Wang, Y. Assessment of the Degree of Building Damage Caused by Disaster Using Convolutional Neural Networks in Combination with Ordinal Regression. Remote Sens. 2019, 11, 2858. [Google Scholar] [CrossRef]
- Moradi, M.; Shah-Hosseini, R. Earthquake Damage Assessment Based on Deep Learning Method Using VHR Images. Environ. Sci. Proc. 2020, 5, 16. [Google Scholar] [CrossRef]
- Xiong, C.; Li, Q.; Construction, X.L.-A. Automated Regional Seismic Damage Assessment of Buildings Using an Unmanned Aerial Vehicle and a Convolutional Neural Network; Elsevier: Amsterdam, The Netherlands, 2020; Available online: https://www.sciencedirect.com/science/article/pii/S0926580519304224?casa_token=0ImSg3-eZ4sAAAAA:cW1cgOGa0AU4kOG-518nDplx3KEpW0f70NVY2Ldf1vBhILQzfL_EhNpQlif-1X_FugLNS8RxxUc (accessed on 20 February 2023).
- Zhao, F.; Zhang, C. Building Damage Evaluation from Satellite Imagery using Deep Learning. In Proceedings-2020 IEEE 21st International Conference on Information Reuse and Integration for Data Science, IRI 2020; Institute of Electrical and Electronics Engineers Inc.: New York, NY, USA, 2020; pp. 82–89. [Google Scholar] [CrossRef]
- Cheng, C.S.; Behzadan, A.H.; Noshadravan, A. Deep learning for post-hurricane aerial damage assessment of buildings. Comput. Aided Civ. Infrastruct. Eng. 2021, 36, 695–710. [Google Scholar] [CrossRef]
- Calantropio, A.; Chiabrando, F.; Codastefano, M.; Bourke, E. Deep learning for automatic building damage assessment: Application in post-disaster scenarios using UAV data. ISPRS Ann. Photogramm. Remote Sens. Spat. Inf. Sci. 2021, V-1–2021, 113–120. [Google Scholar] [CrossRef]
- Planet. Available online: https://www.planet.com/gallery (accessed on 21 February 2023).
- Hu, J.; Li, L.; Lin, Y.; Wu, F.; Zhao, J. A Comparison and Strategy of Semantic Segmentation on Remote Sensing Images. Adv. Intell. Syst. Comput. 2019, 1074, 21–29. [Google Scholar] [CrossRef]
- He, K.; Zhang, X.; Ren, S.; Sun, J. Deep residual learning for image recognition. In Proceedings of the IEEE Computer Society Conference on Computer Vision and Pattern Recognition; IEEE Computer Society: Washington, DC, USA, 2016; pp. 770–778. [Google Scholar] [CrossRef]
| Disclaimer/Publisher’s Note: The statements, opinions and data contained in all publications are solely those of the individual author(s) and contributor(s) and not of MDPI and/or the editor(s). MDPI and/or the editor(s) disclaim responsibility for any injury to people or property resulting from any ideas, methods, instructions or products referred to in the content. |
© 2024 by the authors. Licensee MDPI, Basel, Switzerland. This article is an open access article distributed under the terms and conditions of the Creative Commons Attribution (CC BY) license (https://creativecommons.org/licenses/by/4.0/).


 ,
, 