
Induced Partial Saturation Using Pseudomonas stutzeri Biogas for Mitigate Structure Settlement

Abstract
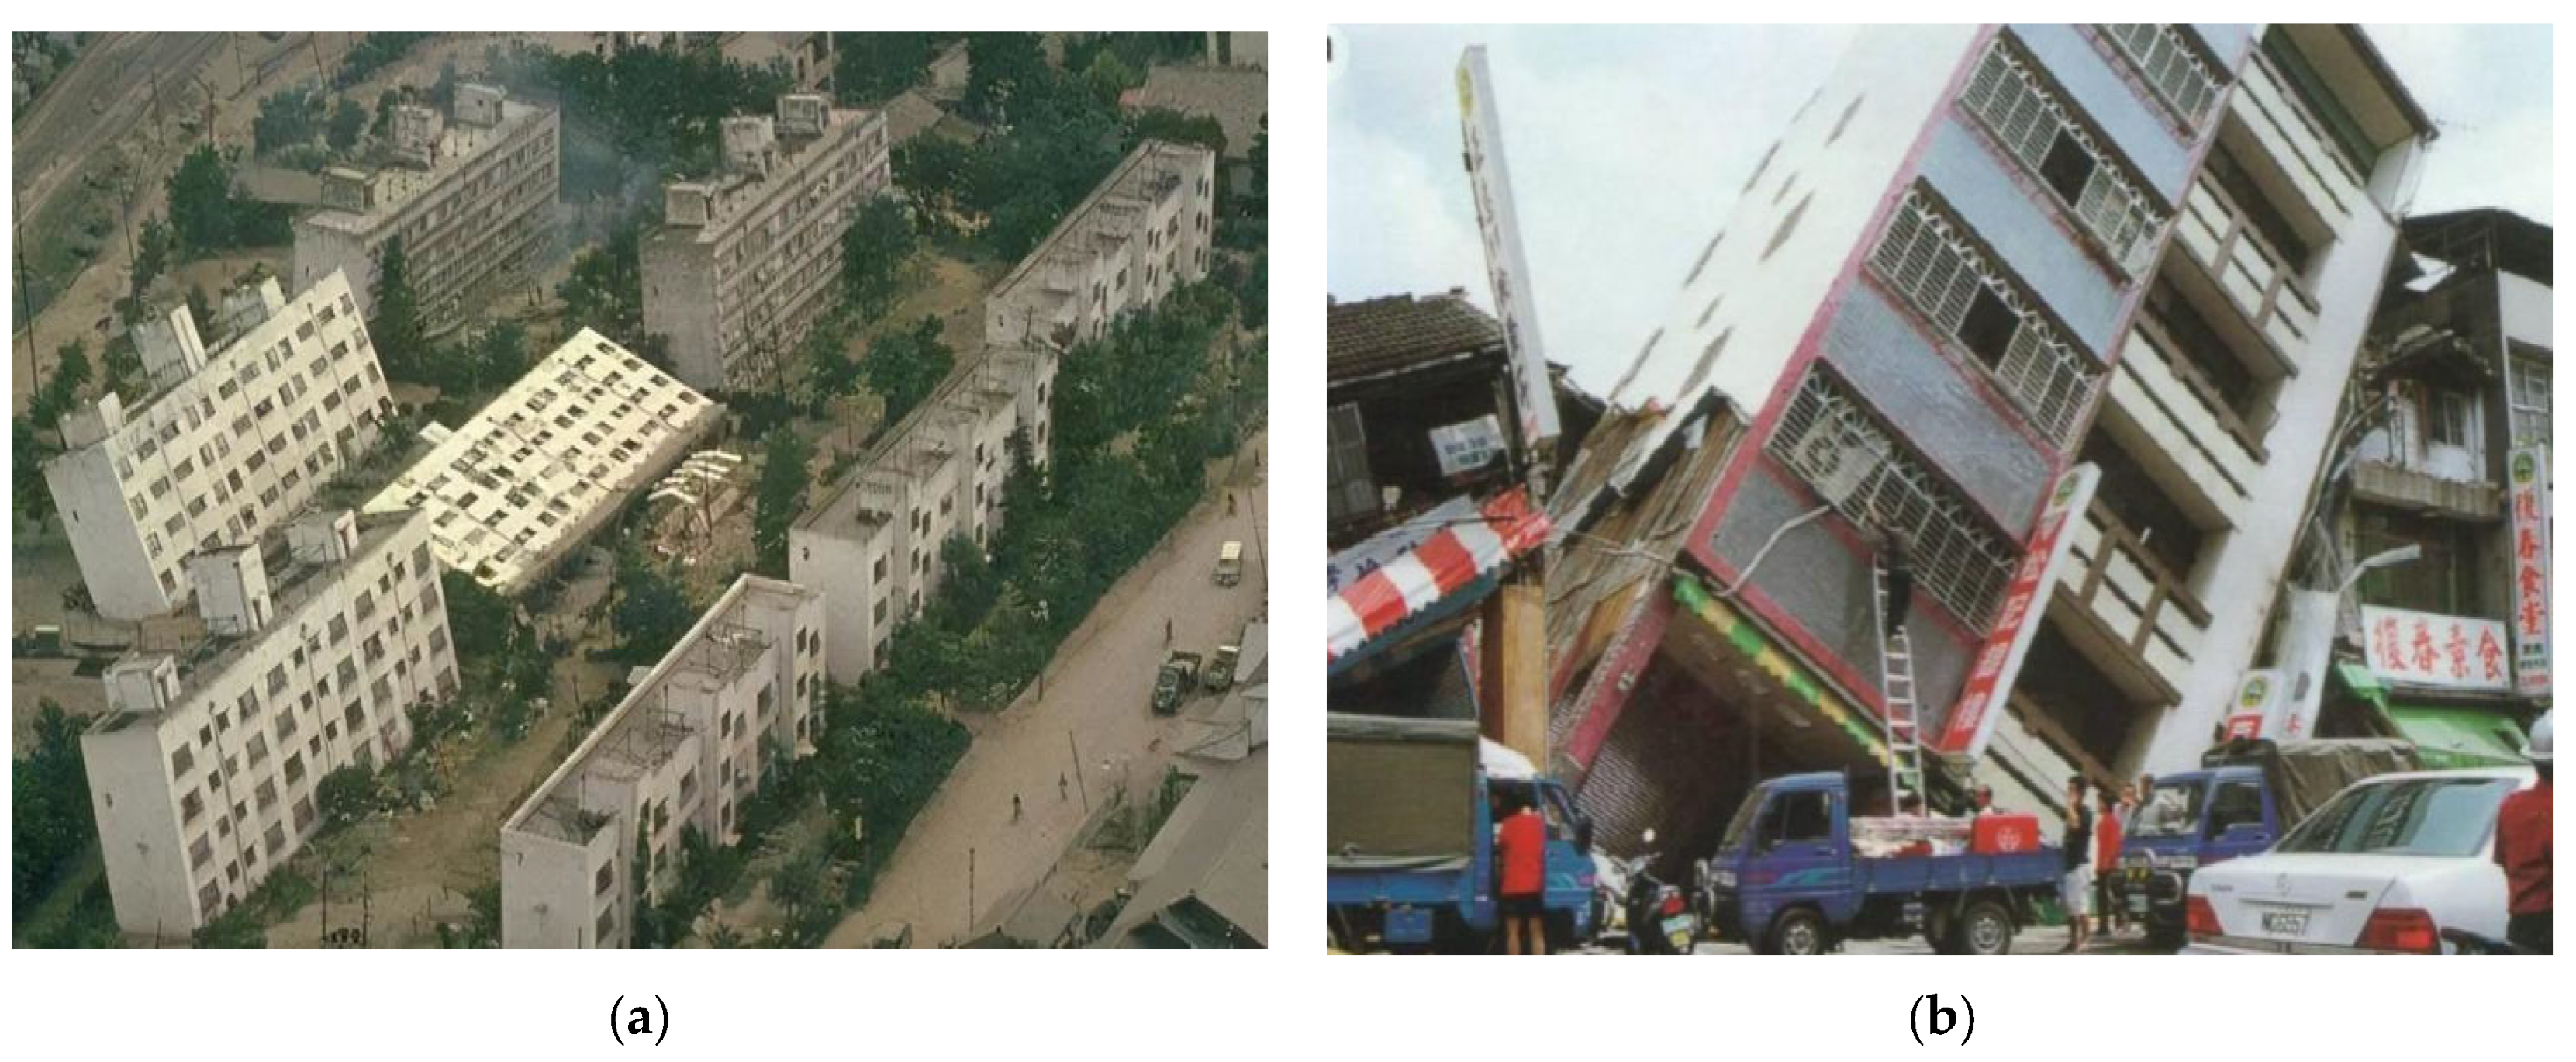
1. Introduction
2. Materials and Methods
2.1. Materials
2.1.1. Test Sand
2.1.2. Bacterial Culture
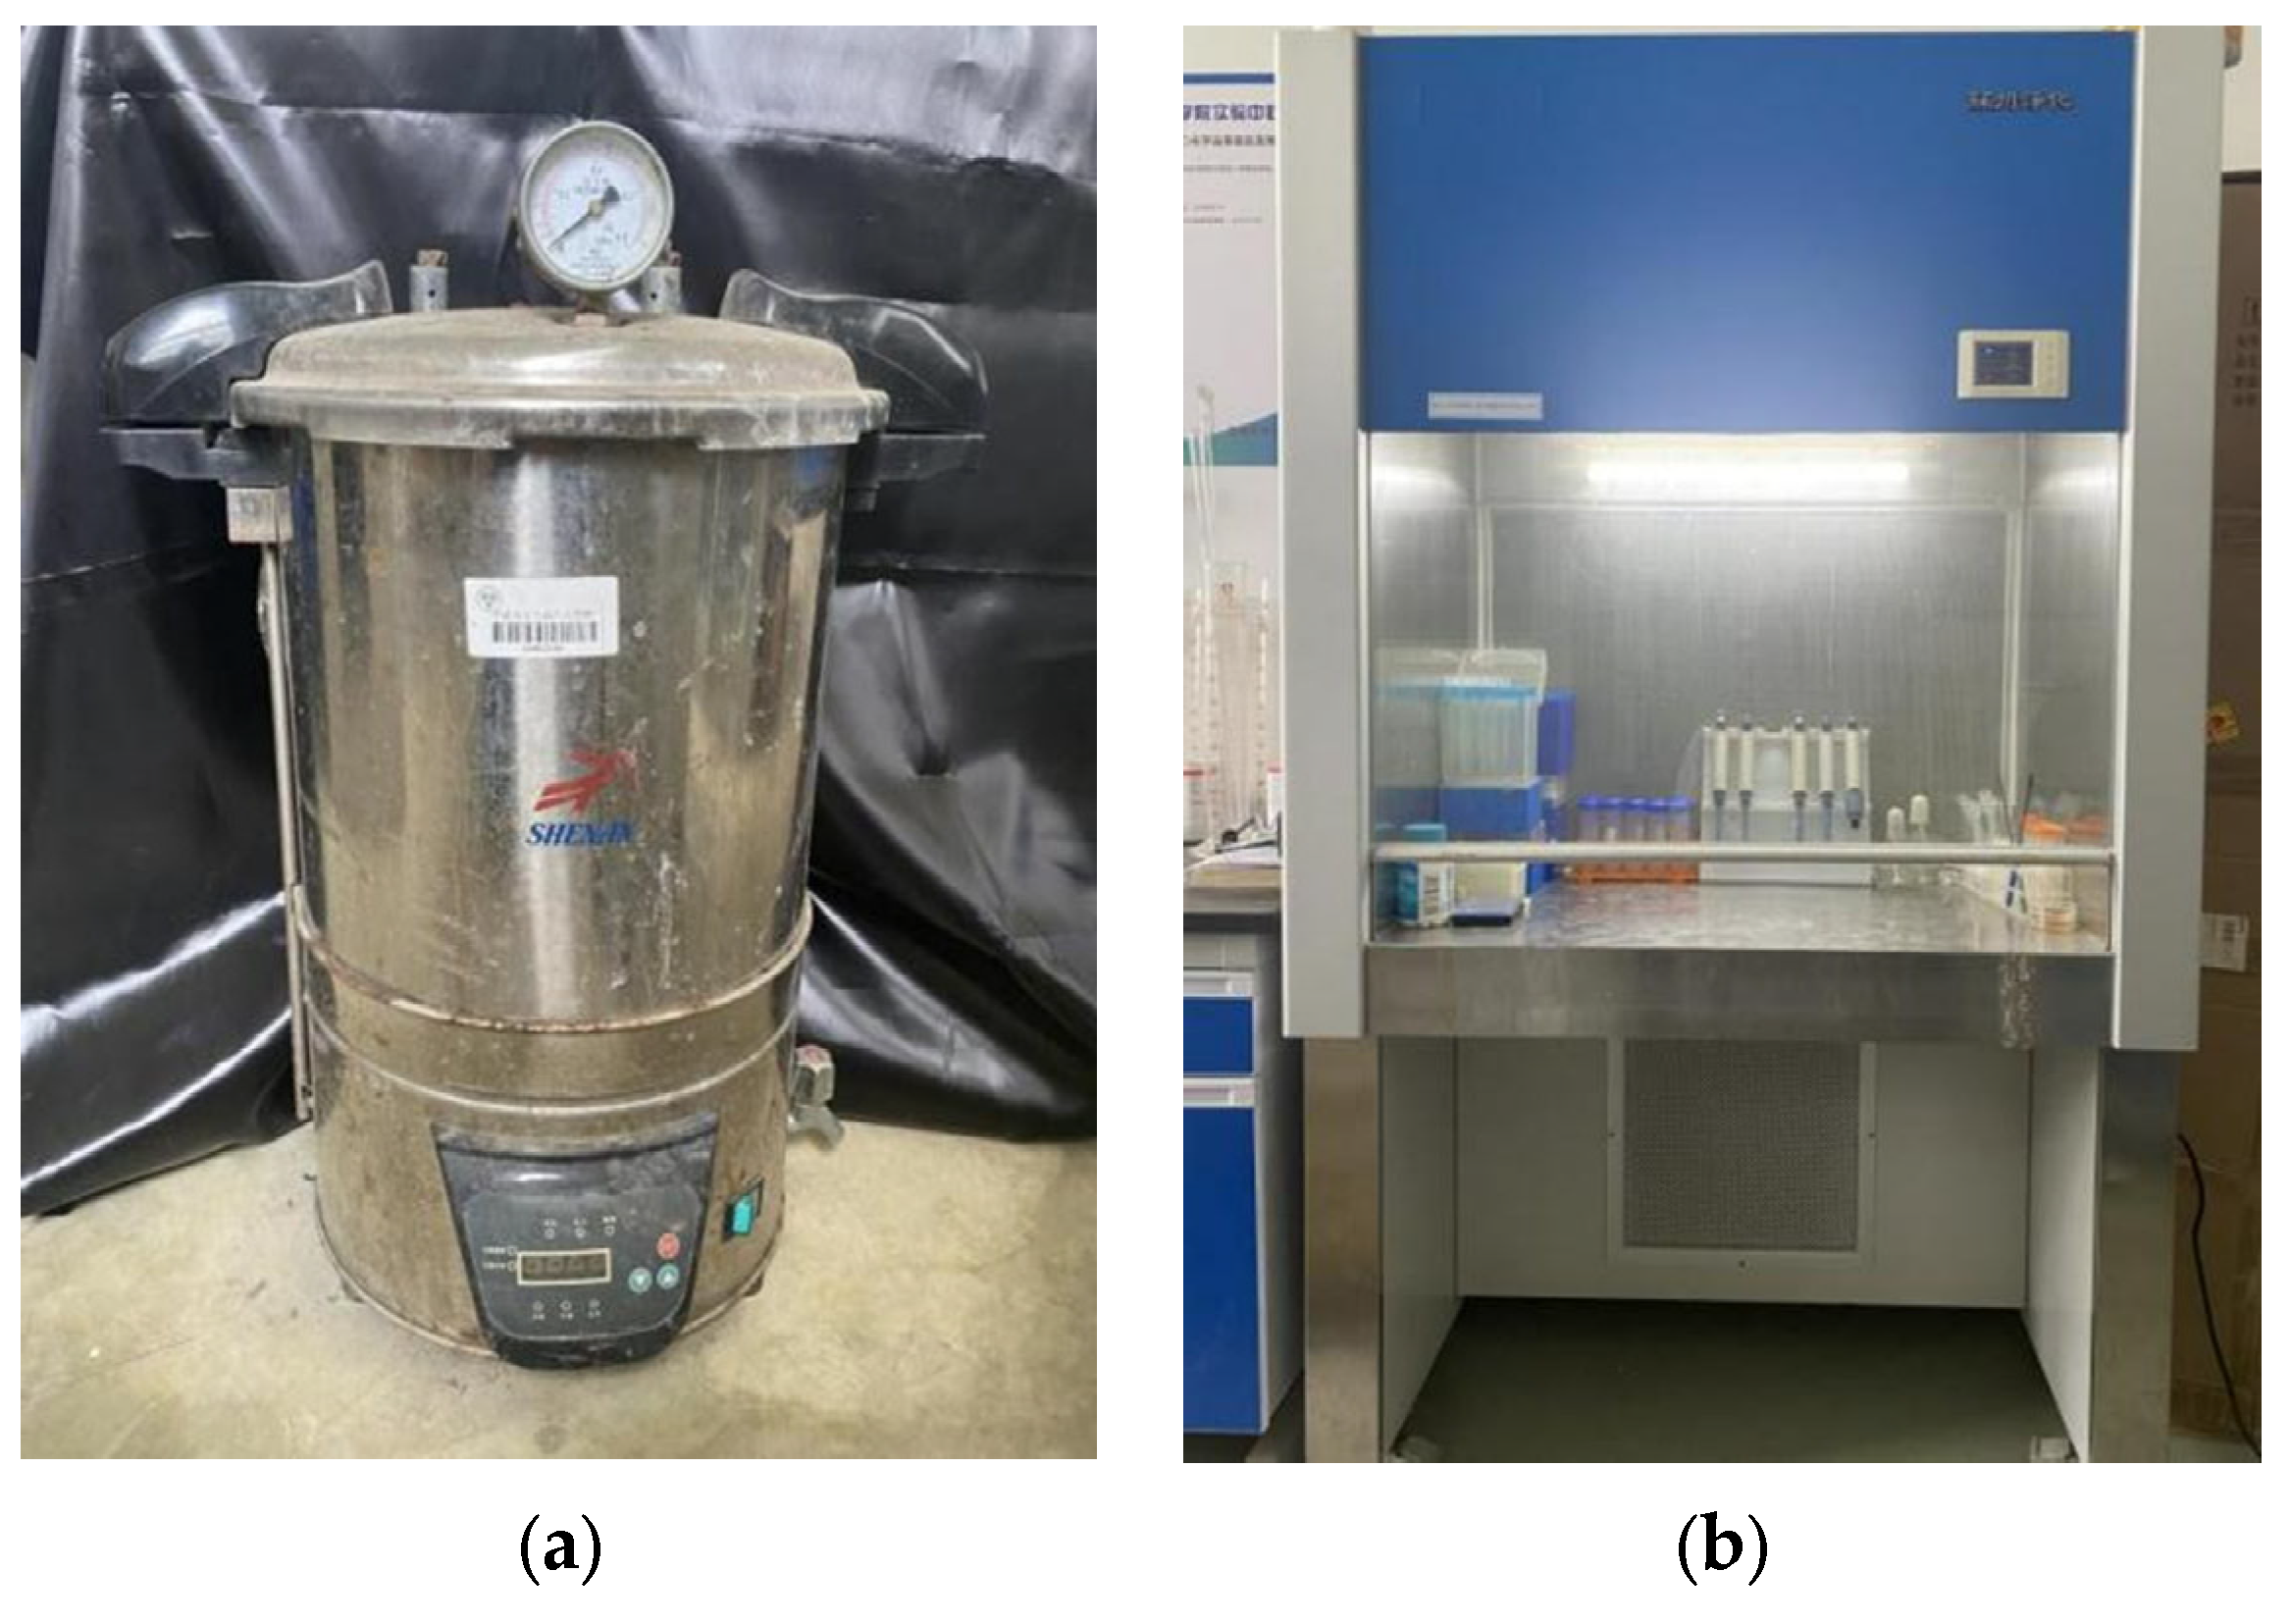
2.2. Methods
2.2.1. Denitrification Performance Verification
- Luria–Bertani culture medium was used for bacterial growth. When the bacteria were in the logarithmic phase, they were centrifuged at 4000 r/min, and the supernatant was removed. Denitrification media was added to form a treatment solution with an OD600 equal to 0.1.
- Then, 1 mL treatment liquid was added to 2 mL centrifuge tubes. According to the website DSMZ, static culture was performed at an optimal temperature of 30 °C.
- Samples were obtained at 3 h intervals, and the concentrations of nitrate and nitrite were detected.
2.2.2. Gas Generation Test
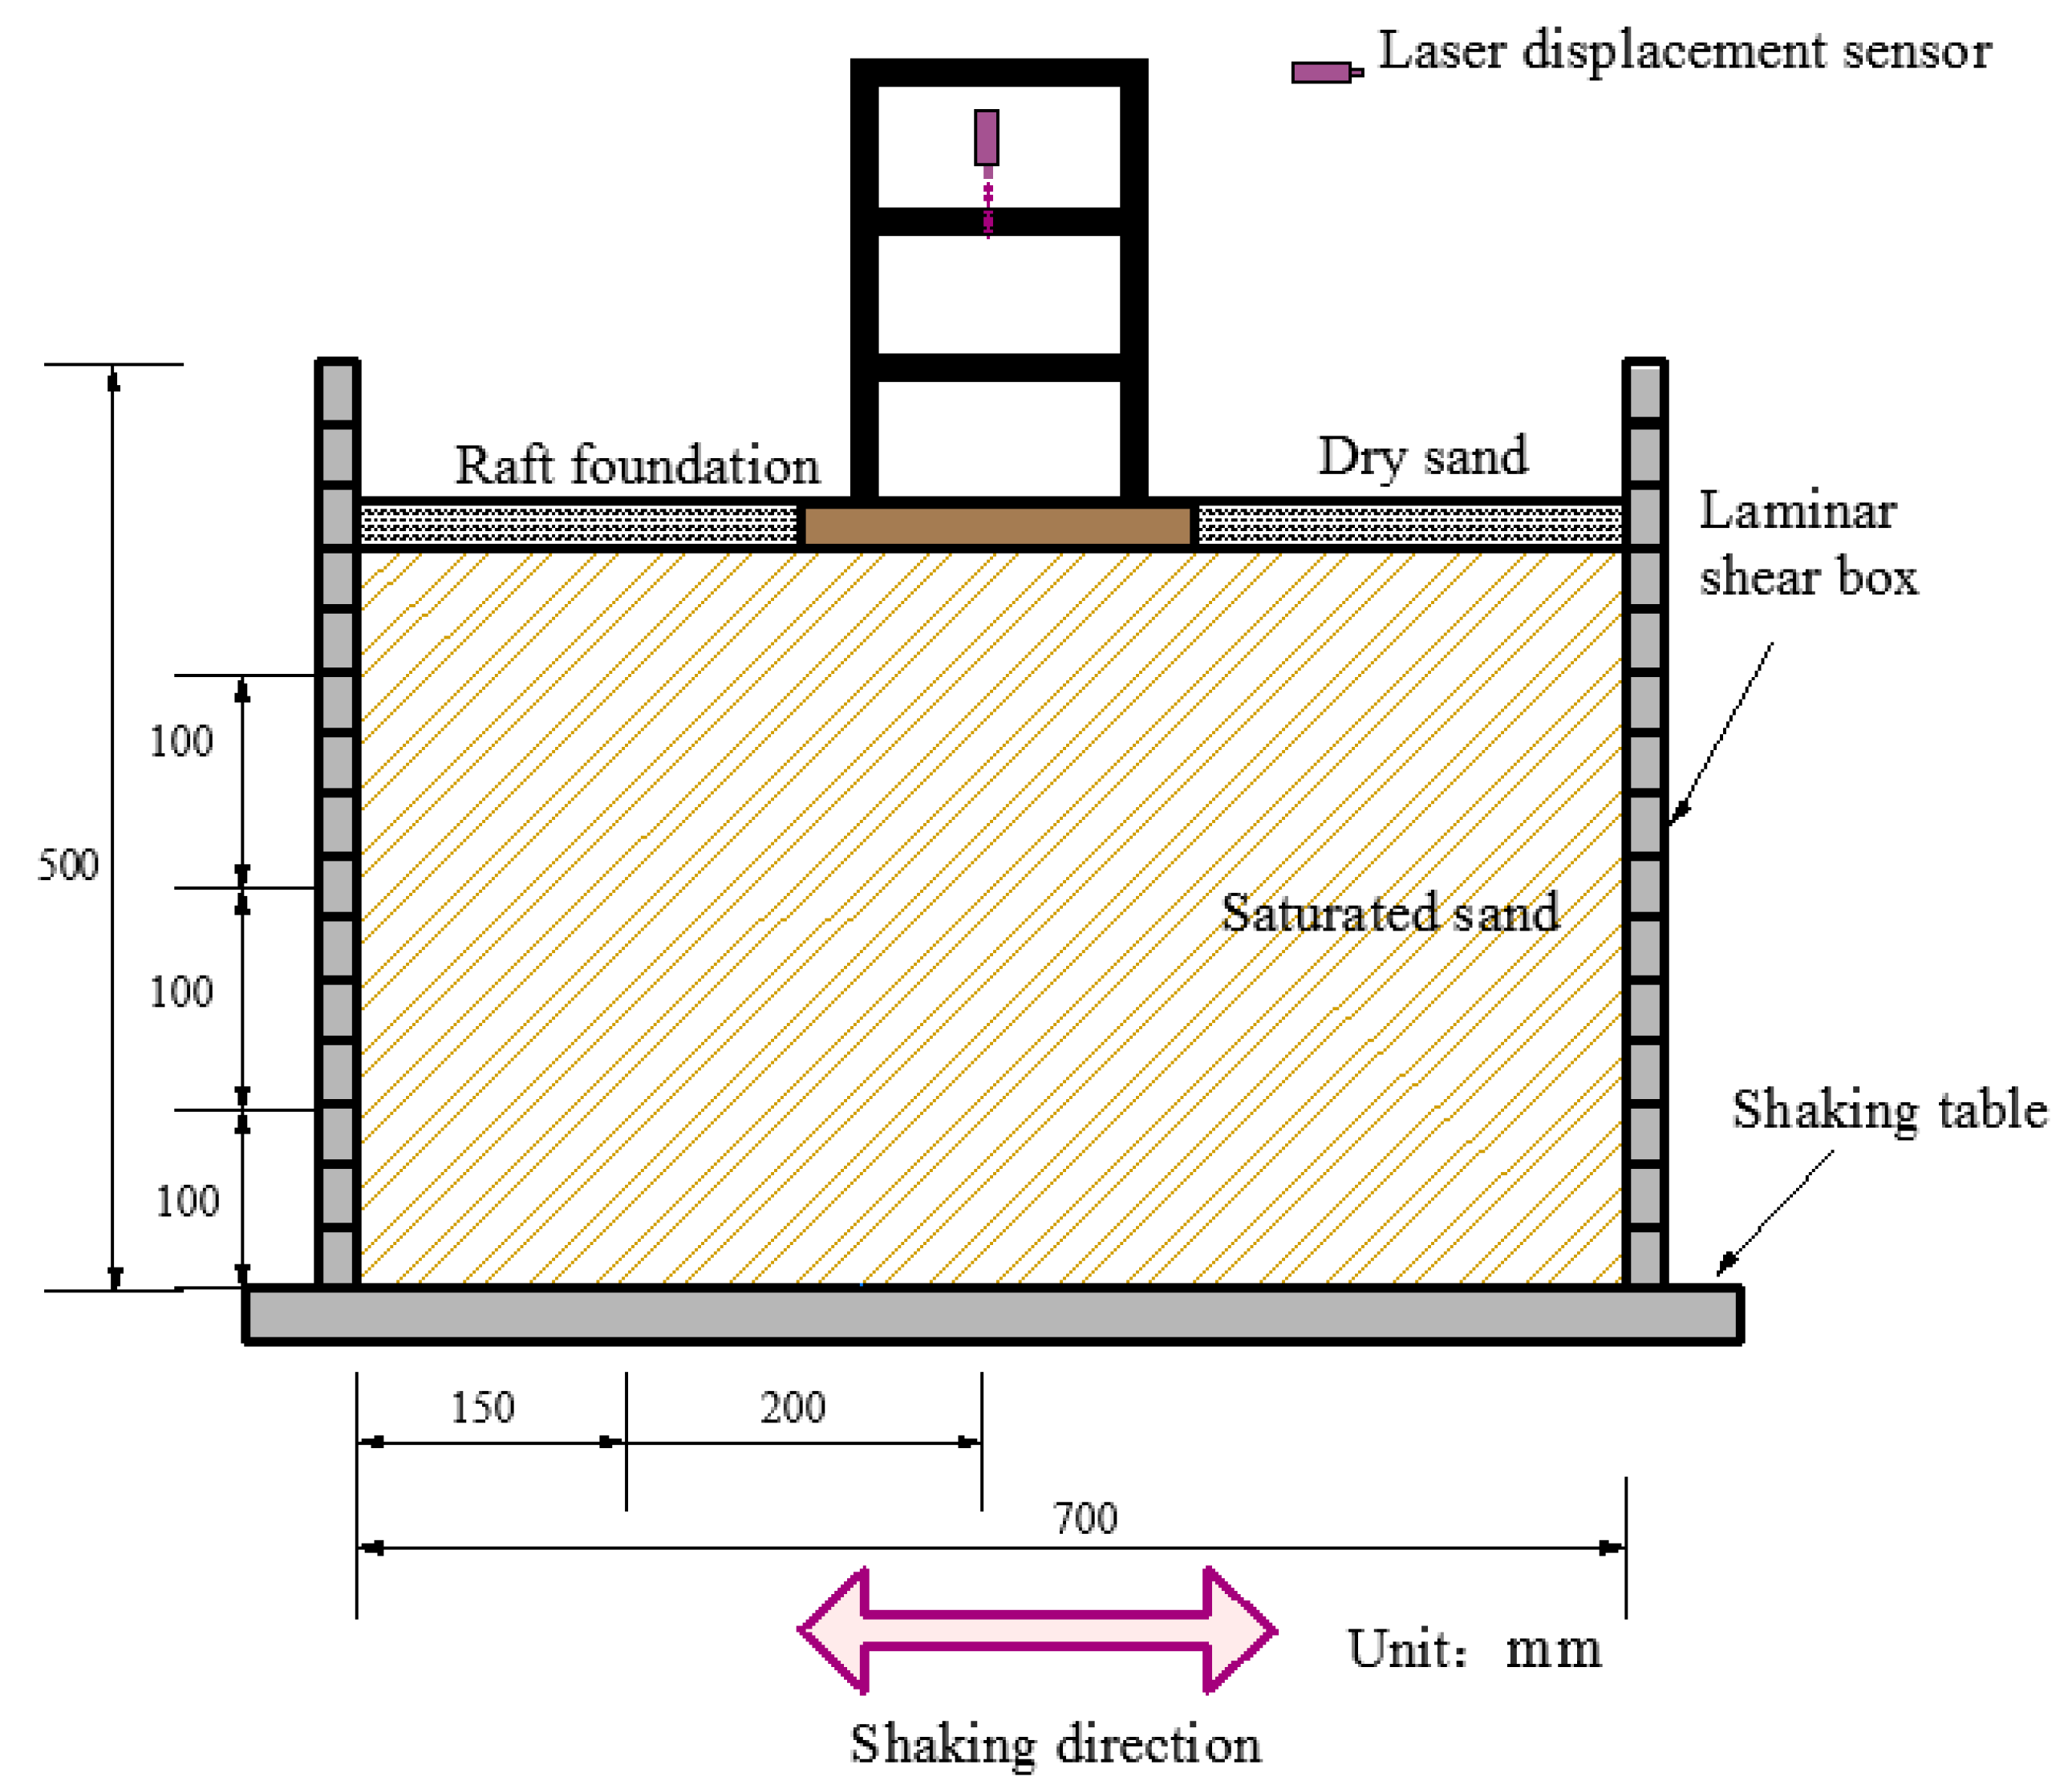
2.2.3. Shaker Table Tests
2.3. Experimental Scheme of Gas Generation Test
3. Results and Discussion
3.1. Standard Curve of the Nitrates and Nitrites
3.2. Control Method of Desaturation
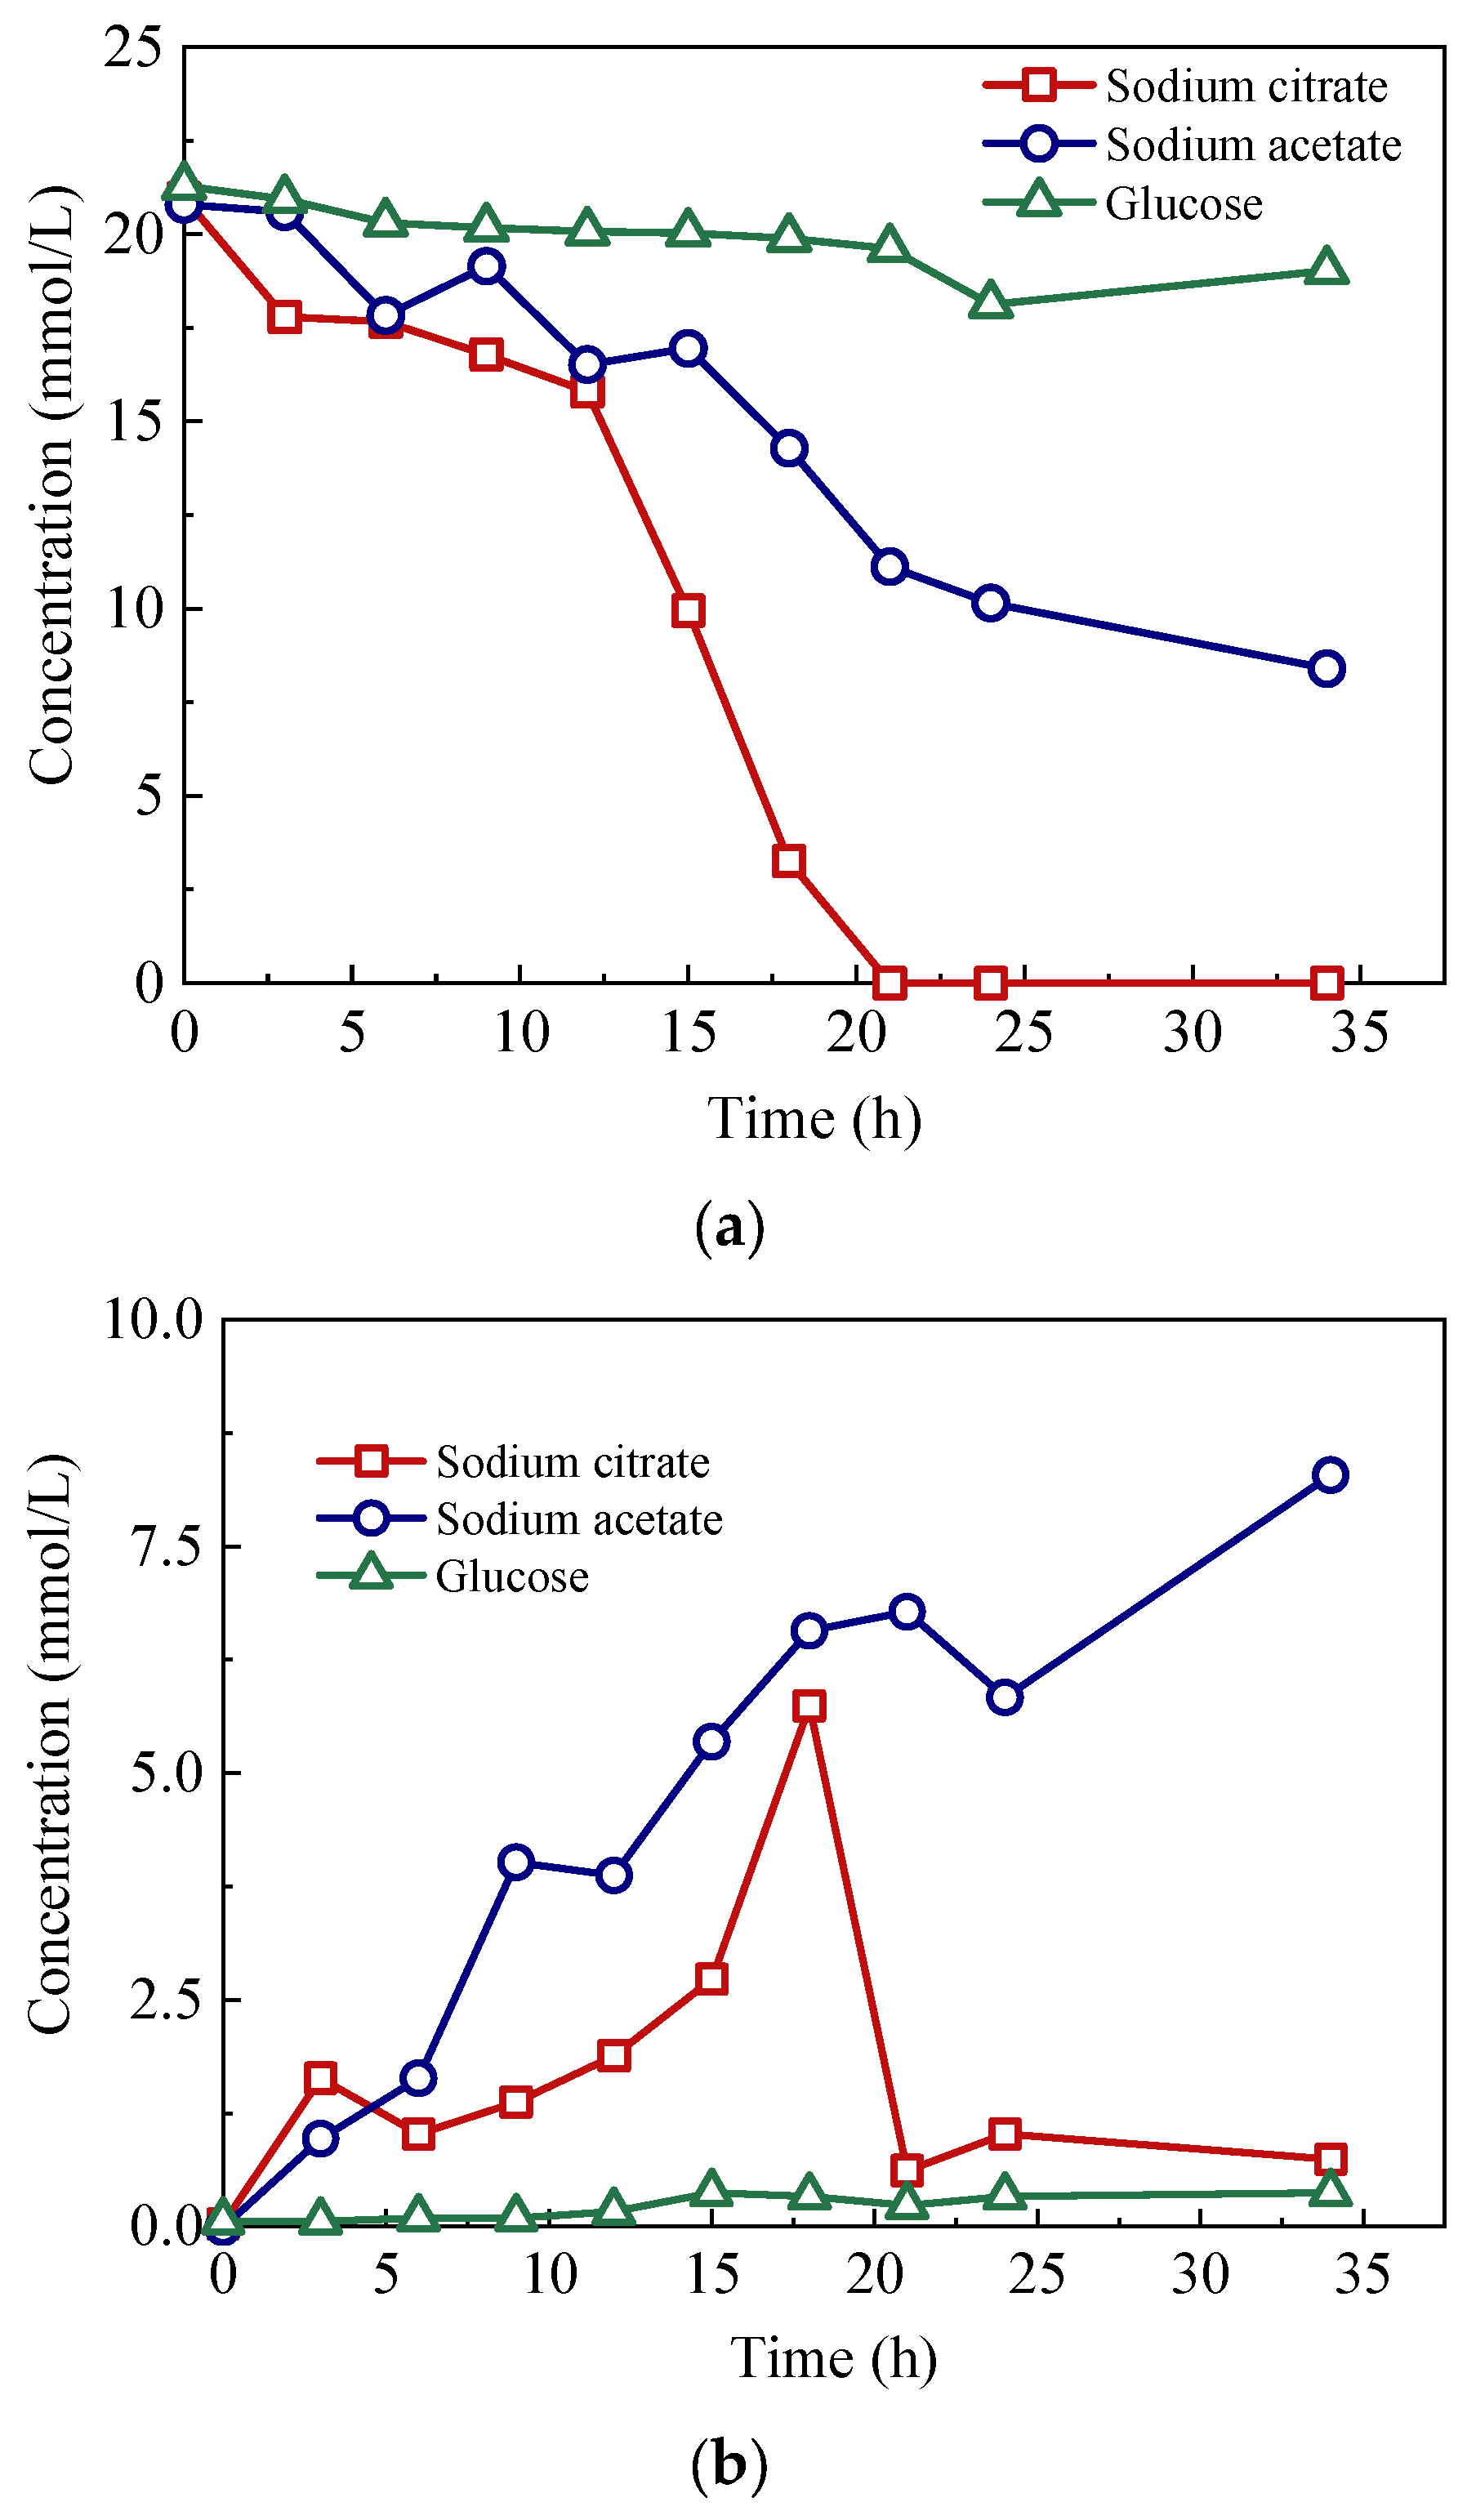
3.2.1. Carbon Source Optimization
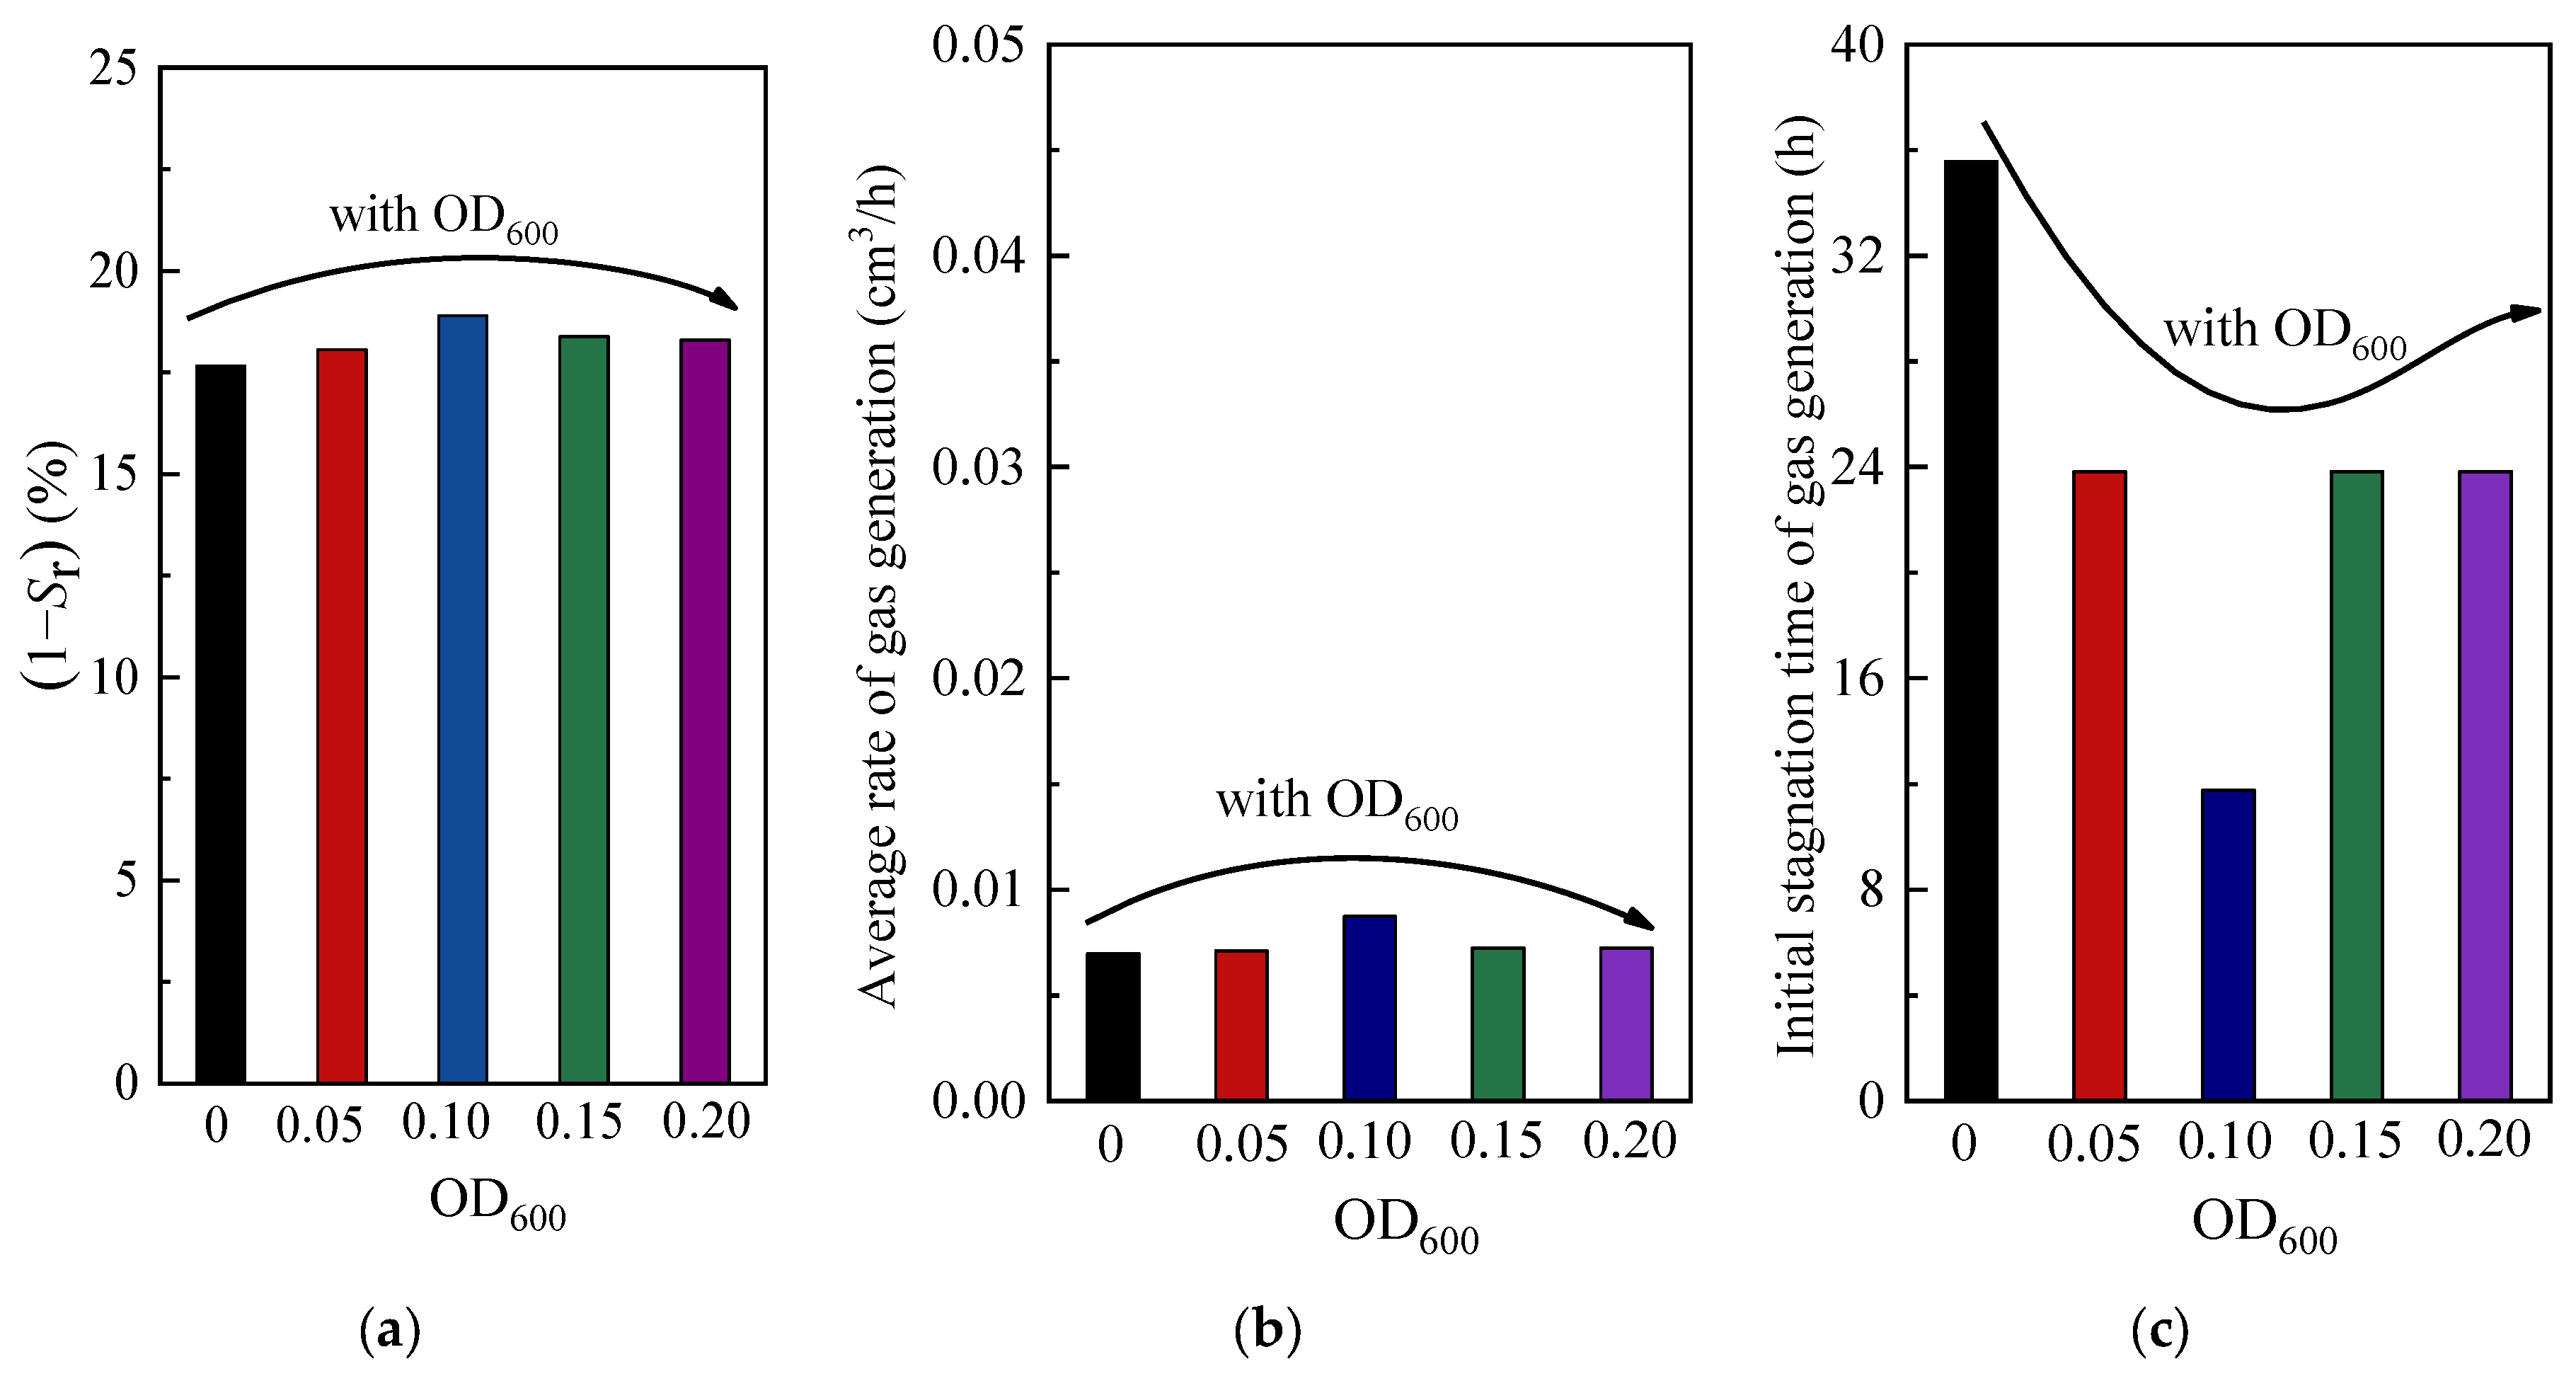
3.2.2. Bacterial Concentrations
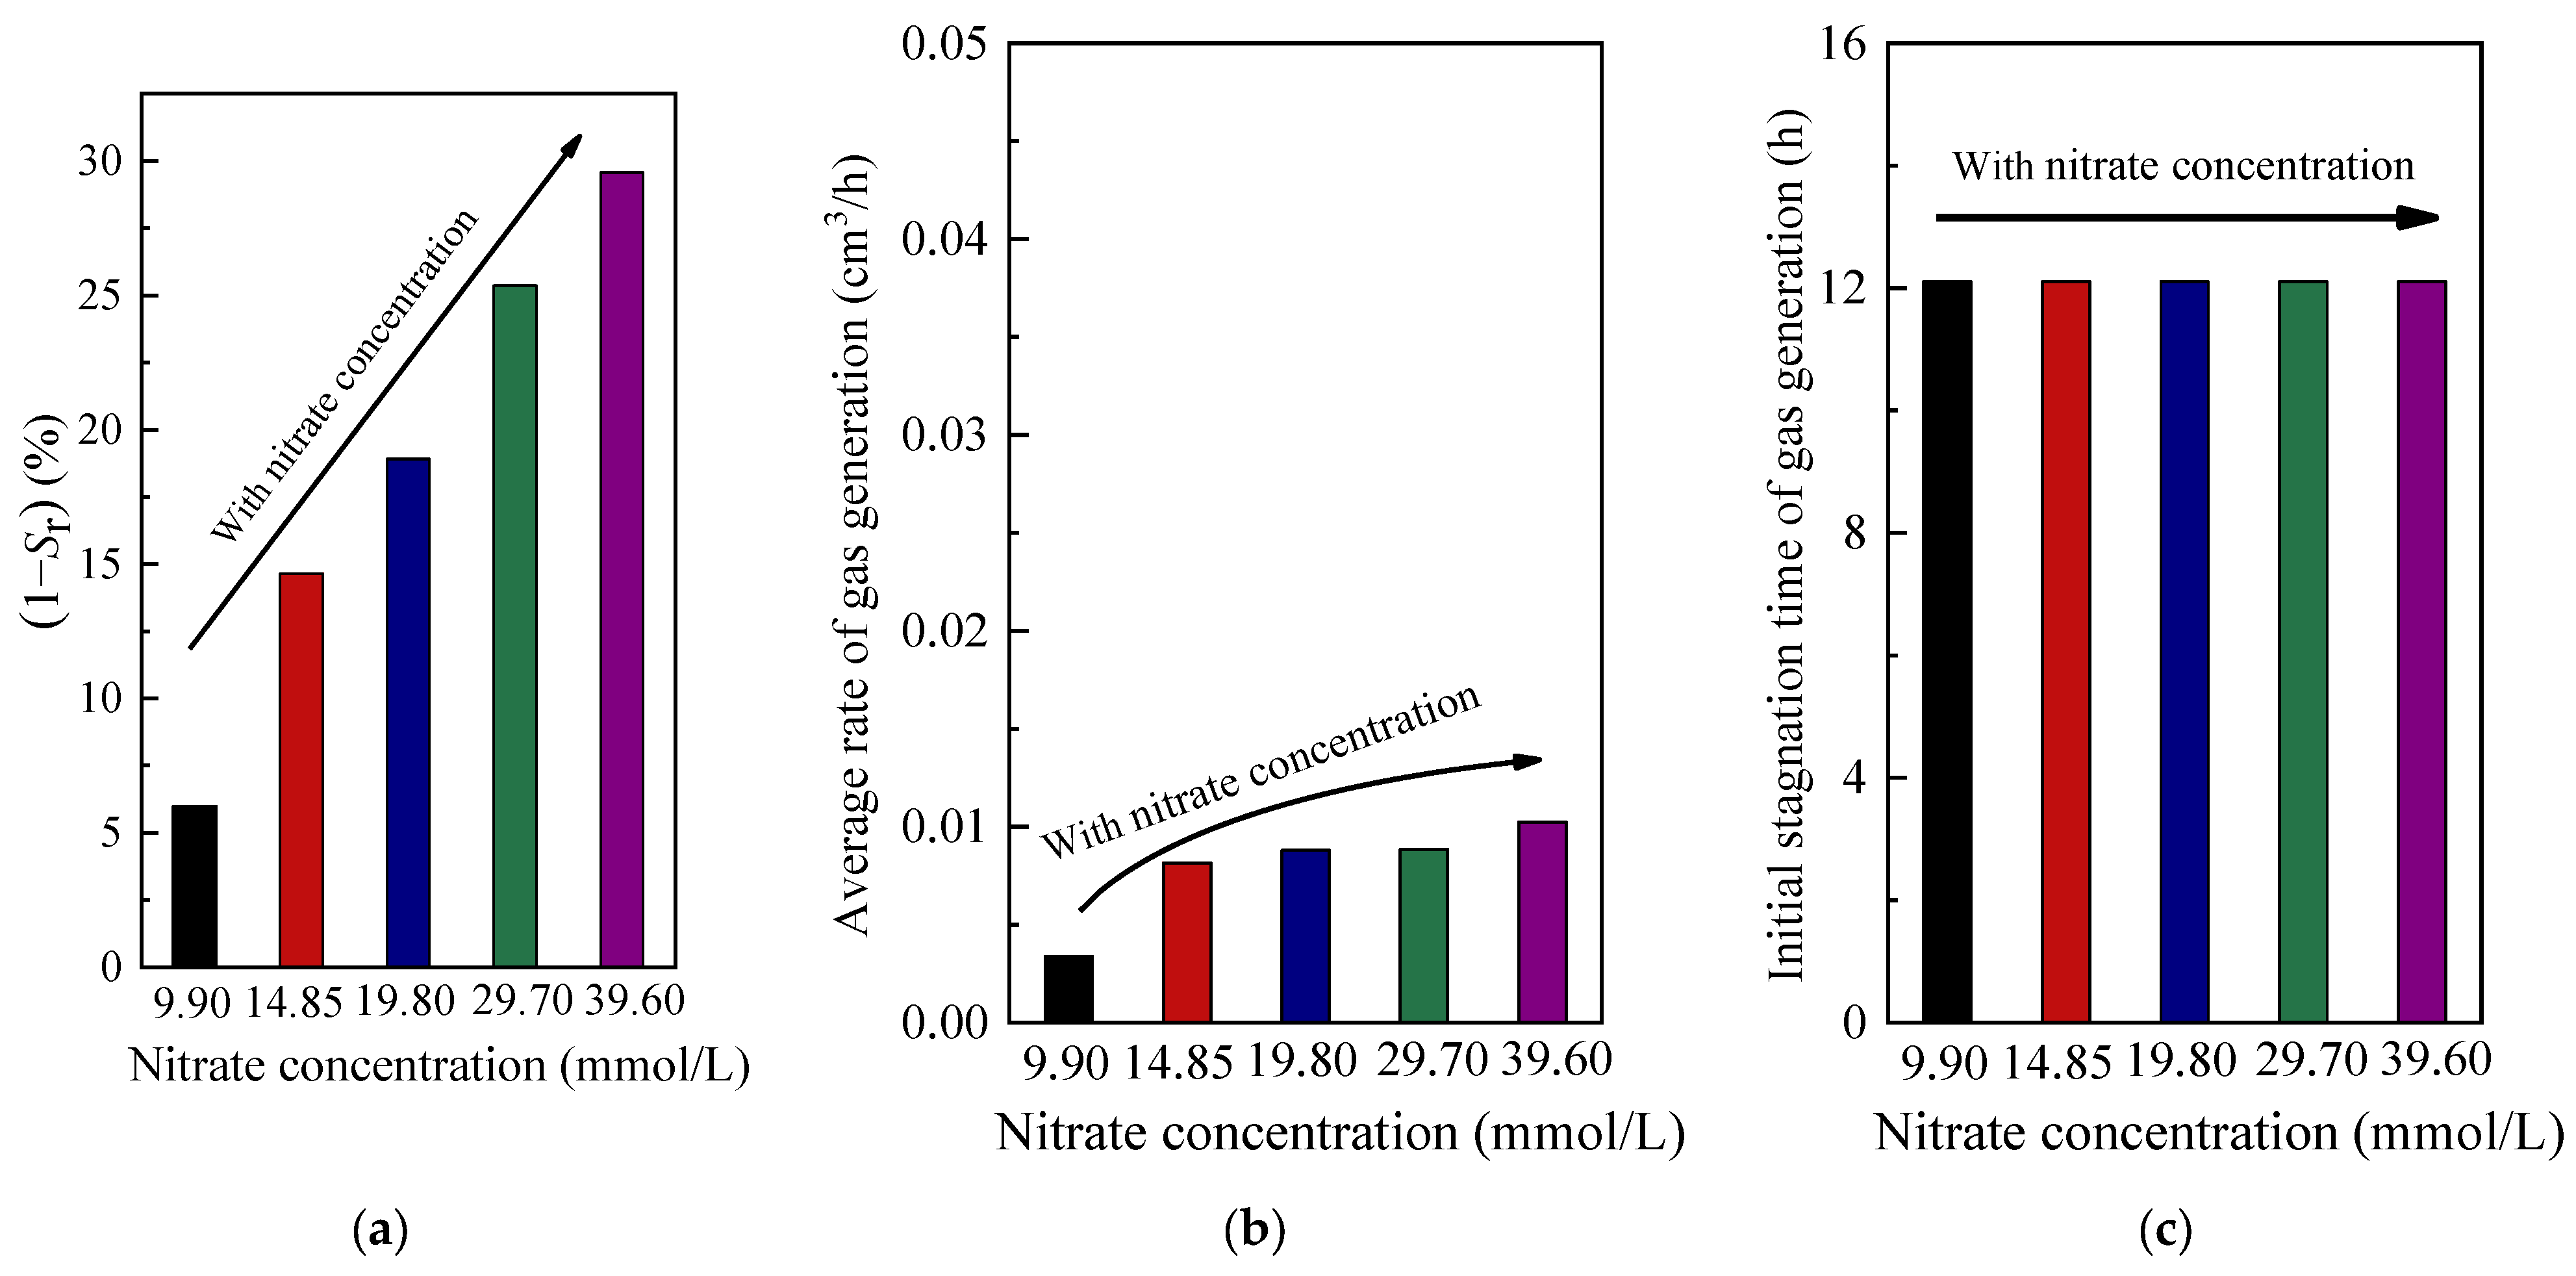
3.2.3. Nitrate Concentrations
3.3. Influencing Factors of the Degree of Saturation Reduction
3.3.1. Temperatures
3.3.2. pH
3.3.3. Soils
3.4. Advantages of Pseudomonas stutzeri
3.5. Mitigate Structure Settlement Using Pseudomonas stutzeri Biogas
4. Conclusions
- (1)
- The removal rate of nitrate reached 100%. Also, the bacteria proliferate quickly and have a strong denitrification effect when sodium citrate is used as a carbon source. The best carbon source in the denitrification process of Pseudomonas stutzeri is sodium citrate. When the OD600 of the bacterial suspension was 0.1, the fastest gas generation of microorganisms in the soil pore was observed. In addition, the degree of saturation reduction was the maximum, which indicated that the best bacterial concentration of the bacterium suspension can be used as 0.1.
- (2)
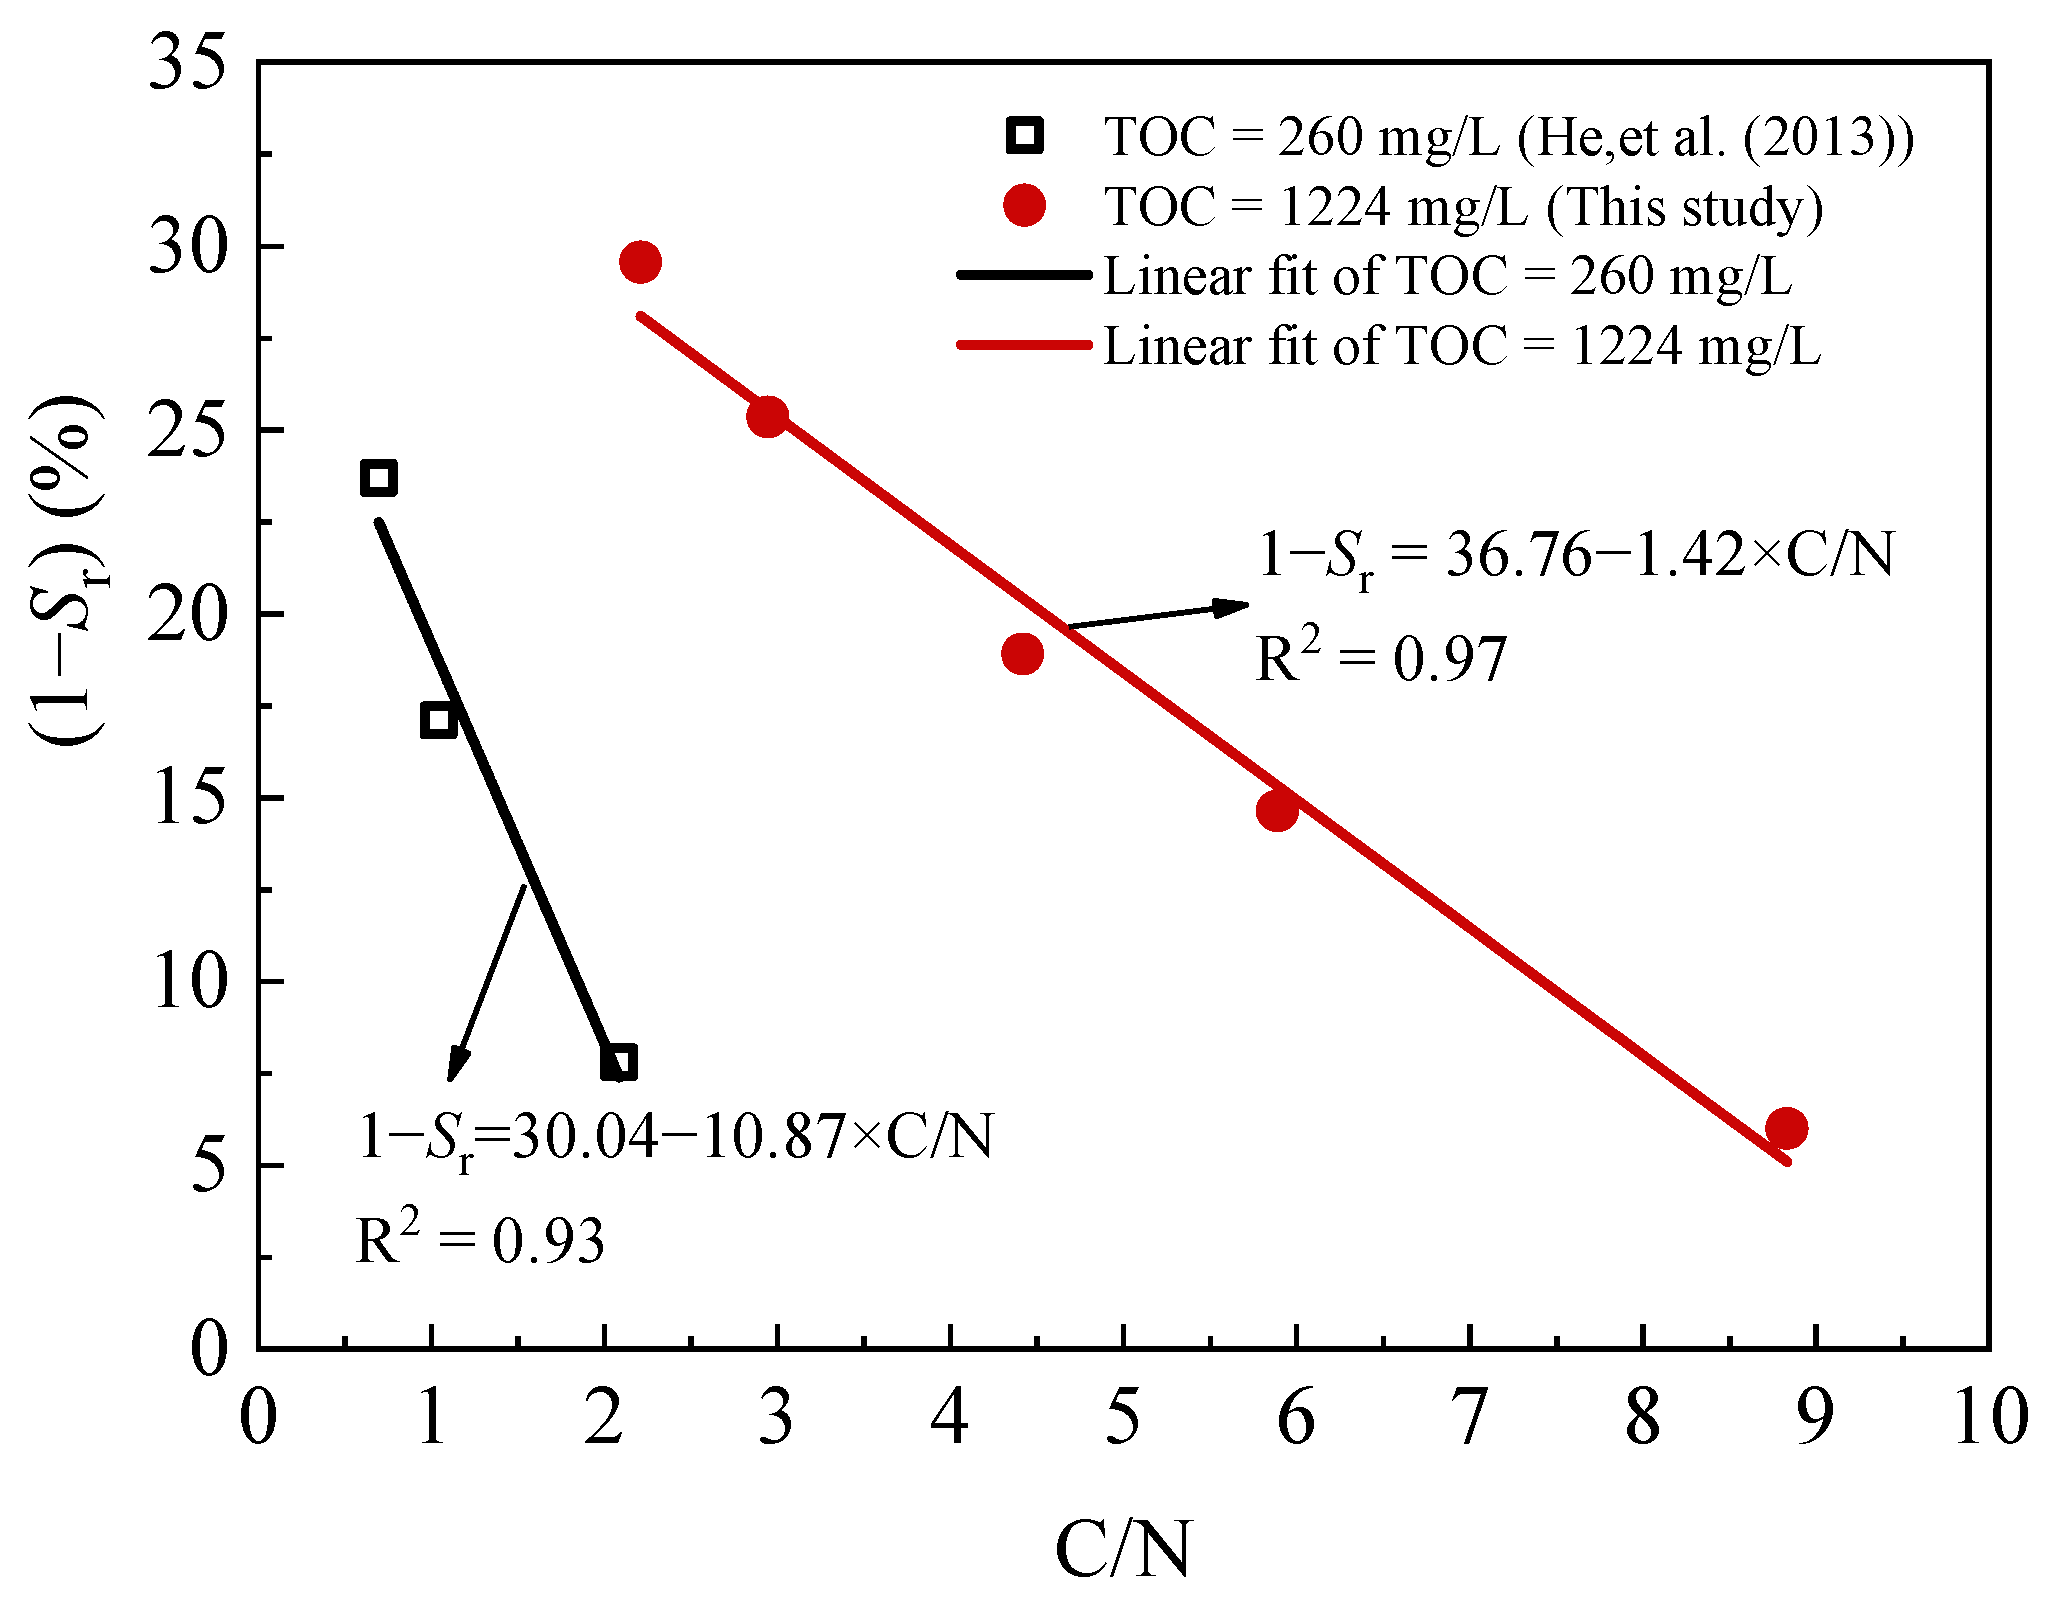
- The C/N of the bacterium suspension was used as the index to control the degree of saturation reduction. According to the results of the experiment, the degree of saturation reduction exhibited a good empirical linear relationship with the C/N.
- (3)
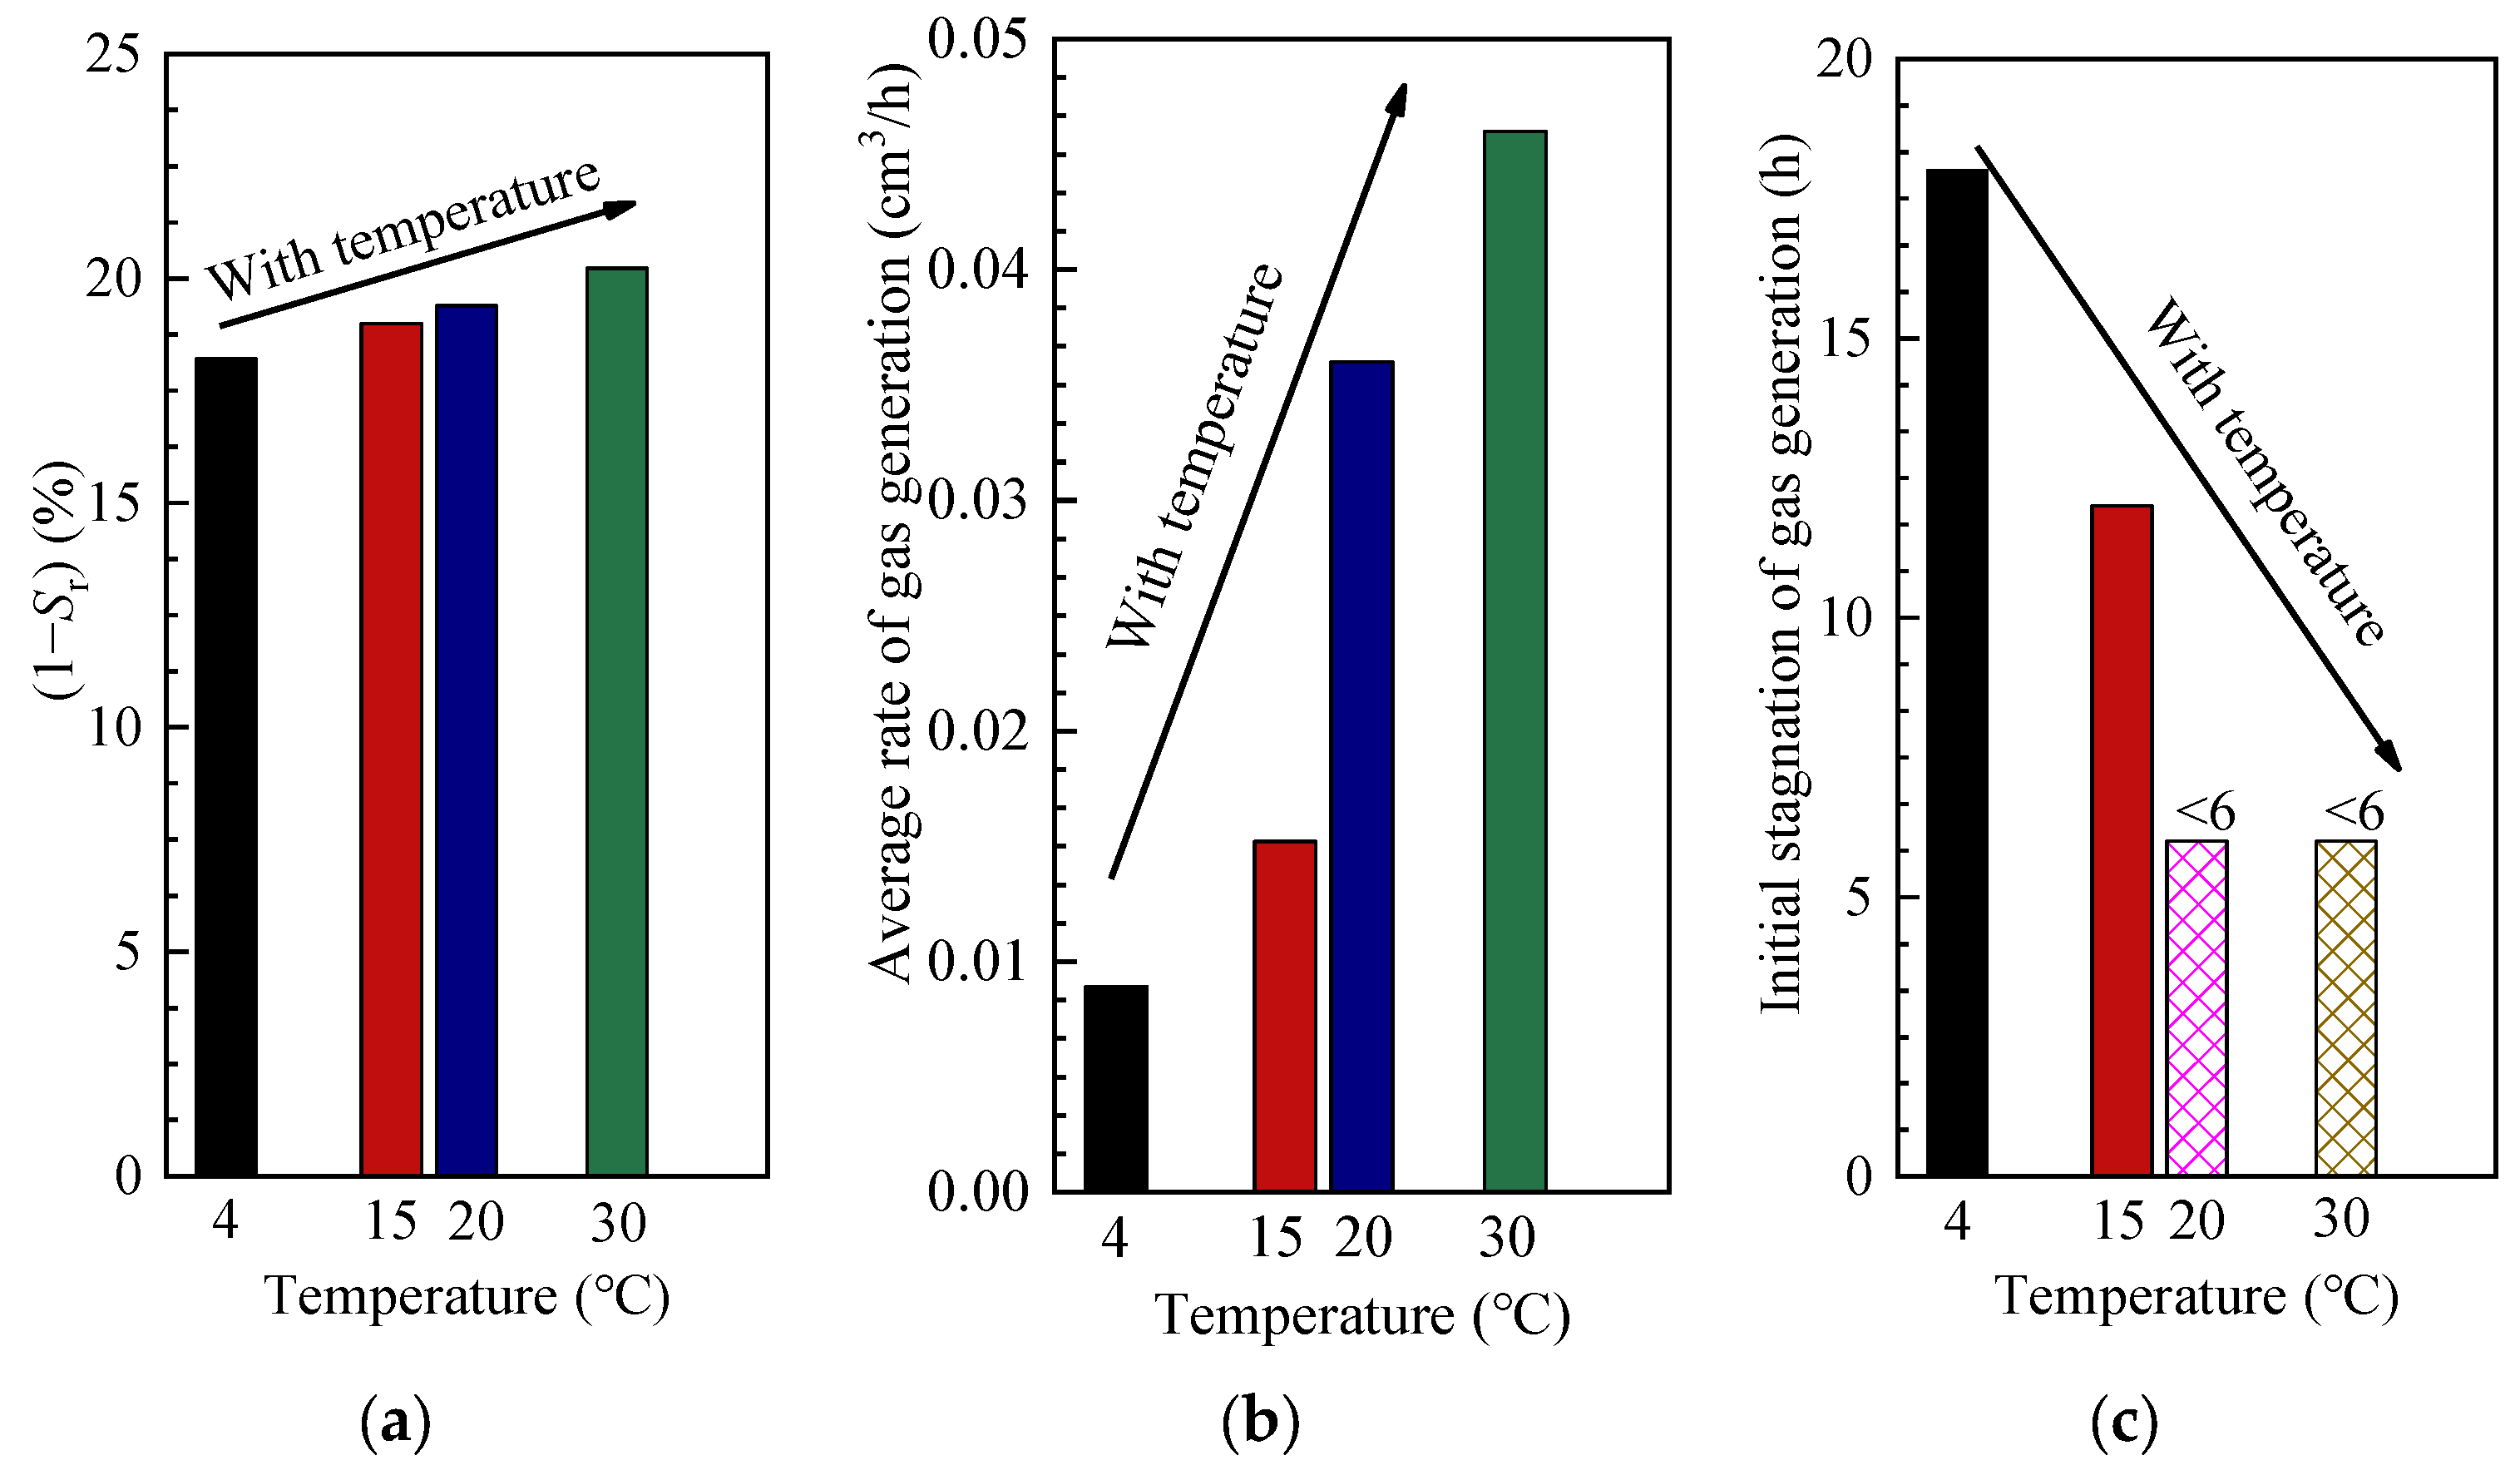
- The final saturation of the samples increased with the slight rise in temperature. The average gas generation rate of bacteria in the sand increased significantly with the increase in temperature. When the temperatures were 15 °C and 4 °C, the bacteria experienced initial stagnation periods of 12 and 18 h during gas generation, respectively. The optimum temperature of this method was between 20 °C and 30 °C.
- (4)
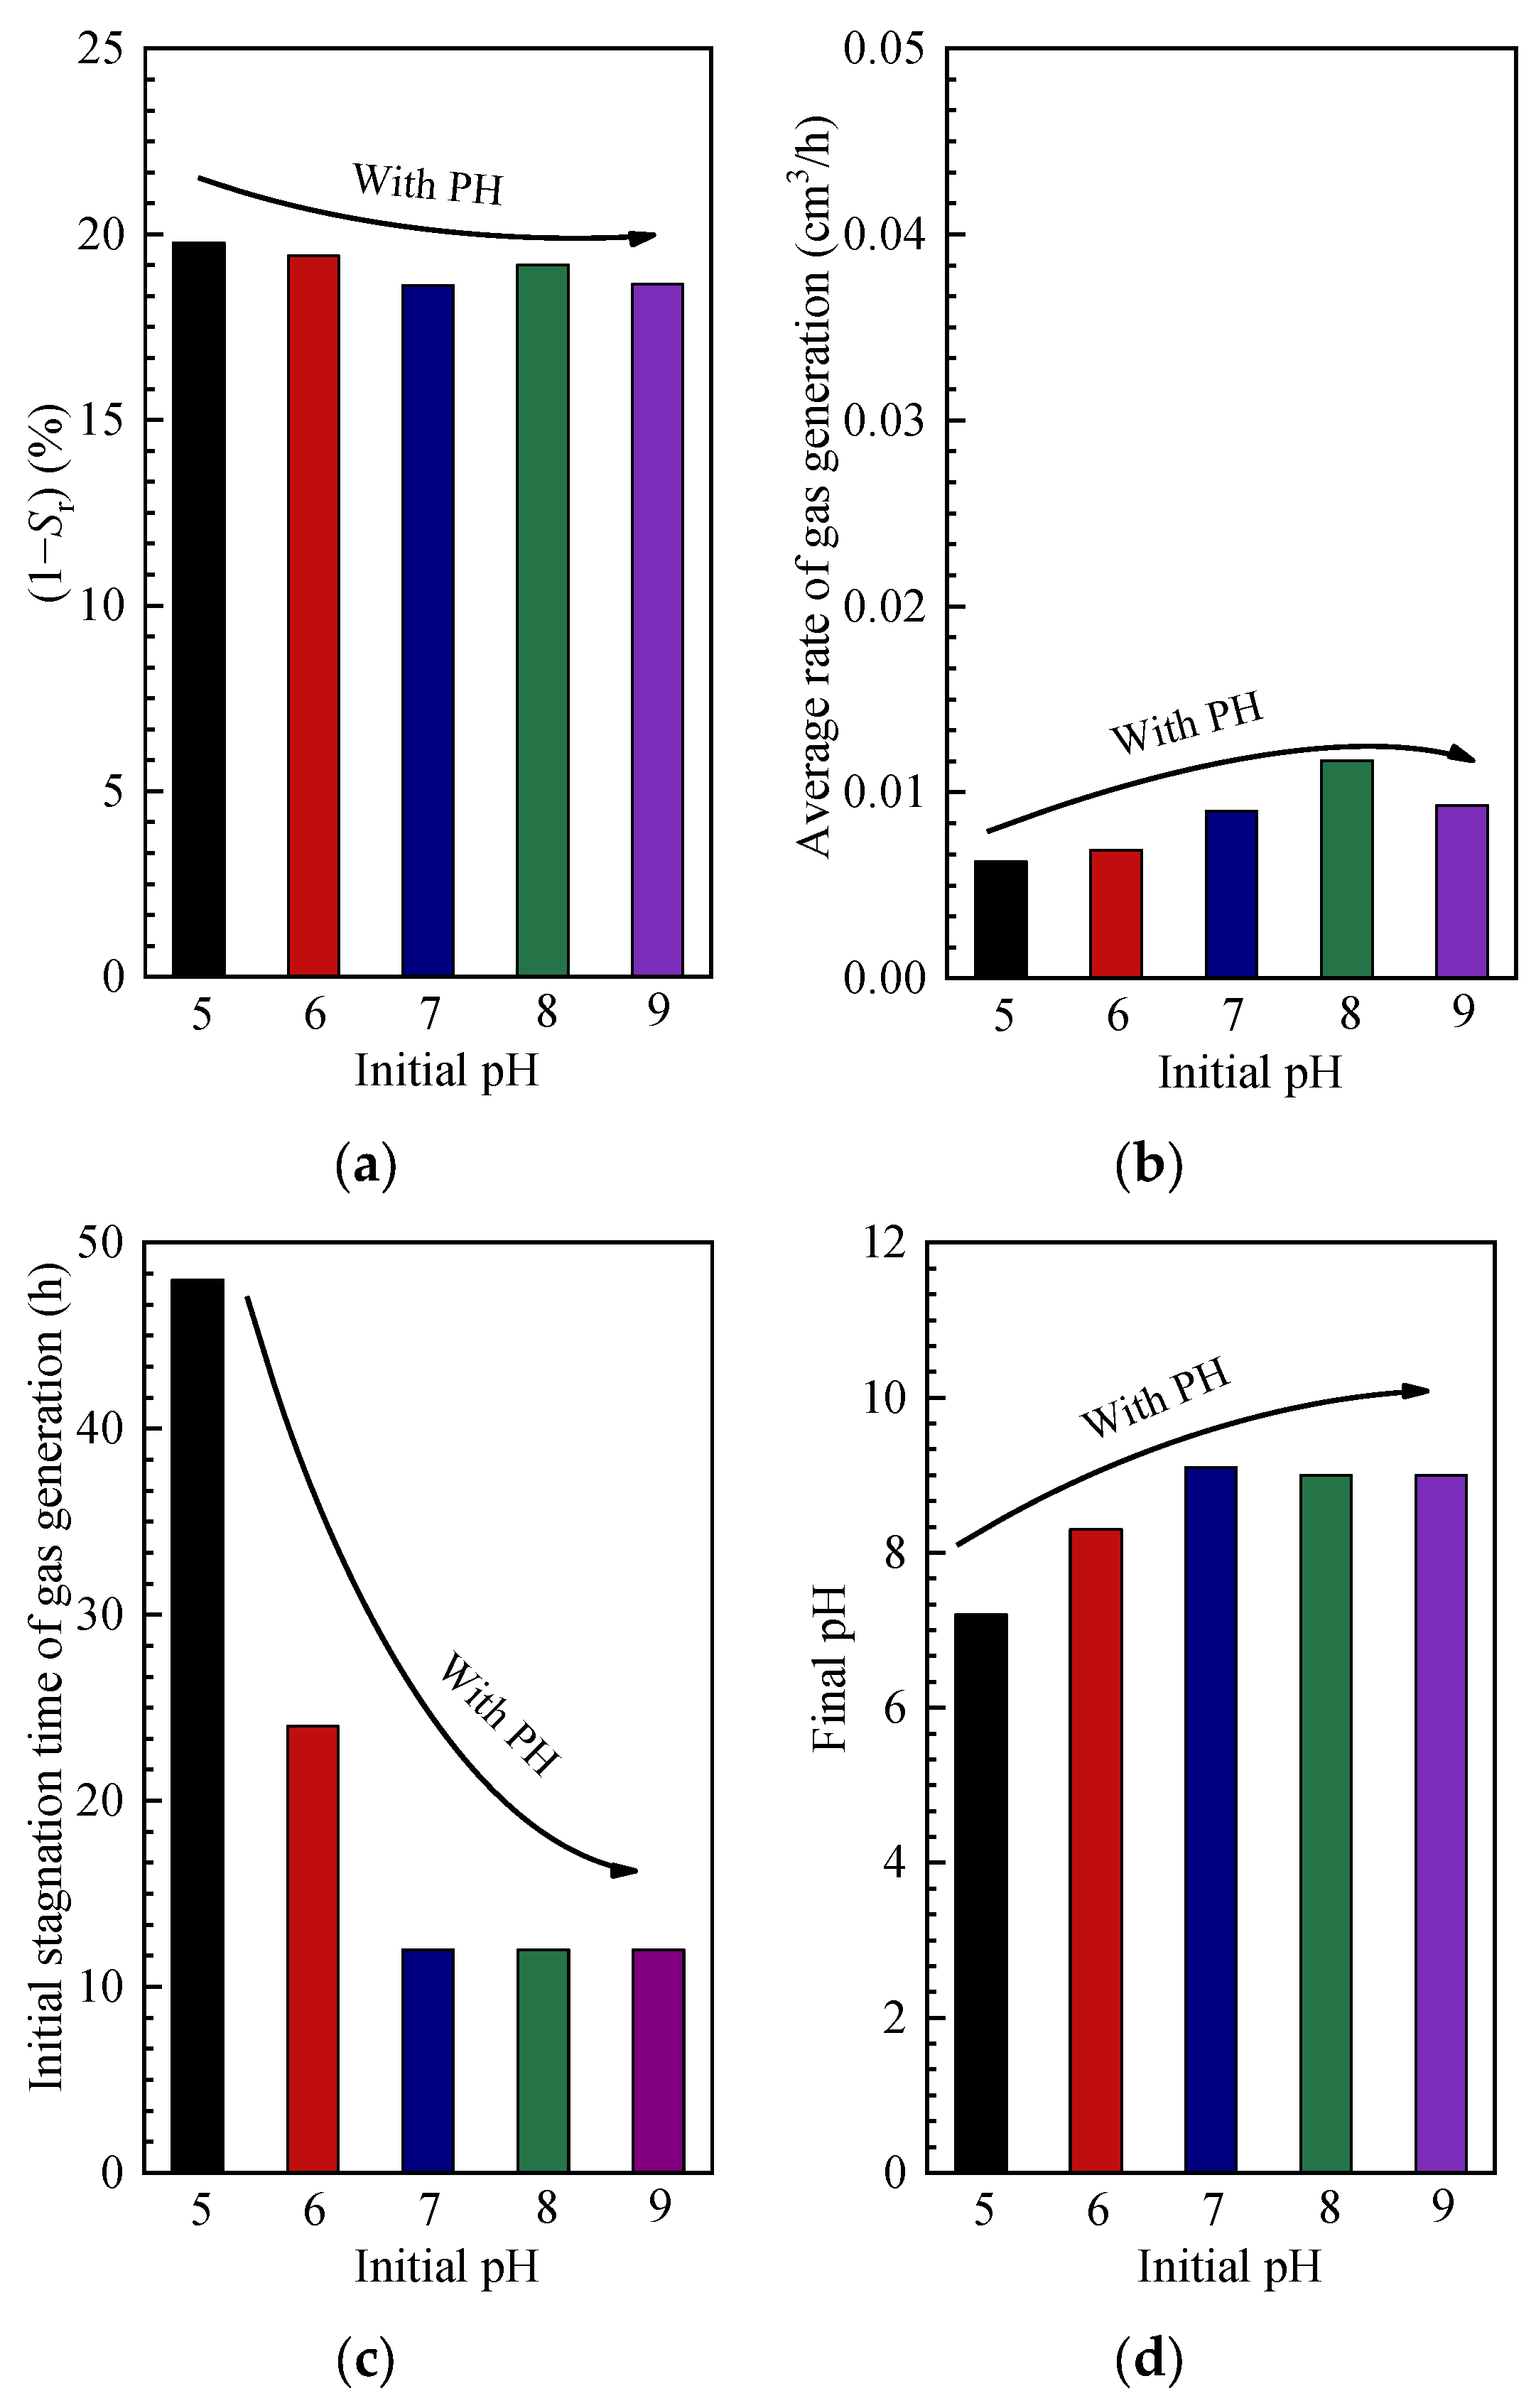
- The average gas generation rate decreased as the pH decreased. The initial stagnation of gas generation is 48 h when the value of pH is 5. It is only half when pH is 6. In neutral and alkaline conditions, the initial stagnation period is a quarter of that of acidic conditions. The most suitable pH was between 7 and 9.
- (5)
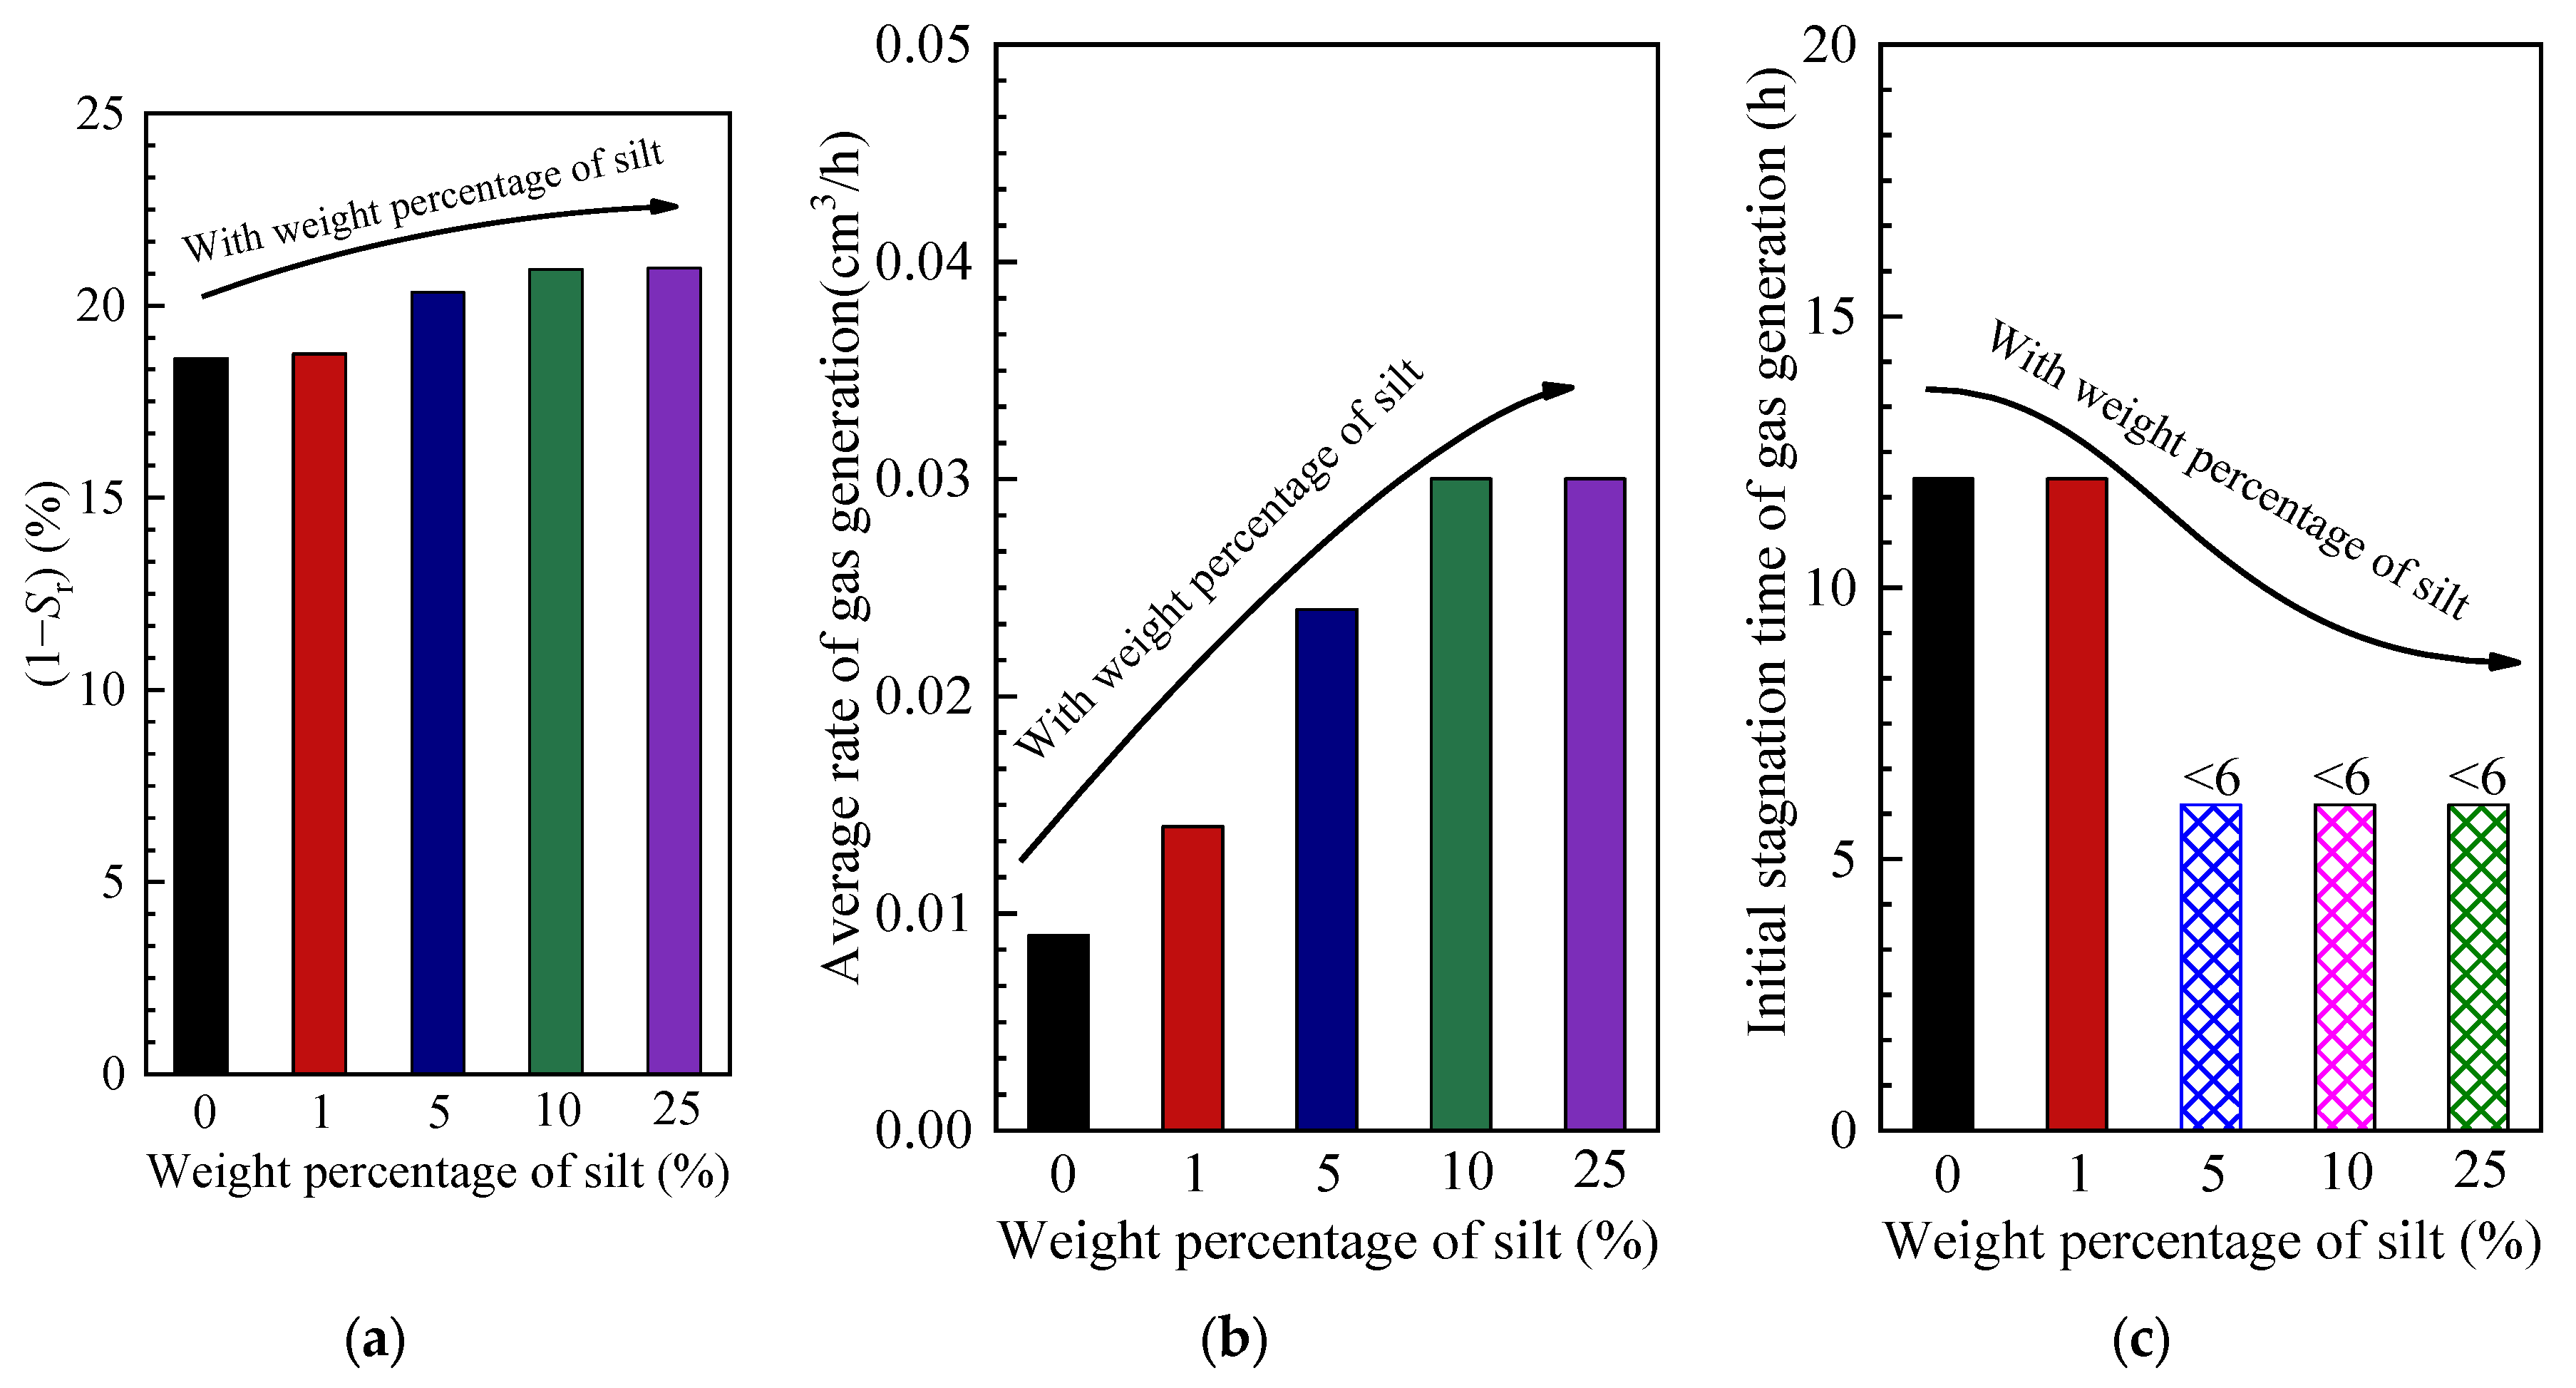
- The heterogeneous nucleation sites also increased with the increase in the silt content of sand, which resulted in a low supersaturating threshold in the fluid of the microbial gas, thus promoting denitrification. Therefore, the changes in the silt content in the sand with the change in the average gas generation rate and the initial stagnation period were significant, but the degree of saturation reduction had increased slightly.
- (6)
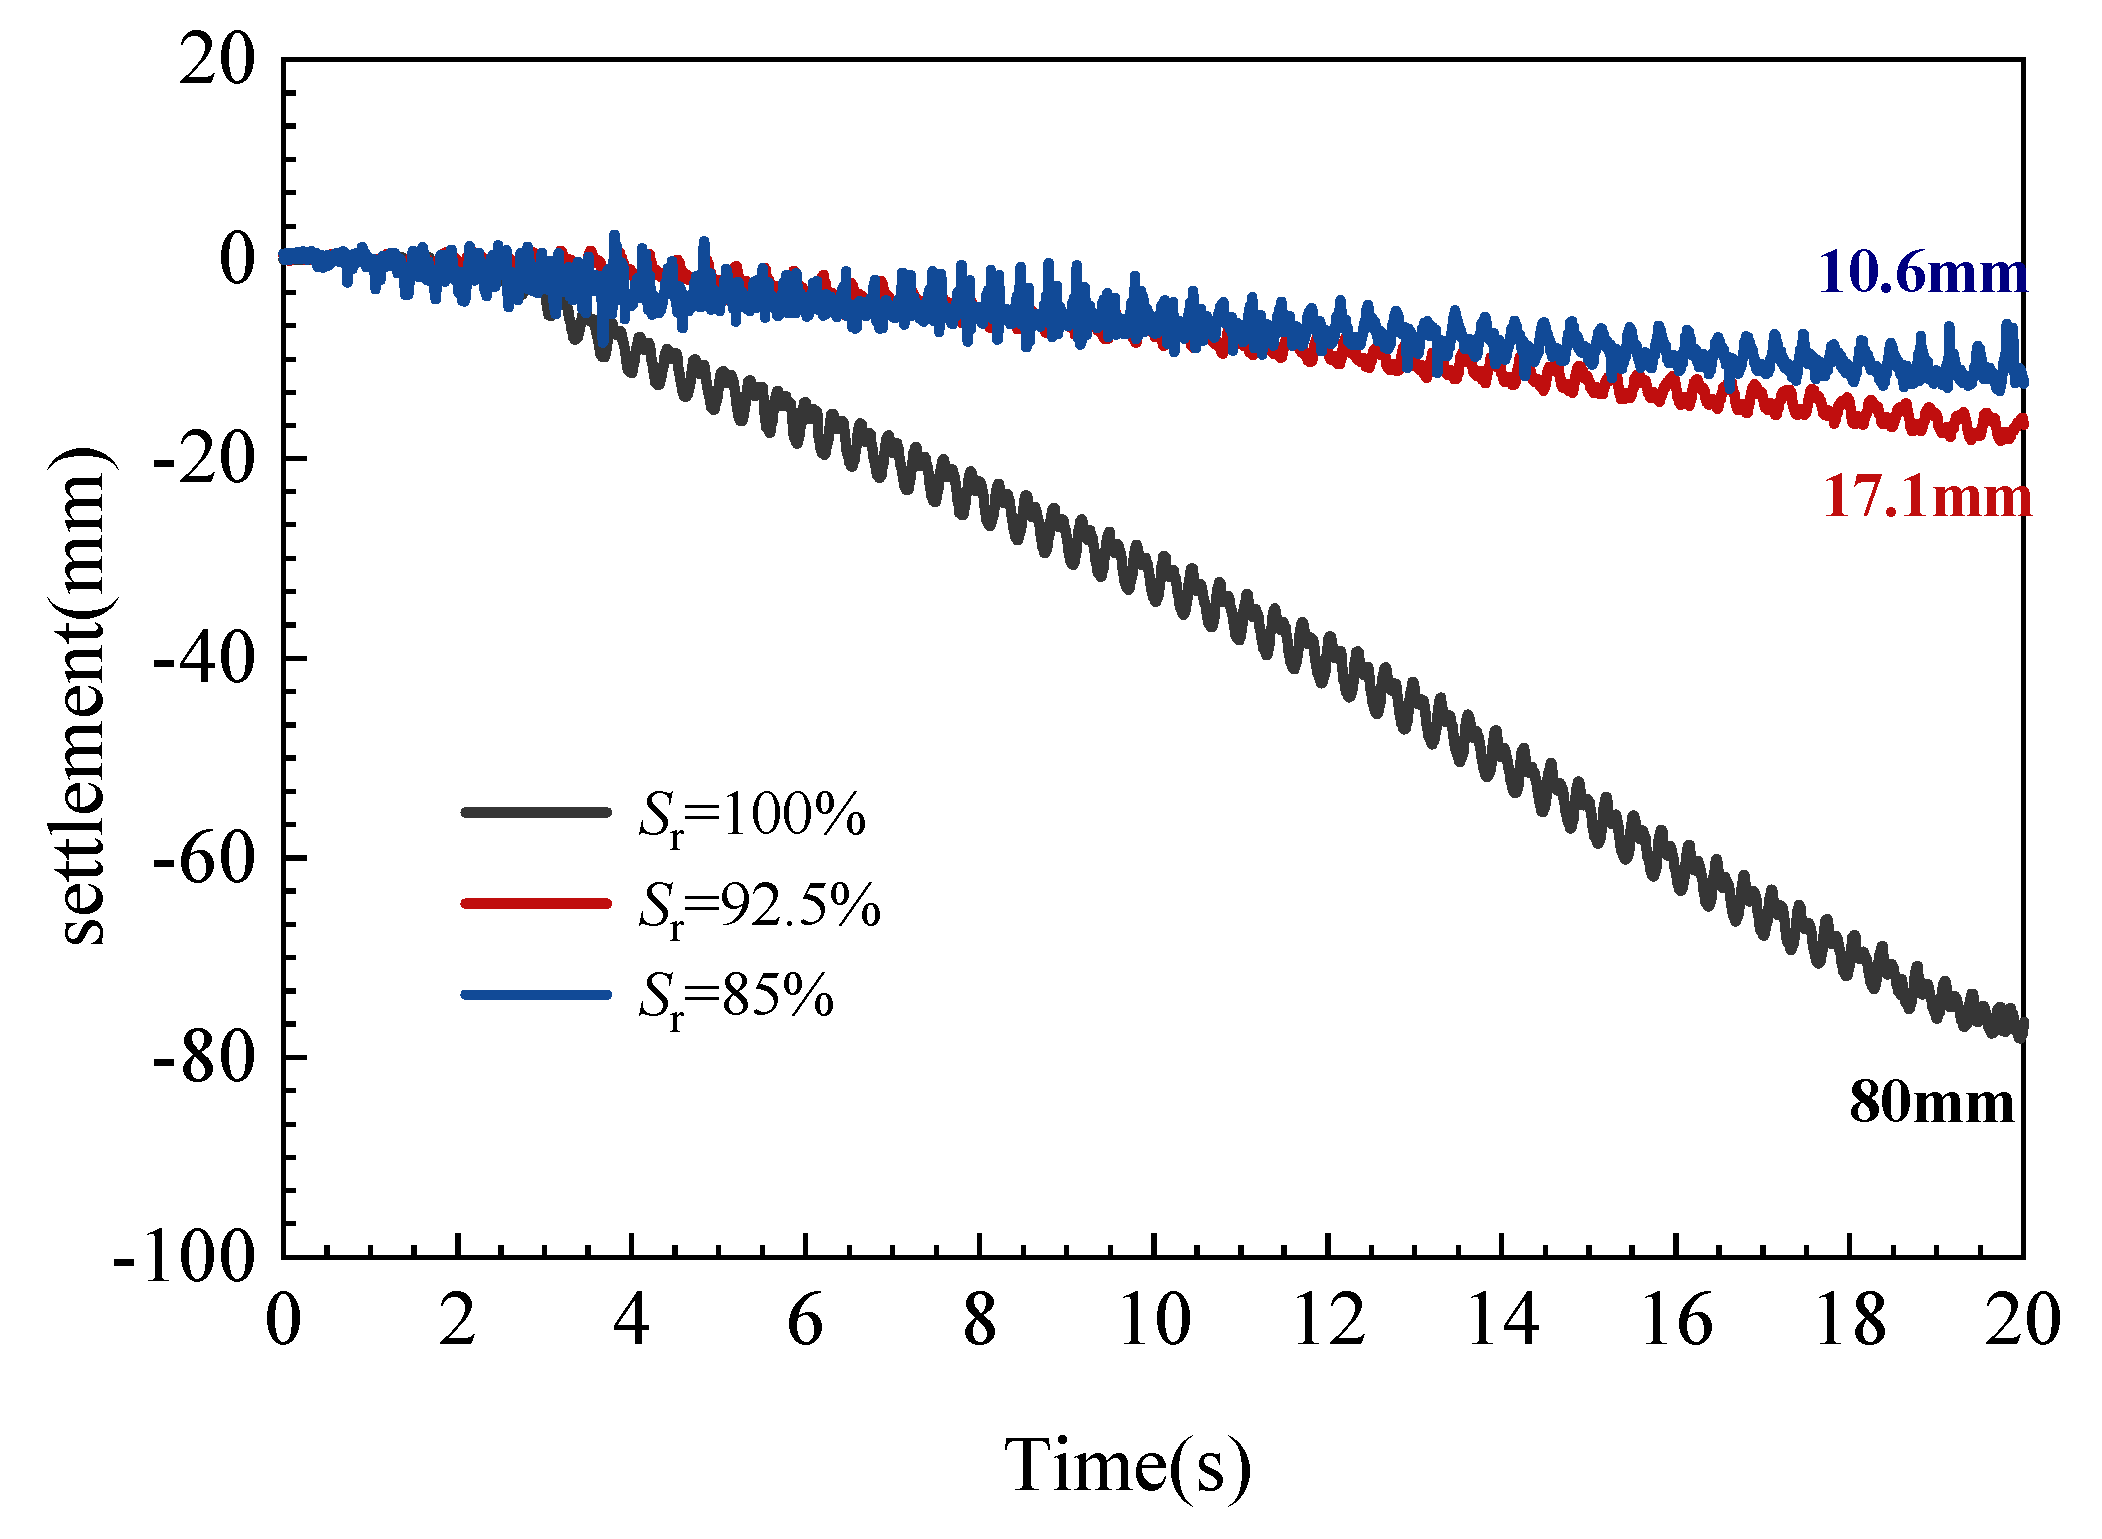
- The settlement after Pseudomonas stutzeri biogas desaturation was greatly reduced. The settlement of saturation of 92.5% sand foundation reached 17.1 mm, and the 85% saturation was only 10.6 mm.
Author Contributions
Funding
Data Availability Statement
Conflicts of Interest
References
- Zhu, Z.; Dupla, J.C.; Canou, J.; Foerster, E. Experimental study of liquefaction resistance: Effect of non-plastic silt content on sand matrix. Eur. J. Environ. Civ. Eng. 2022, 26, 2671–2689. [Google Scholar] [CrossRef]
- Zhu, Z.; Zhang, F.; Peng, Q.; Dupla, J.C.; Canou, J.; Cumunel, G.; Foerster, E. Assessment of the loading waveform on the cyclic liquefaction resistance with Hostun 31 sand. Soil Dyn. Earthq. Eng. 2021, 150, 106919. [Google Scholar] [CrossRef]
- Wu, L.; Cheng, W.; Zhu, Z. Fractional-Order Elastoplastic Modeling of Sands Considering Cyclic Mobility. J. Mar. Sci. Eng. 2021, 9, 354. [Google Scholar] [CrossRef]
- Zimmaro, P.; Nweke, C.C.; Hernandez, J.L.; Hudson, K.S.; Hudson, M.B.; Stewart, J.P. Liquefaction and Related Ground Failure from July 2019 Ridgecrest Earthquake Sequence. Bull. Seismol. Soc. Am. 2020, 110, 1549–1566. [Google Scholar] [CrossRef]
- Simons, M.; Minson, S.E.; Sladen, A.; Ortega, F.; Jiang, J.L.; Owen, S.E.; Meng, L.S.; Ampuero, J.P.; Wei, S.J.; Chu, R.S. The 2011 magnitude 9.0 Tohoku-Oki earthquake: Mosaicking the megathrust from seconds to centuries. Science 2011, 6036, 1421–1425. [Google Scholar] [CrossRef]
- Asuda, S.; Harada, K.; Ishikawa, K.; Kanemaru, Y. Characteristics of liquefaction in Tokyo Bay area by the 2011 Great East Japan Earthquake. Soils Found. 2012, 52, 793–810. [Google Scholar] [CrossRef]
- Montgomery, J.; Wartman, J.; Reed, A.N.; Gallant, A.P.; Hutabarat, D.; Mason, H.B. Field Reconnaissance Data from GEER Investigation of the 2018 MW 7.5 Palu-Donggala Earthquake. Data Brief 2021, 34, 106742. [Google Scholar] [CrossRef]
- Bhattacharya, S.; Hyodo, M.; Goda, K. Liquefaction of sand in the Tokyo Bay area from the 2011 Tohoku (Japan) earthquake. Soil Dyn. Earthq. Eng. 2011, 31, 1618–1628. [Google Scholar] [CrossRef]
- Ghani, S.; Kumari, S. Liquefaction hazard mitigation using computational model considering sustainable development. In Risk, Reliability and Sustainable Remediation in the Field of Civil and Environmental Engineering; Elsevier: Amsterdam, The Netherlands, 2022; pp. 183–196. [Google Scholar]
- Ghani, S.; Kumari, S. Reliability analysis for liquefaction risk assessment for the city of Patna, India using hybrid computational modeling. J. Geol. Soc. India 2022, 98, 1395–1406. [Google Scholar] [CrossRef]
- Ghani, S.; Sapkota, S.C.; Singh, R.K.; Bardhan, A.; Asteris, P.G. Modelling and validation of liquefaction potential index of fine-grained soils using ensemble learning paradigms. Soil Dyn. Earthq. Eng. 2024, 177, 108399. [Google Scholar] [CrossRef]
- Ghani, S.; Kumari, S. Prediction of soil liquefaction for railway embankment resting on fine soil deposits using enhanced machine learning techniques. J. Earth Syst. Sci. 2023, 132, 145. [Google Scholar] [CrossRef]
- Hossain, Z.; Abedin, M.Z.; Rahman, M.R.; Haque, N.; Jadid, R. Effectiveness of sand compaction piles in improving loose cohesionless soil. Transp. Geotech. 2020, 26, 100451. [Google Scholar] [CrossRef]
- Sadrekarimi, A.; Ghalandarzadeh, A. Evaluation of gravel drains and compacted sand piles in mitigating liquefaction. Proc. Inst. Civ. Eng. Ground Improv. 2005, 9, 91–104. [Google Scholar] [CrossRef]
- Zhao, L.; Chen, Y.; Chen, W.; Wang, J.; Ren, C. The performance of T-shaped deep mixed soil cement column-supported embankments on soft ground. Constr. Build. Mater. 2023, 369, 130578. [Google Scholar] [CrossRef]
- Yoshimi, Y.; Tanaka, K.; Tokimatsu, K. Liquefaction resistance of a partially saturated sand. Soils Found. 1989, 29, 157–162. [Google Scholar] [CrossRef] [PubMed]
- Okamura, M.; Takebayashi, M.; Nishida, K.; Fujii, N.; Jinguji, M.; Imasato, T.; Yasuhara, H.; Nakagawa, E. In-Situ desaturation test by air injection and its evaluation through field monitoring and multiphase flow simulation. J. Geotech. Geoenviron. Eng. 2011, 137, 643–652. [Google Scholar] [CrossRef]
- Okamura, M.; Teraoka, T. Shaking table tests to investigate soil desaturation as a liquefaction countermeasure. Seism. Perform. Simul. Pile Found. 2006, 145, 282–293. [Google Scholar]
- Yegian, M.K.; Eseller-Bayat, E.; Alshawabkeh, A.; Ali, S. Induced-partial saturation for liquefaction mitigation: Experimental investigation. J. Geotech. Geoenviron. Eng. 2007, 133, 372–380. [Google Scholar] [CrossRef]
- He, J.; Chu, J.; Wu, S. Mitigation of soil liquefaction using microbially induced desaturation. J. Zhejiang Univ. Sci. A 2016, 17, 577–588. [Google Scholar] [CrossRef]
- Tsukamoto, Y.; Kawabe, S.; Matsumoto, J.; Hagiwara, S. Cyclic resistance of two unsaturated silty sands against soil liquefaction. Soils Found. 2014, 54, 1094–1103. [Google Scholar] [CrossRef]
- Mele, L.; Tian, J.; Lirer, S.; Lora, A.; Koseki, J. Liquefaction resistance of unsaturated sands: Experimental evidence and theoretical interpretation. Géotechnique 2019, 69, 541–553. [Google Scholar] [CrossRef]
- Zeybek, A.; Madabhushi, S.P.G. Influence of air injection on the liquefaction-induced deformation mechanisms beneath shallow foundations. Soil Dyn. Earthq. Eng. 2017, 97, 266–276. [Google Scholar] [CrossRef]
- Zeybek, A.; Madabhushi, S.P.G. Centrifuge testing to evaluate the liquefaction response of air-injected partially saturated soils beneath shallow foundations. Bull. Earthq. Eng. 2017, 15, 339–356. [Google Scholar] [CrossRef]
- Zeybek, A.; Madabhushi, G.; Santana, P. Durability of partial saturation to counteract liquefaction. Proc. Inst. Civ. Eng. Ground Improv. 2017, 170, 102–111. [Google Scholar] [CrossRef]
- Eseller-Bayat, E.; Yegian, M.K.; Alshawabkeh, A. Liquefaction Response of Partially Saturated Sands. I: Experimental Results. J. Geotech. Geoenviron. Eng. 2013, 139, 863–871. [Google Scholar] [CrossRef]
- He, J.; Chu, J. Undrained Responses of Microbially Desaturated Sand under Monotonic Loading. J. Geotech. Geoenviron. Eng. 2014, 140, 4014003. [Google Scholar] [CrossRef]
- He, J.; Chu, J.; Ivanov, V. Mitigation of liquefaction of saturated sand using biogas. Géotechnique 2013, 63, 267–275. [Google Scholar] [CrossRef]
- Moug, D.M.; Sorenson, K.R.; Khosravifar, A.; Preciado, M.; Stallings Young, E.; Van Paassen, L.; Wang, Y. Field trials of microbially induced desaturation in low-plasticity silt. J. Geotech. Geoenviron. Eng. 2022, 148, 05022005. [Google Scholar] [CrossRef]
- Stallings Young, E.G.; Mahabadi, N.; Zapata, C.E.; Van Paassen, L.A. Microbialinduced desaturation in stratified soil conditions. Int. J. Geosynth. Ground Eng. 2021, 7, 37. [Google Scholar] [CrossRef]
- Li, Y. Mitigation of Sand Liquefaction Using In Situ Production of Biogas with Biosealing; Iowa State University: Ames, IA, USA, 2014. [Google Scholar]
- Yang, X.; Wang, S.; Zhou, L. Effect of carbon source, C/N ratio, nitrate and dissolved oxygen concentration on nitrite and ammonium production from denitrification process by Pseudomonas stutzeri D6. Bioresour. Technol. 2012, 104, 65–72. [Google Scholar] [CrossRef]
- Peng, E.; Zhang, D.; Sun, W.; Du, G. Desaturation for Liquefaction Mitigation Using Biogas Produced by Pseudomonas stutzeri. J. Test. Eval. 2018, 46, 20170435. [Google Scholar] [CrossRef]
- Peng, E.; Sheng, Y.; Hu, X.; Zhang, D.W.; Hou, Z. Mitigation of sand liquefaction under static loading condition using biogas bubbles generated by denitrifying bacteria. J. Environ. Manag. 2021, 295, 113106. [Google Scholar] [CrossRef]
- Peng, E.; Sheng, Y.; Hu, X.; Zhang, D. Undrained Responses of Partially Saturated Sand Induced by Biogas under Dynamic Cyclic Loading. J. Test. Eval. 2021, 49, 20190841. [Google Scholar] [CrossRef]
- Peng, E.; Hou, Z.; Sheng, Y.; Zhang, D.; Song, L.; Chou, Y.L. Anti-liquefaction performance of partially saturated sand induced by biogas under high intensity vibration. J. Clean. Prod. 2021, 319, 128794. [Google Scholar] [CrossRef]
- Henderson, S.L.; Dandie, C.E.; Goyer, C.; Zebarth, B.J.; Burton, D.L.; Trevors, J.T.; Gilkes, R.J.; Prakongkep, N. Glucose effects on denitrifier abundance, denitrification gene mRNA levels, and denitrification activity in an anoxic soil microcosm. In Proceedings of the 19th World Congress of Soil Science, Brisbane, QL, Australia, 1–6 August 2010. [Google Scholar]
- Philippot, L.; Andert, J.; Jones, C.M.; Bru, D.; Hallin, S. Importance of denitrifiers lacking the genes encoding the nitrous oxide reductase for N2O emissions from soil. Glob. Change Biol. 2011, 17, 1497–1504. [Google Scholar] [CrossRef]
- Rebatalanda, V.; Santamarina, J.C. Mechanical effects of biogenic nitrogen gas bubbles in soils. J. Geotech. Geoenviron. Eng. 2012, 138, 128–137. [Google Scholar] [CrossRef]
- Cole, J.A.; Brown, C.M. Nitrite reduction to ammonia by fermentative bacteria: A short circuit in the biological nitrogen cycle. FEMS Microbiol. Lett. 1980, 7, 65–72. [Google Scholar] [CrossRef]
- Carrera, J.; Vicent, T.; Lafuente, F.J. Influence of temperature on denitrification of an industrial high-strength nitrogen wastewater in a two-sludge system. Water Sa 2003, 29, 11–16. [Google Scholar] [CrossRef]
- Gerven, T.V.; Baelen, D.V.; Dutré, V.; Vandecasteele, C. Influence of carbonation and carbonation methods on leaching of metals from mortars. Cem. Concr. Res. 2004, 34, 149–156. [Google Scholar] [CrossRef]
- Glass, C.; Silverstein, J.A. Denitrification kinetics of high nitrate concentration water: PH effect on inhibition and nitrite accumulation. Water Res. 1998, 32, 831–839. [Google Scholar] [CrossRef]
- Senbayram, M.; Chen, R.; Budai, A.; Bakken, L.; Dittert, K. N₂O emission and the N₂O/(N₂O+N₂) product ratio of denitrification as controlled by available carbon substrates and nitrate concentrations. Agric. Ecosyst. Environ. 2012, 147, 4–12. [Google Scholar] [CrossRef]
- Ronen, D.; Berkowitz, B.; Magaritz, M. The development and influence of gas bubbles in phreatic aquifers under natural flow conditions. Transp. Porous Media 1989, 4, 295–306. [Google Scholar] [CrossRef]


| Types of Soil | Specific Gravity Gs | Effective Grain Size D10/mm | Median Particle Size D30/mm | Mean Particle Size D50/mm | Limiting Particle Size D60/mm | Cu | Cc |
|---|---|---|---|---|---|---|---|
| Sand | 2.68 | 0.27 | 0.33 | 0.42 | 0.46 | 1.71 | 0.88 |
| Silt | 2.79 | - | 0.0064 | 0.013 | 0.017 | - | - |
| No. | Soil | Carbon Source | Bacterial Concentrations (OD600) | Nitrate Concentrations (mmol/L) | Temperature/°C | pH |
|---|---|---|---|---|---|---|
| 1 | 100% Sand | Sodium citrate, Sodium acetate, Glucose | 0.1 | 19.80 | Room temperature | 7 |
| 2 | 100% Sand | Sodium citrate | 0.01, 0.05, 0.1, 0.15, 0.2 | 19.80 | Room temperature | 7 |
| 3 | 100% Sand | Sodium citrate | 0.1 | 9.90, 14.85, 19.80, 29.70 and 39.60 | Room temperature | 7 |
| 4 | 100% Sand | Sodium citrate | 0.1 | 19.80 | 4, 15, 20, and 30 | 7 |
| 5 | 100% Sand | Sodium citrate | 0.1 | 19.80 | Room temperature | 5, 6, 7, 8, and 9 |
| 6 | 100% Sand, 99% Sand + 1% Silt 95% Sand + 5% Silt, 90% Sand + 10% Silt 75% Sand + 25% Silt | Sodium citrate | 0.1 | 9.80 | Room temperature | 7 |
| No. | Soil | Desaturation/% | Relative Density/% | Carbon Source | Temperature/°C | pH |
|---|---|---|---|---|---|---|
| 1 | 100% Sand | 100 | 40 | Sodium citrate | 25 | 7 |
| 2 | 100% Sand | 92.5 | 40 | Sodium citrate | 25 | 7 |
| 3 | 100% Sand | 85 | 40 | Sodium citrate | 25 | 7 |
| Bacteria | Test Conditions | Test Results | ||||
|---|---|---|---|---|---|---|
| Initial OD600 | Initial Nitrate Concentration (mmol/L) | Temperature (°C) | Initial Stagnation (h) | Average Rate of Gas Generation of 1 cm3 Soil (cm3/h) | Degree of Saturation (%) | |
| Pseudomonas stutzeri | 0.100 | 20.17 | 20 | <3 | 0.0037 | 80.81 |
| Pseudomonas denitrificans | 0.005 | 26.74 | Room temperature | 39 | 0.0017 | 76.50 |
Disclaimer/Publisher’s Note: The statements, opinions and data contained in all publications are solely those of the individual author(s) and contributor(s) and not of MDPI and/or the editor(s). MDPI and/or the editor(s) disclaim responsibility for any injury to people or property resulting from any ideas, methods, instructions or products referred to in the content. |
© 2024 by the authors. Licensee MDPI, Basel, Switzerland. This article is an open access article distributed under the terms and conditions of the Creative Commons Attribution (CC BY) license (https://creativecommons.org/licenses/by/4.0/).
Share and Cite
Lv, M.; Zhang, D.; Peng, E.; Guo, Y. Induced Partial Saturation Using Pseudomonas stutzeri Biogas for Mitigate Structure Settlement. Buildings 2024, 14, 484. https://doi.org/10.3390/buildings14020484
Lv M, Zhang D, Peng E, Guo Y. Induced Partial Saturation Using Pseudomonas stutzeri Biogas for Mitigate Structure Settlement. Buildings. 2024; 14(2):484. https://doi.org/10.3390/buildings14020484
Chicago/Turabian StyleLv, Meitong, Dingwen Zhang, Erxing Peng, and Yinhe Guo. 2024. "Induced Partial Saturation Using Pseudomonas stutzeri Biogas for Mitigate Structure Settlement" Buildings 14, no. 2: 484. https://doi.org/10.3390/buildings14020484
APA StyleLv, M., Zhang, D., Peng, E., & Guo, Y. (2024). Induced Partial Saturation Using Pseudomonas stutzeri Biogas for Mitigate Structure Settlement. Buildings, 14(2), 484. https://doi.org/10.3390/buildings14020484