Article

Research on Energy Consumption Prediction Models for High-Rise Hotels in Guangzhou, Based on Different Machine Learning Algorithms

1
Pearl River Foreign Investment Architectural Designing Institute Co., Ltd., Guangzhou 510060, China
2
College of Architecture, Changsha University of Science and Technology, Changsha 410114, China
3
State Key Laboratory of Subtropical Building Science, School of Architecture, South China University of Technology, Guangzhou 510655, China
*
Author to whom correspondence should be addressed.
Buildings 2024, 14(2), 356; https://doi.org/10.3390/buildings14020356
Submission received: 27 November 2023 / Revised: 4 January 2024 / Accepted: 6 January 2024 / Published: 28 January 2024

Abstract

:
With the advancement of information technology, energy consumption prediction models are widely used for various types of buildings (office, residential, and commercial buildings) as guidance during the design and management stages. This article will establish an efficient building energy consumption prediction model for hotel buildings. To achieve this, we collected 78 architectural drawings of high-rise hotel buildings to establish 6 kinds of typical energy consumption models in 2 standard floor layouts and 3 public area levels. Then, on this basis, we used the total energy consumption calculated by EnergyPlus as an indicator to conduct sensitivity analysis on geometric feature parameters, internal heat source parameters, and thermal parameters, respectively. Finally, we generated a building database with 5000 samples through the R programming language to calculate and verify the energy consumption. As a result, it was proved that the energy consumption of hotel buildings can be predicted accurately, and that quadratic polynomial regression, with the best accuracy and stability, is the most suitable optimization model for hotel energy consumption prediction in Guangzhou. These conclusions provide a good theoretical basis for the analysis, prediction, and optimization of energy consumption in high-rise hotel buildings in the future.

1. Introduction

In response to the fast pace of global urbanization, the consumption of fuels is rapidly increasing, posing significant environmental and social challenges. Notably, the construction and upkeep of buildings account for over 40% of the world’s total energy usage, with one-third of total carbon dioxide emissions [1]. Among various types of buildings—offices, residences, hospitals, and commercial spaces—hotels stand out as significant energy consumers, with significant potential for energy savings. According to Chung’s research, hotels consume more energy than any other type of building, surpassing even hospitals at over 45% of energy consumption [2]. In China, Li’s study on the energy consumption of 210 newly built hotel buildings in Shandong Province revealed that approximately 60% of hotels are non-energy-saving buildings, with air conditioning accounting for 40% to 51% of total building energy consumption [3].
To effectively manage energy usage in hotel buildings, it is essential to establish an energy consumption prediction model that can analyze the energy cost of each building’s behavior. There are two primary methods for creating such models: physical-model-based methods (also known as white-box approaches) and data-driven methods (also referred to as black-box approaches).
Traditional physical-model-based methods often utilize heat conduction to establish thermal equilibrium equations to estimate building performance, calculate energy consumption, and conduct the corresponding analyses. Commonly used software for physical-model-based energy simulations include TRNSYS, eQuest, DeST, EnergyPlus, and others [4]. In energy prediction, physical-model-based methods require detailed information input, such as the physical characteristics of the building, HVAC systems, equipment information, and occupant schedules [5]. While this extensive database of information leads to more accurate predictions, it also makes the modeling process and simulation calculations more complex and time-consuming.
Data-driven methods are based on pre-existing large amounts of historical data, using mathematical statistics or machine learning methods to extract data features for energy consumption analysis and prediction. It can be established solely based on a large amount of research data and can also be further combined with optimization algorithms to form optimization models. Machine learning (ML) technology has found widespread application in building analysis, modeling, and prediction [6]. ML algorithms possess self-learning capabilities and can rapidly identify optimal solutions, making them suitable for complex nonlinear problems [7,8]. Numerous studies have employed machine learning for building energy consumption predictions [9,10]. Furthermore, artificial neural networks (ANN) [11], support vector machines (SVM) [12], and extreme learning machines [13] are also advanced data-driven methods for building energy prediction and have already been widely applied in this field.
For the establishment of energy consumption prediction models, the prediction methods vary according to the type of building and its thermal environment. Currently, there are numerous studies on other types of buildings, for example, office buildings [14], residential buildings [15], hospital buildings [16], and commercial buildings [17]. According to existing research results, there is relatively little research on the energy consumption of hotel buildings, and most of them only focus on energy monitoring, statistics, and analysis of existing cases. However, there is a lack of energy consumption prediction models on energy-saving design for hotel buildings. Based on this situation, this study chooses machine learning methods and compares various classic algorithms to determine the fastest and most accurate prediction model for high-rise hotel buildings in Guangzhou.

2. Materials and Methods

Guangzhou, the capital city of Guangdong province in southern China, spans an area of 7434.40 km2 and lies between 112.8–114.2° E and 22.3–24.1° N. Characterized by ample daylight, abundant rainfall, and a prolonged summer season throughout the year, Guangzhou experiences a typical climate of hot summers and warm winters. This climatic zone is marked by considerable solar radiation and minimal fluctuations in temperature and humidity. Given the persistently high temperatures and humidity levels in Guangzhou, accurately calculating and effectively managing the energy consumption of hotel buildings in the city is of the utmost importance.
The purpose of this study is to introduce a widely applicable high-rise hotel building energy consumption model based on existing building information in Guangzhou or other cities with a similar climate and to validate the feasibility of machine learning methods for rapid energy consumption prediction. To achieve these goals, a total of 78 sets of engineering drawings for high-rise hotels were collected, including 10 from Guangzhou, 9 from other parts of Guangdong Province, 31 from other parts of China, and 28 sets from unknown locations. During the investigation, it was observed that the regional characteristics of high-rise hotel buildings were not significant, so all cases were analyzed without distinguishing between regions.
The research process of this study can be divided into four steps: the first step is to establish a typical high-rise hotel model after an investigation of architectural drawings. The second step is to perform sensitivity analysis on all input variables, using the SRC method to determine the parameters that have a significant impact on the EH. The third step is to train a total of 14 kinds of models using 11 common machine learning algorithms, based on typical hotel building models. As a result, by comparing their EH values, the most optimal model is selected to establish an energy consumption prediction model. The tools used in each process are described below:
  • Drawing analysis tools—Statistical methods: Statistical methods are essential for analyzing data and extracting meaningful insights. The box plot method, regression analysis, cluster analysis, normal tests, and other techniques can be used to process, analyze, and extract data. Prior to establishing a typical model, it is crucial to conduct a correlation test analysis on the data samples to ensure the credibility of the final selected typical values and calculation methods. This step ensures the scientific nature of the subsequent research and enables accurate representation of the data.
  • Modeling tools—Parametric modeling: After determining the required variables and their ranges, the Latin hypercube sampling method [18] is used to randomly generate building models with different combinations of variable values, and the R programming language [19] is employed to compile the inputs and generate a building model database that can be put into software for calculations. This step enables the creation of a comprehensive database of building models that can be used for further analysis.
  • Sensitivity analysis tool—Standard regression coefficient method (SRC): The SRC method is used to determine the sensitivity of parameters to EH by calculating the value of the SRC. The larger the absolute value of the SRC, the greater the impact of the parameters on EH. If the variable’s SRC is negative, this indicates that the inputs and outputs have a negative correlation [20]. This analysis helps identify the most significant parameters that have a significant impact on EH, enabling further optimization.
  • Simulation calculation tool—EnergyPlus [21]: Simulation calculation tools can obtain more data in a short period of time and can independently change the variables. This study uses EnergyPlus to simulate and calculate the energy consumption to establish a database for analysis and training.
  • Machine learning model—Generalized linear model: In statistics, a generalized linear model is a generalization of an ordinary linear model, which allows independent variables to influence dependent variables through linking functions, greatly expanding the available range of linear regression. In this study, 11 common GLM algorithms are used to train 14 different models. Evaluation indicators are employed to compare their performance, and the optimal model is selected for accurate prediction.

3. Results

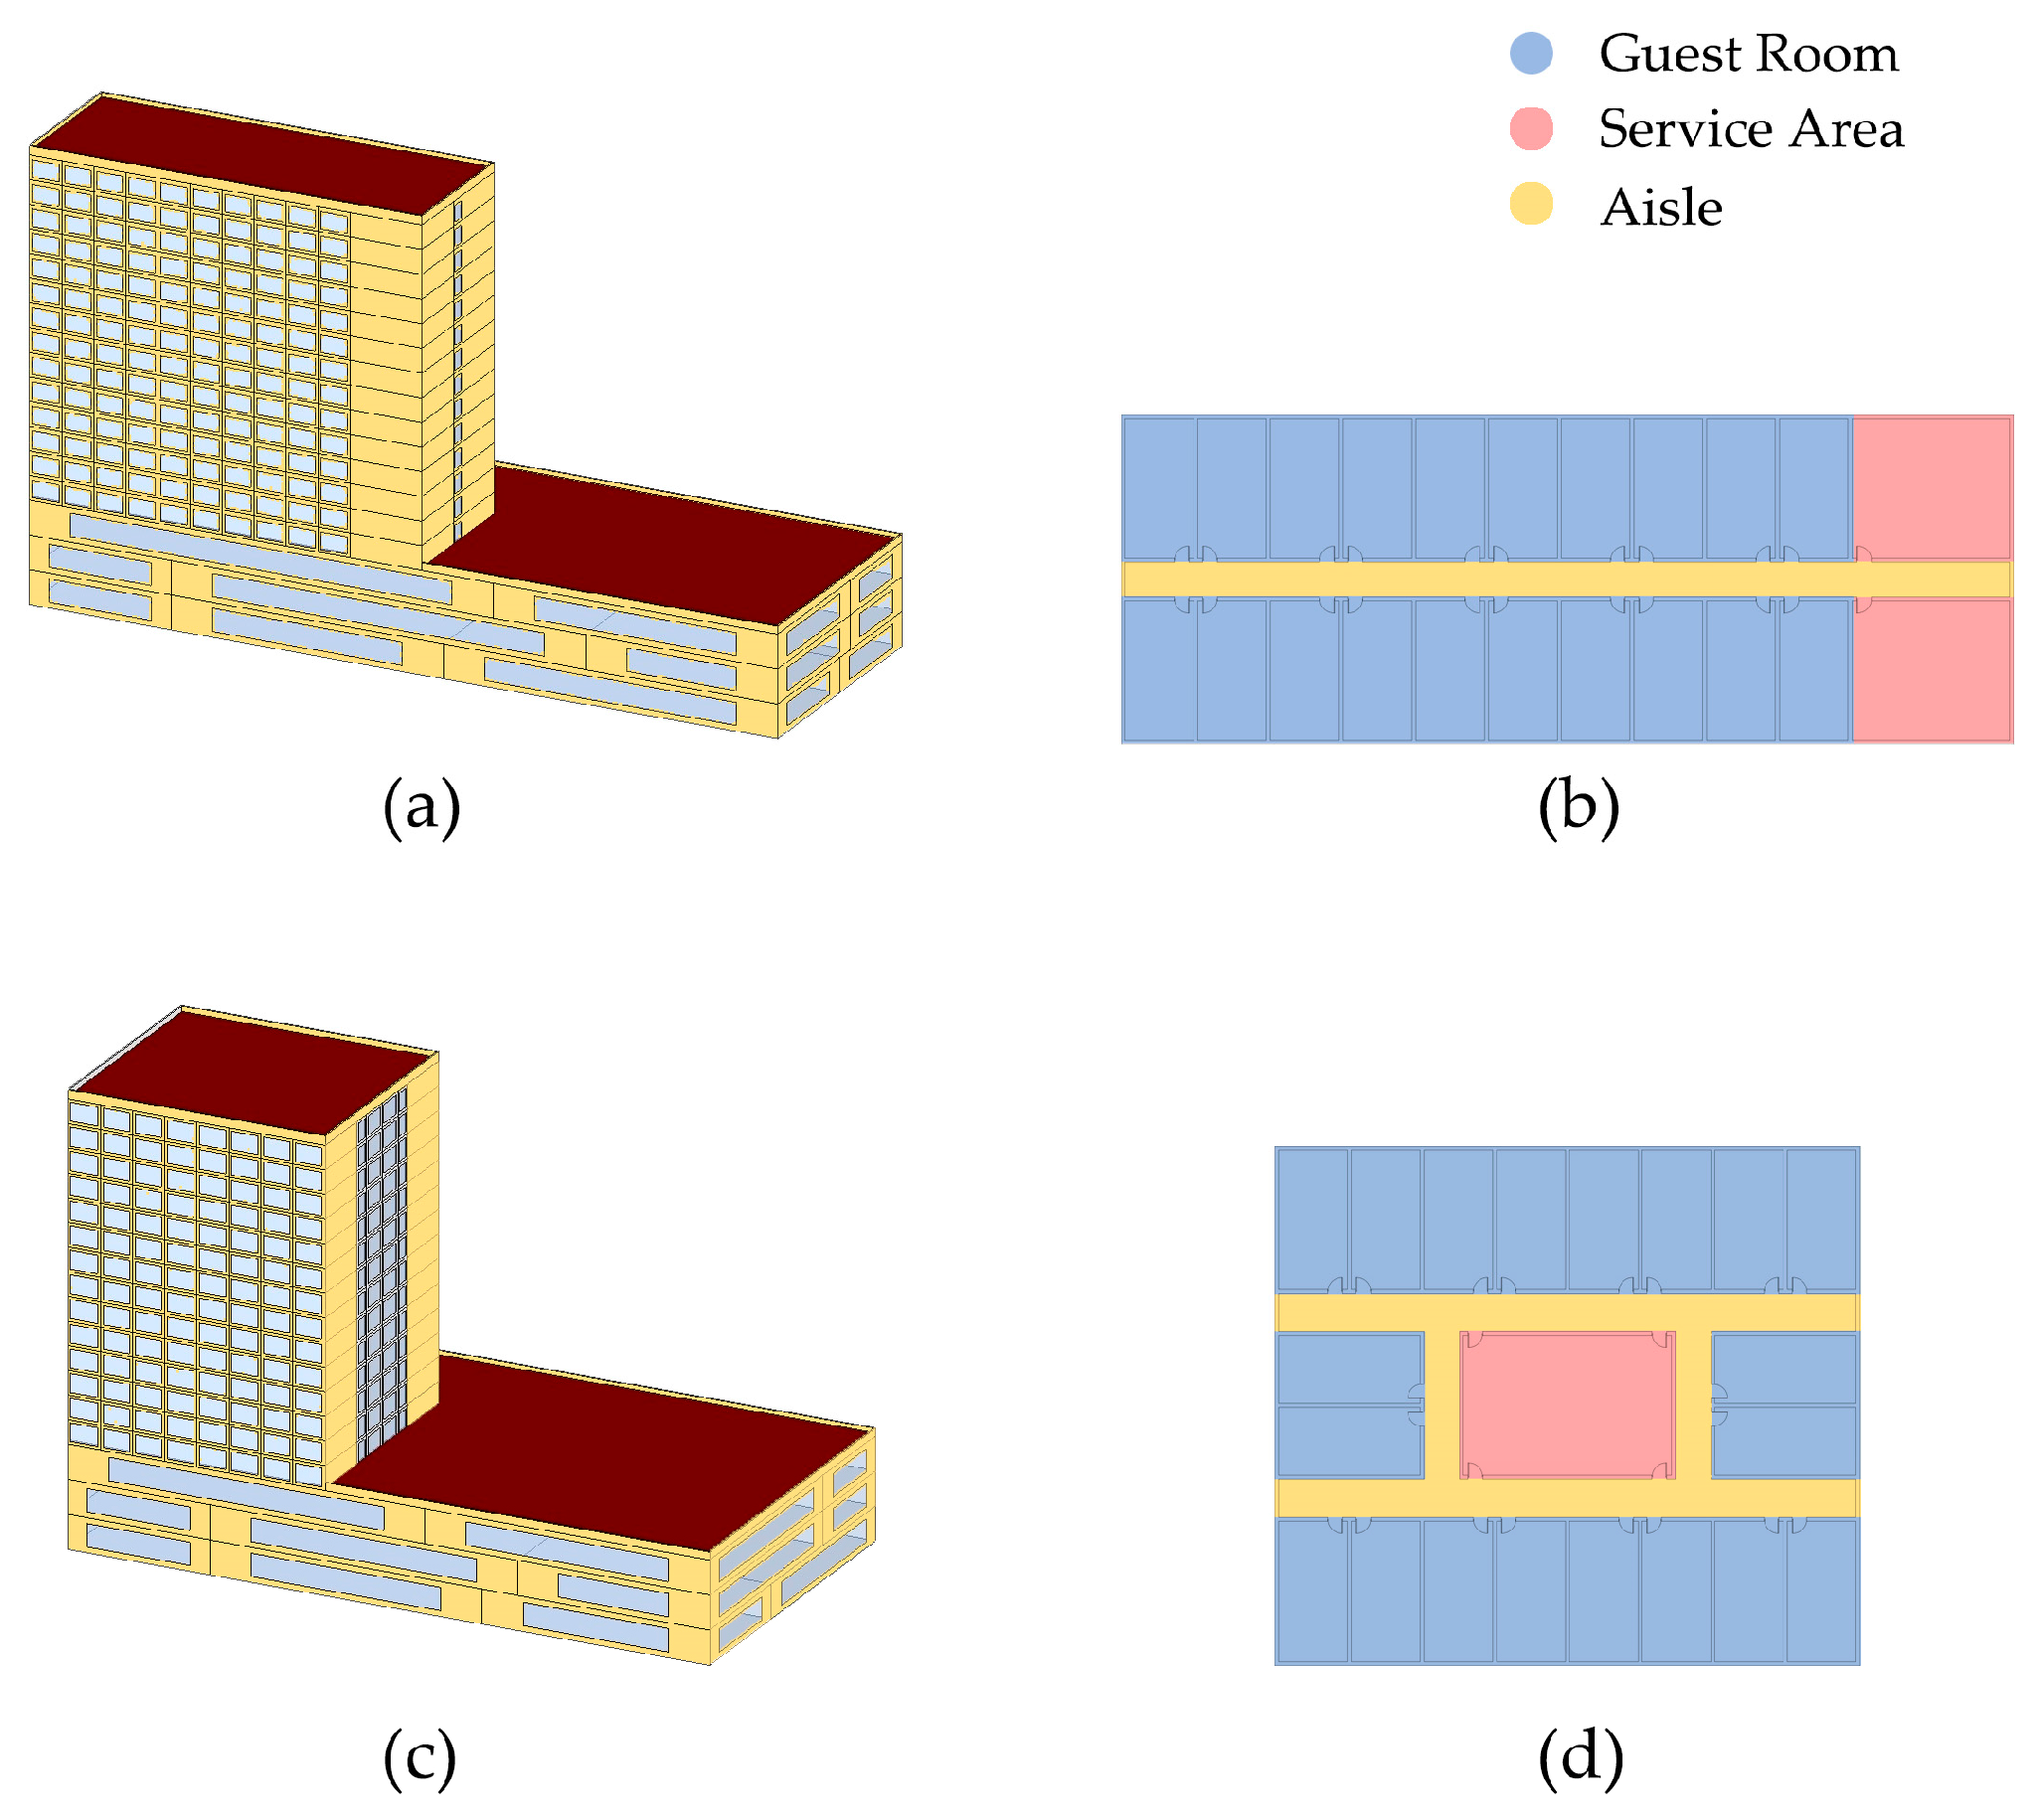
3.1. Typical Hotel Energy Model Establishment

After conducting a statistical analysis of the drawings of hotel buildings in Guangzhou, the input parameters of typical hotel building models can be classified into four categories:
  • Architectural geographic information;
  • Building energy equipment information;
  • Internal heat source information;
  • Building geometry information.
The first three types of information are determined according to the “Energy Efficiency Design Standards for Public Buildings” (GB 50189-2015) in China [22], and the specific types and value ranges are shown in Table 1. The building geometric information is then summarized, based on the statistical and research results, and a typical building model is established.
Due to the large number of building feature factors and their interrelationships in this study, regression analysis is used to reduce the amount of input variables. If the R2 of 1 variable surpasses 0.8, we can use the regression equation to replace this input variable. With the help of the box plot method and regression analysis statistics, it can be inferred that the typical high-rise hotel building mode comprises 14 floors of guest rooms and 4 floors of public areas, giving 18 floors in total. The guest room floors stand at 3.4 m in height, while the public area floors measure 4.8 m in height, resulting in a total height of 66.8 m.
According to our research on the drawings, there are two types of layout methods for the guest room floors in high-rise hotel buildings: strip layouts and square layouts. These layout methods can exhibit contrasting characteristics in terms of geometric space, thermal performance, and other aspects. In both layout methods, guest rooms can be standardized to the same unit, based on their weighted average area. Therefore, only the average area of this unit should be considered. For public areas within hotels, the function type and its corresponding area are counted. The various parameter values of both guest room and public area floors are presented in Table 2.
For the strip floor plan, the area of the non-temperature-controlled zone can be obtained through regression analysis:
N C A Y = R A × R N Y × 0.135 + 65.323
where N C A Y is the area of the non-temperature-controlled zone in the strip floor plan, R A is a single room’s area, and R N Y is the number of rooms on one side in the strip floor plan.
For the square floor plan, the area of the non-temperature-controlled zone can be calculated by:
N C A H = S L H 2 × R L + C W × S W H 2 × R L + C W
where N C A H is the area of the non-temperature-controlled zone in the square floor plan, S L H is the length of the square floor plan, R L is a single room’s length, C W is the corridor width, and S W H is the width of the square floor plan.
Out of the 78 drawings analyzed in this study, 59 drawings contain public area information, and 49 drawings provide detailed introductions to the public areas. By dividing the frequency of each function type of public area into 25% units, we can classify them into four levels. The first three levels are set in descending order of frequency, while those falling below 25% are considered special values and are excluded from the calculation. The statistical results are presented in Figure 1. In the various designs, the areas of the public spaces range from 400 to 6000 m2, making it challenging for a single value to completely cover the different levels of public areas in hotel buildings. Therefore, the area of a public space is counted separately, according to the corresponding function. The statistical results are then classified according to their levels, as shown in Table 3.
Other research on typical building models has shown that the spatial location of public areas has no significant impact on EH when the area is fixed [23,24]. Therefore, after determining the area, the high-rise hotel podium model can be simplified into simple geometric shapes. According to statistics, the width-to-length ratios of strip and square layout podiums are 30% and 80%, respectively.
In summary, a typical building model can be established as having a north-south orientation, a total of 18 floors, and a total height of 66.8 m. There are 308 guest rooms, each with an average area of 40 square meters and an aspect ratio of 2:1. There are 20 guest rooms on each floor, and the corridor width is 2.2 m. Within each guest room, the bathroom area of 8 m2 accounts for 20% of the total area. For the strip layout model, there are 10 guest rooms on the north and south sides, divided by the service area in the middle. For the square layout model, there are 2 guest rooms on the short side and 8 guest rooms on the long side, with a service area in the middle as well. The ratio of the window-to-wall area (RWR) for the guest room floor is set at 34%, while for public areas, the average RWR value is set at 67%, based on the statistical data. The typical geometric models of two types of high-rise hotels are shown in Figure 2.

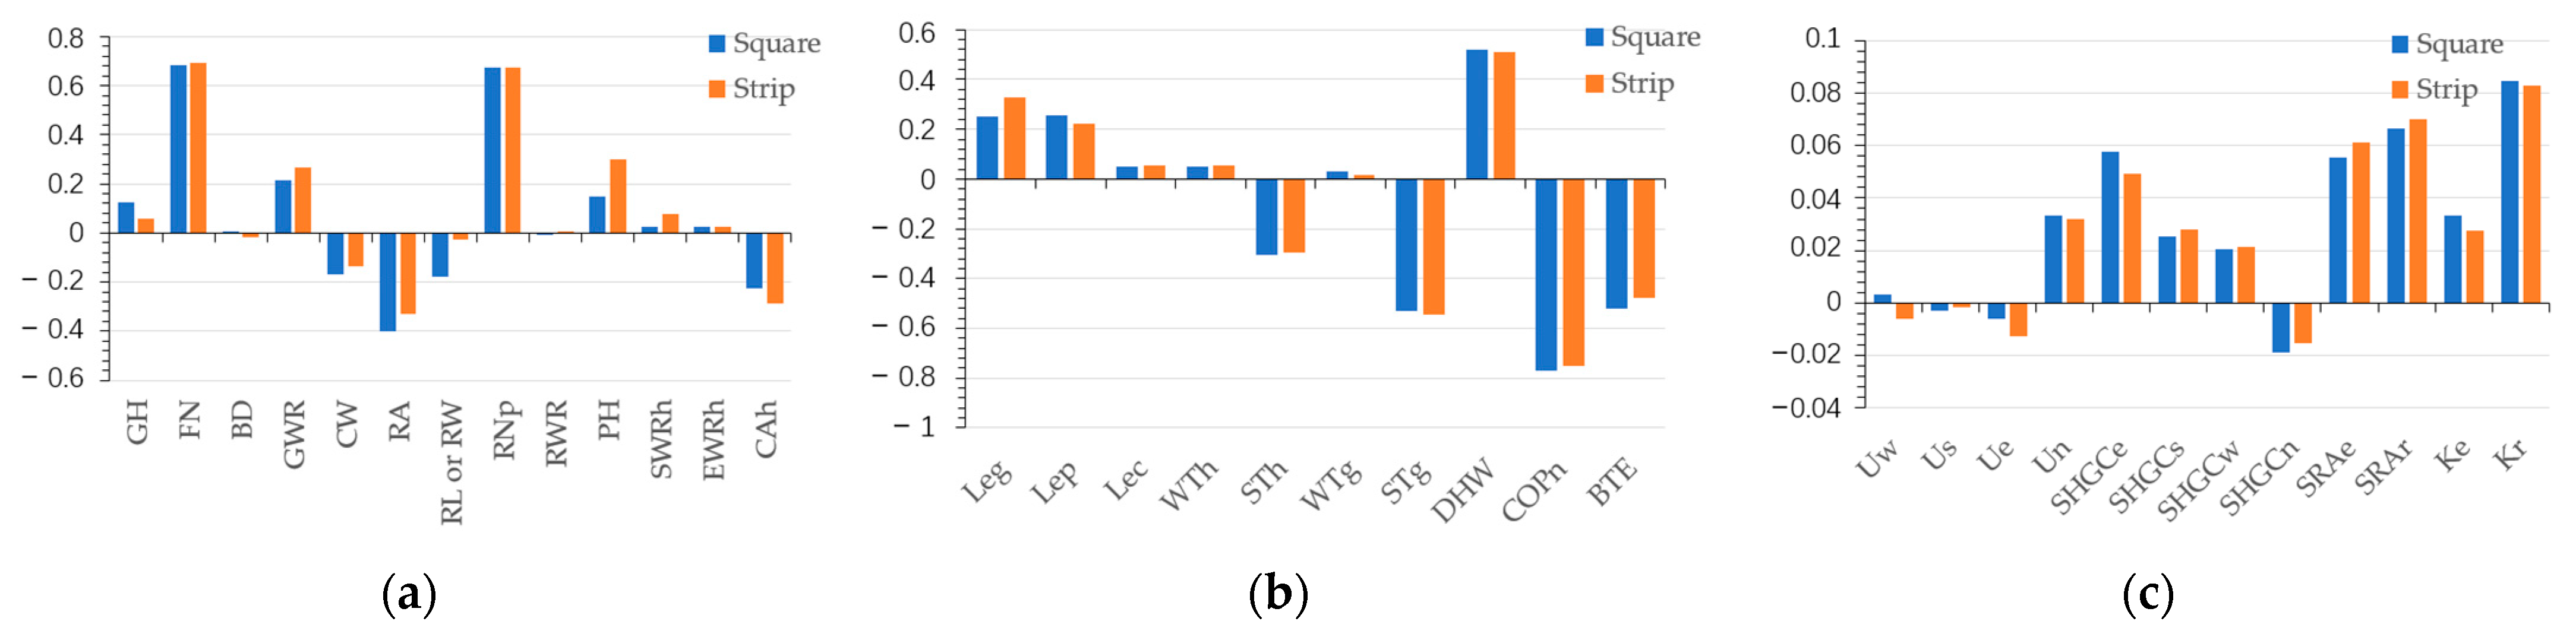
3.2. Sensitivity Analysis

On the basis of the typical hotel building model, EH can be calculated via EnergyPlus. After that, we can use EH as a metric for conducting sensitivity analyses of the various parameters, including geometric feature parameters, internal heat source parameters, and thermal parameters, to verify their influence. Initially, we assume that the relationship between this parameter and building energy consumption conforms to a linear model, and then use the standardized regression coefficient (SRC) to determine the fitting effect. The sensitivity of parameters to energy consumption can be determined by the absolute value of the SRC, and the larger the absolute value, the more important the parameter is. A positive value indicates a positive correlation between the parameter and the model output, while a negative value indicates the opposite.
As the calculation results are extensive, the R programming language was used to compile and calculate the standard regression coefficients for each parameter. The specific code segments are provided in Appendix A and Appendix B, and the calculation result is shown in Figure 3.
Parameters with an SRC greater than 0.5 are considered to have a significant impact on the total energy consumption of the building, as follows:
  • Geometric feature parameters: Total number of floors (FN), number of rooms on one side (RNP, LRNQ, SRNQ), area of a single room (RA), temperature-controlled area of public space (CAH), area ratio of the window to the wall (GWR), and the height of public areas (PH);
  • Internal heat source parameters: Energy efficiency ratio of chillers (COPn), hot water consumption (DHW), boiler efficiency (BTE), and guest floor setting for temperature in summer (STG);
  • Thermal parameters: North external window heat transfer coefficient (Un), east external window heat gain coefficient (SHGCe), heat transfer coefficient of the roof (KR), and heat transfer coefficient of an external wall (KE).
From this, it can be concluded that focusing on the parameters listed above during the design and management stages of high-rise hotel buildings in Guangzhou and the surrounding areas can effectively improve the efficiency of energy usage.

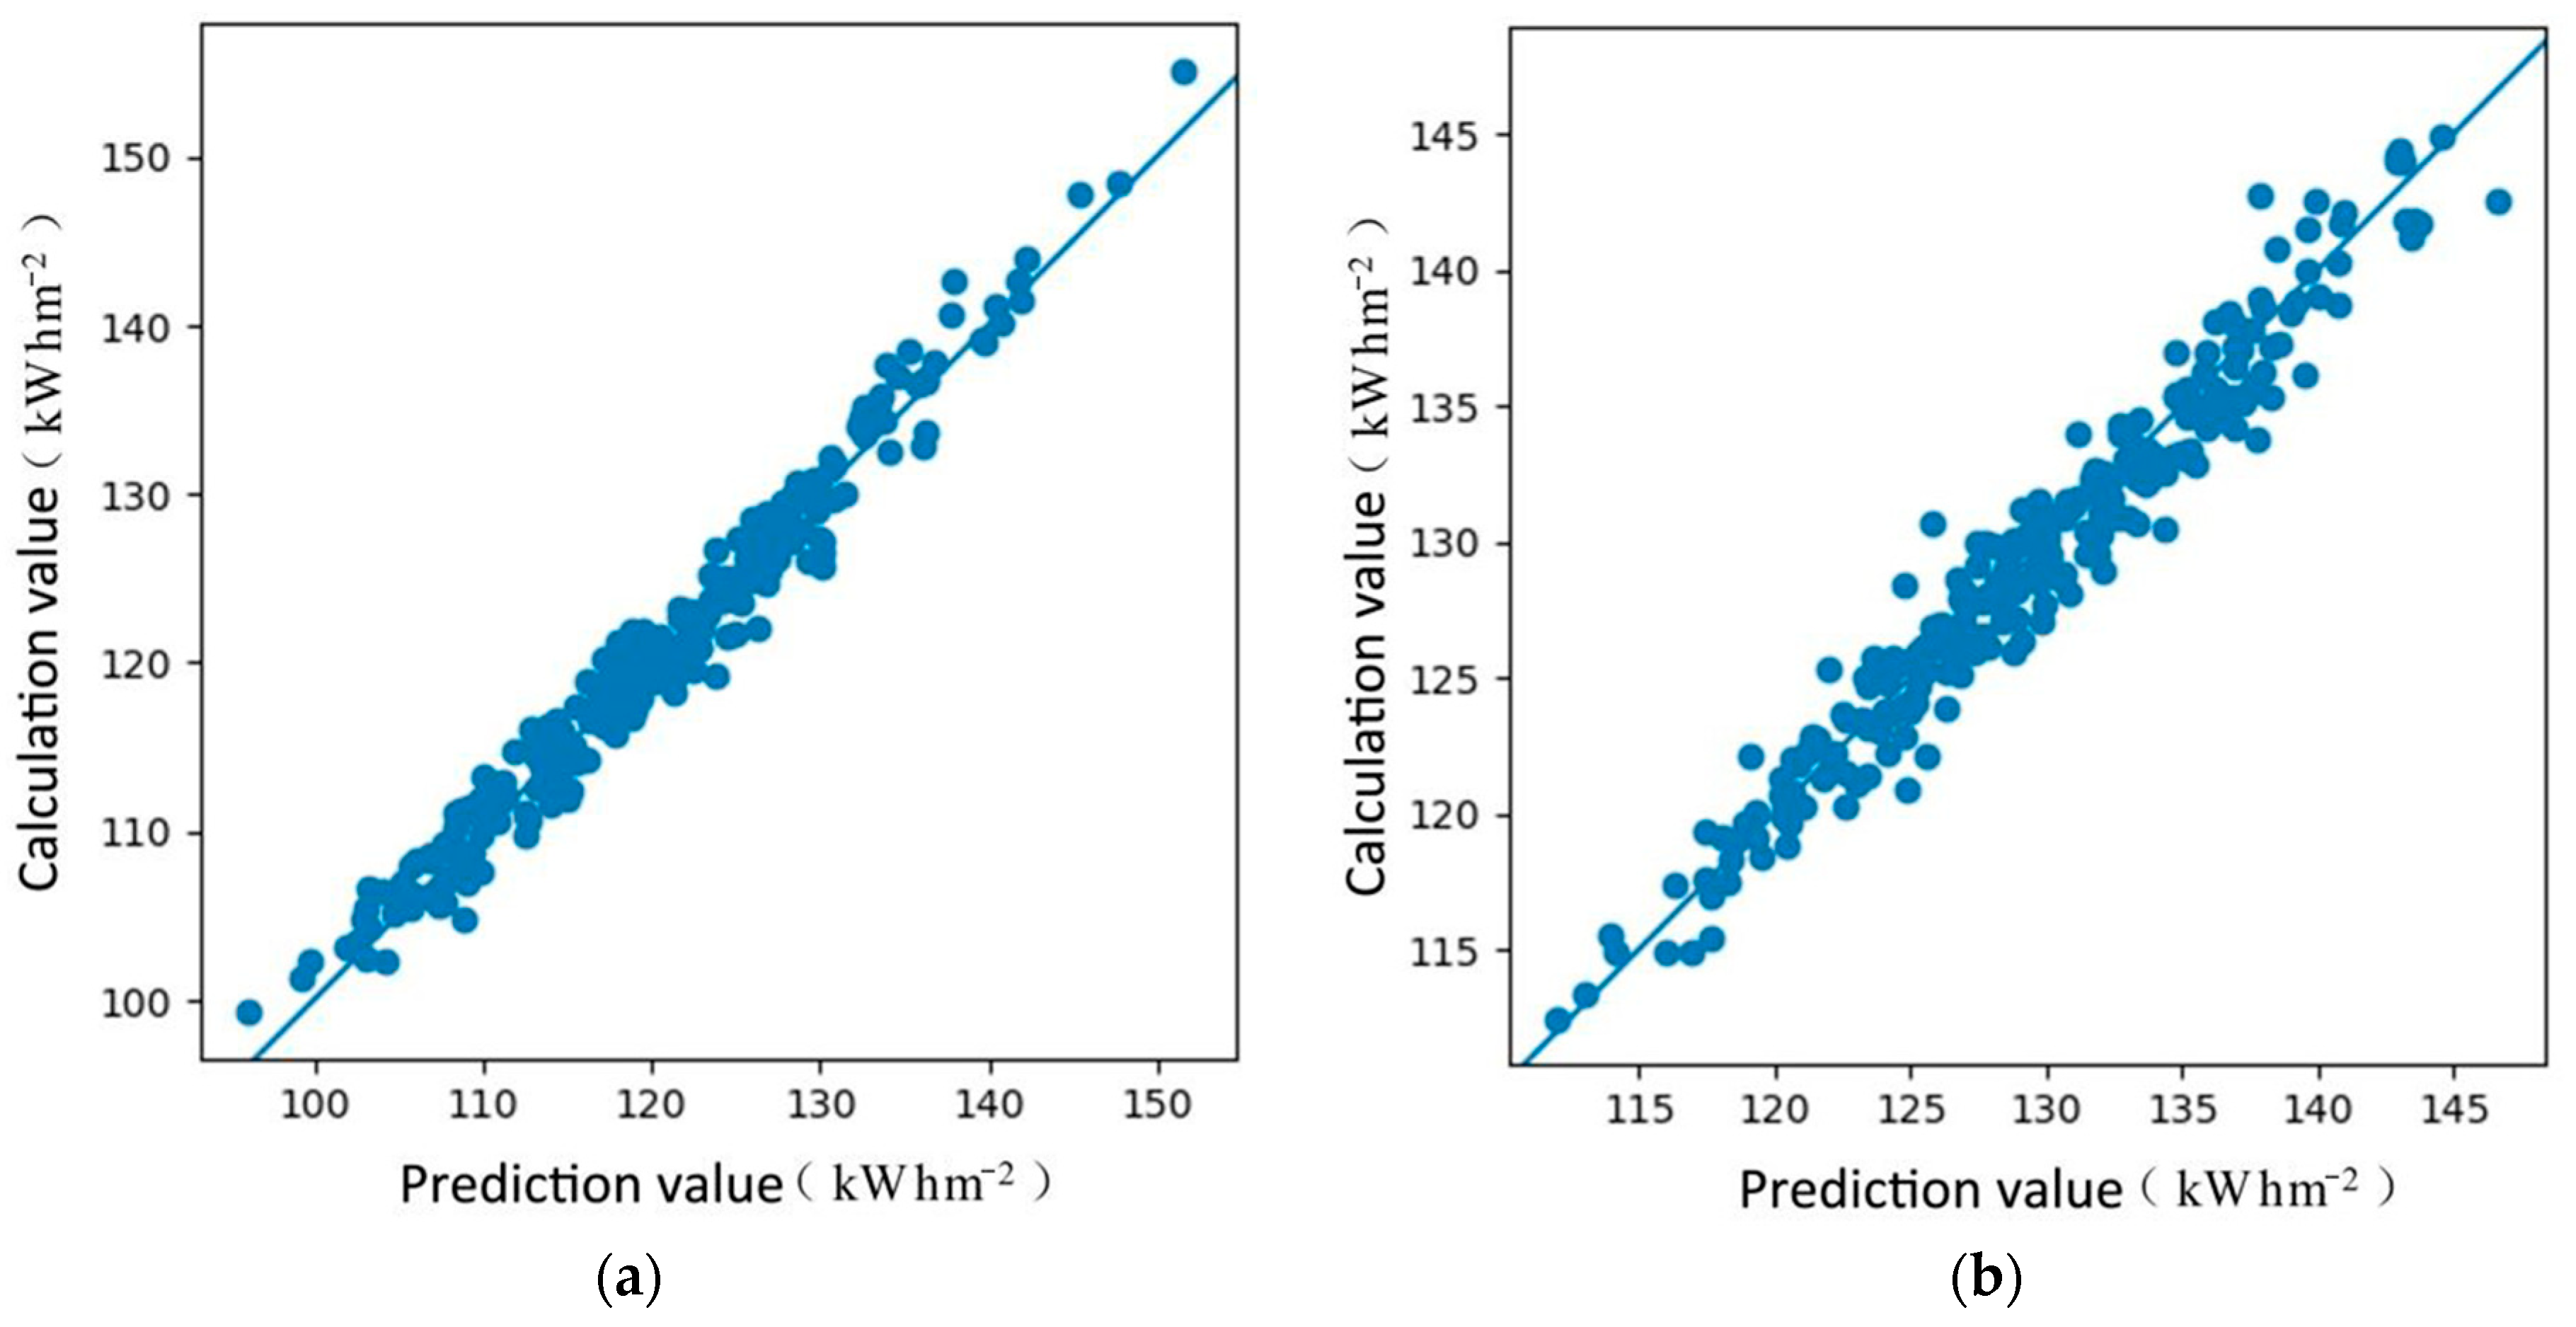
3.3. Parametric Prediction Model

The process of establishing an energy consumption prediction model based on machine learning methods can be briefly described according to the steps shown in Figure 4 [25].
The establishment of a machine learning model requires a large amount of input data. In this study, a method employing the computer batch generation of models was used to construct an input database. While generating hotel building models in bulk, based on the sensitivity analysis results given above, those parameters having a significant impact on the result were designated as variables, while other input parameters with little impact were replaced by constants. The geometric parameters were derived from the typical hotel building model, while the thermal and internal heat source parameters were calculated using benchmark values, and the meteorological data were taken from the typical annual meteorological parameters of Guangzhou. The quantitative values and ranges are shown in Table 4. Given the numerous input data categories and diverse dimensions, variations between variables could potentially impact the outcomes of certain learning model calculations. To eliminate these effects and ensure comparability, we utilized the StandardScaler tool from the Sklearn package to preprocess the data.
According to Table 4, there are 15 types of variables and 20 types of fixed-value data constructing the database. To guarantee the convergence of the calculation outcomes, the sampling frequency was set to 2500 times for each of the strip and square layout models. In total, 5000 energy consumption prediction models generated by random combination sampling were inserted into EnergyPlus for energy consumption simulation. After collecting the energy consumption (EH) data via the R programming language, the results indicate a normal distribution with no evident outlier data. The specific outcomes are as follows:
For the strip layout hotel model, the EH ranges from 93.14 to 153.60 kWhm−2, mainly distributed between 113.82 and 127.10 kWhm−2, with a mean of 120.67 kWhm−2, a median of 120.24 kWhm−2, and a standard deviation of 9.68, as illustrated in Figure 5a. For the square layout hotel model, the EH ranges from 111.94 to 152.23 kWhm−2, mainly distributed between 123.94 and 133.38 kWhm−2, with a mean of 128.74 kWhm−2, a median of 128.38 kWhm−2, and a standard deviation of 6.74, as displayed in Figure 5b.
At this point, the preliminary work of data collection and organization, data processing, and variable screening has been completed. Moving forward, appropriate modeling methods will be determined to refine and train the prediction model, followed by the relevant evaluation and validation. We selected 14 common machine learning models and used 5000 sets of generated models as the input dataset. The k-fold cross-validation method (k = 10) was used to calculate and predict the EH. The average and variance from ten training sessions were calculated to compare the generalization and stability of different models, enabling us to identify the optimal model. Table 5 presents the results. After comparison, it can be inferred that for both datasets, the predictive performance of each model exhibits a similar trend. Among them, the R2 of quadratic polynomial regression is above 0.95, and the variance is less than 0.01. Considering its accuracy and stability, this model was selected. The relationship between the calculated and predicted values is shown in Figure 6.
To verify the accuracy of the prediction model, we designated the prediction values from the typical hotel building model as the benchmark for E0 and compared them with the EH from the prediction model. A comparison of the results is presented in Table 6. From the table, it is evident that the bias falls within the range of 2.38% to 8.11%, which is considered acceptable.
To further validate the accuracy and practicality of the prediction model, we compared the EH from actual hotel projects (both strip and square layouts) with the prediction model. Prior to using EnergyPlus to calculate the energy consumption of the actual hotel project, we used the OpenStudio plugin in SketchUp to establish the geometric model according to the architectural drawings. We then inputted the internal heat source parameters, thermal parameters, and energy equipment parameters according to the drawings and used the meteorological parameter file in Guangzhou for simulation. As a result, it was calculated that the EH from an actual strip layout hotel building project was 152.87 kWhm−2, and the prediction value was 135.67 kWhm−2, resulting in a bias of 11.25%. The EH from an actual square layout hotel project was 157.48 kWhm−2, and the predicted value was 148.87 kWhm−2, resulting in a bias of 5.59%.
From the comparison results, it can be inferred that despite a minor bias between the prediction model and the actual project, considering such factors as special equipment and actual personnel activities, the bias remains within an acceptable range. This suggests that the prediction model demonstrates good predictive capabilities and can accurately facilitate the numerical analysis of hotel energy consumption.

4. Discussion

Currently, due to the absence of straightforward and efficient rapid evaluation tools, it is challenging to predict and analyze the energy consumption of high-rise hotel design at a data level. To address this issue, a hotel building prediction model was developed using software like the R programming language, EnergyPlus, SketchUp, and more, based on the machine learning approach. This model aids in accurately predicting thermal performance at various stages of high-rise hotel building design and management.
However, it is important to note that this model still faces some limitations that need to be addressed:
  • While establishing the typical model for public areas, the differences in energy consumption characteristics of all functional public areas were not considered. According to Gu’s research [26], the energy consumption of hotels is mainly related to their individual architectural characteristics and service levels. In the future, more practical surveys and research will be conducted and combined with actual situations.
  • In high-rise hotel buildings, there are differences in the external meteorological environment between floors and rooms, due to differences in vertical height. In other words, when the building layout, orientation, and indoor thermal environment are consistent, the energy consumption of rooms will also be different.
  • The energy consumption prediction model established in this article is only applicable to the Guangzhou area. For hotels in different regions, the research scope could be further expanded. Therefore, in-depth analysis and exploration can be conducted based on the local climate to provide relevant guidance for hotel building design within each climate zone.
  • At present, many hotel buildings have adopted new energy-saving methods, such as variable enclosure structures, adaptive control systems, and production capacity systems. It is hoped that in future research, the effects of various energy-saving methods can be analyzed.

5. Conclusions

In summary, the establishment of an energy consumption prediction model for high-rise hotel buildings can be divided into the following three steps:
Firstly, we collected and analyzed 78 sets of drawings of high-rise hotel buildings and identified 2 common forms of guest floor layout, the strip and square, along with 3 public area levels. Therefore, in total, six kinds of typical geometric models of high-rise hotel buildings were generated.
Secondly, based on typical geometric models, the standard regression coefficient (SRC) method was used to conduct a sensitivity analysis of the geometric feature parameters, internal heat source parameters, and thermal parameters, respectively. After statistical analysis, those parameters with a significant impact on the EH were obtained.
Finally, a database with a sample size of 5000 was established and divided using k-fold cross-validation. With a target value of EH, 14 kinds of common machine learning algorithms were compared for their learning and modeling performance. As a result, the quadratic polynomial regression model was determined to be the best energy consumption prediction model for high-rise hotel buildings in Guangzhou and other regions with similar climate characteristics, and the relevant validation was conducted.
The results show that the energy consumption values of high-rise hotel buildings can be predicted with great accuracy, and machine learning is a very effective method for this type of prediction. Moreover, the machine learning method can be an important guide for heating and cooling engineers when selecting the most appropriate and efficient heating and cooling equipment at the hotel design stage since it is now possible to model energy consumption systems with minimum data input.

Author Contributions

All authors (J.Z., C.Y., J.Y. and L.Z.) contributed to Conceptualization and methodology.; software, C.Y. and J.Y.; validation, J.Z. and C.Y.; formal analysis, J.Z.; investigation, J.Z., J.Y.; resources, L.Z.; data curation, J.Z., J.Y.; writing—original draft preparation, J.Z., C.Y and J.Y.; writing—review and editing, J.Z. and J.Y.; visualization, J.Z. and C.Y.; supervision, L.Z.; project administration, J.Z.; funding acquisition, L.Z. All authors have read and agreed to the published version of the manuscript.

Funding

This project is supported by the National Key Research and Development Project of China (No. 2019YFE0124500).

Data Availability Statement

The authors declare data is unavailable due to privacy.

Conflicts of Interest

Author Jin Zhang was employed by the company Pearl River Foreign Investment Architectural Designing Institute Co. Ltd. The remaining authors declare that the research was conducted in the absence of any commercial or financial relationships that could be construed as a potential conflict of interest.

Appendix A

  Code for reading calculation results in the R programming language:
  • setwd (“D:/R”)
  • tempmatrix <- matrix (0,nrow=4,ncol=7)
  • for (i in 1:4){
  • resultcsv <- paste (‘hotelyi/YiFan’, i,‘_2022-05-11 150039Table.csv’,sep=‘’)
  • ncol <- 20
  • if (file.exists (resultcsv)){
  • latin <- read.csv (resultcsv, fill=TRUE, colClasses=‘character’, blank.lines.skip=FALSE, col.names = paste0 (‘V’, seq_len (ncol)), header=FALSE)
  • dim (latin)
  •  mean_cooling <- as.numeric (latin [51,3])/as.numeric (latin [42,3])
  •  mean_HVAC <- as.numeric (latin [104,3])
  •  mean_lighting <- as.numeric (latin [103,3])
  •  mean_euqipment <- as.numeric (latin [105,3])
  •  mean_hotwater <- as.numeric (latin [105,7])
  •  tempmatrix[i,1] <- i
  •  tempmatrix[i,2] <- mean_cooling
  •  tempmatrix[i,3] <- mean_HVAC
  •  tempmatrix[i,4] <- mean_lighting
  •  tempmatrix[i,5] <- mean_euqipment
  •  tempmatrix[i,6] <- mean_hotwater
  •  tempmatrix[i,7] <- hotwater+mean_lighting+mean_HVAC
  • }
  • }
  • colnames (tempmatrix) <- c (“Number”,“Cooling”,“HVAC”,“lighting”,“equipment”,“hotwater”,“addup”)
  • write.csv (tempmatrix, ‘result.csv’, row.names=TRUE)

Appendix B

Code for sensitivity analysis with the R programming language
  • indata <- read.csv (‘inputnew-yi01.csv’,header = TRUE,sep=“,”)
  • outdata <- read.csv (‘resultyi01-hotwater.csv’,header = TRUE,sep=“,”)
  • dim (indata);names (indata)
  • dim (outdata);names (outdata)
  • ## define inputs and outputs
  • newx <- indata[,c (2:14)]#inputs
  • newy1<- outdata[,2] #cooling
  • newy2<- outdata[,3] #HVAC
  • newy3<- outdata[,4] #lighting
  • newy4<- outdata[,6] #hotwater
  • newy5<- outdata[,7] #Total add up
  • names (newx) <- c
  • alldata1<- cbind (newx,newy1)
  • alldata2<- cbind (newx,newy2)
  • alldata3<- cbind (newx,newy3)
  • alldata4<- cbind (newx,newy4)
  • alldata5<- cbind (newx,newy5)
  • library (sensitivity)
  • ##Standardized Regression Coefficient
  • sensrc1<- src (newx,newy1)##run SRC method
  • print (sensrc1)##show results
  • plot (sensrc1)##plot results
  • abline (h=0,col=“red”)##plot a zero line
  • ##Standardized Regression Coeffiennts with 2000 times bootstrap
  • ##therefore the results will have the distributions,not only point estimate
  • sensrcbs1<- src (newx,newy1,nboot=2300)##run SRC
  • print (sensrcbs1)
  • windows ()##open a new window for plotts
  • plot (sensrcbs1)
  • abline (h=0,col=“red”)
  • sensrc2<- src (newx,newy2)##run SRC method
  • print (sensrc2)##show results
  • plot (sensrc2)##plot results
  • abline (h=0,col=“red”)##plot a zero line
  • ##Standardized Regression Coeffiennts with 2000 times bootstrap
  • ##therefore the results will have the distributions,not only point estimate
  • sensrcbs2<- src (newx,newy2,nboot=2300)##run SRC
  • print (sensrcbs2)
  • windows ()##open a new window for plotts
  • plot (sensrcbs2)
  • abline (h=0,col=“red”)
  • sensrc3<- src (newx,newy3)##run SRC method
  • print (sensrc3)##show results
  • plot (sensrc3)##plot results
  • abline (h=0,col=“red”)##plot a zero line
  • ##Standardized Regression Coeffiennts with 2000 times bootstrap
  • ##therefore the results will have the distributions,not only point estimate
  • sensrcbs3<- src (newx,newy3,nboot=2300)##run SRC
  • print (sensrcbs3)
  • windows ()##open a new window for plotts
  • plot (sensrcbs3)
  • abline (h=0,col=“red”)

References

  1. Pérez-Lombard, L.; Ortiz, J.; Pout, C. A review on buildings energy consumption information. Energy Build. 2008, 40, 394–398. [Google Scholar] [CrossRef]
  2. Chung, M.; Park, H.C. Comparison of building energy demand for hotels, hospitals, and offices in Korea. Energy 2015, 92, 383–393. [Google Scholar] [CrossRef]
  3. Li, Z. Research on Energy Consumption Quota and Energy Conservation Measures for Star-Level Hotel Buildings in Shandong Province. Master’s Thesis, Shandong Jianzhu University, Jinan, China, 2016. [Google Scholar]
  4. Yu, S. Research on the Energy Supply Mode of the Coupling System between Renewable Energy and Energy Storage in Passive Ultra Low Energy Buildings. Master’s Thesis, Shenyang Jianzhu University, Shenyang, China, 2018. [Google Scholar]
  5. Martínez, S.; Eguía, P.; Granada, E.; Moazami, A.; Hamdy, M. A performance comparison of multi-objective optimization-based approaches for calibrating white-box building energy models. Energy Build. 2020, 216, 109942. [Google Scholar] [CrossRef]
  6. Zhang, L.; Wen, J.; Li, Y.; Chen, J.; Ye, Y.; Fu, Y.; Livingood, W. A review of machine learning in building load prediction. Appl. Energy 2021, 285, 116452. [Google Scholar] [CrossRef]
  7. Mawson, V.J.; Hughes, B.R. Deep learning techniques for energy forecasting and condition monitoring in the manufacturing sector. Energy Build. 2020, 217, 109966. [Google Scholar] [CrossRef]
  8. Chai, Q.; Wang, H.; Zhai, Y.; Yang, L. Using machine learning algorithms to predict occupants’ thermal comfort in naturally ventilated residential buildings. Energy Build. 2020, 217, 109937. [Google Scholar] [CrossRef]
  9. Jain, R.K.; Smith, K.M.; Culligan, P.J.; Taylor, J.E. Forecasting energy consumption of multi-family residential buildings using support vector regression: Investigating the impact of temporal and spatial monitoring granularity on performance accuracy. Appl. Energy 2014, 123, 168–178. [Google Scholar] [CrossRef]
  10. Chen, Y.; Tan, H. Short-term prediction of electric demand in building sector via hybrid support vector regression. Appl. Energy 2017, 204, 1363–1374. [Google Scholar] [CrossRef]
  11. Fouladfar, M.H.; Soppelsa, A.; Nagpal, H.; Fedrizzi, R.; Franchini, G. Adaptive thermal load prediction in residential buildings using artificial neural networks. J. Build. Eng. 2023, 77, 107464. [Google Scholar] [CrossRef]
  12. Dong, B.; Cao, C.; Lee, S.E. Applying support vector machines to predict building energy consumption in tropical region. Energy Build. 2005, 37, 545–553. [Google Scholar] [CrossRef]
  13. Chavala, L.R.; Kurapati, S.R.; Pragati, M. Building Energy Consumption Prediction Model Using Machine Learning. In Cybernetics, Cognition and Machine Learning Applications, Proceedings of the ICCCMLA 2021, Singapore, 18 December 2021; Springer Nature: Singapore, 2022; pp. 9–18. [Google Scholar]
  14. Zhong, H.; Wang, J.; Jia, H.; Mu, Y.; Lv, S. Vector field-based support vector regression for building energy consumption prediction. Appl. Energy 2019, 242, 403–414. [Google Scholar] [CrossRef]
  15. Razak, O.A.; Hafiz, A.; Ismail, S.; Funlade, S.; Saheed, A. Building energy consumption prediction for residential buildings using deep learning and other machine learning techniques. J. Build. Eng. 2022, 45, 103406. [Google Scholar]
  16. Bagnasco, A.; Fresi, F.; Saviozzi, M.; Silvestro, F.; Vinci, A. Electrical consumption forecasting in hospital facilities: An application case. Energy Build. 2015, 103, 261–270. [Google Scholar] [CrossRef]
  17. Deng, H.; David, F.; Matthew, J.E. Predictive modeling for US commercial building energy use: A comparison of existing statistical and machine learning algorithms using CBECS microdata. Energy Build. 2018, 163, 34–43. [Google Scholar] [CrossRef]
  18. Tian, W. A review of sensitivity analysis methods in building energy analysis. Renew. Sustain. Energy Rev. 2013, 20, 411–419. [Google Scholar] [CrossRef]
  19. R Programming Language. Available online: https://www.rstudio.com/ (accessed on 26 November 2023).
  20. Saltelli, A.; Ratto, M. Global Sensitivity Analysis. The Primer; John Wiley: Hoboken, NJ, USA, 2008. [Google Scholar]
  21. EnergyPlus. Available online: https://energyplus.net/ (accessed on 26 November 2023).
  22. GB 50189-2015; Ministry of Housing and Urban Rural Development of the People’s Republic of China. Energy Efficiency Design Standards for Public Buildings. China Construction Industry Press: Beijing, China, 2015.
  23. Pan, X.; Chen, Y.; Deng, Z. Building a Typical Building Energy Consumption Model—Taking Changsha Shopping Mall Buildings as an Example. J. Xi’an Univ. Archit. Technol. (Nat. Sci. Ed.) 2021, 53, 947–954. [Google Scholar]
  24. Zheng, L. Research on Annual Air Conditioning Load Forecast of Shopping Mall in the Pearl River Delta Region Based on Machine Learning Method. Ph.D. Thesis, South China University of Technology, Guangzhou, China, 2019. [Google Scholar]
  25. Fumo, N. A review on the basics of building energy estimation. Renew. Sustain. Energy Rev. 2014, 31, 53–60. [Google Scholar] [CrossRef]
  26. Gu, W.; Tan, H.; Zhuang, Z. Analysis of the Current Situation and Characteristics of Energy Consumption in Hotel Buildings in China. Build. Energy Effic. 2014, 6, 56–62. [Google Scholar]
Figure 1. The distribution of public area functions in 78 high-rise hotel drawings.
Buildings 14 00356 g001
Figure 2. Typical model (a) and guest room floor plan (b) for the strip layout method model. Typical model (c) and guest room floor plan (d) for the square layout method model.
Buildings 14 00356 g002
Figure 3. Standard regression coefficients for the geometric feature parameters (a), internal heat source parameters (b), and thermal parameters (c).
Buildings 14 00356 g003
Figure 4. Steps for establishing a building energy consumption prediction model.
Buildings 14 00356 g004
Figure 5. Calculation results of EH for the strip floor model group (a) and the square floor model group (b).
Buildings 14 00356 g005
Figure 6. Comparison between prediction and calculation EH value from quadratic polynomial regression model for the strip floor model group (a) and the square floor model group (b).
Buildings 14 00356 g006
Table 1. Thermal parameters and internal heat source factor variables, along with their values.
VariableRange
Lighting power density of a guest room (Wm−2)5–7
Lighting power density of a guest floor corridor (Wm−2)2.5–3.5
Guest floor cooling point (°C)24–27
Guest floor heating point (°C)20–22
Hot water consumption per person (L)110–140
Energy efficiency ratio of chillers (%)530–630
North external window heat transfer coefficient (Wm−2 K−1)2.0–4.0
South external window heat transfer coefficient (Wm−2 K−1)2.0–4.0
East external window heat transfer coefficient (Wm−2 K−1)2.0–4.0
West external window heat transfer coefficient2.0–4.0
North external window heat gain coefficient0.18–0.44
South external window heat gain coefficient0.18–0.44
East external window heat gain coefficient0.18–0.44
West external window heat gain coefficient0.18–0.44
Solar radiation absorption coefficient of an external wall0.35–0.8
Heat transfer coefficient of an external wall (Wm−2 K−1)0.5–1.5
Solar radiation absorption coefficient of the roof0.35–0.8
Heat transfer coefficient of the roof (Wm−2 K−1)0.3–0.9
Table 2. Typical model parameters for guest rooms in high-rise hotel buildings.
ParameterValue
Width to length ratio of the room (%)50
Single room area (m2)40
Single room length (m)8.94
Single room width (m)4.47
Guest floor height (m)3.4
Number of guest floors14
Number of rooms on one side of a strip plan10
Number of rooms on the long side of a square plan8
Number of rooms on the short side of a square plan2
Corridor width of the guest floor (m)2.2
Area ratio of the window to the wall (%)34
Square floor length (m)35.76
Square floor width (m)31.22
Square floor area (m2)1116.42
Strip floor length (m)58.05
Strip floor width (m)20.08
Square guest floor area (m2)1165.64
Table 3. Area of each functional space of the hotel.
Area of L3 (m2)Area of L2 (m2)Area of L1 (m2)
Lobby1597.5951.0433.4
Office1238.6461.399.5
Restaurant3026.21314.9439.7
Media Hall1211.6676.8230.2
Meeting Room799.8309.2-
Commercial554.9169.5-
Bathing577.7220.8-
Fitness173.3--
Hairdressing92.9--
Bar466.0--
Kitchen1008.7526.0199.9
Total3246.91367.8601.1
Non-temperature-controlled area606.0301.6177.4
Table 4. Variables and quantitative parameters of the energy consumption prediction model database.
Parameter CategoryParameter Name and UnitValue or Range
Geometric variable parametersHeight of public area (m)3.4–6
Total number of floors8–24
Area of a single room (m2)20–60
Number of rooms on one side8–40
Temperature-controlled area of a public space (m2)619–4111
Area ratio of window to wall (%)10–90
Geometric quantitative parametersArea ratio of window to wall in a guest floor (%)24
Corridor width of a guest floor (m)2.2
Guest floor height (m)3.4
Width-to-length ratio of the room (%)50
Building orientation (angle from north)0
Area ratio of the north-south window to the wall in a public area (%)68
Area ratio of the east-west window to the wall in a public area (%)68
Internal heat source variable parametersGuest floor cooling point (°C)24–28
Hot water consumption per person (L)110–140
Energy efficiency ratio of chillers (%)540–630
Boiler efficiency (%)80–98
Internal heat source quantitative parametersGuest floor heating point (°C)22
Lighting power density of a guest floor corridor (Wm−2)5
Lighting power density of a guest room (Wm−2)7
Lighting power density of a public area (Wm−2)10
Public area cooling point (°C)22
Public area heating point (°C)18
Thermal variable parametersNorth external window heat transfer coefficient (Wm−2 K−1)1.8–4.0
East external window heat gain coefficient (Wm−2 K−1)0.18–0.44
Solar radiation absorption coefficient of an external wall0.35–0.8
Solar radiation absorption coefficient of the roof0.35–0.8
Heat transfer coefficient of the roof (Wm−2 K−1)0.3–0.8
Thermal quantitative parametersSouth external window heat transfer coefficient (Wm−2 K−1)3.0
West external window heat transfer coefficient (Wm−2 K−1)3.0
East external window heat transfer coefficient (Wm−2 K−1)3.0
Heat transfer coefficient of an external wall (Wm−2 K−1)1.50
South external window heat gain coefficient (Wm−2 K−1)0.44
West external window heat gain coefficient (Wm−2 K−1)0.44
North external window heat gain coefficient (Wm−2 K−1)0.48
Table 5. R2 and variance for predicting total energy consumption per unit area.
ModelCodeStrip Layout Method ModelSquare Layout Method Model
R2VarianceR2Variance
Polynomial regressionPR10.930.0080.90.014
Quadratic polynomial regressionPR20.960.0040.950.008
k-Nearest neighborsKNN0.3090.0480.5670.026
Regression decision treeCART0.4360.0690.6920.036
Elastic network regressionEN0.7440.0180.7810.021
LASSO regressionLASSO0.7680.0210.770.021
Linear regressionLR0.930.0090.8990.014
Ridge regressionRIDGE0.930.0090.8990.014
Gradient boostingAB0.7490.0260.8370.015
Gradient boosting nearest neighborsABKNN0.1510.0720.4970.05
Random forest regressionRFR0.7950.0230.8750.009
Extreme random tree regressionETR0.8140.0180.8870.01
Gradient boosting regression treeGBR0.9030.0080.9210.008
Gradient boosting regressionABLR0.9290.0090.8930.012
Table 6. Comparison of the prediction and simulated calculation values.
Model NameEH (kWhm−2)E0 (kWhm−2)Bias
Square L1131.004121.18−8.11%
Square L2136.01126.54−7.48%
Square L3145.05148.592.38%
Strip L1108.164116.146.76%
Strip L2125.594122.87−2.95%
Strip L3136.85141.482.94%
Disclaimer/Publisher’s Note: The statements, opinions and data contained in all publications are solely those of the individual author(s) and contributor(s) and not of MDPI and/or the editor(s). MDPI and/or the editor(s) disclaim responsibility for any injury to people or property resulting from any ideas, methods, instructions or products referred to in the content.

