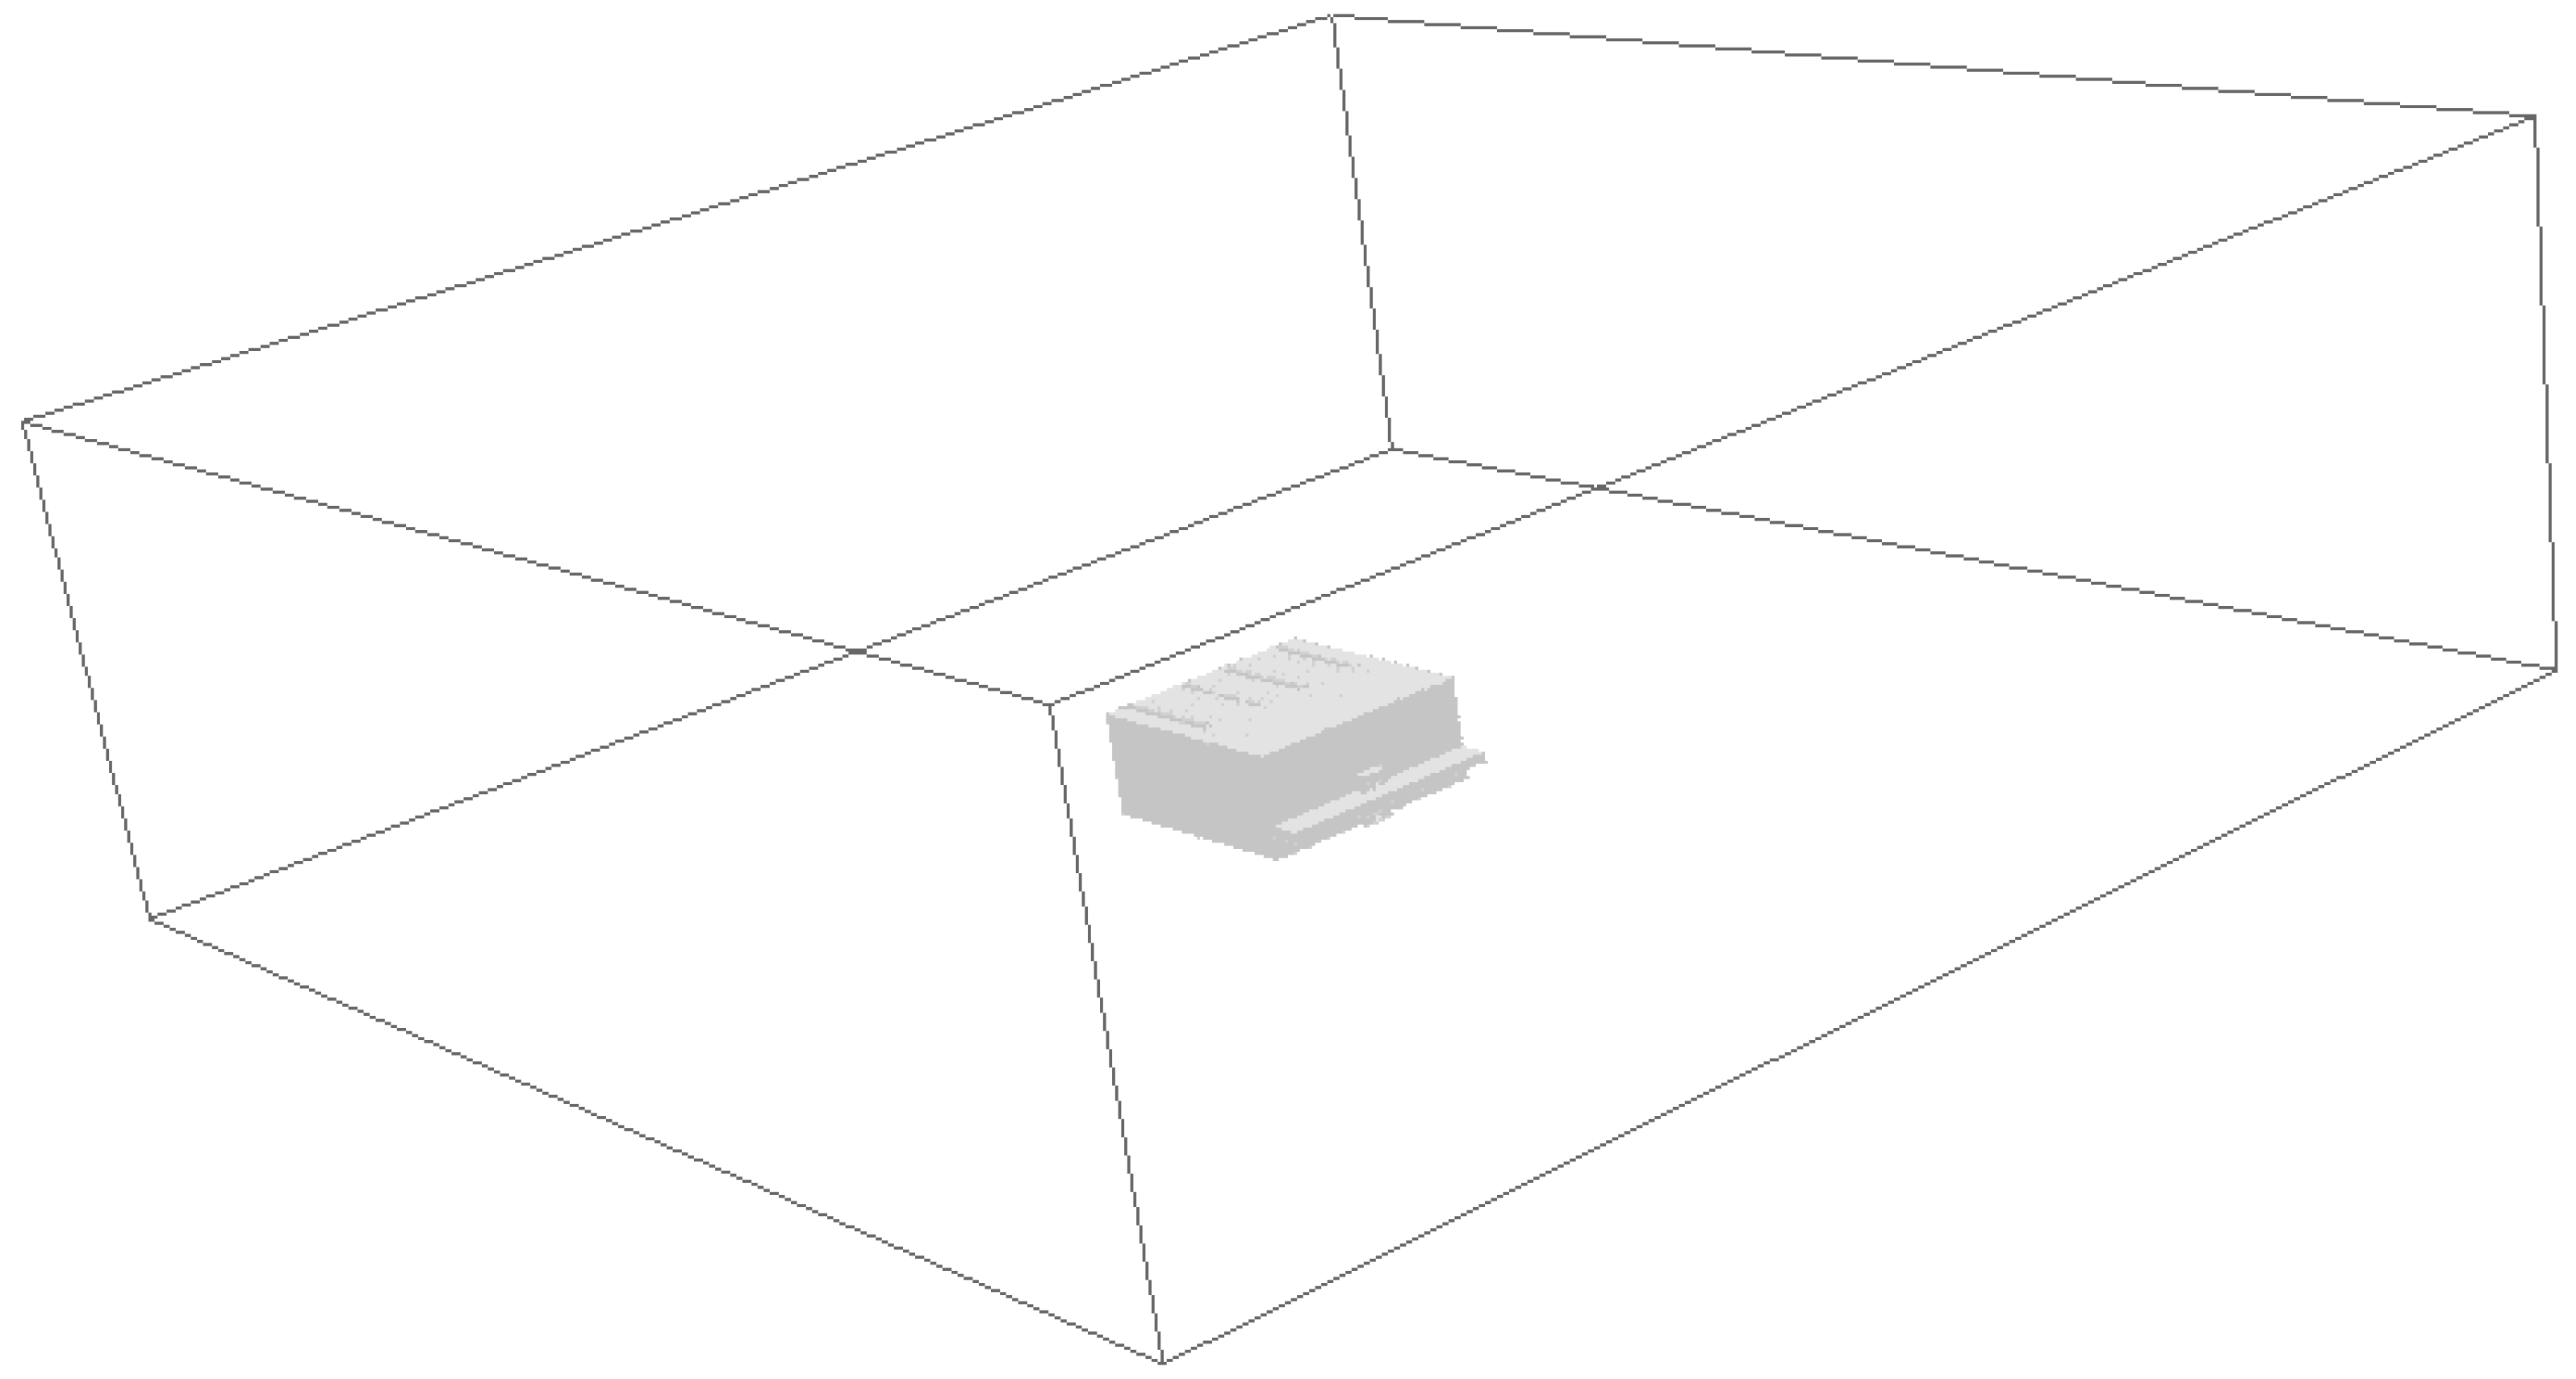
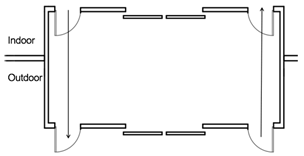
Article

A Wind Protection Design Strategy for Airport Terminal Door Bucket Space Based on Wind Environment Simulations

School of Human Settlements and Civil Engineering, Xi’an Jiaotong University, Xi’an 710049, China
*
Author to whom correspondence should be addressed.
Buildings 2024, 14(2), 344; https://doi.org/10.3390/buildings14020344
Submission received: 17 December 2023 / Revised: 12 January 2024 / Accepted: 22 January 2024 / Published: 26 January 2024
(This article belongs to the Special Issue Environmental Comfort and Energy Consumption in Buildings)

Abstract

:
Airport terminal buildings are large public transportation buildings with complex functions and dense crowds, and the wind environment has significant effects on passenger comfort and the energy consumption of air conditioning systems. In this study, we investigated Xianyang T3 Terminal as an example and used the Phoenics software to conduct comprehensive simulations based on different door bucket forms and parameters, as well as comprehensively considering the impacts of different outdoor wind environments. A terminal door bucket windproof design strategy was proposed based on our results. The results showed that door buckets could effectively reduce the entry of outdoor wind, and built-in door buckets performed the best. The width of the door bucket should be set to 9.3–11.3 m and the depth of the door bucket to 6.7–7.7 m. The height of the door bucket had little impact. A side door should be added to the door bucket, so it can be opened when the outdoor wind speed is high, and a mechanical ventilation system should be introduced to improve the indoor ventilation.

1. Introduction

Due to the rapid advancement of urbanization in China, the scale of the construction industry has grown rapidly, and the problem of building energy consumption has also intensified alongside rapid economic development. China adheres to the path of sustainable development and relevant requirements have been proposed to promote the comprehensive green transformation of economic and social development in the “14th Five-Year Plan”. The Civil Aviation Administration of China has also included a special chapter on green development in the “14th Five-Year Plan” to focus on promoting energy conservation in civil aviation, reducing pollution, and decreasing carbon consumption through collaborative management.
Airport terminals are buildings with high energy consumption due to their huge building scale and hot and humid indoor environment requirements. In recent years, the domestic civil aviation industry has developed rapidly and passenger throughput has increased significantly. Consequently, terminal door buckets remain open, and increases have occurred in the intrusion of cold wind during the winter and hot air during the summer, thereby decreasing the thermal comfort of passengers, with continuous increases in the needs for air conditioning and refrigeration, thus increasing heating energy consumption. Therefore, it is necessary to develop an appropriate design for terminal door buckets to optimize the indoor wind environment. By changing the shape and structure of terminal door buckets, we can obtain better natural ventilation effects to reduce the wind system load on the building, i.e., the air conditioning system load.
Due to the emergence of high-rise buildings and the development of computational fluid dynamics (CFD), many studies have used CFD methods to simulate and research wind environments. However, few wind environment simulations have been conducted for terminal buildings, although studies of other similar large public buildings provided useful references for the present study.
Nguyen and Reiter [1] and Vanhooff and Blocken [2] conducted studies on airflow using the CFD software Phoenics. Bonser et al. [3] used CFD to simulate the wind and heat environments inside a football stadium. Zheng et al. [4] applied CFD to explore the influence of vent shapes on the wind pressure ventilation in a gymnasium, analyzing the effects from various perspectives, including air intake, airflow depth, and wind speed in key functional areas. Focusing on airport terminals, Tang et al. [5] carried out long-term indoor environmental quality monitoring for indoor thermal environment measurements in a large terminal building. Xinyu et al. [6,7] studied the relationship between wind speed and the thermal comfort of passengers in airport terminals. Jing et al. [8] studied the relationship between the indoor environment and comfort behaviors. Jingyu et al. [9] proposed methods for enhancing thermal comfort in large public buildings based on the analysis of thermal comfort. A specific study by Mingyang et al. [10] at Xi’an Xianyang International Airport’s T2 and T3 terminals involved field tests to compare indoor wind and heat conditions under varying air supply methods. Xiaojia [11] provided a comprehensive summary of door bucket types, shapes, dimensions, and opening forms in terminal entrances and exits, using Airpak to simulate their impact on the terminal buildings’ indoor thermal environments. Previous studies in China and other countries have conducted comprehensive indoor wind environment simulations, but research into the wind environments in terminal buildings has mainly been based on field tests, with relatively few simulations of natural ventilation.
In the present study, we conducted indoor wind environment simulations using indicators, such as wind speed, air age, ventilation efficiency, and ventilation times, to study the pollutant diffusion and ventilation effects of the indoor wind environment. We investigated the Xianyang T3 terminal building as an example and used the Phoenics software to simulate the wind speed and air age for the door bucket, as well as the indoor personnel long-term stay area of the terminal building under natural ventilation conditions. We aimed to assess the door bucket form that could achieve the best natural ventilation effect, and to provide an experimental basis for the subsequent optimization of the door bucket form for the terminal building. By taking the wind speed in the area where people stayed for a long time as the constraint and the minimum indoor air age as the goal, the indoor wind environment at the terminal door bucket was optimized and we proposed a windproof design strategy for the door bucket.

2. Evaluation Criteria for Natural Ventilation

Natural ventilation is divided into two types, comprising wind pressure ventilation and thermal pressure ventilation. Wind pressure ventilation refers to the formation of a pressure difference at different locations on a building’s surface, so the building blocks the airflow movement. The airflow will pass through the holes on the building’s surface and flow indoors under the action of the pressure difference to result in indoor ventilation. Thermal pressure ventilation refers to the density difference caused by differences in the air temperature driving the airflow. The most typical example of hot pressure ventilation is the “chimney effect”.
According to the “Green Terminal Building Standard” (MH/T 5033-2017) [12], when a terminal uses a centralized air conditioning and heating system, the indoor temperature, humidity, fresh air volume, and other design parameters should comply with the “Civil Building Heating, Ventilation and Air Regulation Design Specifications” (GB 50736-2012) [13]. The “Civil Building Heating, Ventilation and Air Regulation Design Specifications”(GB 50736-2012) [13] stipulate the indoor design parameters for air conditioning in areas where people stay for a long time, as shown in Table 1.
Regarding the design standard for the wind speed in indoor wind environments, Wei et al. [14] studied the minimum wind speed that can be perceived by humans at different temperatures and summarized the effects of wind speed on human comfort, as shown in Table 2.
Previous studies of indoor wind environments have mostly used indicators such as wind speed, air age, and air exchange volume for evaluation. For example, Yang [15] evaluated the ventilation effects of high and low side windows in gymnasiums in severe cold areas based on two indicators, comprising ventilation volume and air age. Bonser et al. [3] evaluated the effects of opening and closing the roof of a stadium on the indoor wind environment based on the ground level of the playing field in the stadium, as well as the magnitude of the wind speed in the stands. Moreover, Nguyen and Reiter [1] investigated the effects of six different roof shapes, including curved and conical roof shapes, on indoor natural ventilation based on the airflow pathways and wind speeds.
According to previous research, in the present study, we established indoor wind environment evaluation standards based on the indoor air age, indoor wind speed, and other parameters to evaluate the indoor wind environment at the door bucket in simulations. We aimed to obtain the minimum indoor wind speed and minimum indoor air age by optimizing the design of the indoor wind environment at the terminal door.
The indoor wind speed has great impacts on passenger comfort. In this study, we used the “Green Terminal Building Standard” (MH/T 5033-2017) [12] and results obtained in previous research to summarize the relationships between the indoor wind speed and human comfort (Table 3). In particular, the human body feels comfortable when the indoor wind speed is less than or equal to 0.3 m/s, the human body can feel the breeze and experience moderate comfort when the indoor wind speed is greater than 0.3 m/s and less than or equal to 0.6 m/s, the human body feels slightly uncomfortable when the wind speed is slightly higher at greater than 0.6 m/s and less than 1.0 m/s, and the human body feels uncomfortable when the indoor wind speed is greater than 1 m/s.
The air age can be used to represent the effectiveness of ventilation. Air age refers to the time that the air at a certain observation point remains at that location. Therefore, the air age is lower when the air circulation is faster and the ventilation rate is faster, and thus the ventilation is more effective, but vice versa in the opposite conditions.
Recent studies have conducted various types of structural research to elucidate the relationship between wind speed, air age, and human comfort, contributing significantly to our understanding of this complex interplay. Di and Wang’s work [16] proved the relationship between wind speed and human comfort, and Huang’s work [17] proved the relationship between air age and human comfort.

3. Simulation Method

The Phoenics software was used to simulate and analyze the indoor wind environment at the door bucket in a terminal building, and to study the effects of different door bucket patterns (door bucket type, door bucket scale, and door opening form) and outdoor wind directions on the indoor wind environment, based on indexes such as the wind speed and air age. The simulations were conducted using the standard k-epsilon (KE) turbulence equation. The simulations focused on the indoor wind environment at 1.5 m above the ground in the door bucket space.

3.1. Computational Domain and Grid Setup

The sizes of the computational domain and the experimental model were established based on the floor plan of the T3 terminal at Xi’an Xianyang International Airport. The size of the computational domain was set to 575.2 m (length, X) × 506.8 m (width, Y) × 157 m (height, Z), and that of the experimental model was set to 82.2 m (length, X) × 72.4 m (width, Y) × 31.4 m (height, Z). The exterior wall of the T3 terminal is a glass curtain wall, which is simplified as a vertical curtain wall with a total of two floors and a patio connecting it internally. Six skylights are located on the top, each with a size of 34 m (length, X) × 3 m (width, Y). A door bucket is located in the middle on one side. The size of the door bucket is 9.3 m (length, X) × 4.7 m (width, Y) × 4.8 m (height, Z).
As shown in Figure 1, the opening width of the automatic door in the middle of the door bucket is 3 m and the opening width of the manual doors on both sides is 1 m. The distances between the model and the front and rear boundaries of the computational domain are equal at 246.6 m. The distances between the model and the left and right boundaries of the computational domain are equal at 217.2 m. Figure 1 shows a schematic illustration of this setup.
In our study, a structured grid was selected based on the shape and size of the simulation area. For the simulations focusing on the door bucket space, we utilized grids of varying dimensions: 40 cm × 40 cm × 20 cm, 50 cm × 50 cm × 30 cm, and 80 cm × 80 cm × 50 cm. Through our evaluations, we found that the grid measuring 50 cm × 50 cm × 30 cm offered the most efficient calculation speed and a higher accuracy, with only a marginal difference compared to the smaller 40 cm × 40 cm × 20 cm grid. Consequently, we finalized the grid dimensions for the door bucket simulations to be 50 cm × 50 cm × 30 cm. This grid configuration resulted in a total of 1,200,060 grid squares, and we set the number of iterations for the simulations at 1000.

3.2. Parameter Settings

The experimental simulations were configured using summer meteorological data specific to Xianyang, Shaanxi Province, China. These data align with the parameters outlined in “Design specifications for heating, ventilation and air conditioning in civil buildings” (GB 50736-2012) (Table 4). Xianyang, situated near the major city of Xi’an on the Guanzhong Plain, is positioned at approximately 34°20′ N latitude. Xianyang is designated as Climate zone IIc in the Chinese climate classification system.
Among the various working conditions when changing the shape of the door bucket, only the second-layer door bucket was changed. The other simulation parameter settings were as shown in Table 5.
In this study, our primary objective is to analyze the conditions of summer comfort. Recognizing the extensive research already available on winter comfort, our focus is directed towards the less explored domain of summer comfort. This is because, during the winter, the presence of covered or closed doors and the use of indoor heating systems substantially alter the natural wind environment. Such alterations present challenges in obtaining simulation results that accurately reflect winter conditions.
Our research methodology intentionally excludes temperature as a variable. This approach allows us to concentrate specifically on the impact of changes in wind speed and air age on human comfort.
Table 5. Various parameter settings used for simulation calculations.
Basic ParameterSetting
Door bucket typeMid-mounted
Door bucket width9.3 m
Door bucket depth4.7 m
Door bucket height4.8 m
Door bucket typeMid-mounted
Outdoor temperature29.9 °C
Outdoor wind speed1.7 m/s
Outdoor wind directionWNW
Outdoor air pressure953.1 hPa
TurbulenceStandard KE turbulence model
Door opening formSee Figure 2

3.3. Measurement Point Selection

By comparing the wind speed and air age at different distances from the door bucket on the central axis of the door bucket in the terminal building, we evaluated the comfort and ventilation effect of the indoor wind environment at the door bucket in the terminal building under different working conditions. We evaluated the effects of different conditions, such as the type of door bucket, scale of the door bucket, open door form, and direction of the wind from outside, on the indoor wind environment at the door bucket, and determined the working conditions that agreed with the optimal indoor conditions according to the simulation results. The specific measurement points are shown in Figure 3.
Figure 3 shows that all of the measurement points were located on the central axis of the door bucket. By taking the intersection of the extension line of the horizontal wall and the central axis of the door bucket as the origin, a measurement point was set every 3 m outward, with two measurement points set on the outdoor side and five measurement points set on the indoor side, with a total of eight measurement points.

3.4. Settings for Working Conditions

In order to analyze the effects of different door bucket types on the indoor wind environment at the door bucket in the terminal building, according to the planar relationship between the door bucket and the building facade, the door bucket in the terminal building was divided into the following four types: no door bucket type, door bucket built-in type, door bucket mid-mounted type, and door bucket external type. The computational simulation conditions for these four types are shown in Figure 4.
In order to analyze the effects of the door bucket scale on the indoor wind environment at the door bucket in the terminal building, based on the original dimensions of the door bucket, we changed the door bucket face width, door bucket depth, and door bucket height, and the simulation calculations were compared with the original situation. To study the impact of the door bucket surface width on the indoor wind environment at the terminal door bucket, the depth and height were kept at their original dimensions, and the surface width was increased from 7.3 m to 13.3 m with a step length of 2 m. To study the impact of the door bucket depth on the indoor wind environment at the terminal door bucket, the surface width and height were kept at their original dimensions, and the depth was increased from 3.7 m to 7.7 m with a step length of 1 m. To study the impact of the door bucket height on the indoor wind environment at the terminal door bucket, the surface width and depth were kept at their original dimensions, and the height was increased from 3.8 m to 5.8 m with a step length of 0.5 m. In total, 12 different working conditions were established for simulations, as shown in Table 6.
In order to analyze the impacts of different door bucket opening methods on the indoor wind environment at the terminal door bucket, the six calculation simulation conditions shown in Table 7 for door opening forms under different streamline conditions were tested. In particular, simulation 1 tested the opening of all doors on both sides, simulation 2 tested only opening the manual doors on both sides, and simulation 3 tested only opening the automatic doors on both sides. Simulations 4, 5, and 6 tested three working conditions in the door bucket room on both sides of the side door, comprising the side door size, the same size of the manual door, and an opening width of 1 m. Simulation 4 tested only opening the outer automatic door with two side doors. Simulation 5 tested opening the outer automatic door, one inner side door, and the adjacent manual door. Simulation 6 tested opening the outer automatic door, one inner side door, and the diagonal manual door.
The effects of different outdoor wind directions on the indoor wind environment at the door bucket in the terminal building were also analyzed. For the door bucket at the windward side, the following five dominant wind directions were calculated to simulate the working conditions, which were expressed as the angle of the vertical direction relative to the wall of the building, where the clockwise direction was the positive direction and the counterclockwise direction was the negative direction. Table 8 shows the different simulated wind directions.

3.5. Model Validation

To validate the accuracy of our simulation results, we undertook in situ wind speed measurements on the second floor of Xianyang Airport’s T3 terminal building, as indicated in Figure 5. These measurements were conducted on 27 May 2023, at a height of 1.5 m above the floor level. We established our origin at the intersection of the wall’s center axis and the center axis of the right-side automatic door. Measurement points were set at 3 m intervals inside the building, extending up to 15 m from the origin. On the day of the measurements, the environmental conditions were as follows: a minimum temperature of 16 °C, a maximum temperature of 17 °C, moderate rain, and a southwesterly wind at force 1 with an outdoor wind speed of 0.5 m/s.
The collected wind speed data are shown in Table 9. Figure 6 presents the simulation results. A comparison between the in situ measurements and the simulation data, as depicted in Table 9, demonstrates a close alignment.

4. Results and Discussion

4.1. Experimental Simulations of Different Types of Door Buckets

4.1.1. Wind Speed

When the outdoor wind speed was 1.7 m/s and the outdoor temperature was 29.9 °C, Figure 7 shows the wind speed cloud diagram at a pedestrian height of 1.5 m for each door bucket type and working condition. The changes in the wind speed within the experimental model for each door bucket type and working condition are shown in Table 10 and Figure 8.
In Figure 7, the yellow area is the range where the wind speed was greater than 2.50 m/s. When there was no door bucket, there were a small number of bright yellow areas and a large number of green areas at the door, and the indoor wind speed was high. The wind speed at the center of the door bucket was as high as 3.13 m/s and the indoor comfort was low. After using the door bucket, there were no bright yellow areas in the interior of the door bucket under the three working conditions for DBB, DBM, and DBE, and there was only a small green area behind the door inside the door bucket, thereby indicating that the activation of the door bucket could reduce the indoor wind speed at the door bucket.
The specific changes in the indoor wind speed on the central axis of the door bucket are shown in Table 10 and Figure 8. Figure 8 shows that, under the working conditions with an added door bucket, when the outdoor wind blew from outside to indoors, the wind speed tended to decrease and then slowly increase. Figure 7 shows that this was caused by the speed of the outdoor wind decreasing when it passed through the door bucket. The automatic door on one side of the room was closed and the outdoor wind entered from the manual doors on both sides, so the wind speed was also lower in the room closer to the door bucket. Due to the outdoor wind blowing in through the manual doors on both sides, the wind speed increased slightly when the indoor distance was slightly farther from the door bucket, before stabilizing as the distance increased.
Table 10 shows that, from 9 m to 15 m indoors, the wind speed for the NDB type decreased from 0.37 m/s to 0.31 m/s, with a decrease of 0.06 m/s. The wind speed for the DBB type increased from 0.15 m/s to 0.49 m/s, with an increase of 0.34 m/s. The wind speed for the DBM type increased from 0.28 m/s to 0.55 m/s, with an increase of 0.27 m/s. The wind speed for the DBE type increased from 0.51 m/s to 0.56 m/s, with an increase of 0.05 m/s. In addition, the wind speeds for the NDB and DBE types exhibited small fluctuations, but the wind speeds for the DBB and DBM types increased as the distance increased. The wind speed conditions at 15 m indoors under each working condition are shown in Figure 9.
Figure 9 shows that, at 15 m indoors, the wind speed was lowest for the no door bucket type at only 0.31 m/s. However, Figure 7a shows that, when there was no door bucket, the outdoor wind direction had a greater impact on the airflow direction at the door bucket, where it made the high wind speed area deviate from the door bucket central axis. In fact, the indoor high wind speed area was the largest for the door bucket type, with the most severe outdoor wind intrusion. Table 10 shows that the wind speeds for the DBB, DBM, and DBE types increased in order, with speeds of 0.49 m/s, 0.55 m/s, and 0.56 m/s, respectively, and the differences were small. Table 3 shows that the wind speeds were all moderate for the DBB, DBM, and DBE types. However, at 12 m indoors, the wind speeds for the DBB, DBM, and DBE types were 0.36 m/s, 0.52 m/s, and 0.58 m/s, respectively. The wind speed was lowest for the DBB type, where the wind speeds differed by 0.16–0.22 m/s compared with those for DBM and DBE types. Thus, the differences were relatively great.
To improve passenger comfort, the lowest indoor wind speed can be achieved by using the DBB type. However, due to the requirement for wind speed in the comfortable state being less than or equal to 0.3 m/s, additional mechanical ventilation equipment needs to be introduced to reduce the entry of outdoor wind, thereby reducing the indoor wind speed.

4.1.2. Air Age

When the outdoor wind speed was 1.7 m/s and the outdoor temperature was 29.9 °C, Figure 10 shows the air age cloud diagrams at a pedestrian height of 1.5 m under each door bucket type working condition. The changes in air age from the origin to 15 m indoors under each door bucket type working condition are shown in Table 11 and Figure 11.
Table 11 and Figure 11 show that, from 9 m to 15 m indoors, the air age for the no door bucket type decreased from 1576.0 s to 1543.0 s, with a decrease of 33 s. The air age for the door bucket built-in type decreased from 1652.3 s to 1378.9 s, with a decrease of 273.4 s (16.5%). The air age for the door bucket center-mounted type decreased from 1429.1 s to 1399 s, with a decrease of 30.1 s (2.1%). The air age for the door bucket external type increased from 1237.7 s to 1422.5 s, with an increase of 184.8 s (14.9%). The air age for the external door bucket type increased as the distance increased, but the air age decreased as the distance increased for the other types. The air age conditions at 15 m indoors under each working condition are shown in Figure 12.
Figure 12 shows that, at 15 m indoors, the air age was the highest for the no door bucket type at 1543.0 s. The air ages for the door bucket built-in type, door bucket mid-mounted group, and external door type increased in order, with 1378.9 s, 1399.0 s, and 1422.5 s, respectively. In terms of the ventilation effect, the lowest air age value can be obtained by using a built-in door bucket. The T3 terminal is huge and the natural ventilation system only includes skylights and door buckets, so the indoor air mobility is poor and the air age is high. Therefore, additional mechanical ventilation should be introduced to further reduce the air age and enhance the ventilation effect.
Based on the wind speed and air age conditions with the four door bucket types, it can be concluded that a large amount of outdoor wind intrudes when there is no door bucket, so the local wind speed indoors is excessively high, the surrounding wind speed is excessively low, and the air age is excessively high. Adding door buckets can reduce the indoor wind speed and effectively decrease the intrusion of outdoor wind. Under the working conditions with an added door bucket, according to the indoor wind speed and air age, the results from lowest to highest were obtained with all door buckets of the inner type, door buckets of the middle type, and then door buckets of the outer type. Therefore, it is best to use a built-in door bucket.

4.2. Experimental Simulations of Different Door Bucket Scales

4.2.1. Wind Speed

Simulations of Different Widths

When the outdoor wind speed was 1.7 m/s and the outdoor temperature was 29.9 °C, Figure 13 shows the wind speed cloud diagram at a 1.5 m pedestrian height for each door bucket width. The changes in the wind speed from 6 m outdoors to 15 m indoors for each door bucket width are shown in Table 12 and Figure 14.
Table 12 shows that, at indoor positions from 9 m to 15 m, the wind speed with a door bucket width of 7.3 m increased from 0.11 m/s to 0.43 m/s, with an increase of 0.32 m/s. The wind speed with a door bucket width of 9.3 m increased from 0.28 m/s to 0.55 m/s, with an increase of 0.27 m/s. The wind speed with a door bucket width of 11.3 m increased from 0.17 m/s to 0.31 m/s, with an increase of 0.14 m/s. The wind speed with a door bucket width of 13.3 m decreased from 0.56 m/s to 0.39 m/s, with a decrease of 0.17 m/s. The wind speed with a door bucket width of 13.3 m decreased as the distance increased, but the wind speed increased as the distance increased with the other door bucket widths. The wind speeds at 15 m indoors for each door bucket width are shown in Figure 15.
Figure 15 shows that, at 15 m indoors, the wind speed was lowest at 0.31 m/s when the door bucket width was 11.3 m. According to Table 3, the wind speed was moderate with a door bucket width of 11.3 m. Under the other widths, the wind speeds ranging from smallest to highest were obtained with the door bucket widths of 13.3 m, 7.3 m, and 9.3 m, where the wind speeds were 0.39 m/s, 0.43 m/s, and 0.55 m/s, respectively. According to Table 3, the wind speeds were all at moderate levels with the door bucket widths of 13.3 m, 7.3 m, and 9.3 m.
As the width increased, due to outdoor wind blowing into the room from both sides of the manual door, the change in the spacing on both sides of the manual door influenced the reduction in the wind speed on the center axis of the door bucket. Figure 8 and Figure 13 show that, due to the influence of the outdoor wind direction, the wind speed in the indoor area on the central axis of the door bucket was mainly affected by the outdoor wind passing through the door (1). At 15 m indoors, the wind speed was lower with a width of 7.3 m than 9.3 m, and the wind speed was greater with a width of 13.3 m than 11.3 m. However, Figure 13a shows that, when the widths were 7.3 m and 13.3 m, the distributions of the outdoor wind speed behind the manual doors on both sides were quite different, where the high-wind-speed area behind door (3) was narrower and longer when the width was 7.3 m. In fact, the green high-wind-speed area increased and the high-wind-speed area behind door (1) was shortened, which had little impact on the wind speed on the central axis of the terminal door bucket. When the width was 13.3 m, the high-wind-speed area behind door (1) was far away from the central axis of door (1) and it deviated toward the central axis of the door bucket, which greatly affected the wind speed on the central axis of the terminal door bucket, but the actual green high-wind-speed area decreased. Therefore, the actual outdoor wind intrusion situation was more severe with a width of 7.3 m than 9.3 m, and the outdoor wind intrusion situation was improved with a width of 13.3 m compared with 11.3 m.
In general, as the width of the door bucket increased, the indoor high-wind-speed area gradually decreased and the comfort level increased. Thus, from a passenger comfort perspective, a door bucket width of 11.3–13.3 m is more appropriate.

Simulation at Different Depths

When the outdoor wind speed was 1.7 m/s and the outdoor temperature was 29.9 °C, Figure 16 shows the wind speed cloud diagram at a pedestrian height of 1.5 m under each door bucket depth. The changes in the wind speeds for each door bucket depth from 6 m outdoors to 15 m indoors are shown in Figure 16 and Figure 17 and Table 13.
Table 13 shows that, from 9 m to 15 m indoors, the wind speed with a door bucket depth of 3.7 m increased from 0.35 m/s to 0.55 m/s, with an increase of 0.20 m/s. The wind speed with a door bucket depth of 4.7 m increased from 0.28 m/s to 0.55 m/s, with an increase of 0.27 m/s. The wind speed with a door bucket depth of 5.7 m increased from 0.18 m/s to 0.53 m/s, with an increase of 0.35 m/s. The wind speed with a door bucket depth of 6.7 m increased from 0.11 m/s to 0.39 m/s, with an increase of 0.28 m/s. The wind speed with a door bucket depth of 7.7 m increased from 0.12 m/s to 0.24 m/s, with an increase of 0.12 m/s. Thus, the wind speed increased with the distance from 9 m to 15 m indoors under all of the door bucket depths. The wind speeds at 15 m indoors under each of the door bucket depths are shown in Figure 18.
Figure 18 shows that, at 15 m indoors, when the door bucket depth was 7.7 m, the wind speed was lowest at only 0.24 m/s. Table 3 shows that the wind speed was comfortable with a door bucket depth of 7.7 m. The wind speeds with door bucket depths of 6.7 m, 5.7 m, 4.7 m, and 3.7 m were 0.39 m/s, 0.53 m/s, 0.55 m/s, and 0.55 m/s, respectively. According to Table 3, the wind speed was moderate with door bucket depths of 6.7 m, 5.7 m, 4.7 m, and 3.7 m. As the door bucket depth increased, the wind speed at 15 m indoors changed in a more obvious linear manner, and the wind speed decreased as the depth of the door bucket increased.
In general, as the door bucket depth increased, the indoor wind speed gradually decreased. When the door bucket depth increased from 5.7 m to 7.7 m, the indoor wind speed decreased significantly. When the depth increased to 7.7 m, the wind speed at 15 m indoors decreased to 0.24 m/s from 0.55 m/s with the original depth of 4.7 m. The effect was significant and the wind speed was at a low level. From a passenger comfort perspective, a door bucket depth of 6.7–7.7 m is more appropriate.

Simulation at Different Heights

When the outdoor wind speed was 1.7 m/s and the outdoor temperature was 29.9 °C, Figure 19 shows the wind speed nephograms at a 1.5 m pedestrian height for each door bucket height. The changes in the wind speeds for each door bucket height from 6 m outdoors to 15 m indoors are shown in Table 14 and Figure 20.
Figure 20 shows that the wind speed curves under different door bucket heights approximately overlapped, and the door bucket height had a minimal impact on the indoor wind speed in the door bucket. Table 14 shows that, from 3 m to 15 m indoors, the maximum wind speed differences with different door bucket heights were 0.02 m/s, 0.01 m/s, 0.02 m/s, 0.02 m/s, and 0.02 m/s, and thus the differences were very small. From 9 m to 16 m indoors, the wind speed increased from 0.25–0.28 m/s to 0.53–0.55 m/s, with an increase of 0.27–0.29 m/s. Therefore, these results suggest that the height of the door bucket had little impact on the indoor wind speed at the door bucket.

4.2.2. Air Age

Simulations of Different Widths

When the outdoor wind speed was 1.7 m/s and the outdoor temperature was 29.9 °C, Figure 21 shows the air age cloud diagram at a pedestrian height of 1.5 m for each door bucket width. The changes in the air age value from the origin to 15 m indoors under each door bucket width are shown in Table 15 and Figure 22.
Table 15 shows that, from 9 m to 15 m indoors, the air age with a door bucket width of 7.3 m increased from 1200.7 s to 1261.2 s, with an increase of 60.5 s. The air age with a door bucket width of 9.3 m decreased from 1429.1 s to 1399.0 s, with a decrease of 31.1 s. The air age with a door bucket width of 11.3 m decreased from 1538.3 s to 1397.7 s, with a decrease of 140.6 s. The air age with a door bucket width of 13.3 m decreased from 1724.0 s to 1700.0 s, with a decrease of 24 s. The air ages with door bucket widths of 7.3 m, 9.3 m, and 13.3 m tended to decrease initially, before then increasing. The air age with a door bucket width of 11.3 m decreased as the distance increased. The air ages at 15 m indoors under each of the door bucket widths are shown in Figure 23.
Figure 23 shows that, at 15 m indoors, the air age was lowest with a door bucket width of 7.3 m at 1261.2 s. The air ages were moderate with door bucket widths of 9.3 m and 11.3 m at about 1400 s. The air age was highest with a door bucket width of 13.3 m at 1700 s. The air age increased with the width. As the door bucket width increased from 7.3 m to 13.3 m, the indoor air age at 15 m gradually increased, and the ventilation effect worsened. Thus, from a ventilation effect perspective, a door bucket width of 7.3–9.3 m is more appropriate.
According to the wind speed and air age under the four door bucket widths, as the width increased, the indoor high wind speed area decreased and the outdoor wind entry situation improved, but the indoor air age also increased and the ventilation effect worsened. The door bucket at the Xianyang T3 Terminal is continuously open and affected greatly by the outdoor wind. In general, a door bucket width from 9.3 m to 11.3 m can be used to reduce the indoor wind speed and reduce the age of indoor air.

Simulations at Different Depths

When the outdoor wind speed was 1.7 m/s and the outdoor temperature was 29.9 °C, Figure 24 shows the air age cloud distribution at a pedestrian height of 1.5 m under each of the door bucket depths. The changes in the air age values from the origin to 15 m indoors under each of the door bucket depths are shown in Table 16 and Figure 25.
It can be seen from Table 16 that, at 9 m to 15 m indoors, the air age in the 3.7 m depth group increased from 1374.0 s to 1416.5 s, an increase of 42.5 s; the air age of the group with a depth of 4.7 m decreased from 1429.1 s to 1399.0 s, a decrease of 31.1 s; the air age of the group with a depth of 5.7 m decreased from 1543.1 s to 1374.6 s, a decrease of 168.5 s; the air age of the group with a depth of 6.7 m decreased from 1619.5 s to 1460.8 s, a decrease of 158.7 s; and the air age of the group with a depth of 7.7 m decreased from 1651.1 s to 1467.3 s, a decrease of 183.8 s. Among them, the air age of the 3.7 m depth and 4.7 m depth groups showed a trend of first decreasing and then increasing. The air age of the 5.7 m depth group, the 6.7 m depth group, and the 7.7 m depth group decreased with the increase in distance. The air age at 15 m indoors under each working condition was mapped to obtain Figure 26.
Figure 26 shows that, at 15 m indoors, the air age was lowest with a door bucket depth of 5.7 at 1374.6 s. The air age was moderate with door bucket depths of 3.7 m and 4.7 m at about 1400 s. The air age was highest with door bucket depths of 6.7 m and 7.7 m at about 1460 s. As the depth increased from 3.7 m to 7.7 m, the air age value at 15 m indoors decreased initially and then increased. When the depth was 3.7 m, the air age was 1416.5 s. The minimum air age was 1374.6 s when the depth was 5.7 m and the maximum air age was 1467.3 s when the depth was 7.7 m. The indoor air ages at 6 to 12 m are shown in Table 16 and Figure 27.
Figure 27 shows that, as the depth of the door bucket increased, the indoor air age at 6–12 m tended to increase. Therefore, increasing the depth of the door bucket led to an increase in the air age. Figure 26 shows that the air age value at 15 m indoors differed greatly because it was affected more by skylight. From a ventilation effect perspective, a door bucket depth of 3.7–4.7 m is best.
According to the wind speeds and air ages under the five different door bucket depths, the depth had the greatest impact on the indoor wind speed at the terminal’s door bucket. As the depth increased, the indoor wind speed gradually decreased. However, the air age also increased as the depth increased. In general, a door bucket depth of 6.7–7.7 m can be used to significantly reduce the indoor wind speed. In addition, a mechanical ventilation system should be introduced to improve the ventilation effect, which weakened as the depth increased.

Simulation at Different Heights

When the outdoor wind speed was 1.7 m/s and the outdoor temperature was 29.9 °C, Figure 28 shows the air age cloud diagram at a 1.5 m pedestrian height under each door bucket height. The changes in the air age from the origin to 15 m indoors under each door bucket height are shown in Table 17 and Figure 29.
Table 16 shows that, from 9 m to 15 m indoors, the air age with a door bucket height of 3.8 m decreased from 1475.0 s to 1416.9 s, with a decrease of 42.5 s. The air age with a door bucket height of 4.3 m decreased from 1432.3 s to 1407.2 s, with a decrease of 25.1 s. The air age with a door bucket height of 4.8 m decreased from 1429.1 s to 1399.0 s, with a decrease of 30.1 s. The air age with a door bucket height of 5.3 m decreased from 1432.8 s to 1395.8 s, with a decrease of 37.0 s. The air age with a door bucket height of 5.8 m decreased from 1433.9 s to 1380.2 s, with a decrease of 53.7 s. From 9 m to 15 m indoors, the indoor air age with each door bucket height tended to decrease initially and then increase. The air ages at 15 m indoors under each of the door bucket heights are shown in Figure 30.
Figure 30 shows that, at 15 m indoors, the air age was lowest with a door bucket height of 5.8 m at 1380.2 s. The air ages with door bucket heights of 3.8 m, 4.3 m, 4.8 m, and 5.3 m were 1416.9 s, 1407.2 s, 1399.0 s, and 1395.8 s, respectively. As the height increased from 3.8 m to 5.8 m, the indoor air age value at 15 m gradually decreased from 1416.9 s to 1380.2 s. Increasing the height of the door bucket can reduce the indoor air age at the terminal door bucket and achieve a better ventilation effect, but the differences in the actual air age values under each door bucket height were small, where the maximum difference was only 36.7 s.
According to the wind speeds and air ages under the five door bucket heights, the height had little impact on the indoor wind environment at the terminal’s door bucket. As the height of the door bucket increased, the wind speed changed little and the air age decreased slightly. In general, the height of the door bucket had little impact on the indoor wind environment at the door bucket, and thus any door bucket height can be selected between 3.8 m and 5.8 m.

4.3. Experimental Simulations of Different Door Opening Modes

4.3.1. Wind Speed

When the outdoor wind speed was 1.7 m/s and the outdoor temperature was 29.9 °C, Figure 31 shows the wind speed nephograms at a pedestrian height of 1.5 m under various door opening modes. The changes in the wind speed from 6 m outdoors to 15 m indoors under various door opening modes are shown in Table 18 and Figure 32.
Figure 32 and Table 18 show that, from 3–9 m indoors, the wind speed ranges in simulations 1–6 were 0.45–1.31 m/s, 0.08–0.23 m/s, 0.31–0.36 m/s, 0.14–0.15 m/s, 0.08–0.16 m/s, and 0.15–0.16 m/s, respectively, and the differences were large. In particular, the two door opening modes in simulation 1 and simulation 3 obtained higher wind speeds due to the opening of the inner automatic door.
At 9 m to 15 m indoors, the wind speed decreased from 0.45 m/s to 0.29 m/s in simulation 1, with a decrease of 0.16 m/s. The wind speed increased from 0.23 m/s to 0.30 m/s in simulation 2, with an increase of 0.07 m/s. The wind speed decreased from 0.31 m/s to 0.26 m/s in simulation 3, with a decrease of 0.05 m/s. The wind speed remained unchanged at 0.16 m/s in simulation 4. The wind speed increased from 0.16 m/s to 0.19 m/s in simulation 5, with an increase of 0.03 m/s. The wind speed increased from 0.16 m/s to 0.17 m/s in simulation 6, and it was almost unchanged. In particular, the wind speeds decreased as the distance increased in simulation 1 and simulation 3, the wind speeds increased slightly as the distance increased in simulation 2 and simulation 5, and the wind speed remained almost unchanged as the distance increased in simulation 4 and simulation 6. The wind speeds at 15 m indoors under each of the door opening modes are shown in Figure 33.
Figure 33 shows that, at 15 m indoors, the wind speeds were lower in simulation 4, simulation 5, and simulation 6, with additional side doors at 0.16 m/s, 0.19 m/s, and 0.17 m/s, respectively. According to Table 3, the wind speeds were all comfortable in simulation 4, simulation 5, and simulation 6. The wind speeds were slightly higher in simulation 1, simulation 2, and simulation 3 at 0.29 m/s, 0.30 m/s, and 0.26 m/s, respectively. According to Table 3, the wind speeds were all comfortable in simulation 1, simulation 2, and simulation 3. However, Figure 27 shows that the outdoor wind intrusion situations in simulation 1 and simulation 3 were similar to that when there was no door bucket. Due to the influence of the outdoor wind direction, the indoor high-wind-speed area was biased to one side and the actual outdoor wind intrusion situation was more severe. Therefore, the door opening modes in simulation 2 with only manual door opening and in simulation 4, simulation 5, and simulation 6 with an added side door were more effective at reducing the indoor wind speed compared with the wind speed of 0.55 m/s at 15 m inside the room under the original door opening form.
From a passenger comfort perspective, it may be better to add a side door. During periods when fewer passengers are passing in and out, the automatic door should be closed and the manual door opened. The side door should be opened when the outdoor wind speed is high.

4.3.2. Air Age

When the outdoor wind speed was 1.7 m/s and the outdoor temperature was 29.9 °C, Figure 34 shows the air age cloud diagrams at a pedestrian height of 1.5 m under various door opening modes. The changes in the air age values from the origin to 15 m indoors under various door opening modes are shown in Table 19 and Figure 35.
Table 16 shows that, from 9 m to 15 m indoors, the air age increased from 1289.1 s to 1802.3 s in simulation 1, with an increase of 513.2 s. The air age increased from 1225.2 s to 1484.8 s in simulation 2, with an increase of 259.6 s. The air age increased from 1942.1 s to 1967.0 s in simulation 3, with an increase of 24.9 s. The air age increased from 1760.0 s to 1811.8 s in simulation 4, with an increase of 51.8. The air age decreased from 1676.5 s to 1660.0 s in simulation 5, with a decrease of 16.5 s. The air age increased from 1768.0 s to 1786.0 s in simulation 6, with an increase of 18.0 s. In particular, the air ages in simulation 1, simulation 2, and simulation 4 all increased as the distance increased. The air ages in simulation 3, simulation 5, and simulation 6 changed slightly as the distance increased. The air ages at 15 m indoors under each of the door opening modes are shown in Figure 36.
Figure 35 shows that, among simulation 2, simulation 4, simulation 5, and simulation 6, the air age was lowest in simulation 2 from 3 m indoors. Figure 36 shows that, at 15 m indoors, the air age was lowest in simulation 2 at 1484.8 s, while the air ages were moderate in simulation 1, simulation 4, simulation 5, and simulation 6, ranging from 1660 s to 1803 s, and the air age was highest in simulation 3 at 1967.0 s. From a ventilation effect perspective, compared with the air age of 1399 s at 15 m indoors in the original door opening mode, changing the door opening mode to simulated door opening modes 1 to 6 increased the indoor air age and reduced the natural ventilation effect.
According to the wind speeds and air ages under the six door opening modes, simulation 2 with closing the side door and only opening the manual door achieved the lowest wind speed and air age, and, although adding a side door significantly reduced the wind speed, the air age increased more. In general, during periods when there are few passengers, the door opening method in simulation 2 can be used, with only the manual doors on both sides being opened. This mode can reduce the indoor wind speed and the air age will increase less. A side door can also be added. When the outdoor wind speed is high, the door opening mode in simulation 5 can be used to reduce the intrusion of outdoor wind, and mechanical ventilation can be introduced to reduce the indoor air age and enhance the ventilation effect.

4.4. Experimental Simulation of Different Outdoor Wind Directions

4.4.1. Wind Speed

When the outdoor wind speed was 1.7 m/s and the outdoor temperature was 29.9 °C, Figure 37 shows the wind speed cloud diagrams at a pedestrian height of 1.5 m for each outdoor wind direction. The changes in wind speed for each outdoor wind direction condition from 6 m outdoors to 15 m indoors are shown in Table 20 and Figure 38.
Table 20 shows that, when the outdoor wind direction was −60° at a distance from 9 m to 15 m indoors, the wind speed increased from 0.30 m/s to 0.53 m/s, with an increase of 0.23 m/s. When the outdoor wind direction was −30°, the wind speed increased from 0.20 m/s to 0.26 m/s, with an increase of 0.06 m/s. When the outdoor wind direction was 0°, the wind speed increased from 0.22 m/s to 0.32 m/s, with an increase of 0.12 m/s. When the outdoor wind direction was 30°, the wind speed increased from 0.169 m/s to 0.26 m/s, with an increase of 0.07 m/s. When the outdoor wind direction was 60°, the wind speed increased from 0.42 m/s to 0.58 m/s, with an increase of 0.16 m/s. The wind speed increased as the distance increased for each outdoor wind direction. The wind speeds at 15 m indoors under each of the outdoor wind directions are shown in Figure 39.
Figure 39 and Table 3 show that, at 15 m indoors, the wind speed was lowest at 0.26 m/s and comfortable when the outdoor wind direction was −30° or 30°. When the outdoor wind direction was 0°, the wind speed increased slightly to 0.32 m/s, which was moderate but close to a comfortable state. The wind speed was highest at 0.53–0.58 m/s and moderate when the outdoor wind direction was −60° or 60°. From a passenger comfort perspective, the indoor wind speed is lowest when the outdoor wind direction is between −30° and 30°, and thus passenger comfort will be best.

4.4.2. Air Age

When the outdoor wind speed was 1.7 m/s and the outdoor temperature was 29.9 °C, Figure 40 shows the air age cloud diagram at a pedestrian height of 1.5 m for each outdoor wind direction. The changes in the air age from 6 m outdoors to 15 m indoors under various outdoor wind directions are shown in Table 21 and Figure 41.
Table 20 shows that, from 9 m to 15 m indoors, when the outdoor wind direction was 60°, the air age increased from 1360.1 s to 1404.4 s, with an increase of 44.3 s. When the outdoor wind direction was 30°, the air age decreased from 2782.4 s to 2969.6 s, with a decrease of 85.8 s. When the outdoor wind direction was 0°, the air age decreased from 1764.4 s to 1686.6 s, with a decrease of 77.8 s. When the outdoor wind direction was −30°, the air age decreased from 2927.5 s to 2791.1 s, with a decrease of 136.4 s. When the outdoor wind direction was −60°, the air age increased from 1258.3 s to 1319.6 s, with an increase of 61.3 s. In particular, when the outdoor wind direction was −60° or 60°, the air age tended to decrease and then increase as the distance increased. Under the other outdoor wind directions, the air age decreased as the distance increased. The indoor air ages at 15 m under each of the outdoor wind directions are shown in Figure 42.
Figure 42 shows that, at 15 m indoors, the air age was lowest when the outdoor wind direction was −60° or 60°, ranging from 1319 s to 1405 s. When the outdoor wind direction was 0°, the air age increased slightly and it was 1687 s. When the outdoor wind direction was −30° or 30°, the air age increased significantly, ranging from 2696 to 2792 s, and the ventilation effect was poor. From a ventilation effect perspective, the indoor air age is lowest when the outdoor wind direction is −60° or 60°, and the natural ventilation effect will be best.
According to the wind speed and air age under the five outdoor wind directions, the wind speed was highest but the air age was lowest when the outdoor wind direction was −60° or 60°, whereas the indoor wind speed was lowest but the air age increased significantly when the outdoor wind direction was −30° or 30°. The indoor wind speed was low and the air age was also low when the outdoor wind direction was 0°. In general, the indoor wind environment at the door bucket will be best when the outdoor wind direction is perpendicular to the facade of the building at the door bucket.

5. Conclusions

(1)
When a door bucket is absent, a large amount of outdoor wind intrudes and the local wind speed is excessively high indoors, with an excessively low surrounding wind speed and a very high air age. Adding a door bucket can reduce the indoor wind speed and effectively decrease the intrusion of outdoor wind. In working conditions with an added door bucket, according to the indoor wind environment, the wind speed and air age will increase from low to high when door buckets are installed in the inner section, middle section, and outer section.
(2)
The depth of the door bucket had the greatest impact on the indoor wind environment at the door bucket, followed by the door bucket width and door bucket height. As the width of the door bucket increased, the indoor high-wind-speed area at the door bucket decreased, the air age gradually increased, the passenger comfort in the indoor wind environment increased, and the ventilation effect worsened. As the depth of the door bucket increased, the indoor wind speed at the door bucket decreased significantly, the air age gradually increased, the passenger comfort in the indoor wind environment increased, and the ventilation effect worsened. As the door bucket height increased, the indoor wind speed at the door bucket changed little and the air age decreased slightly.
(3)
Adding a side door had a great impact on the indoor wind environment at the door bucket. When no side doors were added, only opening the manual doors on both sides achieved a lower indoor wind speed with only a small increase in the air age. After adding a side door, the indoor wind speed was lowest after opening the side door, but the indoor air age was relatively high. We recommend introducing a mechanical ventilation system to enhance the ventilation effect.
(4)
When the outdoor wind direction angle was −60° or 60°, the wind speed was highest but the air age was lowest. When the outdoor wind direction angle was −30° or 30°, the indoor wind speed was lowest but the air age increased significantly. When the outdoor wind direction angle was 0°, the indoor wind speed was low and the air age was also low. In general, when the outdoor wind direction is at an angle of 0°, the indoor wind environment at the door bucket will be the best.
Finally, based on the simulation results, we summarized the corresponding windproof design strategies for door buckets. During the subsequent renovation of the Xianyang T3 Terminal, built-in door buckets can be used, with a door bucket width of 9.3–11.3 m and door bucket depth of 6.7–7.7 m. To ensure the safe evacuation and movement of passengers, the height of the door bucket can be set from 3.8 m to 5.8 m. The door opening form should include a side door added to the door bucket. When the outdoor wind speed is low, only the manual door needs to be opened through the inside, and the open state of the automatic door and manual door can be switched on the outside to meet the needs of specific traffic conditions. When the outdoor wind speed is high, the side door should be opened on the inside to block the intrusion of outdoor wind. In addition, a mechanical ventilation system should be introduced, such as operating a fresh air system to ensure good indoor ventilation.
This study has two primary limitations. Firstly, while the standard k-ε turbulence model was employed throughout, including for outside wind flow, the specific characteristics of wind turbulence in external conditions were not distinctly addressed. Secondly, our simulation exclusively focused on summer conditions. This decision, driven by the goal of exploring the less examined area of summer comfort and practical changes in winter conditions such as closed doors, limits our findings. Future research could remedy these limitations by incorporating a detailed analysis of external wind turbulence in a larger area and extending the study to include winter conditions in a more detailed model, thus offering a more holistic understanding of environmental interactions across different seasons.

Author Contributions

W.L. wrote the paper. M.Z. designed the experiment. L.Y. and G.Y. modified the paper. All authors have read and agreed to the published version of the manuscript.

Funding

This study was supported by Natural Science Foundation of Shaanxi Province (grant number 2023-JC-YB-316).

Data Availability Statement

The data supporting the findings of this study are available upon request from the corresponding author. The data are not publicly available due to privacy and security restrictions related to airport operations. Specific data elements are subject to confidentiality obligations and were used under license for the current study.

Conflicts of Interest

There are no conflicts of interest to declare.

References

  1. Nguyen, A.T.; Reiter, S. The effect of ceiling configurations on indoor air motion and ventilation flow rates. Build. Environ. 2011, 46, 1211–1222. [Google Scholar] [CrossRef]
  2. Vanhooff, T.; Blocken, B. Coupled urban wind flow and indoor natural ventilation modelling on a high-resolution grid: A case study for the Amsterdam ArenA stadium. Environ. Model. Softw. 2010, 25, 51–65. [Google Scholar] [CrossRef]
  3. Bonser, S.; Hughes, B.R.; Calautit, J.K. Investigation of the impact of roof configurations on the wind and thermal environment in football stadiums in hot climates. Int. J. Vent. 2020, 19, 260–279. [Google Scholar] [CrossRef]
  4. Cheng, Z.; Li, L.; Qi, X.; Zhang, P. Research on the influence of vent shape on wind pressure ventilation effect in gymnasium. Archit. Sci. 2020, 36, 106–111, 146. [Google Scholar]
  5. Tang, H.; Yu, J.; Zhang, Z.; Zhou, H.; Zhao, Y.; Lin, B.; Yang, X.; Kang, C. Analysis of Spatiotemporal Characteristics of Indoor Physical Environmental Quality in Large Terminal Buildings Based on Field Measurement. Build. Sci. 2023, 39, 9–14+87. [Google Scholar]
  6. Jia, X.; Huang, Y.; Cao, B.; Zhu, Y.; Wang, C. Field investigation on thermal comfort of passengers in an airport terminal in the severe cold zone of China. Build. Environ. 2021, 189, 107514. [Google Scholar] [CrossRef]
  7. Jia, X.; Cao, B.; Zhu, Y.; Huang, Y. Field studies on thermal comfort of passengers in airport terminals and high-speed railway stations in summer. Build. Environ. 2021, 206, 108319. [Google Scholar] [CrossRef]
  8. Hou, J.; Sun, Y.; Song, Y.; Kim, J.; Parkinson, T.; de Dear, R. Study on adaptive comfort behaviours in mixed-mode residential buildings in Tianjin, China. Indoor Built Environ. 2022, 31, 777–787. [Google Scholar] [CrossRef]
  9. Yuan, J.; Yu, Q.; Yao, S.; Ma, X.; Sun, Z. Multi-objective optimization for the daylighting and thermal comfort performance of elevated subway station buildings in cold climate zone of China. J. Build. Eng. 2023, 78, 107771. [Google Scholar] [CrossRef]
  10. Wu, M.; Liu, X.; Zhao, K.; Zhang, L.; Zhou, M. Indoor environment test of tall spaces in T2 and T3 terminals of Xi’an Xianyang International Airport. HVAC 2014, 10, 135–139. [Google Scholar]
  11. Liu, X. Research on Energy-Saving Design of Terminal Entrance and Exit Space Based on Indoor Thermal Environment Simulation—Taking Chengdu Shuangliu T2 Terminal as an Example. Master’s Thesis, Southwest Jiaotong University, Chengdu, China, 2021. [Google Scholar]
  12. MH/T 5033-2017; Beijing New Airport Construction Headquarters. Green Terminal Standard. China Civil Aviation Press: Beijing, China, 2017.
  13. GB/T 50736-2012; Ministry of Housing and Urban-Rural Development of the People’s Republic of China. Design Specifications for Heating, Ventilation and Air Conditioning in Civil Buildings. China Industrial Architecture Press: Beijing, China, 2015.
  14. Zhu, W.; Di, Y.; Wang, W.; Li, A. Indoor environment and natural ventilation. J. Archit. Sci. Eng. 2006, 23, 90–94. [Google Scholar]
  15. Zhao, Y. Research on the Architectural Design of Gymnasiums in Severe Cold Areas Based on low Energy Consumption Goals. Ph.D. Thesis, Harbin Institute of Technology, Harbin, China, 2014. [Google Scholar]
  16. Di, Y.H.; Wang, S.C. The research of indoor thermal comfort under dynamic conditions. Appl. Mech. Mater. 2013, 291, 1752–1755. [Google Scholar] [CrossRef]
  17. Huang, X.; Qu, C. Research on indoor thermal comfort and age of air in Qilou street shop under mechanical ventilation scheme: A case study of Nanning traditional block in southern China. Sustainability 2021, 13, 4037. [Google Scholar] [CrossRef]
Figure 1. Computational domain and model diagram.
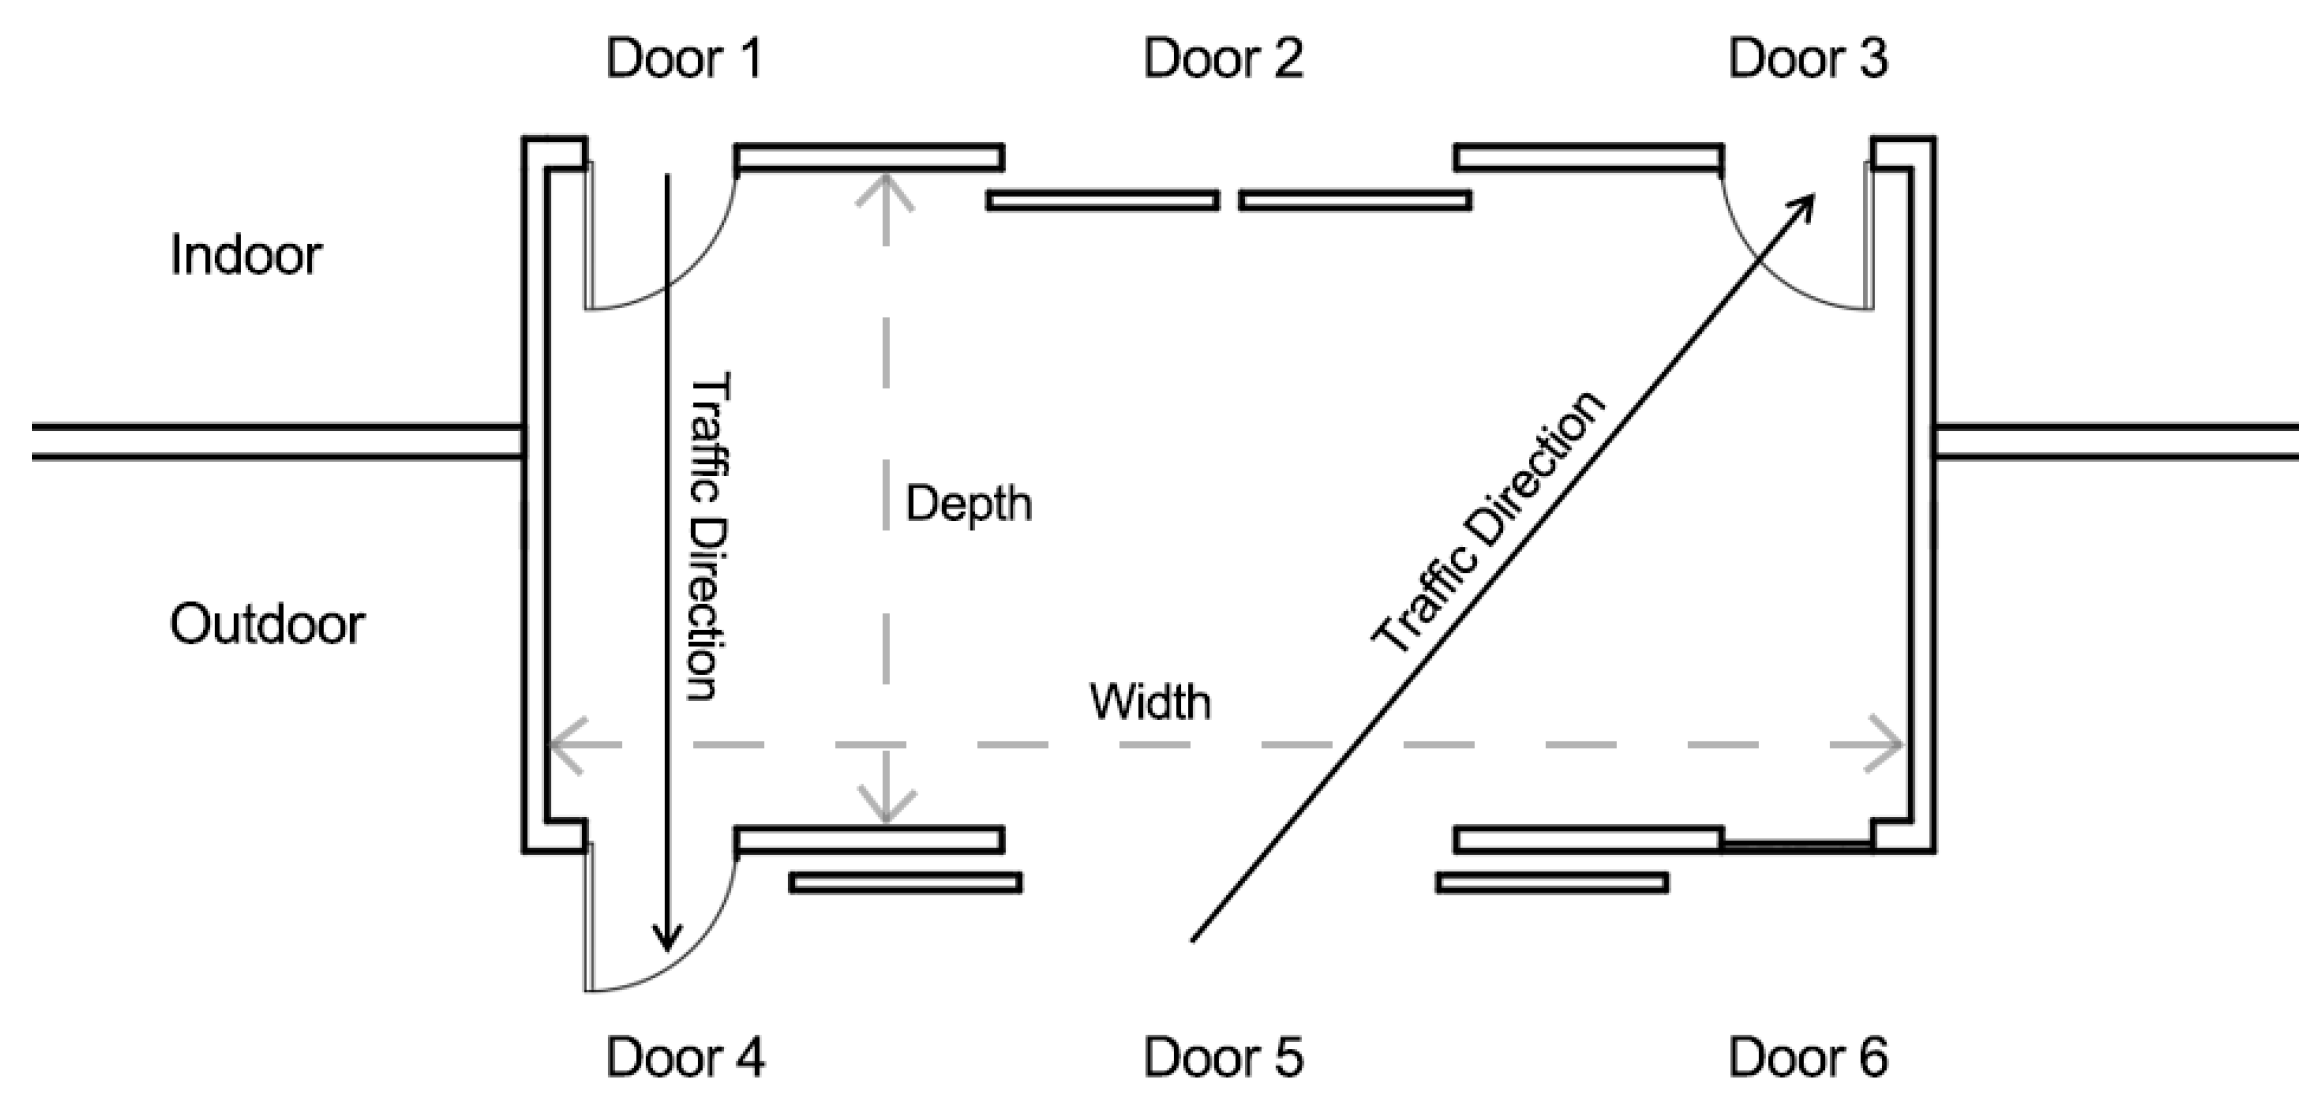
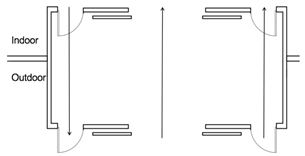
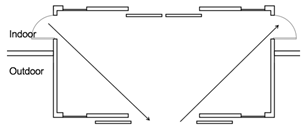
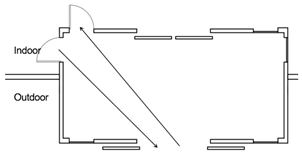
Buildings 14 00344 g001
Figure 2. Schematic diagram of door bucket opening form.
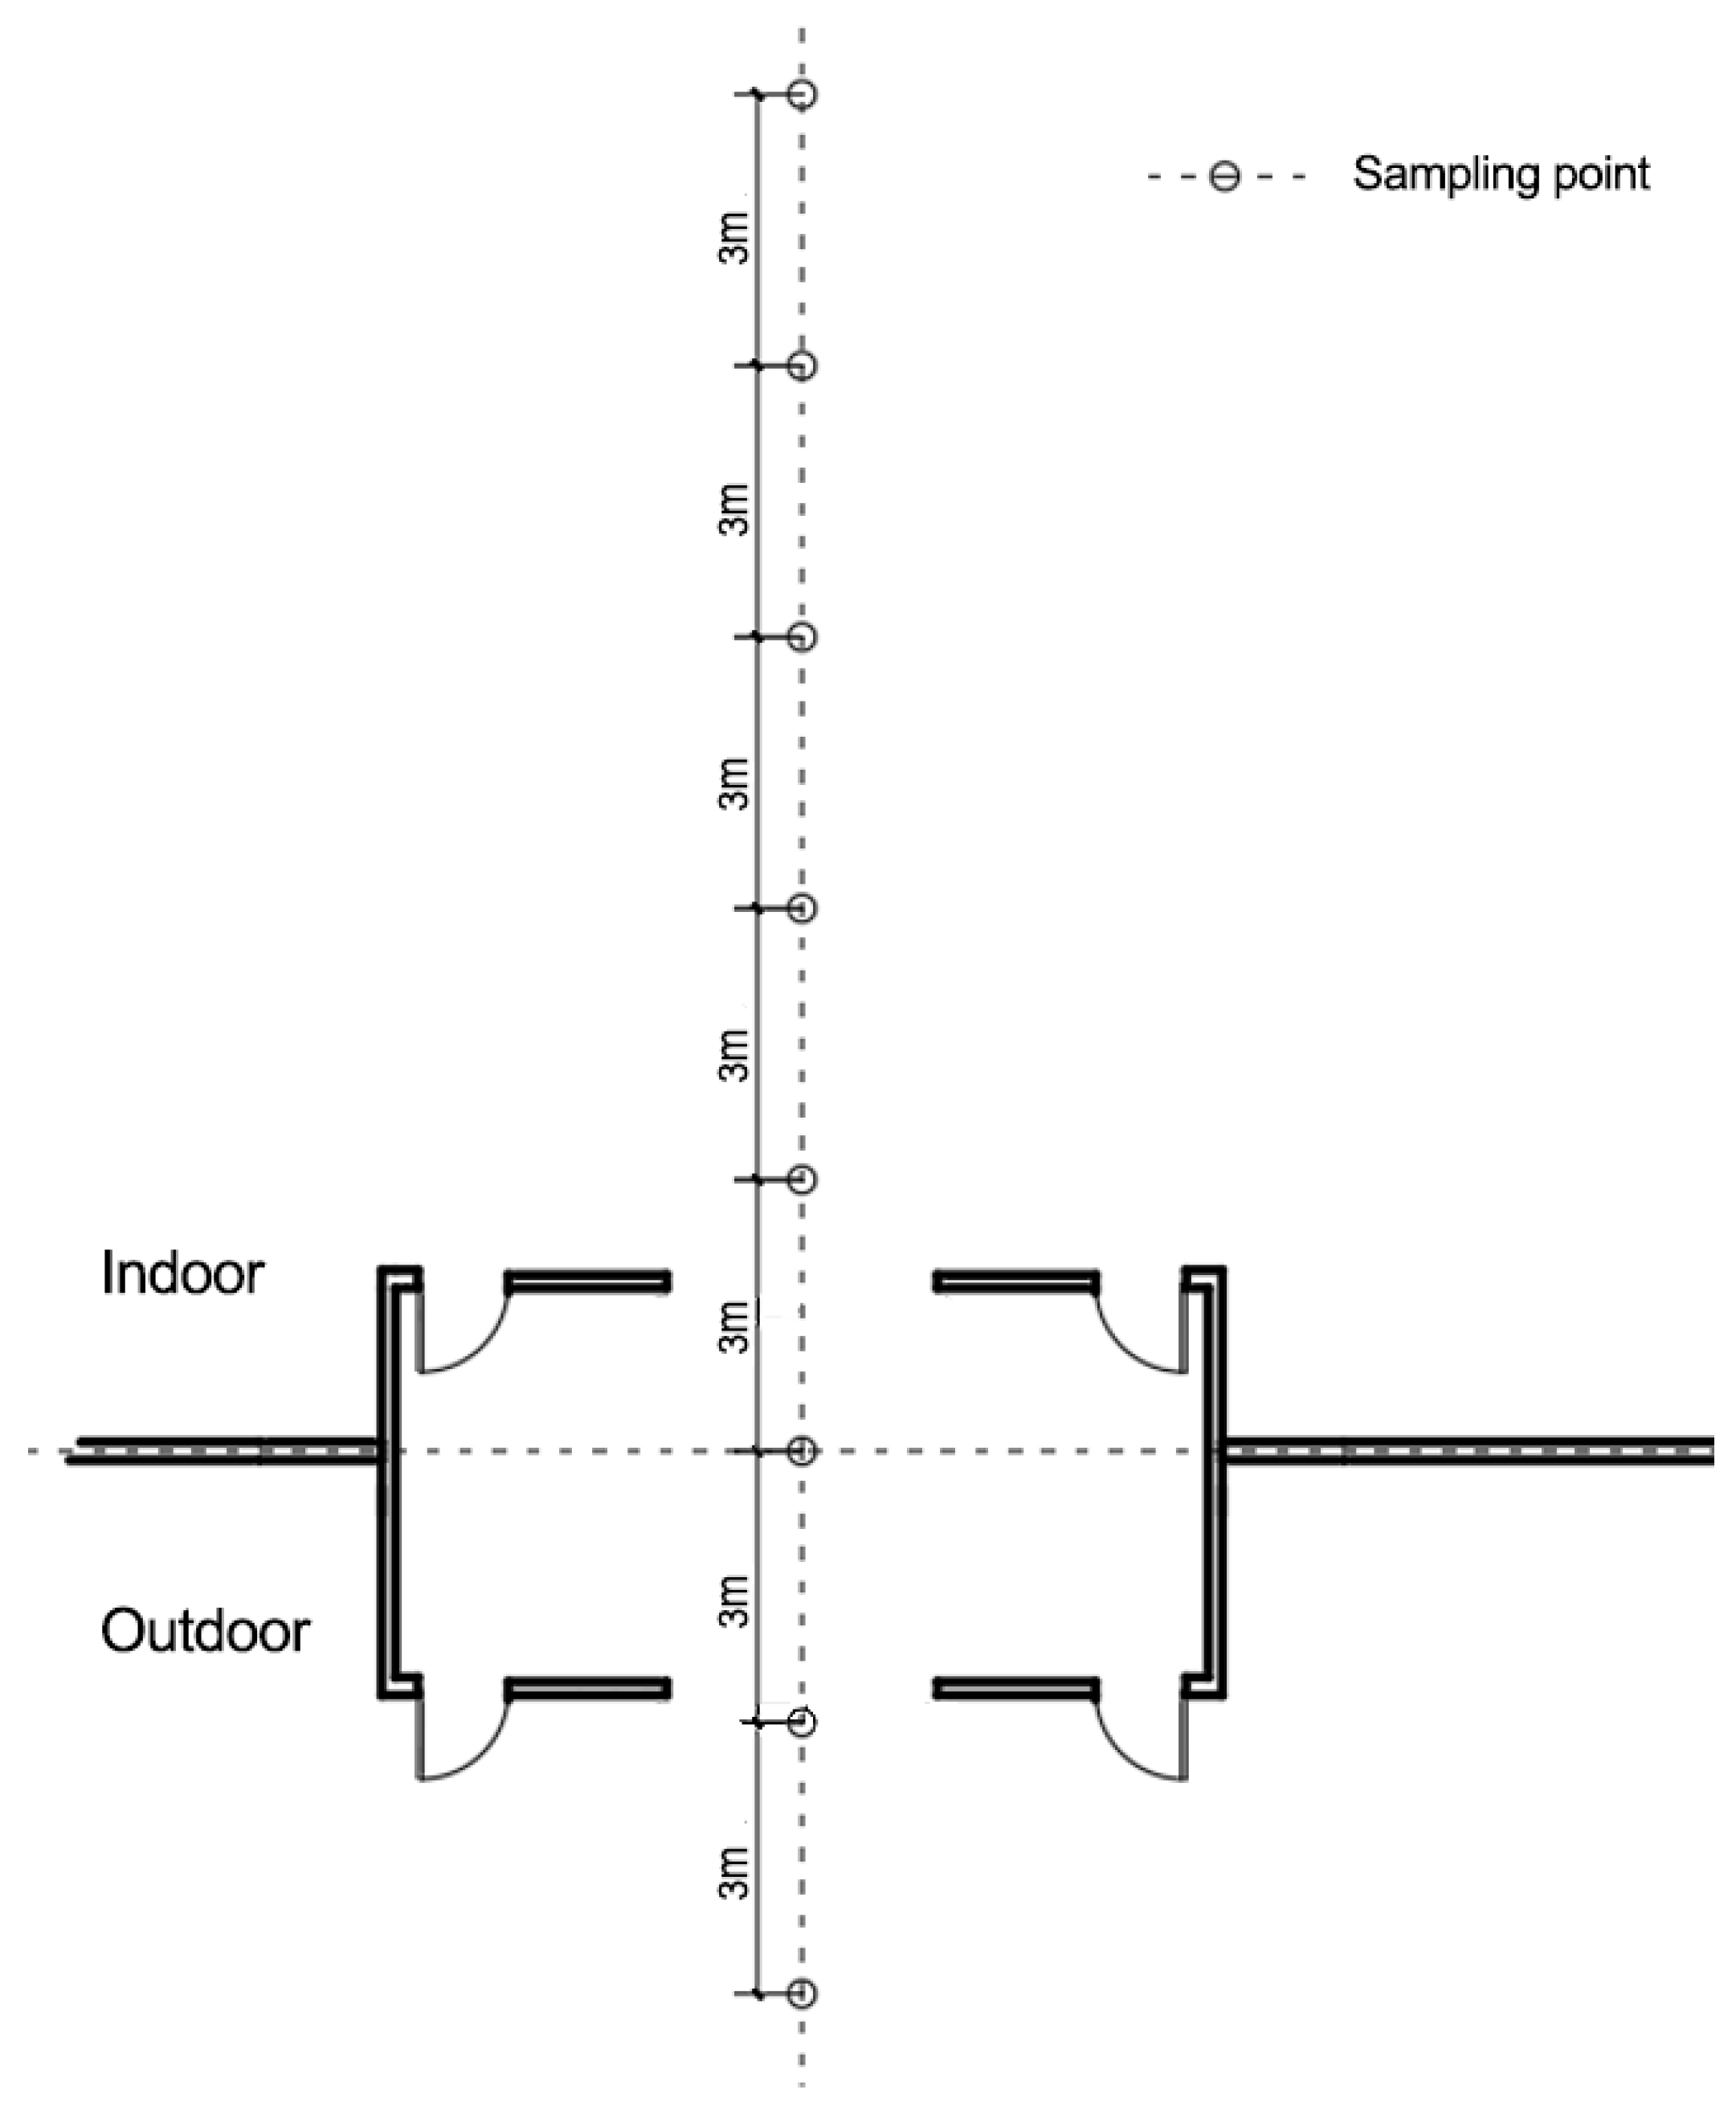
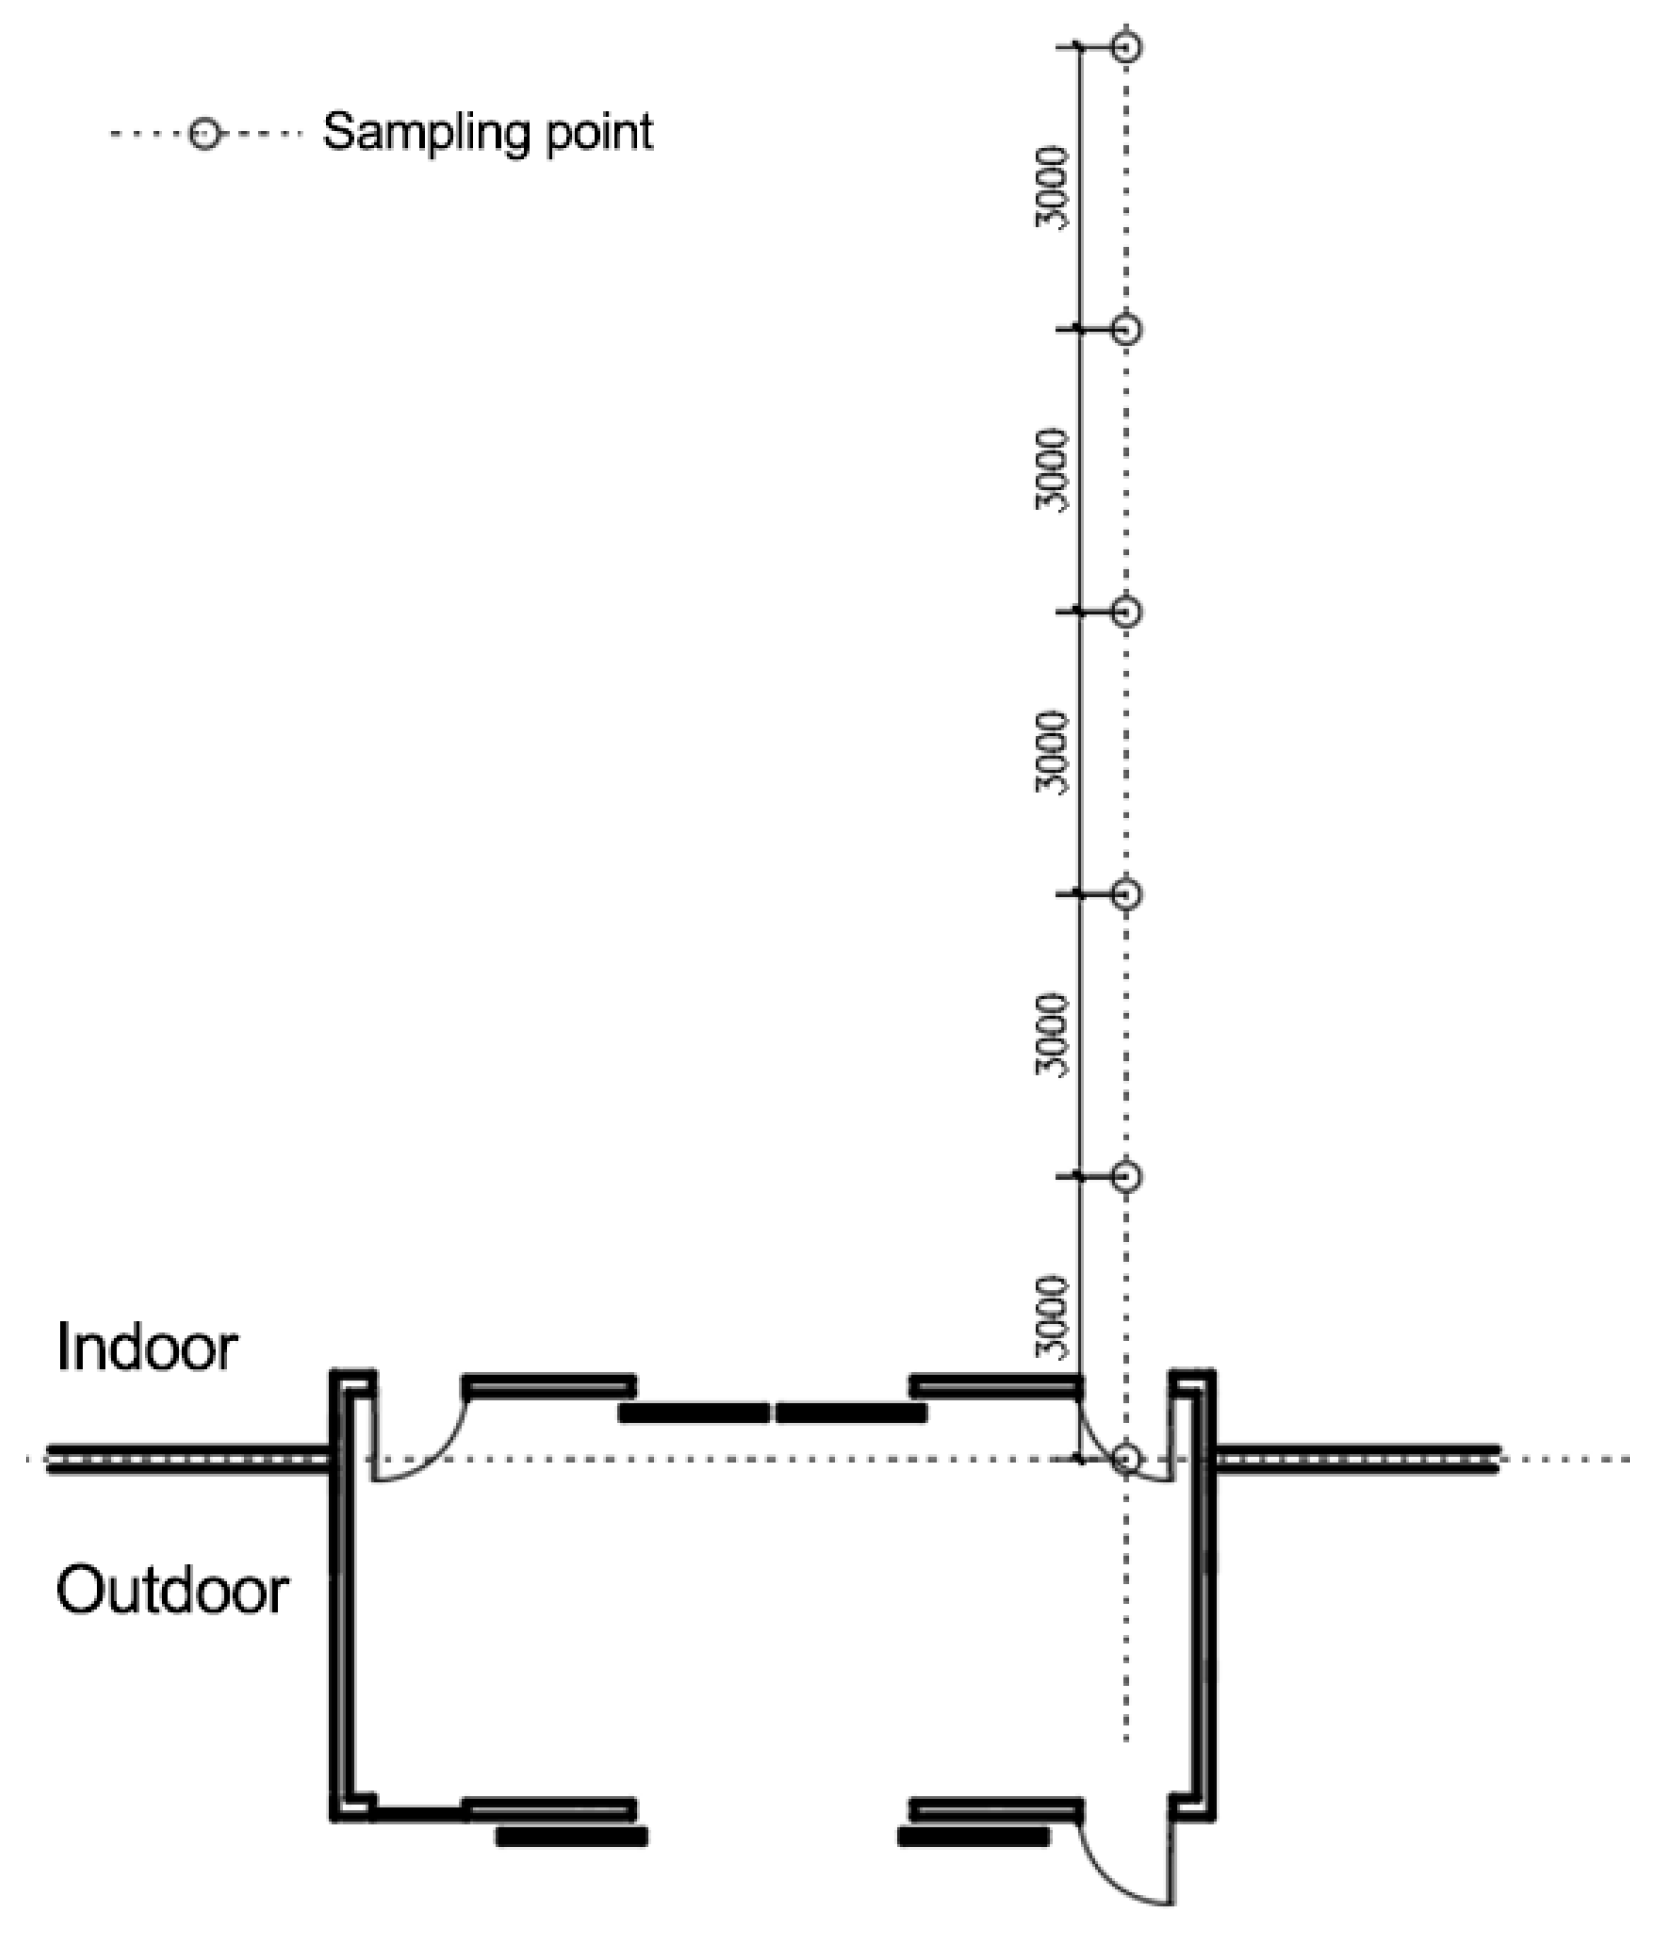
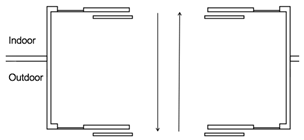
Buildings 14 00344 g002
Figure 3. Schematic diagram of measurement points.
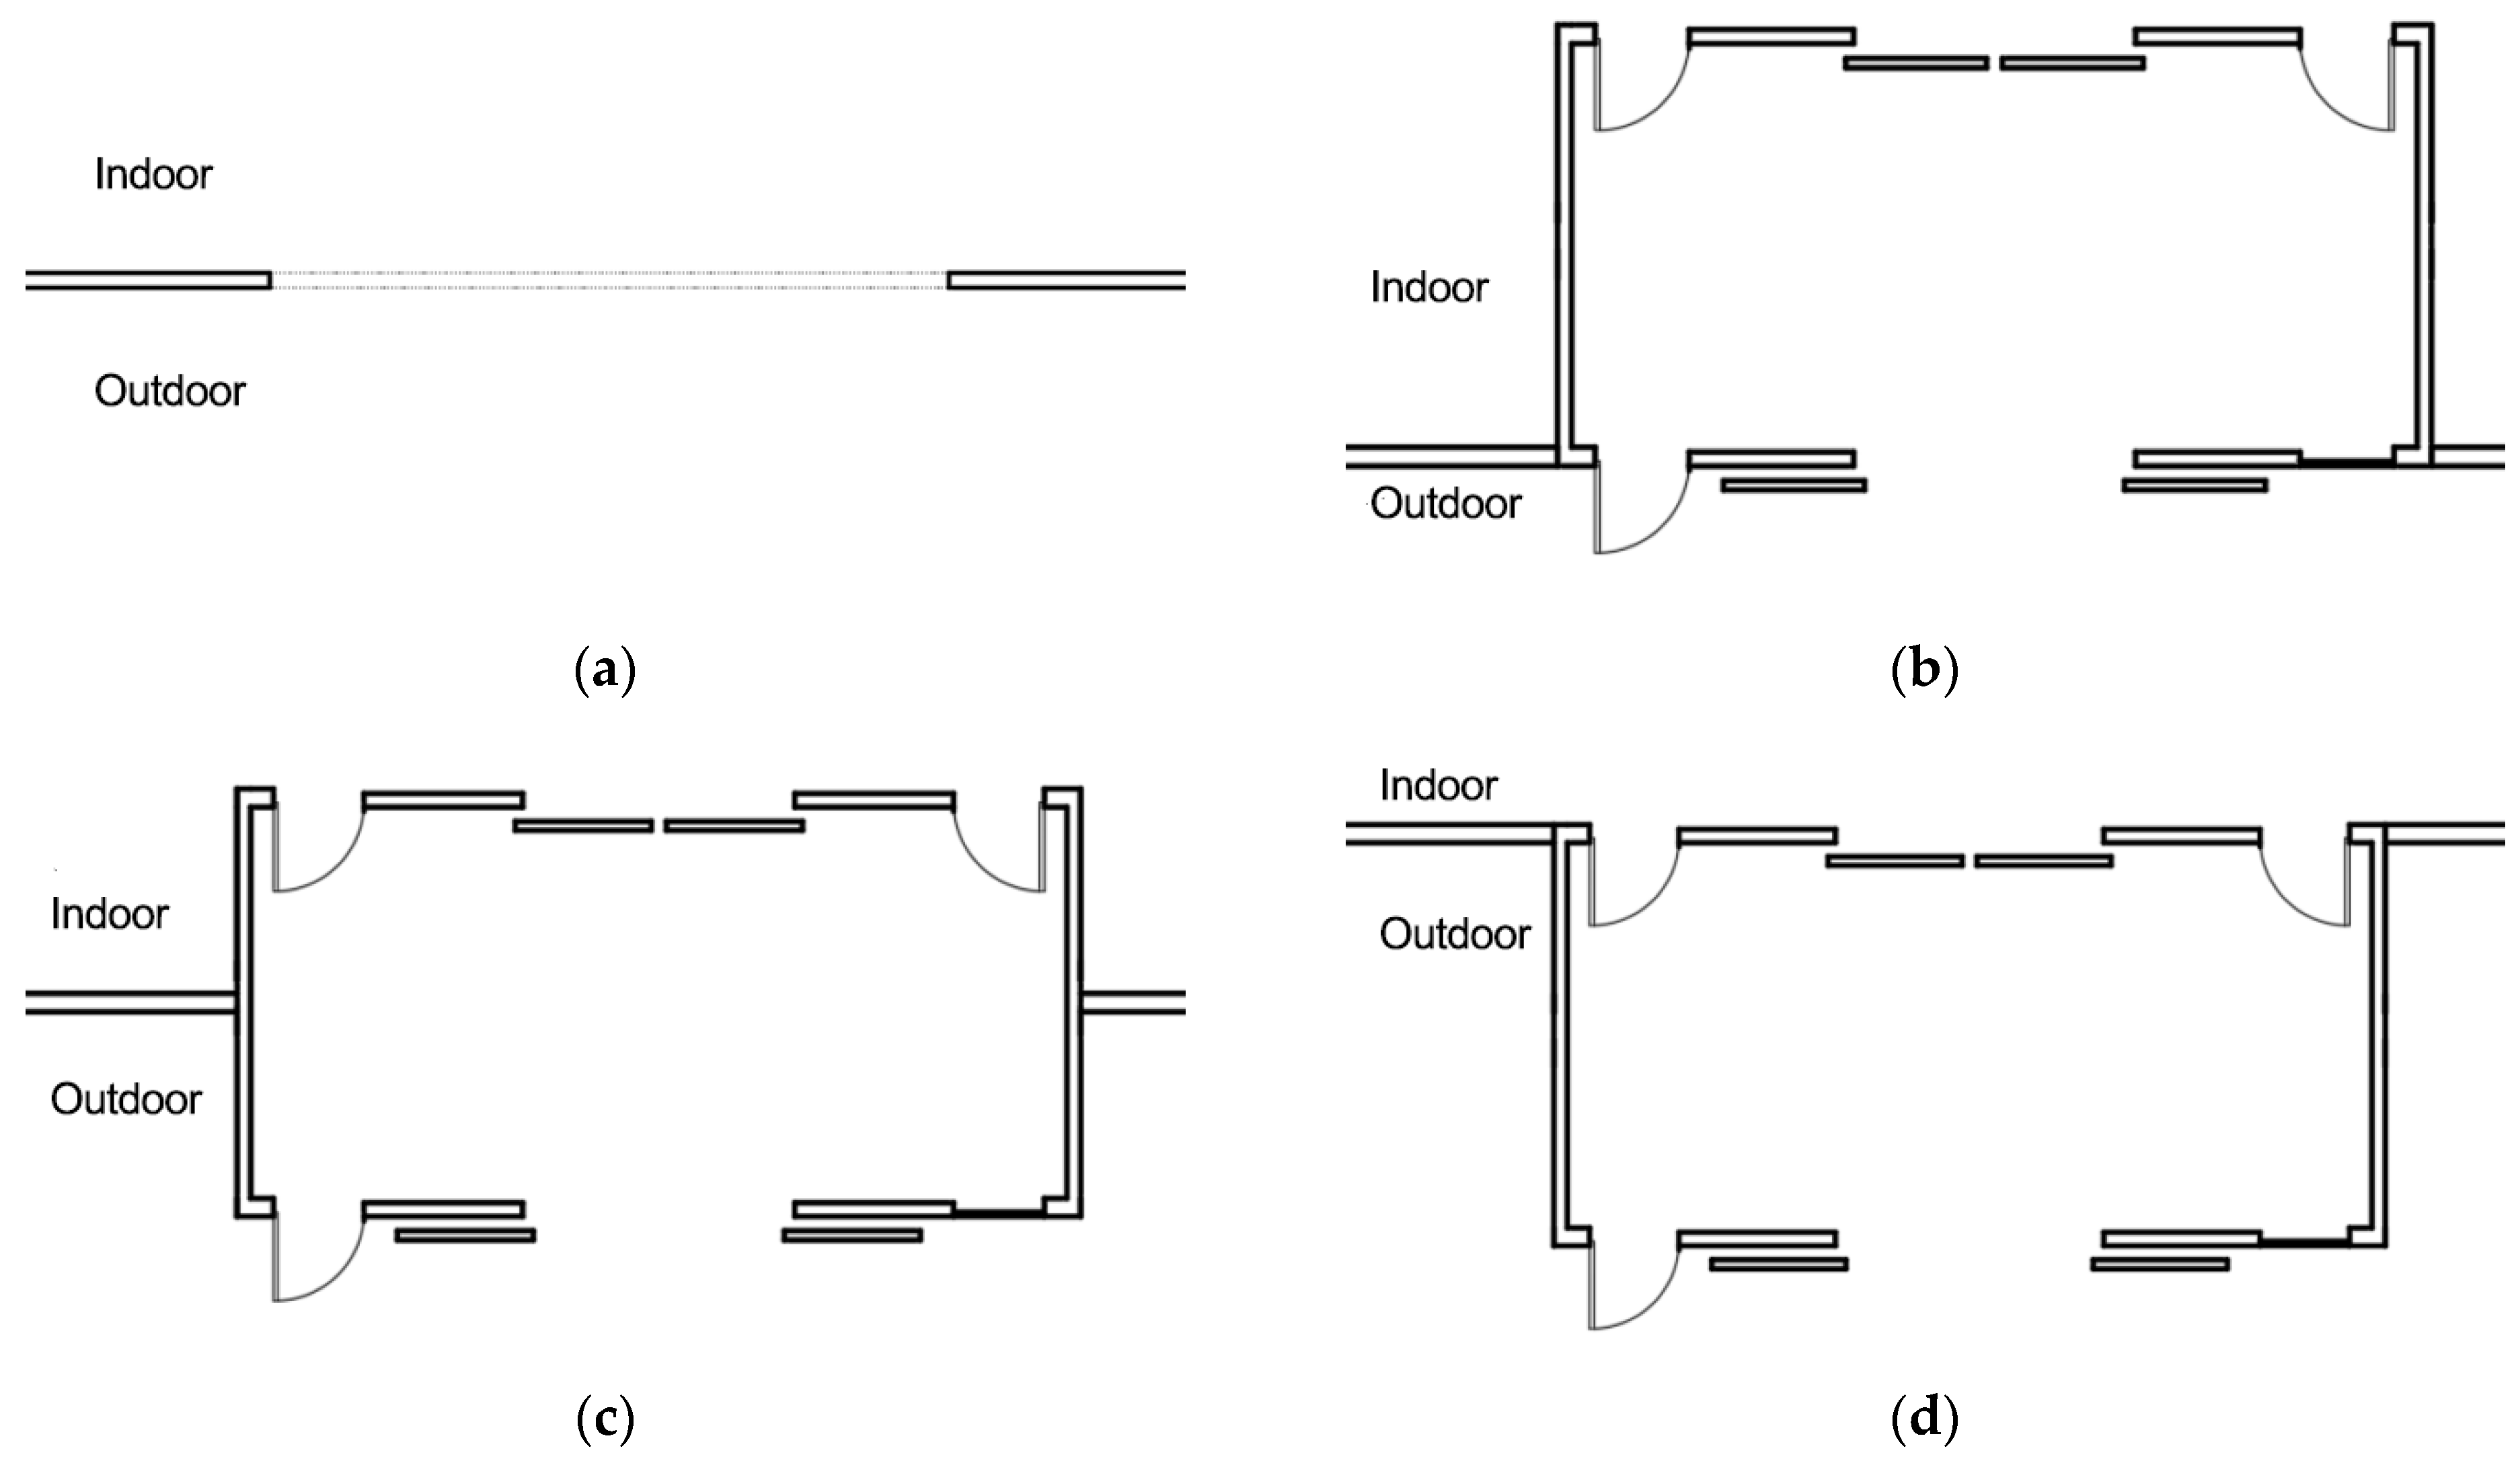
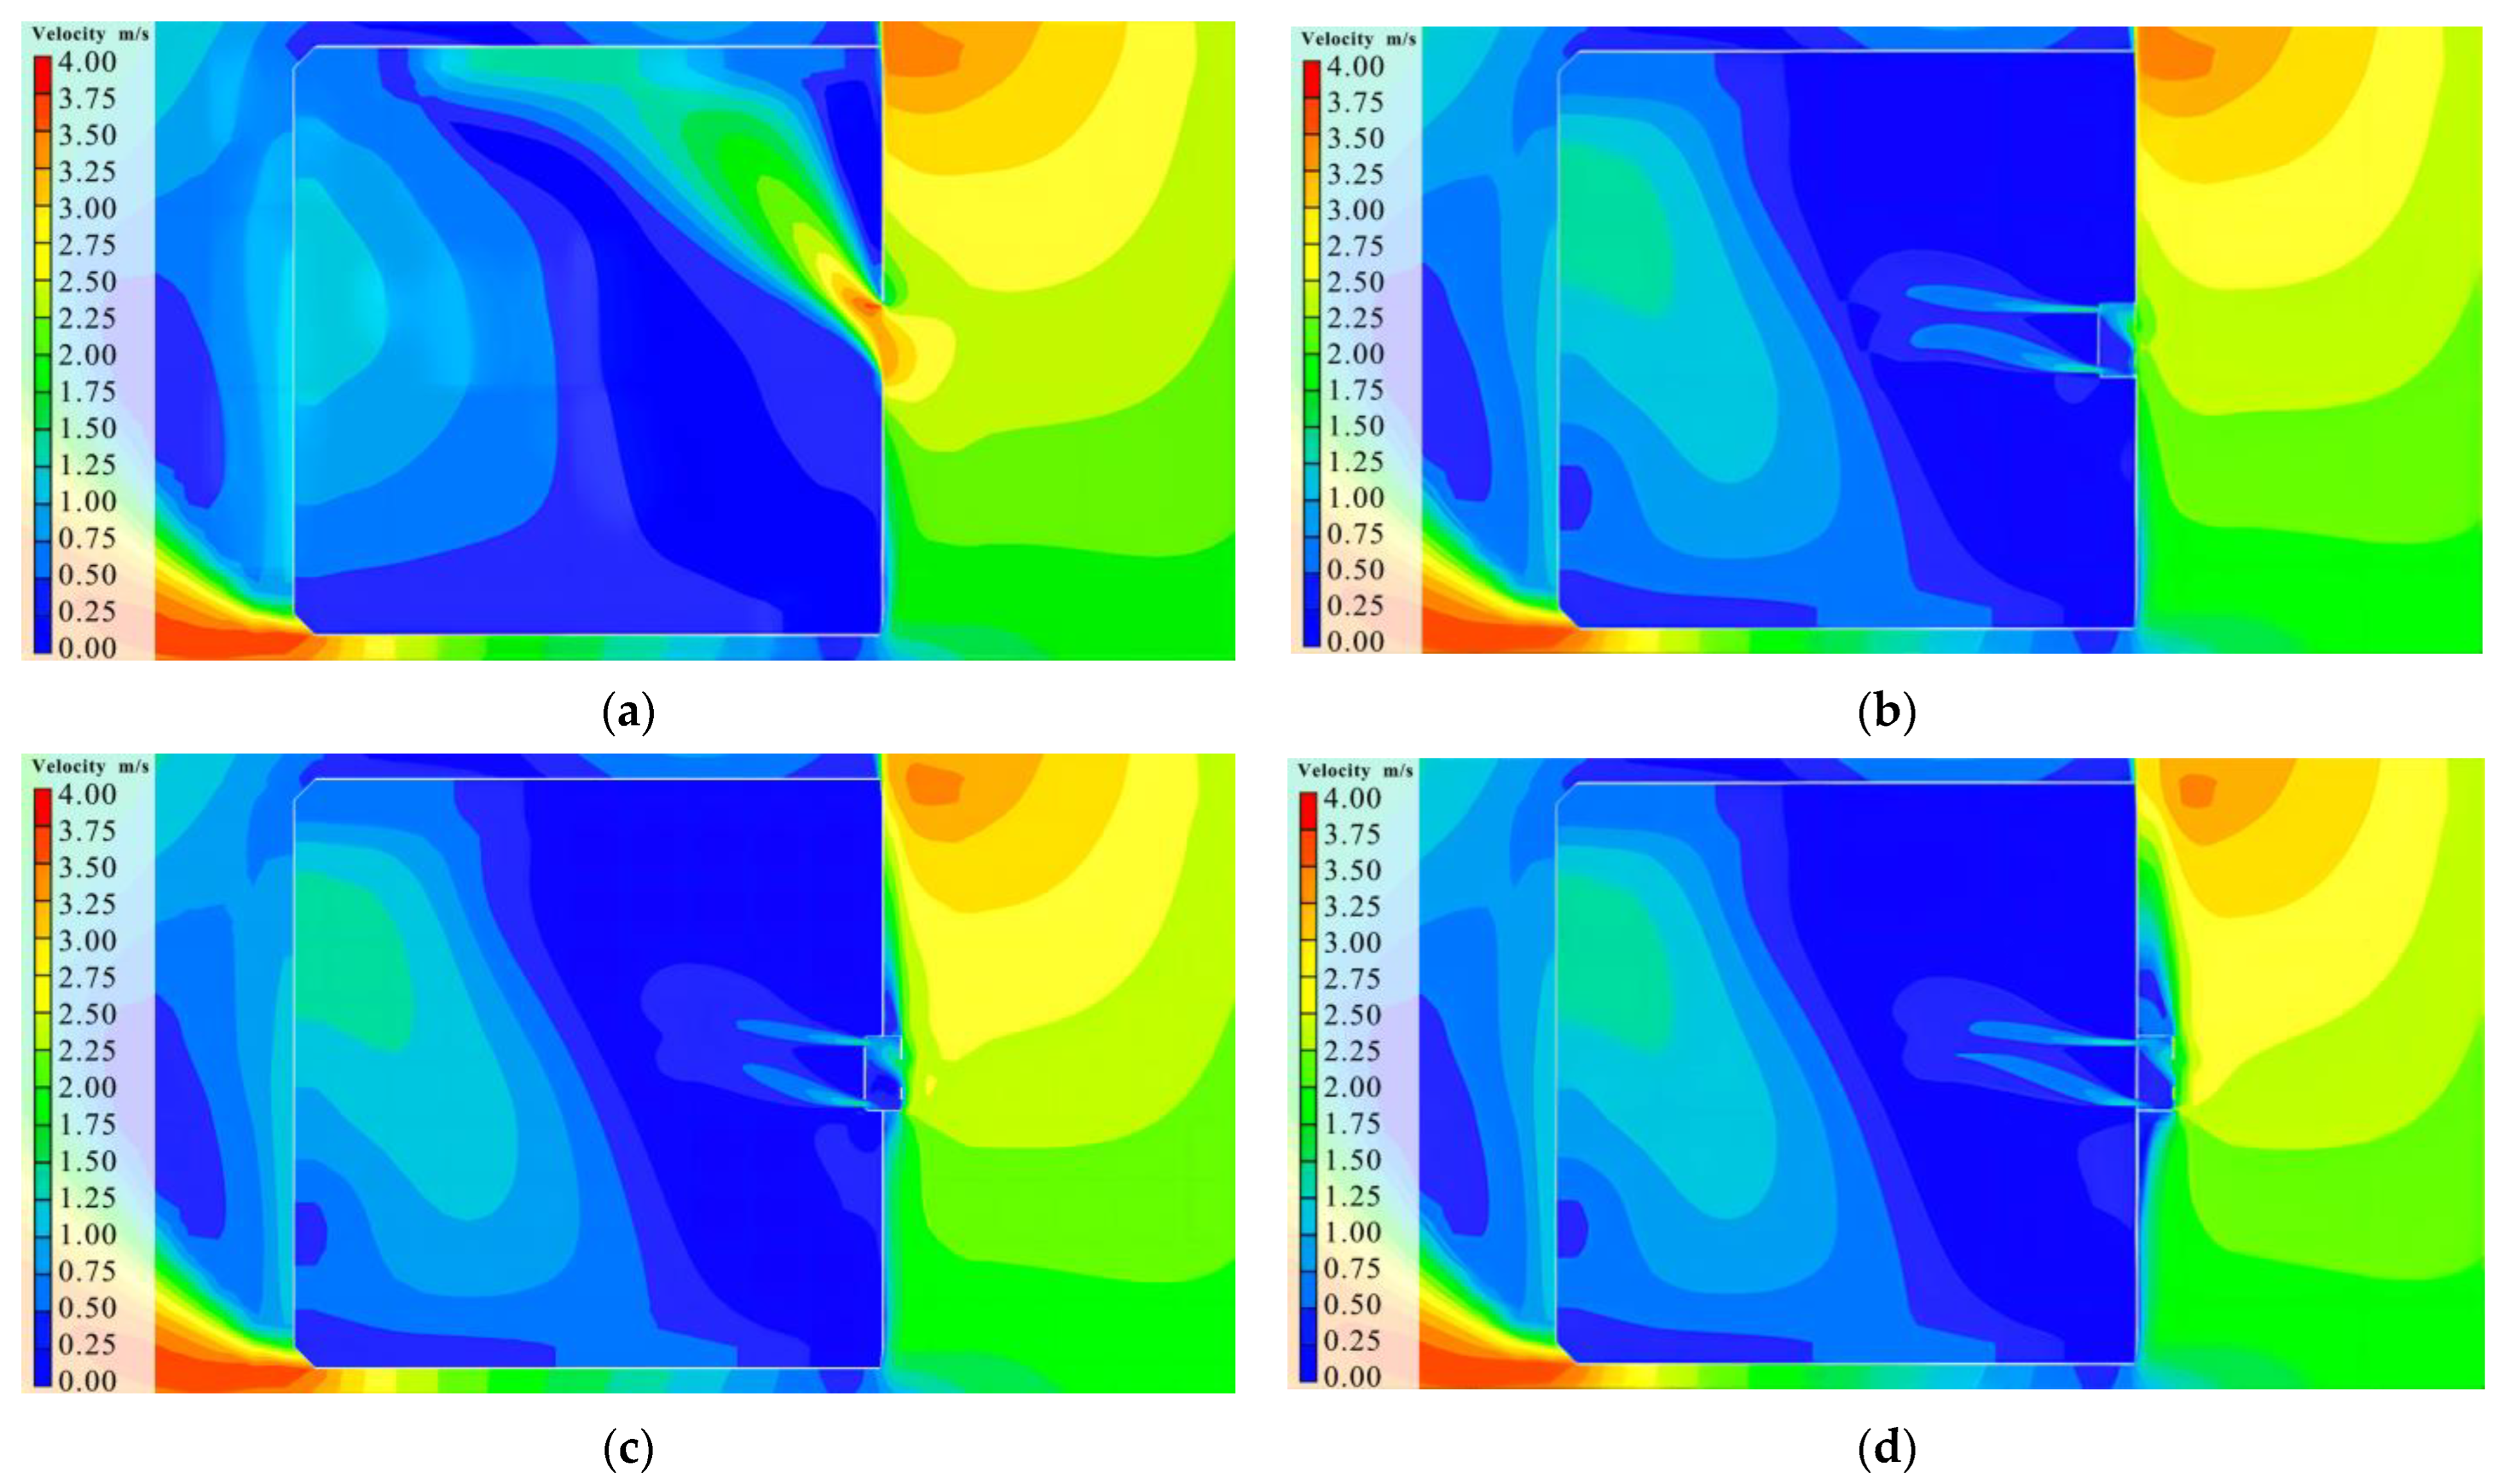
Buildings 14 00344 g003
Figure 4. Schematic diagrams showing each door bucket type. (a) No door bucket type (NDB). (b) Door bucket built-in type (DBB). (c) Door bucket mid-mounted type (DBM). (d) Door bucket external type (DBE).
Buildings 14 00344 g004
Figure 5. Wind speed at the center of the door bucket when the skylight was open or closed.
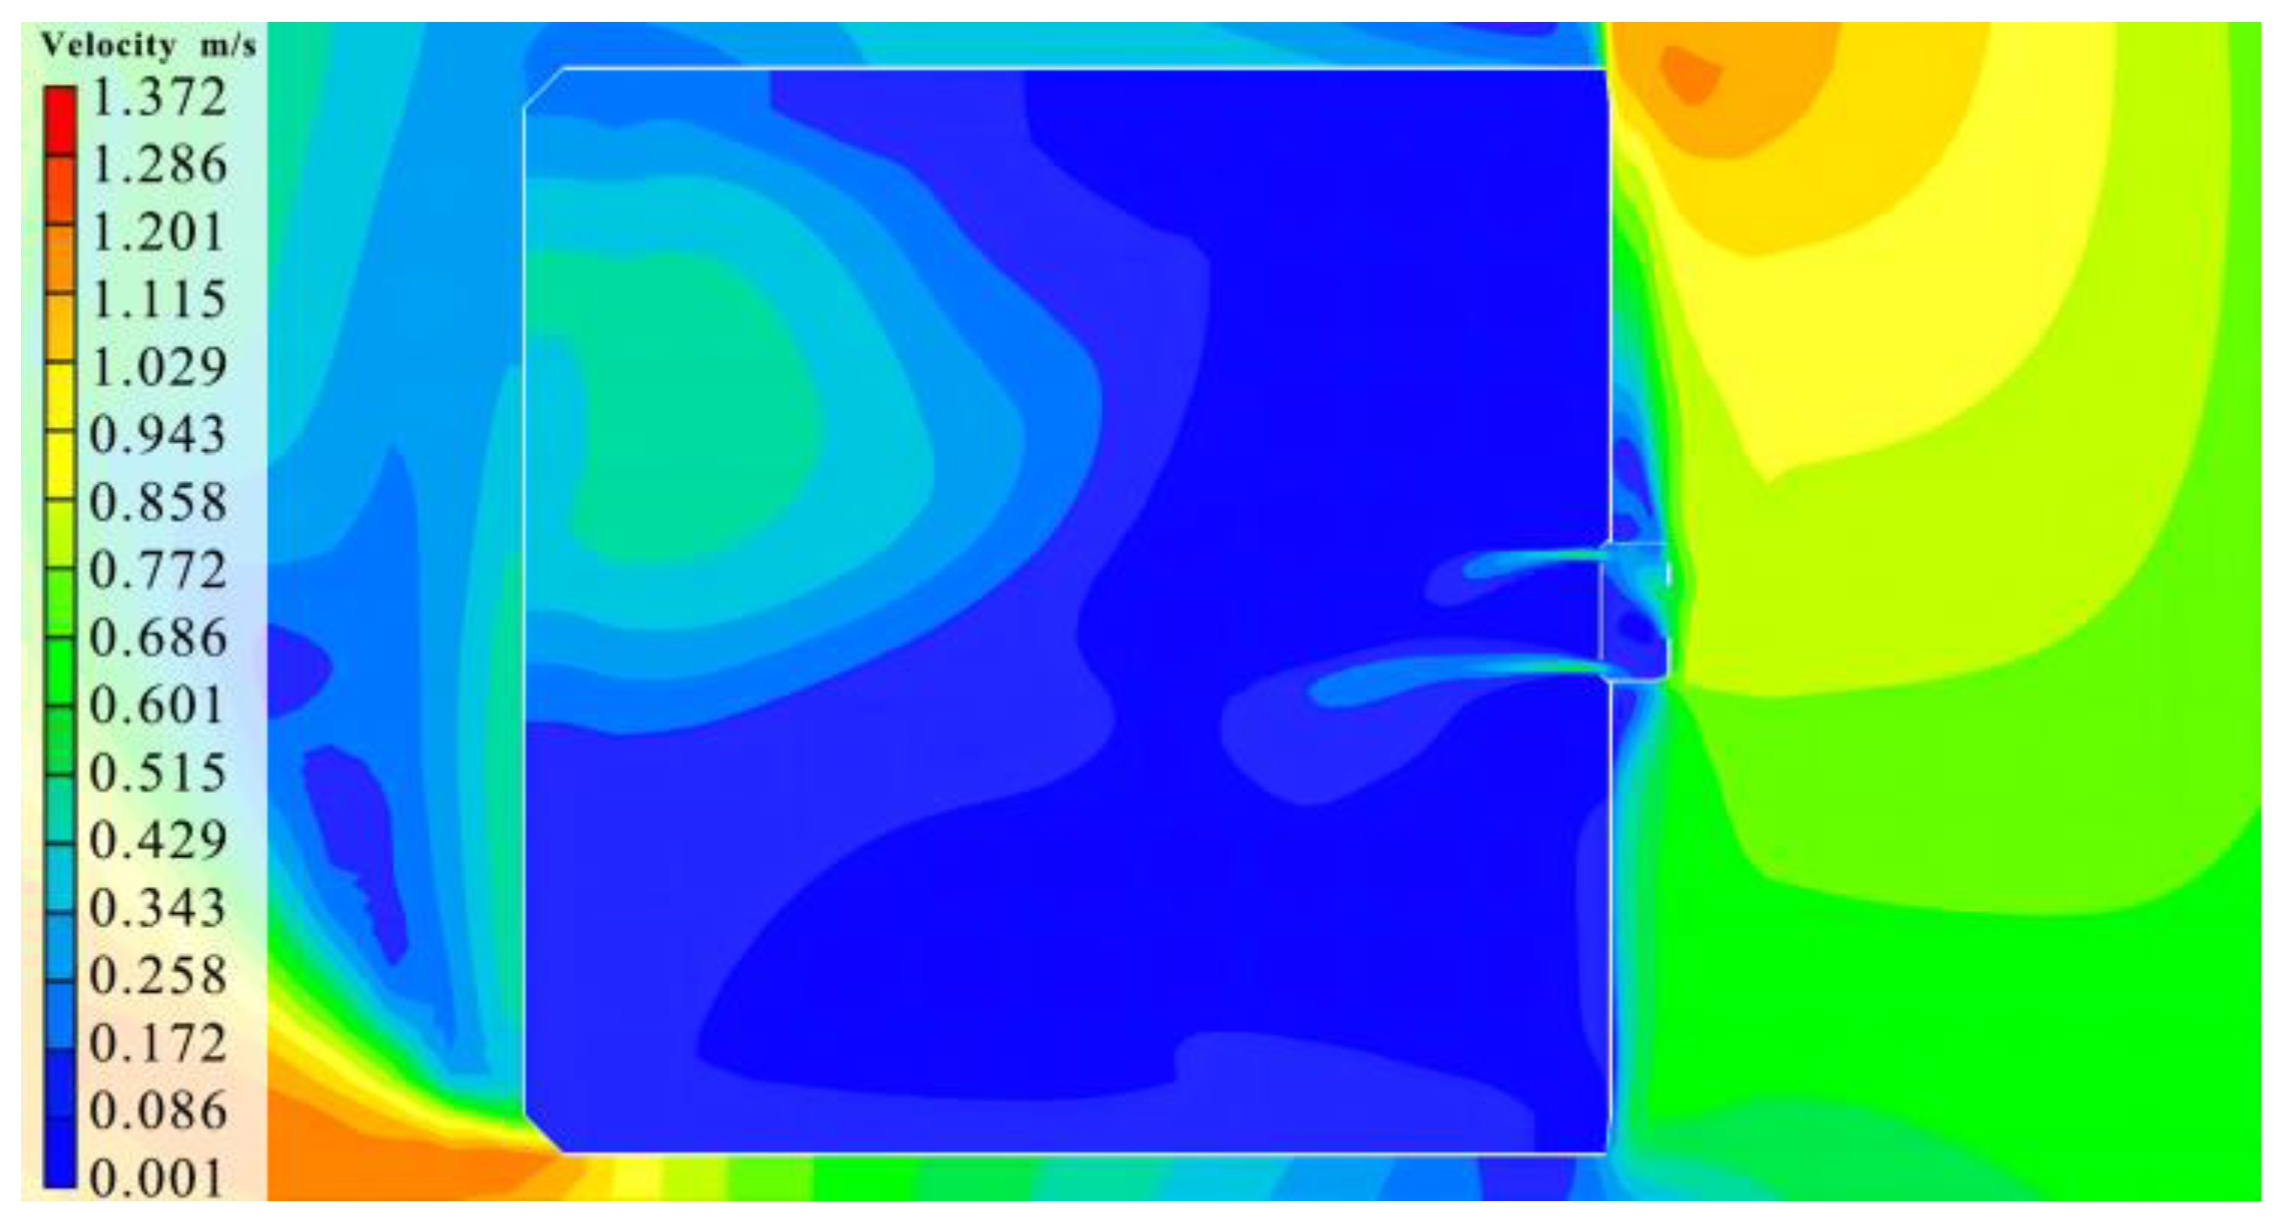
Buildings 14 00344 g005
Figure 6. Simulated wind speed cloud diagram at a height of 1.5 m.
Buildings 14 00344 g006
Figure 7. Wind speed distributions at a height of 1.5 m under different door bucket types. (a) Wind speed cloud diagram at a height of 1.5 m for NDB. (b) Wind speed cloud diagram at a height of 1.5 m for DBB. (c) Wind speed cloud diagram at a height of 1.5 m for DBM. (d) Wind speed cloud diagram at a height of 1.5 m for DBE.
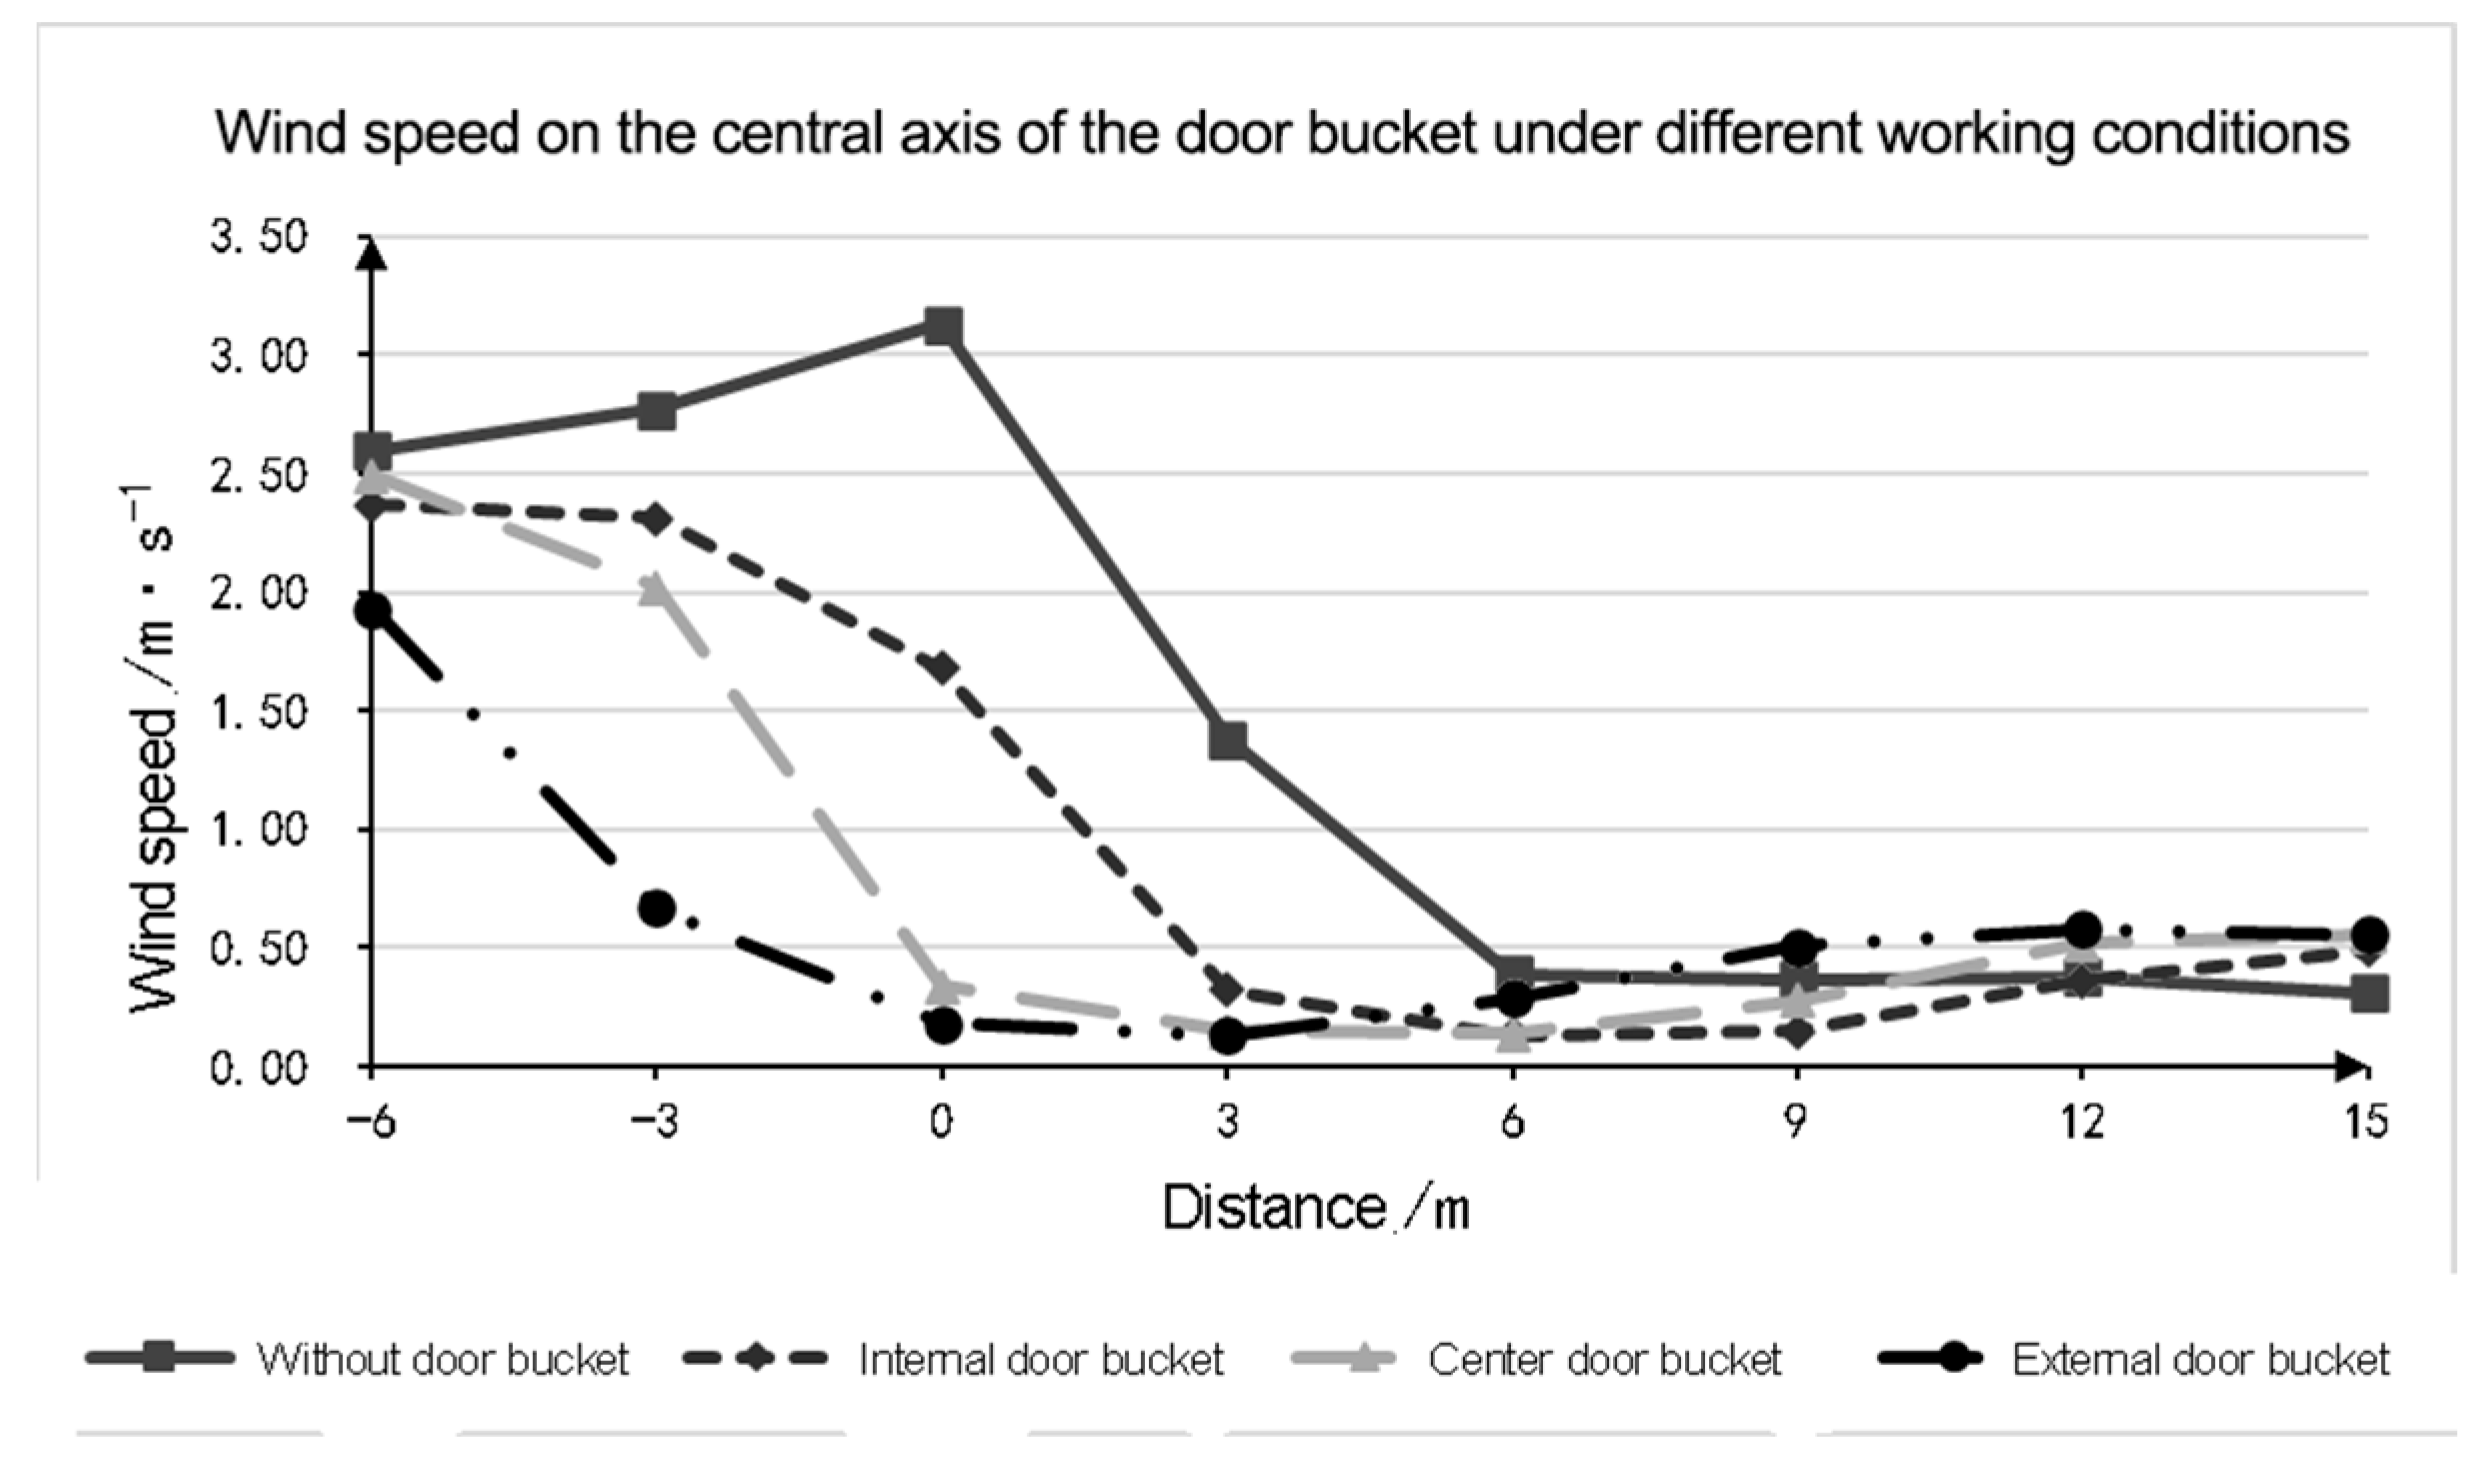
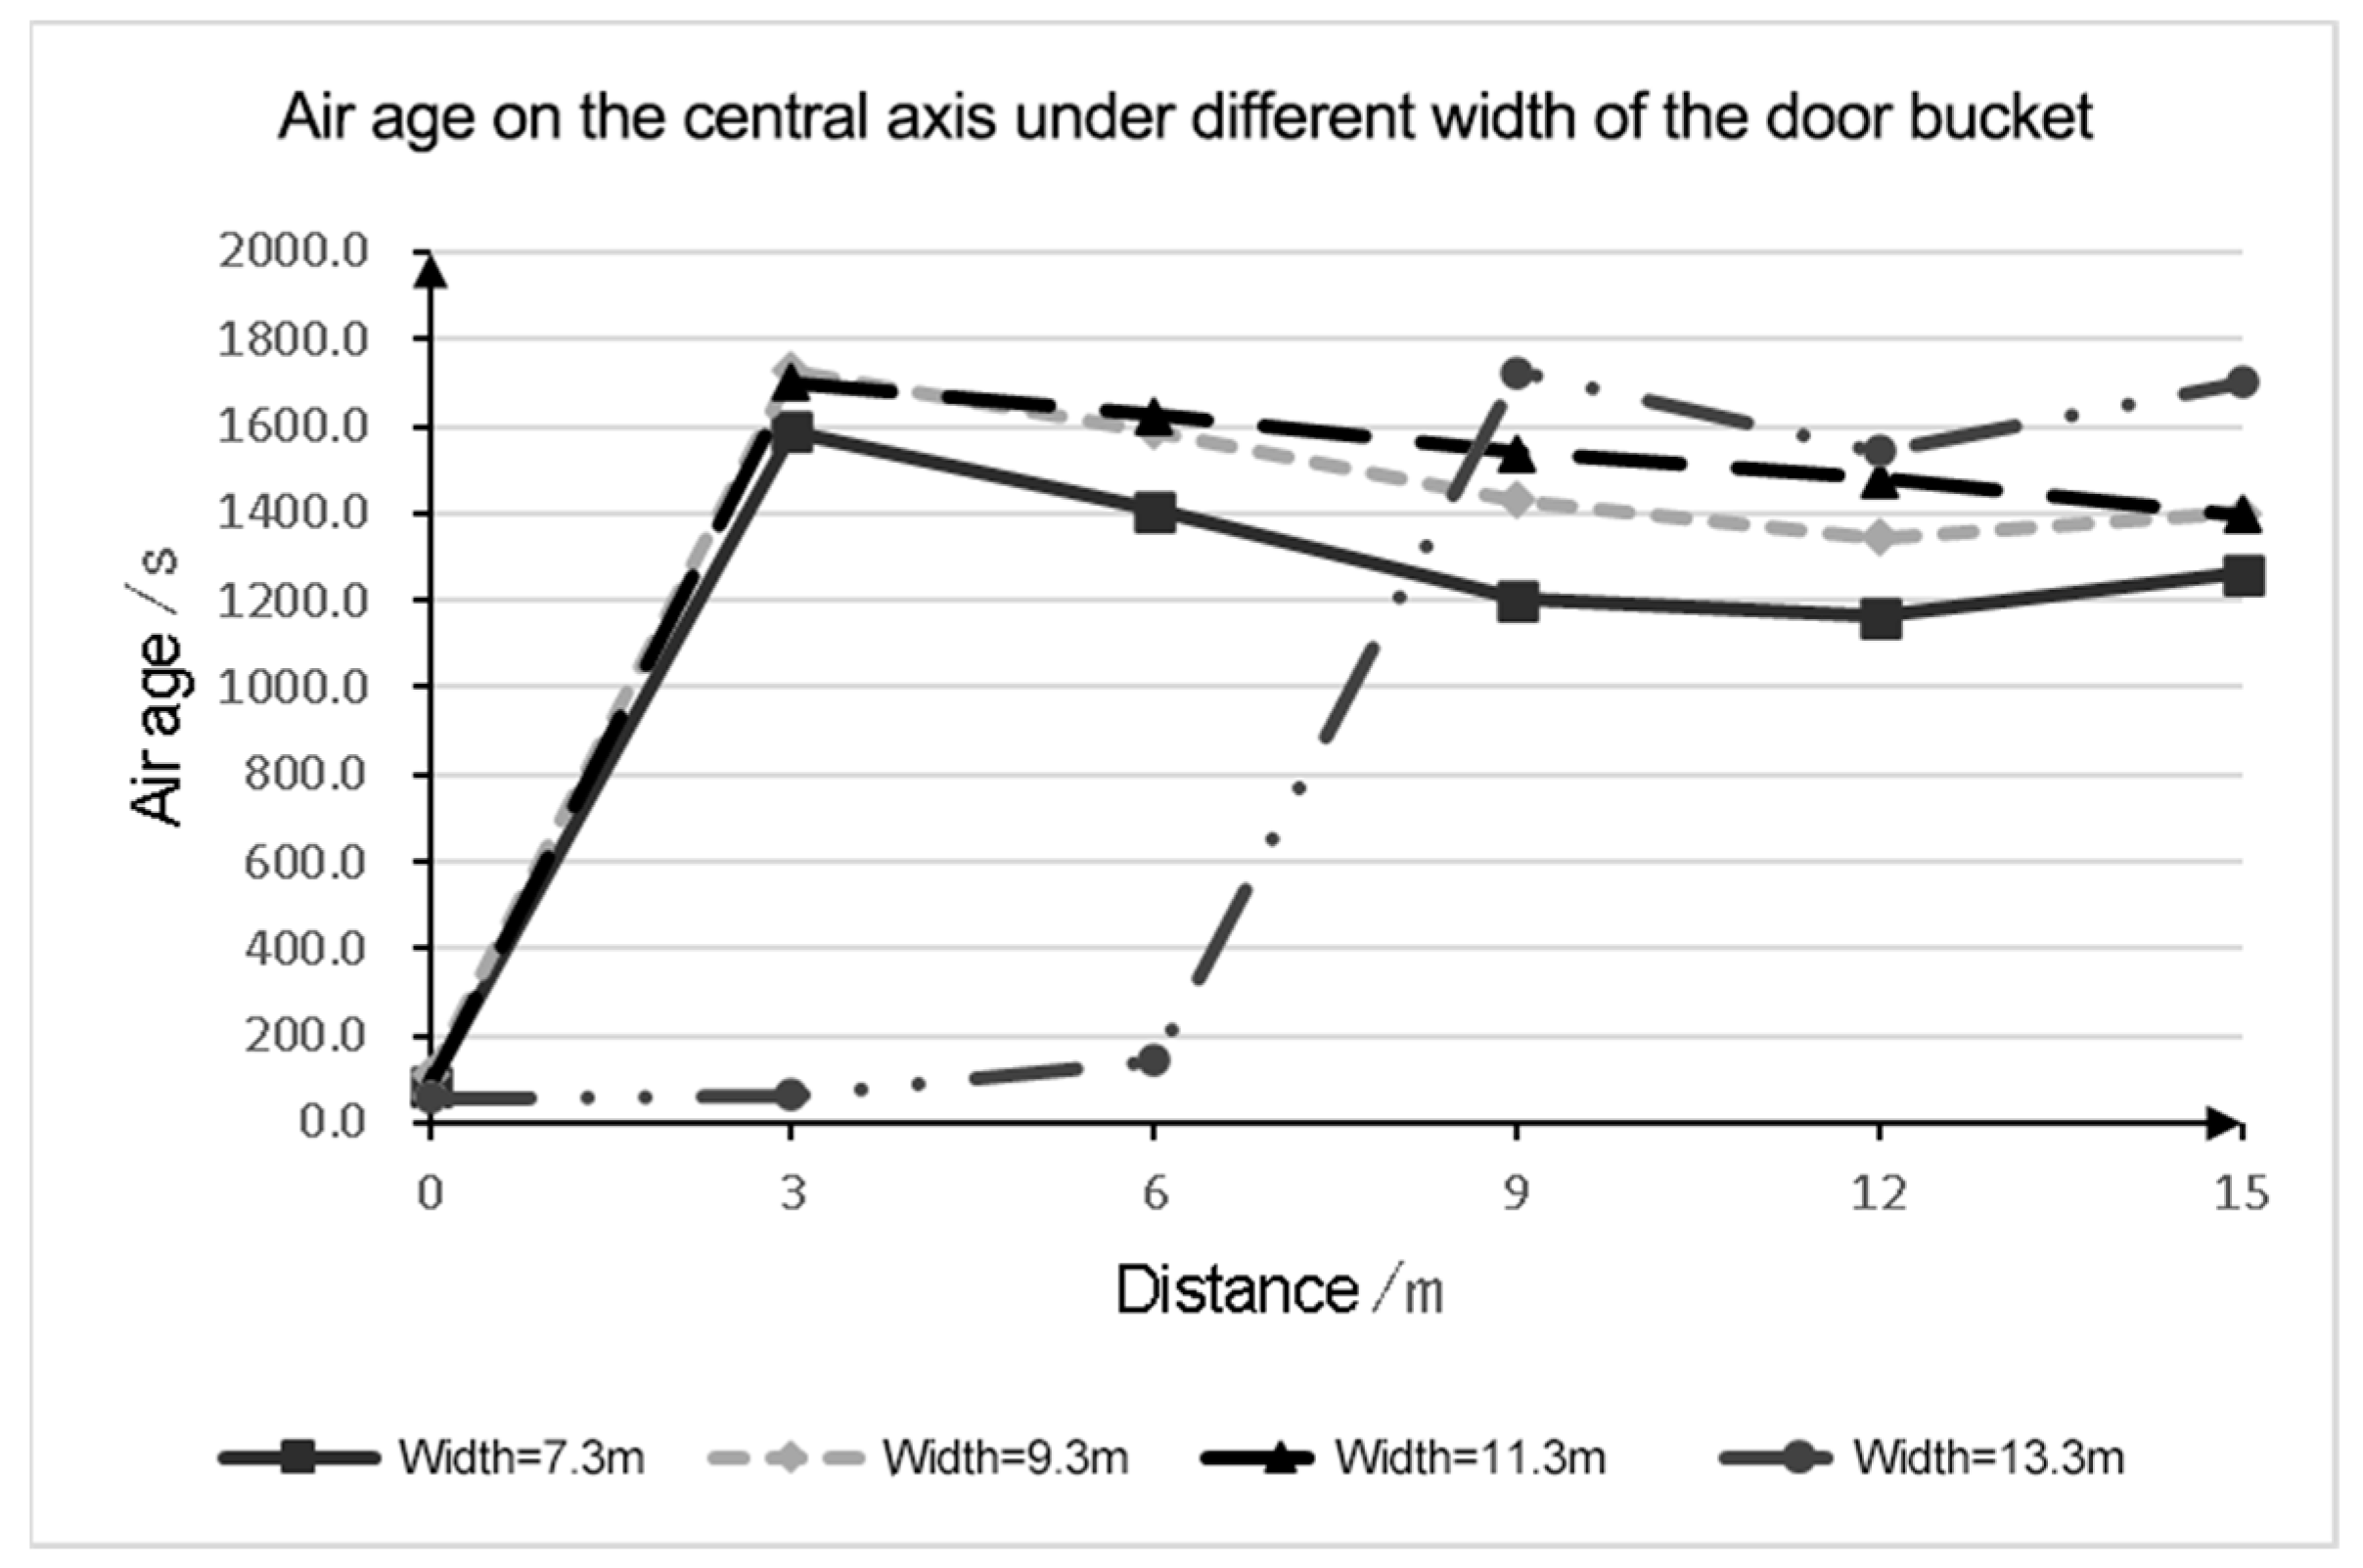
Buildings 14 00344 g007
Figure 8. Changes in wind speed on the central axis of the door bucket under different door bucket types.
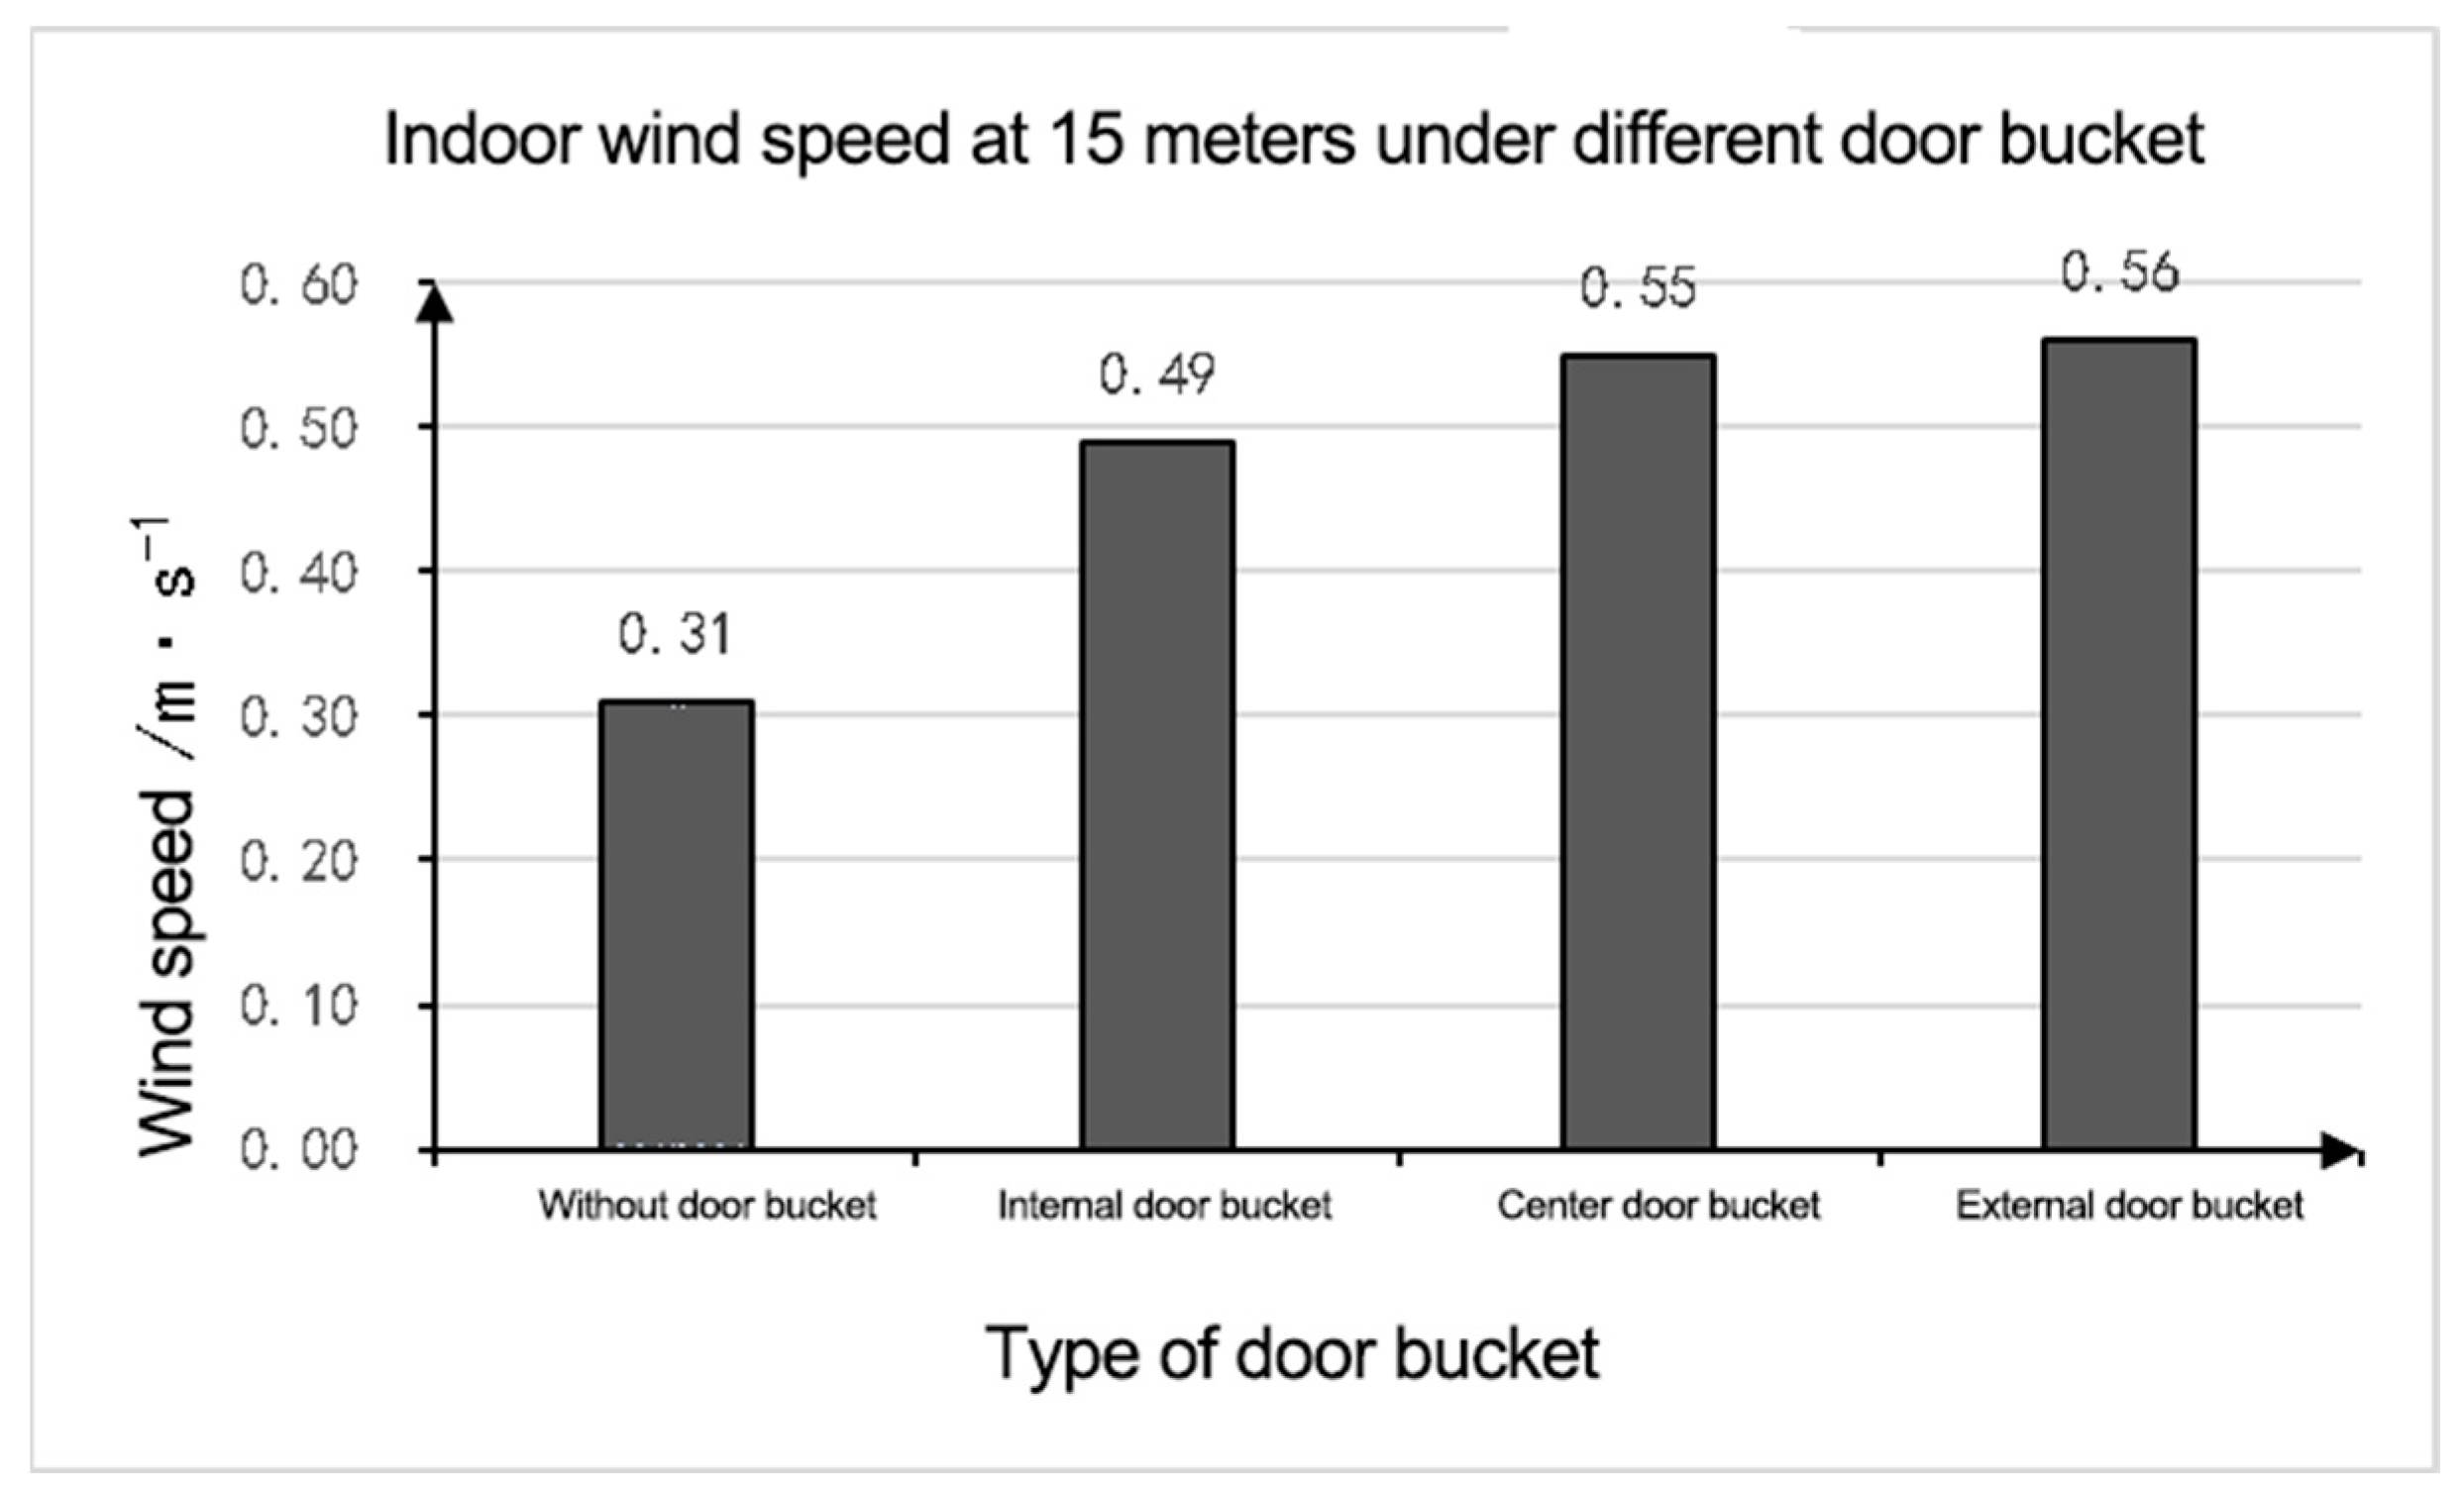
Buildings 14 00344 g008
Figure 9. Indoor wind speed at 15 m under different door bucket types.
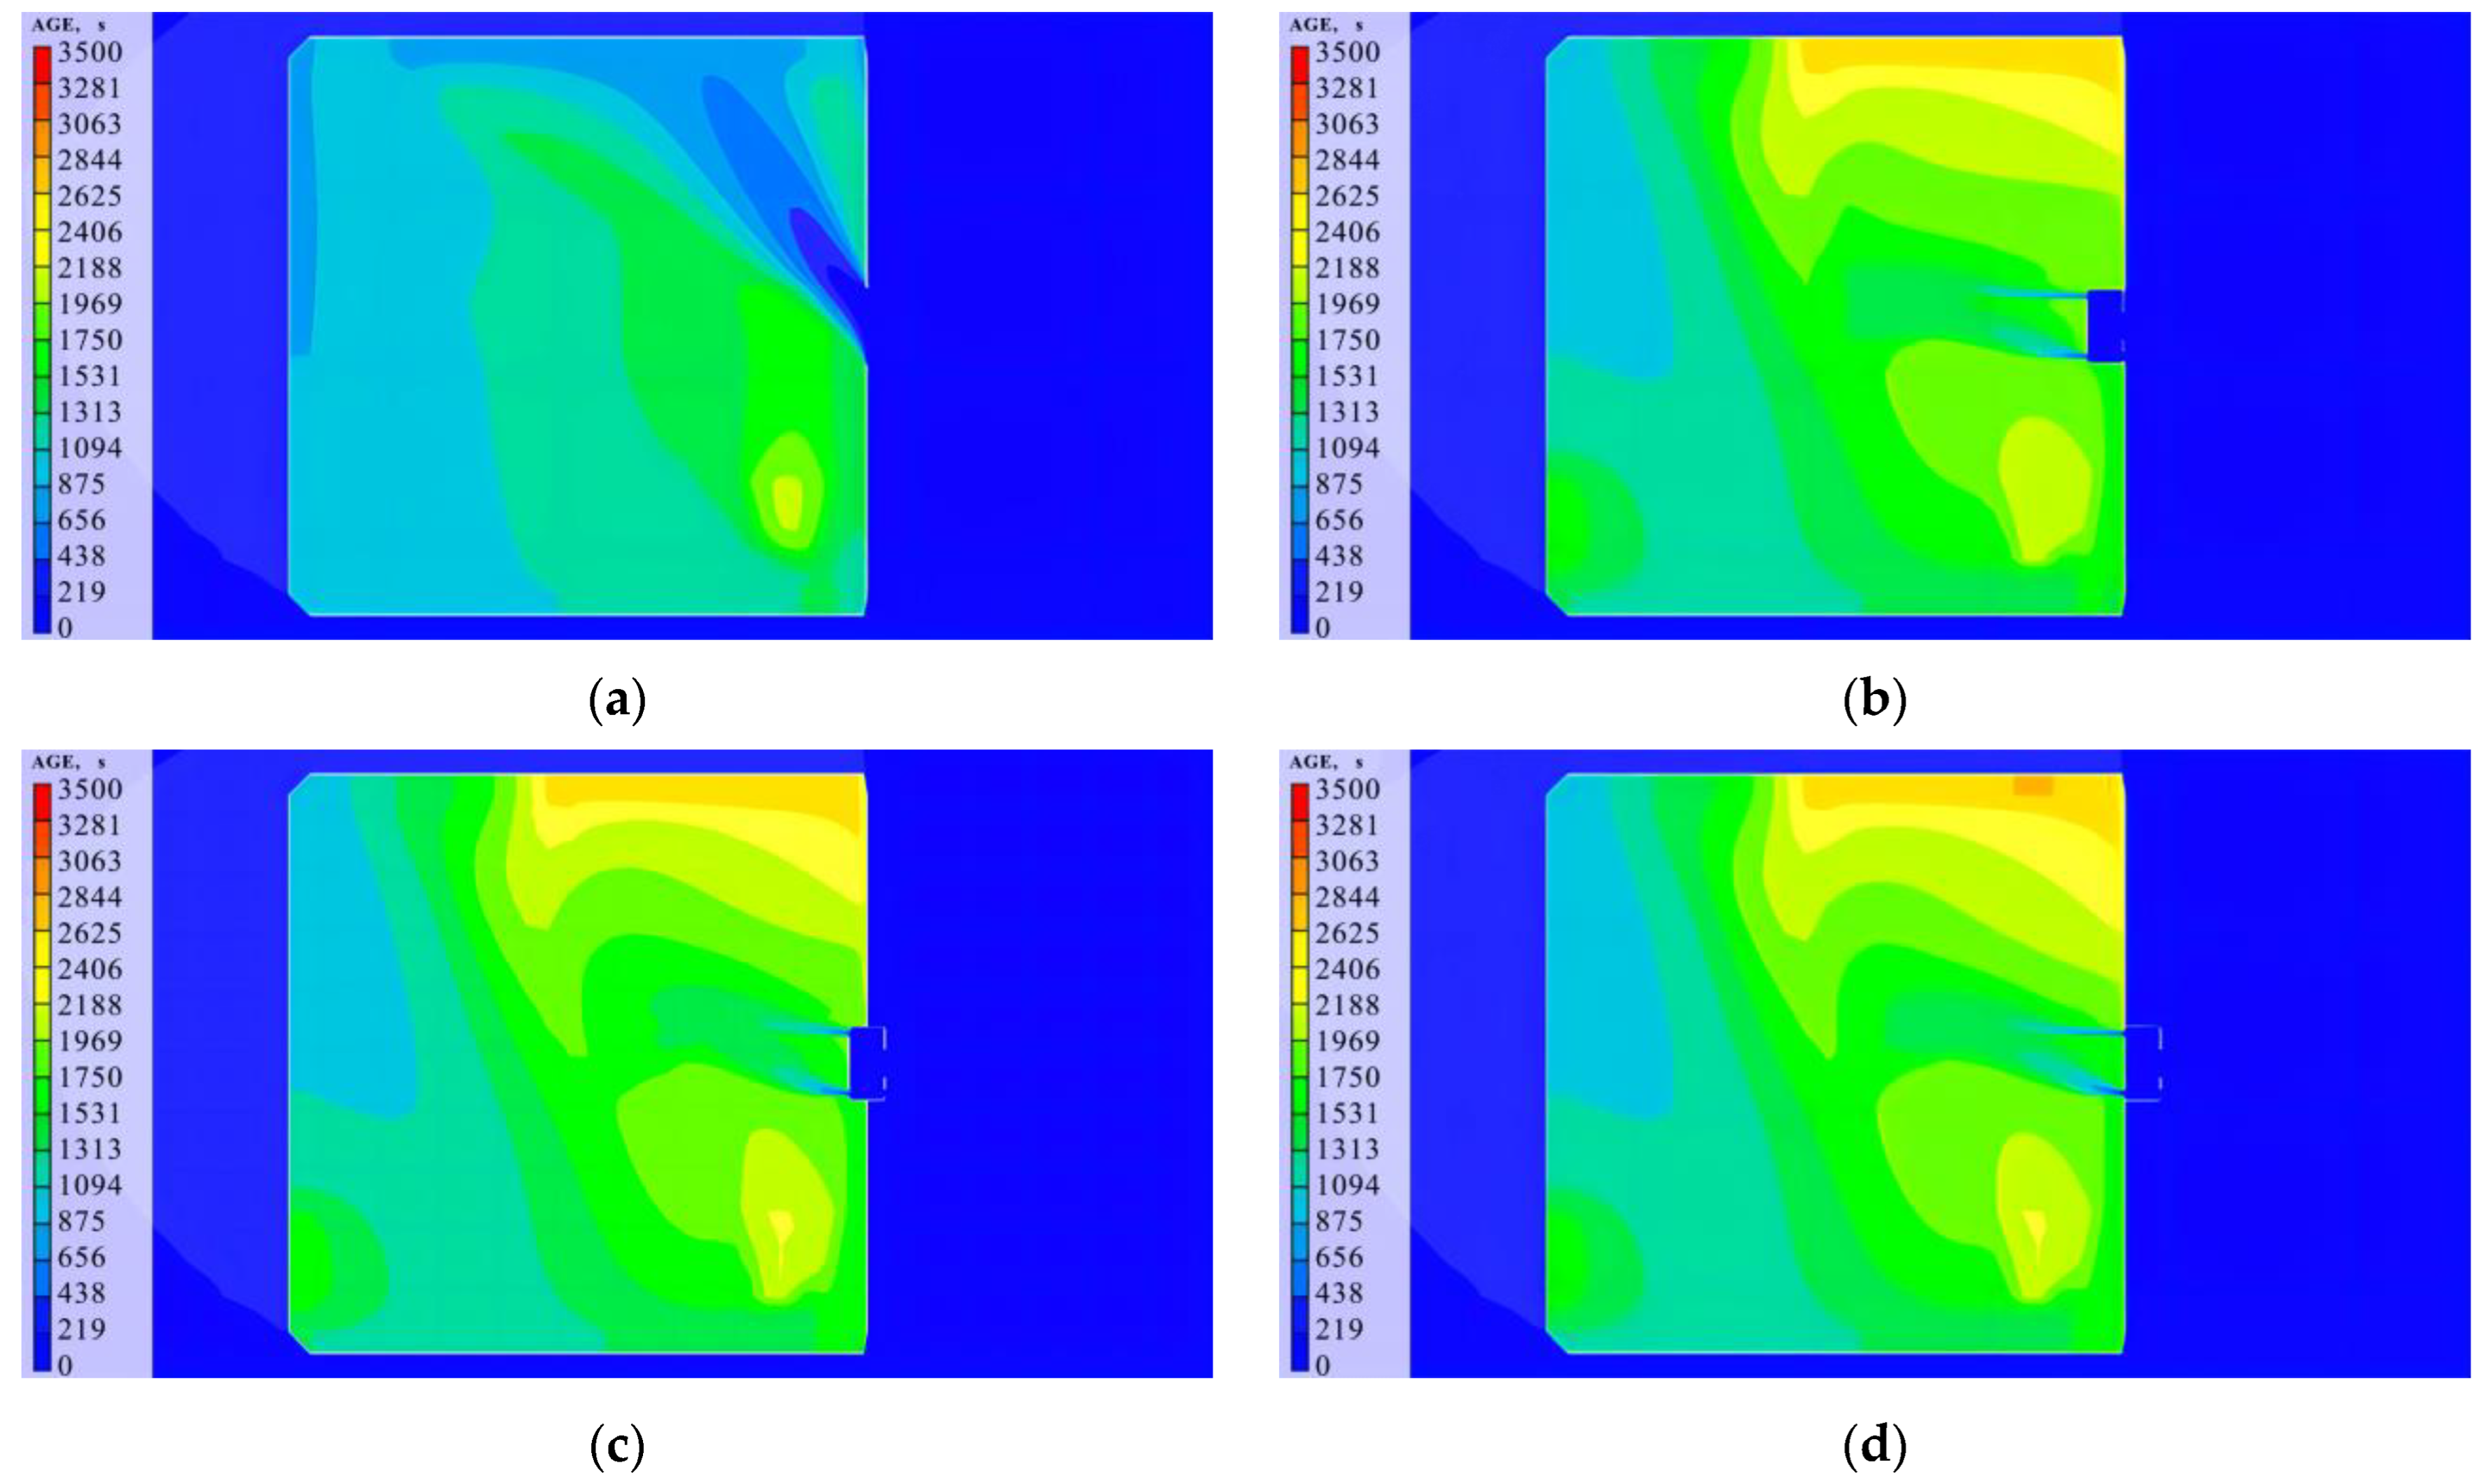
Buildings 14 00344 g009
Figure 10. Air age distributions at a height of 1.5 m under different door bucket types. (a) Air age cloud diagram at a height of 1.5 m for NDB. (b) Air age cloud diagram at a height of 1.5 m for DBB. (c) Air age cloud diagram at a height of 1.5 m for DBM. (d) Air age cloud diagram at a height of 1.5 m for DBE.
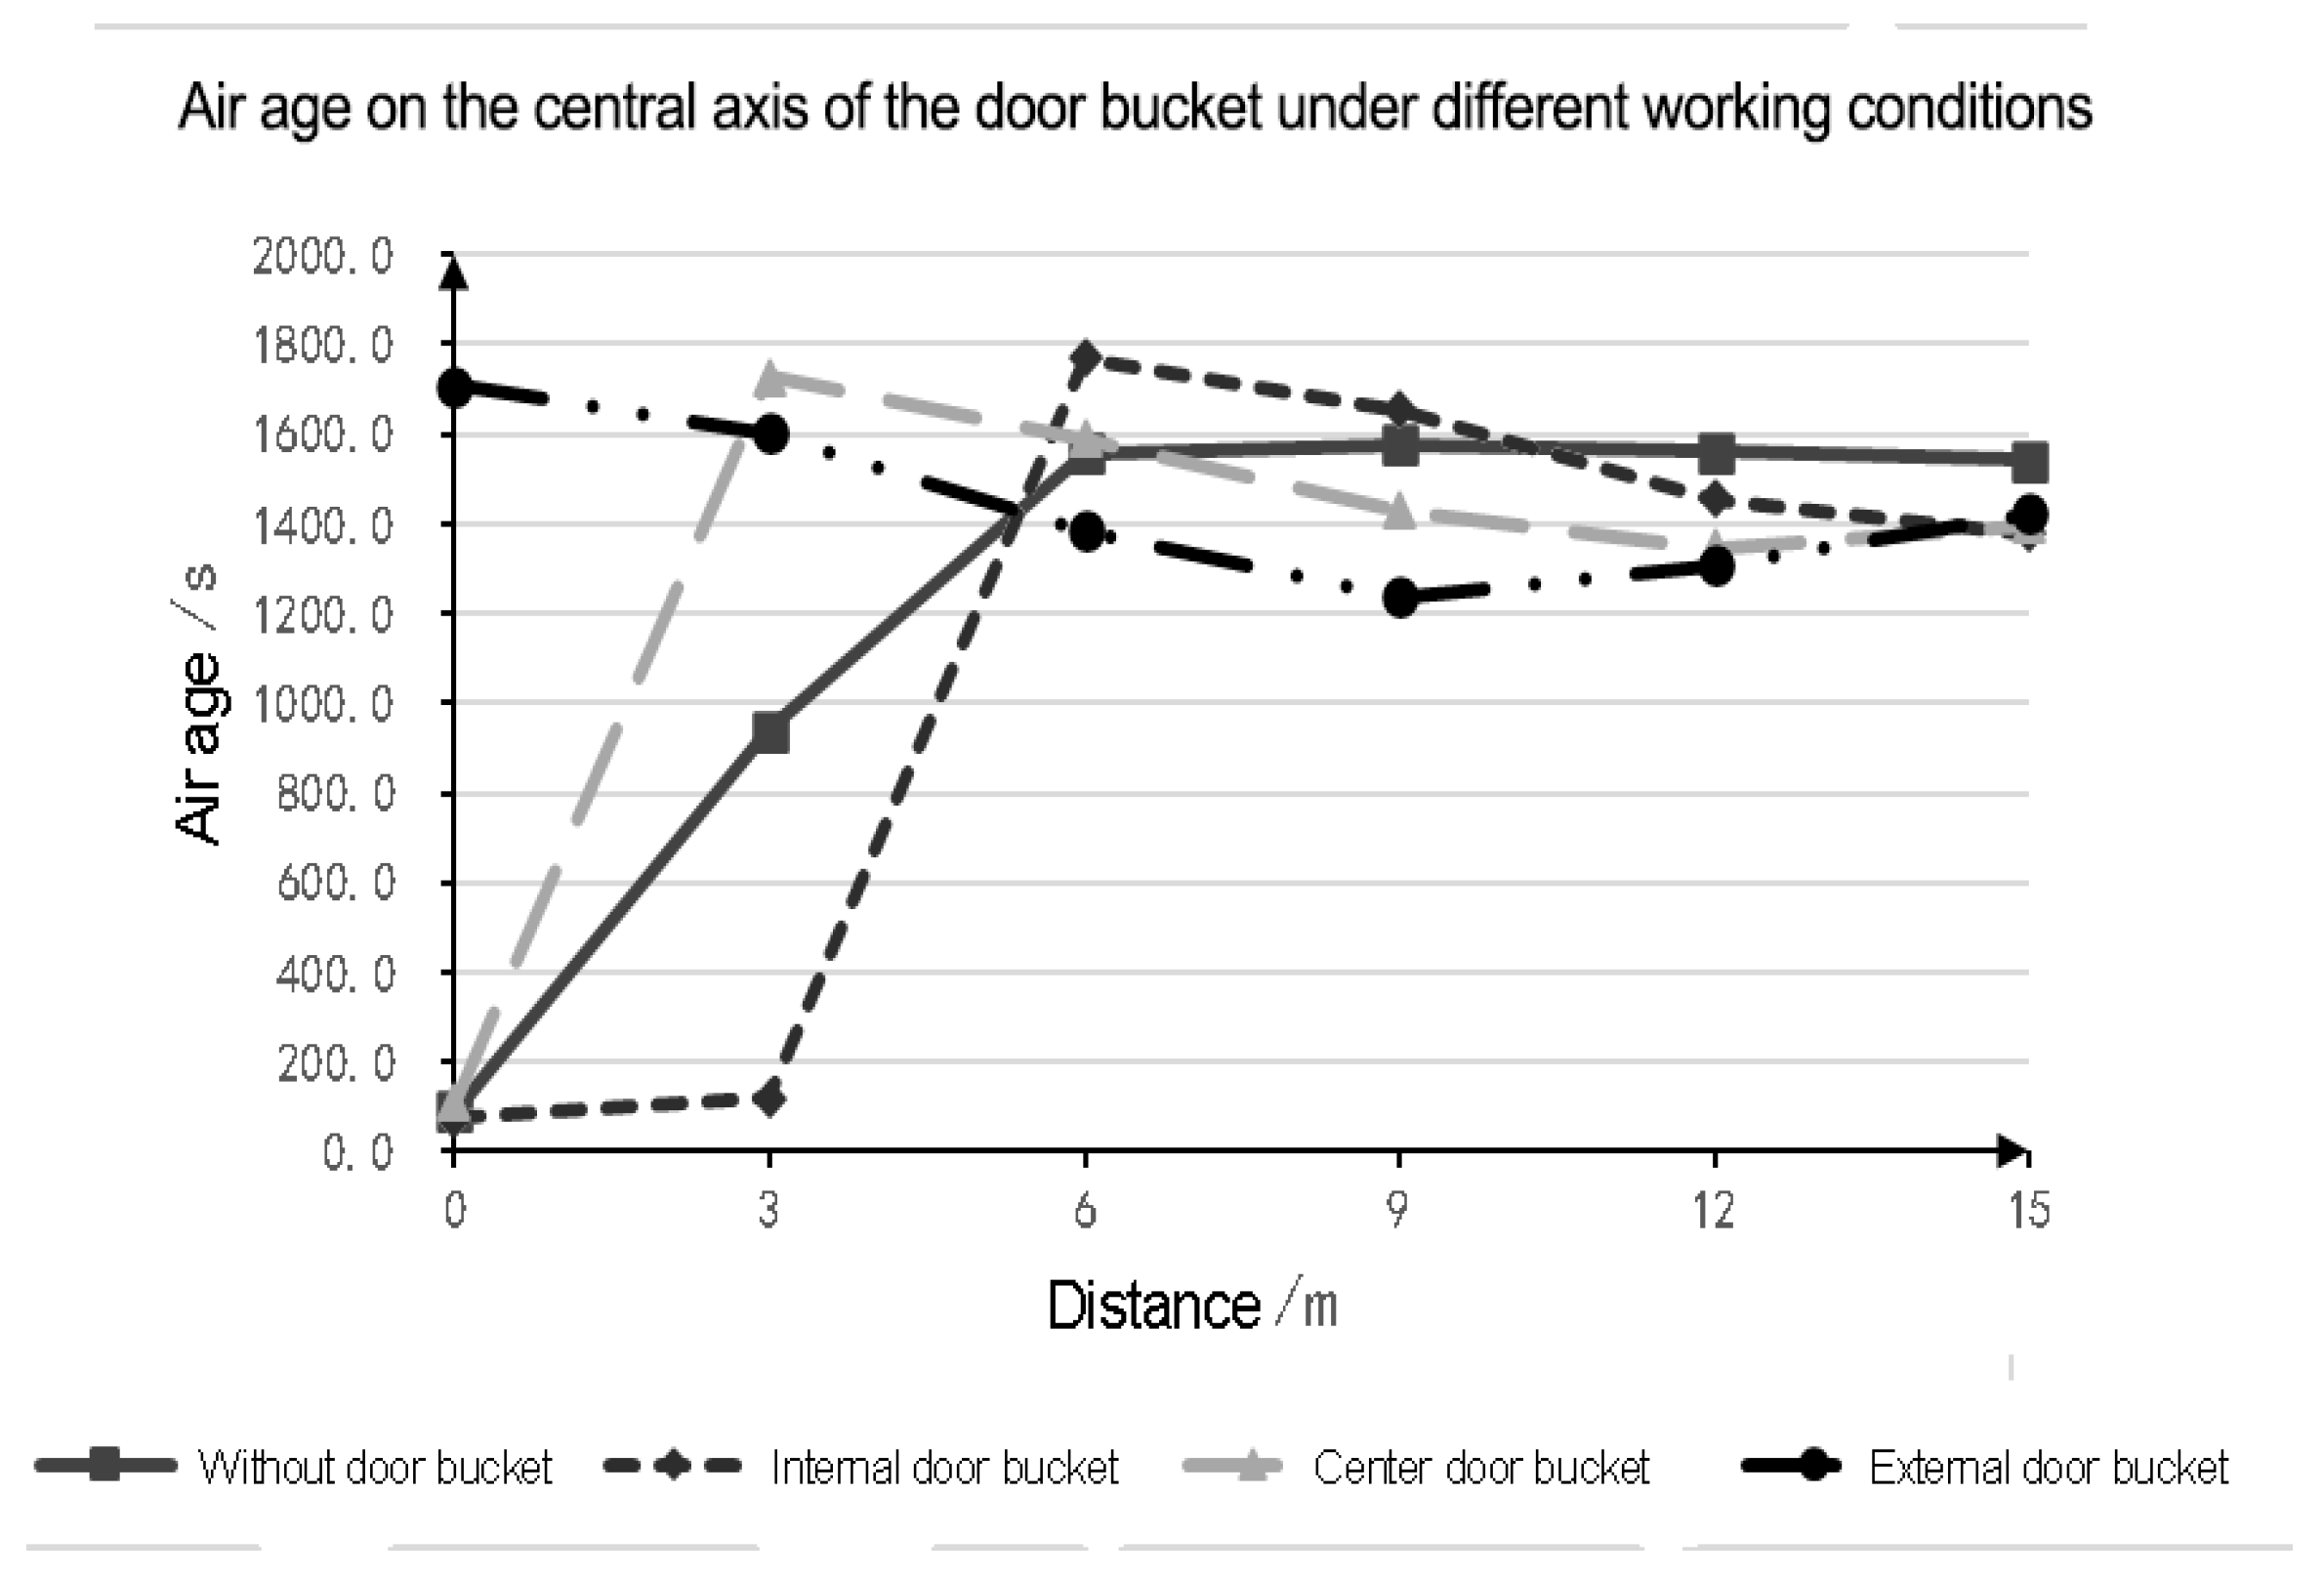
Buildings 14 00344 g010
Figure 11. Changes in air age on the central axis of the door bucket under different door bucket types.
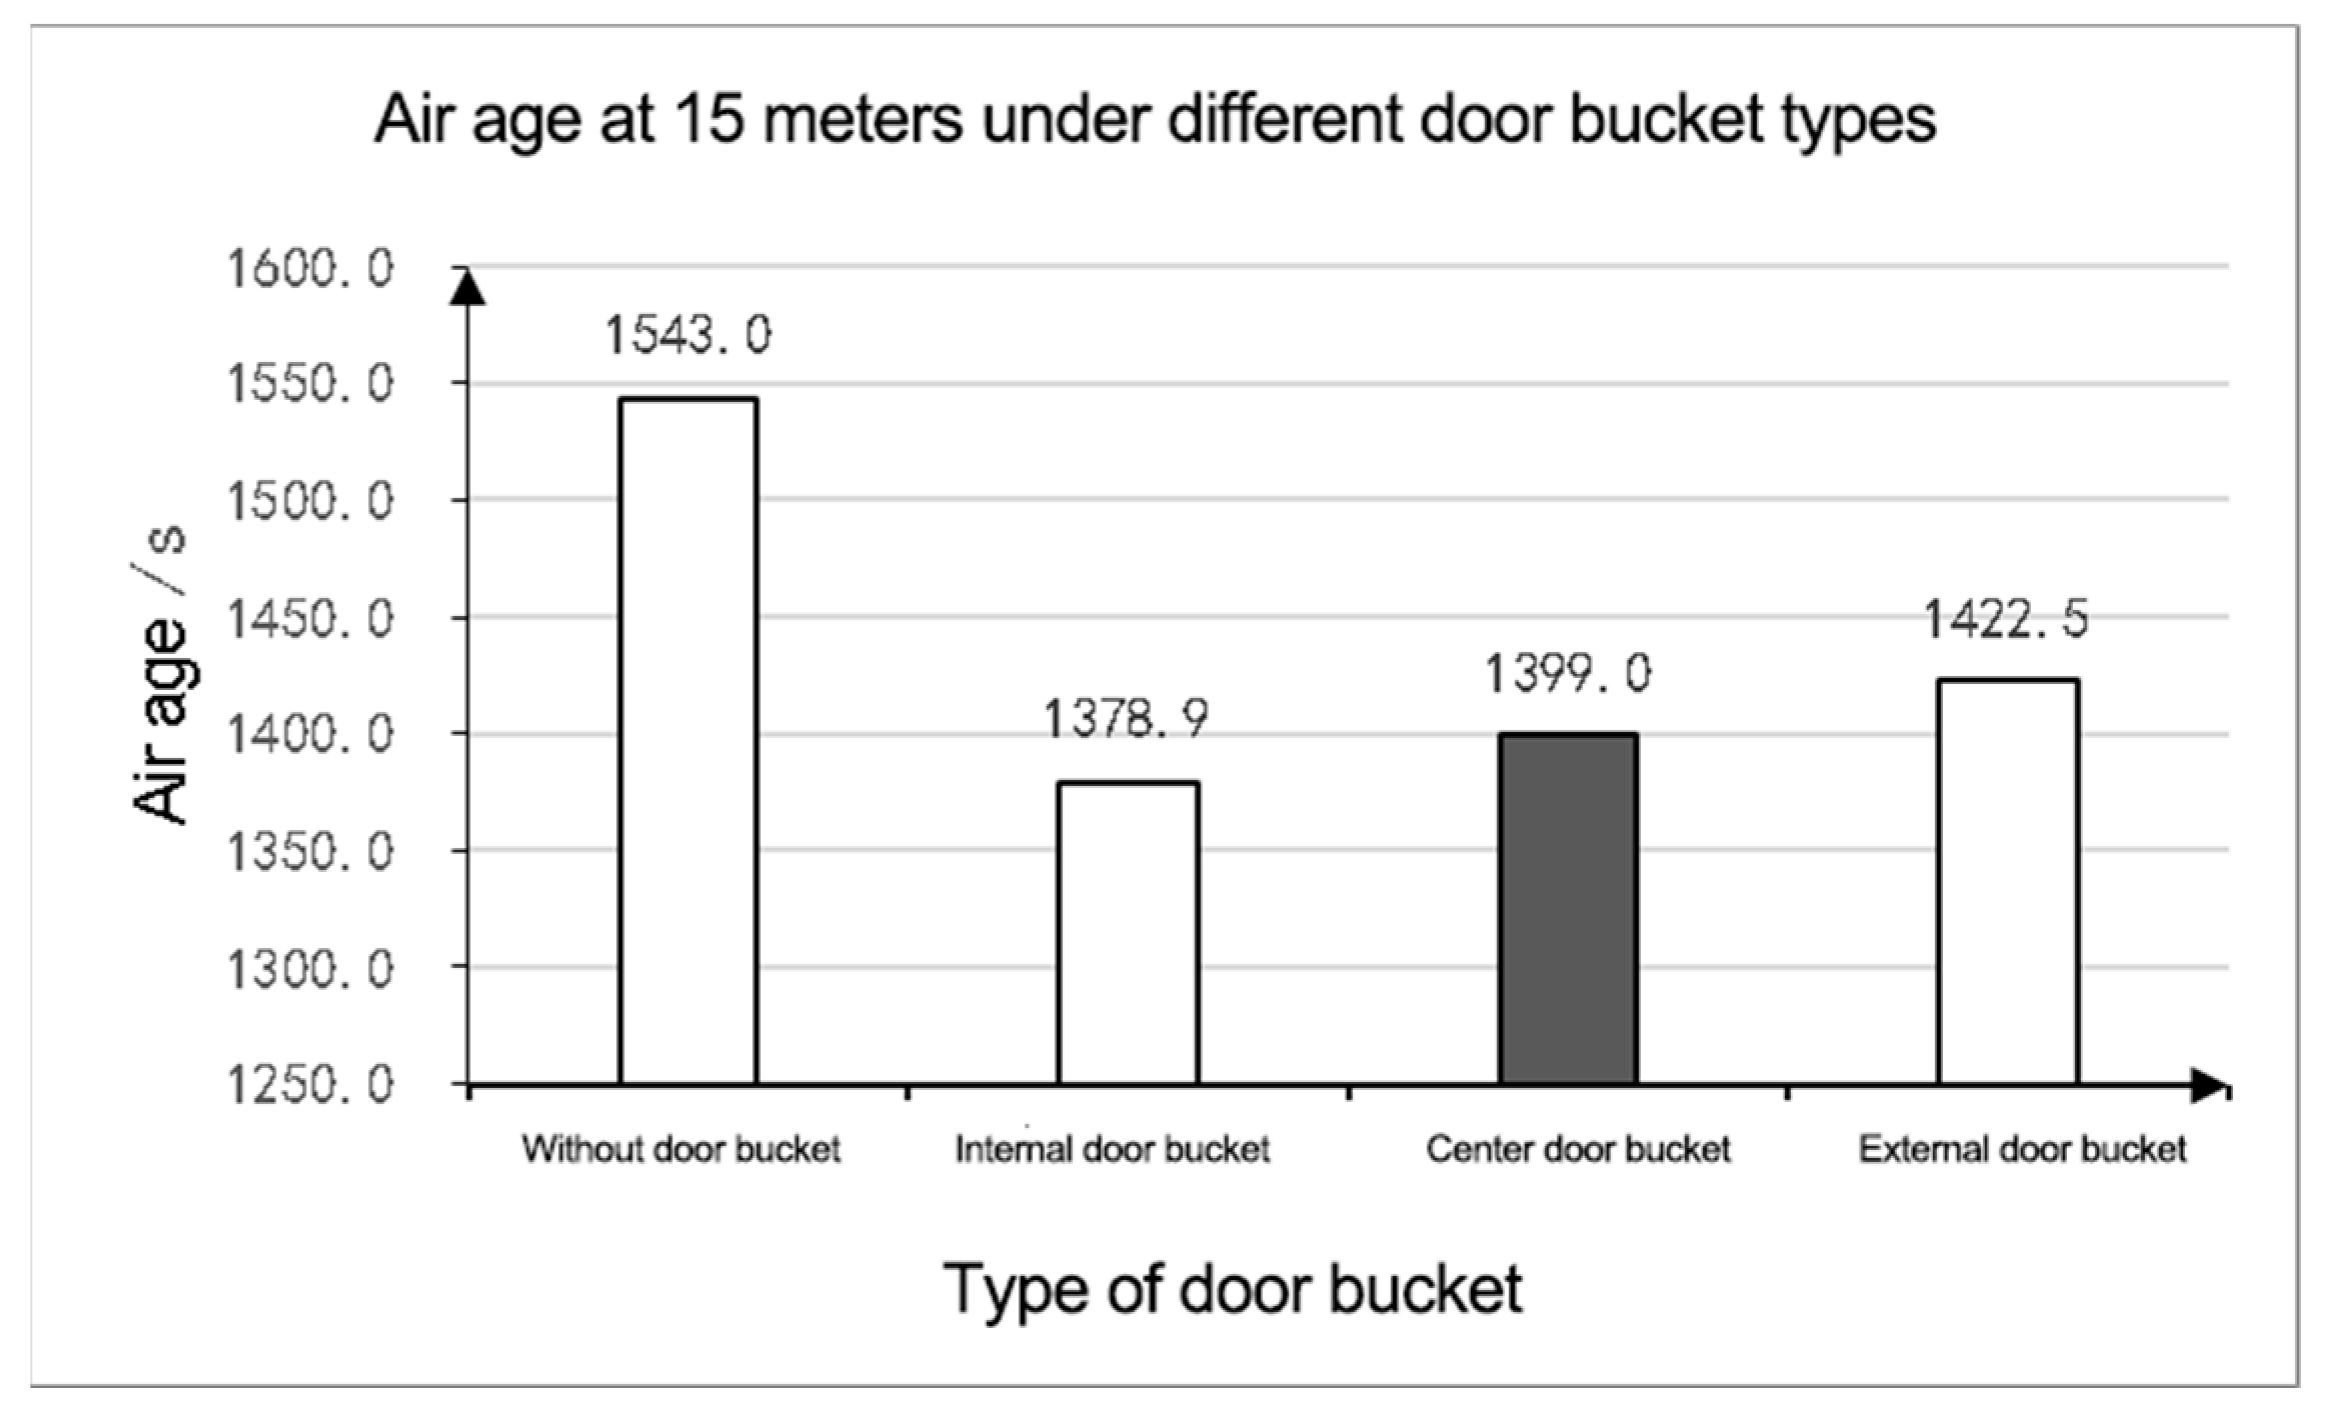
Buildings 14 00344 g011
Figure 12. Indoor air age at 15 m under different door bucket types.
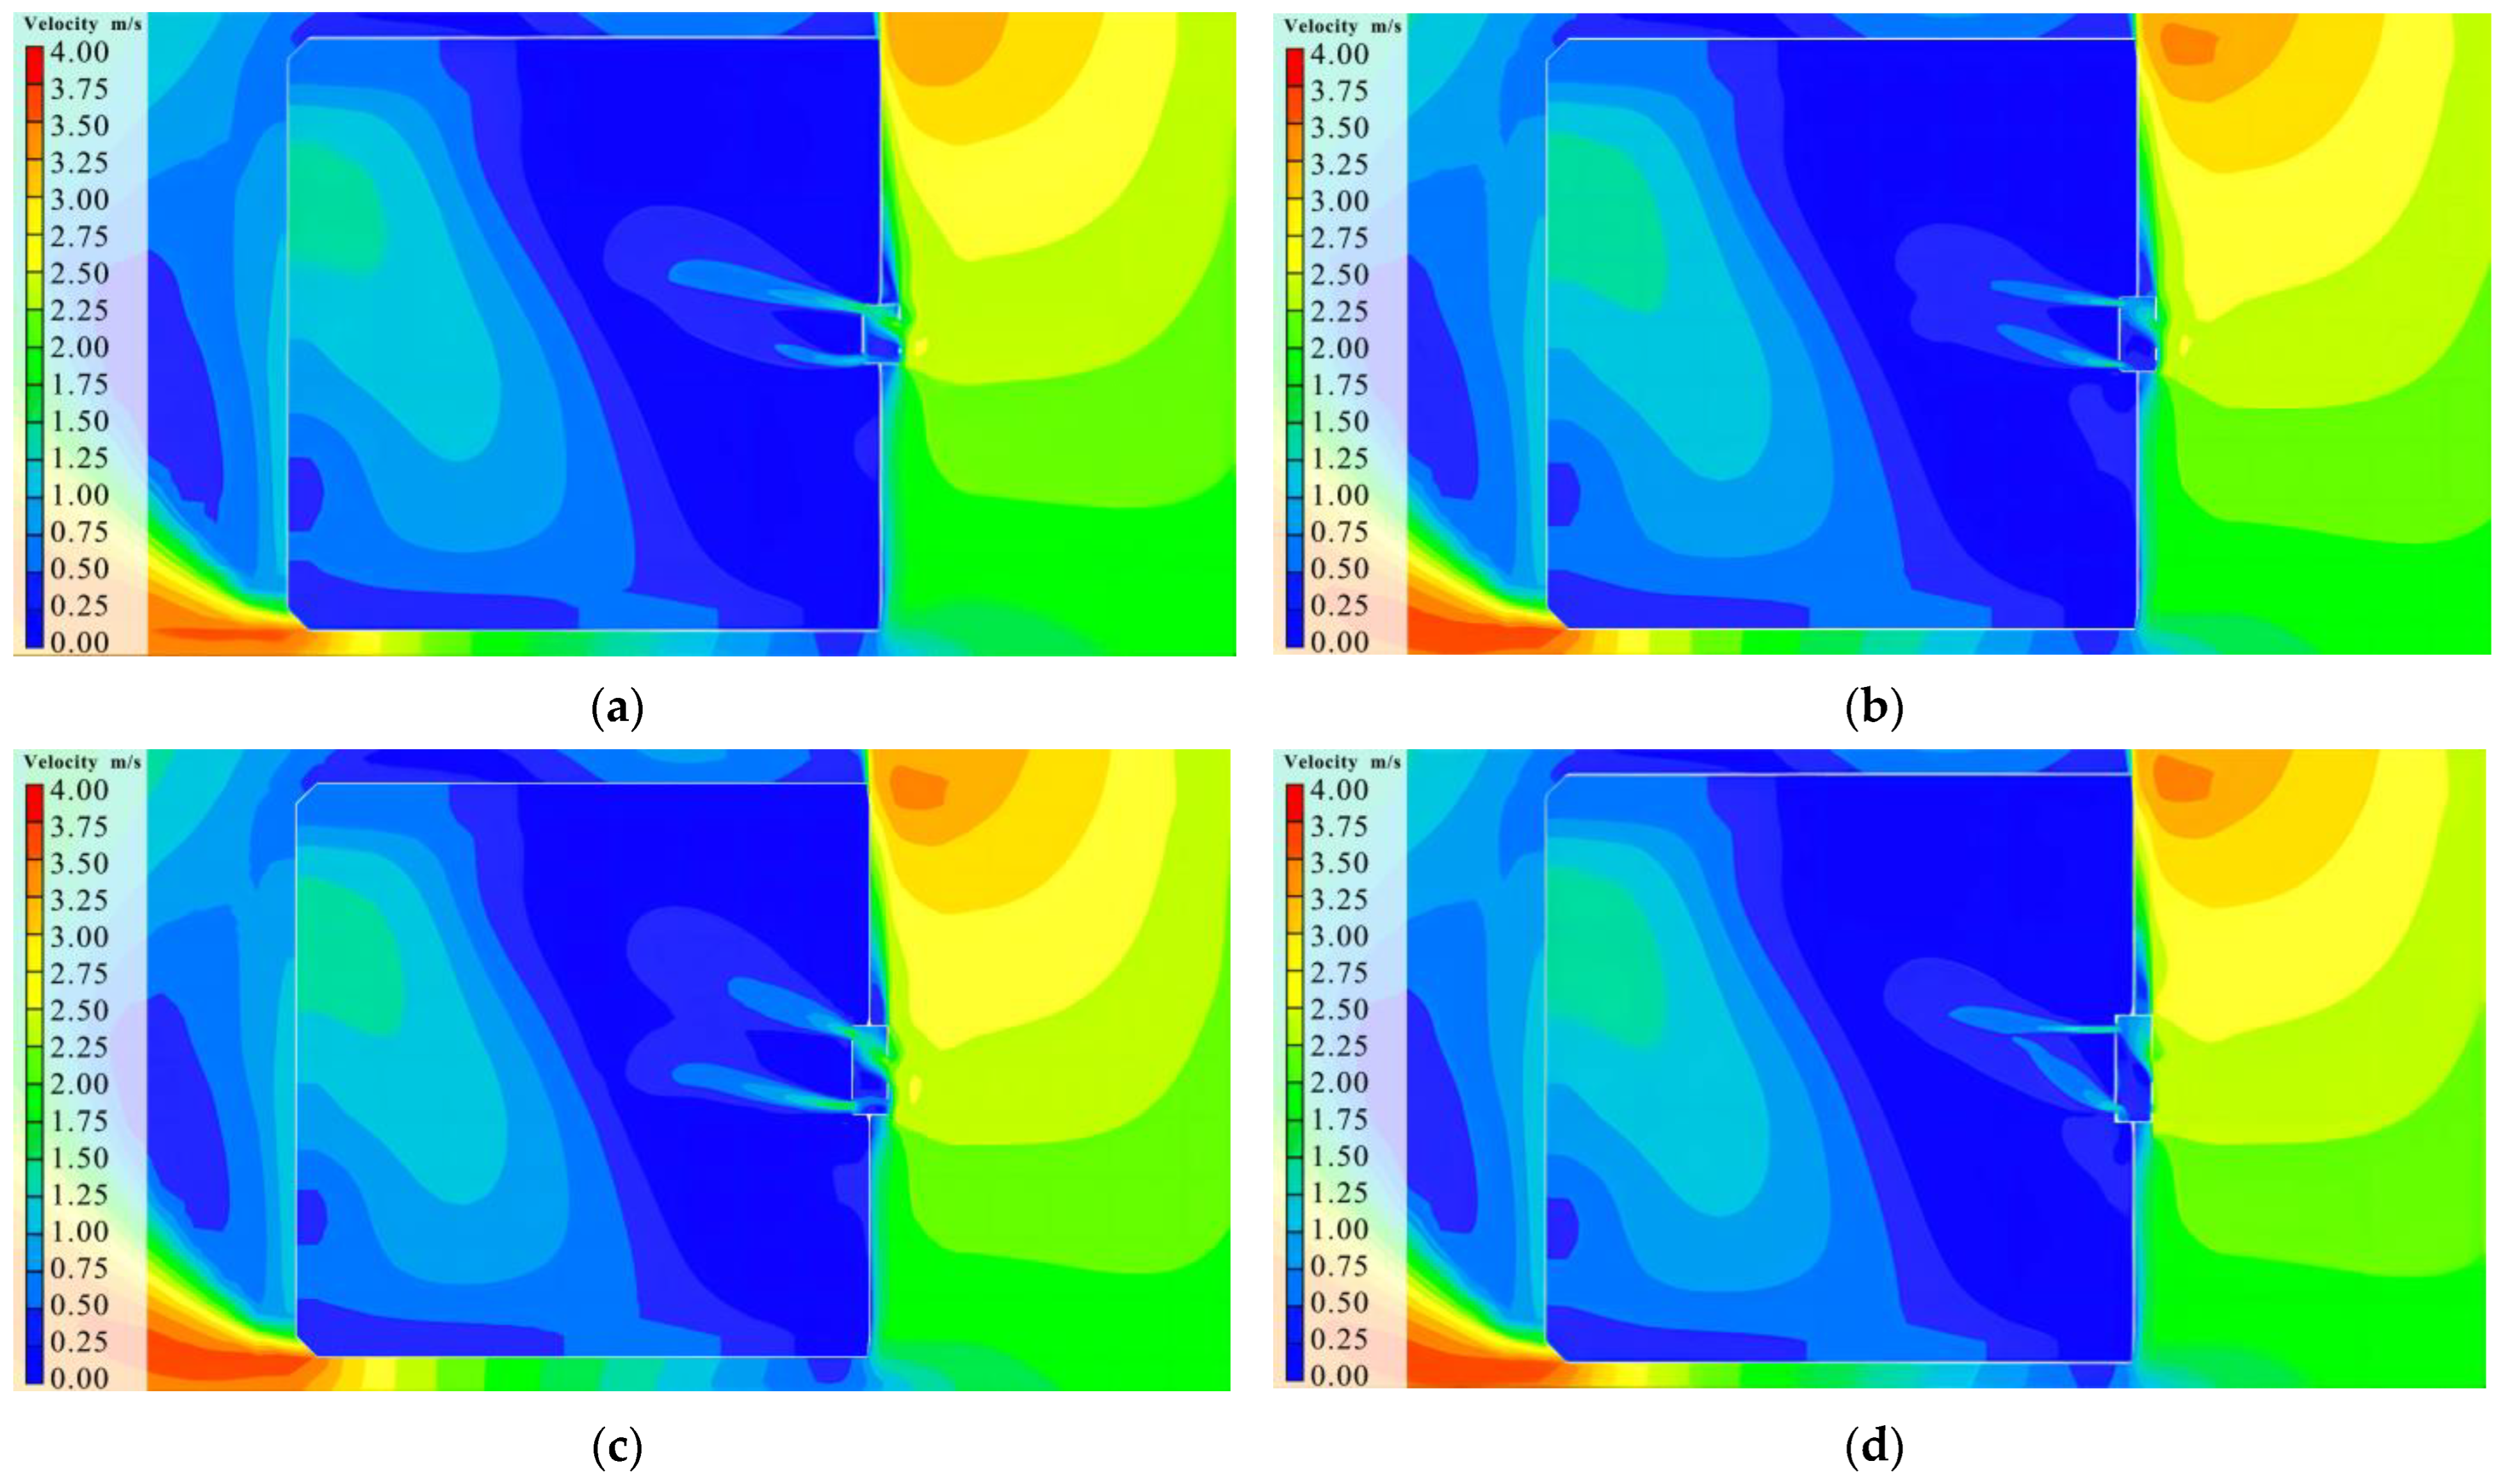
Buildings 14 00344 g012
Figure 13. Wind speed distribution at a height of 1.5 m under different door bucket widths. (a) Wind speed cloud diagram at a height of 1.5 m with a door bucket width of 7.3 m. (b) Wind speed cloud diagram at a height of 1.5 m with a door bucket width of 9.3 m. (c) Wind speed cloud diagram at a height of 1.5 m with a door bucket width of 11.3 m. (d) Wind speed cloud diagram at a height of 1.5 m with a door bucket width of 13.3 m.
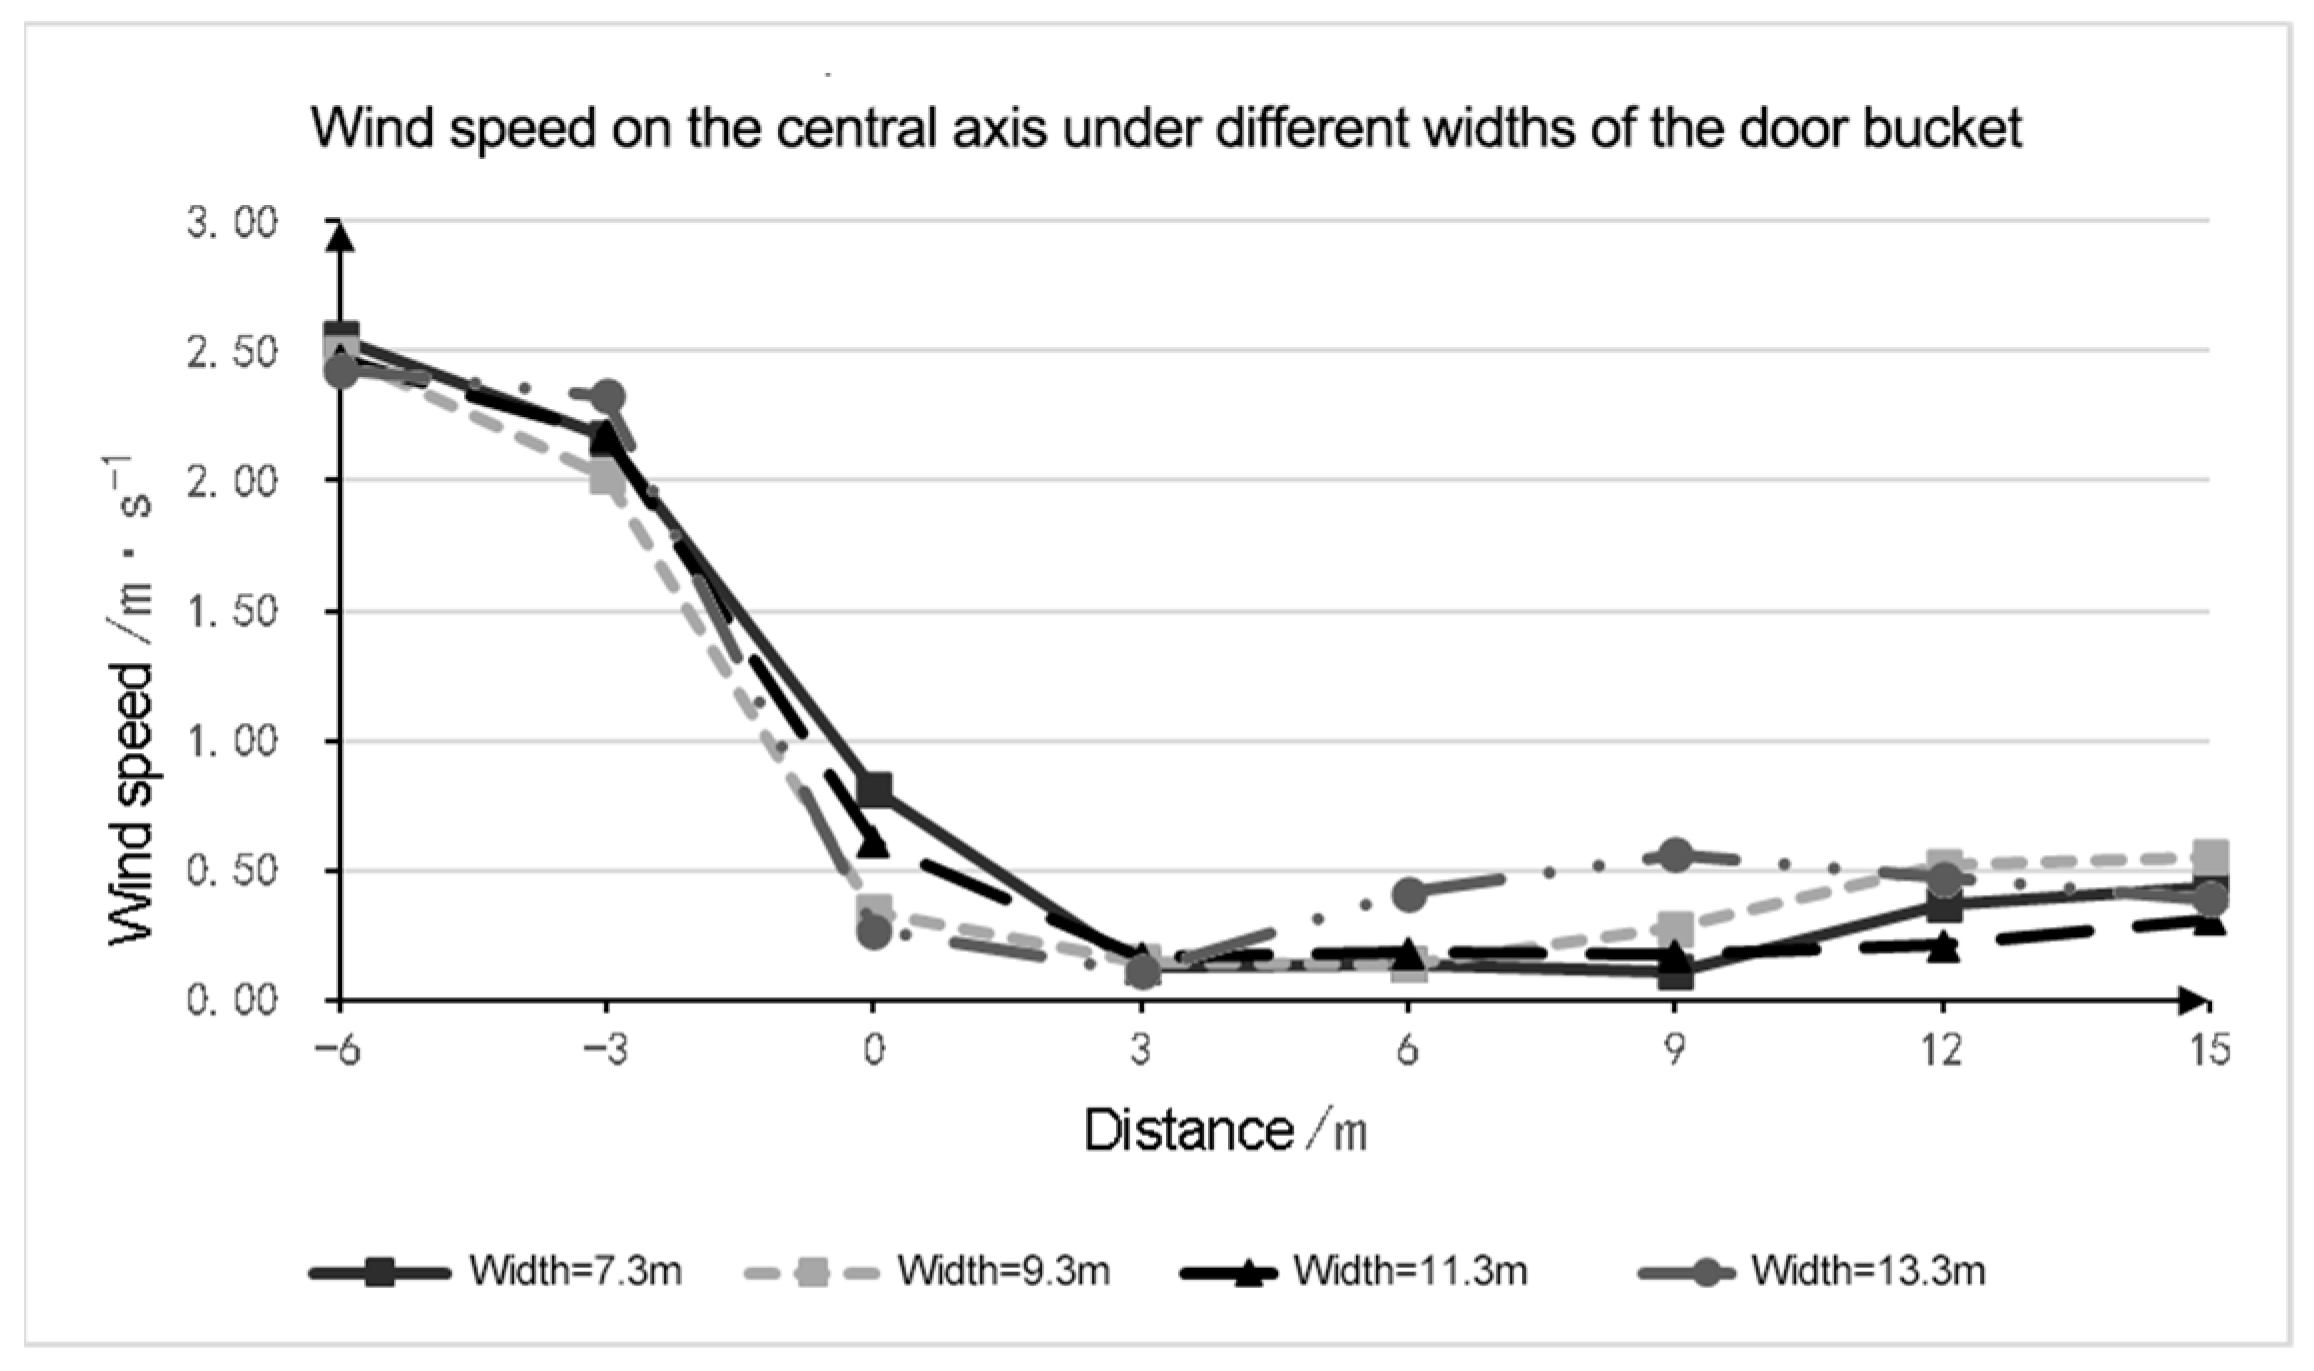
Buildings 14 00344 g013
Figure 14. Changes in wind speed on the central axis of the door bucket under different door bucket widths.
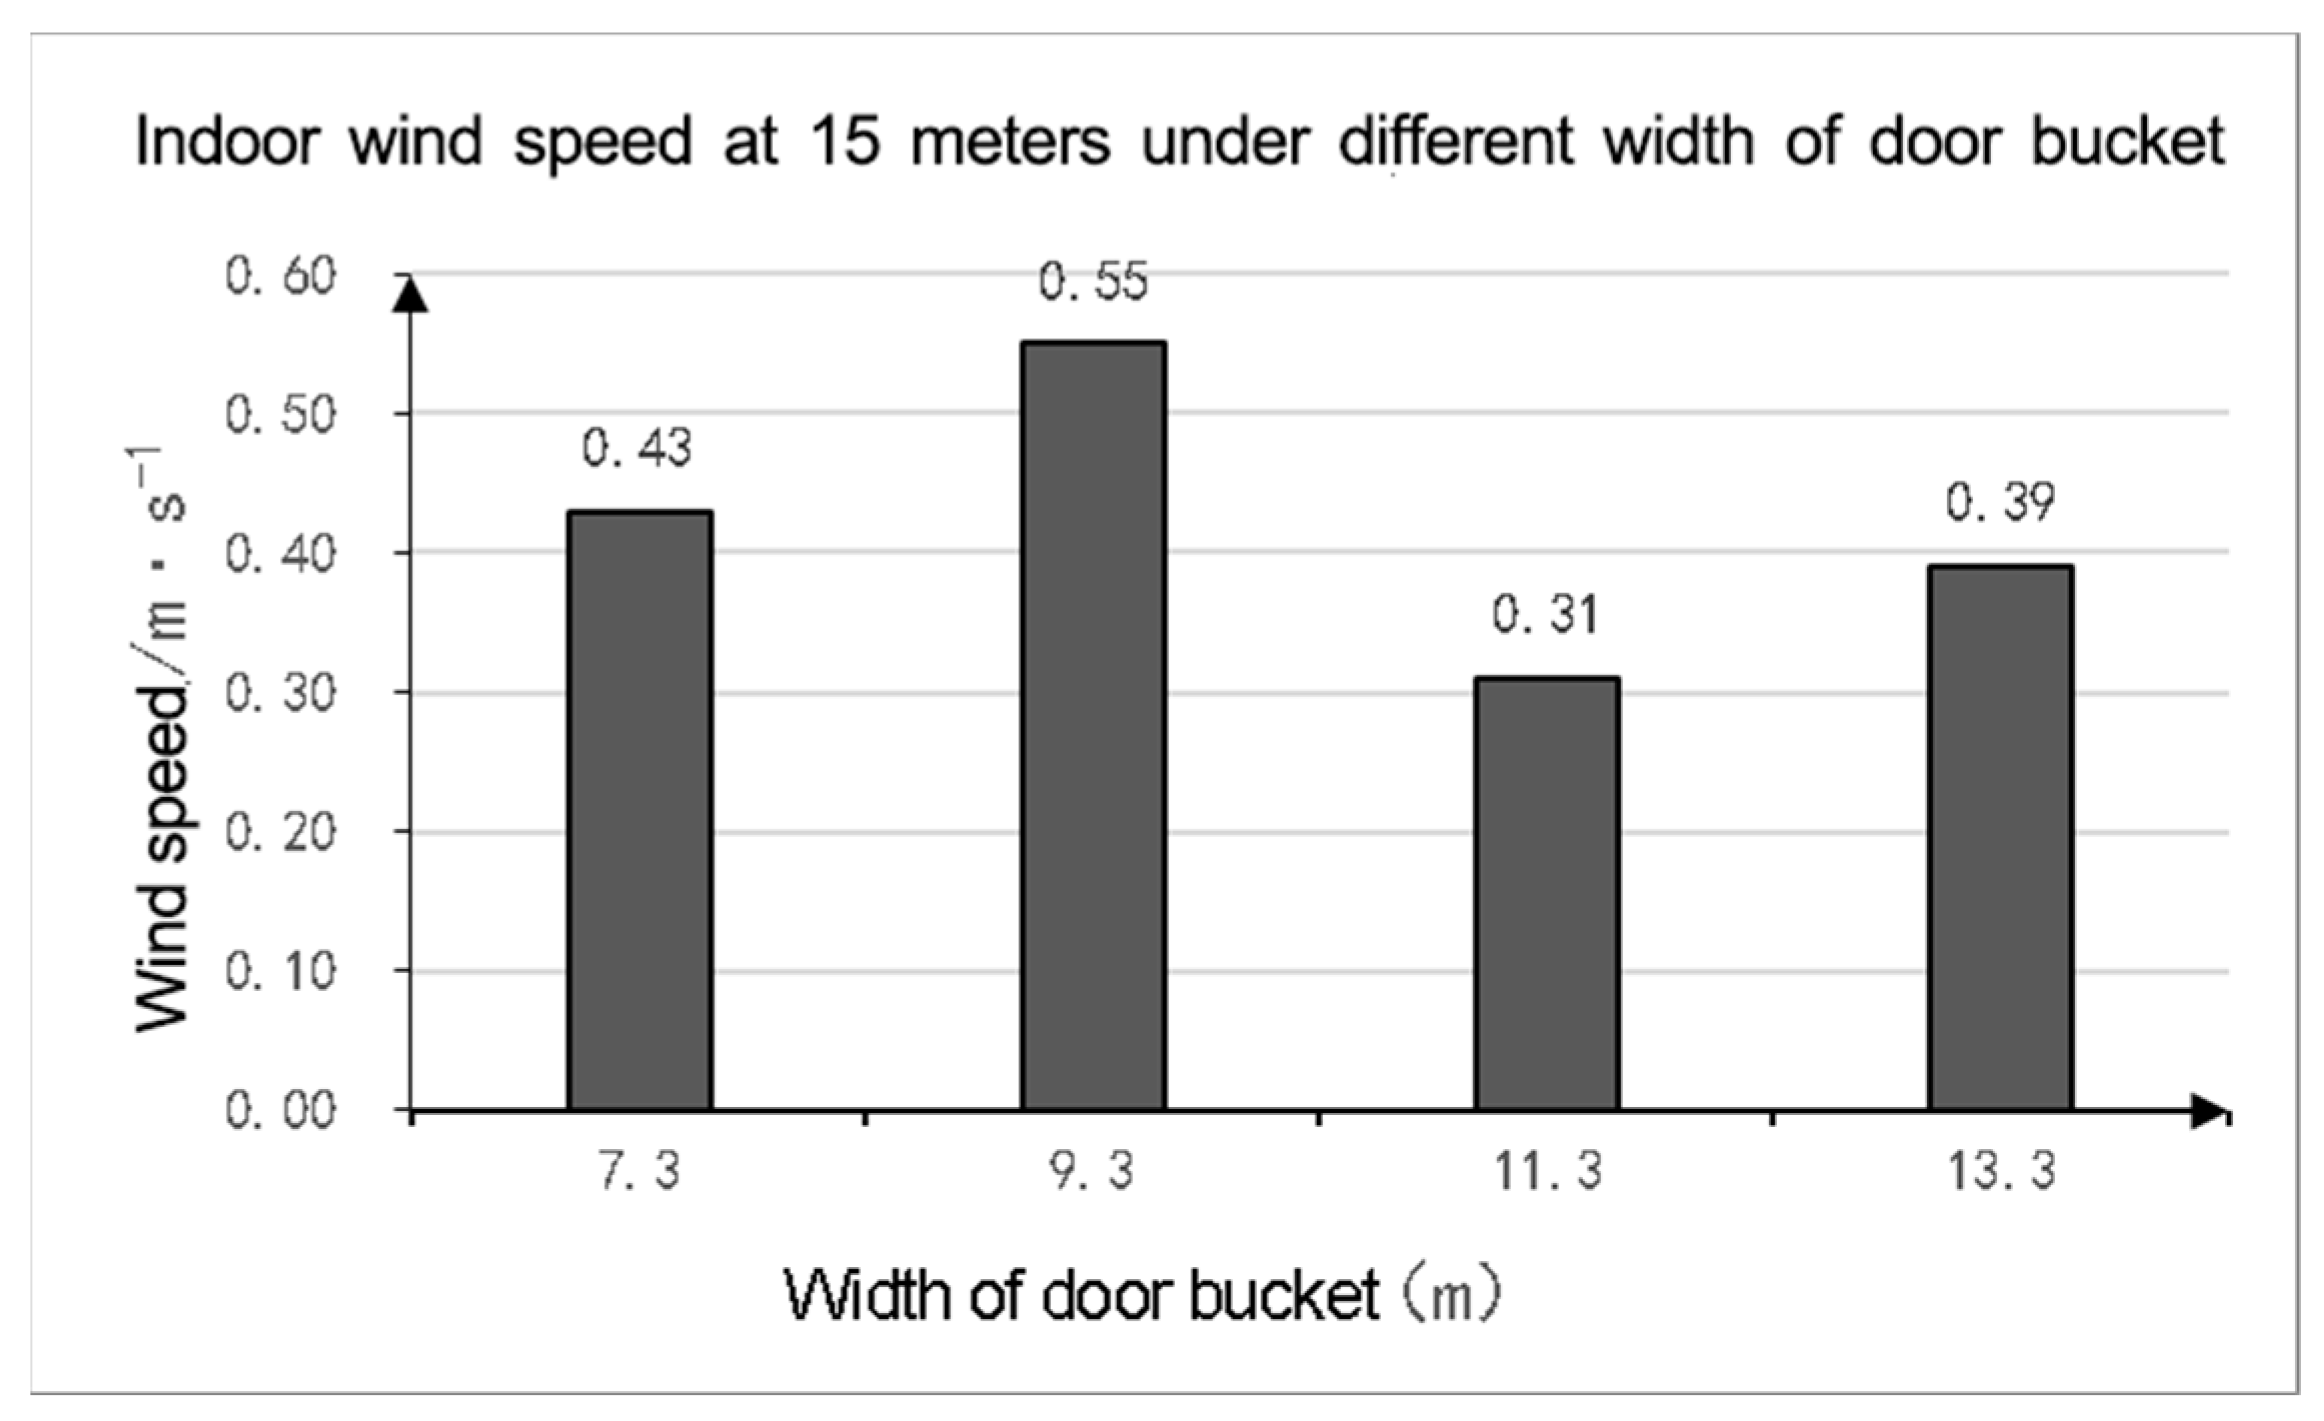
Buildings 14 00344 g014
Figure 15. Indoor wind speeds at 15 m with different door bucket widths.
Buildings 14 00344 g015
Figure 16. Wind speed distribution at a height of 1.5 m under different door bucket depths. (a) Wind speed cloud diagram at a height of 1.5 m with a door bucket depth of 3.7 m. (b) Wind speed cloud diagram at a height of 1.5 m with a door bucket depth of 4.7 m. (c) Wind speed cloud diagram at a height of 1.5 m with a door bucket depth of 5.7 m. (d) Wind speed cloud diagram at a height of 1.5 m with a door bucket depth of 6.7 m. (e) Wind speed cloud diagram at a height of 1.5 m with a door bucket depth of 7.7 m.
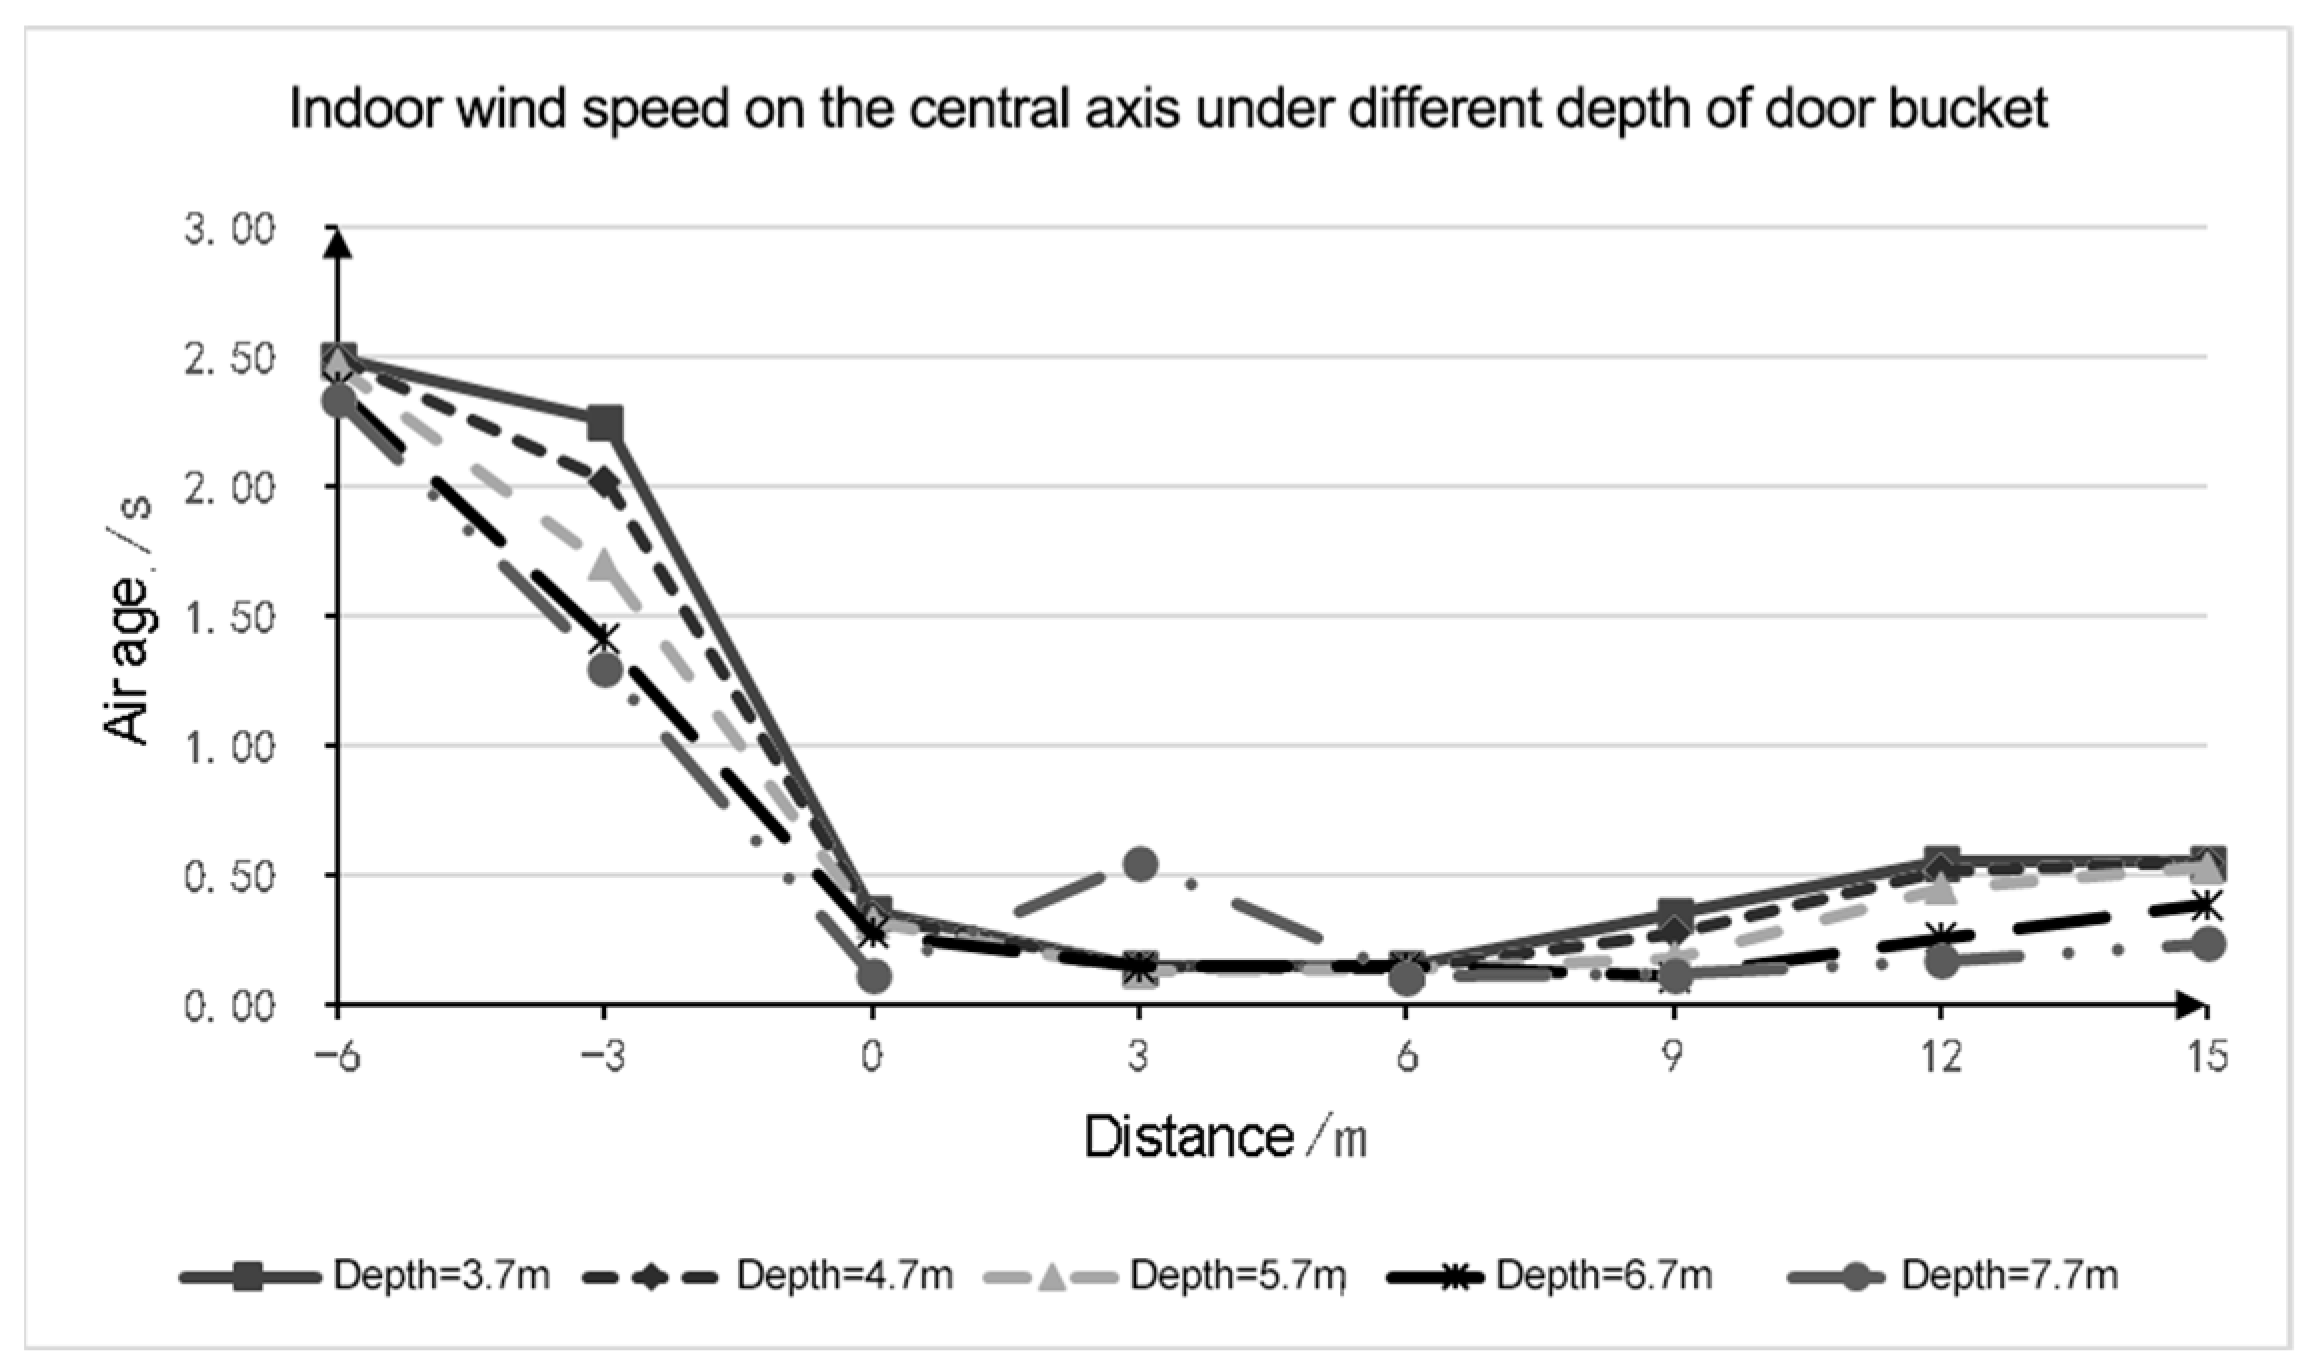
Buildings 14 00344 g016
Figure 17. Changes in wind speed on the central axis of the door bucket under different door bucket depths.
Buildings 14 00344 g017
Figure 18. Indoor wind speeds at 15 m under different door bucket depths.
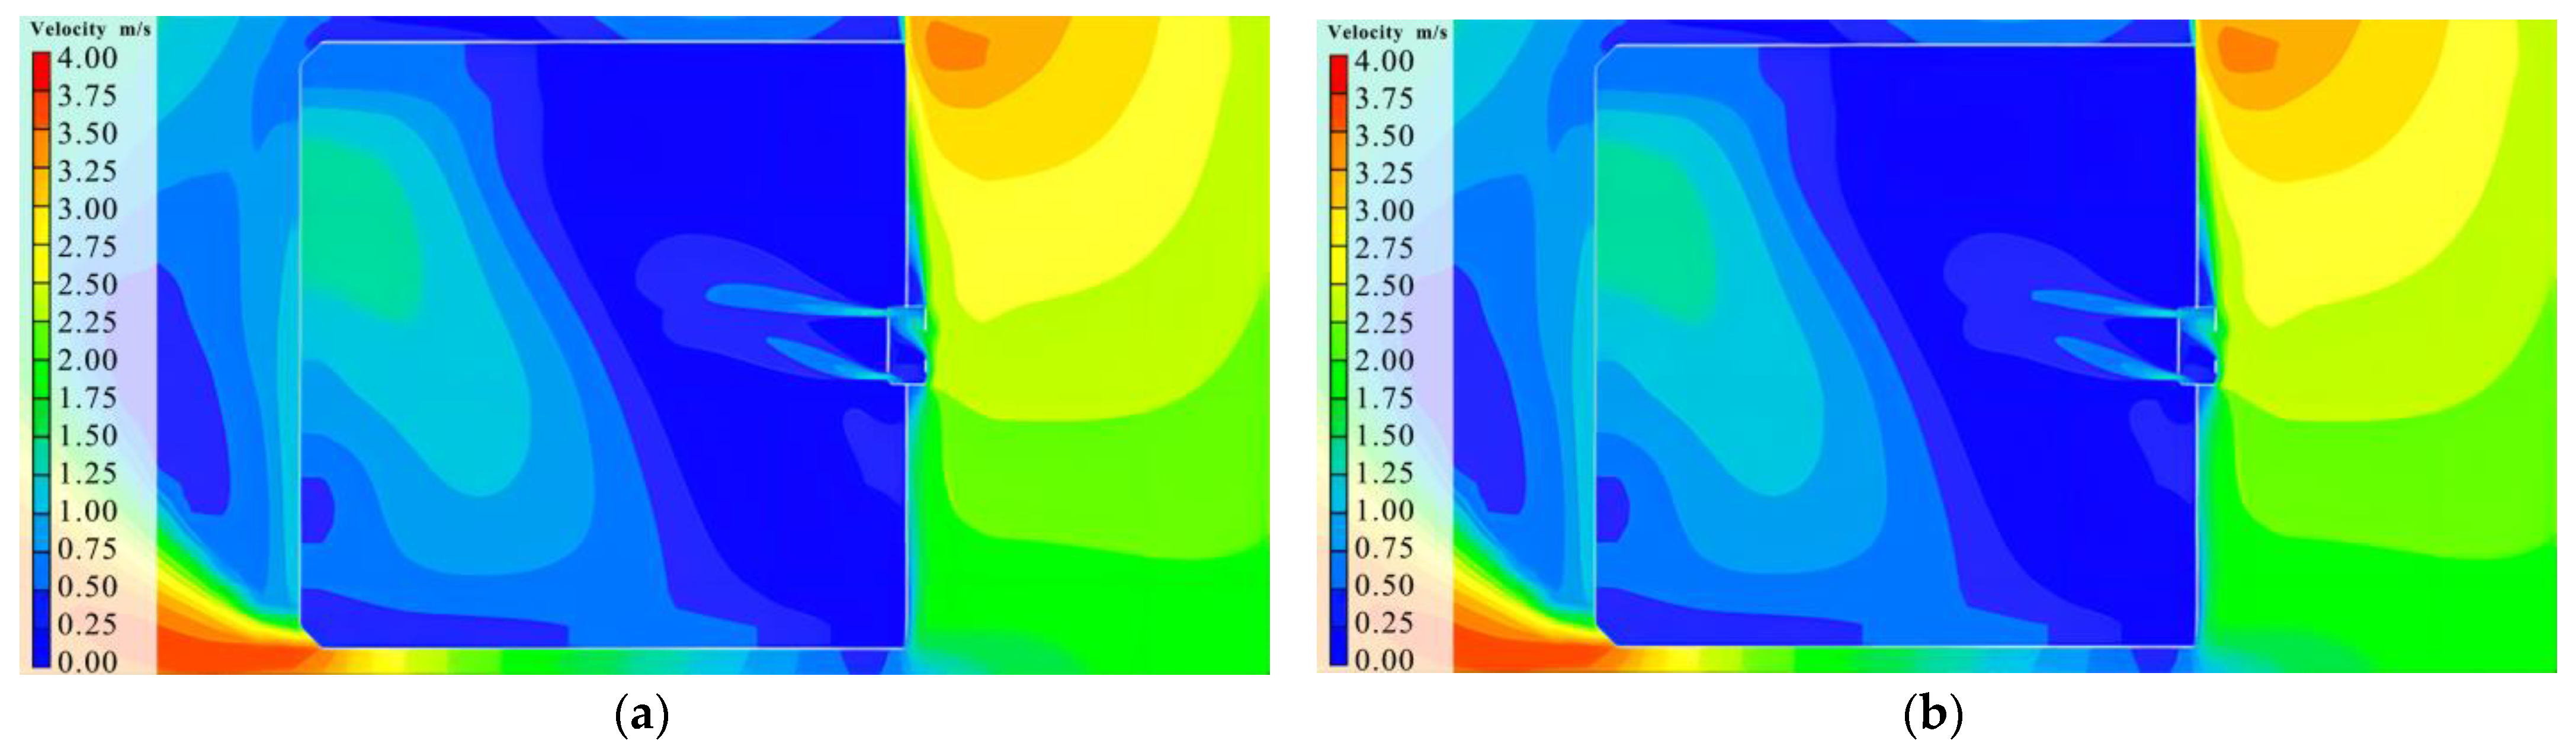
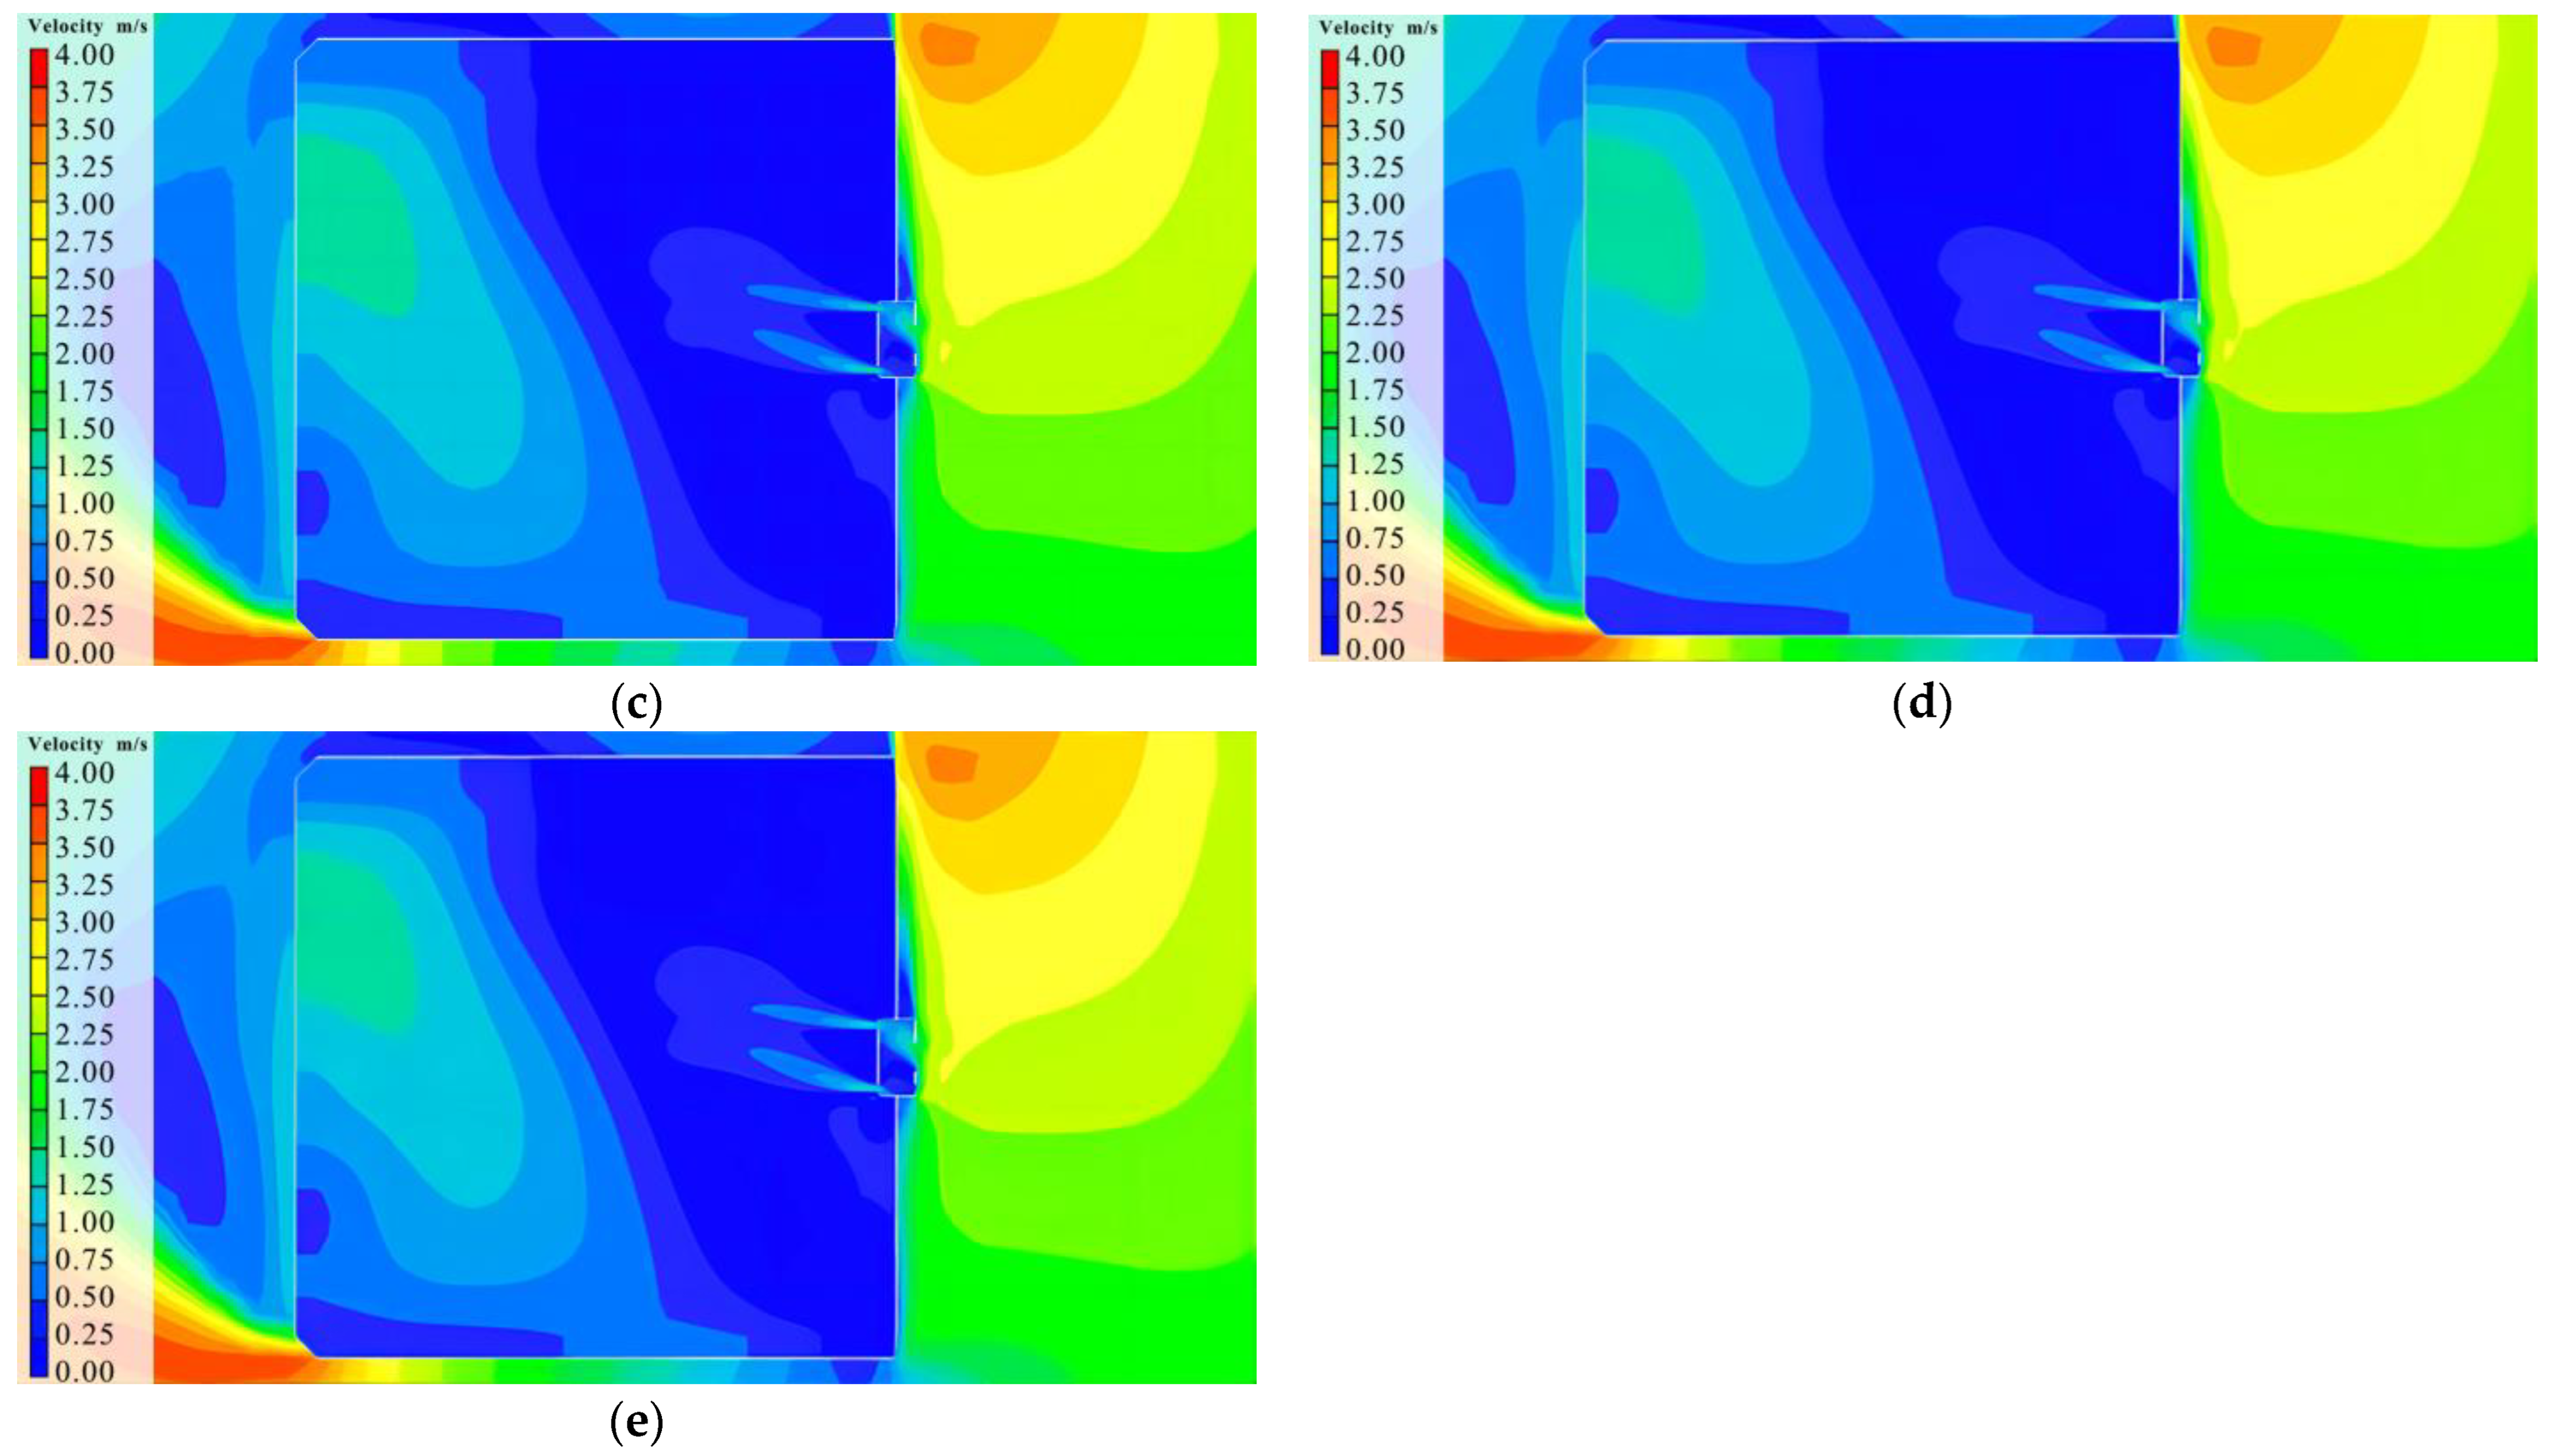
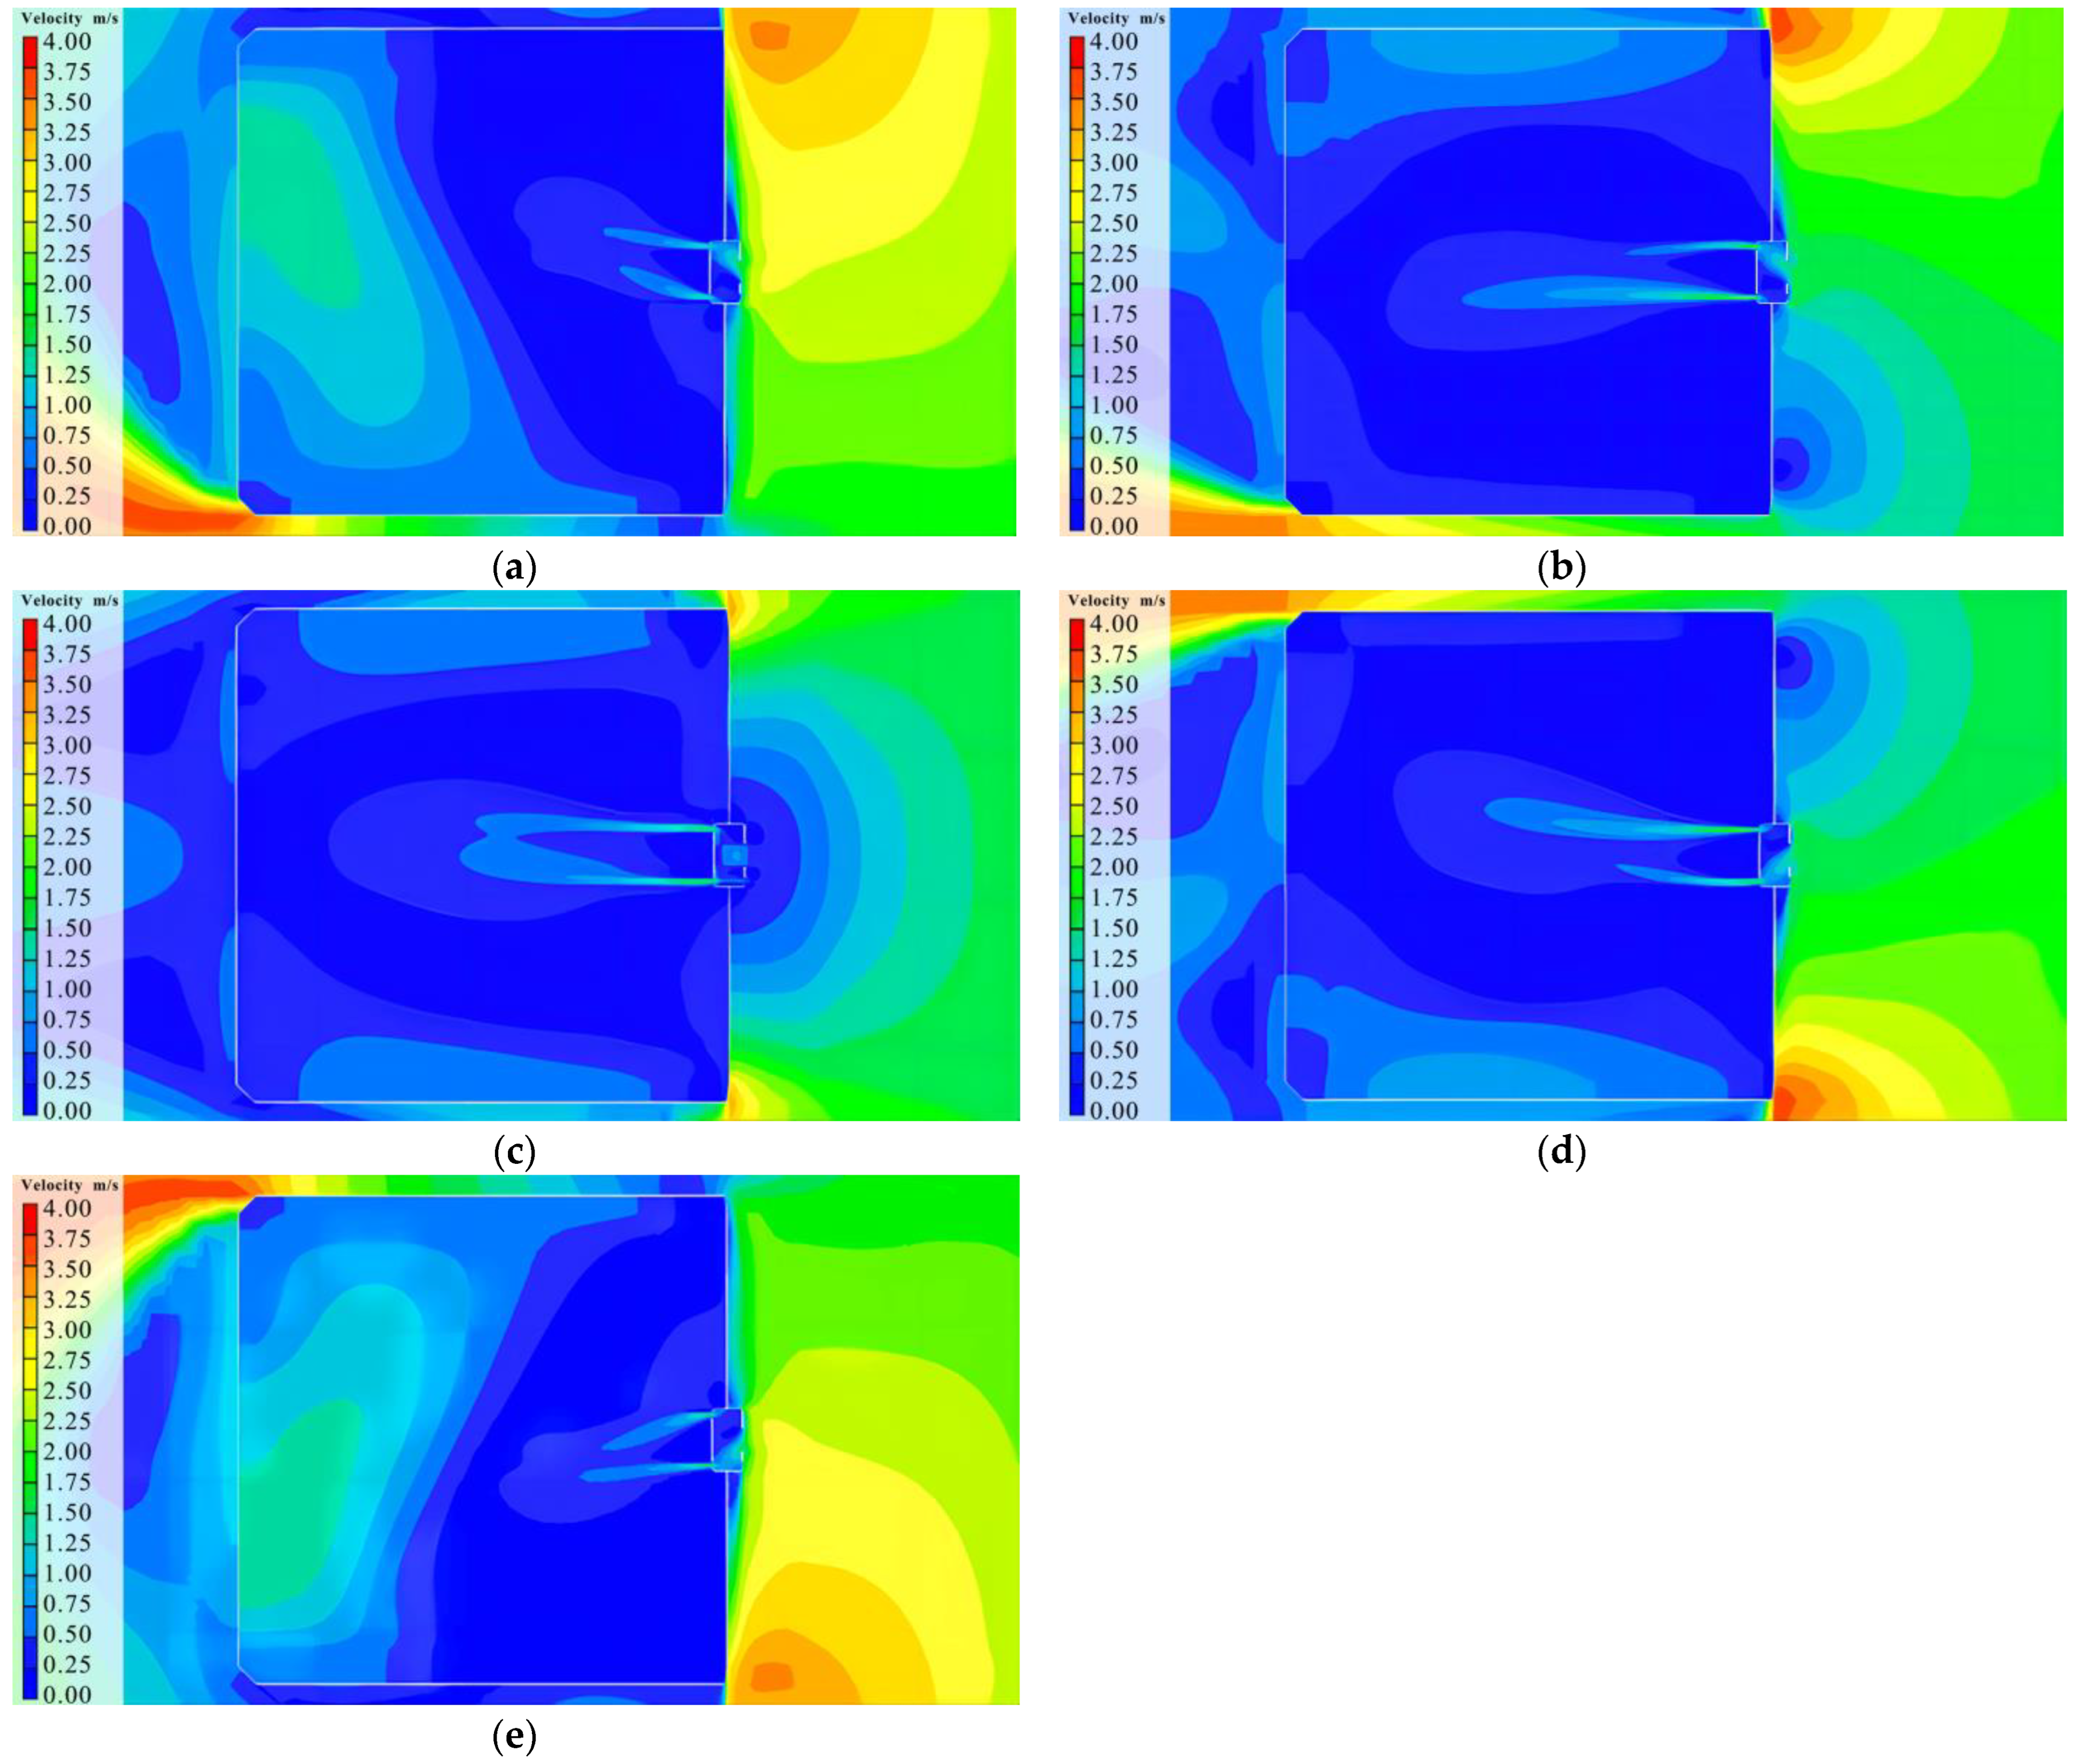
Buildings 14 00344 g018
Figure 19. Wind speed distributions at 1.5 m height under different door bucket heights. (a) Wind speed cloud diagram at a height of 1.5 m with a door bucket height of 3.8 m. (b) Wind speed cloud diagram at a height of 1.5 m with a door bucket height of 4.3 m. (c) Wind speed cloud diagram at a height of 1.5 m with a door bucket height of 4.8 m. (d) Wind speed cloud diagram at a height of 1.5 m with a door bucket height of 5.3 m. (e) Wind speed cloud diagram at a height of 1.5 m with a door bucket height of 5.8 m.
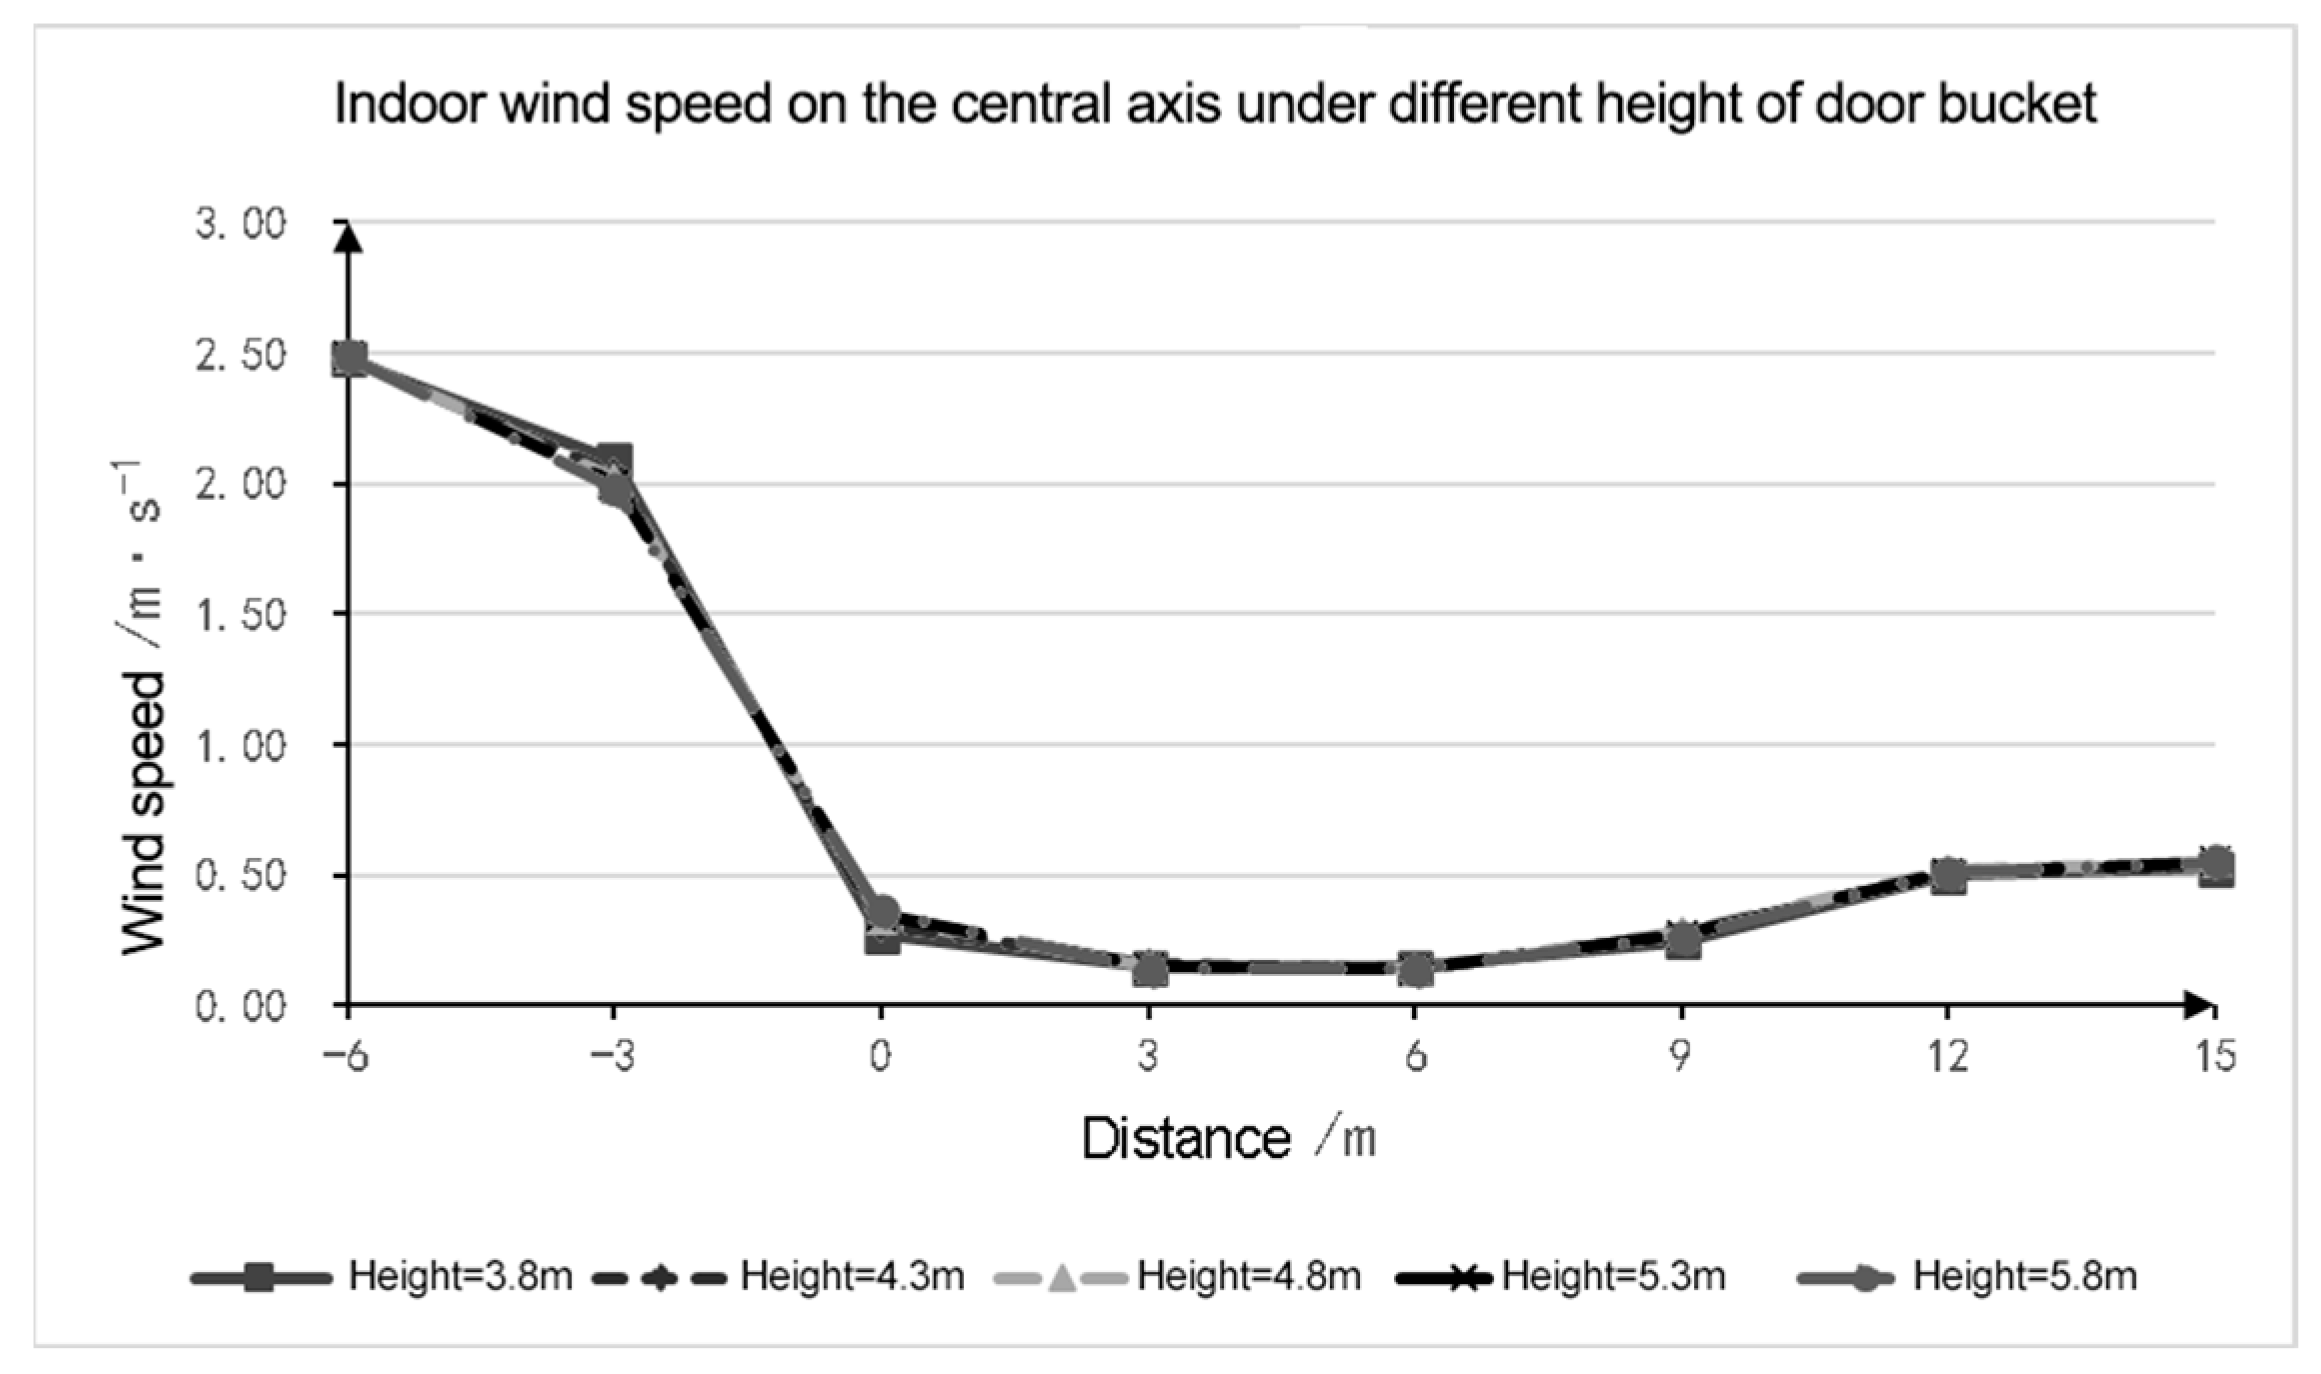
Buildings 14 00344 g019aBuildings 14 00344 g019b
Figure 20. Changes in wind speed on the central axis of the door bucket under different door bucket heights.
Buildings 14 00344 g020
Figure 21. Air age distributions at a height of 1.5 m under different door bucket widths. (a) Air age cloud diagram at a height of 1.5 m with a door bucket width of 7.3 m. (b) Air age cloud diagram at a height of 1.5 m with a door bucket width of 9.3 m. (c) Air age cloud diagram at a height of 1.5 m with a door bucket width of 11.3 m. (d) Air age cloud diagram at a height of 1.5 m with a door bucket width of 13.3 m.
Buildings 14 00344 g021
Figure 22. Changes in air age on the central axis of the door bucket under different door bucket widths.
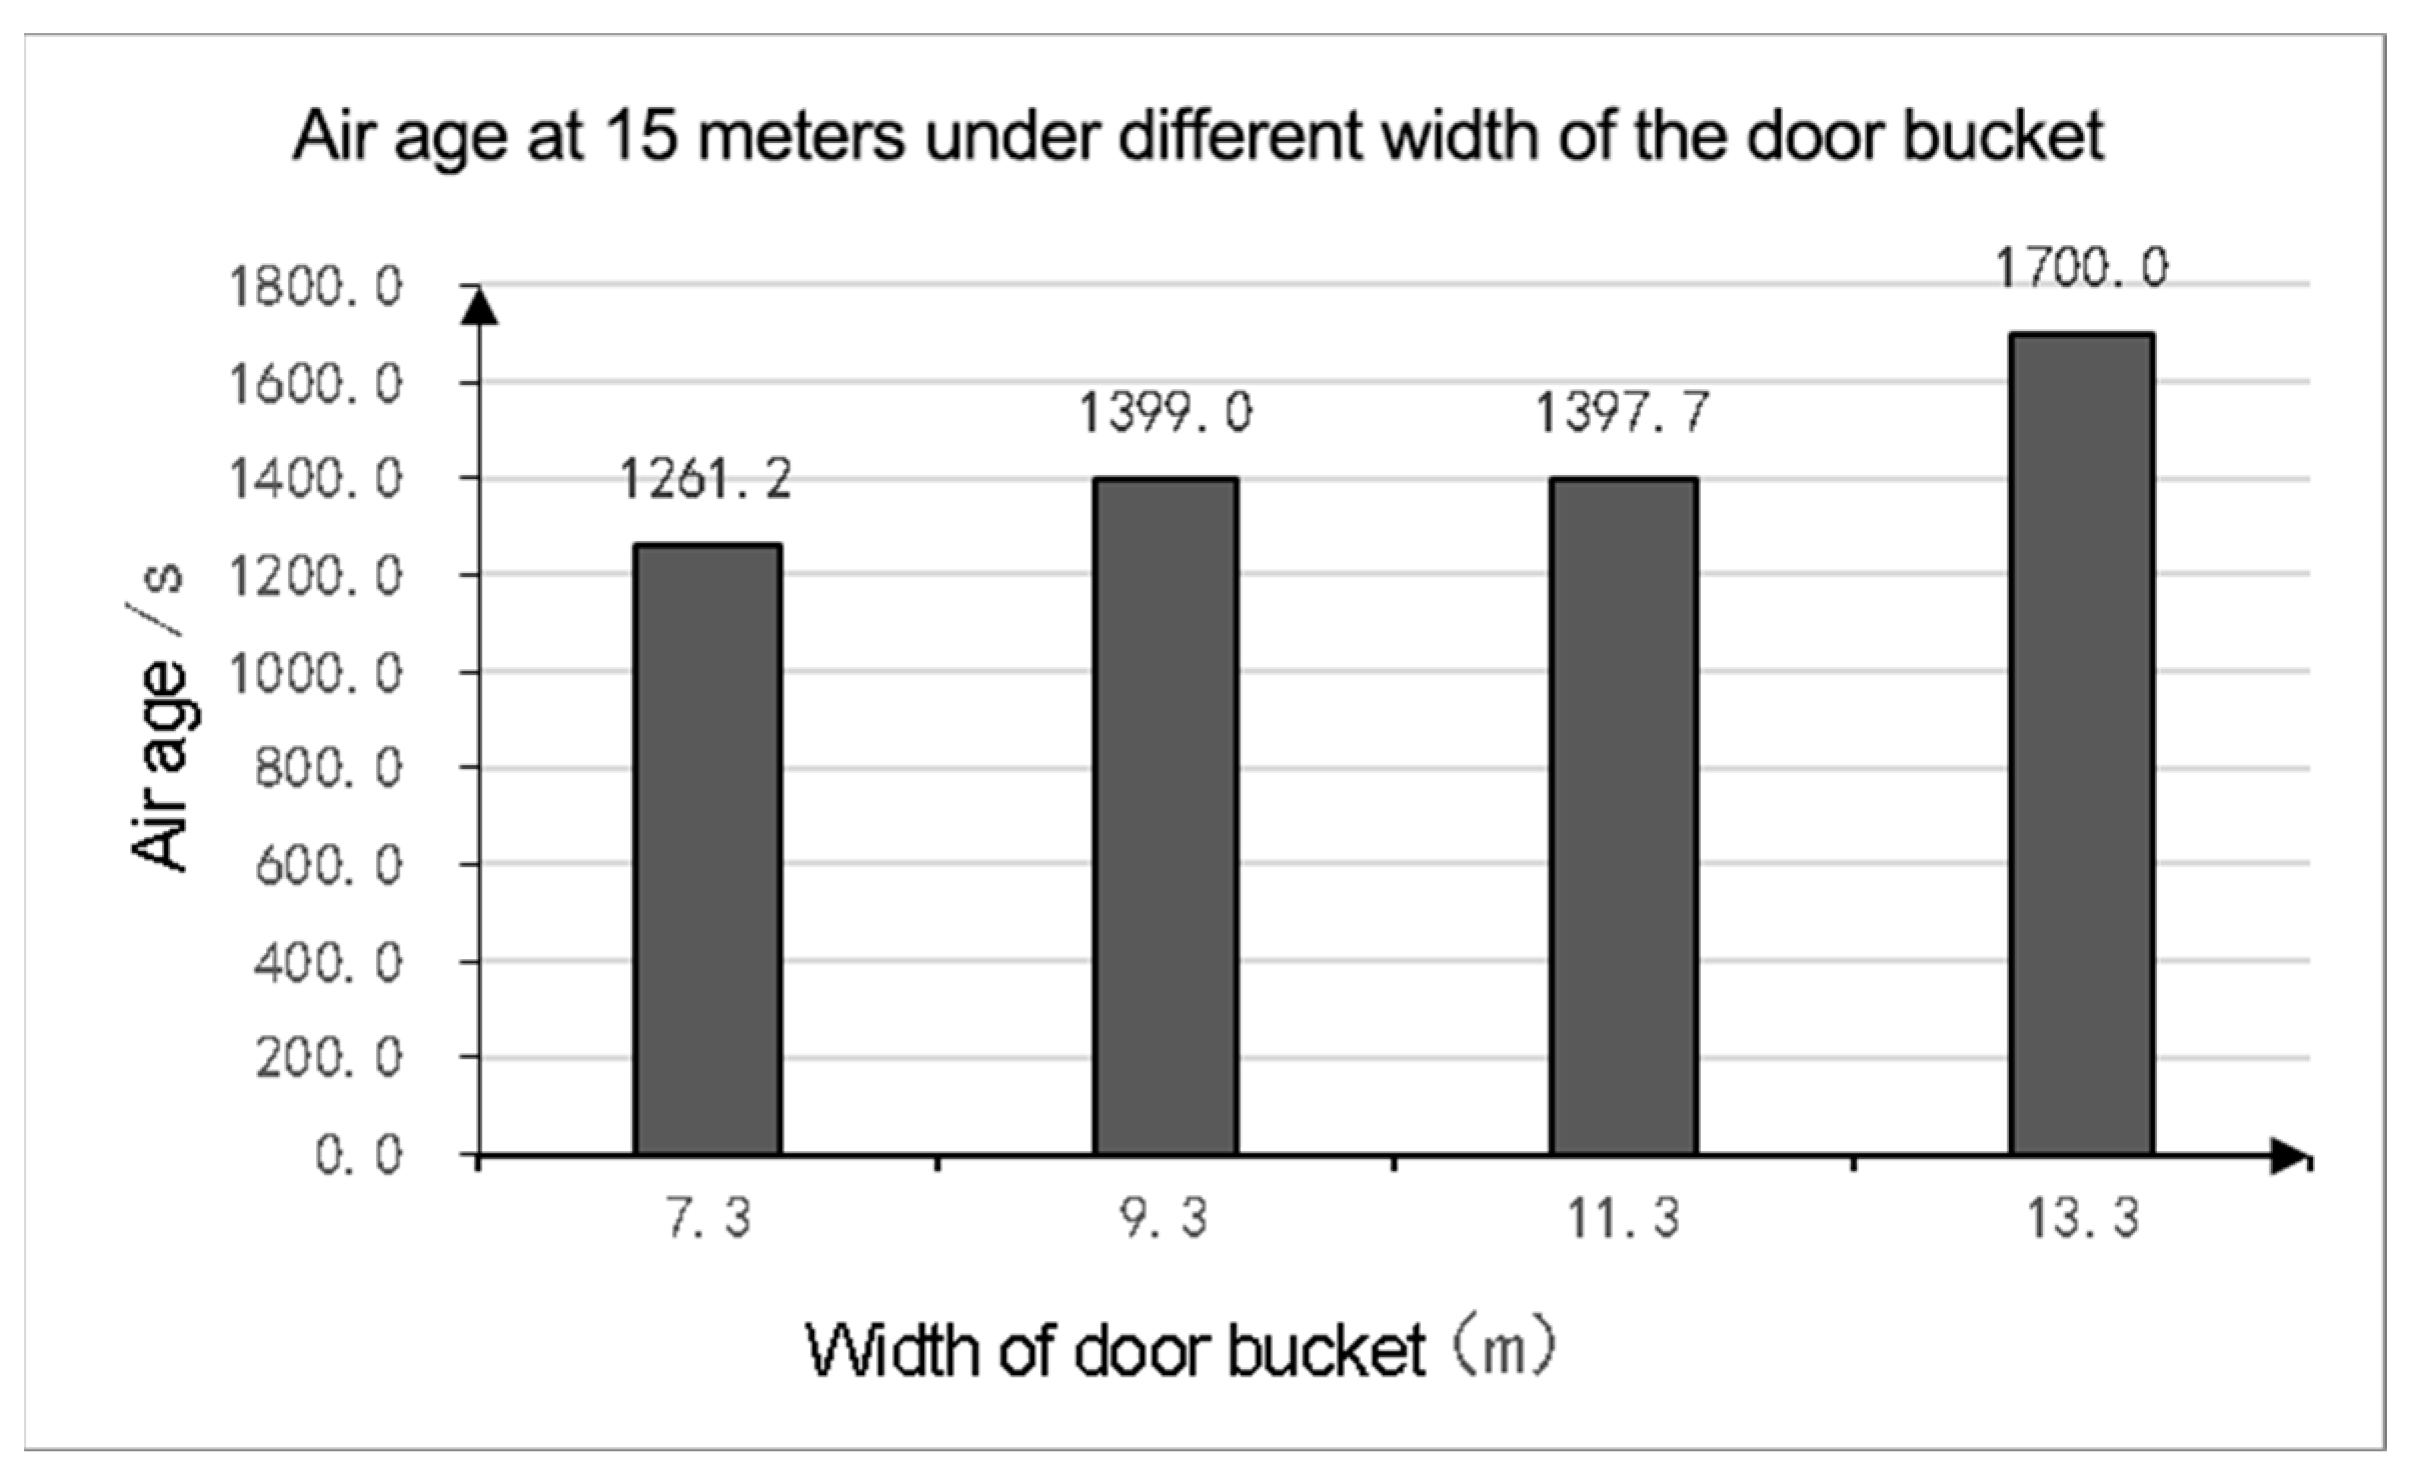
Buildings 14 00344 g022
Figure 23. Indoor air ages at 15 m under different door bucket width.
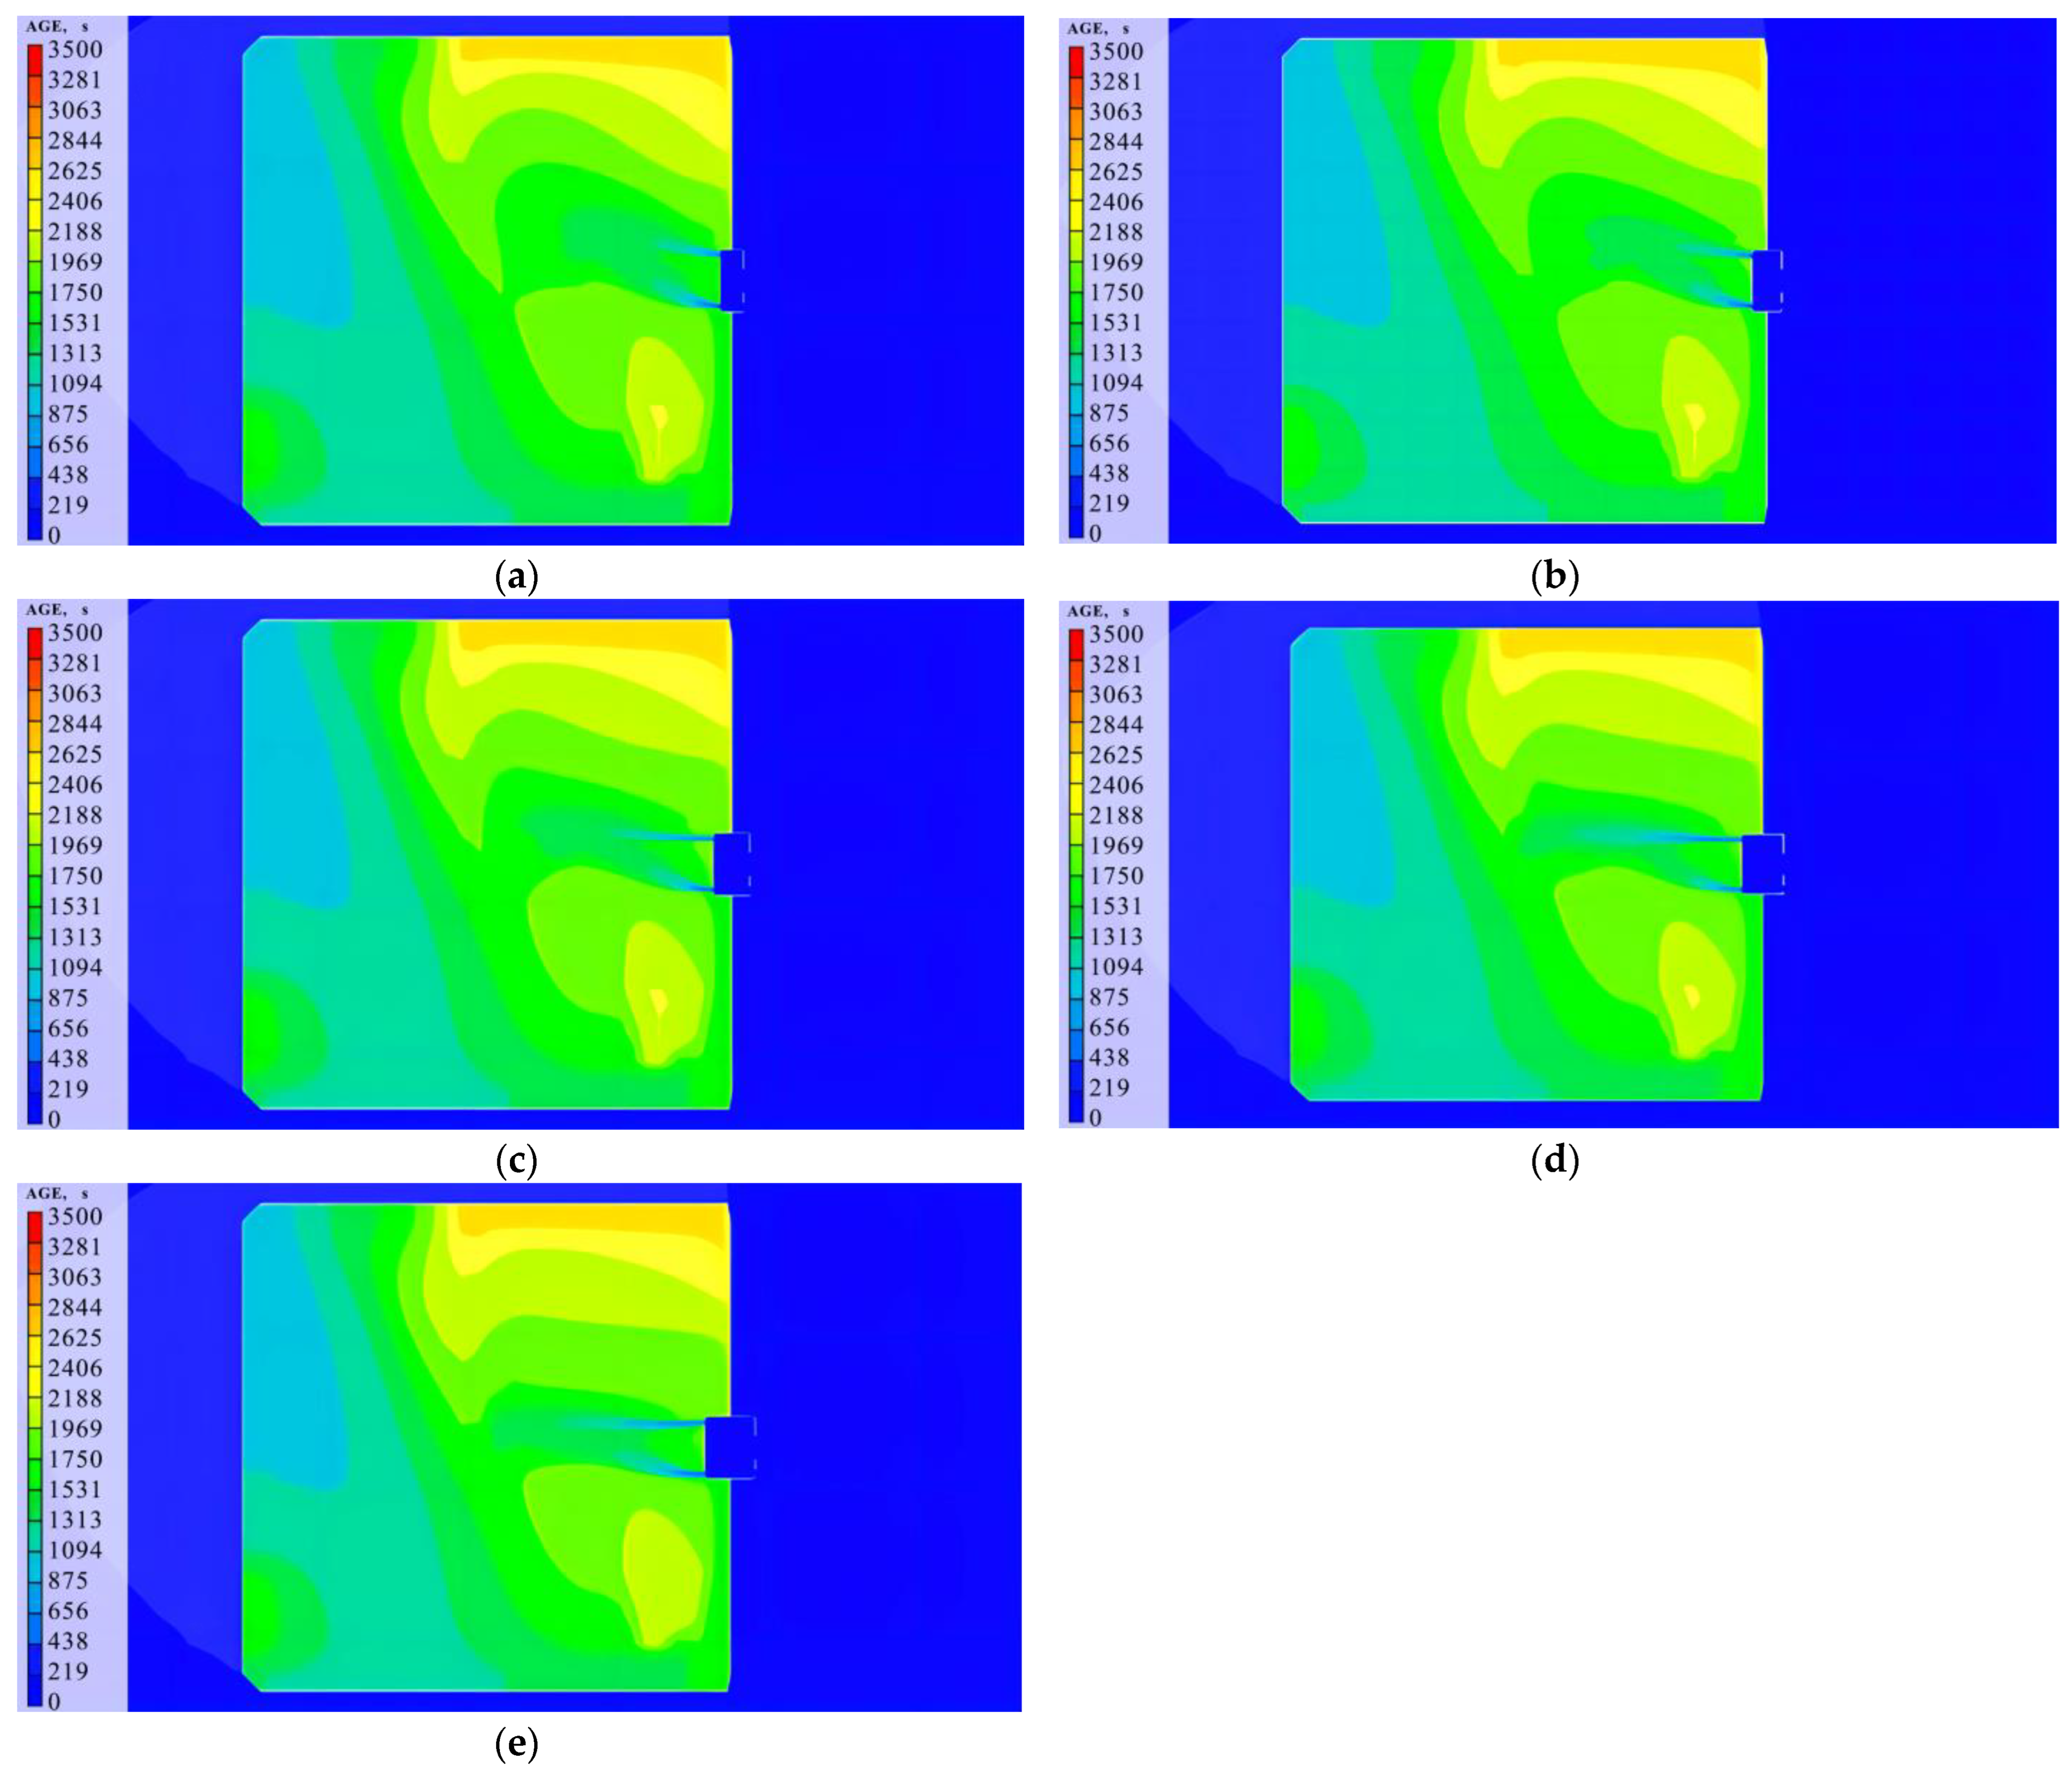
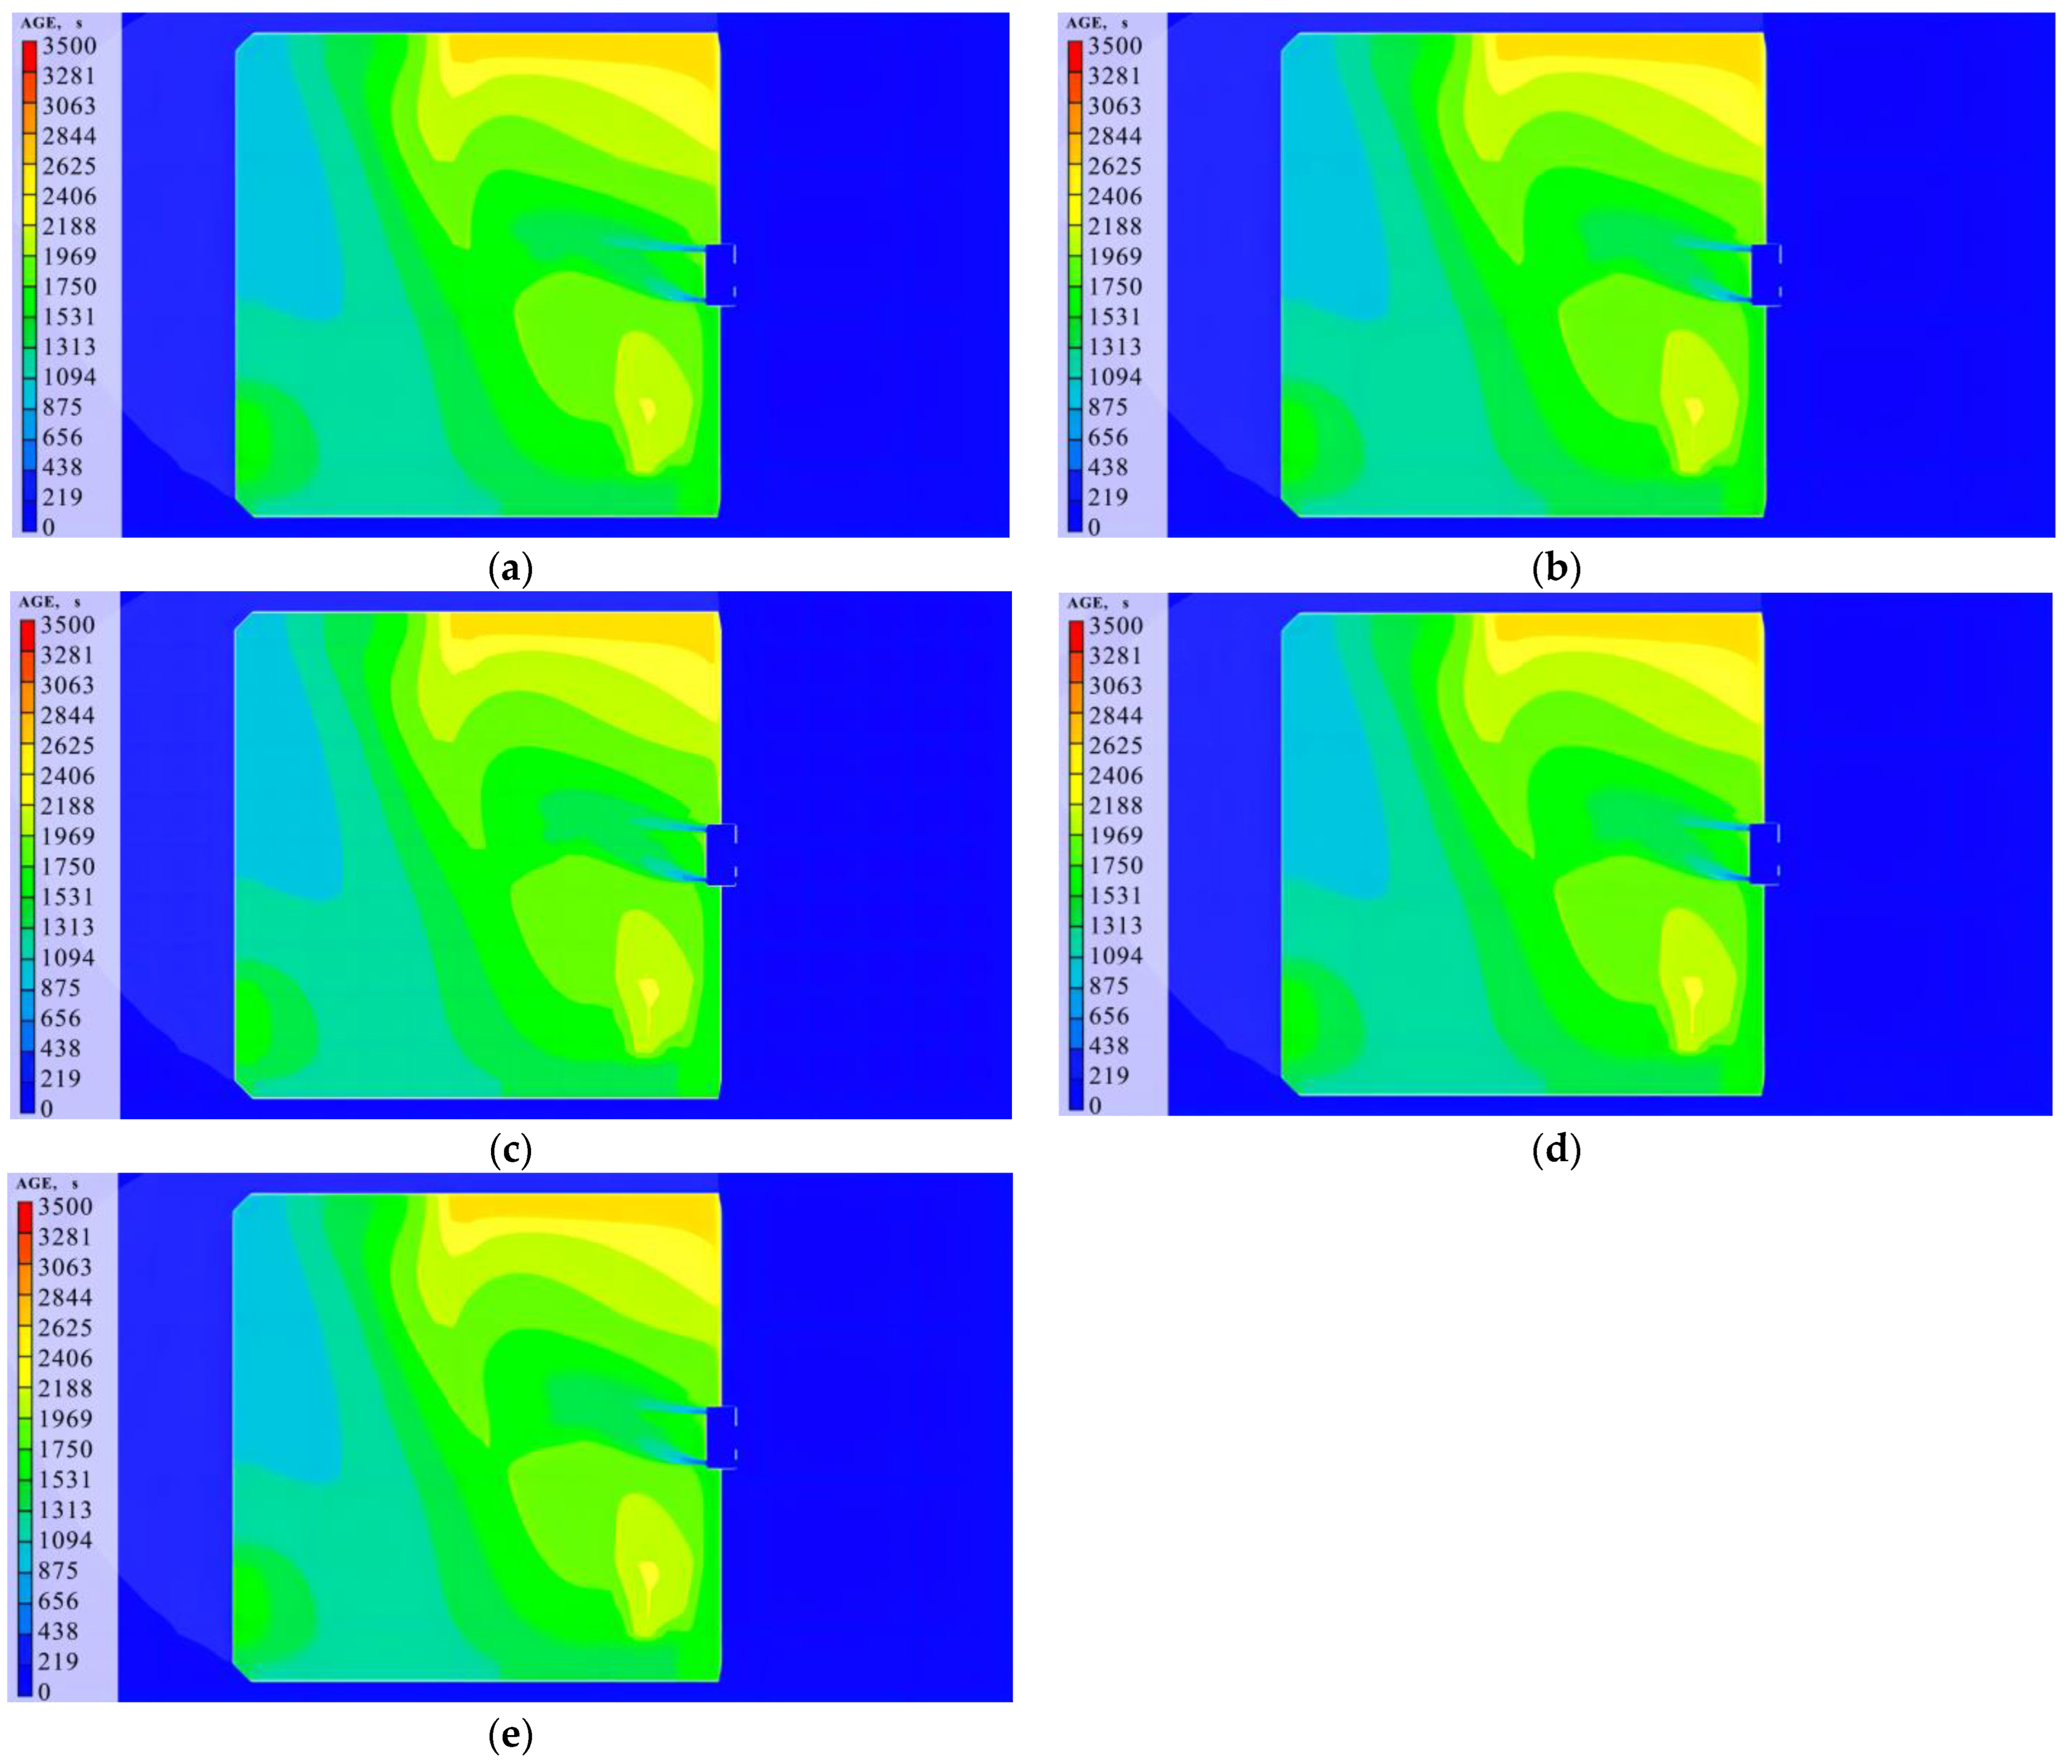
Buildings 14 00344 g023
Figure 24. Air age distribution at 1.5 m height under different door bucket depths. (a) Air age cloud diagram at a height of 1.5 m with a door bucket depth of 3.7 m. (b) Air age cloud diagram at a height of 1.5 m with a door bucket depth of 4.7 m. (c) Air age cloud diagram at a height of 1.5 m with a door bucket depth of 5.7 m. (d) Air age cloud diagram at a height of 1.5 m with a door bucket depth of 6.7 m. (e) Air age cloud diagram at a height of 1.5 m with a door bucket depth of 7.7 m.
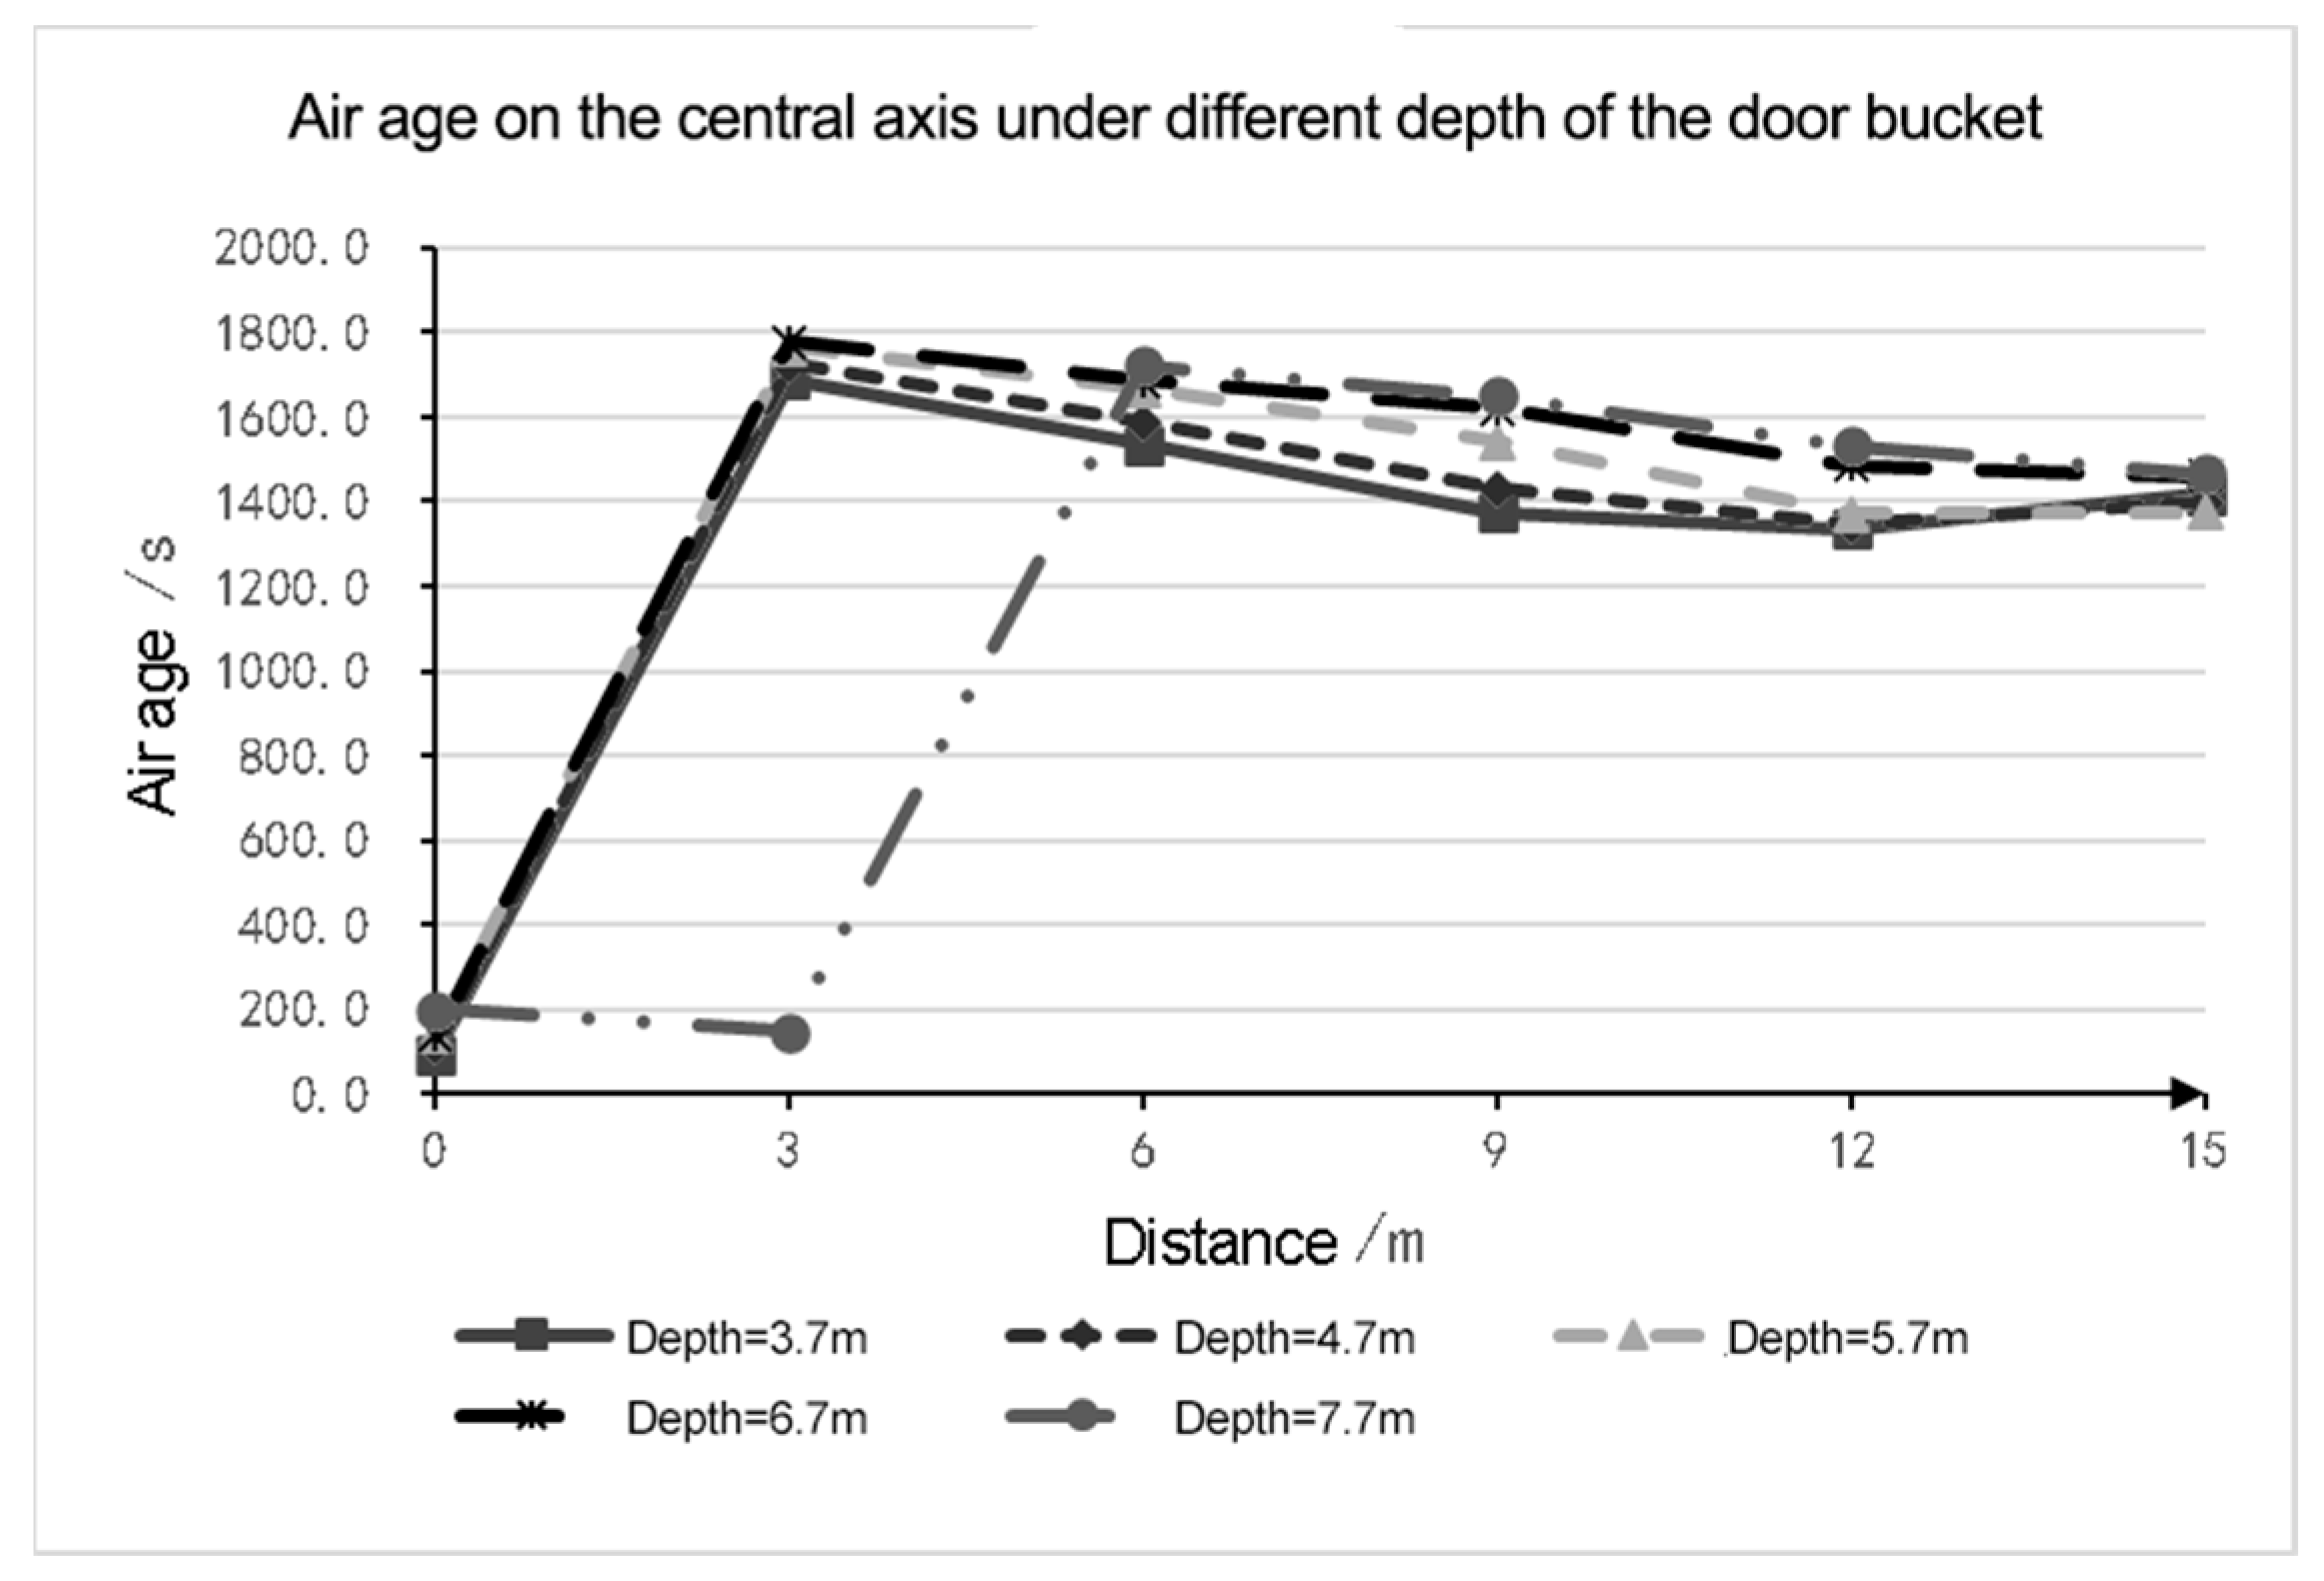
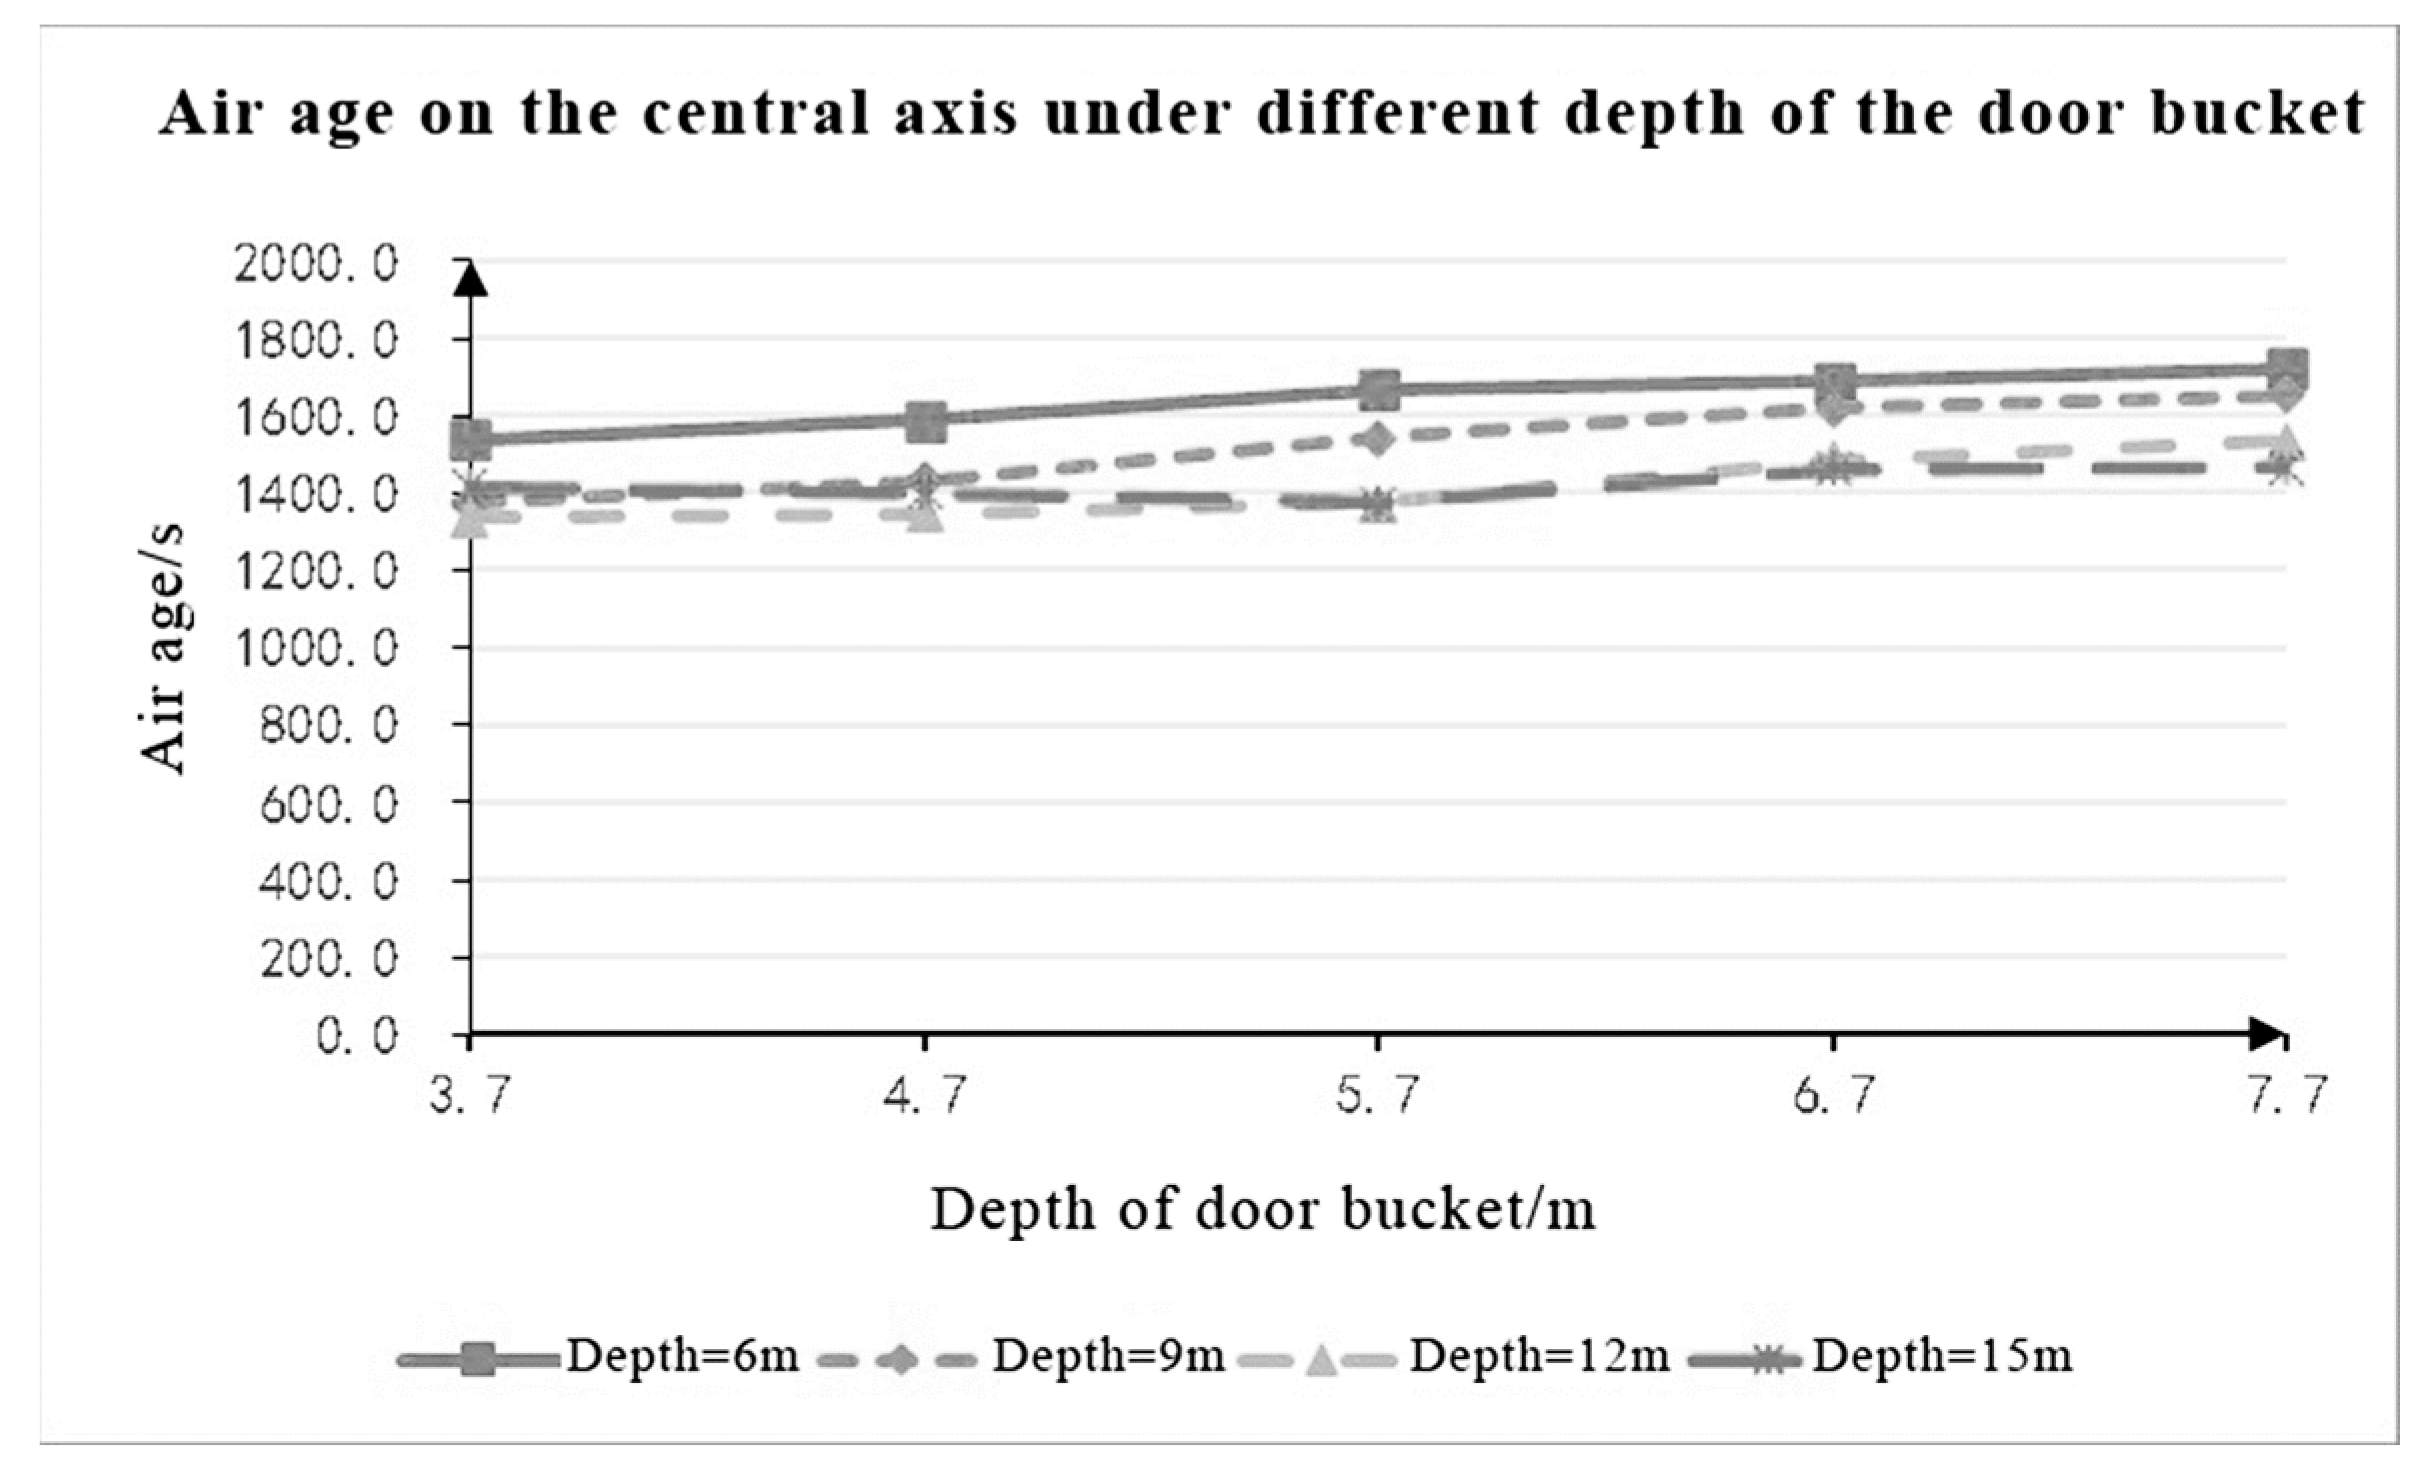
Buildings 14 00344 g024
Figure 25. Changes in air age on the central axis of the door bucket under different door bucket depth conditions.
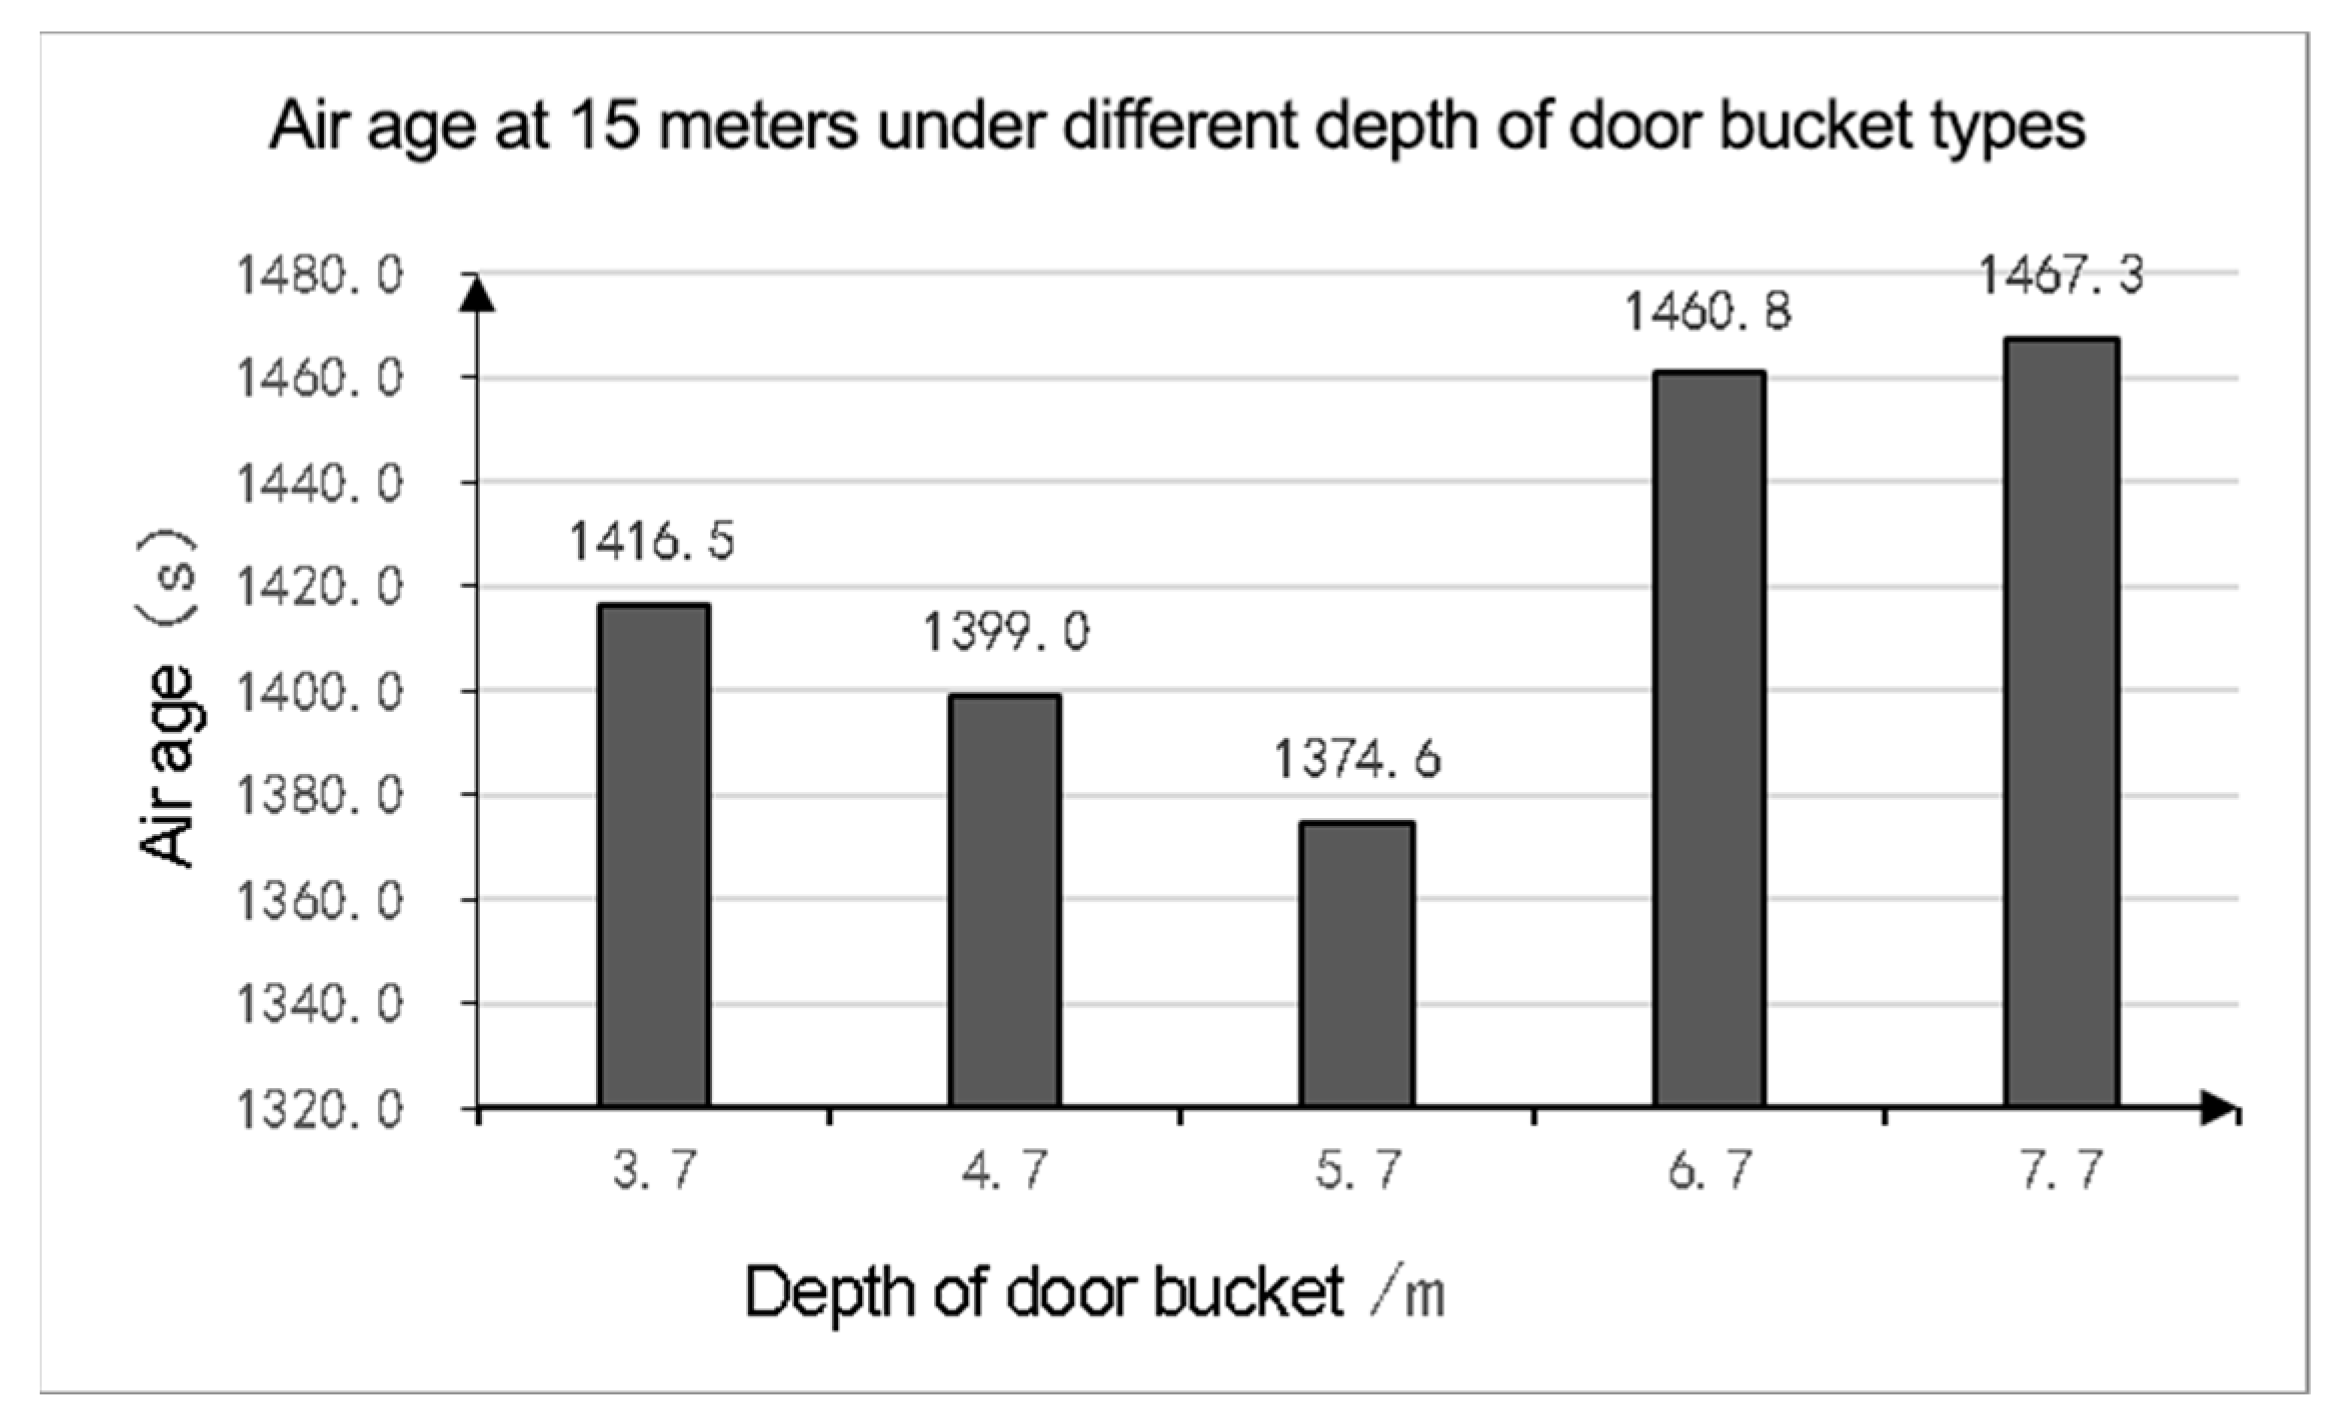
Buildings 14 00344 g025
Figure 26. Air ages at 15 m indoors under different door bucket depths.
Buildings 14 00344 g026
Figure 27. Changes in air age at different distances on the central axis of the door bucket.
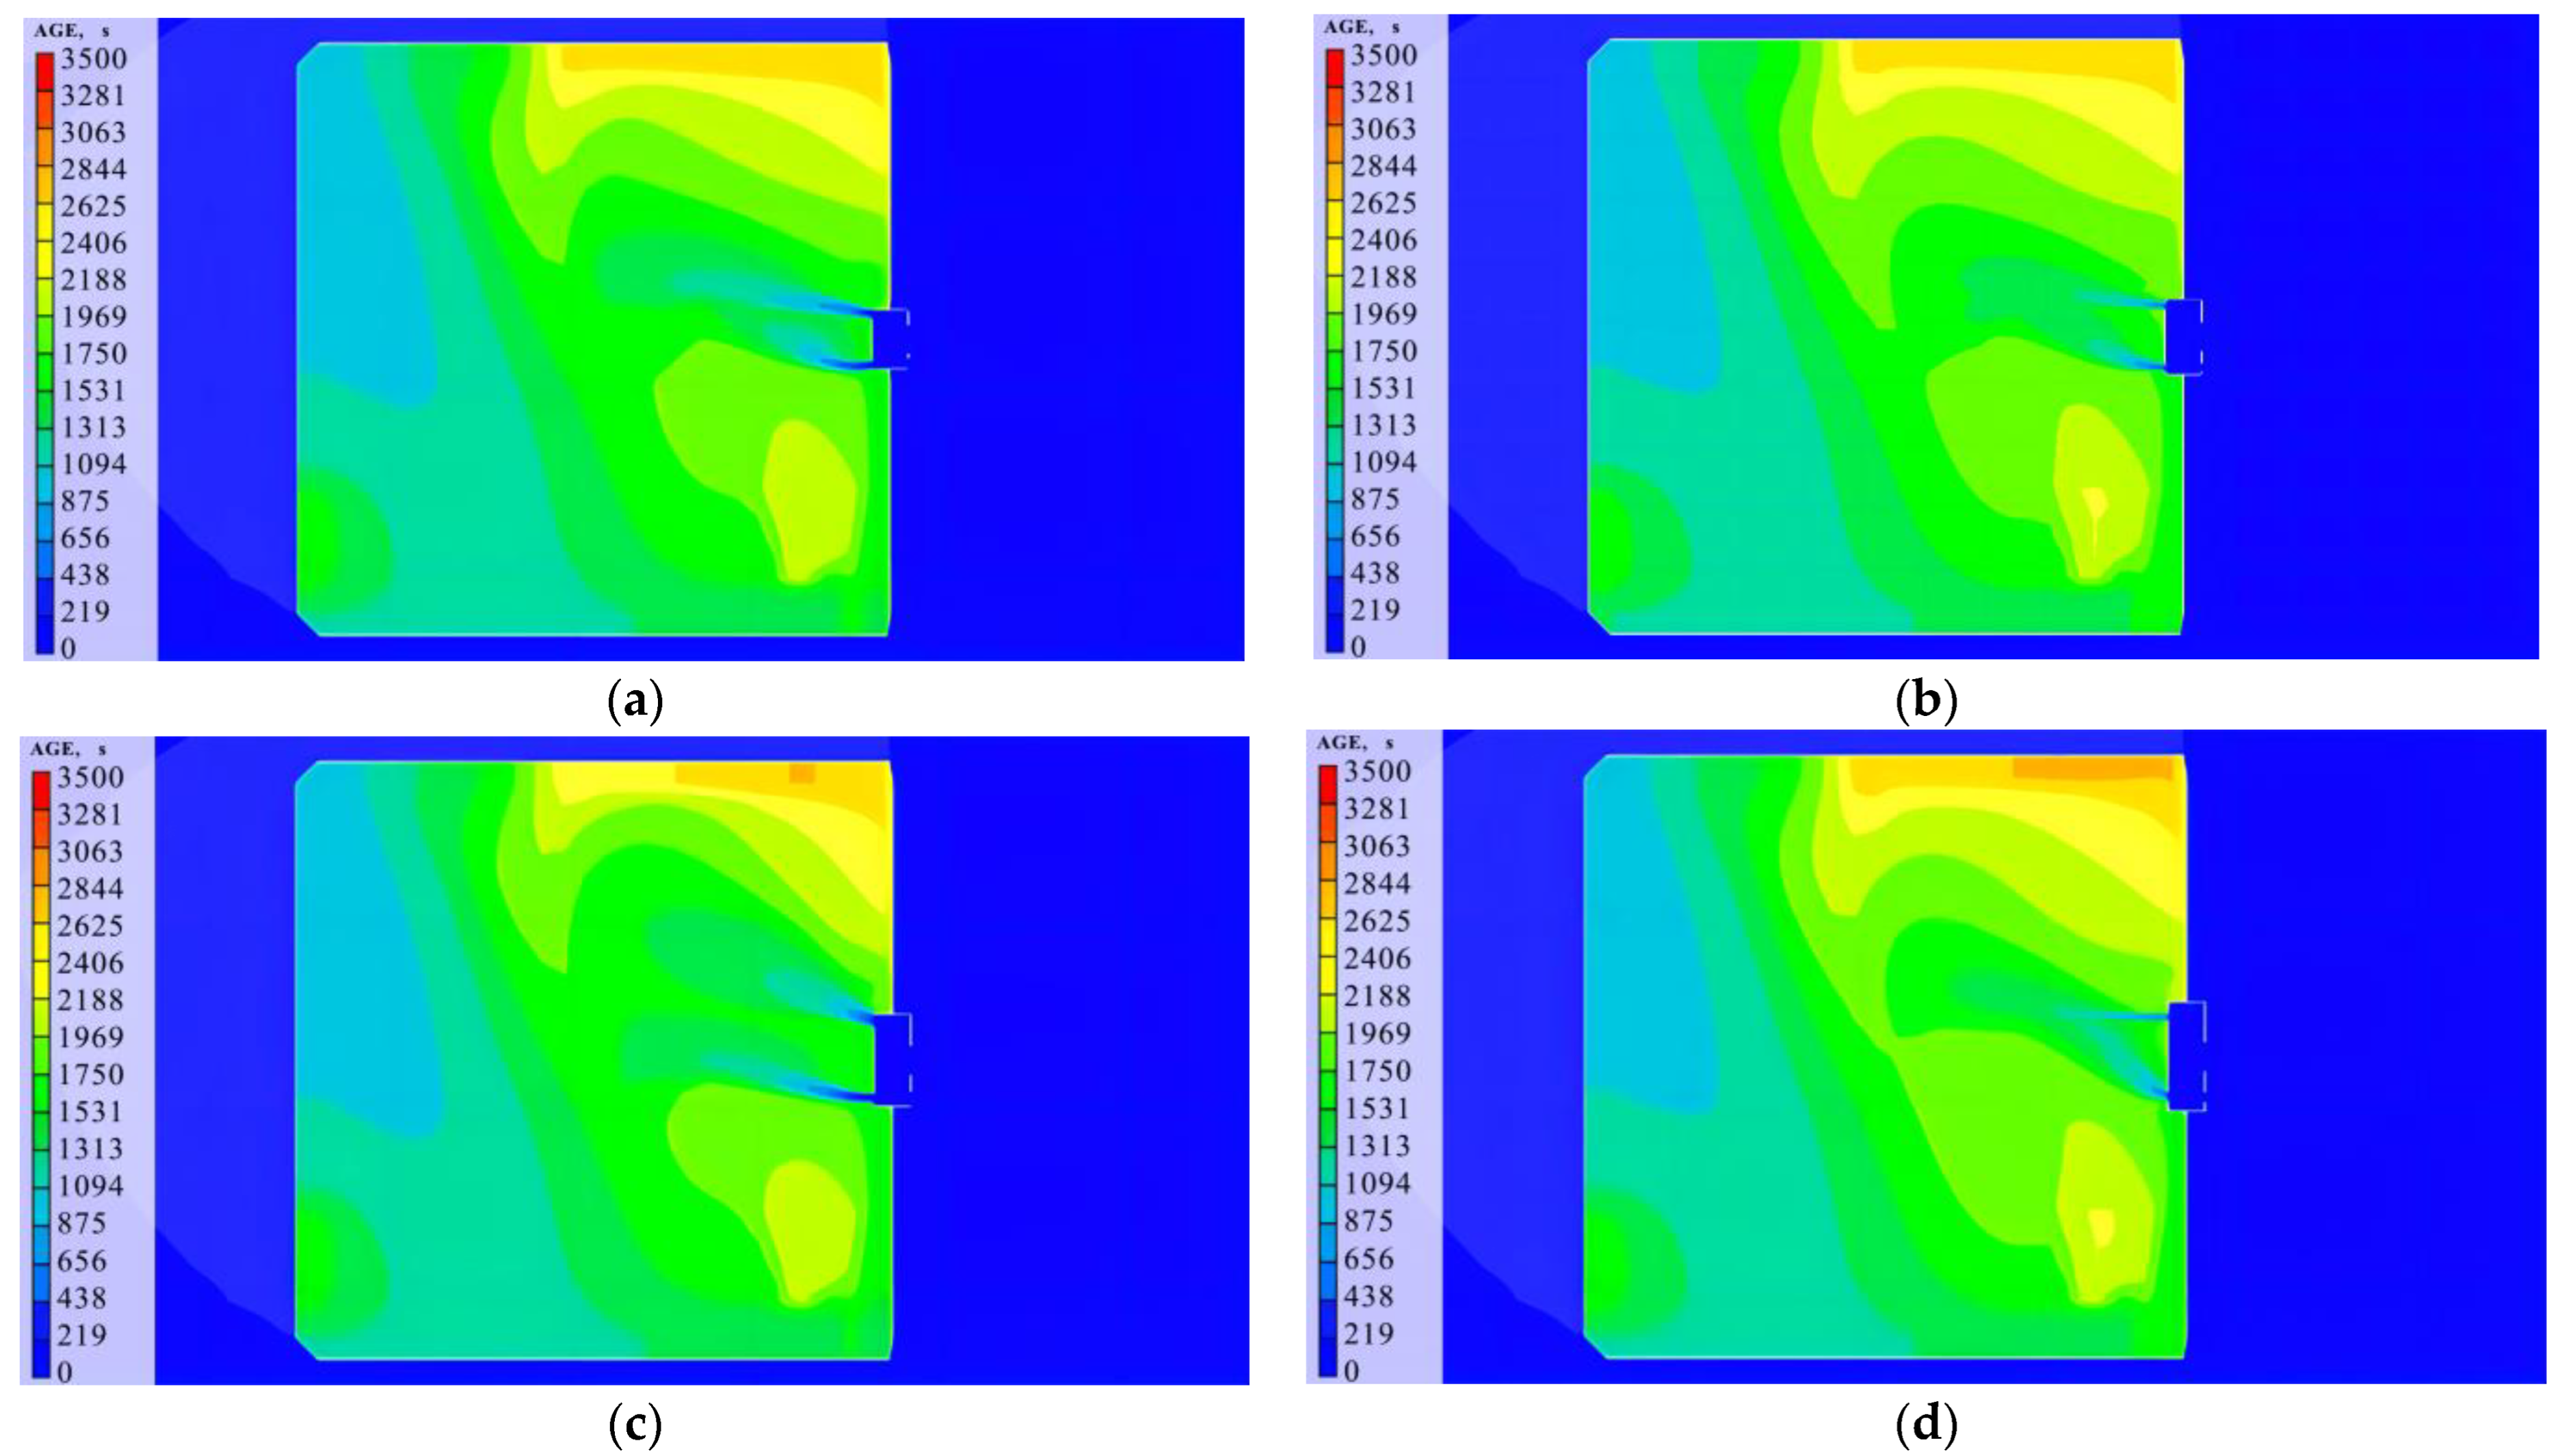
Buildings 14 00344 g027
Figure 28. Air age distribution at 1.5 m height under different door bucket heights. (a) Air age cloud diagram at a height of 1.5 m with a door bucket height of 3.8 m. (b) Air age cloud diagram at a height of 1.5 m with a door bucket height of 4.3 m. (c) Air age cloud diagram at a height of 1.5 m with a door bucket height of 4.8 m. (d) Air age cloud diagram at a height of 1.5 m with a door bucket height of 5.3 m. (e) Air age cloud diagram at a height of 1.5 m with a door bucket height of 5.8 m.
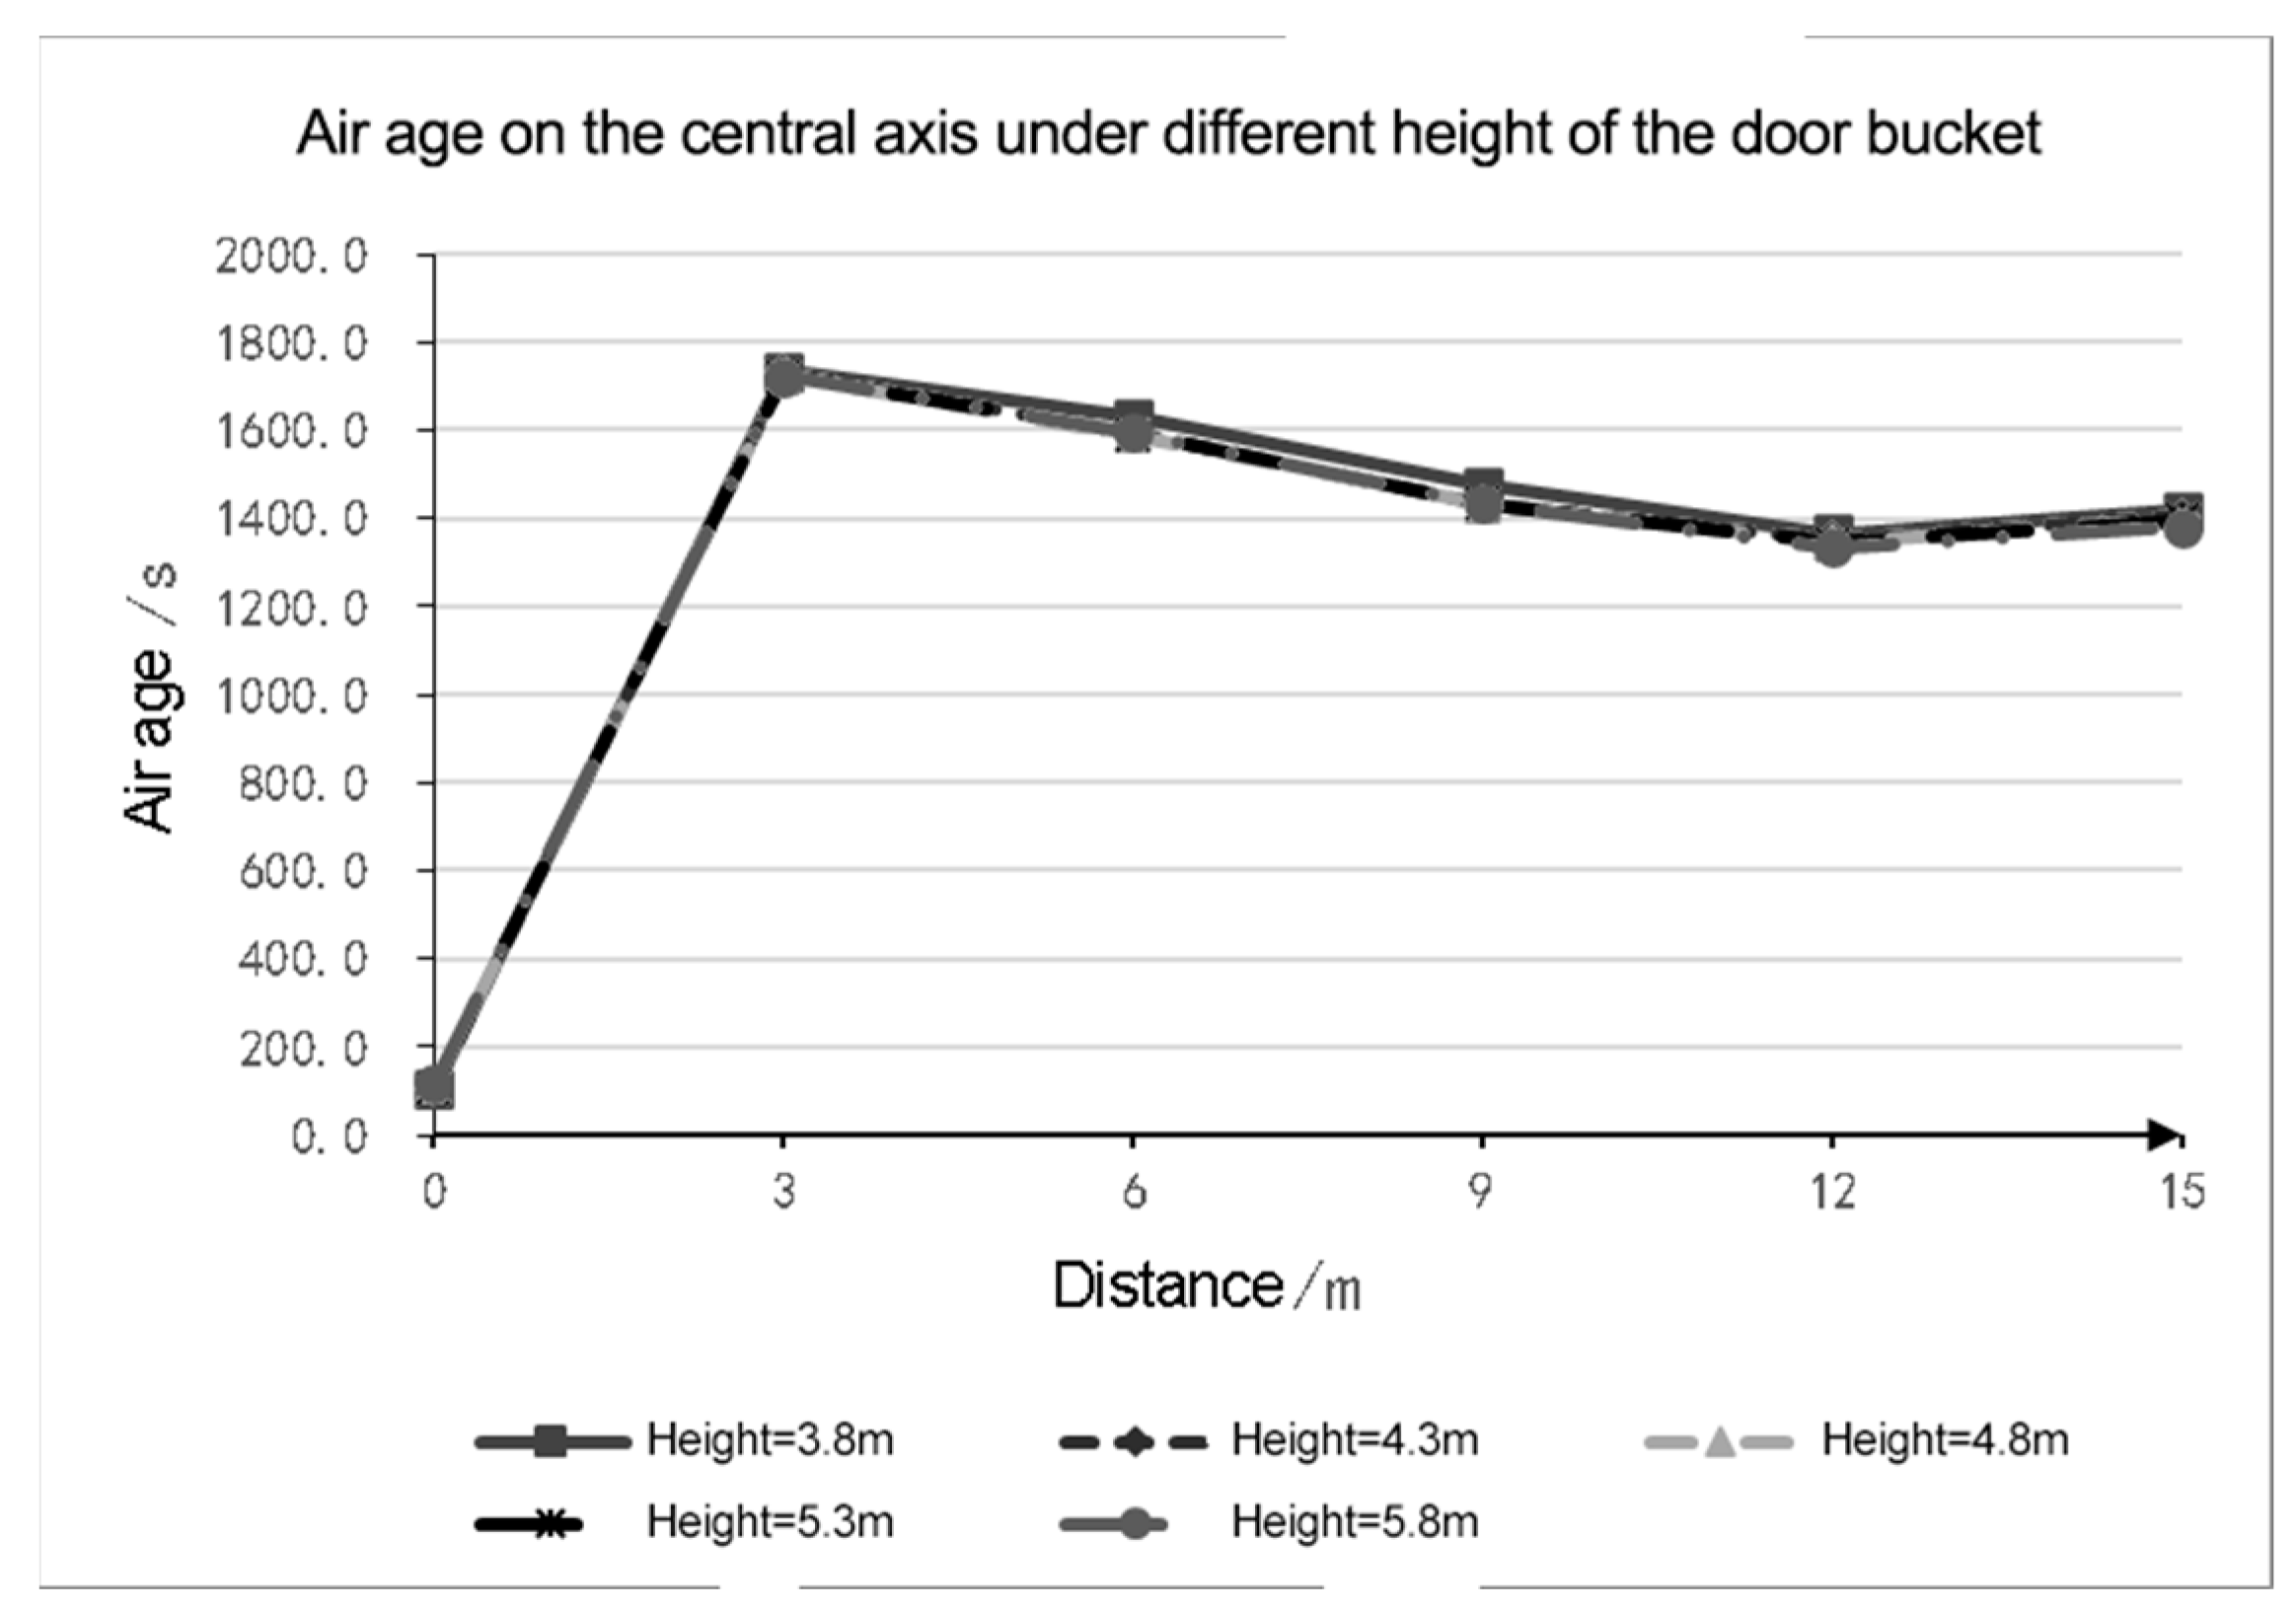
Buildings 14 00344 g028
Figure 29. Changes in air age on the central axis of the door bucket under different door bucket heights.
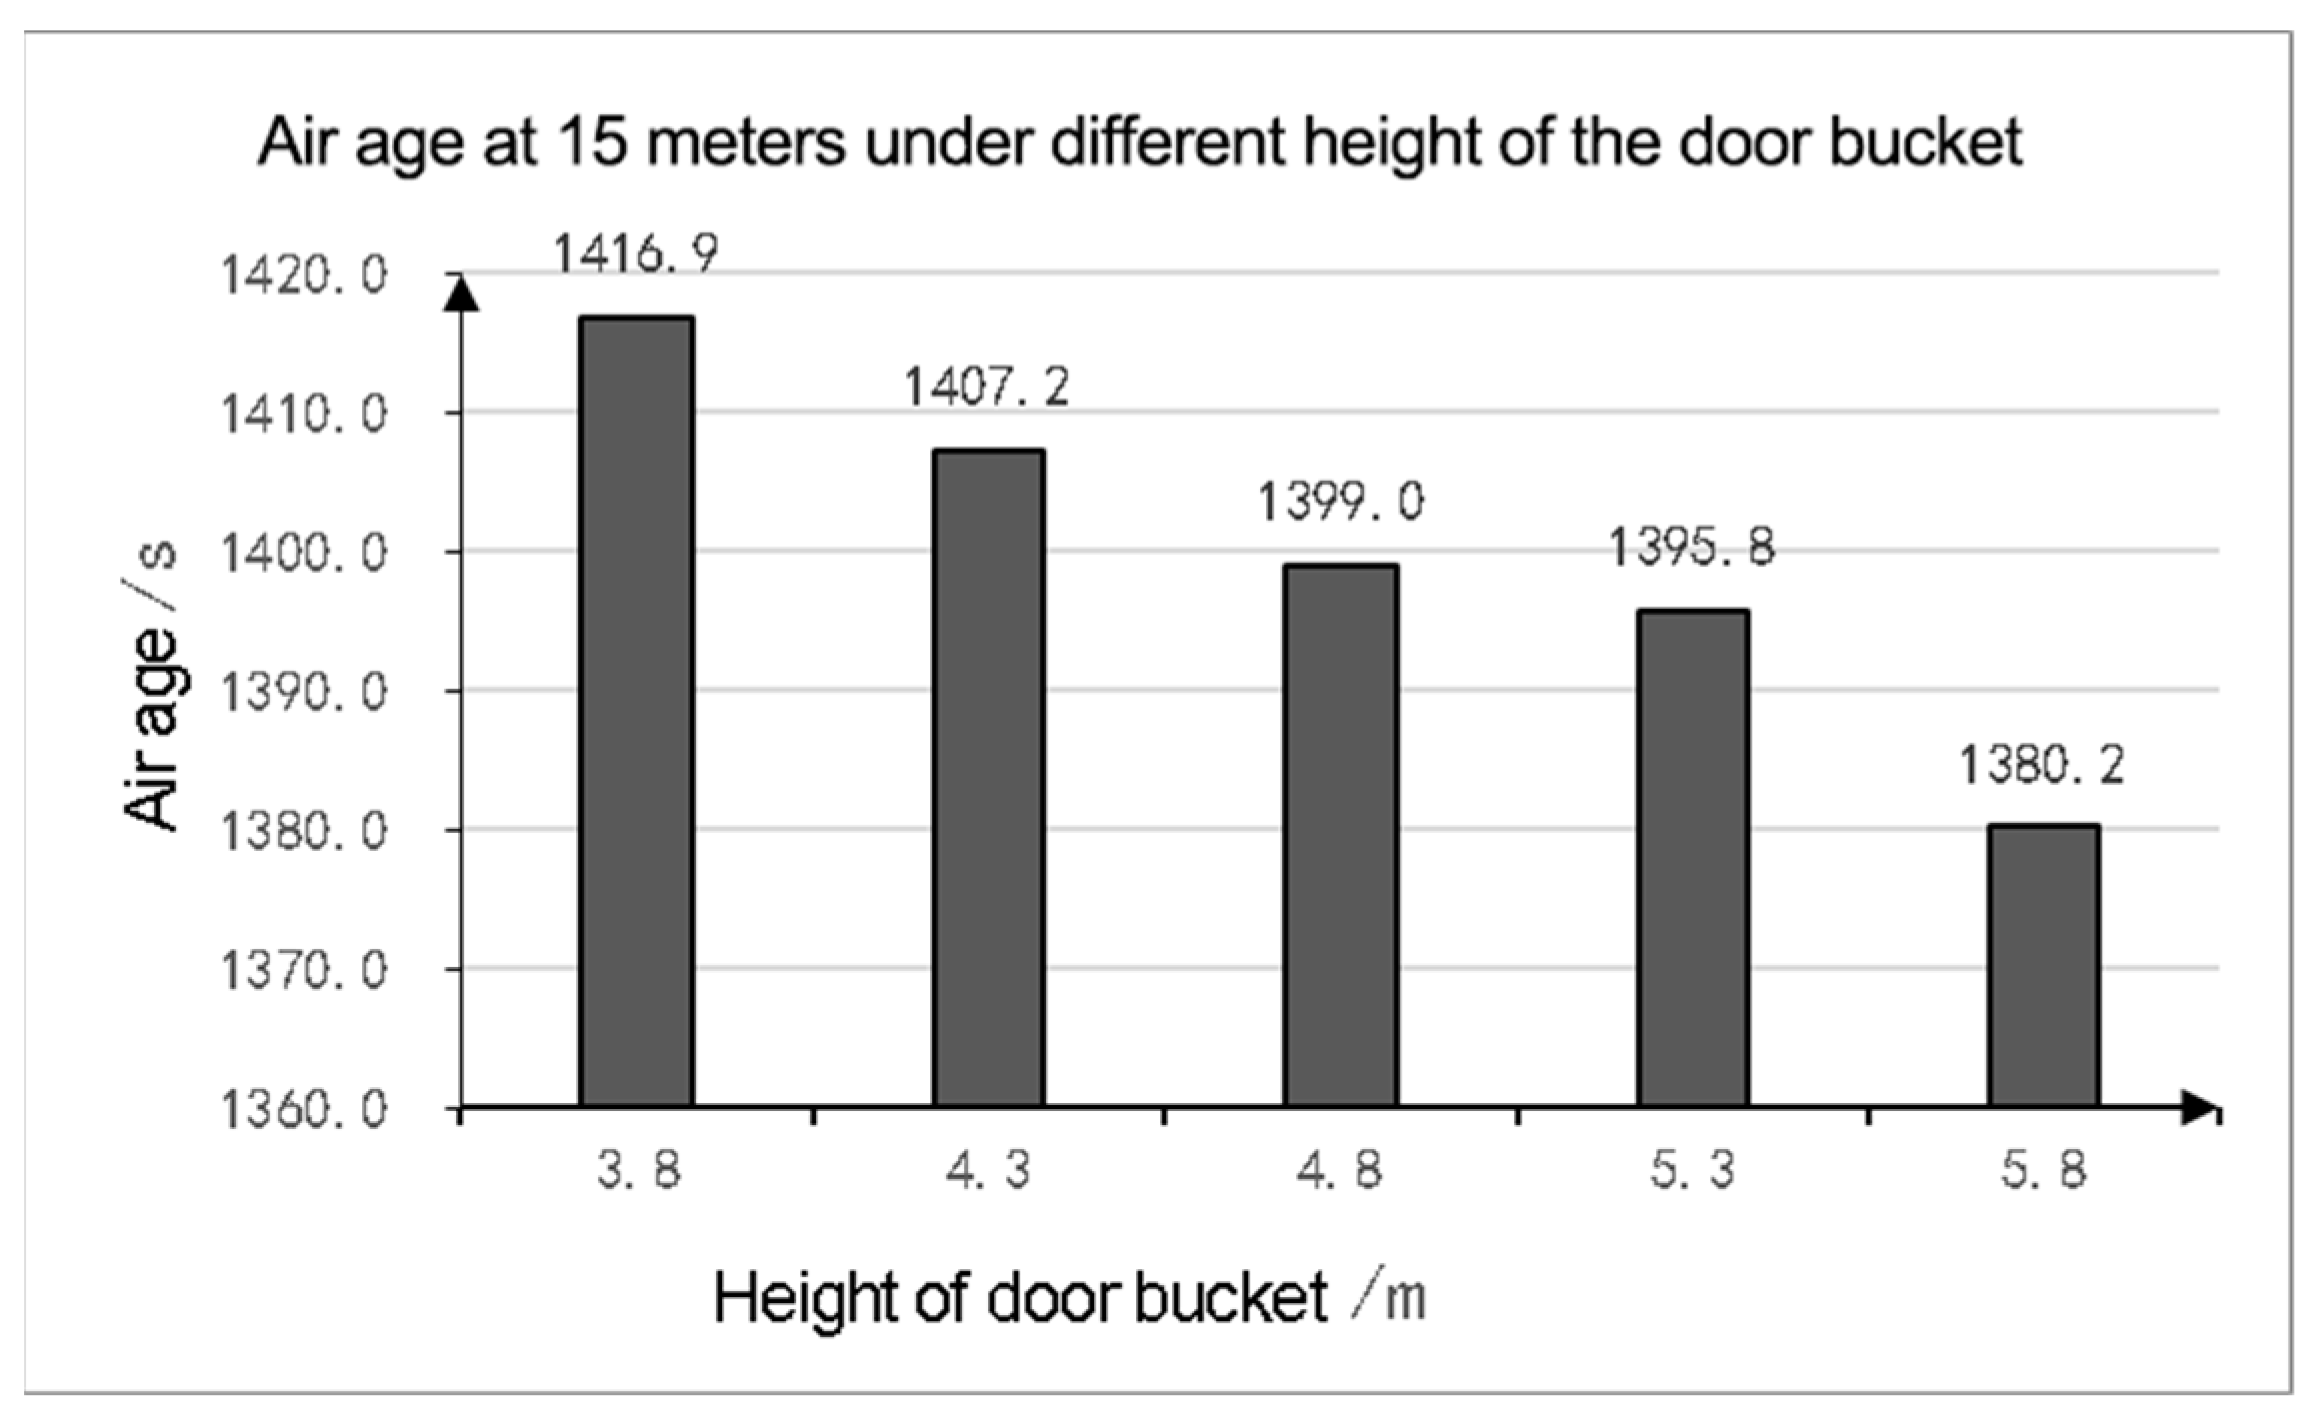
Buildings 14 00344 g029
Figure 30. Indoor air age at 15 m under different door bucket heights.
Buildings 14 00344 g030
Figure 31. Wind speed distribution at a height of 1.5 m under different door opening modes. (a) Simulation 1: Wind speed cloud diagram at 1.5 m height. (b) Simulation 2: Wind speed cloud diagram at 1.5 m height. (c) Simulation 3: Wind speed cloud diagram at 1.5 m height. (d) Simulation 4: Wind speed cloud diagram at 1.5 m height. (e) Simulation 5: Wind speed cloud diagram at 1.5 m height. (f) Simulation 6: Wind speed cloud diagram at 1.5 m height.
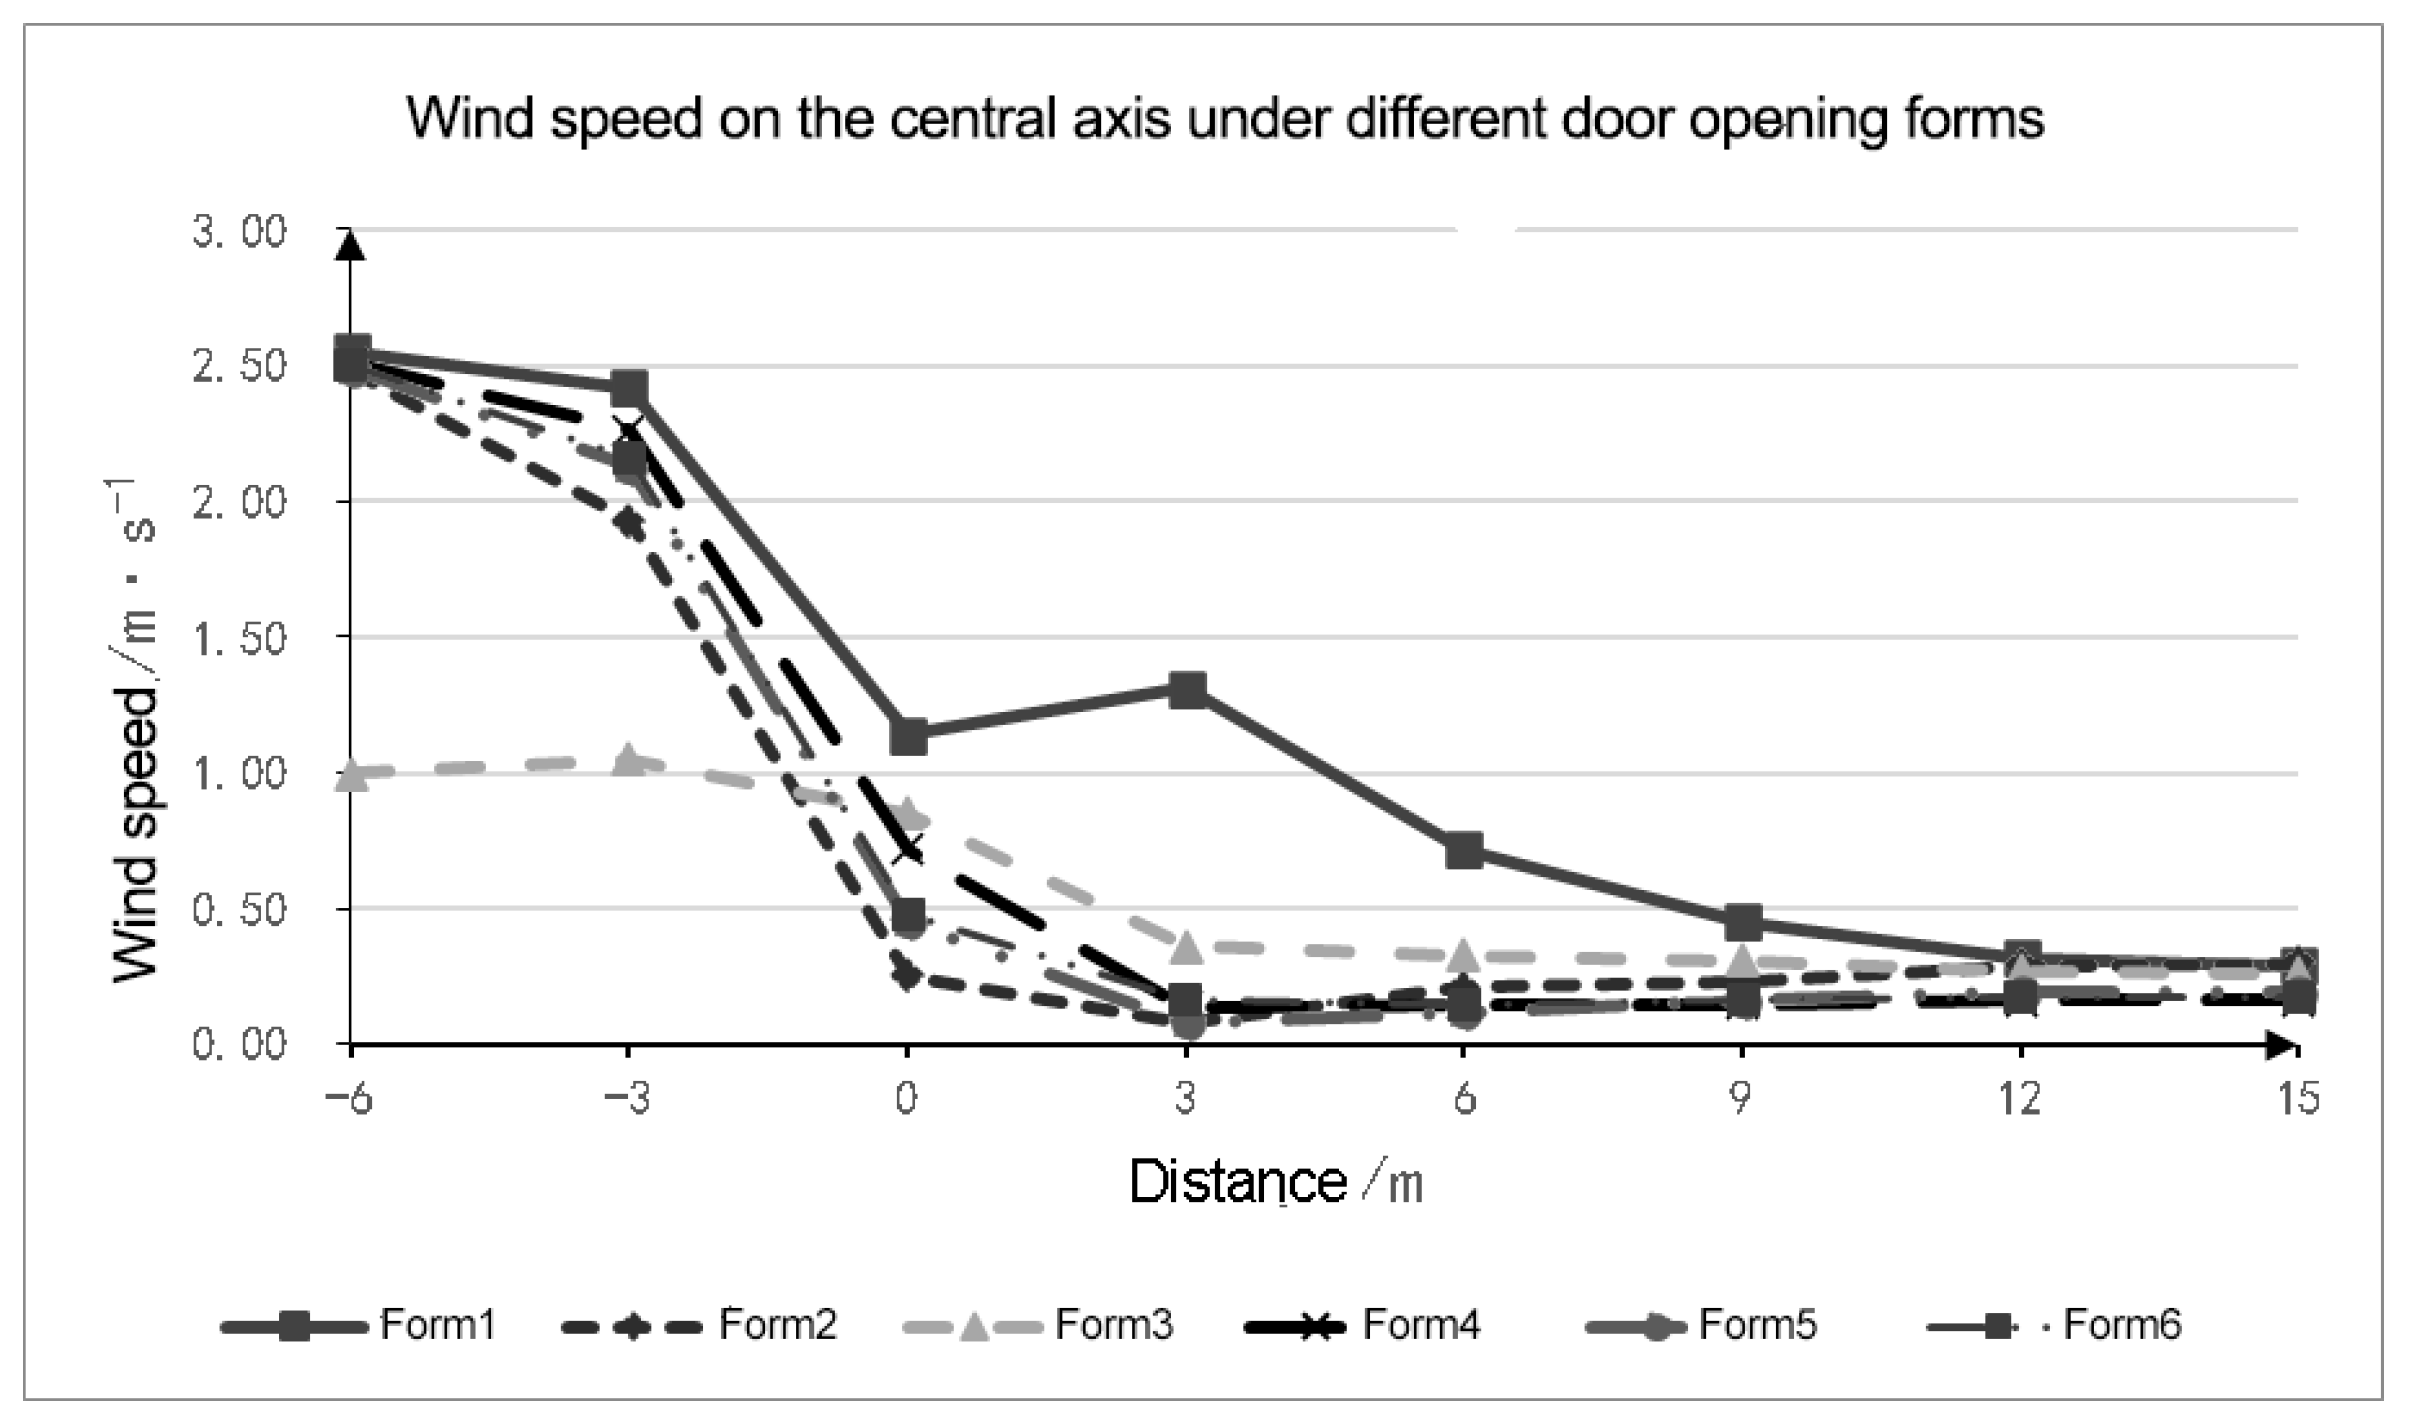
Buildings 14 00344 g031
Figure 32. Changes in wind speed on the central axis of the door bucket under different door opening modes.
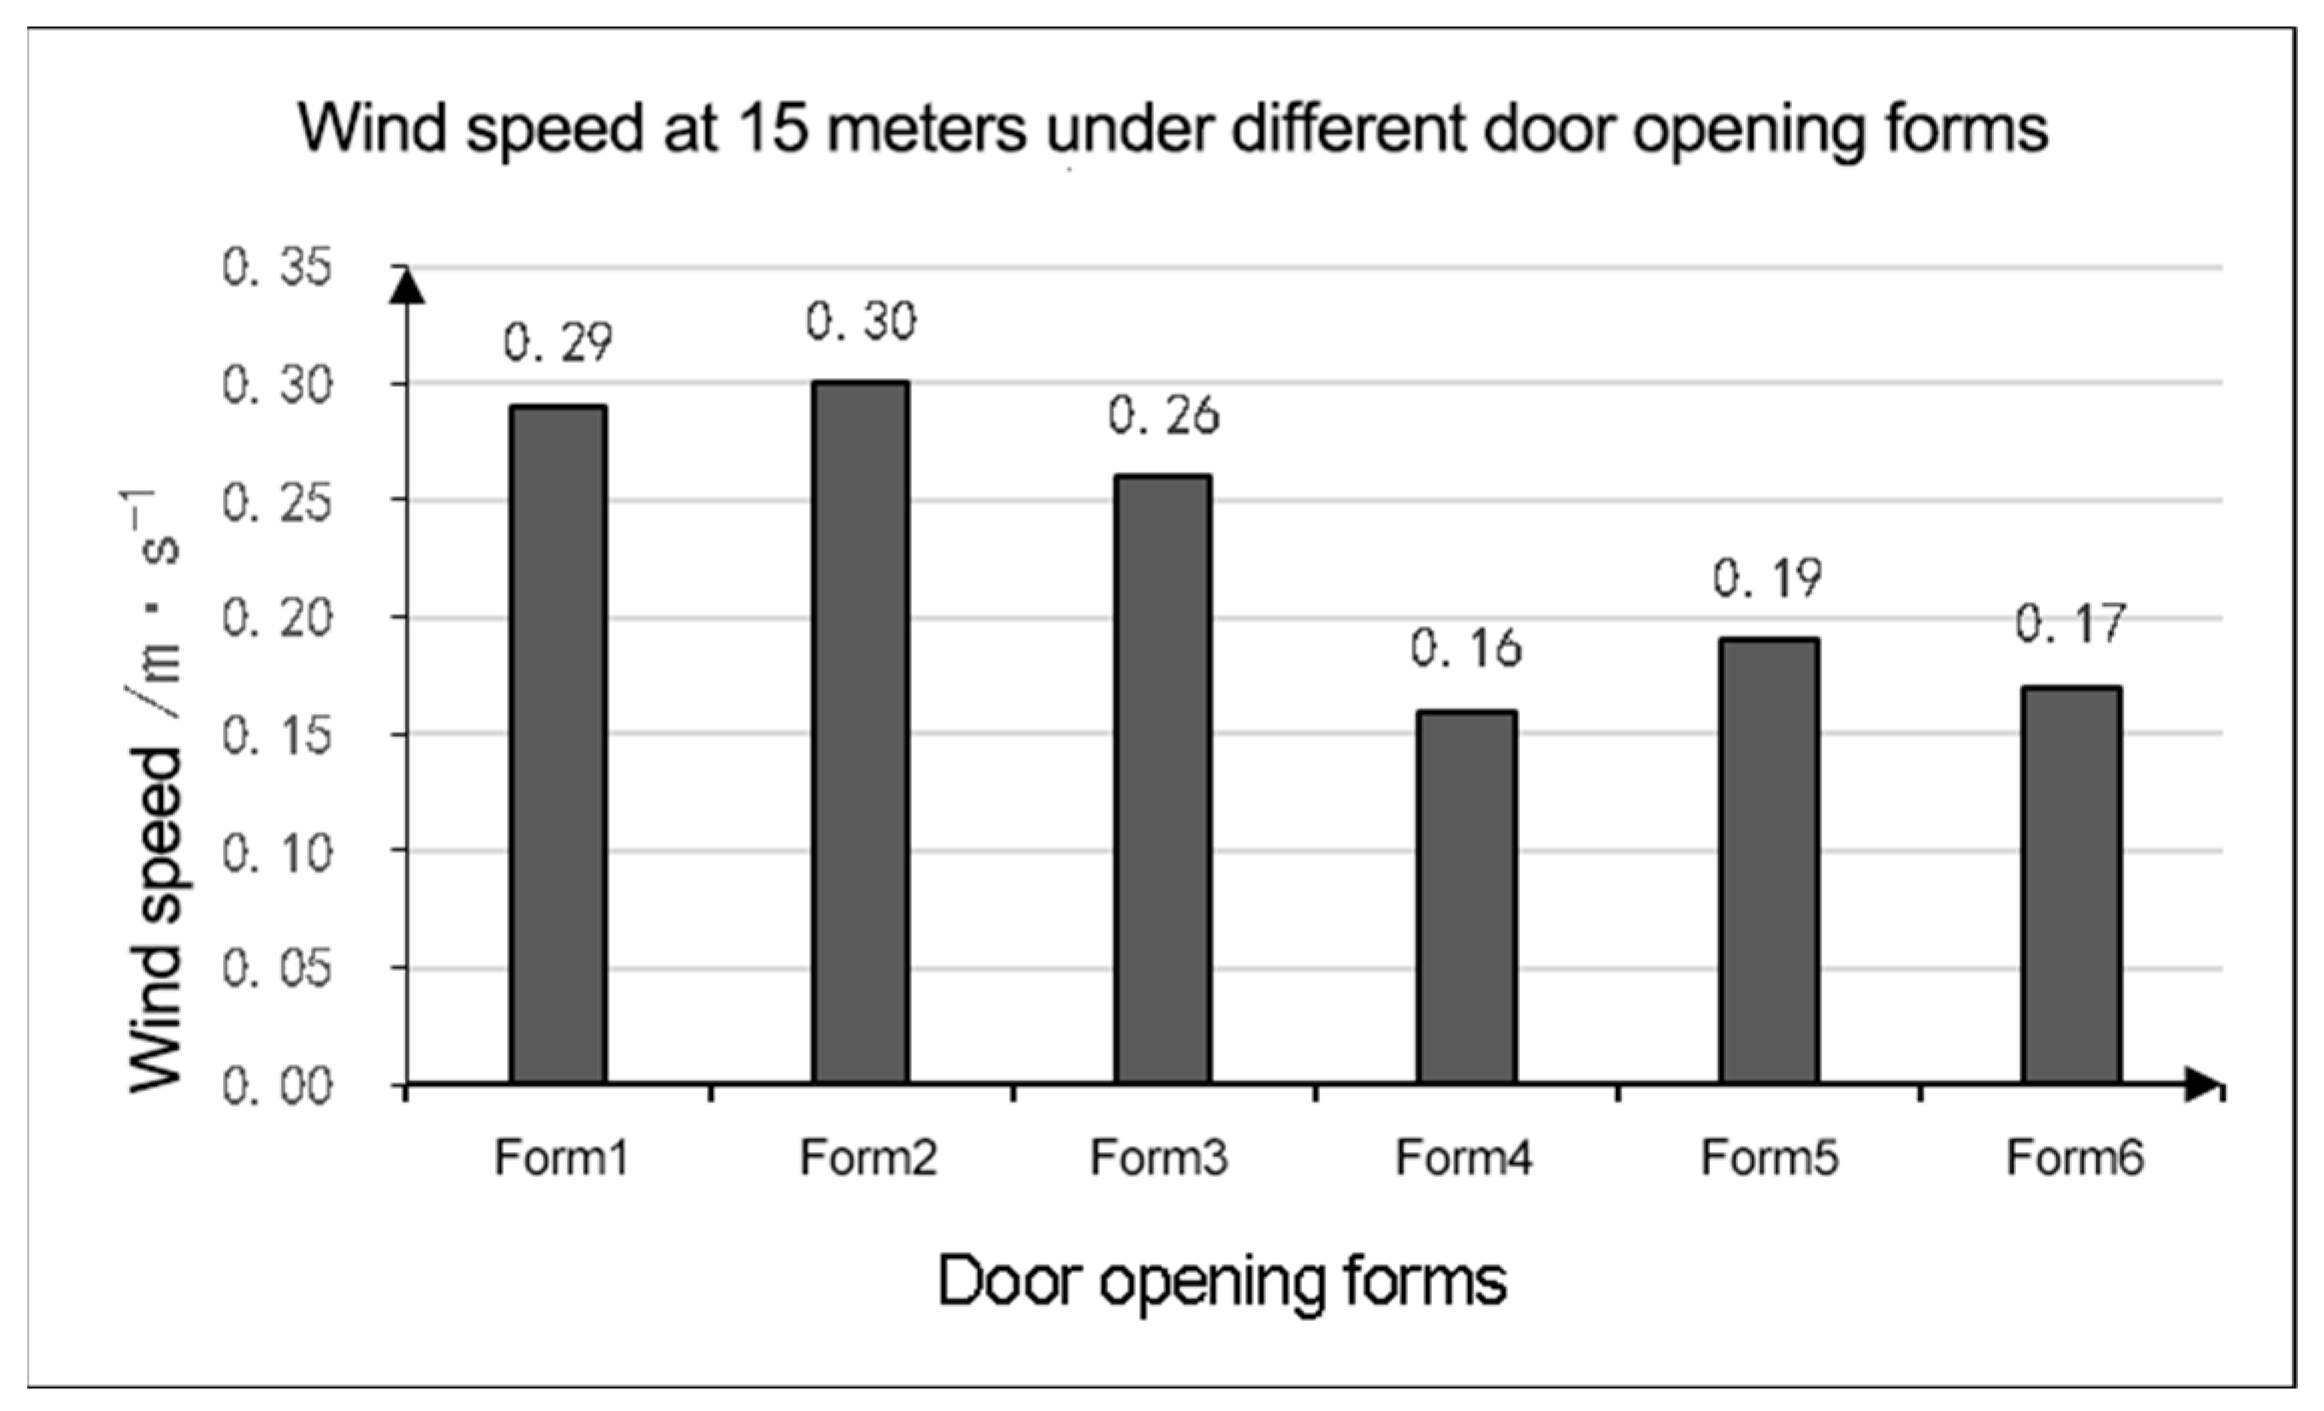
Buildings 14 00344 g032
Figure 33. Indoor wind speeds at 15 m under different door opening modes.
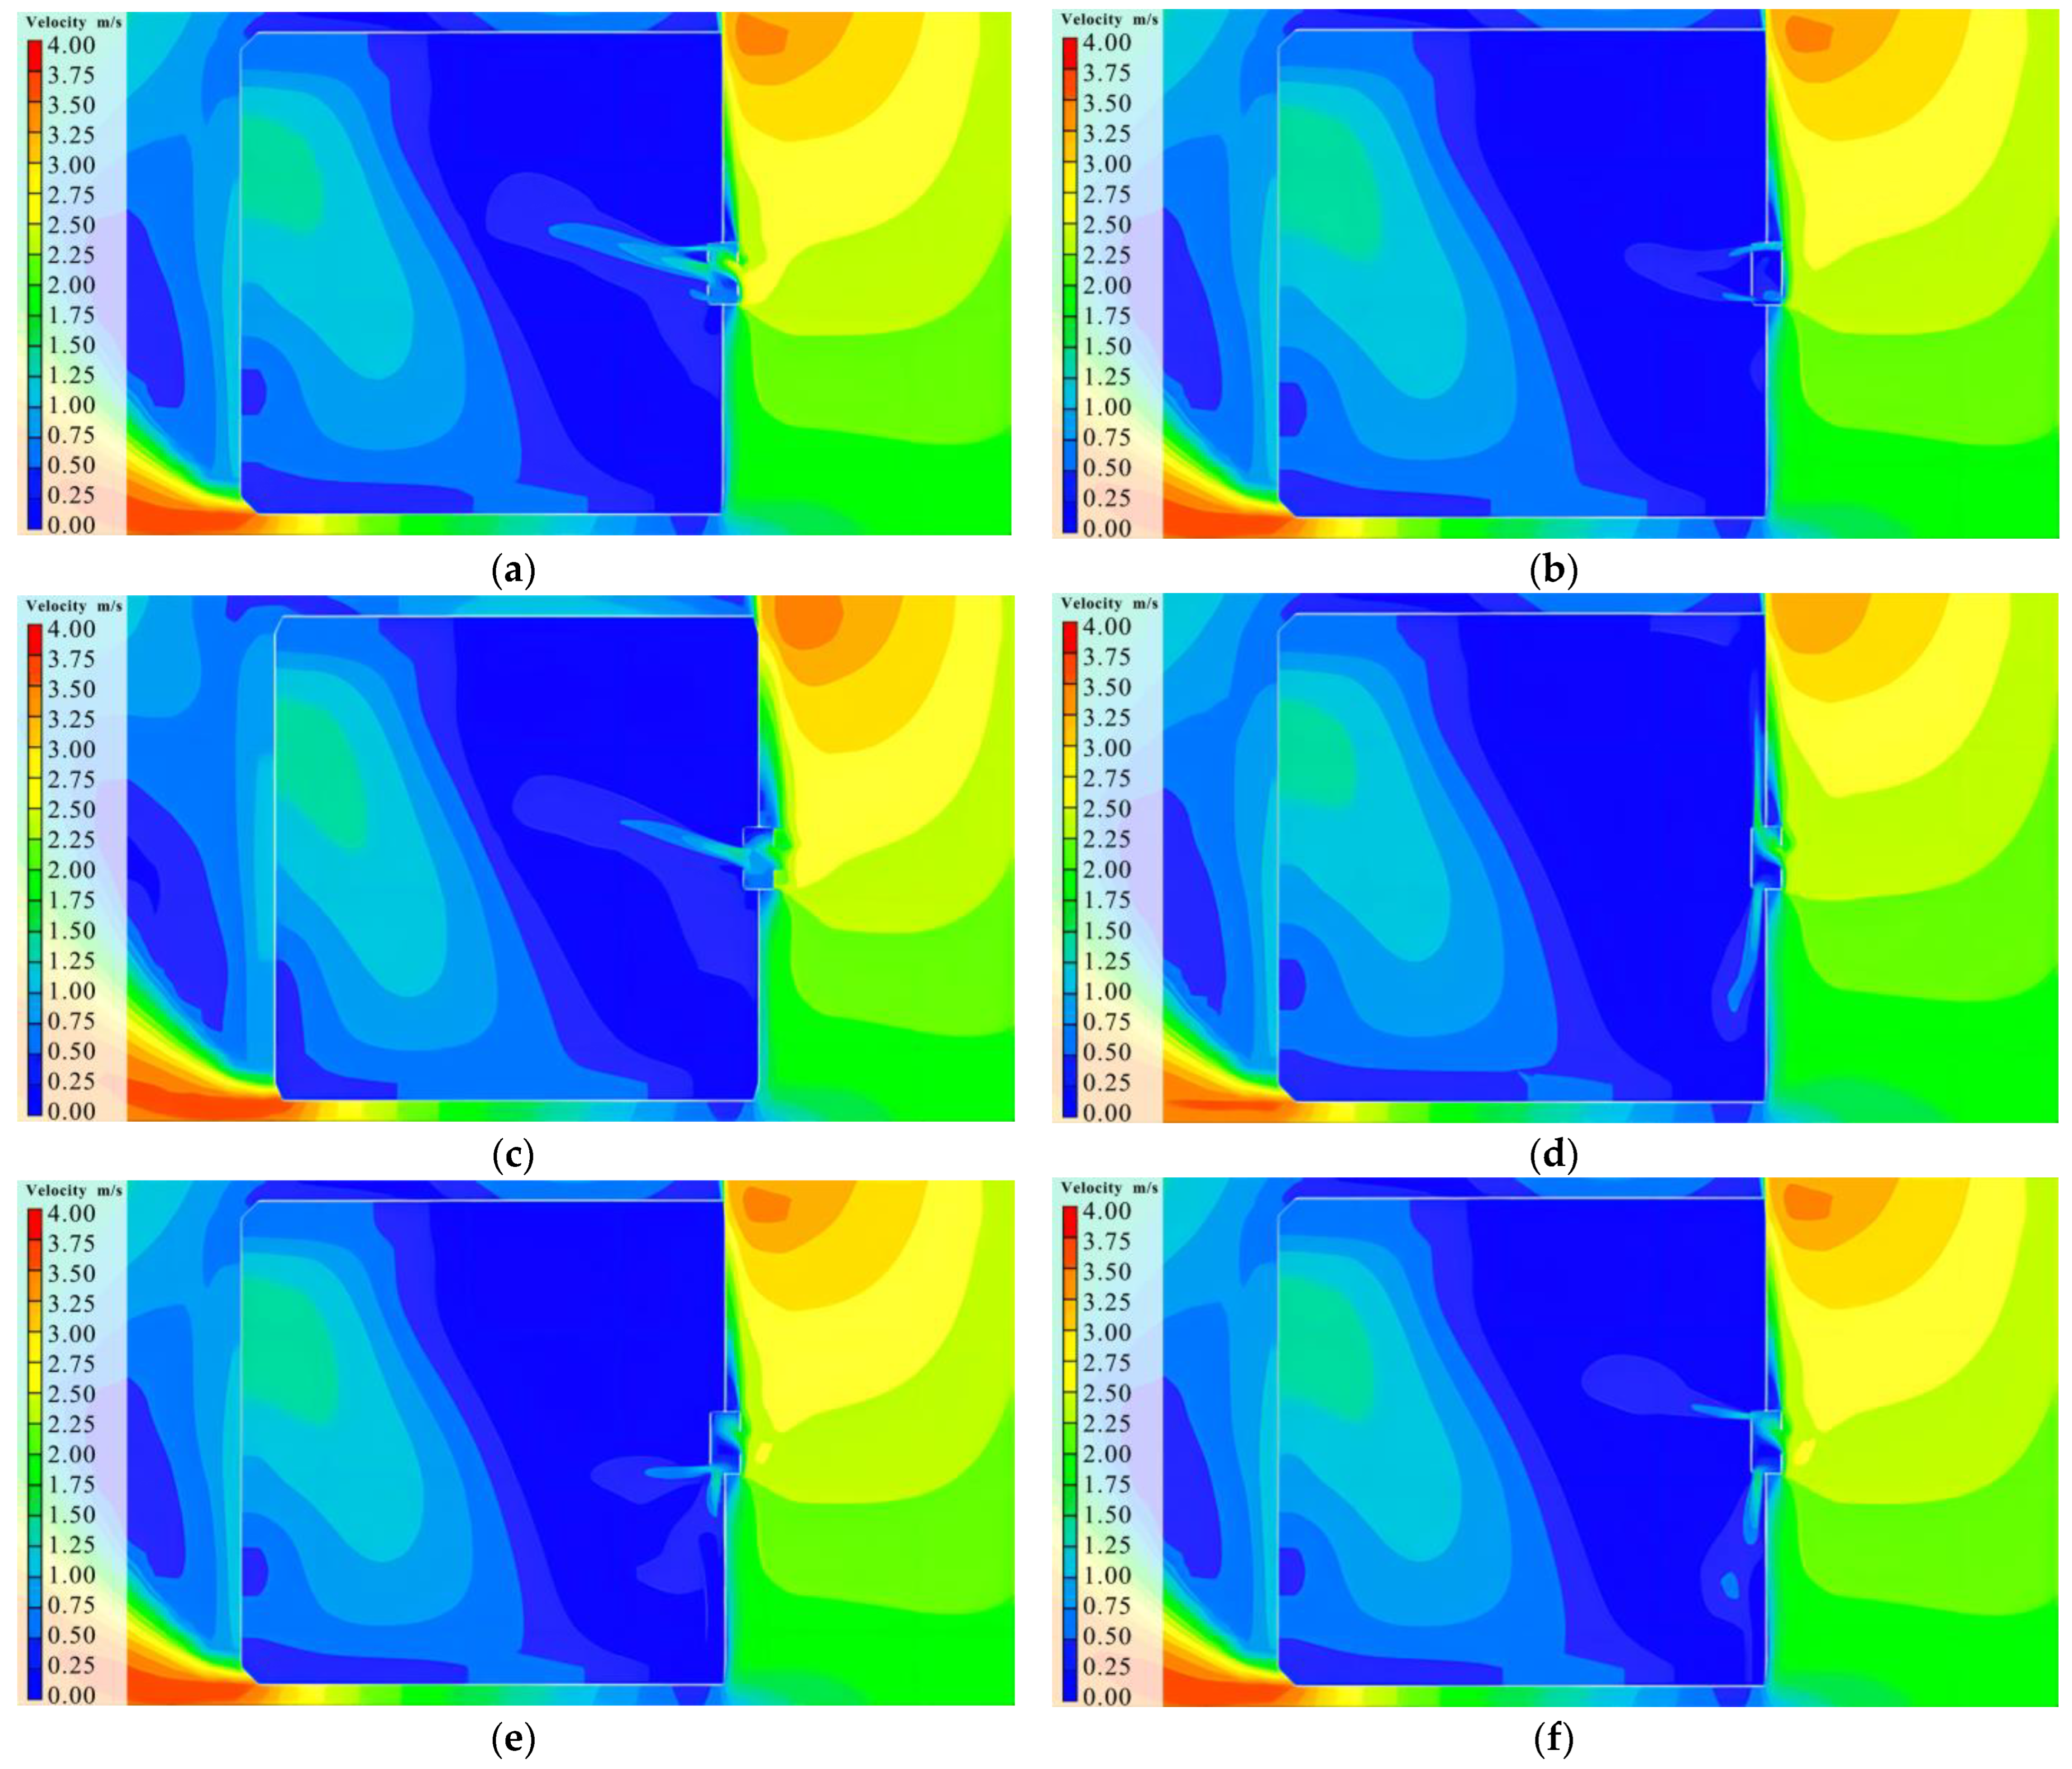
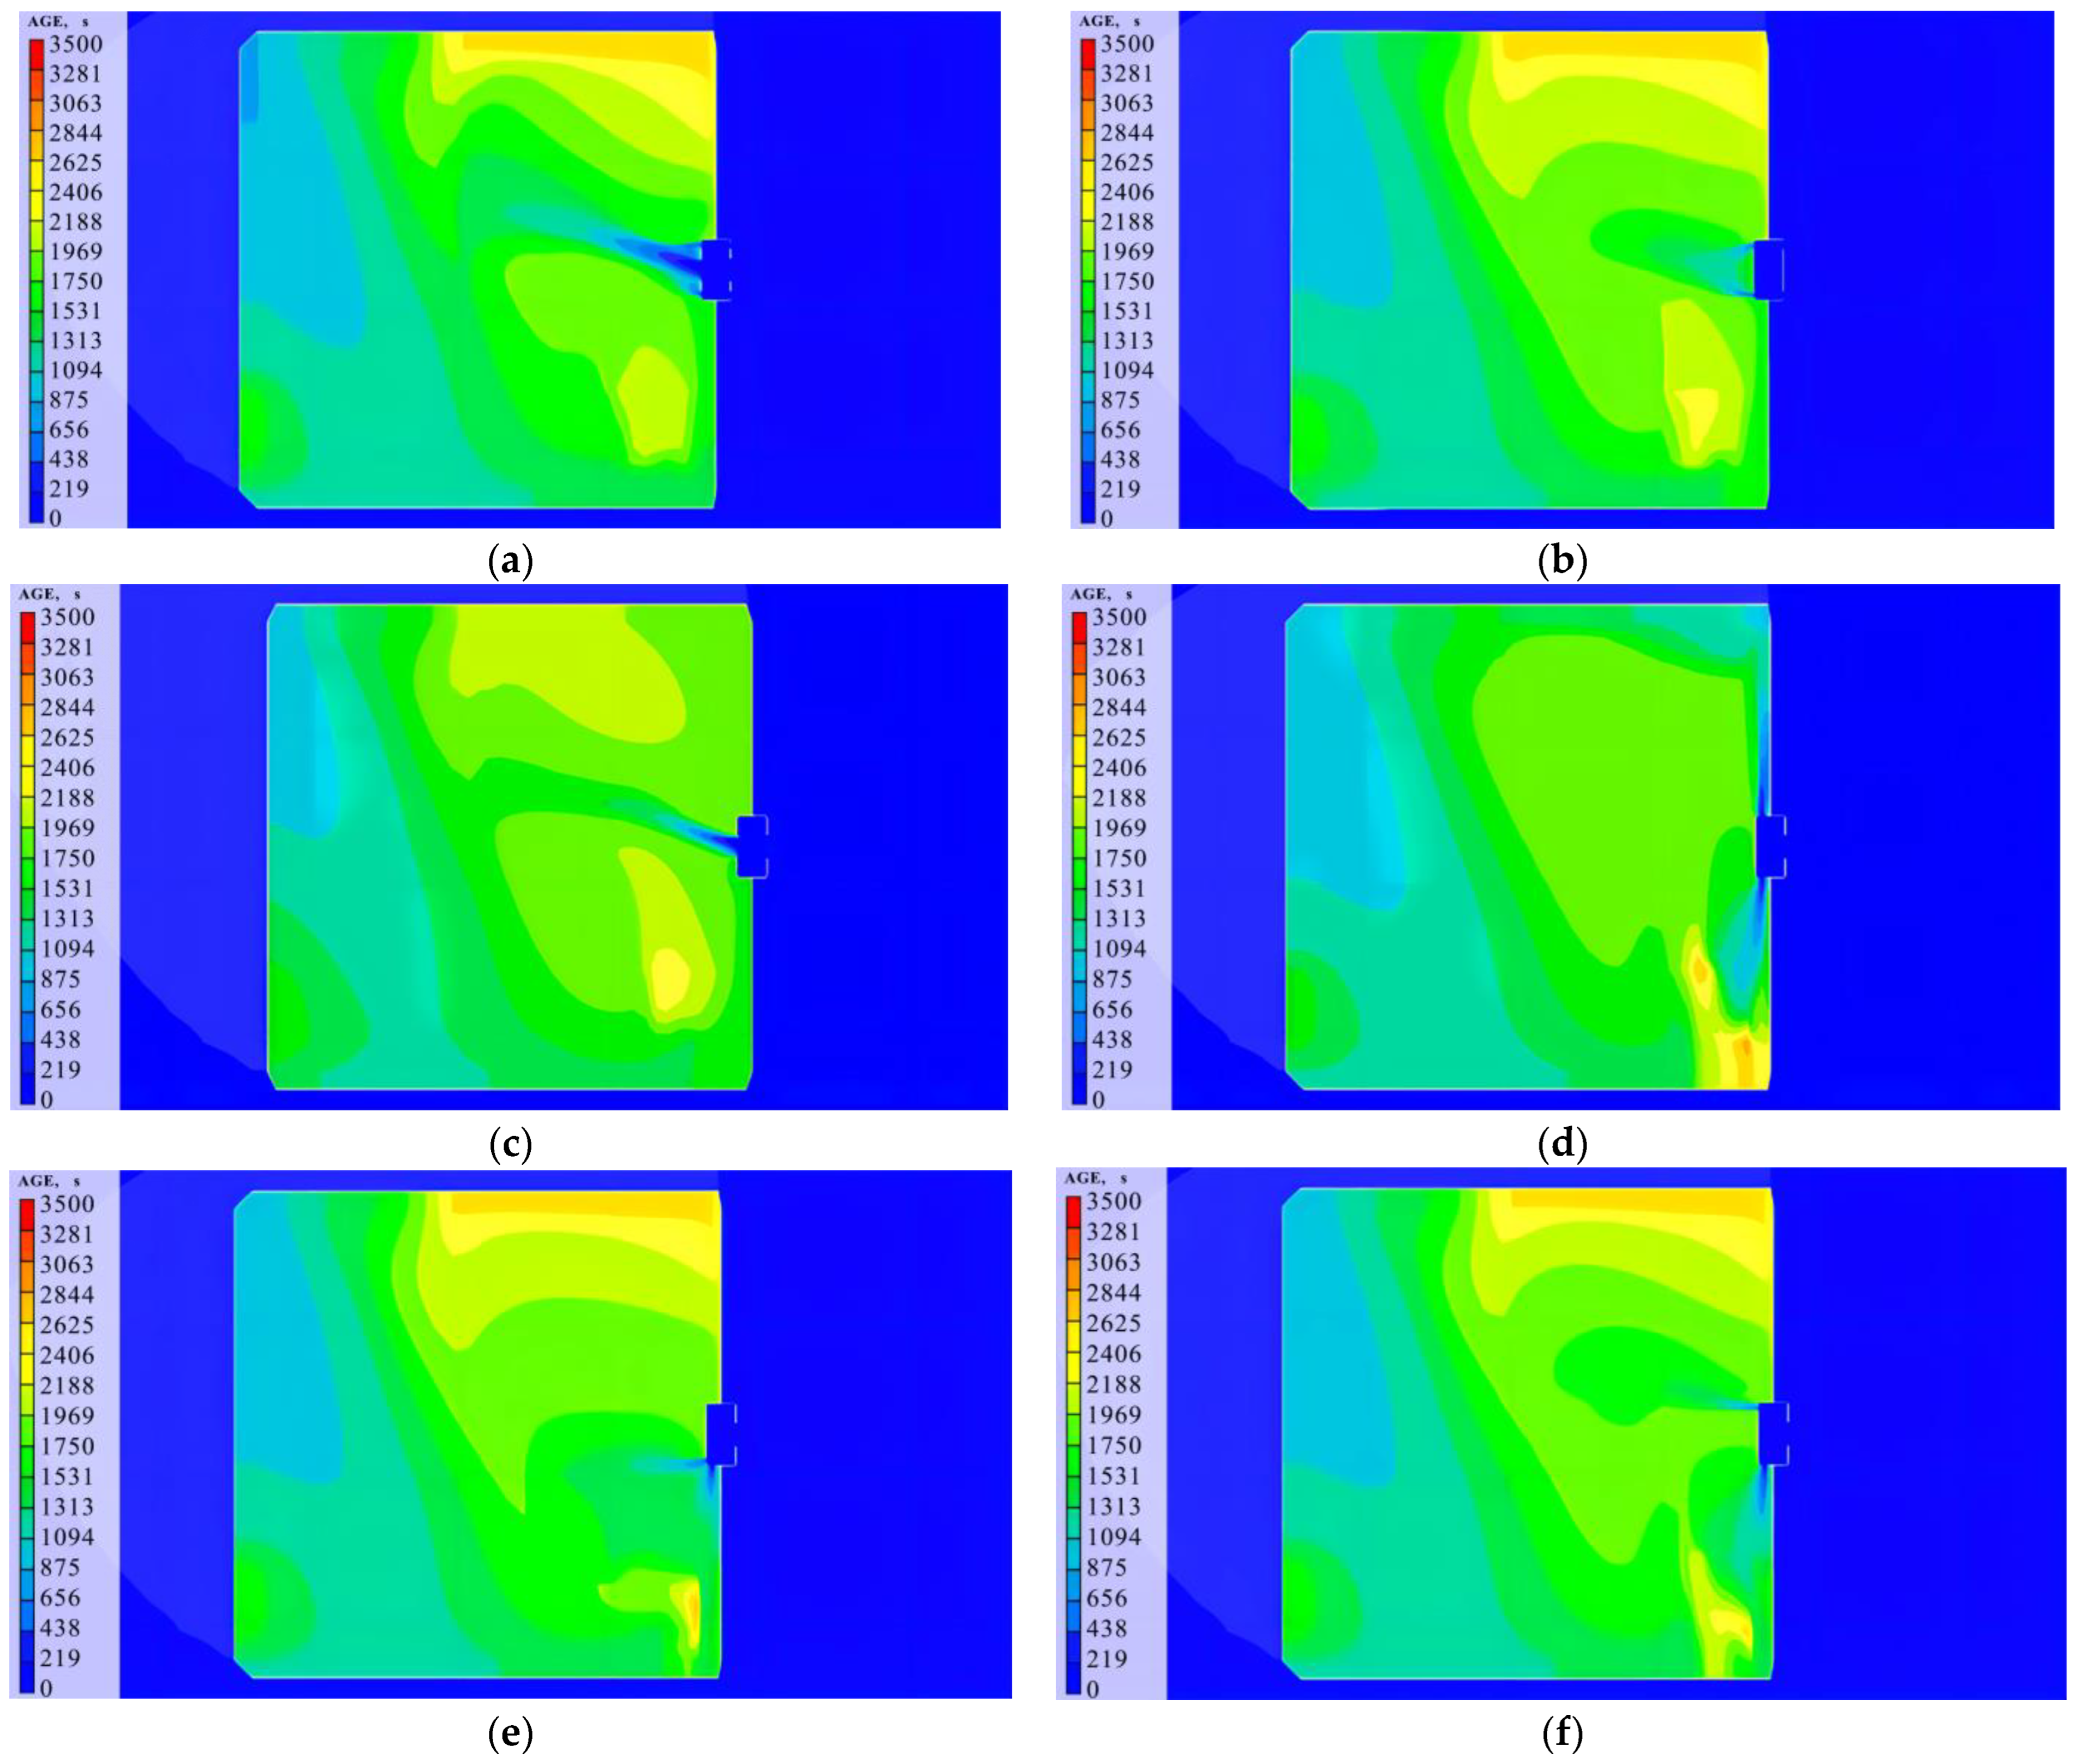
Buildings 14 00344 g033
Figure 34. Air age distribution at 1.5 m height under different door opening modes. (a) Simulation 1: Air age cloud image at a height of 1.5 m. (b) Simulation 2: Air age cloud image at a height of 1.5 m. (c) Simulation 3: Air age cloud image at a height of 1.5 m. (d) Simulation 4: Air age cloud image at a height of 1.5 m. (e) Simulation 5: Air age cloud image at a height of 1.5 m. (f) Simulation 6: Air age cloud image at a height of 1.5 m.
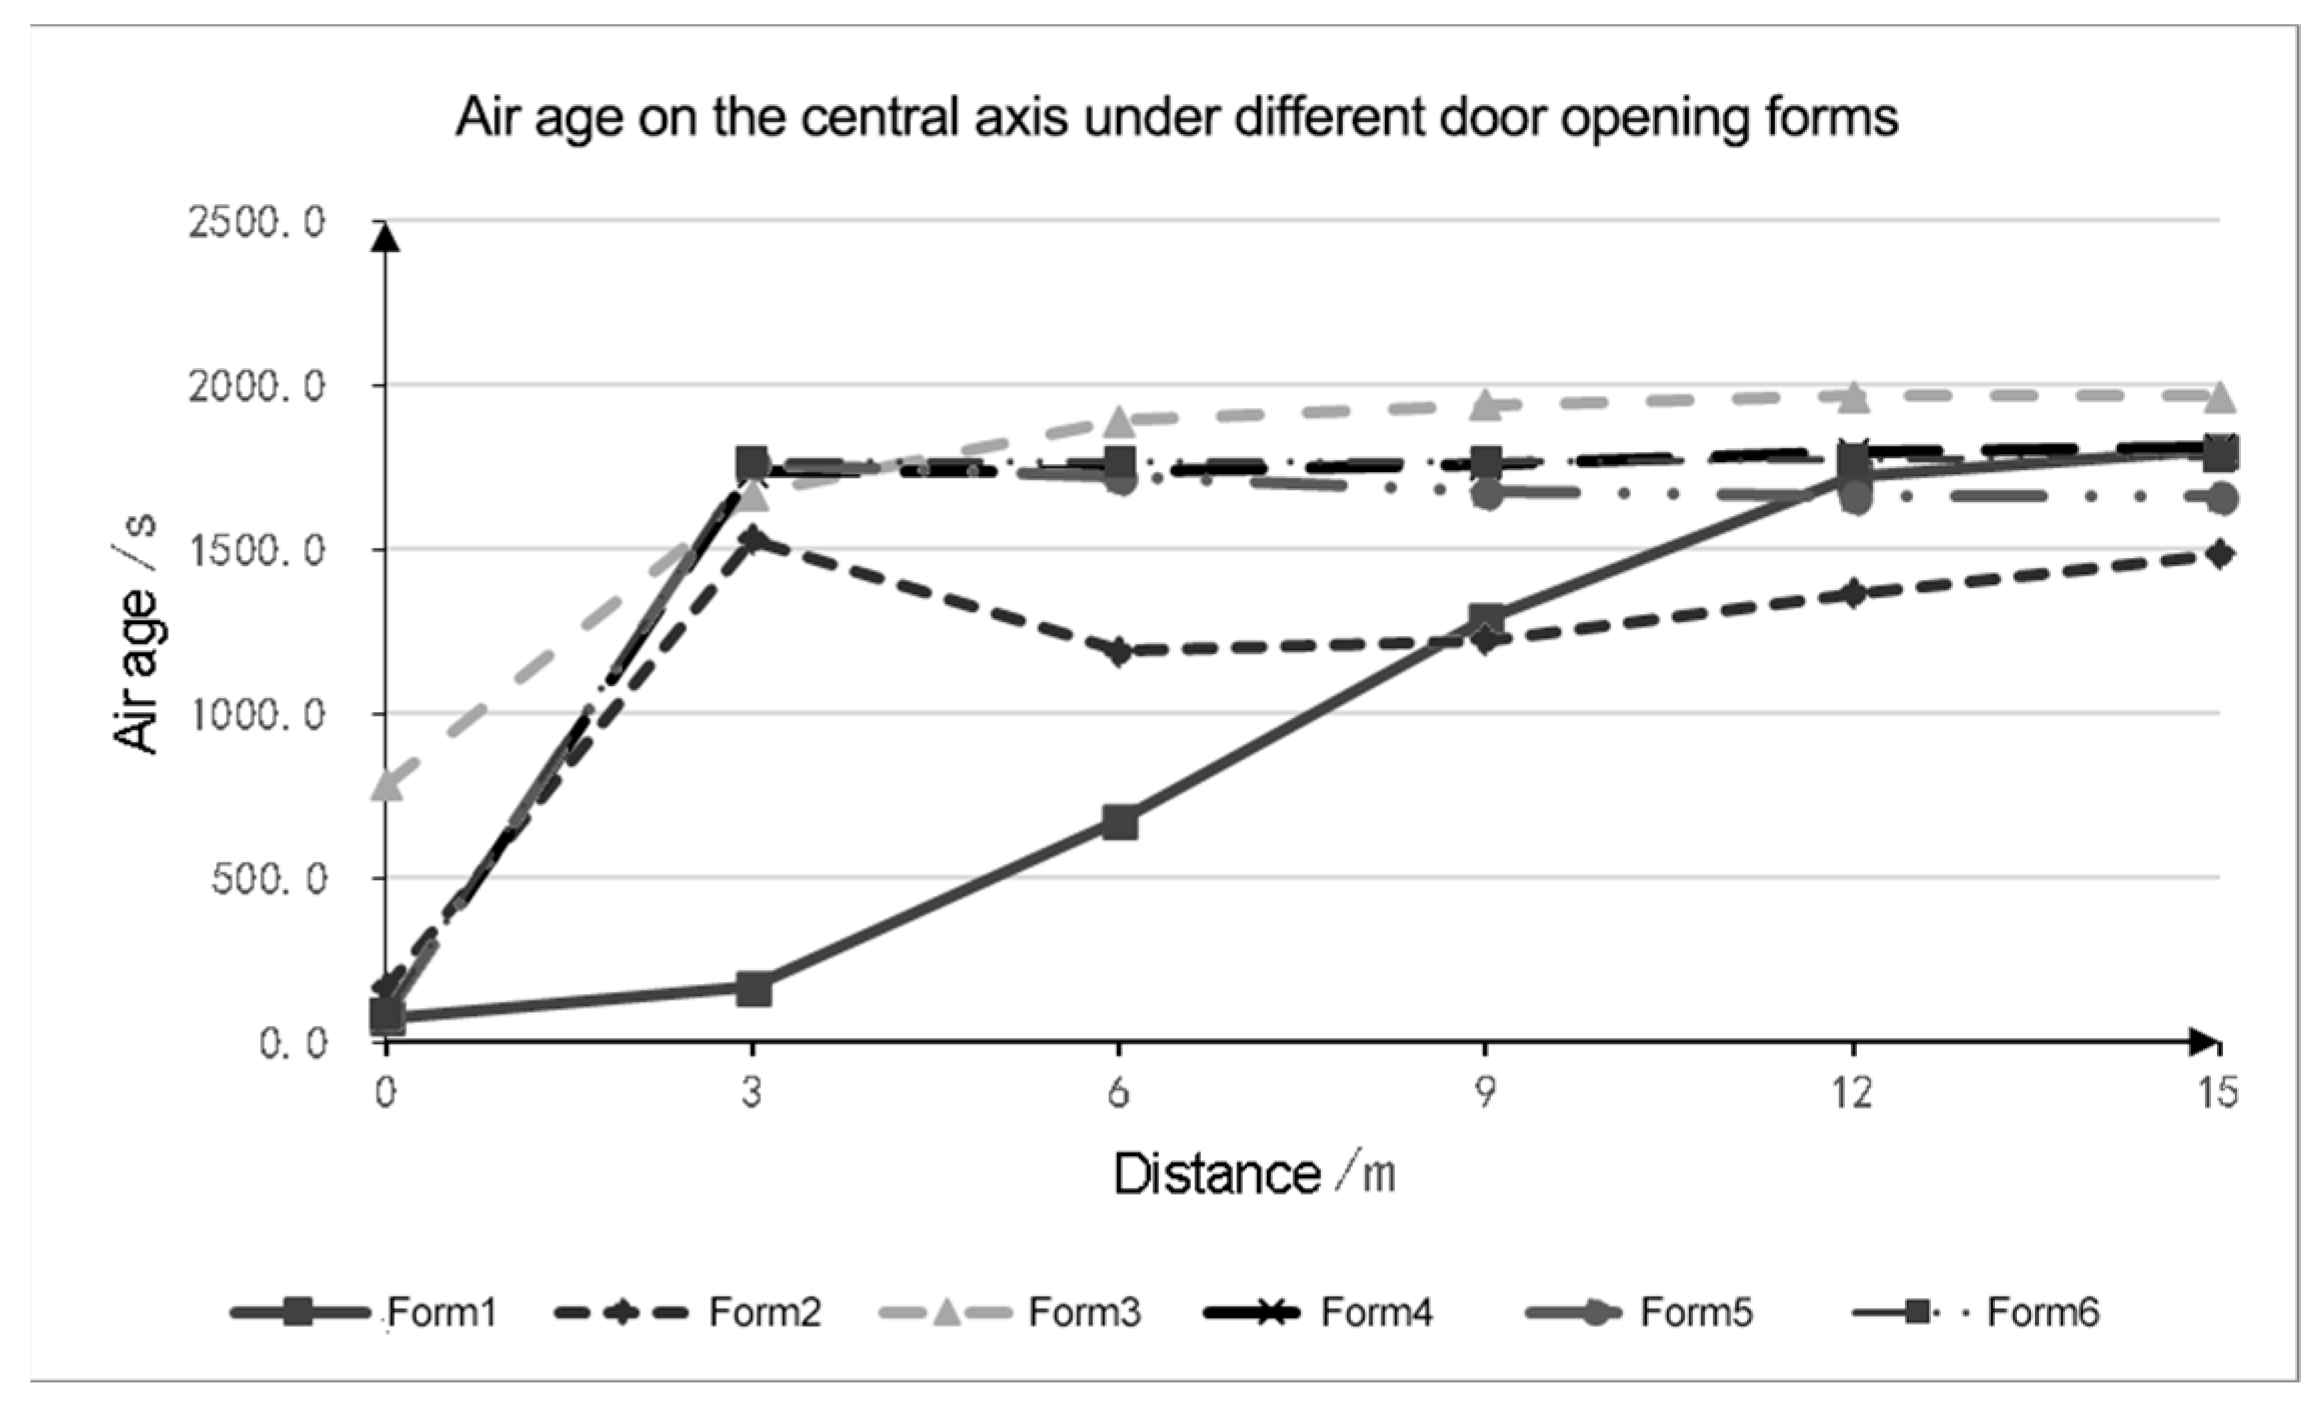
Buildings 14 00344 g034
Figure 35. Changes in air age on the central axis of the door bucket under different door opening forms.
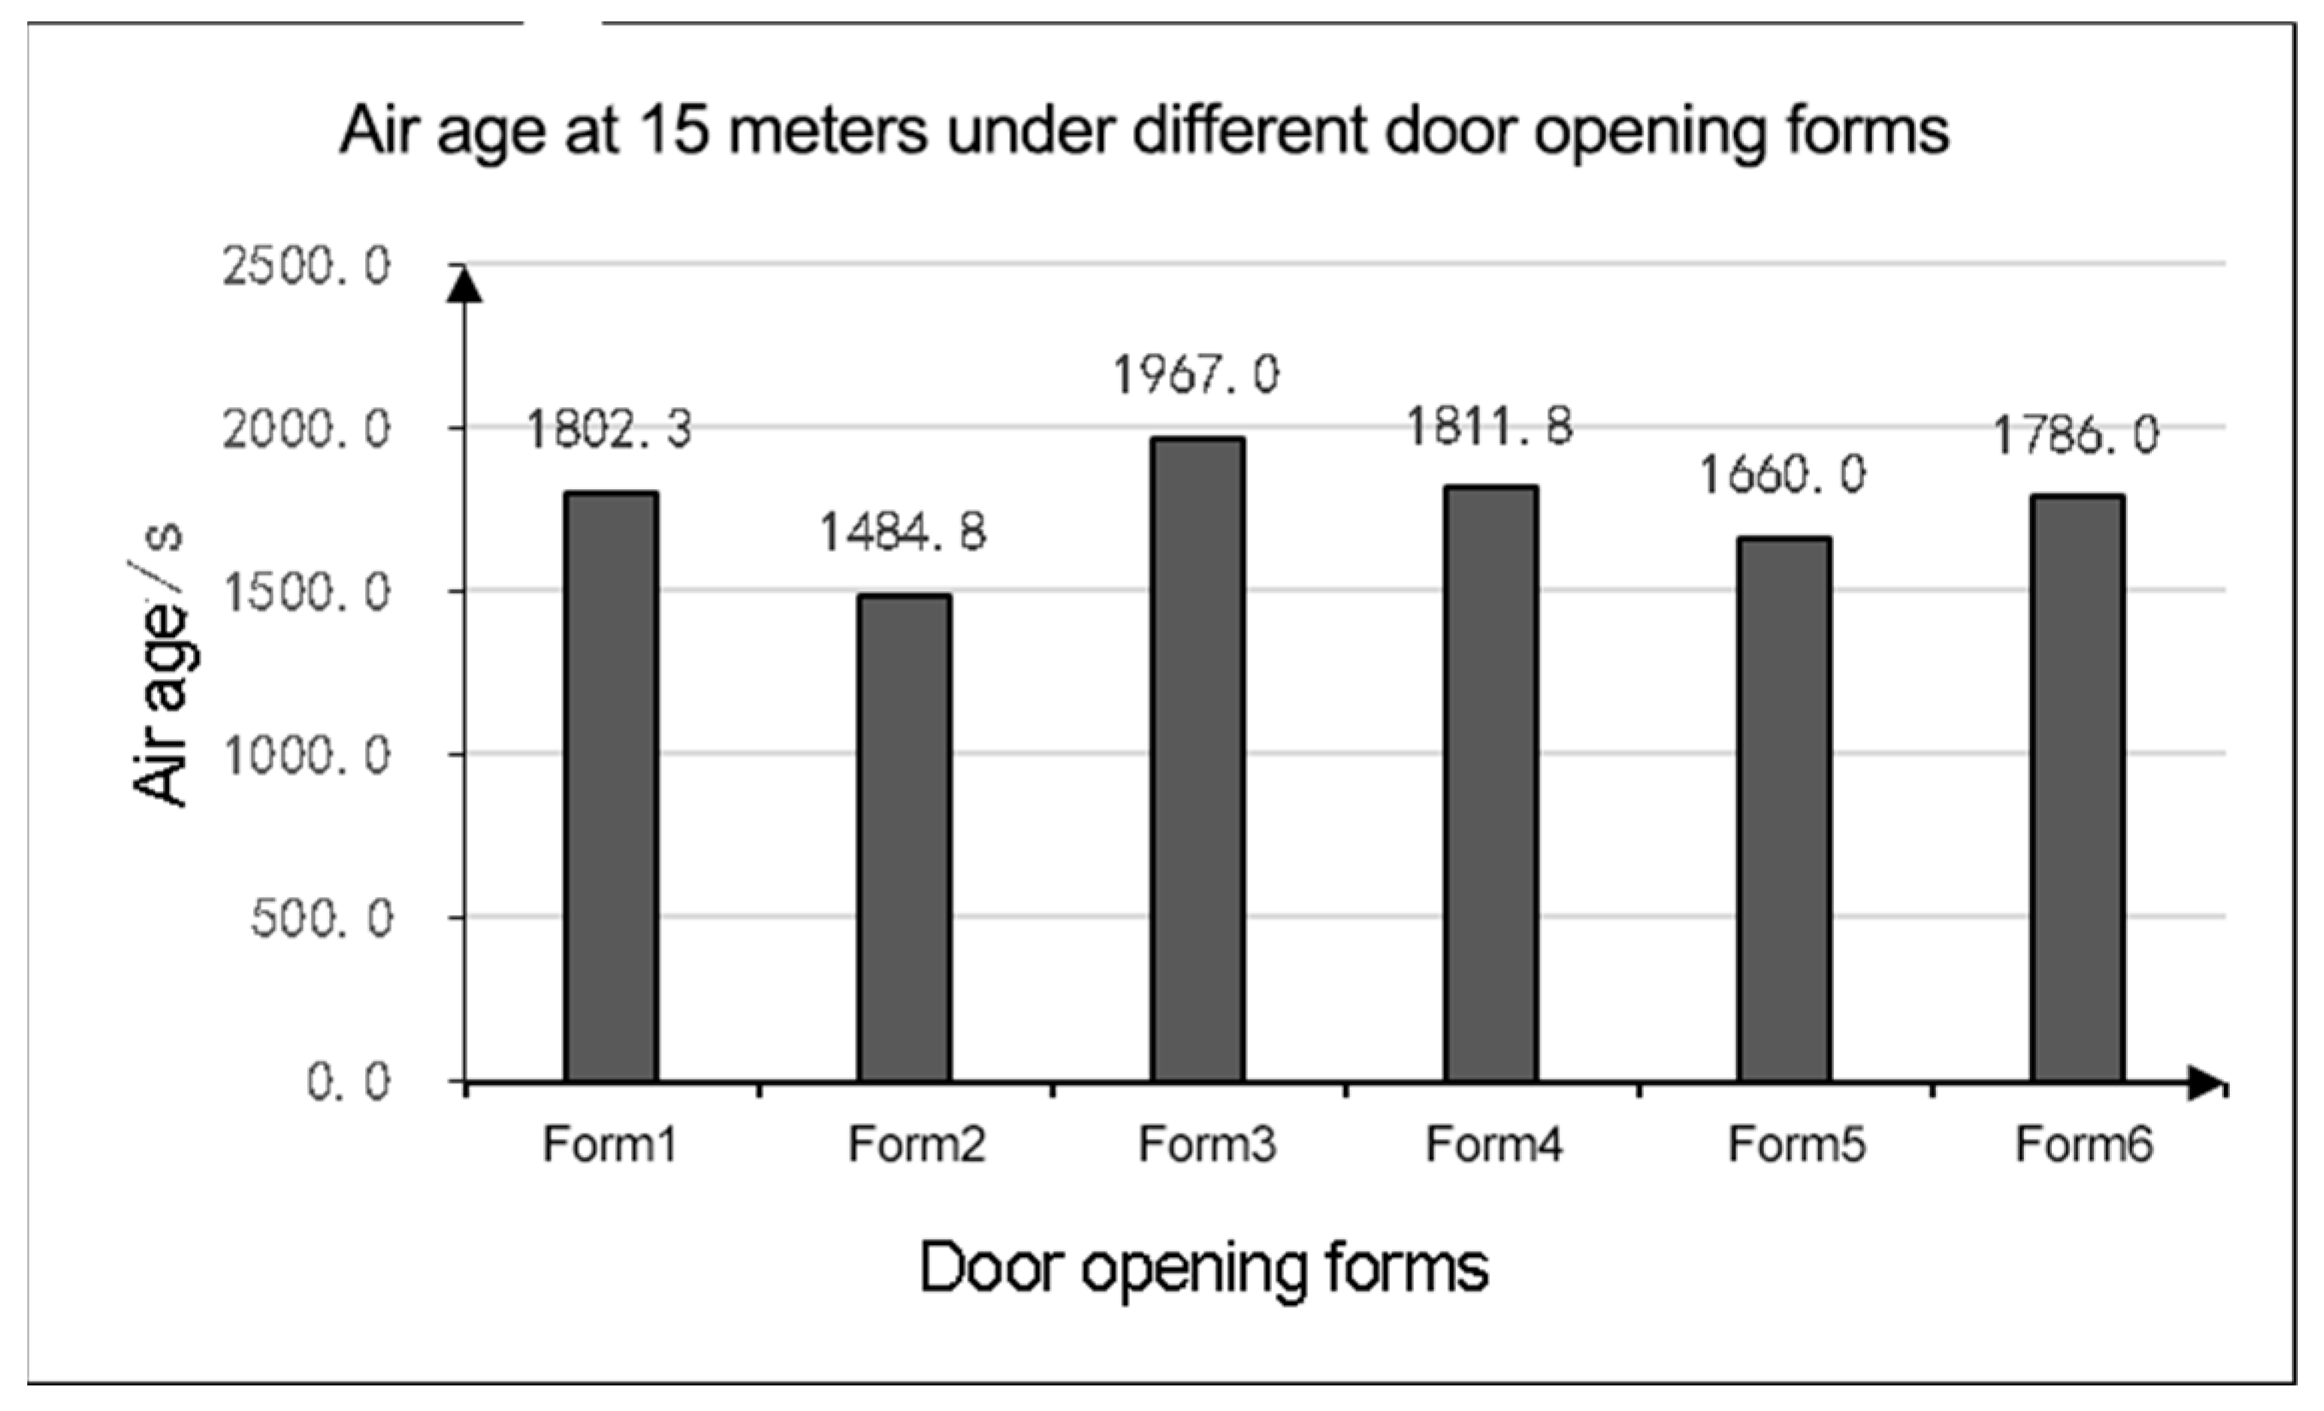
Buildings 14 00344 g035
Figure 36. Indoor air ages at 15 m under different door opening modes.
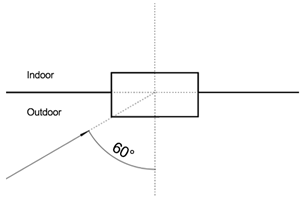
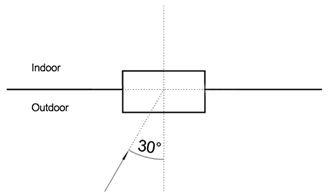
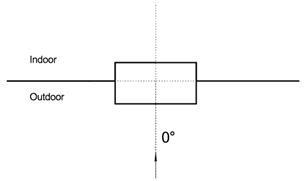
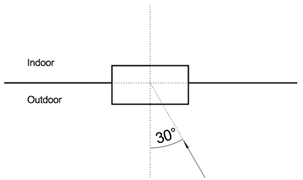
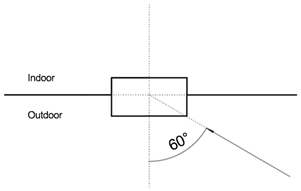
Buildings 14 00344 g036
Figure 37. Wind speed distribution at a height of 1.5 m under different outdoor wind directions. (a) Cloud diagram of wind speed at a height of 1.5 m when the outdoor wind direction was at an angle of 60°. (b) Cloud diagram of wind speed at a height of 1.5 m when the outdoor wind direction was at an angle of 30°. (c) Cloud diagram of wind speed at a height of 1.5 m when the outdoor wind direction was at an angle of 0°. (d) Cloud diagram of wind speed at a height of 1.5 m when the outdoor wind direction was at an angle of −30°. (e) Cloud diagram of wind speed at a height of 1.5 m when the outdoor wind direction was at an angle of −60°.
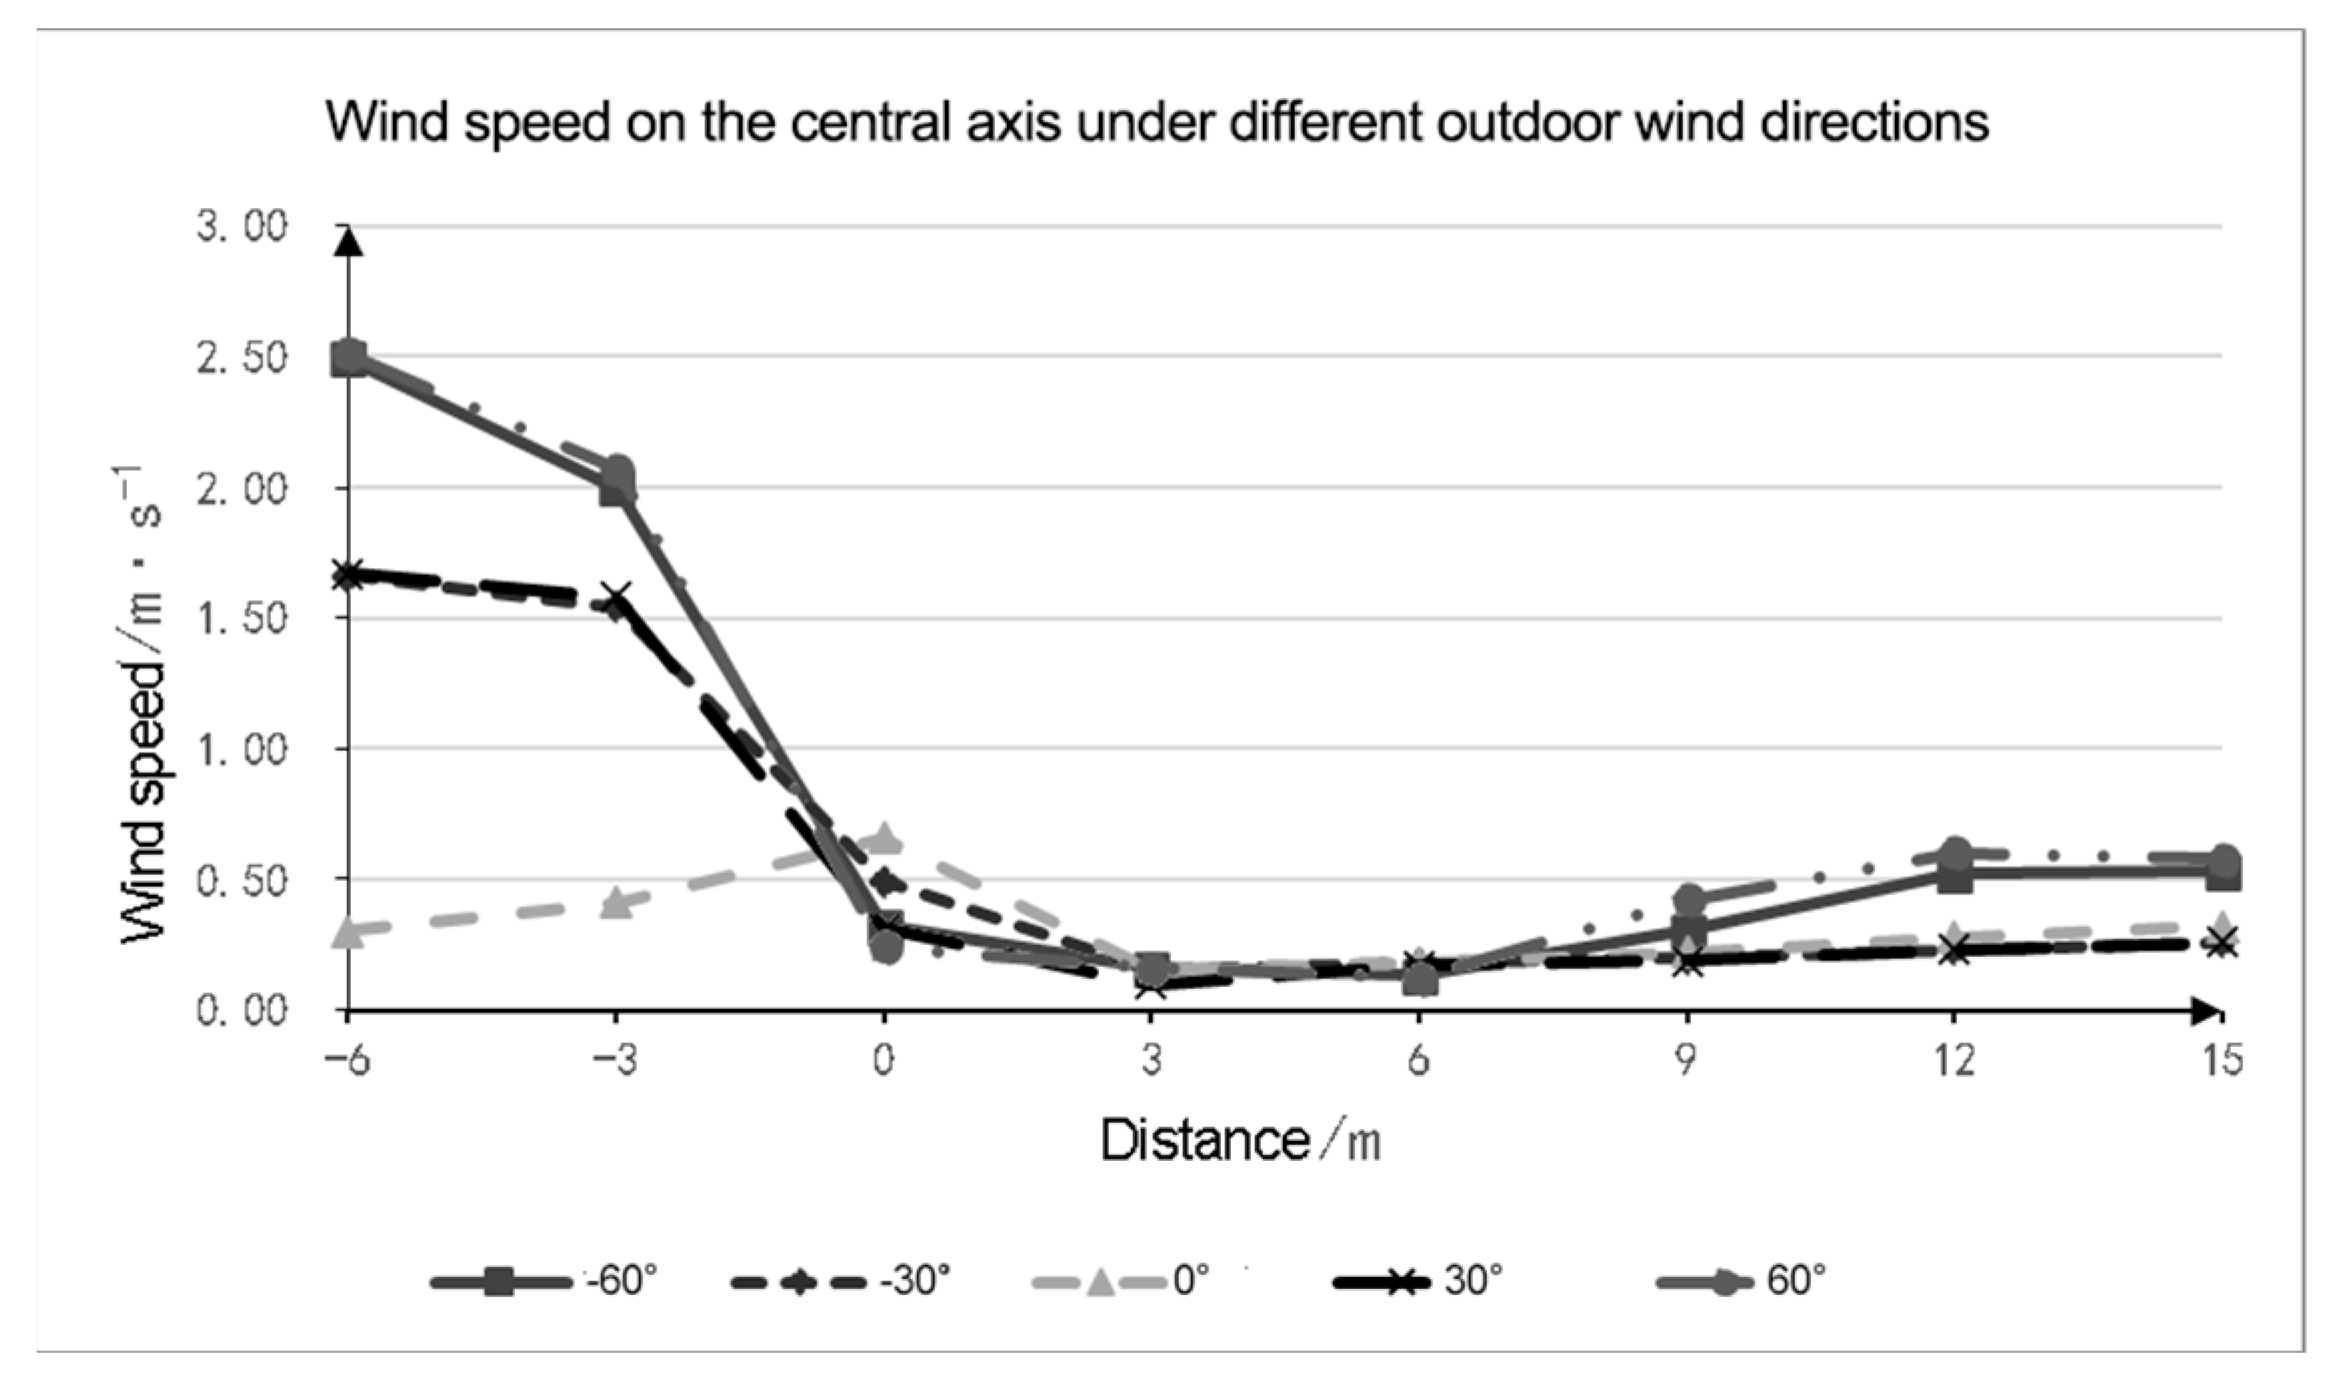
Buildings 14 00344 g037
Figure 38. Wind speed changes on the central axis of the door bucket under different outdoor wind directions.
Buildings 14 00344 g038
Figure 39. Indoor wind speeds at 15 m under different outdoor wind directions.
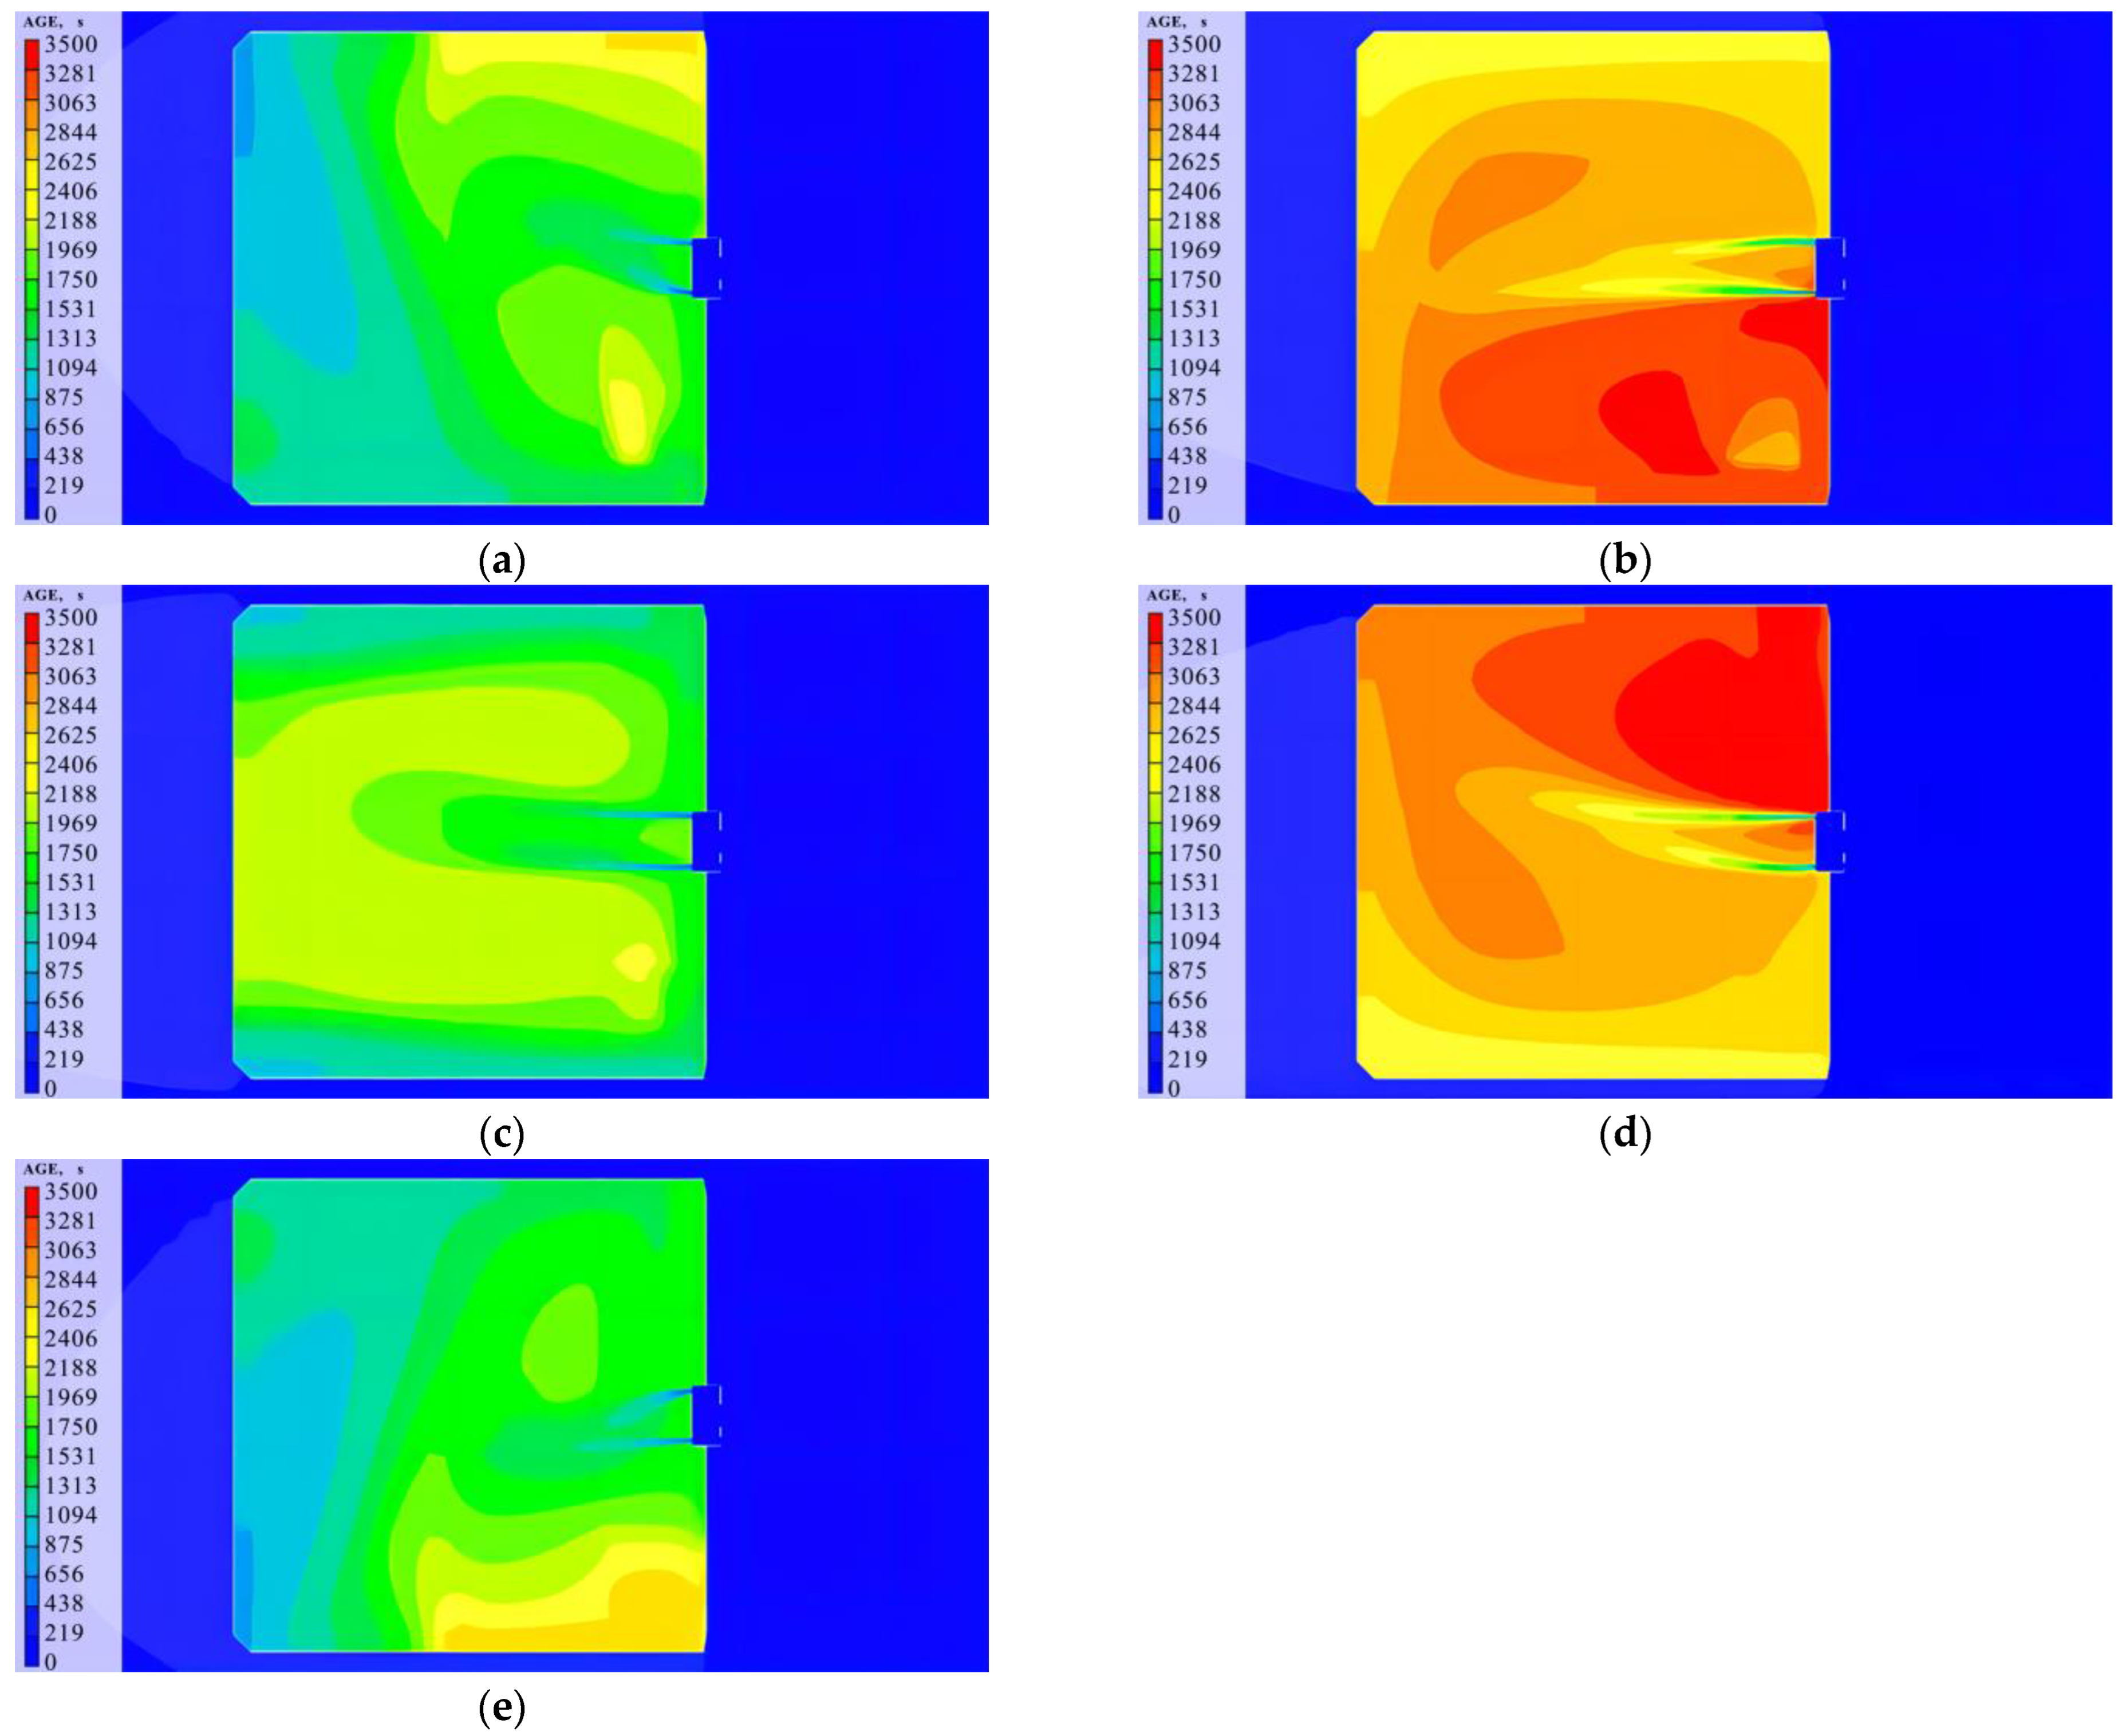
Buildings 14 00344 g039
Figure 40. Air age distribution at 1.5 m height under different outdoor wind directions. (a) Air age cloud diagram at a height of 1.5 m with an outdoor wind direction angle of 60°. (b) Air age cloud diagram at a height of 1.5 m with an outdoor wind direction angle of 30°. (c) Air age cloud diagram at a height of 1.5 m with an outdoor wind direction angle of 0°. (d) Air age cloud diagram at a height of 1.5 m with an outdoor wind direction angle of −30°. (e) Air age cloud diagram at a height of 1.5 m with an outdoor wind direction angle of −60°.
Buildings 14 00344 g040
Figure 41. Air age changes on the central axis of the door bucket under different outdoor wind directions.
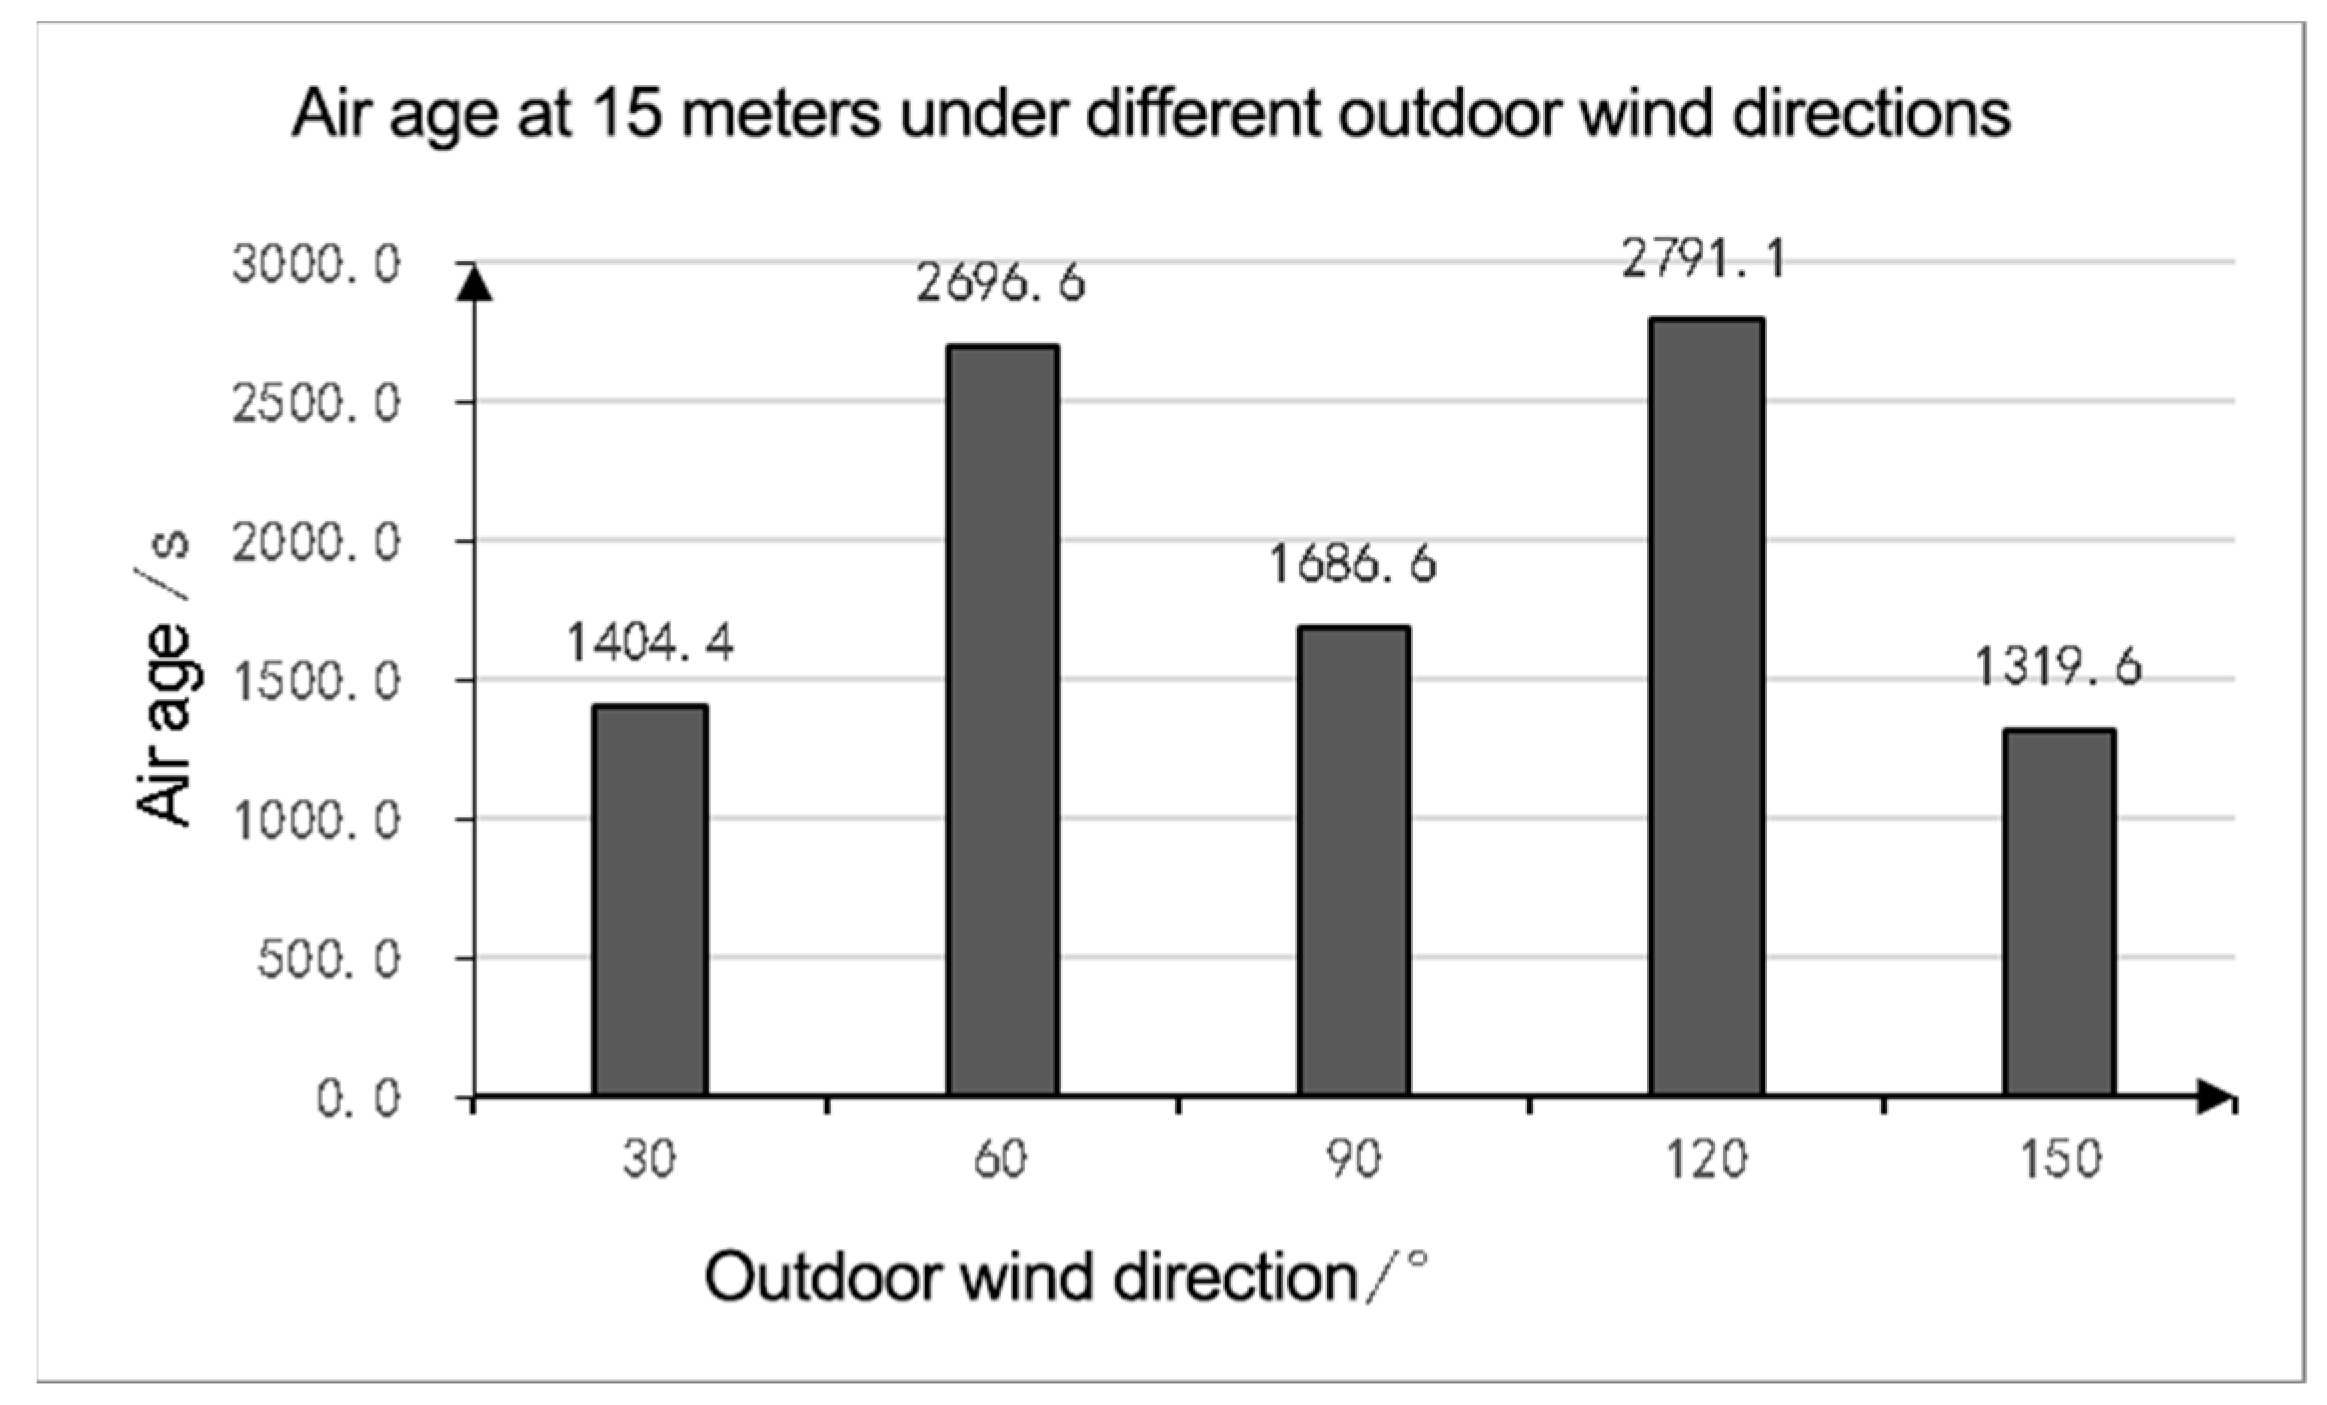
Buildings 14 00344 g041
Figure 42. Indoor air ages at 15 m under different outdoor wind directions.
Buildings 14 00344 g042
Table 1. Indoor design parameters for air conditioning in areas with extended stays by people.
CategoryThermal Comfort LevelTemperature (°C)Relative Humidity (%)Wind Speed (m/s)
Heating conditionsLevel I22–24≥30≤0.2
Level II18–22≤0.2
Cooling conditionsLevel I24–2640–60≤0.25
Level II26–28≤70≤0.3
Table 2. Effects of wind speed on human comfort.
Wind Speed (m/s)Impact on Human Comfort
0–0.25Wind speed too weak to notice
0.25–0.5Less windy and comfortable
0.5–1.0Moderate wind speed, more comfortable
1.0–1.5Windy and slightly uncomfortable
>1.5Excessive wind speed and obvious discomfort
Table 3. Indoor wind speed evaluation criteria.
Wind Speed (m/s)Comfort
0–0.3Comfort
0.3–0.6Moderate
0.6–1.0Slight discomfort
>1.0Discomfort
Table 4. Xianyang climate conditions given in the “Design specifications for heating, ventilation and air conditioning in civil buildings”.
CitySeasonCalculated Ventilation Outdoor Temperature (°C)Average Outdoor Wind Speed (m/s)Maximum Wind DirectionOutdoor Atmospheric Pressure (hPa)
XianyangSummer29.91.7WNW953.1
Winter−0.41.4NW971.7
Table 6. Simulation parameter settings for different door dimensions (m).
Serial NumberSimulated WidthSimulation DepthSimulated Height
Case 19.3 (original)4.7 (original)4.8 (original)
Case 27.34.7 (original)4.8 (original)
Case 311.34.7 (original)4.8 (original)
Case 413.34.7 (original)4.8 (original)
Case 59.3 (original)3.74.8 (original)
Case 69.3 (original)5.74.8 (original)
Case 79.3 (original)6.74.8 (original)
Case 89.3 (original)7.74.8 (original)
Case 99.3 (original)4.7 (original)3.8
Case 109.3 (original)4.7 (original)4.3
Case 119.3 (original)4.7 (original)5.3
Case 129.3 (original)4.7 (original)5.8
Table 7. Six types of door-opening modes.
Door opening formSimulation 1Simulation 2
Buildings 14 00344 i001Buildings 14 00344 i002
Door opening formSimulation 3Simulation 4
Buildings 14 00344 i003Buildings 14 00344 i004
Door opening formSimulation 5Simulation 6
Buildings 14 00344 i005Buildings 14 00344 i006
Table 8. Simulated wind directions.
Wind direction angle (°)6030
Buildings 14 00344 i007Buildings 14 00344 i008
Wind direction angle (°)0–30
Buildings 14 00344 i009Buildings 14 00344 i010
Wind direction angle (°)–60
Buildings 14 00344 i011
Table 9. Comparison of wind speeds in field tests and simulation results.
Distance (m)03691215
Measured wind speed (m/s)0.620.240.210.140.090.09
Simulated wind speed (m/s)0.620.270.170.090.040.03
Table 10. Changes in wind speed change on the central axis of the door bucket (unit: m/s).
Distance (m)−6−303691215
NDB2.602.773.131.380.390.370.380.31
DBB2.372.311.680.320.130.150.360.49
DBM2.492.020.340.150.140.280.520.55
DBE1.930.670.180.130.290.510.580.56
Table 11. Changes in air age on the central axis of the door bucket (unit: s).
Distance (m)03691215
No door bucket92.0939.01557.01576.01561.01543.0
Door bucket built-in 74.3121.51768.81652.31456.41378.9
Door bucket mid-mounted109.71726.21588.61429.11345.61399.0
Door bucket external1708.81603.61386.41237.71308.81422.5
Table 12. Wind speed changes at different width on the central axis of the door bucket (unit: m/s).
Distance (m)−6−303691215
Width = 7.3 m2.552.170.810.130.140.110.370.43
Width = 9.3 m2.492.020.340.150.140.280.520.55
Width = 11.3 m2.472.180.610.160.180.170.210.31
Width = 13.3 m2.432.330.270.110.410.560.470.39
Table 13. Wind speed changes at different depth on the central axis of the door bucket (unit: m/s).
Distance (m)−6−303691215
Depth = 3.7 m2.492.250.360.150.150.350.550.55
Depth = 4.7 m2.492.020.340.150.140.280.520.55
Depth = 5.7 m2.471.700.320.130.140.180.450.53
Depth = 6.7 m2.381.410.280.150.150.110.260.39
Depth = 7.7 m2.341.300.120.550.110.120.170.24
Table 14. Wind speed changes at different height on the central axis of the door bucket (unit: m/s).
Distance (m)−6−303691215
Height = 3.8 m2.482.090.270.150.150.250.500.53
Height = 4.3 m2.482.040.310.160.140.270.510.54
Height = 4.8 m2.492.020.340.150.140.280.520.55
Height = 5.3 m2.492.000.350.150.140.270.510.55
Height = 5.8 m2.491.980.360.140.140.260.510.55
Table 15. Air age change on the central axis of the door bucket (unit: s).
Distance (m)03691215
Width = 7.3 m84.41587.31408.41200.71162.71261.2
Width = 9.3 m109.71726.21588.61429.11345.61399.0
Width = 11.3 m84.51701.51625.81538.31480.11397.7
Width = 13.3 m58.163.0143.21724.01543.11700.0
Table 16. Air age changes at different depth on the central axis of the door bucket (unit: s).
Measurement Point Distance (m)03691215
Depth = 3.7 m93.51687.91536.21374.01337.21416.5
Depth = 4.7 m109.71726.21588.61429.11345.61399.0
Depth = 5.7 m140.81763.01666.81543.11373.21374.6
Depth = 6.7 m137.11776.51686.81619.51485.31460.8
Depth = 7.7 m198.8147.41722.01651.11532.71467.3
Table 17. Air age changes at different height on the central axis of the door bucket (unit: s).
Distance (m)03691215
Height = 3.8 m106.01734.71630.41475.01366.11416.9
Height = 4.3 m104.01730.41593.21432.31351.51407.2
Height = 4.8 m109.71726.21588.61429.11345.61399.0
Height = 5.3 m107.71722.41592.81432.81343.71395.8
Height = 5.8 m116.51722.81595.01433.91335.21380.2
Table 18. Wind speed changes under different door opening modes on the central axis of the door bucket (unit: m/s).
Serial Number−6 m−3 m0 m3 m6 m9 m12 m15 m
Simulation 12.552.421.141.310.720.450.320.29
Simulation 22.481.930.250.080.210.230.290.30
Simulation 31.001.050.850.360.330.310.270.26
Simulation 42.512.260.720.140.150.150.160.16
Simulation 52.492.130.450.080.120.160.190.19
Simulation 62.502.160.480.160.150.160.170.17
Table 19. Air age changes on the central axis of the door bucket (unit: s).
Serial Number0 m3 m6 m9 m12 m15 m
Simulation 173.4169.8676.41289.11726.41802.3
Simulation 2166.61530.81189.71225.21367.91484.8
Simulation 3784.11669.51891.31942.11965.81967.0
Simulation 482.71735.91739.01760.01796.81811.8
Simulation 583.31761.41719.81676.51660.31660.0
Simulation 688.81764.81764.51768.01778.31786.0
Table 20. Wind speed changes on the central axis of the door bucket (unit: m/s).
Angle−6 m−3 m0 m3 m6 m9 m12 m15 m
60°2.492.000.320.160.130.300.520.53
30°1.661.540.490.150.180.200.230.26
0.300.410.660.150.180.220.280.32
−30°1.671.580.310.100.170.190.230.26
−60°2.512.070.240.160.120.420.600.58
Table 21. Air age changes on the central axis of the door bucket (unit: s).
Angle0 m3 m6 m9 m12 m15 m
60°113.01666.81532.71360.11319.41404.4
30°97.82852.82815.32782.42724.82696.6
64.11813.11795.51764.41714.61686.6
−30°108.03001.73000.32927.52834.62791.1
−60°133.21616.21487.11258.31236.61319.6
Disclaimer/Publisher’s Note: The statements, opinions and data contained in all publications are solely those of the individual author(s) and contributor(s) and not of MDPI and/or the editor(s). MDPI and/or the editor(s) disclaim responsibility for any injury to people or property resulting from any ideas, methods, instructions or products referred to in the content.

