Abstract
With the widespread construction of the subway in the Chinese mainland, the environmental vibration caused by subway operation has attracted increasing attention. Train-induced environmental vibrations can cause structural deformation, uneven settlement of line foundations, and tunnel leakage, affecting the structural safety of lines and foundations. This research focuses on a segment of the Nanchang Metro Line 3, which has been chosen as the subject of investigation. A numerical model was developed to analyze the subway train-induced environmental vibration, employing the finite element method (FEM). Utilizing a numerical model, an investigation was conducted to examine the impact of train speed on the subway train-induced environmental vibration, the train-induced environmental vibration transmission characteristics were analyzed, and the control effects of vibration reduction tracks on train-induced environmental vibration were discussed. Train-induced vibration tests were also conducted on Nanchang Metro Line 3 to verify the control effects of various vibration reduction tracks. The results indicate that the subway train-induced environmental vibration rises as the train speed goes up, and the vibration peaks always appear around 63 Hz. When the train speed doubles, the Z-vibration level increases from about 5.1 dB to 5.9 dB. Subway train-induced environmental vibration shows a fluctuating decreasing trend with increasing distance from the centerline of the tunnel. The Z-vibration level reaches its maximum 4 m away from the centerline of the tunnel. Compared with the embedded sleeper, the vibration-damping fastener exhibits a vibration reduction effect of about 9 dB to 18 dB, the rubber vibration-damping pad exhibits a better vibration reduction effect of about 16 dB to 24 dB, and the steel spring floating plate exhibits the best vibration-damping effect of about 18 dB to 28 dB. The calculated Z-vibration levels are basically consistent with the measured values, indicating the accuracy of the calculated results of the control effects of the vibration reduction tracks.
1. Introduction
With the widespread construction of the subway in the Chinese Mainland, the environmental vibration caused by subway operation has attracted increasing attention. During the operation of subway trains, the wheel–rail roughness can cause severe dynamic interaction between the track and the train, leading to vibration of the train systems and track structures. The vibration is transmitted to the area near the line through the track, which, in turn, causes vibration of the soil, ground, and buildings. Train-induced environmental vibrations can cause structural deformation, uneven settlement of line foundations, and tunnel leakage, which can affect the structural safety of lines and foundations. Therefore, train-induced environmental vibration is an unavoidable and important issue in subway operation and development.
With the successive appearance of many numerical computation methods, such as the infinite element method (IFEM), finite element method (FEM), and boundary element method (BEM), numerical calculation methods have been widely used for solving the dynamic problems of tunnel–soil systems. Due to its advantages of clear physical concepts, wide applicability, versatility, and ease of implementation, the FEM has been applied in a large number of theoretical studies on environmental vibration caused by subway train movements. Chua et al. [1,2] developed a two-dimensional (2D) finite element (FE) model to analyze the vibration response of tunnels, buildings, and soils under train loading. Jones et al. [3] developed a 2D coupled finite element–boundary element model (FE–BE model) to analyze the train-induced environmental vibration in a tunnel. Ma et al. [4] investigated the characteristics of vibration sources near subway tunnels and the propagation patterns of vibration waves in soil layers and ground surface by conducting on-site vibration measurements. Then, 2D numerical models under field conditions were established using an FE model to investigate how the parameters of the vibration isolation system of utilizing pile barriers, a widely used vibration mitigation measure in tunnels, affect its properties. Hussein et al. [5] analyzed the traffic-induced building vibration in a tunnel using the substructure method, combining a PiP model of a tunnel–soil system with a 2D frame beam FE model of the building. Hesami et al. [6] used 2D FE model analysis to simulate train movement and its impact on neighboring buildings. Lan et al. [7] combined Padé approximation-based preview repetitive control (POPRC) with equivalent input disturbances (EID) to improve track performance and obtained a simplified POPRC law with EID in the original system, illustrating the robustness and validity of the controller. When analyzed with a 2D FE model, the dynamic parameters of the system and the train loads need to be processed in an equivalent or simplified manner, which will inevitably lead to a large discrepancy between the calculation results and the actual situation. However, tunnel–soil systems are generally very complex, and it is difficult to accurately predict the train-induced environmental vibration using a 2D FE model. To perform quantitative analysis, it is more advantageous to perform calculations with a three–dimensional (3D) FE model. Zhang et al. [8] developed a 3D model of the interaction between the soil and the pile foundation for the purpose of exploring the structural and ground vibrations that are generated by trains operating on viaducts. Dai et al. [9] employed a semi-analytical approach to develop a 3D model of the train–rail–tunnel–ground system and proceeded to analyze the amplitude–frequency characteristics and the spread rule of the environmental vibration that was generated by train operations within underground high–speed railroads. Kouroussis et al. [10,11] established a time-domain track–train vertical coupled dynamics model and a track–soil–structure 3D model, and used joint simulation methodologies and step–by–step calculations to examine the vibration of the building and the ground brought on by passing of the train, respectively. Author He and his colleagues [12,13] developed a 3D analytical model. The purpose of this model was to predict the ground vibration of two fully spaced embedded parallel tunnels. They also analyzed the vibration fields generated at different frequencies and with different soil properties. Sun et al. [14] investigated the X–section cast-in-place concrete (XCC) pile raft (BTXPR for short) foundations buried in air-dry sand and saturated sandy subsoil, respectively. The vibration speed response was measured and analyzed at different cyclic loading frequencies. Measurement shows that the size and change of the vibration speed of the BTXPR foundation are closely related to the saturation of the bottom subsoil. Khajehdezfuly et al. [15] evaluated the vibration induced by the concurrent transit of rail and road vehicles, analyzed the effect of different parameters on the vibrations, and conducted comprehensive field tests. Ma et al. [16] established a 3D model of building–soil–tunnel–track system and analyzed the vibration effects of train passage on the ancient buildings of Xi’an Bell Tower by using the train loads calculated as the external load input. Zhai et al. [17,18] calculated the train dynamic load as an external load input applied to a 3D model of a soil–building system and investigated the vibration of soil, ground, and a subway superstructure caused by train operation. Fiala et al. [19] developed a 3D coupled FE–BE model for calculating the effect of high–speed train operation on the ground on the vibration of buildings along the route. Wu et al. [20] investigated the seismic isolation effect of RSM seismic isolation pads for different site classes. The main influencing factors included base pressure, seismic excitation intensity, and liner thickness. The study showed that the seismic isolation performance increased with seismic excitation intensity, base pressure, and liner thickness.
The noise which is produced by the running of a rail transit system is a prominent problem that bothers residents residing along the railway line [21]. An increasing number of acoustic metamaterials have been studied in recent years with the aim of diminishing the consequences of secondary noise alongside railroads. Talebitooti et al. [22] used the Biot theory to model porous elastic materials—which consider three types of wave propagation, including two compression terms and one shear term—to investigate the effect of embedded porous cores on structural sound transmission loss (STL). Acoustic metamaterials have also been used in noise reduction in rail transportation. Amadasi et al. [23] explored the reduction in train noise in urban areas by miniature sound barriers made of metamaterials and optimized their acoustic design. Zhang et al. [24] elaborated an active control system which can directly apply control torques or moments to the target structures with the properties of rotational motion or vibration and discussed its theory, modeling, comprehensive parameter analysis, and case studies for the flutter vibration control of bridges as well as its application prospects in various other occasions. Many researchers have undertaken investigations into the simulation and prediction of vibrations caused by subway operation. However, the subway train-induced environmental vibration characteristics are not yet clear, and the vibration problem has not been effectively controlled. Consequently, within this paper, a specific tunnel section along Nanchang Metro Line 3 has been designated as the research focus. Employing the FEM, a numerical model dedicated to simulating train-induced environmental vibration has been constructed. Based on the numerical model, the influence of train speed on train-induced environmental vibration was studied, the train-induced environmental vibration transmission characteristics were analyzed, and the control effects of vibration reduction tracks on train-induced environmental vibration were discussed. Vibration tests induced by trains were additionally conducted on Nanchang Metro Line 3 for the purpose of verifying the control effects of diverse vibration reduction tracks.
2. Numerical Model
2.1. Wheel–Rail Interaction Model
When a train runs on rails, it is affected by the roughness of the rails and the wheels, resulting in interaction forces between them, namely wheel–rail forces. Under the action of wheel–rail forces, the rail vibrates, and the vibration energy is transmitted to the tunnel and surrounding soil through the track, thereby causing vibration of the tunnel and surroundings soil. A wheel–rail interaction model was first established based on the dynamic flexibility method, as shown in Figure 1, with the basic equation shown below [25]:
where F represents the wheel–rail forces; ω represents the circular frequency, unit: rad/s; R represents the wheel–rail roughness; and Yc, Yw, and Yr denote the dynamic flexibility of the wheel–rail contact spring, the wheel, and the rail, respectively.

Figure 1.
Schematic diagram of train–track coupling vibration analysis model.
The wheel–rail roughness spectrum given by the ISO3095:2005 standard [26] was chosen as the excitation of the model of wheel–rail interaction as illustrated in Figure 2.
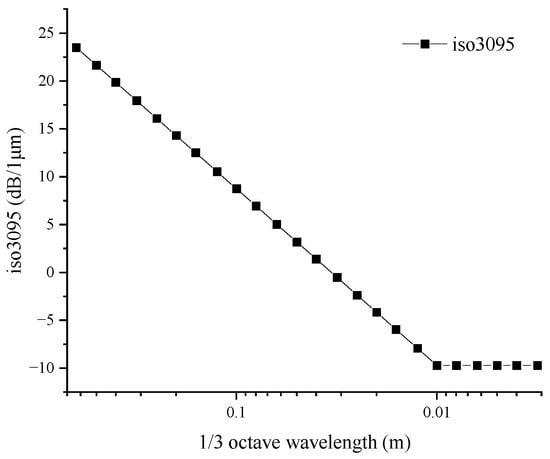
Figure 2.
Rail roughness spectrum.
The wheel–rail forces on track types such as rubber vibration-damping pads, steel spring floating plates, vibration-damping fasteners, and embedded sleepers were calculated using the wheel–rail interaction model. Table 1 shows the parameters that are used for calculating the track structures.

Table 1.
The parameters utilized for the calculation of the track structures.
2.2. Train-Induced Environmental Vibration Model
By using the FEM for structural vibration calculation, the responses of the node acceleration, velocity, and displacement of the structure over time subjected to moving loads can be obtained. The basic equation is as follows:
where K, C, and M are the stiffness matrix, damping matrix, and structural mass matrix, respectively; , , and are the system vibration displacement, velocity, and acceleration, respectively, and F represents the wheel–rail forces.
A representative section of Nanchang Metro Line 3 was selected as the research object. According to the details of the soil layer distribution in the design data, the longitudinal geological profile along the line, and the mechanical properties and physical of the foundation soil, the soil layers used for finite element calculation were simplified to six layers. Table 2 presents the calculation parameters.

Table 2.
Soil layer calculation parameters.
As illustrated in Figure 3, a numerical model of train-induced environmental vibration was established using the FEM. The cross-section of the tunnel is circular, with CHN60 rails and sleepers embedded in an integral track bed, an outer diameter of 6 m, a lining thickness of 0.3 m, an inner diameter of 5.4 m, and a tunnel burial depth of 10 m. In the model, the rail was represented through the utilization of spatial beam elements; the fasteners were simulated using spring-damping elements; shell elements were used to model the tunnel lining; and the soil layers and foundation of the tunnel were simulated using solid elements. To reduce the number of elements and improve computational efficiency, a semi-model of the tunnel–soil structure was established based on symmetry. Symmetry constraints were applied on the symmetry plane, and the bottom of the model was fixed, while the front and right sides were equipped with equivalent viscoelastic boundaries. The parameters utilized for the calculations pertaining to the tunnel and track are presented in Table 3.
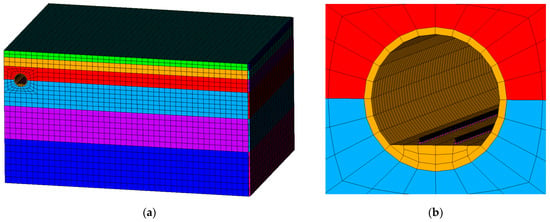
Figure 3.
Numerical model of train-induced environmental vibration: (a) overall model diagram; (b) partial enlarged view of the subway tunnel.

Table 3.
Track and tunnel calculation parameters.
Figure 4 presents a schematic diagram illustrating the calculation points, while Table 4 provides a detailed enumeration of their respective locations.
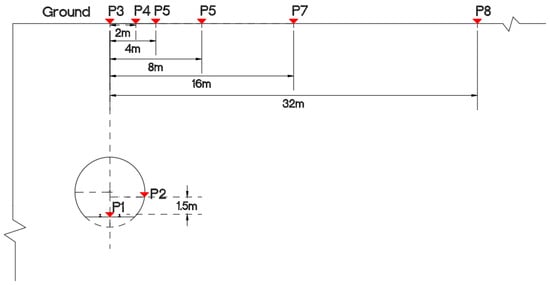
Figure 4.
A schematic diagram of the calculation points.

Table 4.
The locations of the calculation points.
3. Vibration Characteristics
The train-induced vibration responses passing through a subway tunnel with embedded sleepers at speeds of 60 km/h, 80 km/h, 100 km/h, 120 km/h, 140 km/h, and 160 km/h were computed using the aforementioned numerical model. Based on the calculated results, the influence of train speed on the subway train-induced environmental vibration characteristics was studied, and the vibration transmission characteristics were analyzed.
The formula for calculating the vibration acceleration level (VAL) can be written as follows:
where a is the RMS value of vibration acceleration, a0 is the reference acceleration, and a0 = 1 × 10⁻⁶ m/s2.
Z-vibration level is the VAL corrected by the Z-weighting factors according to ISO 2631-1:1997 [27]. Z-weighting factors at center frequencies of 1/3 octave band are listed in Table 5.

Table 5.
Z-weighting factors at center frequencies of 1/3 octave band.
3.1. Influence of Train Speed
Figure 5 presents the spectra of wheel–rail force amplitudes at various train speeds. It can be observed that the trends of wheel–rail force variation with changing frequency are almost the same at varying speeds of the train. The maximum values of the wheel–rail forces in the frequency domain are 4.60, 5.99, 7.37, 8.72, 10.05, and 11.37 kN for train speeds of 60, 80, 100, 120, 140, and 160 km/h, respectively, and they all occur at 65 Hz.
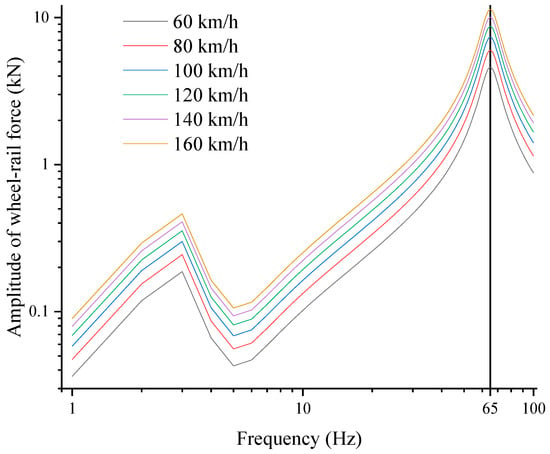
Figure 5.
Spectra of wheel–rail force amplitudes at different speeds.
Figure 6 illustrates the Z-vibration level spectra of typical points resulting from the passage of the train through the subway tunnel at different speeds. The analysis indicates that the subway train-induced vibrations at various points increase in conjunction with an elevation in train speed, and the vibration peaks always appear around 63 Hz. This is because the peaks of wheel–rail forces always occur in the frequency band of 63 Hz.
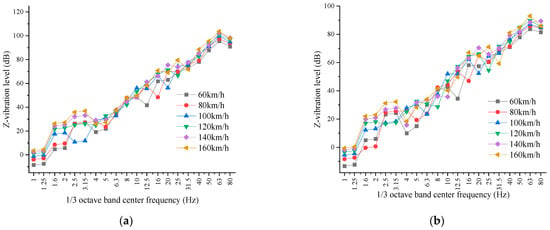
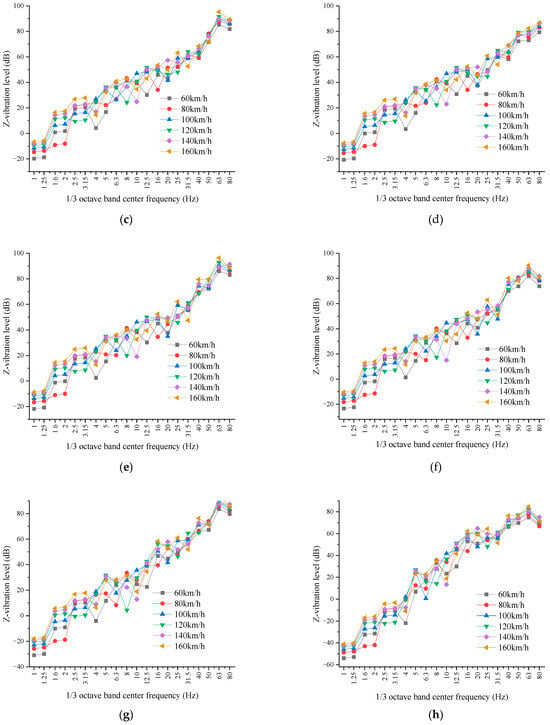
Figure 6.
The Z-vibration-level spectra of typical points caused by the train passing through the subway tunnel at different speeds: (a) P1; (b) P2; (c) P3; (d) P4; (e) P5; (f) P6; (g) P7; (h) P8.
To analyze further the influence that train speed has on the environmental vibration characteristics generated by subway trains, the linear fittings of the relationship between Z-vibration levels at different points and the base-10 logarithm of the train speed are shown in Figure 7.
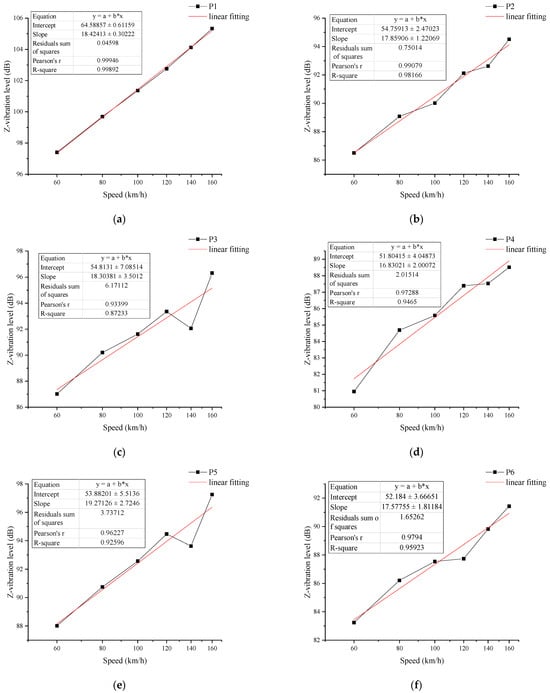
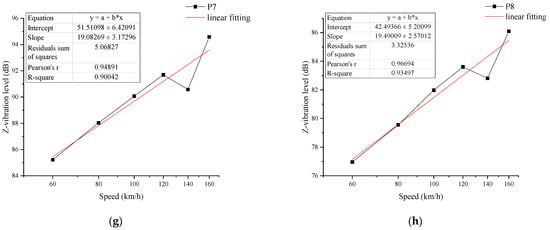
Figure 7.
The linear fittings of the relationship between Z-vibration levels and the base-10 logarithm of the train speed: (a) P1; (b) P2; (c) P3; (d) P4; (e) P5; (f) P6; (g) P7; (h) P8.
According to the linear fittings in Figure 7, the Z-vibration levels at different points can be expressed as follows:
where and represent the Z-vibration levels of the point Pi at speeds of v and v0; denotes the speed correction; and can be written as follows:
where is the slope of the linear fitting of the relationship between Z-vibration level at the point Pi and the base-10 logarithm of the train speed.
In accordance with the aforementioned formulas, the Z-vibration level at the point Pi increases by about dB when the train speed doubles. Based on the linear fitting results in Figure 7, it can be concluded that when the train speed doubles, the Z-vibration level increases from about 5.1 dB to 5.9 dB.
3.2. Vibration Transmission Characteristics
Figure 8 shows the Z-vibration level spectra at various points resulting from the train’s passage in the subway tunnel at speeds of 60, 80, 100, 120, 140, and 160 km/h. At different train speeds, the patterns of Z-vibration level variation with frequency at various points are generally consistent, with vibration peaks occurring around 63 Hz. The maximum vibration occurs at P1 on the track bed, and the minimum vibration occurs at P8, which is located 32 m from the centerline of the tunnel.
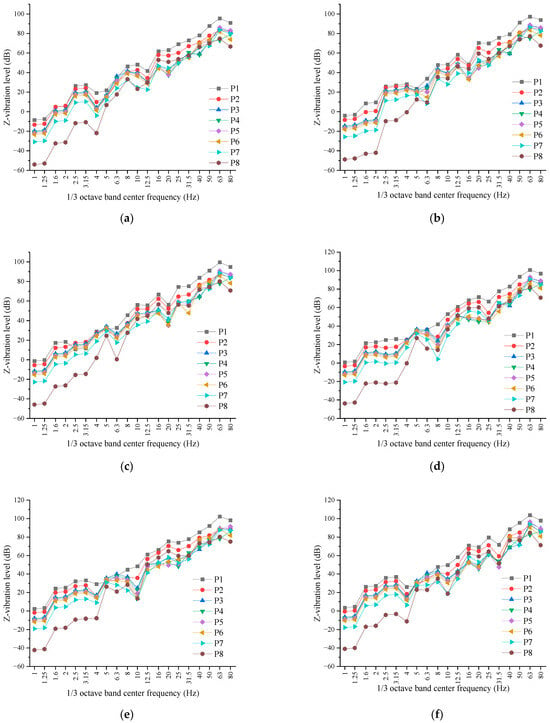
Figure 8.
The Z-vibration level spectra at various points caused by the train passing through the subway tunnel at different speeds: (a) 60 km/h; (b) 80 km/h; (c) 100 km/h; (d) 120 km/h; (e) 140 km/h; (f) 160 km/h.
Figure 9 shows the variation curves of subway train-induced ground vibration with changing distance at speeds of 60, 80, 100, 120, 140, and 160 km/h. The train-induced ground vibration passing through the subway tunnel at different speeds shows a fluctuating decreasing trend with increasing distance from the centerline of the tunnel. The Z-vibration level reaches its maximum 4 m away from the centerline of the tunnel and its minimum 32 m away from it. This phenomenon is associated with the propagation path of vibration waves through the foundation soil. The vibration waves induced by rail transportation mainly propagate in the form of longitudinal, transverse, and Rayleigh waves, in which Rayleigh waves are superimposed by transverse and longitudinal waves. The propagation trajectory is not a straight line but an ellipse, so the localized peaks on the surface are related to the superposition propagation effect of Rayleigh waves.
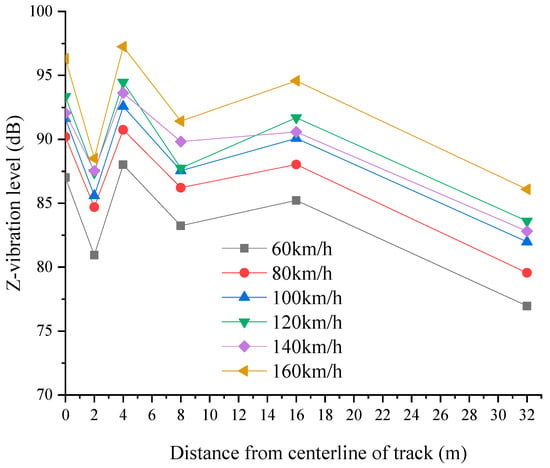
Figure 9.
The variation curves of subway train-induced ground vibration with changing distance at speeds of 60, 80, 100, 120, 140, and 160 km/h.
4. Vibration Control
4.1. Numerical Analysis
Based on the numerical model, the ground vibrations that are produced when the train travels through a subway tunnel furnished with embedded sleepers, steel spring floating plates, vibration-damping fasteners, and rubber vibration-damping pads at a speed of 80 km/h were calculated. Based on the calculated results, research on vibration control measures for subway tunnels was carried out.
The Z-vibration level spectra at various points with different tracks are shown in Figure 10. Compared with the embedded sleepers, the steel spring floating plates, vibration-damping fasteners, and rubber vibration-damping pads all show good vibration reduction effects. Among the three types of vibration reduction tracks, the steel spring floating plates are the most effective when it comes to vibration reduction, followed by rubber vibration-damping pads, and the vibration-damping fasteners are the least effective.
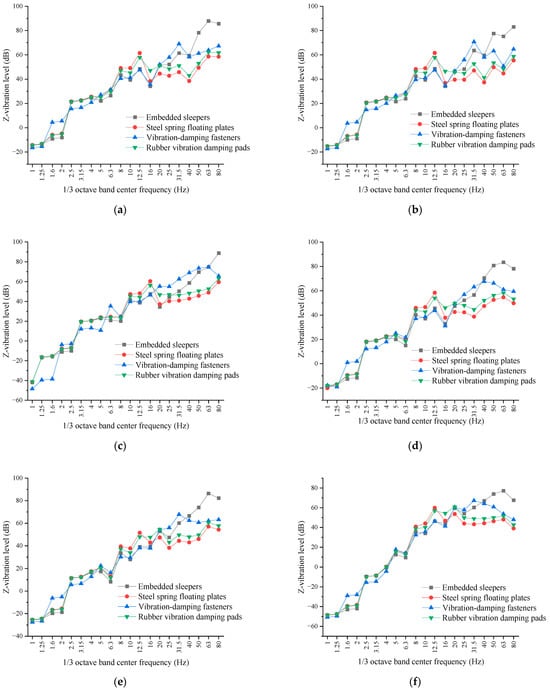
Figure 10.
The Z-vibration level spectra at various points with different tracks: (a) P3; (b) P4; (c) P5; (d) P6; I P7; (f) P8.
In order to quantitatively analyze the vibration reduction effect of different vibration reduction tracks, Table 6 provides the Z-vibration levels at various points on different tracks, and Table 7 presents the effects of vibration reduction that different vibration reduction tracks have on various points.

Table 6.
The Z-vibration levels at various points on different tracks (unit: dB).

Table 7.
Vibration reduction effects of different vibration reduction tracks at various points (unit: dB).
Compared with the embedded sleepers, the vibration-damping effect of vibration-damping fasteners is about 9 dB to 18 dB, that of rubber vibration-damping pads is about 16 dB to 24 dB, and that of steel spring floating plates is about 18 dB to 28 dB.
4.2. Test Verification
For the purpose of validating the computational outcomes regarding the vibration-damping effects of various vibration-damping tracks, sections with steel spring floating plates, rubber vibration-damping pads, and embedded sleepers were selected on Nanchang Metro Line 3 to conduct tests of train-induced vibration, as shown in Figure 11. Accelerometers were positioned on the tunnel wall 1.5 m above the rail surface, i.e., point P2, to record the vibration caused by the train passing at a speed of about 80 km/h.
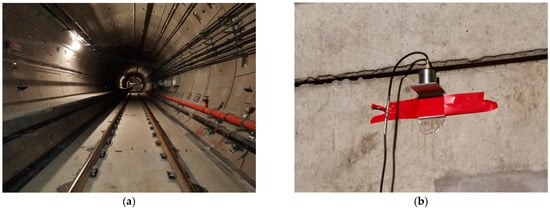
Figure 11.
Test photos: (a) a test section; (b) an accelerometer installed on the tunnel wall.
Figure 12 compares the measured and calculated values of train-induced vibration at point P2. Obviously, the measured values of the Z-vibration levels essentially conform to the calculated values, indicating the accuracy of the calculated results of the vibration reduction tracks.
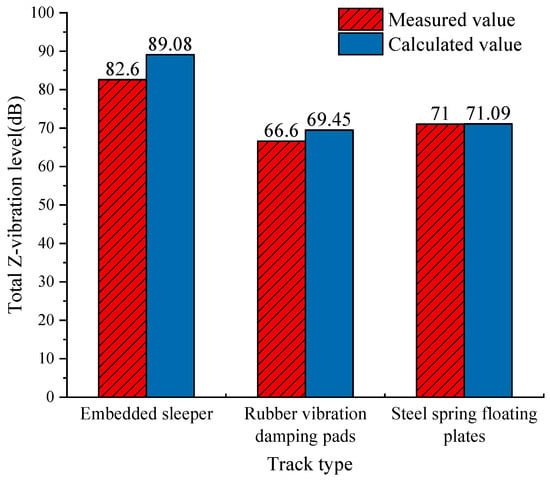
Figure 12.
Comparison between the calculated and measured values of Z-vibration levels at P2.
4.3. Discussion
To further verify the feasibility of the vibration control measures, the environmental vibration limits specified in the Standard of vibration in urban area environment (GB 10070-1988) [28] for each type of urban area are listed in Table 8.

Table 8.
Z-vibration level limits for various types of urban areas (unit: dB).
By comparing the ground vibration on different vibration reduction tracks with the vibration limits in Table 8, it can be seen that, for tracks with embedded sleepers, only the vibration at point P8 meets the vibration limits for the area along both sides of the trunk rail line, while the vibrations at other points all exceed the limits. On tracks with vibration-damping fasteners, the vibrations at all points on the ground basically meet the vibration limits for areas used for mixed purposes and commercial centers, industrial areas, and areas along both sides of the trunk line. On tracks with rubber vibration-damping pads, the vibrations at points P3 and P5 meet the vibration limits for residential areas and areas used for cultural and educational purposes, while other points on the ground meet the vibration limits of special residential areas. On tracks with steel spring floating plates, the vibrations at all points on the ground basically meet the vibration limits of special residential areas.
5. Conclusions
In this study, a tunnel section of Nanchang Metro Line 3 was selected as the research object, and a numerical model of train-induced environmental vibration was established using the FEM. The numerical model was used to investigate the effect of train speed on train-induced environmental vibration, the train-induced environmental vibration transmission characteristics were analyzed, and the control effects of vibration reduction tracks on train-induced environmental vibration were discussed. Train-induced vibration tests were also conducted on Nanchang Metro Line 3 to verify the calculated effects of various vibration reduction tracks. The following are the primary conclusions:
- (1)
- Subway train-induced environmental vibration enhances with an increase in train speed, and the vibration peaks always appear around 63 Hz. When the train speed doubles, the Z-vibration level increases from approximately 5.1 dB to 5.9 dB.
- (2)
- Subway train-induced ground vibration exhibits a fluctuating reduction trend as distance from the centerline of the tunnel increases. The Z-vibration level reaches its maximum at 4 m away from the centerline of the tunnel.
- (3)
- Compared with embedded sleepers, vibration-damping fasteners have a vibration reduction effect of about 9 dB to 18 dB, rubber vibration-damping pads have a better vibration reduction effect of about 16 dB to 24 dB, and steel spring floating plates have the best vibration reduction effect of about 18 dB to 28 dB.
- (4)
- The calculated Z-vibration levels are basically consistent with the measured ones, indicating the accuracy of the calculated results of the control effects of the vibration reduction tracks.
This research has a certain reference value for subway vibration control, and research will be conducted on the active control of subway vibration in the future.
Author Contributions
Conceptualization, L.S. and Q.L.; methodology, L.S. and X.X.; software, X.X.; validation, H.Z. and Y.Z.; formal analysis, X.X.; data curation, X.X.; writing—original draft preparation, L.S.; writing—review and editing, Q.L.; project administration, Q.L.; funding acquisition, L.S. All authors have read and agreed to the published version of the manuscript.
Funding
This research was funded by the China Postdoctoral Science Foundation, grant numbers 2023T160214 and 2023M731077, and the Natural Science Foundation of Jiangxi Province, grant numbers 20224BAB214074 and 20232BAB204087.
Data Availability Statement
The data presented in this study are available on request from the corresponding author.
Conflicts of Interest
The authors declare no conflicts of interest.
References
- Chua, K.H.; Balendera, T.; Lo, K.W. Ground-borne vibrations due to trains in tunnels. Earthq. Eng. Struct. D 1992, 21, 445–460. [Google Scholar] [CrossRef]
- Chua, K.H.; Lo, K.W.; Balendra, T. Building response due to subway train traffic. Int. J. Geotech. Eng. 1995, 121, 747–754. [Google Scholar] [CrossRef]
- Jones, C.J.C.; Thompson, D.J.; Petyt, M. A model for ground vibration from railway tunnels. Proc. Inst. Civil. Eng.-Transp. 2002, 153, 121–129. [Google Scholar] [CrossRef]
- Ma, X.F.; Cao, M.Y.; Gu, X.Q.; Zhang, B.M.; Yang, Z.H.; Guan, P.F. Vibration-isolation performance of a pile barrier in an area of soft soil in shanghai. Shock Vib. 2020, 2020, 8813476. [Google Scholar] [CrossRef]
- Hussein, M.; Hunt, H.; Kuo, K.; Costa, P.A.; Barbosa, J. The use of sub-modeling technique to calculate vibration in buildings from underground railways. Proc. Inst. Mech. Eng. F-J. Ral. 2015, 229, 303–314. [Google Scholar] [CrossRef]
- Hesami, S.; Ahmadi, S.; Ghalesari, A.T. Numerical modeling of train-induced vibration of nearby multi-story building: Case study. KSCE J. Civ. Eng. 2016, 20, 1701–1713. [Google Scholar] [CrossRef]
- Lan, Y.H.; Zhao, J.Y. Improving Track Performance by Combining Padé-Approximation-Based Preview Repetitive Control and Equivalent-Input-Disturbance. J. Electr. Eng. Technol. 2024, 19, 3781–3794. [Google Scholar] [CrossRef]
- Zhang, Z.J.; Li, X.Z.; Zhang, X.; Fan, J.; Xu, G.H. Semi-analytical simulation for ground-borne vibration caused by rail traffic on viaducts: Vibration-isolating effects of multi-layered elastic supports. J. Sound Vib. 2022, 516, 116540. [Google Scholar] [CrossRef]
- Dai, F.; Yang, J.Z.; Bi, L.X.; Liu, Y.T. Analysis on characteristics of ground vibration induced by underground high-speed trains based on in-situ test. J. Low Freq. Noise Vib. Act. Control 2024, 43, 1097–1111. [Google Scholar] [CrossRef]
- Kouroussis, G.; Connolly, D.; Alexandrou, G.; Vogiatzis, K. Railway ground vibrations induced by wheel and rail singular defects. Veh. Syst. Dyn. 2015, 53, 1500–1519. [Google Scholar] [CrossRef]
- Olivier, B.; Verlinden, O.; Kouroussis, G. A vehicle/track/soil model using co-simulation between multibody dynamics and finite element analysis. Int. J. Rail Transp. 2020, 8, 135–158. [Google Scholar] [CrossRef]
- He, C.; Zhou, S.H.; Guo, P.J.; Di, H.G.; Zhang, X.H. Analytical model for vibration prediction of two parallel tunnels in a full-space. J. Sound Vib. 2018, 423, 306–321. [Google Scholar] [CrossRef]
- He, C.; Zhou, S.H.; Di, H.G.; Guo, P.J.; Xiao, J.H. Analytical method for calculation of ground vibration from a tunnel embedded in a multi-layered half-space. Comput. Geotech. 2018, 99, 149–164. [Google Scholar] [CrossRef]
- Sun, G.C.; Kong, G.Q.; Liu, H.L.; Amenuvor, A.C. Vibration velocity of X-section cast-in-place concrete (XCC) pile-raft foundation model for a ballastless track. Can. Geotech. J. 2017, 54, 1340–1345. [Google Scholar] [CrossRef]
- Khajehdezfuly, A.; Shiraz, A.A.; Sadeghi, J. Assessment of vibrations caused by simultaneous passage of road and railway vehicles. Appl. Acoust. 2023, 211, 109510. [Google Scholar] [CrossRef]
- Ma, M.; Li, W.; Qian, C.Y.; Deng, G.H.; Li, Y.D. Study of the train-induced vibration impact on a historic bell tower above two spatially overlapping metro lines. Soil Dyn. Earthq. Eng. 2016, 81, 58–74. [Google Scholar] [CrossRef]
- Zhai, W.M.; He, Z.X.; Song, X.L. Prediction of high-speed train induced ground vibration based on train-track ground system model. Earthq. Eng. Eng. Vibr. 2010, 9, 545–554. [Google Scholar] [CrossRef]
- Yang, J.J.; Zhu, S.Y.; Zhai, W.M.; Kouroussis, G.; Wang, Y.; Wang, K.Y.; Lan, K.; Xu, F.Z. Prediction and mitigation of train-induced vibrations of large-scale building constructed on subway tunnel. Sci. Total Environ. 2019, 668, 485–499. [Google Scholar] [CrossRef]
- Fiala, P.; Degrande, G.; Augusztinovicz, F. Numerical modeling of ground-borne noise and vibration in buildings due to surface rail traffic. J. Sound Vib. 2007, 301, 718–738. [Google Scholar] [CrossRef]
- Wu, M.T.; Tian, W.H.; He, J.; Liu, F.C.; Yang, J. Seismic isolation effect of rubber-sand mixture cushion under different site classes based on a simplified analysis model. Soil Dyn. Earthq. Eng. 2023, 166, 107738. [Google Scholar] [CrossRef]
- Zou, C.; Wang, Y.M.; Tao, Z.Y. Train-induced building vibration and radiated noise by considering soil properties. Sustainability 2020, 12, 937. [Google Scholar] [CrossRef]
- Talebitooti, R.; Zarastvand, M.R. The effect of nature of porous material on diffuse field acoustic transmission of the sandwich aerospace composite doubly curved shell. Aerosp. Sci. Technol. 2018, 78, 157–170. [Google Scholar] [CrossRef]
- Amadasi, G.; Iannace, G.; Bevilacqua, A. City-Train noise reduction in urban area by using acoustic mini-screens made of metamaterials. In Proceedings of the Inter-Noise 2023, Chiba, Tokyo, Japan, 20–23 August 2023. [Google Scholar]
- Zhang, C.W. The active rotary inertia driver system for flutter vibration control of bridges and various promising applications. Sci. China Technol. Sci. 2023, 66, 390–405. [Google Scholar] [CrossRef]
- Wu, T.; Thompson, D.J. Vibration analysis of railway track with multiple wheels on the rail. J. Sound Vib. 2001, 239, 69–97. [Google Scholar] [CrossRef]
- ISO3095:2005; Railway Applications-Acoustics-Measurement of Noise Emitted by Railbound Vehicles. International Organization for Standardization: Geneva, Switzerland, 2005.
- ISO2631-1:1997; Mechanical Vibration and Shock-Evaluation of Human Exposure to Whole-Body Vibration-Part 1: General Requirements. International Organization for Standardization: Geneva, Switzerland, 1997.
- GB 10070-1988; Standard of Vibration in Urban Area Environment. Ministry of Ecology and Environment: Beijing, China, 1988.
Disclaimer/Publisher’s Note: The statements, opinions and data contained in all publications are solely those of the individual author(s) and contributor(s) and not of MDPI and/or the editor(s). MDPI and/or the editor(s) disclaim responsibility for any injury to people or property resulting from any ideas, methods, instructions or products referred to in the content. |
© 2024 by the authors. Licensee MDPI, Basel, Switzerland. This article is an open access article distributed under the terms and conditions of the Creative Commons Attribution (CC BY) license (https://creativecommons.org/licenses/by/4.0/).