Abstract
In this study, three prefabricated integral shear wall specimens with strength differences were constructed based on a real engineering project to investigate the impact of these strength disparities on the structural performance of shear walls. The results indicate that all three prefabricated integral shear wall specimens with strength differences between precast (PC) and cast-in-place (CIP) concrete exhibited bending-shear failure. Moreover, the experimental axial-bearing capacity of the specimens was higher than the calculated axial-bearing capacity obtained using the reduced concrete strength according to the shear wall calculation formula in the code. The ultimate displacement angles of all three specimens exceeded the limit elastic–plastic displacement angle specified for shear wall structures under large seismic motions in the code, and the ductility factors were greater than 3. Furthermore, this paper presents a calculation formula for the axial-bearing capacity of the plane section of prefabricated integral shear walls with strength differences and compares it with experimental results. This paper presents a calculation formula for the axial-bearing capacity of the plane section of prefabricated integral shear walls with strength variations, compares the calculated results with experimental values, and shows that the relative error between the calculated and experimental values is nearly within 10%, which provides a design basis and reference for engineers in calculating the axial-bearing capacity of such shear walls with strength variations.
1. Introduction
The construction industry is one of the largest sectors in terms of energy consumption and carbon emissions. Developing prefabricated buildings is an essential technological approach to achieving the carbon neutrality goals in the construction sector. It is also one of the key measures for the building industry to promote green and high-quality development.
In 2021, a research team from the Beijing University of Civil Engineering and Architecture conducted extensive experimental and numerical simulations to investigate the seismic performance of prefabricated integral shear walls with mortise-tenon connections [1,2,3]. The experimental and simulation results indicate that prefabricated shear wall components with mortise-tenon connections exhibit excellent seismic performance, with a slower stiffness degradation rate compared to CIP components and superior energy dissipation capacity. The failure of these components is mainly concentrated at the transverse recess at the base of the mortise-tenon plate and the protruding areas at the bottom. After reaching the peak load, two vertical cracks form at the joint in the middle of the component. In 2022, Wang X. [4] designed a novel prefabricated shear wall consisting of precast edge components on both sides and a CIP central section. The experimental results show that this prefabricated shear wall with precast edges and a CIP core exhibits seismic performance comparable to that of CIP shear walls and retains high seismic performance even under high axial load ratios. In 2023, Yang J. [5] conducted a study on the vertical joint configurations of prefabricated shear walls and carried out pseudo-static tests on six shear walls with different vertical joint types. The results indicate that prefabricated shear walls with L-shaped and protruding connections exhibit lower axial-bearing capacity compared to those with vertically aligned joints. Additionally, they demonstrate a reduction in both ductility and energy dissipation. As the axial compression ratio increases, the axial-bearing capacity of the prefabricated shear walls increases, while the ductility decreases. The existing literature on the mechanical performance of assembled integral shear walls has not considered the impact of strength differences between the precast and CIP concrete on their mechanical behavior. Numerous experimental studies have demonstrated that the strength discrepancy between these two types of concrete is a significant factor influencing the mechanical performance of assembled structures. In engineering practice, there is often a varying degree of strength discrepancy between the two types of concrete. To investigate the influence of this difference on the mechanical behavior of assembled integral shear walls, this study conducts static tests on three specimens of assembled integral concrete shear walls with differing strength ratios under a 0.2 axial load ratio. The study aims to evaluate the effect of the strength differences between precast and CIP concrete on the structural performance of shear walls.
2. Experimental Overview
2.1. Specimen Design and Fabrication
To investigate the effect of strength variations on the mechanical performance of prefabricated shear walls, this study, based on the relevant literature on prefabricated shear walls and commonly used concrete strength grades in prefabrication plants, selected three representative strength combinations for experimentation. The designed concrete strength grades for the prefabricated components were C45, C50, and C55, while the concrete strength grade for the CIP portions was consistently C30. The specimens were labeled PSW-1, PSW-2, and PSW-3. The geometric dimensions and reinforcement amounts of the three specimens are identical, and each specimen consists of three parts: the loading beam, the support beam, and the wall body. The wall section dimensions are 1600 mm × 200 mm, with a wall height of 2710 mm. The wall is composed of precast wall panels and CIP edge components on both sides. The precast wall panel dimensions are 800 mm × 200 mm, and the length of the CIP edge components along the wall stem is 400 mm on both sides. The dimensions of the support beams for the three precast shear wall specimens are 2400 mm × 400 mm × 450 mm.
The specimens were designed according to the requirements of the Technical Specification for Precast Concrete Structures (JGJ 1-2014) [6] and the Technical Specification for Concrete Structures of Tall Buildings (JGJ 3-2010) [7]. In Figure 1, the vertical reinforcement of the prefabricated wall sections is connected to the ground beam via sleeve connections. The vertical reinforcement in the prefabricated wall consists of four steel bars with a diameter of 14 mm, arranged in a staggered pattern, achieving a reinforcement ratio of 0.38%. The horizontal reinforcement consists of steel bars with a diameter of 8 mm, spaced at 200 mm intervals, yielding a reinforcement ratio of 0.25%. The longitudinal reinforcement in the CIP edge components on both sides consists of six steel bars with a diameter of 16 mm, resulting in a reinforcement ratio of 1.51%. The stirrups are steel bars with a diameter of 8 mm, spaced at 200 mm intervals, yielding a volumetric reinforcement ratio of 0.36%. The horizontally distributed reinforcement within the precast wall panel is anchored into the CIP edge components on both sides, with an anchorage length of 500 mm. The connection between the bearing beam and the CIP portion of the shear wall is achieved by lap splicing the longitudinal reinforcement in the edge components on both sides with the longitudinal reinforcement in the CIP edge components, with a splice length of 600 mm.
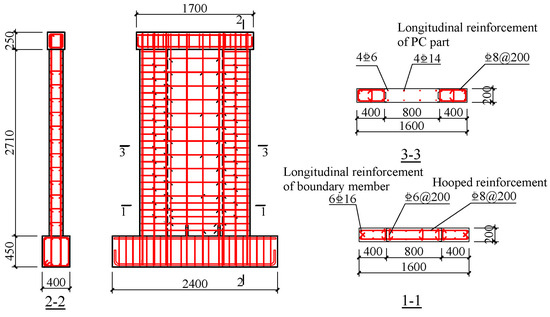
Figure 1.
Reinforcement Layout Diagram.
2.2. Material Properties
The design compressive strengths of the precast concrete in the central sections of specimens PSW-1, PSW-2, and PSW-3 are C45, C50, and C55, respectively, while the cast-in-place concrete in the edge components of all three specimens has a design compressive strength of C30. After casting, six cubic specimens with side lengths of 150 mm were reserved for both the precast and CIP concrete in each specimen, and these cubes were cured under the same conditions as the specimens. The uniaxial compressive tests were performed on the cube specimens according to the Standard for Test Methods of Concrete Physical and Mechanical Properties (GB/T 50081-2019) [8], and the axial compressive strengths of the precast and CIP concrete were calculated based on the methods outlined in the Code for Design of Concrete Structures (GB 50010-2015) [9], with the mechanical properties of the concrete provided in Table 1.

Table 1.
Measured compressive strength of concrete specimens.
All three specimens used HRB400 grade steel bars. Unidirectional tensile tests were conducted on steel bars of different diameters according to Part 1: Method of Test at Room Temperature for Metallic Materials Tensile Test (GB/T 228.1-2021) [10]. Six specimens of each steel bar diameter were reserved for uniaxial tensile testing, and the diameter, yield strength, ultimate tensile strength, and yield strain of the steel bars are listed in Table 2. The stress–strain curves of steel bars with various diameters are shown in Figure 2a, and the stress–strain curves of the precast and CIP concrete for each specimen are shown in Figure 2b,c.
Table 2.
Measured steel strength and yield strain.
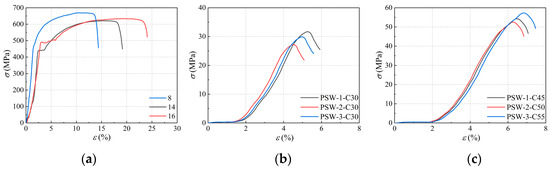
Figure 2.
Stress–strain curve of the test material. (a) Steel bars stress–strain curves; (b) CIP concrete stress–strain curves; (c) PC concrete stress–strain curves.
2.3. Loading Protocol
The experiment was conducted using low-cycle cyclic loading. The vertical loading was provided by a frame-reactor system and two vertical hydraulic jacks. A 2000 kN hydraulic jack was used to apply axial pressure, while another 2000 kN hydraulic jack applied cyclic horizontal force. A schematic diagram of the loading apparatus is shown in Figure 3.
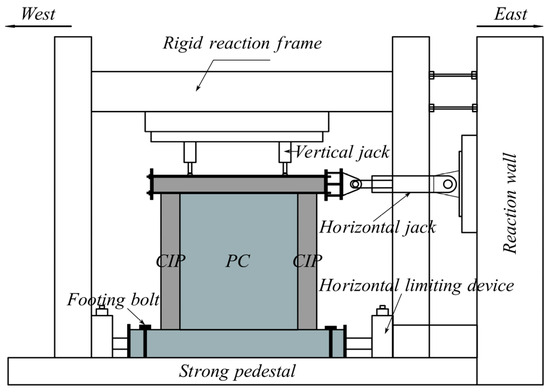
Figure 3.
Loading device.
The axial load ratio of specimens PSW-1, PSW-2, and PSW-3 is 0.2, corresponding to axial loads of 944 kN, 997 kN, and 1056 kN, respectively. According to the Specification for Seismic Test of Buildings (JGJ/T 101-2015) [11], the horizontal load is applied using a displacement-controlled loading method. The loading is applied sequentially at displacement angles of 0.1%, 0.2%, 0.4%, 0.6%, 0.8%, 1.0%, and higher, with two cycles at each level. The test is terminated when the specimen fails completely or when the axial-bearing capacity drops to 85% of the peak load. Figure 4 shows the schematic diagram of the loading process.
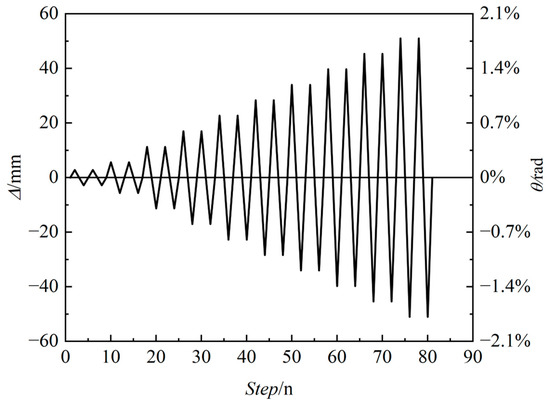
Figure 4.
Loading apparatus.
2.4. Measurement Content
The experiment measured load, displacement, deformation, and steel strain in the reinforcement. D1 to D10 measured the horizontal displacement at various heights of the shear wall, with the measurement points arranged as shown in Figure 5. Figure 6 presents a schematic of the strain gauge arrangement. The strain gauges S1 to S12 were used to measure the longitudinal reinforcement strain 50 mm from the base of the wall; S13 to S22 were used to measure the longitudinal reinforcement strain 500 mm from the base; S23 to S32 measured the strain at 1000 mm from the base; S33 to S34 measured the strain in the transverse reinforcement; S35 to S44 measured the strain in the horizontal reinforcement at the precast and CIP vertical joints; and S45 to S46 measured the strain in the horizontal distributed reinforcement at the inclined sections. The experimental data were acquired in real time using a strain acquisition system controlled by a computer.
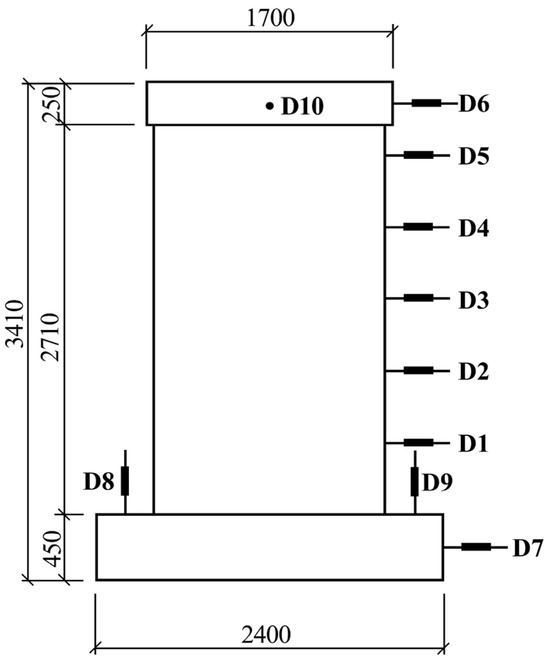
Figure 5.
Displacement gauge arrangement.
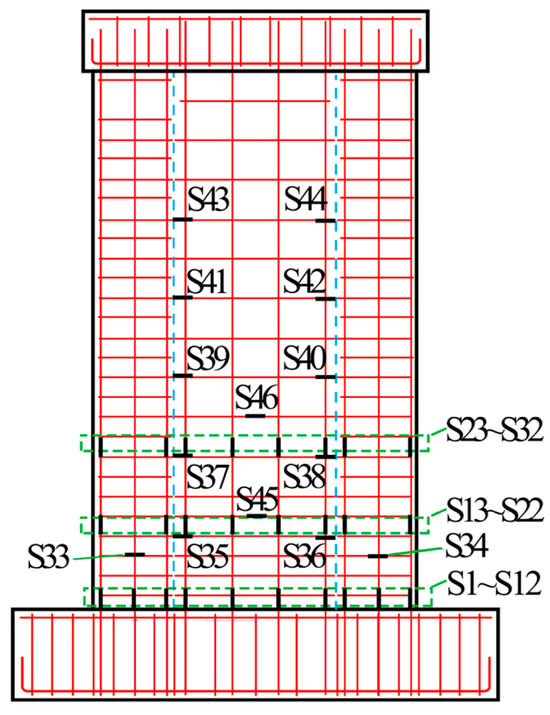
Figure 6.
Strain gauge placement on reinforcement.
3. Results and Discussions
3.1. Failure Patterns
During the elastic stage, due to the relatively small applied load, no visible cracks appeared in the three specimens under cyclic loading. The lateral force–displacement curves were linear, with minimal strain observed in both the reinforcement and concrete, and they complied with the plane section assumption. No residual deformation was observed upon unloading, indicating that the shear walls remained in the elastic range of behavior.
During the crack development stage, the first horizontal crack appeared at a height of 1000 mm on the eastern CIP edge component of specimen PSW-1 when the top horizontal displacement reached −2.8 mm and the crack width was 0.1 mm. This crack showed no residual deformation after unloading. For PSW-2, a horizontal crack formed at a height of 800 mm on the western CIP edge component when the top displacement was 2.8 mm, with a crack width of 0.1 mm. Similarly, for PSW-3, the first horizontal crack appeared at a height of 800 mm on the western CIP edge component when the top displacement was −5.6 mm, with a crack width of 0.15 mm. As the load increased, horizontal cracks continued to develop along the edge components of all specimens, propagating diagonally toward the central wall and intersecting.
At top displacements of −11.7 mm and 15.7 mm for PSW-1, 20.8 mm and 13.7 mm for PSW-2, and −15.4 mm and 10.2 mm for PSW-3, the outermost longitudinal rebars in both the eastern and western edge components yielded under tension. Vertical cracks began to form along the precast and CIP interfaces. For PSW-1, fine vertical cracks appeared within a height of 500 mm on the eastern vertical interface at a displacement of −11.3 mm. For PSW-2, vertical cracks were observed over a height of 1000 mm at a displacement of −17.0 mm. For PSW-3, cracking occurred along the interface over a height of 600 mm at a displacement of 11.3 mm.
In the failure stage, as the horizontal load continued to increase, the horizontal cracks in PSW-1 extended to the top of the wall height, with a maximum width of 2.7 mm. In PSW-2, the cracks also extended to the top of the wall height, with a maximum width of 2.0 mm. For PSW-3, the cracks extended to half of the wall height, with a maximum width of 2.0 mm, and the distribution of cracks was sparser compared to PSW-1 and PSW-2. Finally, at top displacements of −37.0 mm for PSW-1, 40.7 mm for PSW-2, and 34.0 mm for PSW-3, the outermost longitudinal bars were exposed and buckled under compression, while the concrete at the base of the wall was crushed and spalled. The failure modes and crack distributions are shown in Figure 7, Figure 8 and Figure 9.
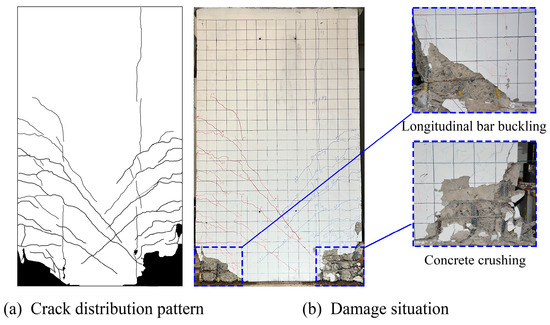
Figure 7.
Failure and crack distribution diagram of specimen PSW-1.
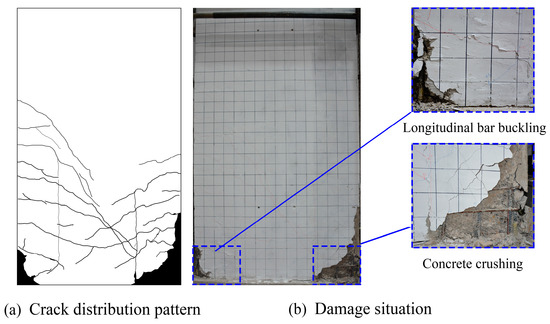
Figure 8.
Failure and crack distribution diagram of specimen PSW-2.
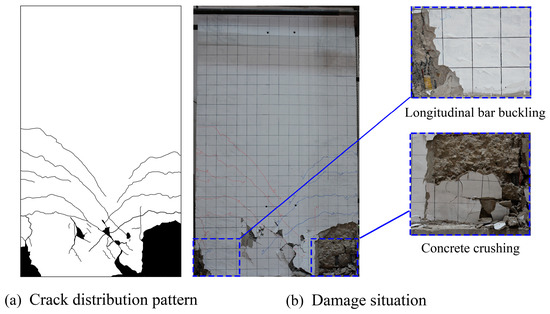
Figure 9.
Failure and crack distribution diagram of specimen PSW-3.
3.2. Hysteresis Curves and Backbone Curves
Figure 10 shows the horizontal force–displacement hysteresis curves at the top of the three specimens. A comparison of these curves reveals that during the initial loading stage, the wall exhibits high stiffness with minimal lateral displacement. The hysteresis curves are approximately linear, indicating that the components remain in a linear elastic state without residual deformation. As the horizontal load increases, cracking occurs, and the slope of the curve gradually decreases, indicating a degradation in lateral stiffness. The specimens yield at a horizontal load of 590 kN and enter the elastic–plastic deformation stage, where the area of the hysteresis loops expands, residual deformation is observed upon unloading, and the stiffness of the specimens progressively decreases. After reaching the peak load, the axial-bearing capacity of the specimens declines rapidly until failure. Due to slippage in the longitudinal rebar lap zone of the CIP section and relative displacement at the interface between the precast and CIP sections, the overall curve exhibits an “S” shape with pronounced pinching.
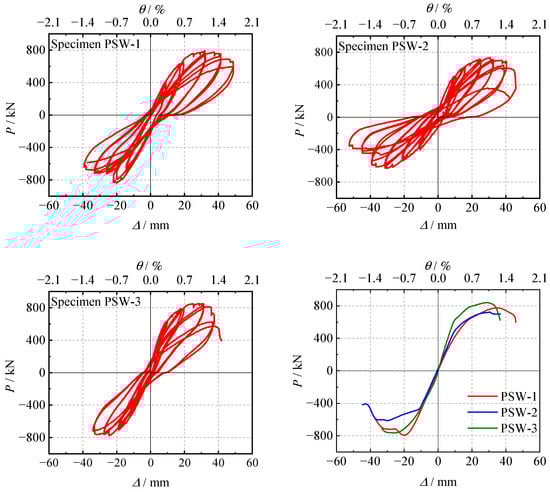
Figure 10.
Hysteresis curve and skeleton curves of each specimen.
Figure 10 also presents a comparison of the backbone curves for the PSW-1, PSW-2, and PSW-3 specimens. It is evident that the slope of the PSW-1 curve is the smallest and the slope of the PSW-3 curve is the largest, indicating that PSW-3 has the highest initial stiffness and PSW-1 the lowest. The peak load capacities of the three specimens are similar, with PSW-3, which has the highest precast strength and the largest difference between the precast and CIP sections, exhibiting the highest positive peak load capacity. However, after the peak load, the decline in load capacity is slower, suggesting that while larger strength differences do not significantly affect the peak load capacity, they notably impact the wall’s lateral stiffness, stiffness degradation, and deformation capacity.
3.3. Axial-Bending Capacity
The cracking load, yield load, peak load, and ultimate load for each specimen are shown in Table 3. The yield load is determined using the farthest point method [12], while the ultimate load corresponds to the point at which the horizontal load on the backbone curve decreases to 85% of the peak load. It can be observed that the cracking loads of the three shear walls, which have different strength characteristics, are quite similar. The average cracking load values for PSW-1, PSW-2, and PSW-3 are 441.73 kN, 448.51 kN, and 438.64 kN, respectively. The yield and peak load capacities of specimen PSW-3 are slightly higher than those of PSW-1 and PSW-2. Table 3 also presents the calculated horizontal force values based on the axial-bending capacity according to the Code for Design of Concrete Structures (GB50010-2015) [9]. Compared to the calculated values, the experimental axial-bending capacities are consistently higher, indicating that the prefabricated shear walls, despite the significant differences between the two concrete components, do not exhibit a significant reduction in axial-bending capacity and still meet the code requirements.
Table 3.
Axial-bending capacities at the cracking, yield, peak, and failure points of the specimen.
3.4. Deformation and Ductility
The displacements and displacement ductility coefficients corresponding to the cracking points, yield points, peak points, and ultimate points of each specimen are shown in Table 4. Here, the vertex displacement angle (denoted as θ) is defined as Δ/H. The displacement ductility coefficient is calculated as μΔ = Δu/Δy. It can be observed that the displacement angle at yield for each specimen is approximately 1/250, while the displacement angle at peak load is around 1/100. At the point of wall failure, the interstory drift angle exceeds 1/120, which meets the requirements for the elastic–plastic interstory drift angle specified in the Code for Seismic Design of Buildings (GB50011-2016) [13]. However, the interstory drift angle at failure for specimen PSW-3 is smaller than that for PSW-1 and PSW-2, while the displacement ductility coefficient for all specimens is greater than 3. These results indicate that when there is a large difference in strength, the deformability and ductility of prefabricated shear walls with varying strength characteristics are reduced.
Table 4.
Displacements at the cracking, yield, peak, and failure points of the specimen.
3.5. Strain Analysis
The experiment measured the strain in the longitudinal reinforcement of both the CIP edge components and the prefabricated sections. Figure 11 shows the strain data recorded by strain gauges S1 to S12, which were placed on the longitudinal reinforcement at a height of 50 mm above the wall base under conditions of axial load application, cracking, yielding, and peak load. The vertical axis represents the strain in the reinforcement, while the horizontal axis indicates the positions of the strain gauges along the height of the wall section.
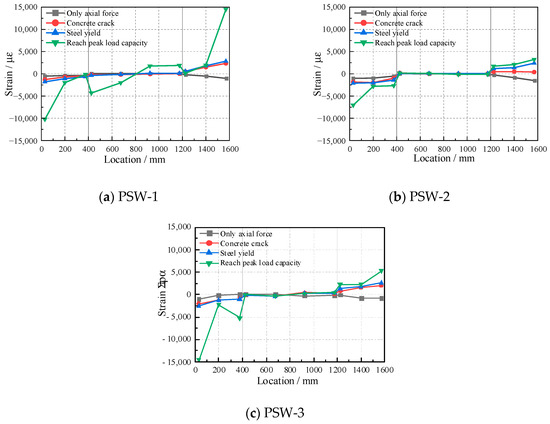
Figure 11.
Vertical reinforcement strain distribution at 50 mm above the wall base.
It can be observed that, under axial load alone, the strain in the longitudinal reinforcement of the CIP edge components is slightly higher than that in the prefabricated wall panel, although all strains remain within a small range. This suggests that the wall section satisfies the plane section assumption at this stage. As the horizontal load increases to the yield point of the components, the strain in the longitudinal reinforcement of the CIP edge components increases, while the strain in the longitudinal reinforcement of the prefabricated wall remains relatively small. At peak load, the strain in the outermost longitudinal reinforcement of all three specimens reached 0.005. In PSW-1, some of the vertically distributed longitudinal reinforcement within the prefabricated wall yielded, whereas in PSW-2 and PSW-3, the vertically distributed longitudinal reinforcement in the prefabricated wall did not yield throughout the loading process. This indicates that the significant differences between the two types of concrete may limit the prefabricated concrete from fully utilizing its strength.
3.6. Stiffness Degradation
To evaluate the stiffness and stiffness degradation behavior of prefabricated shear walls with strength differences under low-cycle horizontal cyclic loading, the secant stiffness at the maximum displacement of each loading cycle is defined as the equivalent stiffness K. Figure 12a shows a comparison of the stiffness degradation curves, while Figure 12b presents the relationship between stiffness degradation and typical interstory drift angles. Three typical states were selected as follows: interstory drift angles of 1/1000 (the limit for interstory drift angle), 1/300 (minor damage [10]), and 1/120 (elastic–plastic interstory drift angle limit).
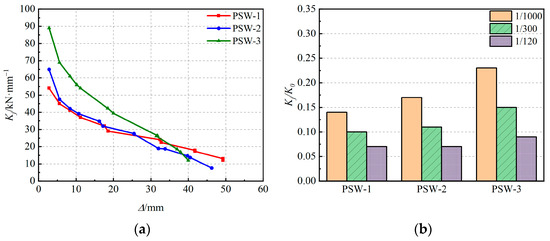
Figure 12.
Comparison of specimen stiffness degradation. (a) Stiffness degradation curves; (b) typical stiffness degradation.
4. Analysis and Calculation of Bending Capacity
4.1. Applicability Conditions
Based on the experimental results of this study, it was found that when the strength difference between the prefabricated and CIP concrete exceeds 30 MPa, there is a significant strain difference between the two concrete sections, and the plane section assumption no longer holds. Additionally, the concrete strength after area equivalence between the two parts is relatively low. Therefore, the applicability conditions for the analysis and calculation formula of the ultimate axial-bending capacity of the plane section proposed in this study are as follows:
4.2. Calculation Model
Assuming that the edge concrete in the compression zone of the CIP section reaches its ultimate compressive strain εcu, the entire plane section of the CIP achieves its compressive strength fcc, and the tensile longitudinal reinforcement yields, this state is defined as the failure of the prefabricated shear wall. At this point, the compressive stress at the edge of the prefabricated wall section is fcc. When the wall reaches its ultimate axial-bending capacity, the CIP wall section within 400 mm along the wall limb achieves the ultimate compressive strength fcc. Therefore, it is assumed that the concrete at the edge of the compression zone in the CIP portion reaches the ultimate compressive strain εcu. As a result, the overall section of the CIP wall reaches the compressive strength fcc, with the yielding of the longitudinal tensile reinforcement defining the failure of the assembled integral shear wall. Thus, the resultant compressive force of the CIP concrete in the compression zone is Ccc = fcc × b × lc. The resultant force acts at the midpoint of the wall limb length in the CIP component. For the resultant force action point of the compressive stress in the prefabricated concrete, the following analysis is conducted: Let Ccp represent the area under the compressive stress–strain curve of the prefabricated concrete at fcc, and y’c represent the distance from the centroid of this area to the origin. The calculation formulas are as follows:
In the equation, xc represents the height of the neutral axis, which corresponds to the theoretical height of the compressed zone; y represents the distance from any height in the compression zone of the wall to the neutral axis, y ≥ 0 and y ≤ xc − lc; lc is the length of the CIP edge member along the wall, and εc is the compressive strain when the precast concrete achieves the compressive strength of the CIP concrete, εc ≥ 0 and εc ≤ ε1; and ε1 represents the compressive strain of the precast concrete when it reaches the compressive strength fcc of the CIP concrete. Based on the simplified plane section assumption, the relationship between y and εc within the precast wall still satisfies Equation (4).
Based on Equations (2) and (3) and the relevant parameters, the coefficients k’1 and k’2 are calculated by substituting into Equations (5) and (6). The coefficients k’1 and k’2 are related to the compressive stress–strain curves of both precast and CIP concrete, as well as the differences in concrete strength between the two. Additionally, by substituting Equation (4) into Equations (7) and (8), the resultant force of the concrete in the compression zone of the precast portion and its distance y’c from the neutral axis are obtained.
The compressive stress of the concrete is divided into two parts based on strength differences, and the resultant force of each part is calculated separately. Assume the equivalent stress value of the precast concrete stress diagram is α’1fcc with a height of β’1(x − lc), and for the CIP concrete, the stress value is fcc with a height of lc.
Let , then
Coefficient α’1 is the ratio of the stress in the precast concrete compression zone to its axial compressive strength, and β’1 is the ratio of the outer edge distance to the neutral axis. α’1 and β’1 depend on the stress–strain relationship and strength differences. Suggested values are shown in Table 5.
Table 5.
Equivalent rectangular stress diagram coefficients α’1 and β’1.
4.3. Derivation of the Axial-Bending Formula
The following basic assumptions are made in calculating the axial-bending load capacity of the prefabricated integral shear wall: (1) Plane section assumption: The section remains plane during bending. As shown in Figure 11, when the wall reaches peak load, the longitudinal strain in the edge components at both ends of the wall shows a gradient. The strain distribution from the tensile side to the unrestrained compression side remains linear, indicating that the section strain satisfies the plane section assumption. (2) The stress–strain curve of the reinforcement follows an ideal elastic–plastic model. (3) The compressive stress of concrete is divided into two parts based on concrete strength, and the resultant force of each part is calculated separately. The precast concrete stress follows a curved distribution, replaced by a simplified equivalent stress diagram with a stress of α’1fcc and a height of β’1(x − lc). The stress distribution in the CIP concrete part is rectangular, with an equivalent rectangular stress of fcc and a height of lc. (4) The tensile strength of the concrete is not considered. (5) The peak value of the wall is defined when the constrained concrete at the outermost edge of the vertical edge components of the wall reaches the peak compressive strain. This stage is referred to as the peak point of the wall, with the corresponding peak bending moment Mp and peak load Fp. At this point, the entire CIP wall section reaches the compressive strength fcc, and the outermost edge stress of the compressed zone in the precast part is also fcc. (6) In the peak state, the longitudinal reinforcement in the tensile and compression edge components has all yielded, and some reinforcement may have entered the strengthening phase. For simplicity, the yield strength fy of the longitudinal reinforcement in the edge components is assumed. (7) During the peak stage, the primary consideration is the effect of the reliably connected reinforcement at the bottom of the tensile zone, while the influence of the vertical distribution of reinforcement in the compressive zone is neglected to simplify the calculation.
Based on the above analysis, the stress–strain distribution at the peak point of the prefabricated integral shear wall with strength variations between precast and CIP is shown in Figure 13 and Figure 14.
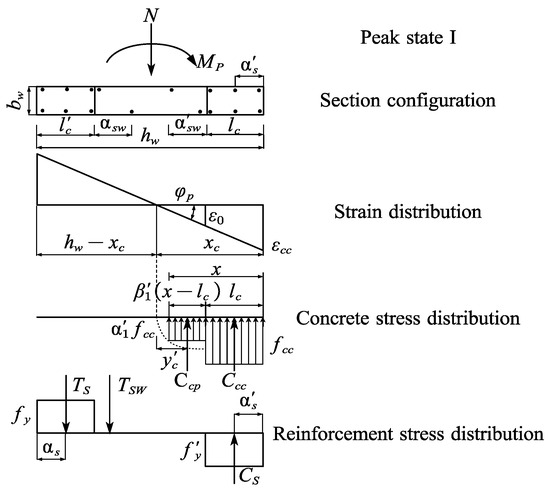
Figure 13.
Strain and stress distribution diagram of section at peak state I.
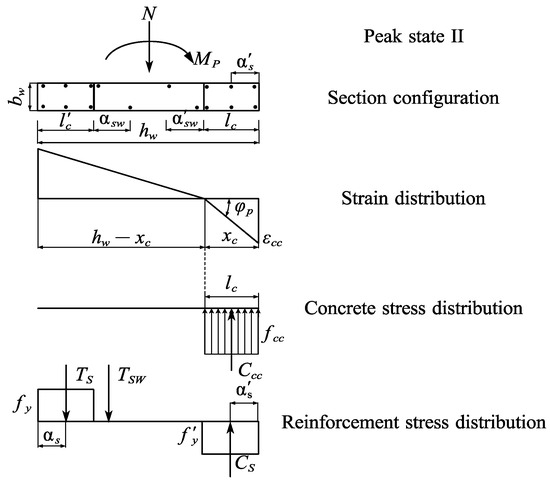
Figure 14.
Strain and stress distribution diagram of section at peak state II.
- (1)
- When xc ≥ lc, based on the stress distribution diagram in Figure 13, the following relationship can be obtained:
Based on the stress distribution and equilibrium conditions of the section, the following can be obtained:
According to Equation (17), the height of the compression zone under the peak state of the wall can be determined. Taking the moment about the centroid of the wall section, the peak bending moment Mp of the section can be obtained.
The mathematical expression for the peak load Fp is as follows:
- (2)
- When xc < lc, based on the stress distribution diagram in Figure 14, the following relationship can be obtained:
Based on the stress distribution and equilibrium conditions of the section, the following can be obtained:
Taking moments at the center point of the wall section, the peak bending moment of section Mp is obtained as follows:
The peak load Fp is calculated using Equation (19).
In the above equations, hw and bw represent the height and width of the shear wall section; l’c and lc represent the heights of the tensile and compressive vertical edge components, respectively; α’s and αs are the distances from the resultant points of tensile and compressive vertical reinforcement forces to the tensile and compressive edges of the section, respectively; α’sw and αsw are the distances from the resultant points of tensile and compressive longitudinal reinforcement within the precast shear wall to the tensile and compressive edges of the precast shear wall, respectively; As and A’s are the cross-sectional areas of the longitudinal reinforcement in the tensile and compressive zones, respectively; Asw and A’sw are the cross-sectional areas of distributed reinforcement in the tensile and compressive zones, respectively; Ccc represents the resultant compressive force of concrete in the CIP zone; Ccp is the reduced resultant compressive force of concrete in the precast zone; Cs represents the resultant force of longitudinal reinforcement in the compressive edge component; Ts is the resultant force of longitudinal reinforcement in the tensile edge component; Tsw is the resultant force of distributed reinforcement in the tensile zone of the precast wall panel.
4.4. Formula Verification
The displacement angles corresponding to the peak load for the three specimens in this study were all less than 1.2%, indicating few loading cycles and minimal hysteresis effects. It is considered valid to use the static analysis formula to derive the axial-bending load capacity formula for prefabricated integral shear walls with strength variations, neglecting the effects of hysteresis and cyclic damage under cyclic loading. The comparison between the calculated peak loads and the experimental values for each specimen is shown in Table 6. It can be observed that the experimental results are in good agreement with the theoretical calculations proposed in this paper. The formula presented above reasonably reflects the actual axial-bending capacity of the assembled integral shear wall with strength differences between the precast and CIP components. For practical applications, these values should be adjusted according to the building type and seismic design level.
Table 6.
Comparison of calculated and experimental peak axial-bending capacities.
The above calculation formula for the bearing capacity of the assembled integral shear wall with strength differences between precast and CIP concrete primarily applies after the shear wall structure has been constructed, when a strength discrepancy exists between the CIP section and the precast section. The applicable conditions are as follows:
- (1)
- The compressive strength of the CIP concrete is lower than that of the precast concrete, and the strength difference between the precast and CIP sections should not exceed 30 MPa.
- (2)
- Appropriate measures should be implemented at the precast-CIP interface, such as suitable keying dimensions, number of keys, and surface roughening treatments, to ensure that both components function as an integrated system throughout the entire loading process.
- (3)
- The axial compression ratio should be within the limits specified in the code.
5. Conclusions
- (1)
- The results of the simulated static tests indicate that the failure mode of the assembled integral shear walls, with strength differences between the precast and CIP components, is characterized by bending-shear failure. Vertical cracks developed at the interface in the later stages of loading. As the strength difference increased, the deformation capacity and ductility slightly decreased, while the ultimate axial-bending capacity remained comparable to that of the cast-in-place shear walls.
- (2)
- According to the axial-bending capacity calculation formula provided in the code, the axial-bending capacity is computed using the adjusted concrete strength. The calculated values range from 0.73 to 0.91 of the experimental values, and the axial-bending capacities of the three assembled integral shear walls with strength differences meet the code requirements. The ultimate displacement angles of all three specimens exceed the limit for the elastic–plastic displacement angle of shear wall structures under large earthquake conditions, as specified in the code. The ductility coefficients of all three specimens are greater than 3, and their elastic–plastic deformation capacities essentially comply with the code requirements.
- (3)
- Based on the experimental data and the relevant literature, a bearing capacity calculation formula for assembled integral shear walls with strength differences is derived, along with the applicable conditions for this formula. A comparison between the experimental and calculated values shows a high degree of agreement, providing designers with a reliable reference and basis for the bearing capacity calculation of shear walls with strength differences.
In summary, within a specific range of strength discrepancies, the experimental results demonstrate that this type of assembled integral shear wall exhibits comparable mechanical performance to that of CIP shear walls and satisfactorily meets the requirements of building structural codes. Furthermore, it provides a foundation for the design of this type of assembled integral shear wall.
Author Contributions
Conceptualization, Z.D.; Methodology, Z.D.; Formal analysis, Z.W.; Writing—original draft, J.W.; Writing—review & editing, J.W. and Z.W. All authors have read and agreed to the published version of the manuscript.
Funding
This research received no external funding.
Data Availability Statement
The original contributions presented in this study are included in the article. Further inquiries can be directed to the corresponding author.
Conflicts of Interest
The authors declare no conflict of interest.
References
- Sun, Z.; Cao, C.; Liu, J. Experimental study on mechanical behaviors of assembled monolithic shear walls with mortise-tenon joints under different shear span ratios. Build. Struct. 2021, 51, 23–29. [Google Scholar] [CrossRef]
- Liu, J.; Wang, B.; Chu, M. Experimental study on flexural behavior of monolithic precast concrete shear walls with mortise-tenon joints. Eng. Mech. 2021, 38, 79–87. [Google Scholar] [CrossRef]
- Xiong, H.; Chu, M.; Liu, J. Numerical analysis of seismic behavior of assembled serrate-edges monolithic shear wall with mortise-tenon joints. Build. Struct. 2022, 52, 1769–1775. [Google Scholar] [CrossRef]
- Wang, X.; Li, Y.; Wu, S.; Li, R. Seismic performance of a novel partly precast RC shear wall with double precast edge members and a central T-shape CIP member. Soil Dyn. Earthq. Eng. 2022, 162, 107481. [Google Scholar] [CrossRef]
- Yang, J.; Yang, Y.; Deng, L.; Sun, B.; Gu, Z.; Zeng, L.; Zhao, S. Seismic behaviors of prefabricated reinforced concrete shear walls assembled with a cast-in-place vertical joint. Buildings 2023, 13, 3013. [Google Scholar] [CrossRef]
- JGJ 1-2014; Technical Specification for Precast Concrete Structures. China Building Industry Press: Beijing, China, 2014.
- JGJ 3-2010; Technical Specification for Concrete Structures of Tall Buildings. China Building Industry Press: Beijing, China, 2010.
- GB/T 50081-2019; Standard for Test Methods of Concrete Physical and Mechanical Properties. China Building Industry Press: Beijing, China, 2019.
- GB 50010-2015; Code for Design of Concrete Structures. China Building Industry Press: Beijing, China, 2015.
- GB/T 228.1-2021; Part 1: Method of Test at Room Temperature for Metallic Materials Tensile Testing. China Building Industry Press: Beijing, China, 2021.
- JGJ/T 101-2015; Specification for Seismic Test of Buildings. China Building Industry Press: Beijing, China, 2015.
- Feng, P.; Qiang, H.; Ye, L. Discussion and definition on yield points of materials, members, and structures. Eng. Mech. 2017, 03, 36–46. [Google Scholar]
- GB 50011-2016; Code for Seismic Design of Buildings. China Building Industry Press: Beijing, China, 2016.
Disclaimer/Publisher’s Note: The statements, opinions and data contained in all publications are solely those of the individual author(s) and contributor(s) and not of MDPI and/or the editor(s). MDPI and/or the editor(s) disclaim responsibility for any injury to people or property resulting from any ideas, methods, instructions or products referred to in the content. |
© 2024 by the authors. Licensee MDPI, Basel, Switzerland. This article is an open access article distributed under the terms and conditions of the Creative Commons Attribution (CC BY) license (https://creativecommons.org/licenses/by/4.0/).