1. Introduction
The rising demand for electricity in society makes transmission towers crucial for electric energy transmission, which is directly linked to the safe operational capacity essential for societal development and stability [
1]. Due to their operational characteristics and geographical placement, transmission towers, particularly in mountainous regions, endure diverse static and dynamic loads over extended durations, including strong winds, heavy rainfall, and other intricate environmental conditions. This exposure renders them susceptible to the loosening of bolted connections, corrosion of joints, and deformation of structural components [
2,
3]. These variables will result in a deterioration of the load-bearing capacity of transmission towers, potentially leading to severe power incidents such as tower deformation or collapse [
4]. Consequently, evaluating safety conditions for transmission towers in dynamic mountainous regions is essential.
Regarding the safety assessment of transmission towers, Chen et al. proposed a framework utilizing 3D point clouds and risk indices to accurately identify damage risks in flooding conditions and assist in grid maintenance [
5]; Fu et al. examined the gust response coefficients of transmission towers during typhoons, discovering that these coefficients surpassed current standards, and recommended enhancing the gust response coefficient to ensure transmission tower safety [
6]; Li et al. assessed the impact of wind fatigue on the brittleness of transmission towers subjected to multiple catastrophes using a probabilistic analytical framework. The findings indicated a significant reduction in structural capacity over time, offering guidance for the design and maintenance of transmission towers [
7]; Zhu et al. proposed a method to evaluate the vulnerability of transmission towers in a downburst wind, and through the simulated wind field and parameterized analysis, they obtained the limit carrying capacity and the most unfavorable location, and showed that the lower storm winds are more destructive than the atmospheric boundary layer winds [
8]; Zhu et al. proposed a wind vulnerability analysis method for transmission towers based on the wind direction, and determined the optimal layout and probability of failure, which provided a basis for the design and risk assessment of the transmission towers [
9]; Kwon et al. analyzed the degradation of structural performance caused by corrosion of the 765 kV transmission towers in coastal areas, and a vulnerability assessment method was proposed and an ultimate collapse surface was created to assess its structural safety under different wind speeds and wind angles of attack [
10]; Meng et al. analyzed the response of microtopography to transmission towers under the influence of typhoons through virtual wind tunnel simulation, and found that the microtopography significantly increased the local wind speed and the risk of collapse, which provided an essential reference for the assessment of the wind resistance of transmission lines under complex terrain [
11]; Gao et al. examined the dynamic reaction of ice removal on wineglass-shaped transmission towers and determined that the central V-shaped section is more susceptible to collapse. They recommend reinforcing the critical linking component to enhance overall stability [
12]; Mukherjee et al. examined the reliability of anchor foundations for transmission towers subjected to fluctuating wind loads and determined that soil cohesion significantly influences the resistance to uprooting capacity through a multivariate adaptive regression spline model. They underscored the necessity of accounting for variability to enhance structural stability and safety [
13].
In terms of monitoring and warning of transmission towers, Shen et al. proposed a technique using clustered dynamic mode decomposition and adaptive block compression sensing to accurately monitor the looseness of transmission towers and safeguard their structural safety through MIMU signal analysis [
14]; Min et al. designed a high-sensitivity fiber Bragg grating smart rod to achieve high-precision strain monitoring and temperature compensation for large-span transmission towers, which provides a reliable solution for transmission tower safety monitoring [
15]; Huang et al. explored the effect of trains passing on the vibration response of transmission towers, and found that it reduces the specific modal frequency, which may lead to misjudgment of health monitoring, and thus optimized the vibration monitoring device to improve the safety [
16]; Jin et al. predicted the foundation settlement displacement of transmission towers in the Salt Lake area by using the multi-temporal phase interferometric synthetic aperture radar, which provides a good solution for the transmission network’s ground settlement disaster monitoring [
17]; Tian et al. developed a fiber Bragg grating flexible sensor with temperature self-compensation to realize automatic early warning of uneven settlement and horizontal sliding of tower base by real-time monitoring of three-dimensional deformation field of the tower base of transmission towers [
18]; Lu et al. researched the factors related to the deformation of the ground surface of the transmission line in the mining area, and constructed a risk assessment and early warning system to effectively predict hidden dangers and improve transmission line safety [
19]; Yao et al. proposed a multi-parameter localization method based on a hybrid distributed fiber optic sensing system, which significantly improves the localization accuracy and efficiency of transmission towers, and provides reliable support for online monitoring and early warning of high-voltage transmission lines [
20]; He et al. conducted millimeter surface displacement of transmission lines with synthetic aperture radar (SAR) interferometry millimeter-level monitoring of surface displacements along transmission lines in the Loess Plateau by synthetic aperture radar interferometry, which provides critical data support for the early warning of geologic hazards in intelligent grids [
21]; Zhang et al. designed a fiber Bragg grating-based on-line monitoring system for the transmission of tower strain, which achieves accurate early warning of transmission tower failures and provides effective support for condition maintenance and disaster prevention [
22].
Despite the advancements in the security evaluation of transmission towers presented in the studies above, significant deficiencies still need to be addressed. These investigations predominantly depend on several data sources, including meteorological, geographic, and grid information, and exhibit a relative need for more intelligent algorithms. Although offering essential context for the evaluation, this dependence leads to inadequate model precision to accurately represent the actual risk in extreme weather scenarios or intricate geographic settings. Furthermore, the velocity and precision of forecasts are constrained, hindering the capacity for real-time monitoring and swift response. To enhance the efficacy of assessment models, it is imperative to implement sophisticated, intelligent algorithms, such as machine learning and deep learning, which can manage extensive, multi-dimensional data, discern potential nonlinear relationships, and consequently augment models’ predictive capacity and adaptability. Future studies should concentrate on incorporating intelligent technologies to enhance the invention and optimization of assessment models, thereby attaining a superior level of safety management.
The support vector machine (SVM) is a prevalent supervised learning method mainly employed for multi-class classification tasks [
23,
24]. It efficiently streamlines the computational procedure by selecting suitable hyperplanes and employing the concept of high and low-dimensional transformations, showcasing considerable benefits in examining nonlinear, high-dimensional, and small-sample issues [
25,
26]. Nonetheless, the conventional SVM exhibits prolonged training durations and elevated computational complexity when confronted with extensive datasets, and there exists variability in the values of the penalty parameter
c and the kernel function parameter
g [
27]. This paper proposes an improved coati optimization algorithm (ICOA) to optimize the SVM’s penalty and kernel function parameters, effectively mitigating overfitting and underfitting, addressing slow computation speed, and improving the accuracy of the model’s classification results.
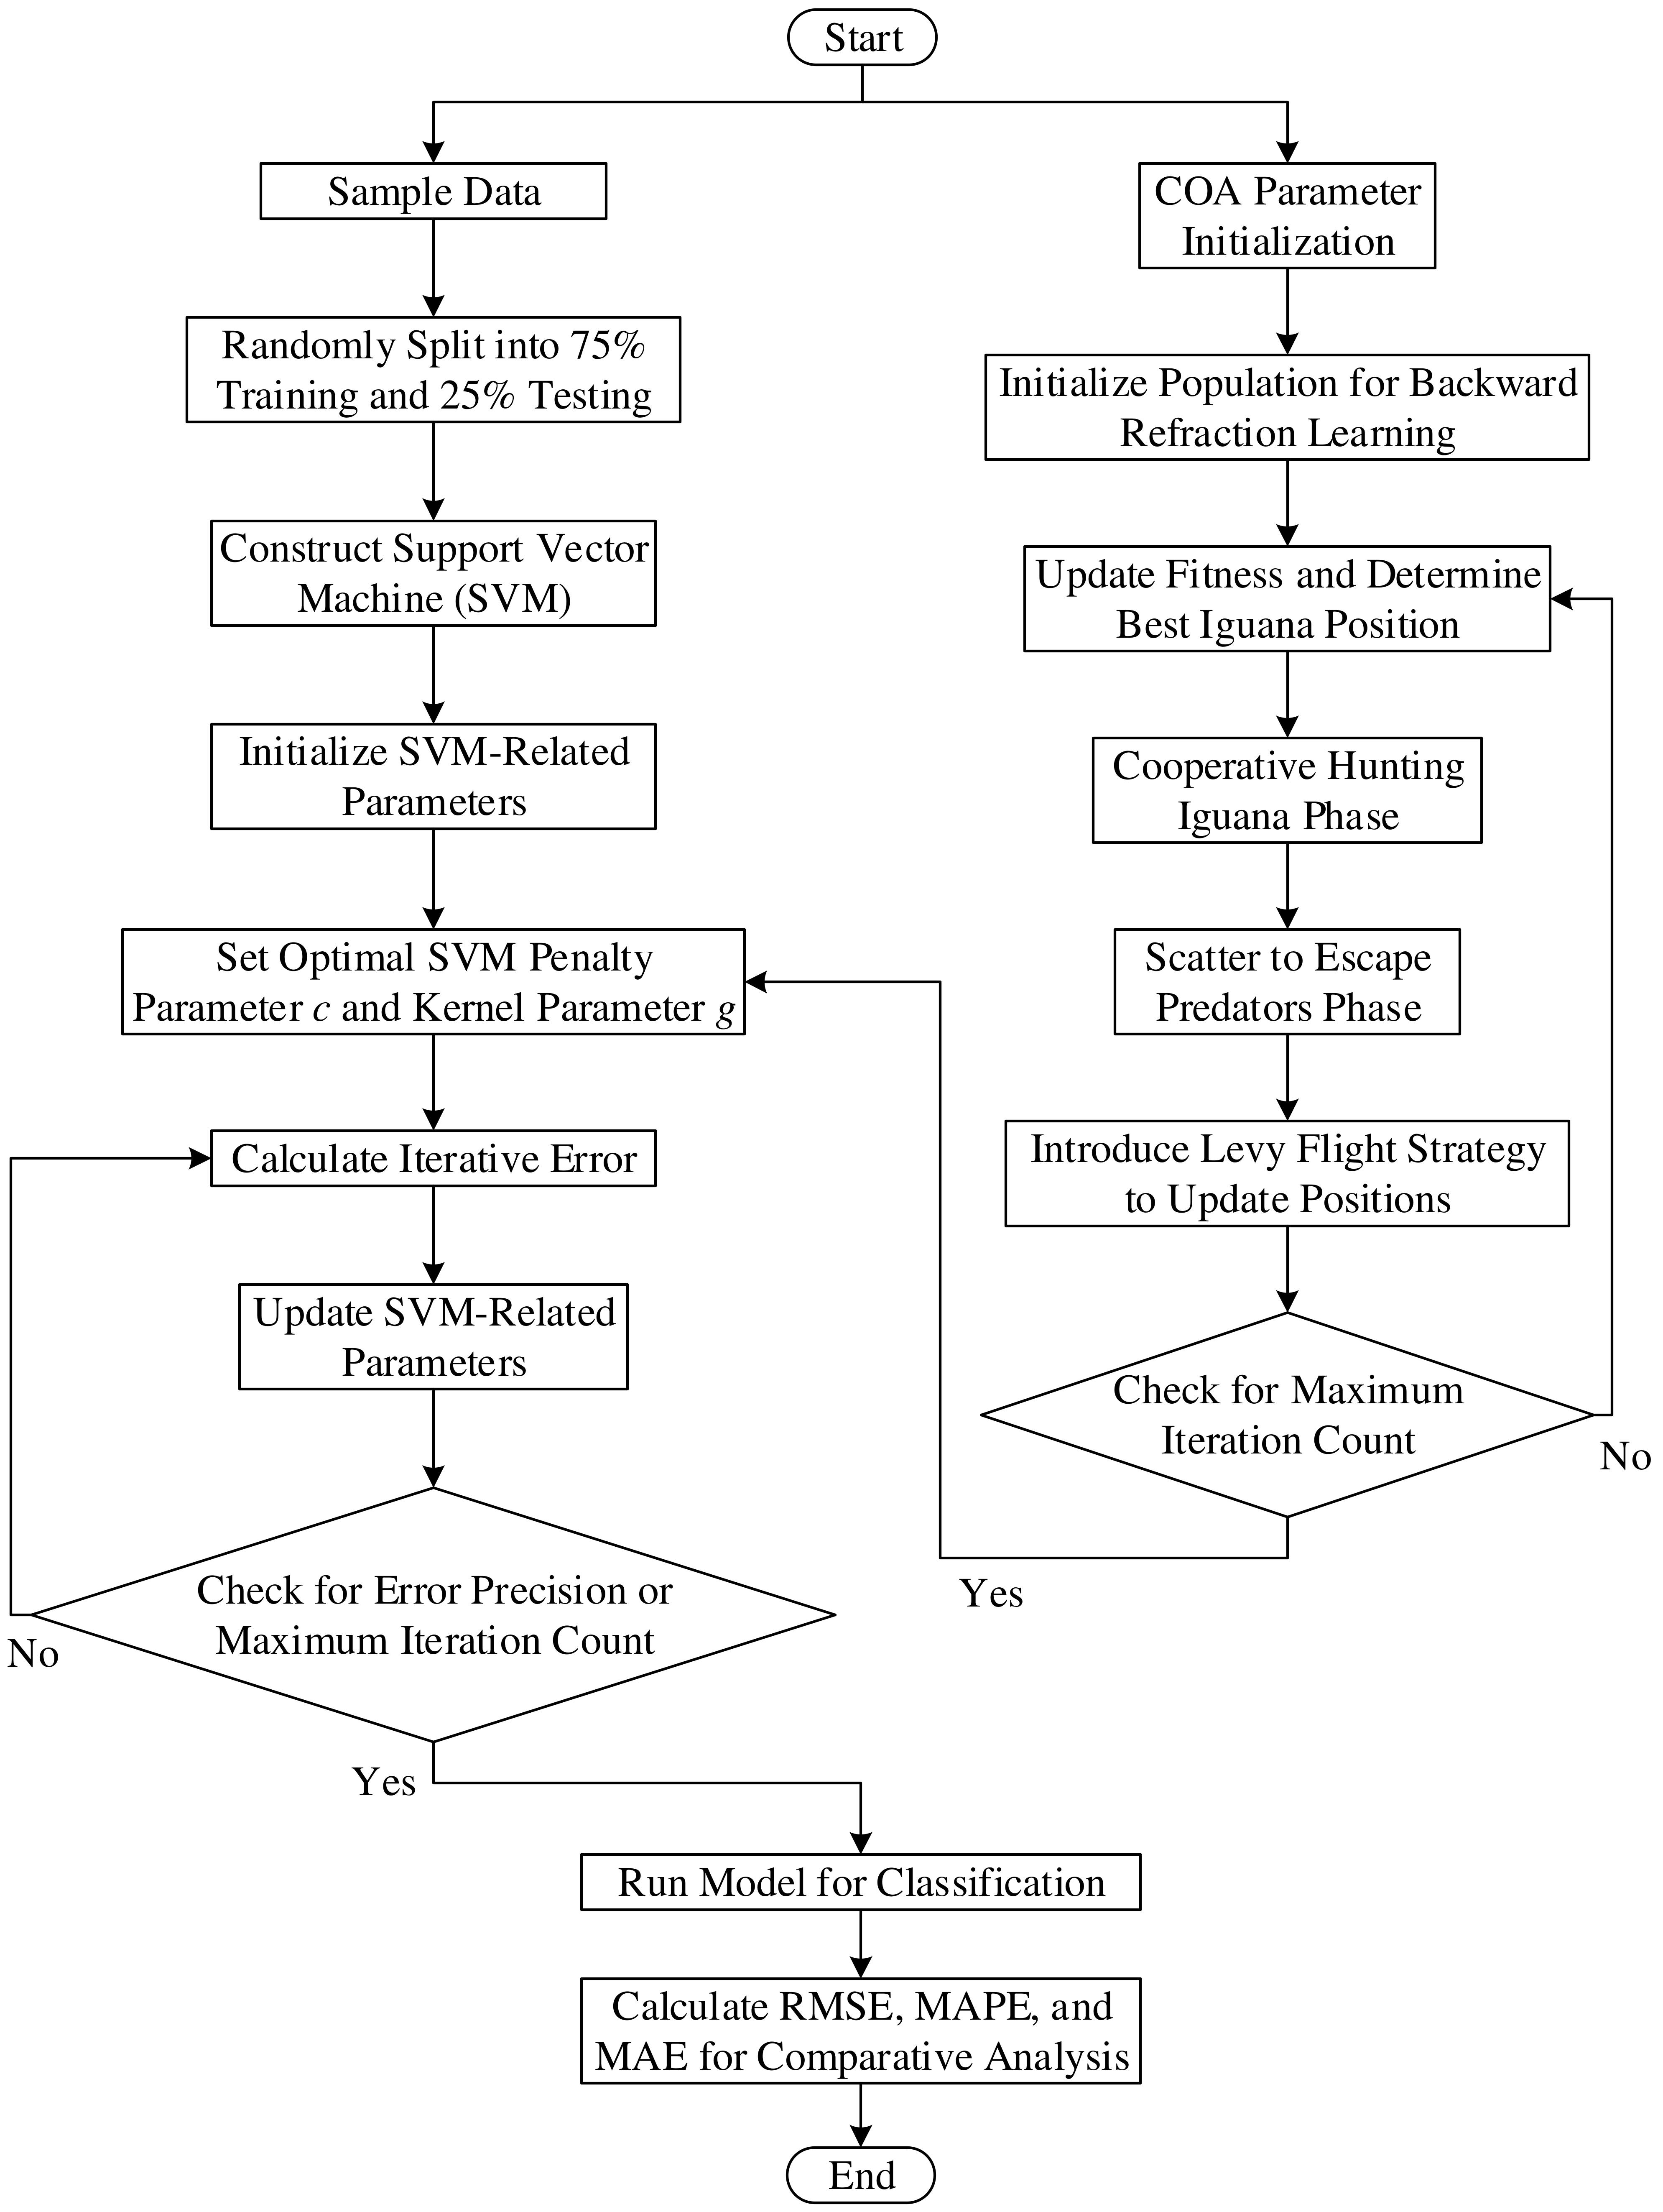
Currently, limited research has employed intelligent algorithms to assess the safety of transmission towers, and the prevailing evaluation methods for these towers exhibit significant subjectivity, as well as low accuracy and efficiency in their assessments. This research offers a transmission tower safety status model utilizing the improved coati optimization algorithm (ICOA) to enhance the SVM. The coati optimization algorithm (COA) is initially enhanced using back-refraction learning and the Levy flight strategy. The SVM’s penalty parameters and kernel functions are optimized utilizing the improved coati optimization algorithm (ICOA) to develop the transmission tower safety condition prediction model. Secondly, a finite element model of the transmission tower is constructed using ABAQUS 2020 software, and the dynamic response of the tower is simulated under various wind angles and loads. The simulated dataset and the ICOA-SVM method are employed to develop a predictive model for the safety condition of transmission towers, utilizing wind angle, wind speed, and ice thickness as inputs and the safety status of the transmission tower as the output. This not only enhances the maintenance and management of the transmission network but also mitigates potential safety risks and bolsters the reliability of the overall power supply, which holds significant practical significance for ensuring the safety of societal electricity use.
5. Example Analysis and Predicted Results
To assess the efficacy of the ICOA-SVM prediction model in optimizing practical problem solutions, a finite element model of transmission towers was developed in ABAQUS. The ICOA-SVM model was employed to classify and predict the safety status of the transmission towers by applying ice and wind loads while also varying the wind direction angle.
5.1. Modeling
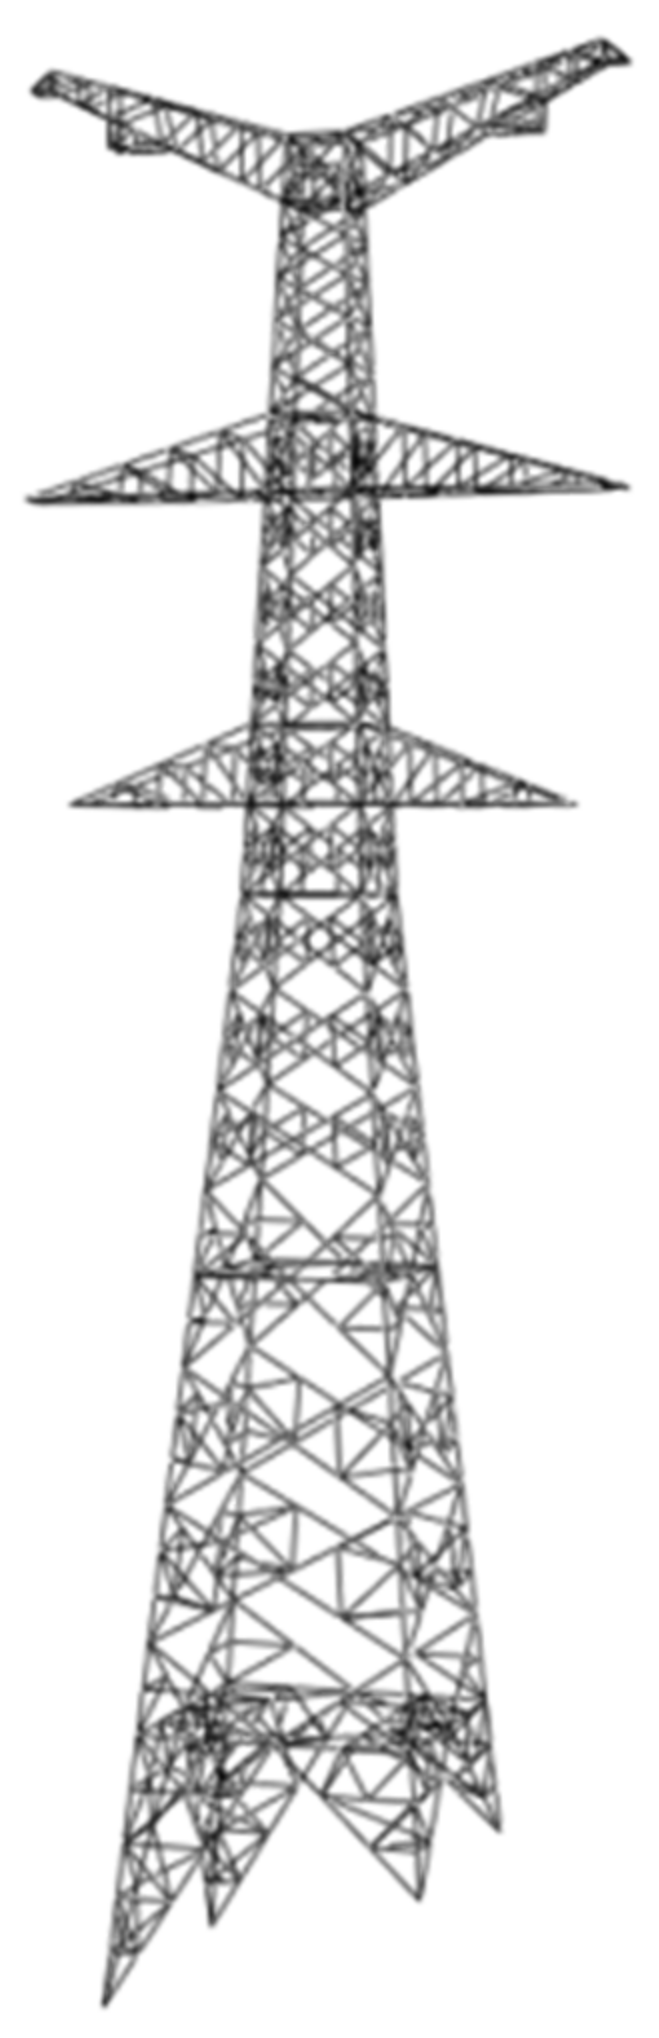
This study examines a 500 kV transmission line utilizing a straight-line tower, namely the SG2-42 model. The tower’s height is 68.35 m, with a nominal height of 42 m, and the distances between the front and rear gears are 421 m and 368 m, respectively. The primary material of the transmission towers is Q420 and Q345 steel, while the auxiliary components consist of Q235 steel. Based on the features of its rod load-bearing capacity, a finite element model is established using the B31 beam unit. The material characteristics of angle steel are presented in
Table 3.
Figure 4 illustrates the ABAQUS finite element model of the transmission tower.
5.2. Calculation and Application of Loads
Both tower–wire separation and coupling models require substantial modeling and computing effort, particularly when assessing wind speeds, wind angles, and other contributing factors. Similar static loading is employed for the finite element analysis of transmission towers to enhance efficiency and obtain a sufficiently big dataset.
Alongside the primary wind load, the transmission tower and the ground conductor must also account for their self-weight and the horizontal stress due to ice accumulation. The base of the transmission tower is established as a fixed constraint, disregarding the mutual vibrational effects between the tower and the conductor line. The horizontal wind load and the vertical load of the conductor are directly applied at the suspension point. At the same time, the tower structure is still subjected to wind load, followed by static analysis.
The self-weight load of the conductor–earth line is determined using the formula
The weight load of the ice is computed as
The associated horizontal wind loads on the conductors and ground are computed as follows:
where
n represents the number of sub conductors per phase;
q denotes the unit mass per unit length of the overhead line;
α signifies the unevenness coefficient of wind pressure;
W0 represents the standard value of the base wind pressure, while
μz is the height-dependent coefficient of wind pressure.
μsc represents the coefficient of the geometry of the conductive line.
βc is the correction coefficient for the wind load on the conductive line;
d represents the outer diameter of the conductive line, whereas
b denotes the thickness of the overlying ice.
Lp denotes the horizontal gear distance of the tower;
Lv signifies the vertical gear distance of the tower;
B denotes the wind load amplification coefficient due to underlying ice;
θ represents the angle between the wind direction and the ground wire direction.
5.3. Simulation Conditions and Results
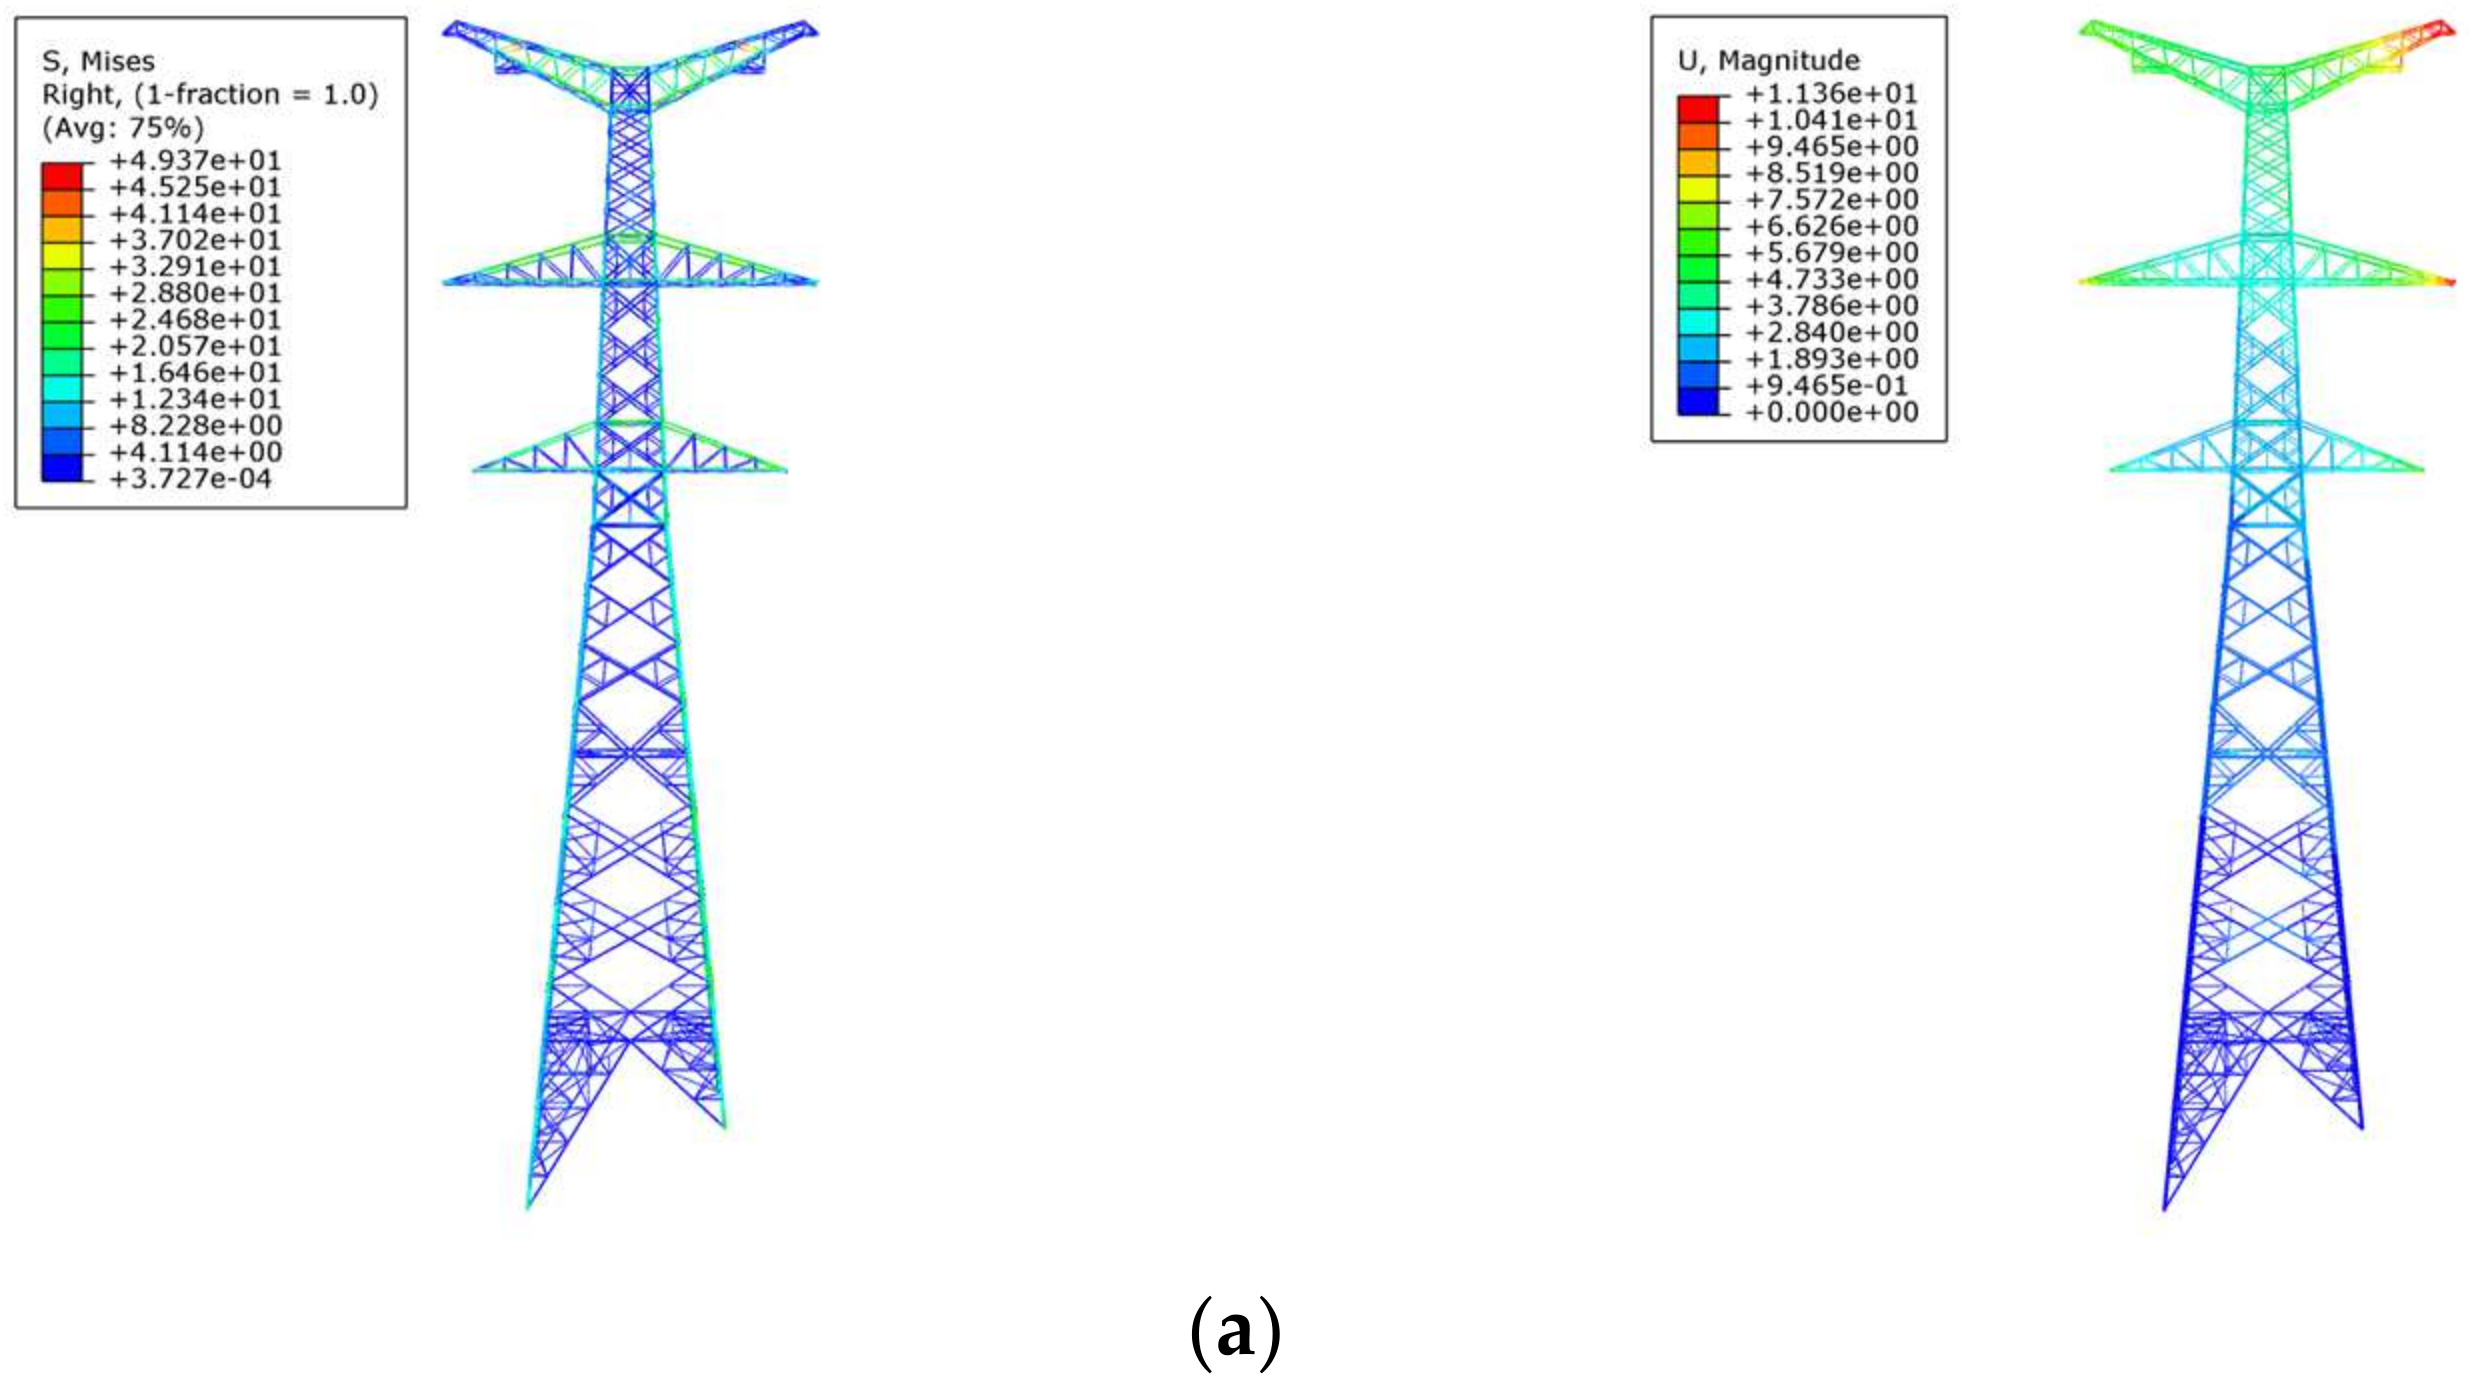
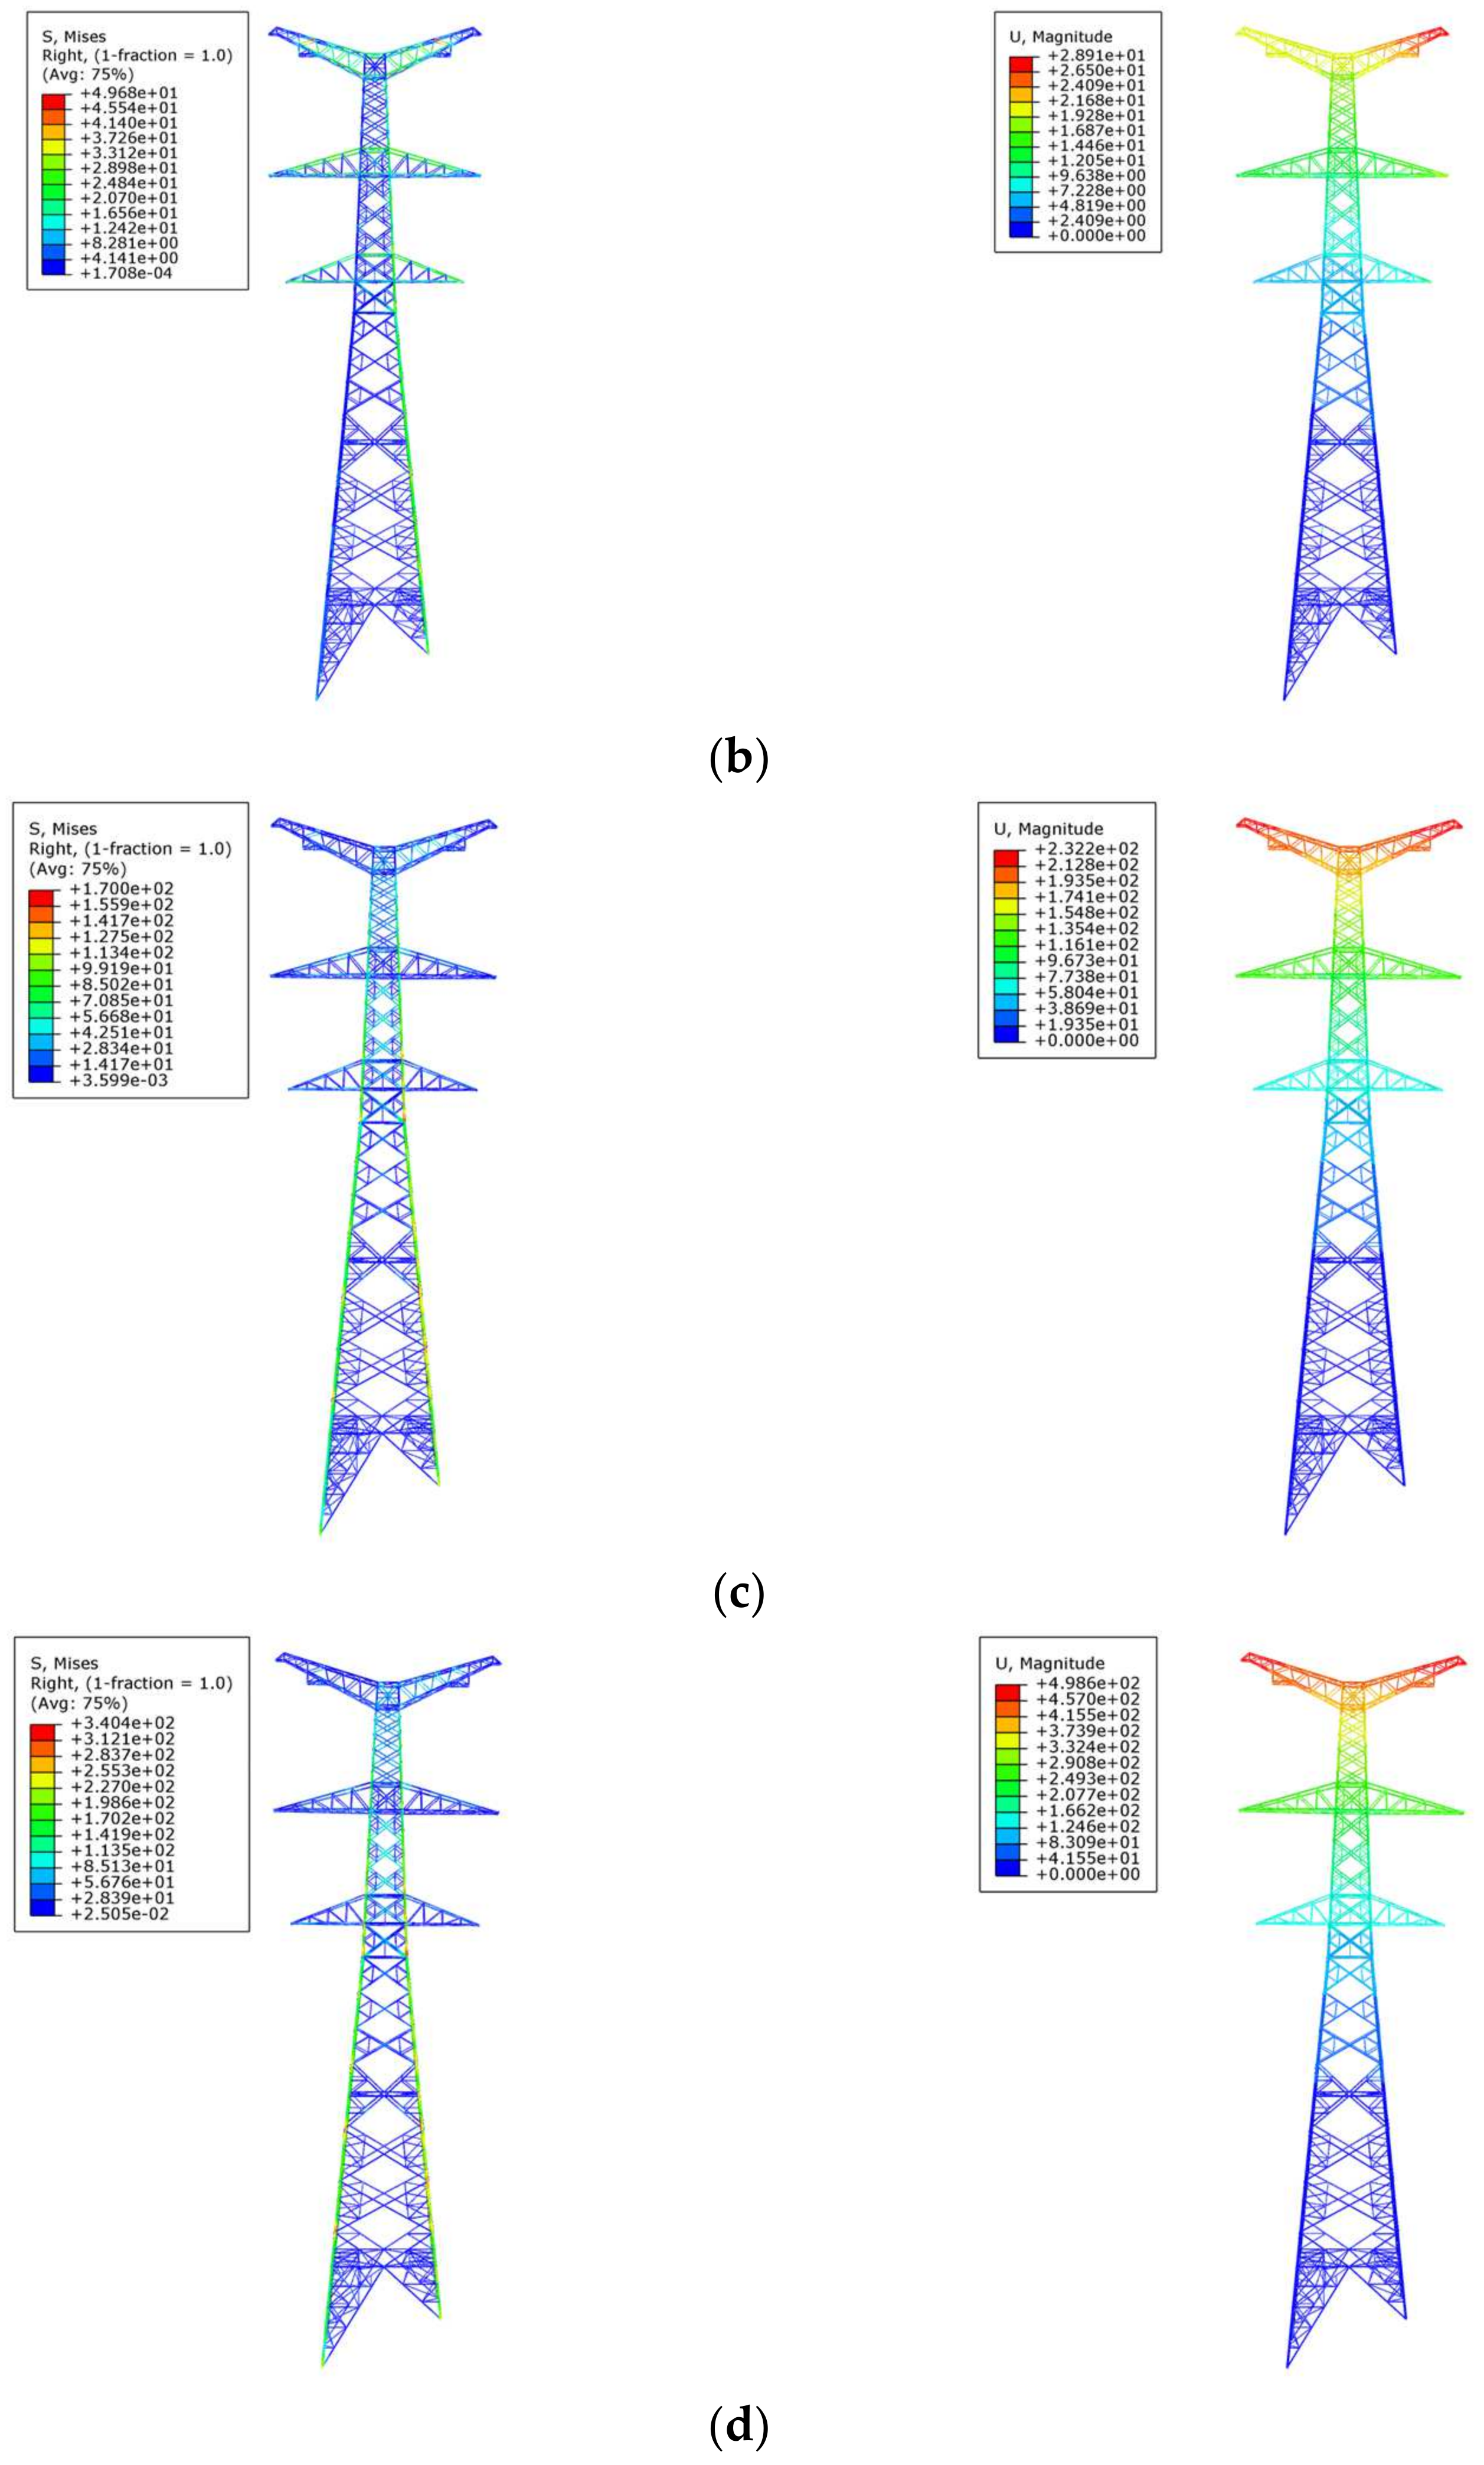
The transmission tower is intended for a wind speed of 30 m/s and an ice thickness of 10 mm. A wind speed ranging from 0 to 30 m/s is applied to the transmission tower, with increments of 2 m/s. Concurrently, the ice thickness is increased by 2 mm. Wind angles of 30°, 45°, 60°, and 90° are utilized, resulting in a total of 384 distinct wind and ice load conditions for simulation calculations. To facilitate comparison and analysis, the following four representative conditions are shown as examples of finite element simulation stress and displacement clouds, as seen in
Figure 5a–d.
Figure 5a,b illustrate that at a wind speed of 10 m/s, with no overlying ice, altering the wind angle does not significantly affect the maximum stress of the tower; however, the maximum displacement rises from 11.37 mm to 28.91 mm.
Figure 5b,c indicate that, with a wind angle of 90 degrees, the maximum stress escalates from 49.68 MPa to 170 MPa, while the maximum displacement increases from 28.91 mm to 232.2 mm.
Figure 5c,d demonstrate that the tower’s maximum stress and maximum displacement rise when only the ice thickness is modified. The alteration in wind angle primarily influences the stress distribution of the tower’s main material and the displacement magnitude of the tower head, whilst variations in wind speed and ice thickness impact the total stress magnitude and displacement size of the tower body.
5.4. Judging Criteria and Dataset Creation
To better illustrate the key factors influencing the safety status of transmission towers,
Table 4 summarizes the primary parameters considered in this study, along with their specific impacts on structural safety. These parameters were incorporated into the finite element modeling and dataset creation processes to ensure a comprehensive representation of real-world conditions. By systematically accounting for these influencing factors, this study aims to build a robust dataset that captures the variability and complexity of real-world scenarios.
Each parameter plays a critical role in determining the structural performance of transmission towers. For instance, wind speed significantly impacts the overall stress and displacement levels, with higher wind speeds leading to exponential increases in structural strain. Wind direction angles, such as 90°, cause asymmetrical stress distribution, often leading to maximum displacement at specific tower sections. Ice thickness, on the other hand, adds substantial weight to the structure, disproportionately affecting vertical rods and increasing both stress and displacement. These environmental factors interact with the tower’s material properties and geometry, determining its load-bearing capacity and overall safety classification under various conditions. The operating condition classification system, ranging from “Safe” to “Unsafe”, provides a standardized framework for quantifying safety risks. This classification is derived from a combination of key parameters, ensuring a holistic evaluation of structural stability. Additionally, the geometry and material properties of the tower define its resilience to these external forces. High-strength steel grades, such as Q420, enhance the tower’s ability to withstand severe conditions, while specific geometrical configurations help optimize force distribution and minimize structural deformations. The integration of these parameters into the finite element model ensures that the ICOA-SVM prediction framework is trained and evaluated on a dataset that accurately reflects real-world operational conditions. This comprehensive approach enhances the robustness of the proposed model and underscores its applicability to diverse environmental scenarios. Future work could further refine the parameter ranges and explore additional influencing factors, such as long-term material degradation and dynamic interactions between accessories and the tower structure, to improve the model’s accuracy and generalizability.
This study evaluates the safety state of transmission towers under various operational settings by analyzing their operational status and safety level through a risk assessment methodology. This risk evaluation graphically quantifies and delineates the safety level of transmission towers under various loading circumstances, offering a scientific foundation for routine operation and maintenance. Numerous experts and researchers, both domestically and internationally, have researched the assessment of transmission tower structural system failures [
29,
30]. The transmission tower construction is often deemed to have failed if it reaches one of the following three conditions:
- (1)
The structure transforms into a mechanism: the criterion for judgement is that, when some members fail, the total stiffness matrix of the remaining members exhibits singularity, resulting in the non-convergence of the ABAQUS calculation program;
- (2)
Structural deformation surpasses the allowable threshold: It is generally accepted that the maximum displacement response limit of the transmission tower is situated at its apex, and if the displacement at the top of the tower exceeds a specified value, it is deemed indicative of structural damage;
- (3)
The structure cannot endure additional loads or the initial occurrence of bearing capacity decline, mostly evidenced by excessive stress ratios in the tower’s main components. This results in damage and is subsequently classified as structural failure.
Integrating the three points above and referencing the pertinent literature [
31,
32] and regulations [
33,
34], the criteria for assessing the safety state of transmission towers, as delineated in
Table 5, categorize the operational state into four classifications: safe, safer, basic safety, and unsafe. Here,
represents the component stress ratio (the ratio of the maximum stress position to its yield stress),
l denotes the tower top displacement, and
h signifies the tower height.
According to the above transmission tower safety status assessment standard, the simulation data are classified. The tower status is divided into four categories: safe, relatively safe, basically safe, and unsafe, and the numbers 1, 2, 3, and 4 are used for abbreviation (the most unfavorable state is taken when the operating status categories are inconsistent). Then, 384 sets of data obtained by simulation are selected for experiments, and 75% of the sample data are randomly divided as the training set for the training of the transmission tower safety status prediction model. The remaining 25% of the sample data are used as the test set to test the accuracy of the model. The transmission tower safety status dataset is shown in
Table 6.
5.5. Forecast Results and Analysis
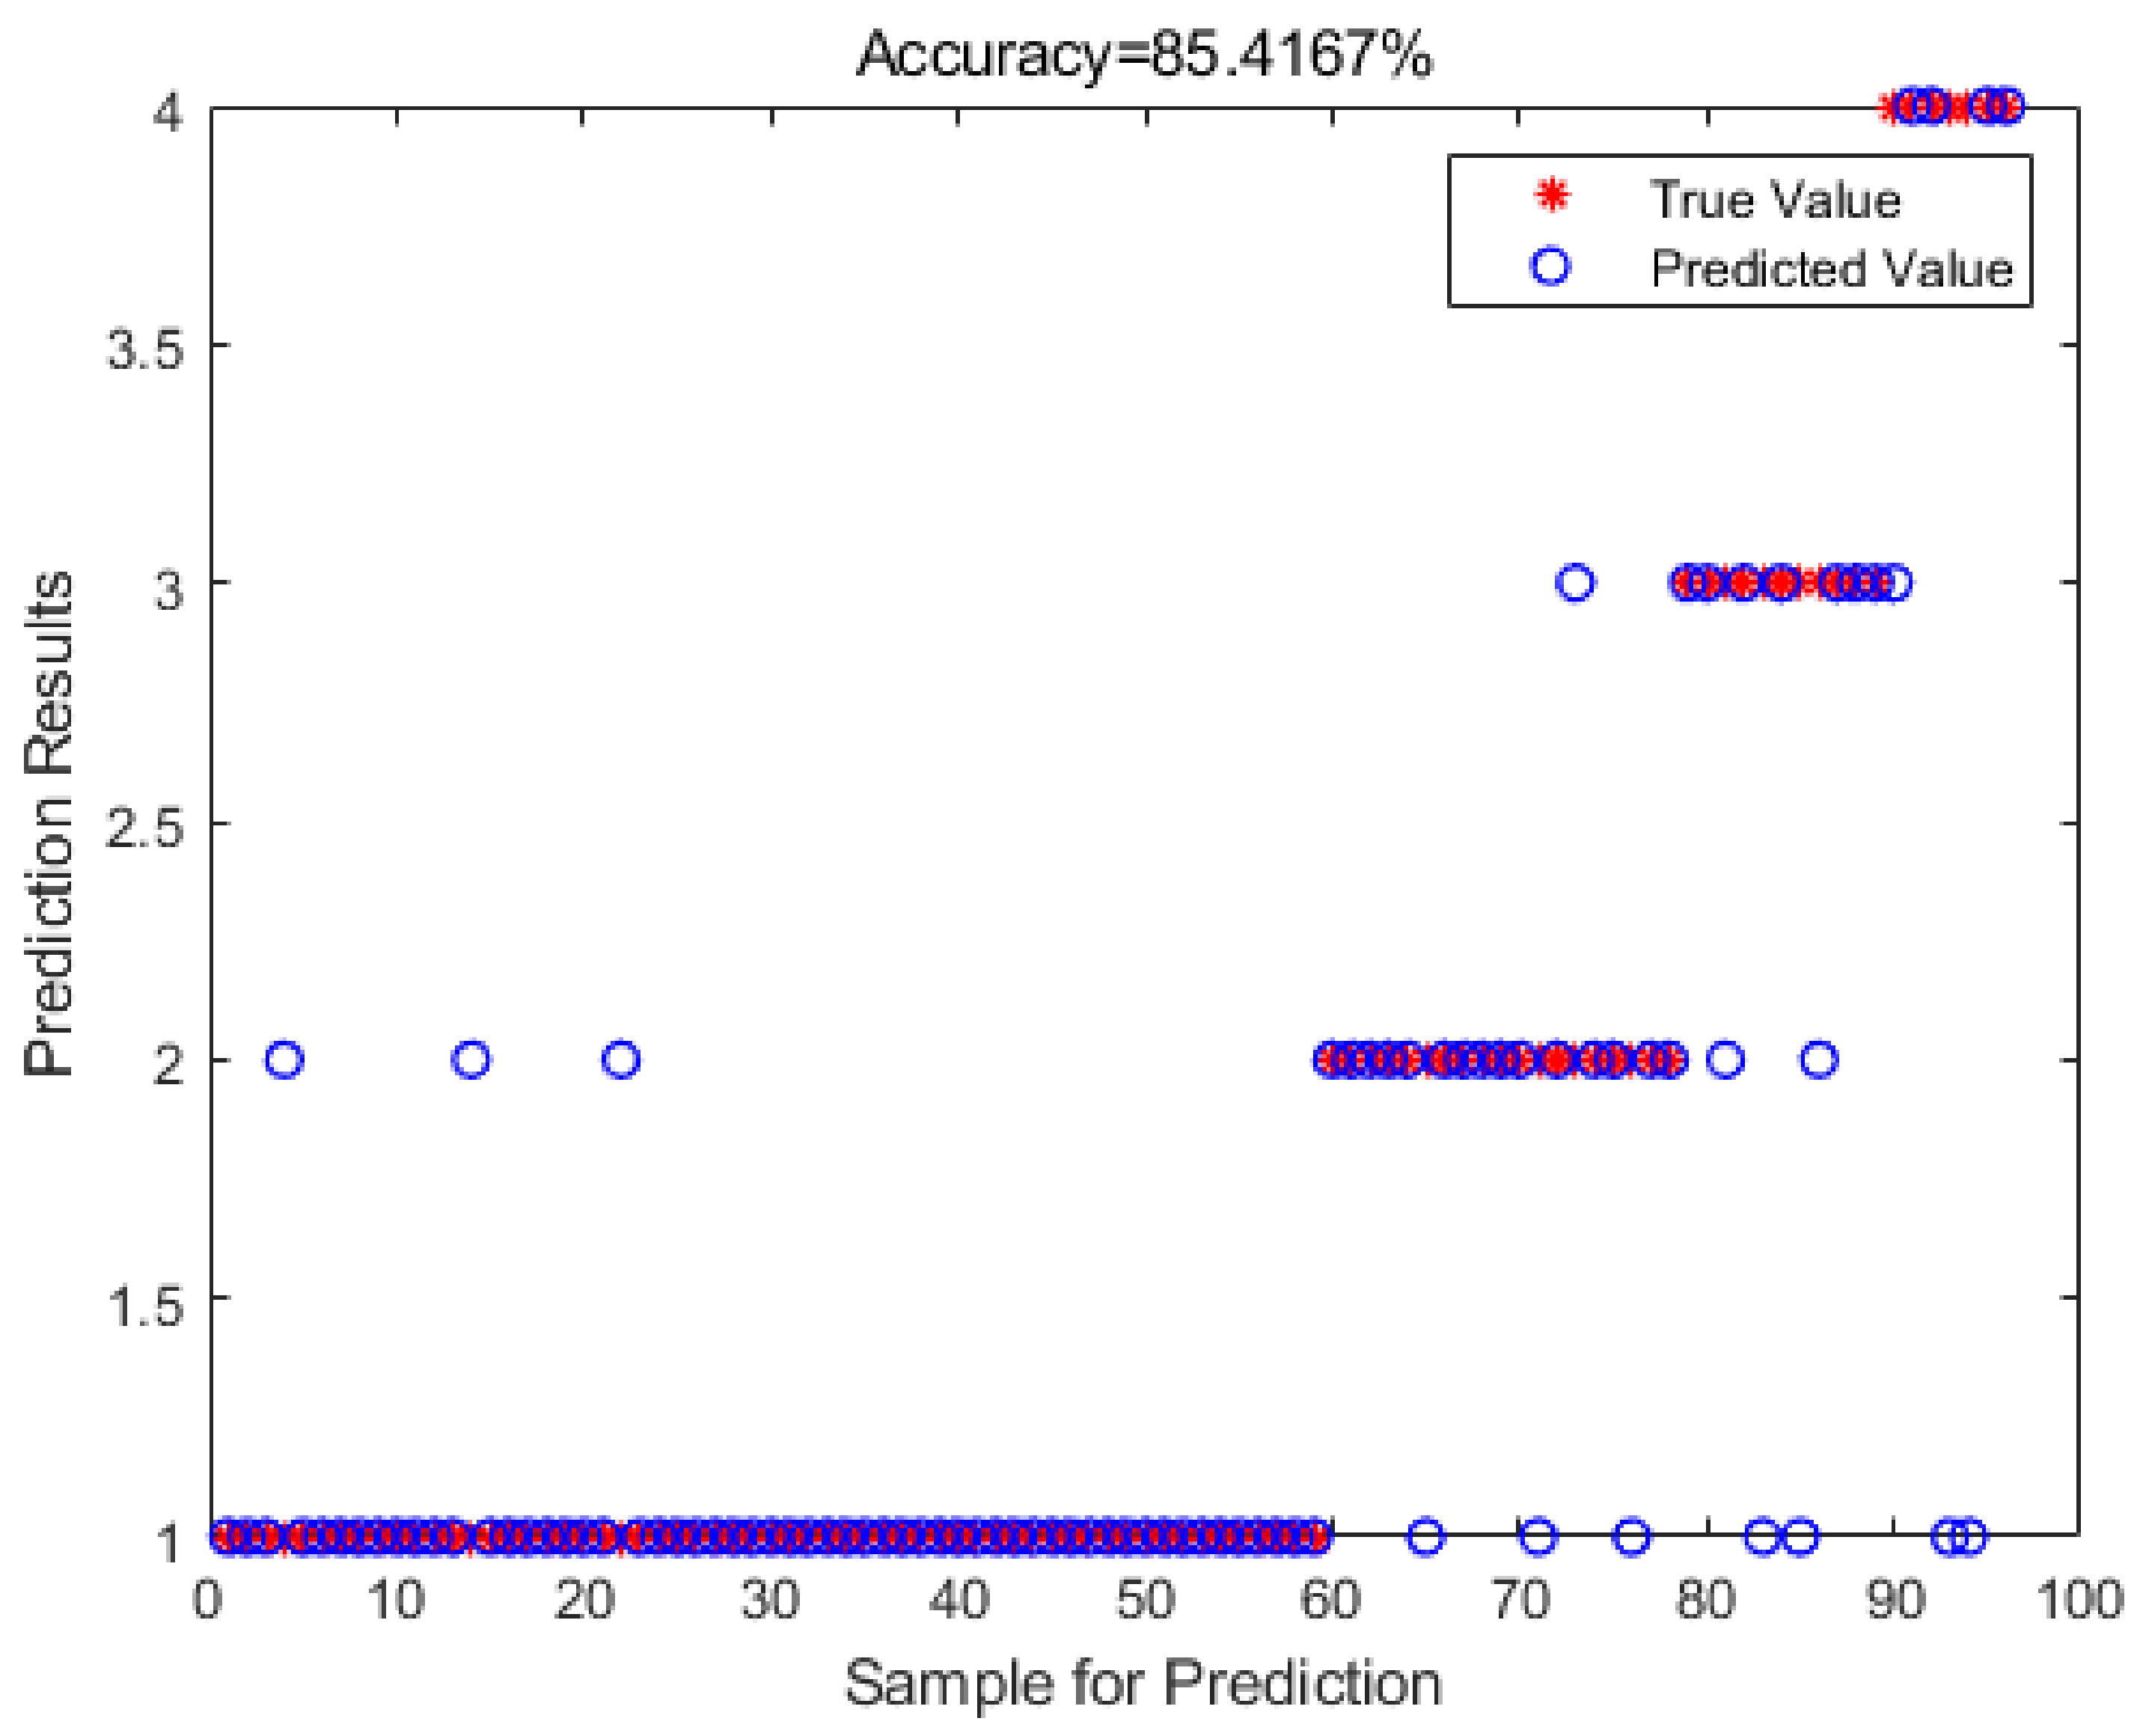
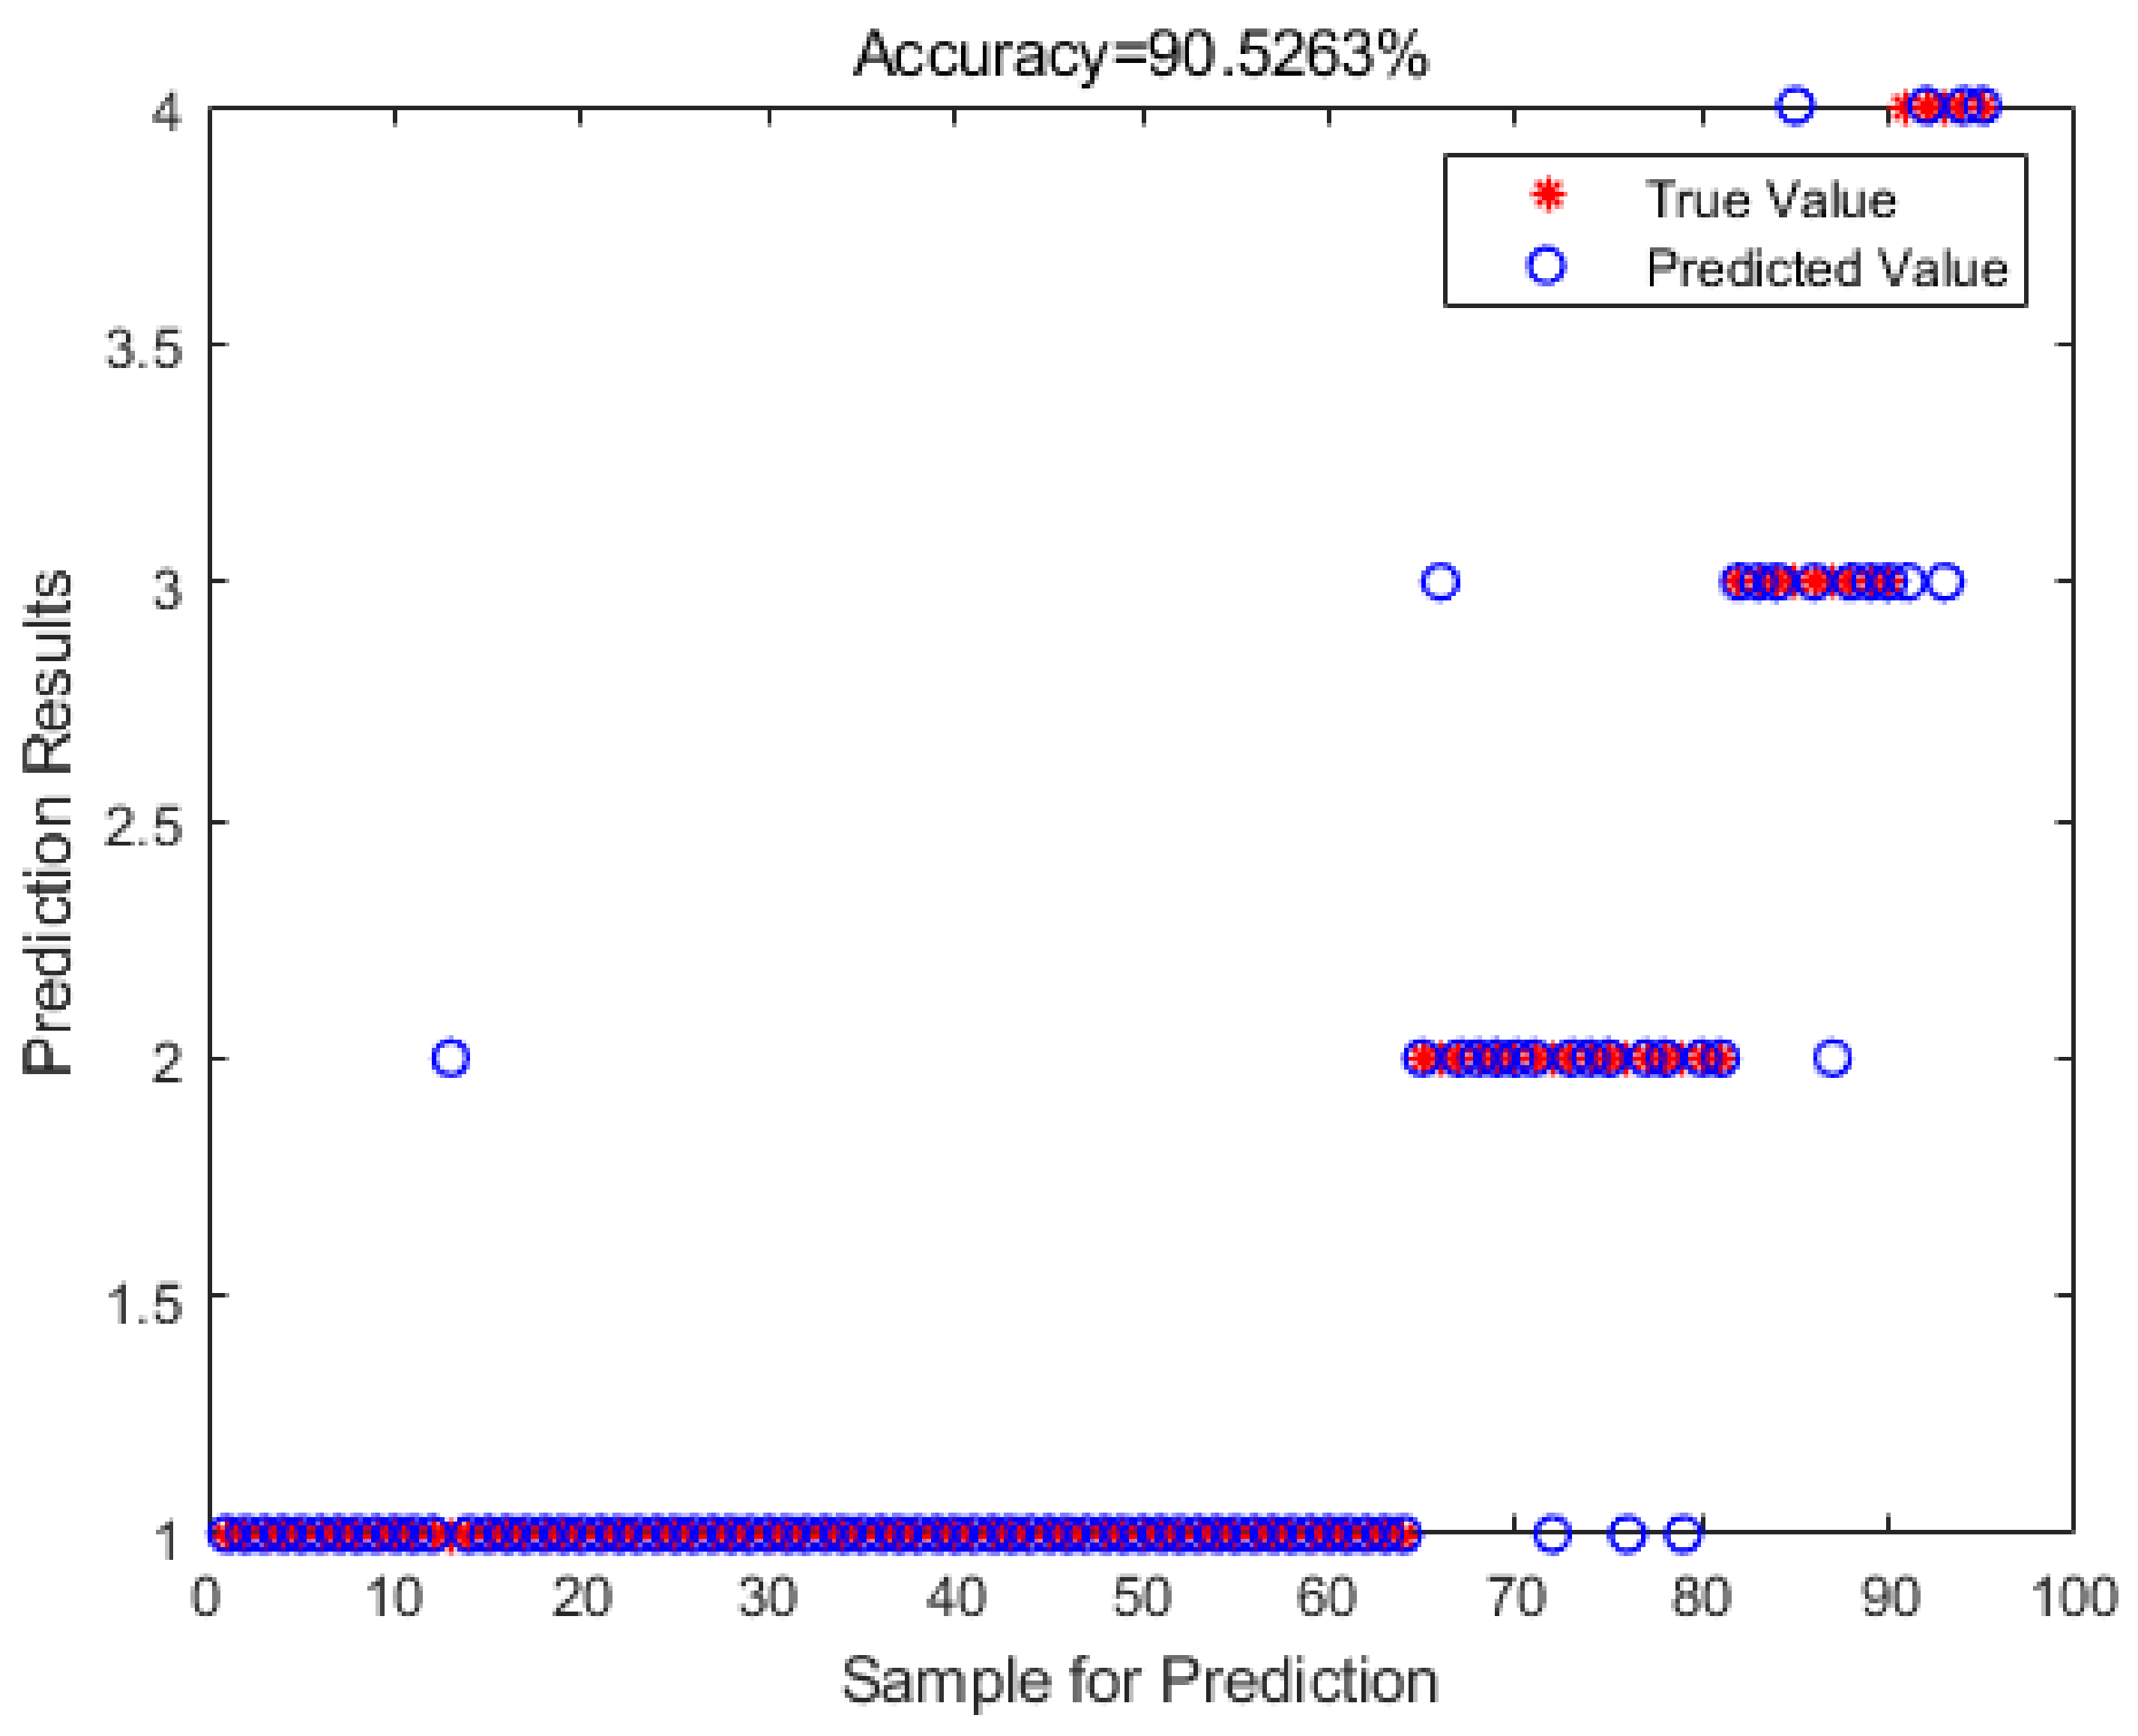
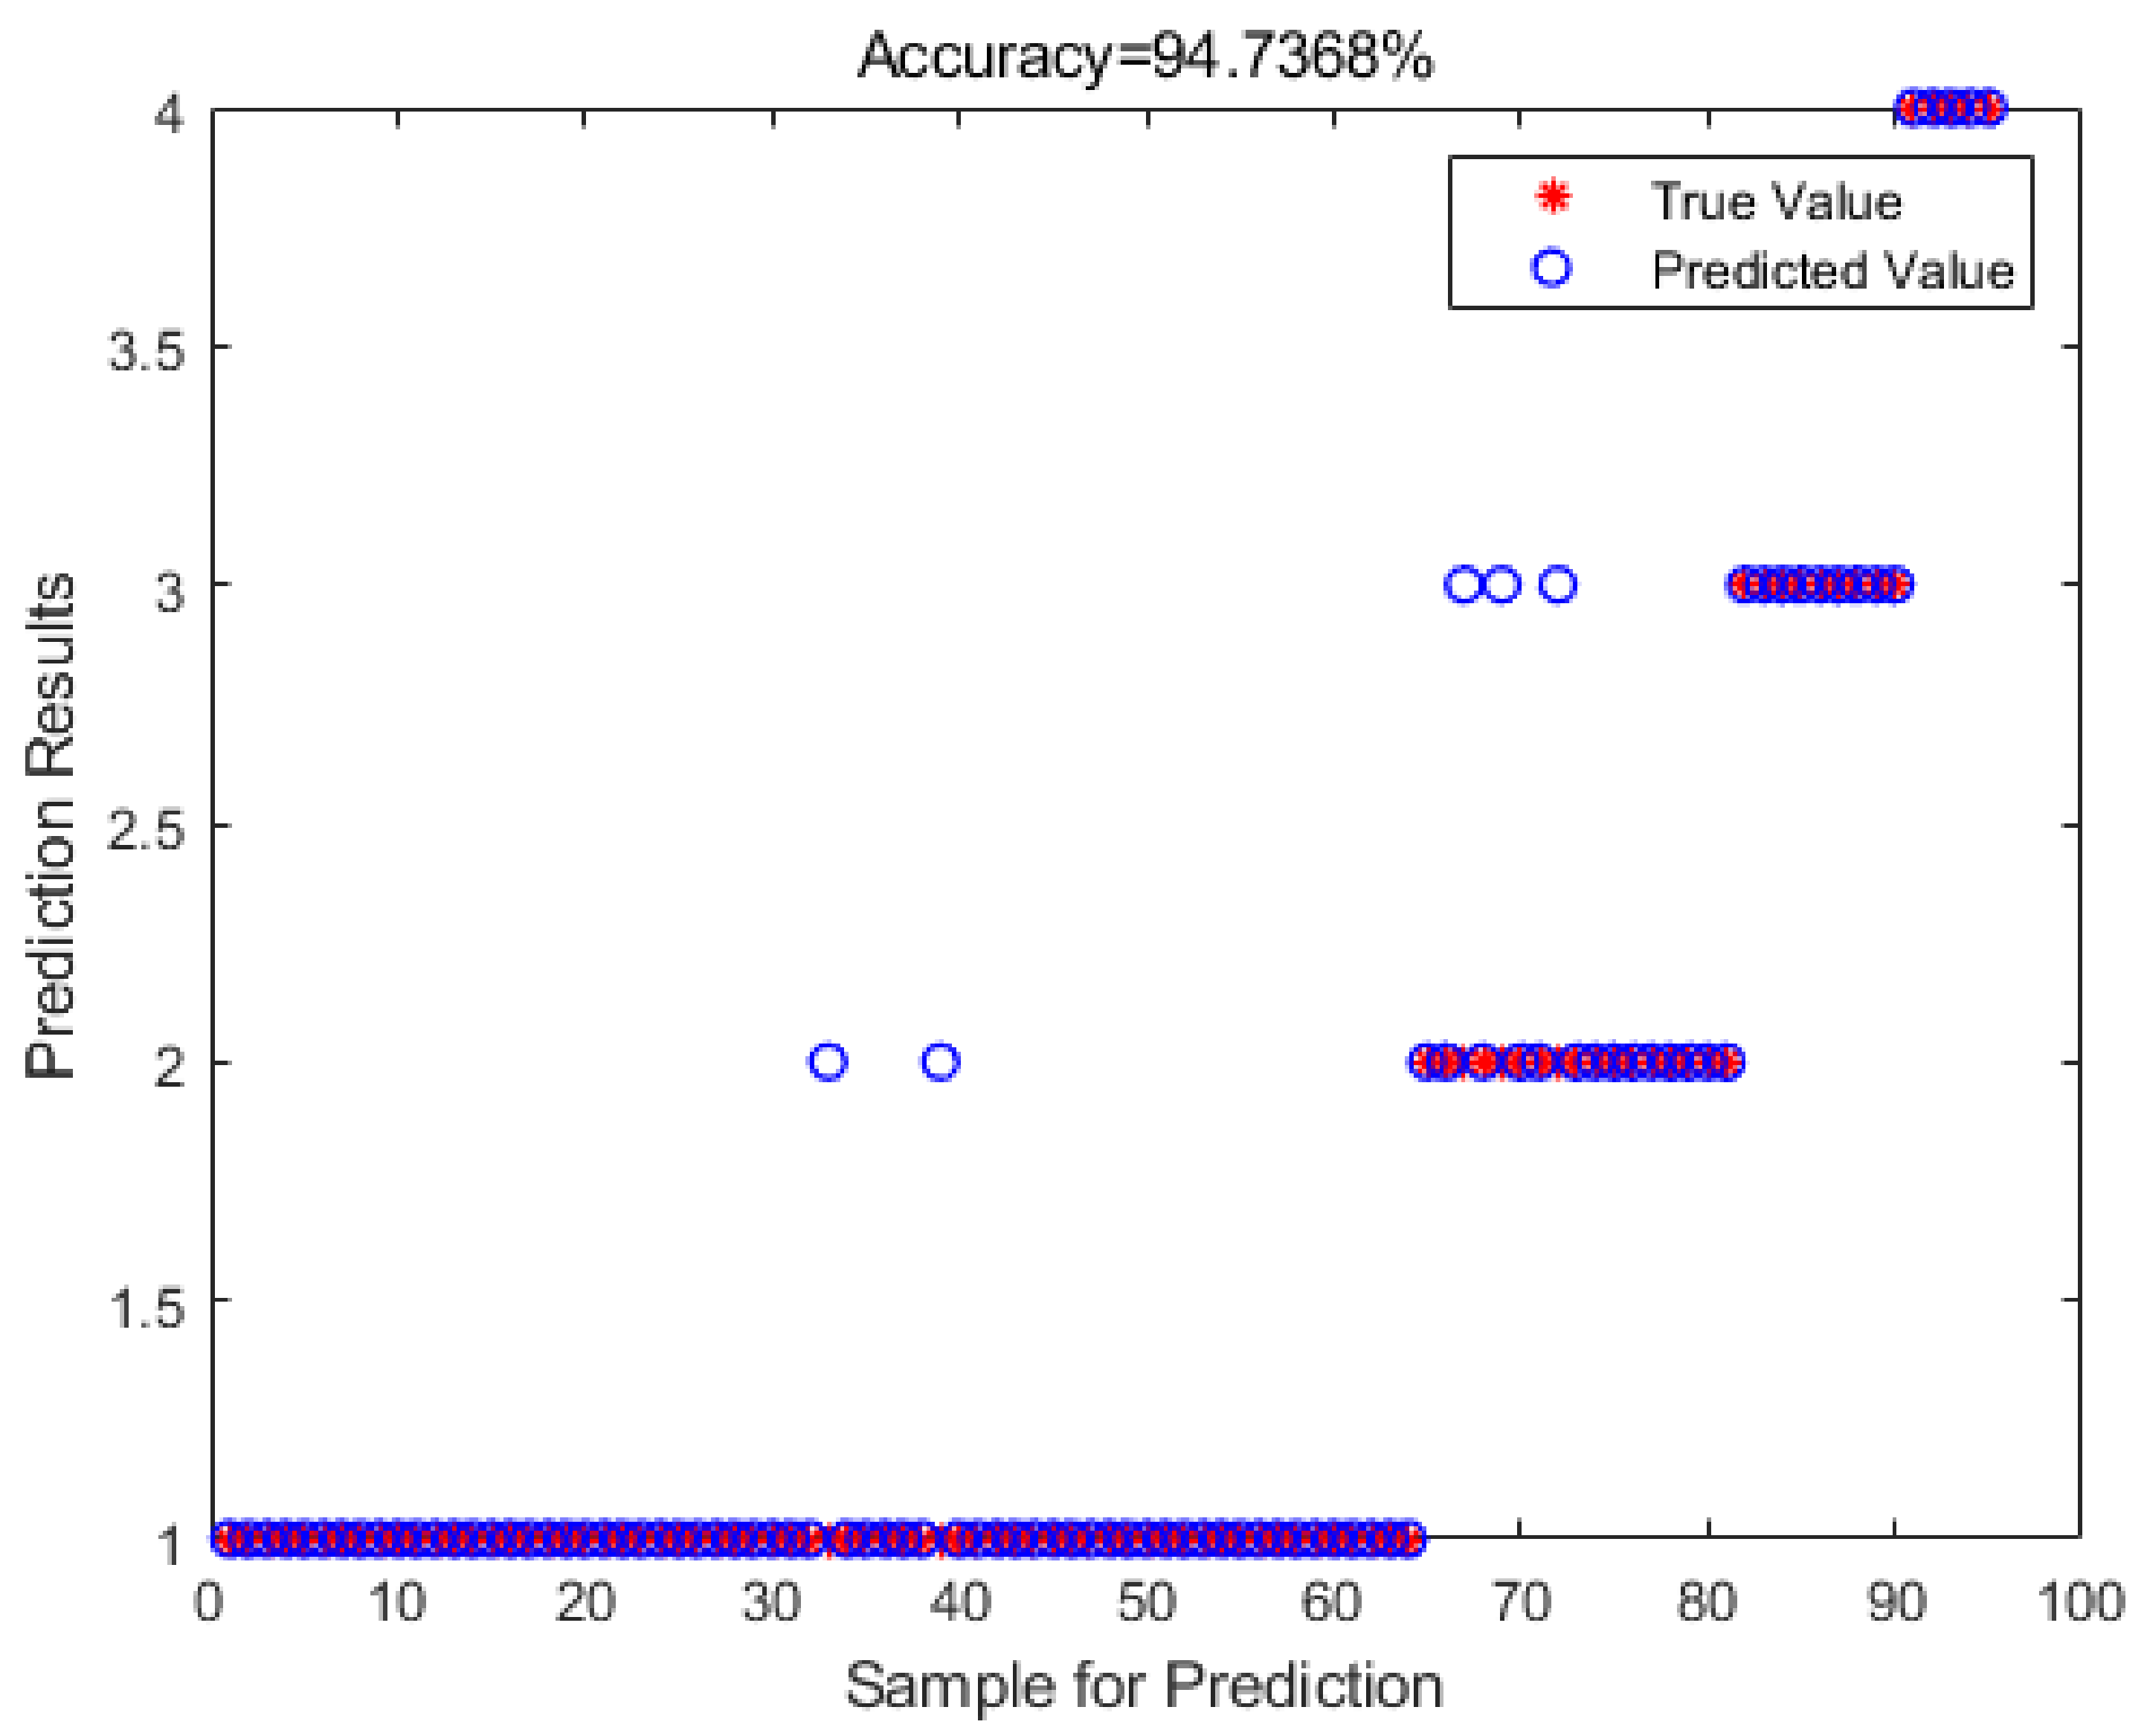
To ascertain that the SVM model enhanced by the improved coati optimization algorithm (ICOA-SVM) possesses superior efficacy in predicting the outcomes of the safety state classification of transmission towers, a comparative analysis is conducted against the conventional SVM model and the unimproved COA-SVM model. The findings of the comparison are presented in
Figure 6,
Figure 7 and
Figure 8.
The ICOA-SVM model demonstrates superior predictive performance relative to the other two models when analyzing the same transmission tower safety state data, exhibiting minimal error with only five erroneous datasets and an accuracy of 94.7368%. In contrast, the COA-SVM model presents nine erroneous datasets and an accuracy of 90.5263%. The unoptimized SVM model shows 14 erroneous datasets and an accuracy of 85.4167%, indicating that the traditional SVM model is less effective in predicting the classification results when it is not optimized.
To effectively demonstrate that the ICOA-SVM model exhibits superior accuracy in forecasting the outcomes of safety state classification for transmission towers, we assess the predictive performance of the three models by computing the root mean square error (RMSE), the mean absolute percentage error (MAPE), and the mean absolute error (MAE). Utilize mean absolute error (MAE) to evaluate the predictive efficacy of the three models. The equations for the three error calculation formulas above are shown in Equations (14)–(16), and the computational results are displayed in
Table 7.
where
n represents the quantity of predicted values,
yi signifies the true value, and
yi′ indicates the forecasted value.
To further ensure the robustness and generalizability of the ICOA-SVM model, a 5-fold cross-validation strategy was applied during the training phase. This approach divides the dataset into five equal parts, where four parts are used for training and the remaining part for validation in each iteration. The process is repeated five times, ensuring that each subset serves as a validation set exactly once. This strategy minimizes the risk of overfitting and provides a comprehensive evaluation of the model’s performance across varying data splits. The cross-validation results demonstrate consistent improvements across all metrics (RMSE, MAPE, MAE), further validating the reliability of the proposed framework.
Table 7 indicates that the SVM model exhibits the highest error values across all metrics, with an RMSE of 0.6124, a MAPE of 0.0911, and an MAE of 0.2083, highlighting its relatively poor predictive performance compared to other models. While random forests (RFs), neural networks (NNs), and gradient boosting (GB) show improved accuracy, their performance remains inferior to that of the ICOA-SVM model. The reduction in errors (RMSE, MAPE, MAE) in the ICOA-SVM model can be attributed to the efficient parameter optimization achieved by the improved coati optimization algorithm (ICOA). Specifically, the inverse refraction learning and Levy flight strategy in ICOA facilitate a more effective exploration of the solution space, preventing the algorithm from becoming trapped in local optima and ensuring optimal SVM parameters, such as the penalty parameter
c and the kernel parameter
g.
Notably, ICOA-SVM achieves the best results among all models, with an RMSE of 0.2294, a MAPE of 0.0368, and an MAE of 0.0521, demonstrating significant improvements of 62.5%, 59.6%, and 75.0%, respectively, over the baseline SVM model. This reduction stems from the precise tuning of SVM parameters, which allows the model to capture complex nonlinear relationships in the data more effectively than other models. Even when RFs, NNs, and GB are optimized using COA and ICOA, their errors remain slightly higher than those of ICOA-SVM, underscoring the superior suitability of SVM for this task when combined with ICOA. Additionally, the ICOA framework enhances predictive performance in RF, NN, and GB models by refining their parameter settings, yet the flexibility and structure of SVM seem to align better with the optimization capabilities of ICOA. These findings highlight the effectiveness of ICOA in enhancing predictive accuracy and the robustness of the ICOA-SVM framework for forecasting the safety status of transmission towers. Together, these results provide a reliable reference for the secure operation and proactive maintenance of critical infrastructure.
5.6. Discussion of Analytical Results
From the above results, several critical insights can be analyzed regarding the performance and applicability of the proposed ICOA-SVM model. First, the results indicate that the integration of the improved coati optimization algorithm (ICOA) with the support vector machine (SVM) significantly enhances prediction accuracy compared to the conventional SVM and COA-SVM models. As shown in
Table 7, the ICOA-SVM model achieved the lowest RMSE (0.2294), MAPE (0.0368), and MAE (0.0521), representing reductions of 62.5%, 59.6%, and 75.0%, respectively, when compared to the traditional SVM. These substantial reductions in error metrics highlight the effectiveness of the ICOA in optimizing SVM parameters, specifically the penalty parameter
c and kernel parameter
g. The use of inverse refraction learning and the Levy flight strategy within the ICOA framework ensured better exploration of the solution space, thereby mitigating issues of local optima that often hinder conventional optimization methods.
Second, the finite element modeling (FEM) results provide valuable insights into the structural response of the transmission towers under different environmental conditions. For instance, the stress and displacement patterns in
Figure 5a–d reveal that the wind angle significantly influences the stress distribution and displacement magnitude, while wind speed and ice thickness directly impact the overall stress and displacement levels. These observations validate the importance of incorporating diverse environmental factors, such as wind speed, wind angle, and ice thickness, into the training data for the predictive model. By simulating a comprehensive range of conditions (384 cases), the FEM results provided a robust dataset for training and evaluating the ICOA-SVM model, ensuring its applicability to real-world scenarios.
Third, the classification results from the ICOA-SVM model demonstrate its robustness and adaptability. As seen in the safety state predictions, the model accurately classified the transmission tower’s safety status across varying conditions with an accuracy of 94.74%, outperforming both COA-SVM (90.53%) and traditional SVM (85.42%). This consistency across different environmental scenarios underscores the model’s ability to generalize well, making it a reliable tool for structural risk assessment. The ability to handle diverse input conditions ensures that the ICOA-SVM model can provide early warnings for potentially unsafe states, supporting proactive maintenance and reducing the likelihood of structural failures.
Lastly, the practical implications of this study are significant. The proposed methodology not only improves prediction accuracy but also offers a scalable approach for assessing the safety of transmission towers in mountainous or harsh environments. By combining advanced simulation techniques, such as FEM, with intelligent optimization algorithms, this study establishes a framework that can be extended to other structural systems requiring safety assessments. The results demonstrate that the ICOA-SVM model is a reliable and efficient tool for power transmission infrastructure management, enabling early detection of structural risks and reducing maintenance costs while ensuring operational reliability.
6. Research Implications
The findings of this study have both theoretical and practical implications. Theoretically, the proposed ICOA-SVM model extends the application of intelligent optimization algorithms to structural safety prediction. By integrating advanced techniques like inverse refraction learning and Levy flight strategies, this study improves the predictive capabilities of SVMs for nonlinear, high-dimensional, and small-sample problems. These advancements contribute to the broader field of machine learning and optimization, offering a novel approach for addressing safety-critical tasks in infrastructure management.
Practically, this study provides a reliable and efficient methodology for assessing the safety of transmission towers under complex environmental conditions. The ICOA-SVM model demonstrated superior performance in accurately predicting the safety states of transmission towers across a range of wind speeds, wind angles, and ice thicknesses. This predictive capability enables timely detection of unsafe conditions, supporting proactive maintenance strategies and reducing the risk of structural failures. Furthermore, the methodology is scalable and can be adapted to other types of infrastructure, making it valuable for improving the reliability and resilience of power transmission systems in diverse geographic and environmental contexts.
The findings also highlight the model’s adaptability to varying geographic conditions. While this study primarily focuses on transmission towers in mountainous regions, the ICOA-SVM framework is flexible and can be applied to non-mountainous areas by incorporating location-specific environmental factors such as wind speed, wind angles, and ice loads into the dataset. This adaptability ensures the model’s practical utility for diverse transmission tower types, supporting its scalability across a wide range of geographic and environmental contexts. Future studies can further validate its effectiveness by incorporating real-world data from non-mountainous terrains to ensure robust generalization.
These implications underscore the significance of combining finite element simulations with intelligent optimization techniques, paving the way for future studies to explore similar approaches in other fields, such as civil engineering, transportation, and renewable energy systems.
7. Conclusions
This paper addresses safety issues that may arise in mountain transmission towers due to complex natural conditions, including rod damage and reduced bearing capacity. We propose a prediction model for the safety status of transmission towers utilizing the ICOA-SVM, enabling the forecasting of their safety state. The following conclusions are drawn:
- (1)
During the finite element simulation, the force condition of the tower structure was assessed by varying the wind angle, wind speed, and ice thickness. The alteration of wind angle primarily influences the stress distribution of the tower’s main material and the displacement of the tower head. However, variations in wind speed and ice thickness impact both the force and displacement of the entire tower structure.
- (2)
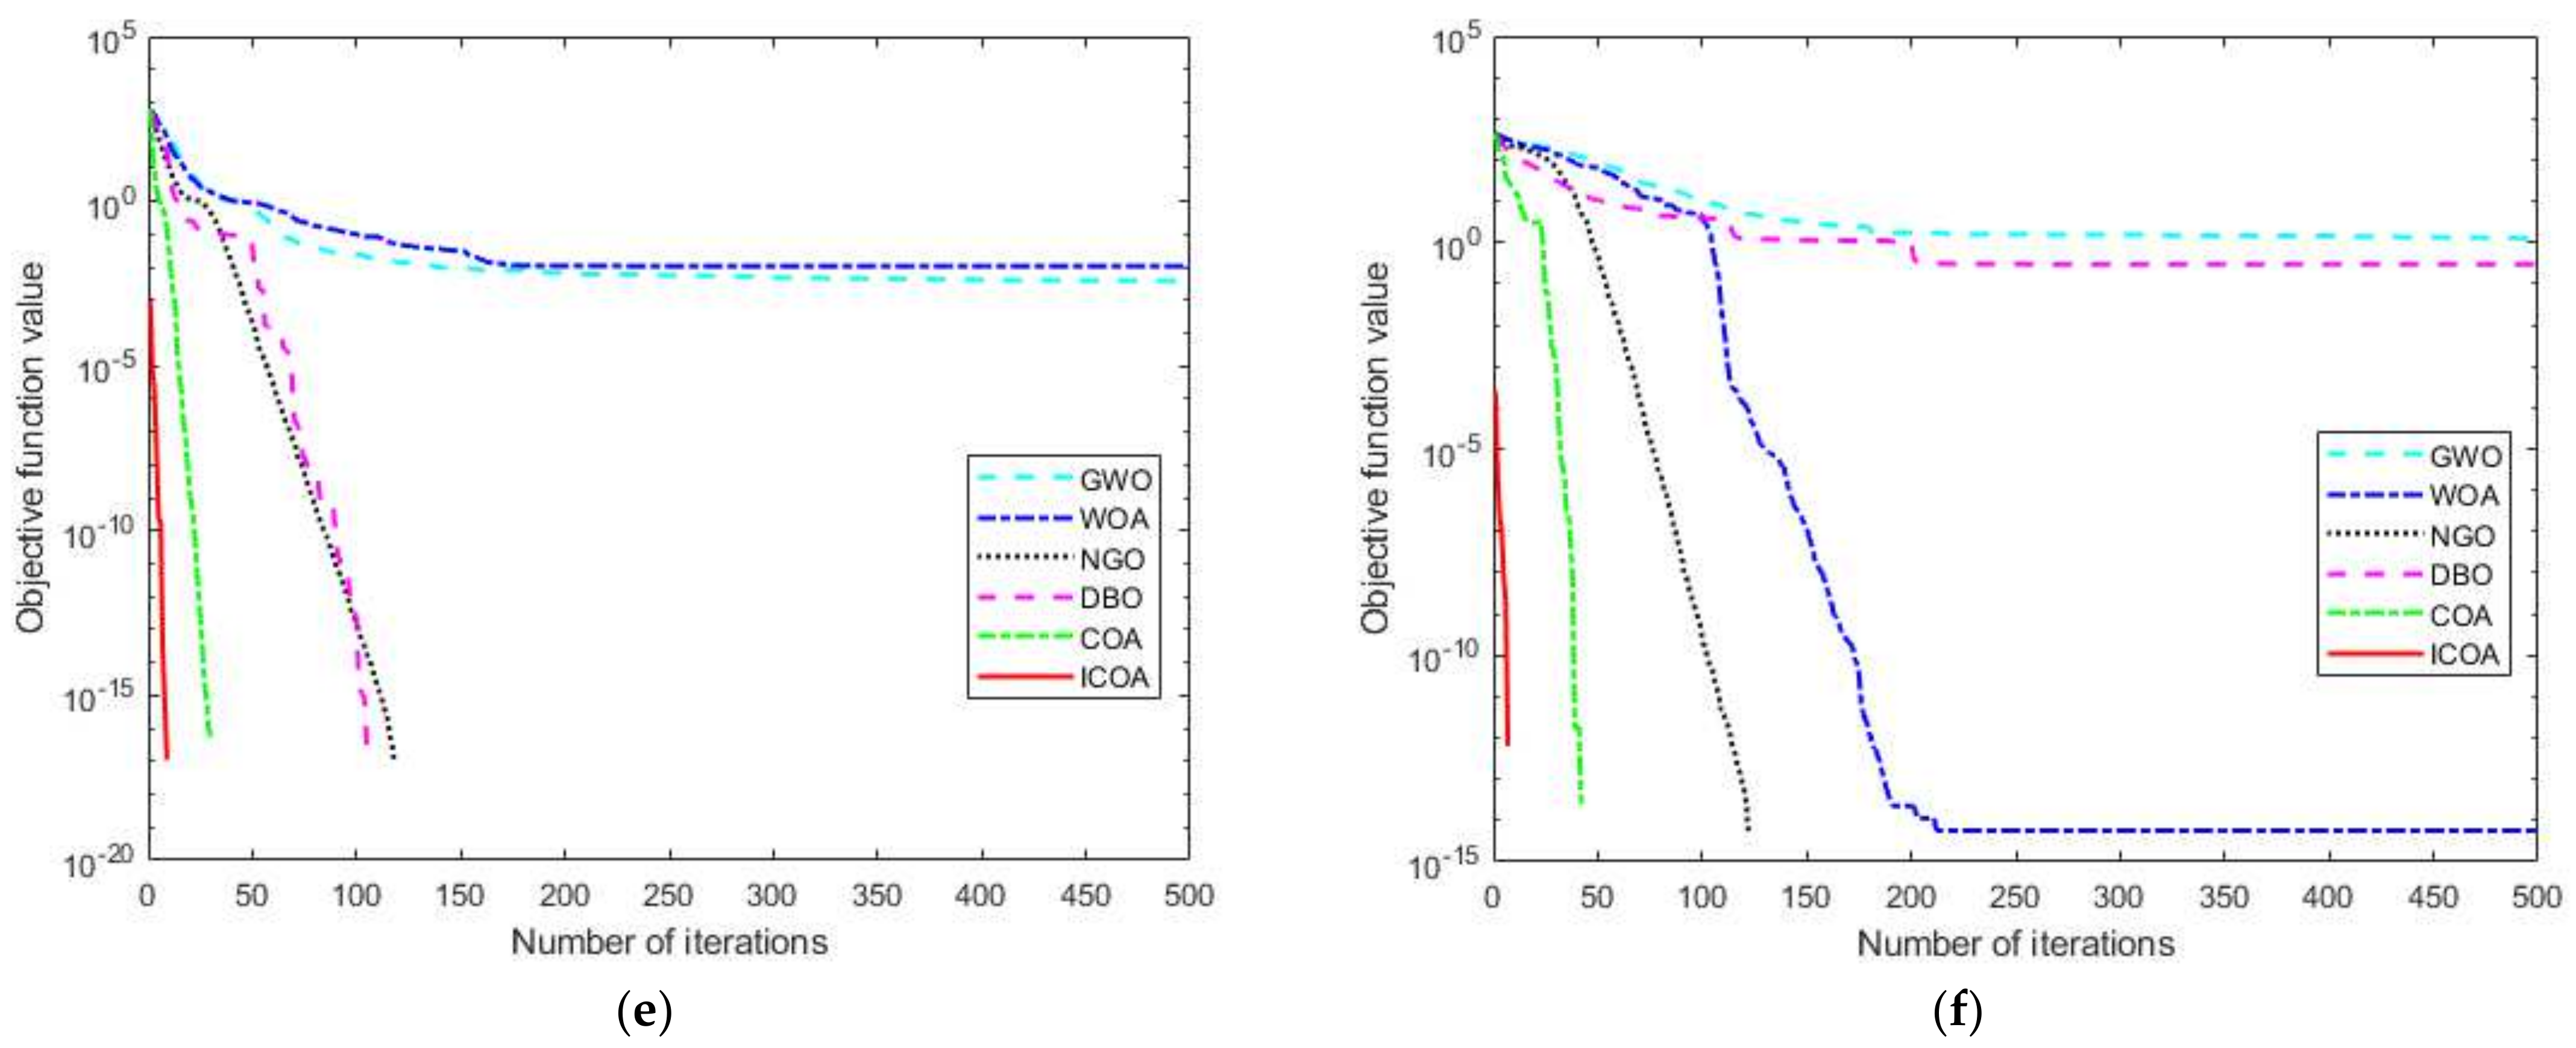
This paper addresses the prolonged training time and computational complexity of traditional SVM methods by employing reverse refraction learning and incorporating the Levy flight strategy to enhance the COA. The resulting ICOA demonstrates superior convergence speed and optimization capability compared to alternative algorithms.
- (3)
Propose an ICOA-SVM for predicting the safety state of transmission towers, demonstrating superior prediction accuracy compared to the SVM. The RMSE value of the ICOA-SVM model decreased by 62.5%, the MAPE value decreased by 59.6%, and the MAE value decreased by 75.0%. This advancement can provide a scientific foundation for the safe operation of the electric power system by enhancing the accuracy and efficiency of the assessment.
Although the proposed ICOA-SVM model demonstrates significant advancements in predicting the safety status of transmission towers, certain limitations need to be acknowledged. Firstly, the dataset used in this study is derived from finite element simulations under predefined conditions. While these simulations provide a controlled and comprehensive framework, they may not fully capture the complexity and variability in real-world scenarios, such as unexpected structural defects, extreme environmental conditions, dynamic interactions with hanging accessories like insulators and conductors, or long-term material degradation. Secondly, the computational complexity of the ICOA framework, although improved compared to traditional methods, remains a limitation, particularly for large-scale applications or real-time monitoring systems. This complexity may pose challenges when scaling the model to process large datasets or operate in environments requiring rapid decision-making. Thirdly, this study focuses specifically on transmission towers, which limits the model’s generalizability to other types of infrastructure. Similar predictive frameworks could potentially be adapted and validated for other structures, such as bridges, pipelines, or wind turbines. These limitations emphasize the need for further research to enhance the model’s computational efficiency, expand its applicability to diverse infrastructure systems, and validate its performance using real-world datasets to ensure its broader applicability and practical feasibility.
Future research should aim to address these limitations by expanding the dataset to include real-world measurements under more diverse environmental conditions, thereby improving the model’s robustness and enhancing its generalizability to complex, real-world scenarios. Efforts should also focus on improving the computational efficiency of the ICOA framework, potentially through further refinements in algorithmic design or the integration of hybrid approaches. Such advancements could enable the deployment of the ICOA-SVM model in real-time monitoring systems, providing timely and accurate safety assessments for critical infrastructure. Additionally, to better capture the nonlinear relationship between wind speed and direction, future studies will include finer granularity in wind direction data beyond the current discrete angles (30°, 45°, 60°, 90°). This refinement will ensure a more comprehensive understanding of how varying wind directions impact the safety and stability of transmission towers.
Additionally, the application of the ICOA-SVM model should also be extended to other structural systems, such as bridges, wind turbines, or pipelines, to demonstrate its adaptability and effectiveness across a broader range of contexts. Incorporating factors like material aging, long-term fatigue effects, and dynamic loading conditions into the model could further enhance its predictive accuracy and comprehensiveness. These improvements would not only refine the current methodology but also establish a more scalable, adaptive, and practical framework for managing infrastructure safety in diverse and challenging environments. By addressing these areas, the proposed approach has the potential to significantly contribute to the fields of structural engineering and intelligent infrastructure management.


