1. Introduction
Incentive zoning bonuses are widely used to guide transit-oriented development (TOD) in many countries, and extensive research has been conducted on this topic. Although much of the research lacks empirical evidence, the associated price-based algorithms have become relatively mature. It is noteworthy that the context of this article is limited to public spaces in high-density TOD (transit-oriented development) areas in East Asia. These are public service products with the responsibility of driving the vitality and development of the development zone. Consequently, the risks associated with the interiorization of indoor public spaces and the scrutiny of their public nature merit reevaluation. Due to the rapid and concentrated development model of TOD in East Asian cities, horizontal space in subway-adjacent plots is limited and scarce. In these contexts, adequate public spaces can only be generated through multi-ground public spaces, which presents challenges for traditional incentive zoning methods.
Traditional methods face limitations in such scenarios. First, when applying the marginal cost–marginal benefit function to analyze the externality benefits for both land users and society, the results show that the marginal benefits for land users do not align with those for society [
1,
2]. As development exceeds a certain threshold, social benefits begin to decline, indicating a disparity between the transaction price of land and its actual social value. Relying solely on transaction prices to measure the social value of land introduces bias, especially in the current context of urban space redevelopment. Therefore, the focus of incentive zoning should be on uncovering the social value of existing land rather than merely increasing land transaction prices.
Second, prevalent incentive zoning methods often reinterpret the building coverage ratio (BCR), where indoor spaces are viewed as economically beneficial spaces and outdoor open spaces as public spaces which can not directly generate economic benefits. In general discussions, this dichotomy leads to the perception that indoor spaces hinder public benefits while outdoor spaces limit economic efficiency. These methods do not account for the integration of multi-ground public spaces with indoor spaces in high-density Asian urban development, which is particularly important in the context of high-building-density subway-adjacent plots. Therefore, incorporating multi-ground public spaces into incentive zoning under a value-based framework presents a new method more suited to high-building-density TOD.
Compared to traditional incentive zoning methods, this new 3-D incentive zoning approach may lack intuitive design correlations among its variables, making visual guidelines essential to visualize the relationships between indicators and outcomes. By providing a clear visualization of the links between data, forms, and indicators, visual guidelines help to bridge research and practical design.
In urban planning, government-issued control documents often reflect a design-oriented research logic, prioritizing design before research. Visual guidelines can be understood as a product of research-driven design. Spatial matrix control, a type of visual guideline, serves as a tripartite visualization method and a reference framework for guiding incentive zoning. Although the use of visual guidelines for urban planning control is widely recognized and applied internationally, there remains a lack of robust empirical support, particularly in the area of incentive zoning.
Thus, the discussion of visual guidelines for 3-D incentive zoning should encompass considerations of incentive zoning, typology, and visual guidelines.
2. Literature Review and Data Preparation
2.1. Incentive Zoning
Incentive zoning has its origins in Richard Cantillon’s theory of residual rent [
3] and Johann Heinrich von Thünen’s agricultural location theory [
4]. Over time, this approach has evolved, and in 1961, the United States formally incorporated incentive zoning, establishing this method as a key tool to optimize urban space. Fundamentally, it operates as a market-based incentive mechanism.
2.1.1. Subjects Involved in Incentive Zoning
Due to the varying zoning policies and regional contexts, the subjects eligible for incentive zoning also differ across these policies. In the 1961 U.S. zoning policy, the concept of privately owned public spaces (POPSs) was introduced [
5], incentivizing private investment in public spaces on private construction sites through FAR bonuses. Early examples of POPSs included plazas and arcades, with specific FAR incentives attached. In contrast, the Shanghai Urban Renewal Measures plan, enacted in 2015 [
6], designated public service facilities, urban open spaces, and historical conservation areas as eligible for incentive zoning. Generally, in countries outside of China, incentive zoning typically applies to public spaces located within private development sites. However, in China, due to differing land policies, the zoning method usually involves external open spaces adjacent to building plots and rarely includes internal public spaces within buildings.
In Japan, the development of Shibuya’s “City Lights” project [
7] marked an experimental shift, where developers included underground spaces within a complex as subjects for zoning bonuses, effectively doubling the original allowable FAR. This demonstrates the potential for underground spaces in multi-ground public spaces to be considered for incentive zoning. Subsequently, Yan Yu integrated the subjects involved in Tokyo’s public space exchange policy (
Table 1) [
8], highlighting that the Japanese Ministry of Land, Infrastructure, Transport and Tourism’s planning documents include underground public pedestrian streets and underground public spaces in incentive zoning. Local policies, such as those implemented in Tokyo’s Sugamo area, further expanded the scope by incorporating bustling second-floor commercial facilities and living services into incentive zoning. For instance, the reconstruction guidelines for Musashino’s street district in Tokyo include pedestrian platforms as eligible subjects for incentive zoning, showcasing that indoor public spaces can also be incorporated into incentive zoning frameworks.
Apart from Japan, several other countries have also undertaken related initiatives (
Table 2). In Kunming, China, policy guidelines state that 1 square meter of public welfare facilities or municipal supporting facilities can be exchanged for 6 m
2 of building area. In Shenzhen, China, the FAR calculation regulations include provisions that allow areas such as elevated floors used as urban public squares, public passageways, public parking, or green leisure spaces to be included in incentive zoning calculations when rewarding areas. The 2014 New York Zoning Regulations for Quality and Affordability also identified weather-protected pedestrian spaces as eligible for inclusion in incentive zoning. Additionally, in another densely populated Asian city, Hong Kong, a study by Francesco Rossini and Melody Yiu compiled a typology of POSPDs (public open space of private developments) [
9], which found that 36% are indoor passages and 10% are rooftops and sky gardens, highlighting the significance of these internal public spaces within buildings.
2.1.2. Methods of Incentive Zoning
However, current incentive zoning methods in China lack empirical support and primarily replicate Western TOD models [
10]. This approach has limitations, as rigidly adopting Western TOD frameworks overlooks the significant differences in land policies and urban living habits between the East and the West [
11]. Western TOD theory typically focuses on subjects within a two-dimensional plane, without fully considering the potential of refined three-dimensional spaces within TOD developments. In China’s high-density urban areas, the inclusion of multi-ground indoor public spaces should be a key consideration in development planning. As Lu Zhongxiao suggested in an interview with Architectural Technique [
7], China could benefit from a system that allows the exchange of both indoor and outdoor public spaces for FAR incentives.
2.1.3. Introduction of the Hedonic Price Method
The Hedonic Price Method (HPM), first introduced by Lancaster and Rosen [
12], is widely used in price-based real estate development research. The core of the method lies in comparing various factors within the equation under the assumption of equivalence. In the context of incentive zoning bonuses, many scholars have explored new directions using the Hedonic Price Method. For instance, Van der Valk examined the impact of housing prices on incentive zoning in Maryland using the Hedonic Price Method [
13].
In the global case of incentive zoning research, the majority of these practices often employ a simplified Hedonic Price Method rather than the full method. For example, Sydney’s implementation of HFS [
14] links the reward area (HFSH) for architectural heritage protection to the historical building’s footprint and the plot’s maximum FAR. Given that the simplified Hedonic Price Method can be applied to incentive zoning, the full Hedonic Price Method holds further potential for enhancing incentive zoning operations. The simplified Hedonic Price Method can be viewed as a form of multiple linear regression equation. Consequently, we can employ multiple linear regression equations to elucidate the full Hedonic Price Method. Nonetheless, it is imperative to deliberate on the selection of dependent variables within the equation.
2.1.4. Equivalent Substitution of Value and Price
In the original Hedonic Price Method, the relationship between dependent and independent variables must be perceptible to users for them to make informed value judgments. For instance, Jim et al. utilized the Hedonic Price Method to analyze high-rise residences in Hong Kong [
15], demonstrating that park views positively influence land prices, usability, and visibility. In research on incentive zoning from a three-dimensional perspective, relying solely on the BCR as the basis for land price evaluation introduces bias, especially when public spaces extend into buildings. The evaluation of complex developments should transition from a focus on land prices to an assessment of perceivable public value, particularly when investigating 3-D incentive zoning methods. This necessitates exploring substitution methods for public spaces and other areas based on value premises. Many researchers have utilized value as an equivalent in the Hedonic Price Method (
Table 3) [
16], suggesting that substituting price with value in the Hedonic Price Method is a viable approach. Moreover, a discussion on the multivariate relationships related to the coefficients of the Hedonic Price Method will require the application of typological methods.
2.2. Typology
2.2.1. Typology of Public Spaces in Rail Transit Complexes
Public spaces play a crucial role in urban planning and related fields. Jan Gehl [
17], through extensive case studies, argues that the quality of public spaces significantly influences social interaction and the overall quality of life within communities. In the context of studying multi-ground public spaces of rail transit complexes, SR Samant examines TOD cases from Singapore to analyze the vertical public spaces within Chinese rail transit complexes [
18]. This analysis highlights how China’s unique TOD development model affects these vertical public space networks. A substantial body of literature underscores the immense social value of public spaces associated with rail transit complexes. Consequently, the 3-D incentive zoning of multi-ground public spaces inevitably involves public spaces as a key consideration. Therefore, discussing public spaces related to rail transit complexes through a typological lens is not only relevant but also practically meaningful.
2.2.2. Criteria for Typology
In existing research, scholars such as M. Francis, J. Gehl, and J. Montgomery have utilized area-based indicators to classify public spaces in urban environments [
17,
19,
20]. However, they have not conducted detailed classifications specifically focusing on public spaces associated with rail transit complexes. Currently, there are few instances of typological studies examining the public spaces of rail transit complexes. For example, WANG Zhendong and WU Menghao categorize these public spaces into three types, “Separated”, “Connected”, and “Integrated”, based on their integration with urban pedestrian systems and subway networks [
21]. The criteria for these classifications primarily revolve around the forms of connection between public spaces and subway stations. However, these classifications often rely on subjective judgments made by researchers, lacking specific indicators or empirical data for validation. Based on these studies, public spaces can indeed be classified using area-based indicators. Similarly, public spaces related to rail transit complexes can be classified employing the same methodological framework, provided it is grounded in a scientific premise.
2.2.3. Typology for Tiers and Types
This study will focus on the typology of tiers and types, specifically the classification of types within multiple tiers. As previously discussed in relation to the Hedonic Price Method analysis, this approach necessitates a multivariate collaborative analysis. When the number of variables reaches three or more, it becomes essential to classify the related variables to facilitate discussions on pairwise substitution conditions. Xiangyang He and colleagues have proposed a dual-clustering framework for exploring multivariate data collaboration in analysis models [
22]. This framework involves clustering equations with four variables in pairs to investigate local correlations within the equations. The dual-clustering classification method can be likened to organizing discussions of types under multiple tiers, representing another form of typology for tiers and types.
2.3. Visual Guidelines
Assuming the method is empirically validated, relying solely on the transfer of indicators and typology for the incentive zoning of multi-ground public spaces presents challenges in intuitively communicating this method to land developers. Therefore, the practical implementation of this method necessitates the integration of diagrams to create a systematic framework for visual guidelines, thereby enhancing its practical application value. The actual utilization of visual guidelines can vary significantly depending on the research subject. To identify specific feasible approaches for this study, it is essential to explore the origins of visual guidelines, their value system, and the various forms they can take. This exploration will provide a comprehensive understanding of how visual guidelines can be effectively employed in the context of incentive zoning for multi-ground public spaces.
2.3.1. The Origins of Visual Guidelines
Visual guidelines serves as a vital technical tool in urban design and land use, providing guidance for the future development of urban spaces. The modern iteration of visual guidelines can be traced back to the first comprehensive zoning policy enacted in the United States in 1916, known as the “New York Zoning Regulations” (
Figure 1). This framework utilized diagrams to stipulate building heights and land use, focusing primarily on the division of plots within a two-dimensional plane and the labeling of relevant indicators for each plot. The range of indicator values was largely informed by past experience rather than rigorous scientific research [
23].
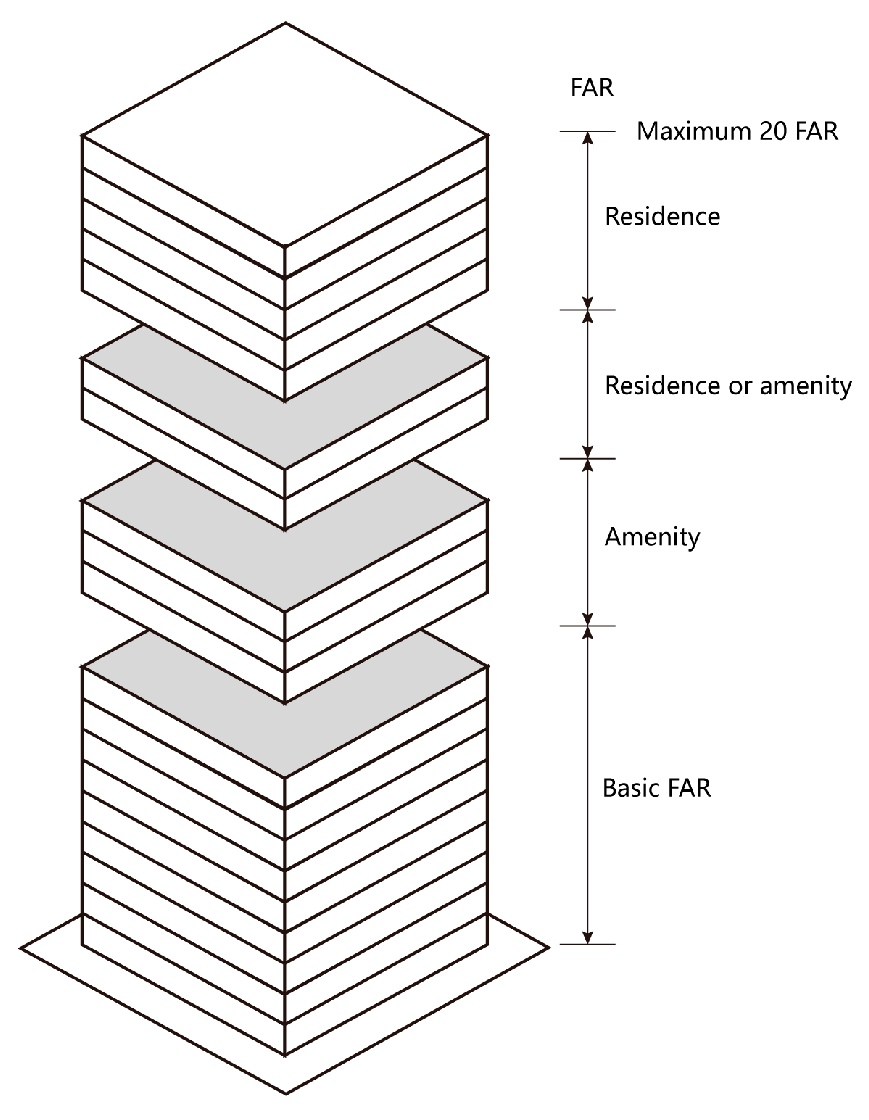
In 1985, Seattle advanced its incentive zoning by expanding visual representation from two dimensions to three-dimensional space (
Figure 2). This initiative provided schematic diagrams of incentive zoning for individual buildings along their vertical axes. Seattle’s incentive zoning is thus regarded as one of the earliest 3-D examples of visual guidelines related to incentive zoning, highlighting its significance in the evolution of urban planning practices.
2.3.2. Value System in Visual Guidelines
The value system inherent in visual guidelines is diverse, enabling regulation based on both price and value. In the context of incentive zoning policies, the majority of guidelines are price-based. For instance, Seattle’s incentive zoning in 1985 implemented visual guidelines centered on land prices, aiming to allow developers to increase land values for economic gain while ensuring the provision of adequate public space.
However, within the current high-density development environment in China, price-based controls present certain shortcomings; therefore, value-based guidelines should also be considered. In fact, many policies related to visual guidelines in other fields prioritize human-centered values over price. Both the United States and the United Kingdom have introduced street control policies that offer guidelines for street dimensions, aiming to enhance the human-friendliness of urban spaces [
24,
25]. These street space regulations are grounded in value systems that emphasize human comfort and visual openness. Research conducted by Whyte has substantiated the positive impact of small- and medium-sized public spaces designed with human-friendly scales on spatial quality [
26]. Consequently, public spaces within transit-oriented complexes can also be subjected to value-based controls.
2.3.3. Gradient Control
Within the framework of typology, transitions between types within tiers give rise to corresponding gradient changes in value presentation, necessitating a detailed explanation of this form of visual guidelines. Taking Shanghai as an example in the context of gradient visual guidelines in incentive zoning [
27], when the FAR is less than 2, the transfer ratio is set at 1:1, meaning that for every square meter of public space, the construction area can be increased by an equivalent square meter. However, once the FAR reaches or exceeds 2, the transfer ratio adjusts to 1:1.2.
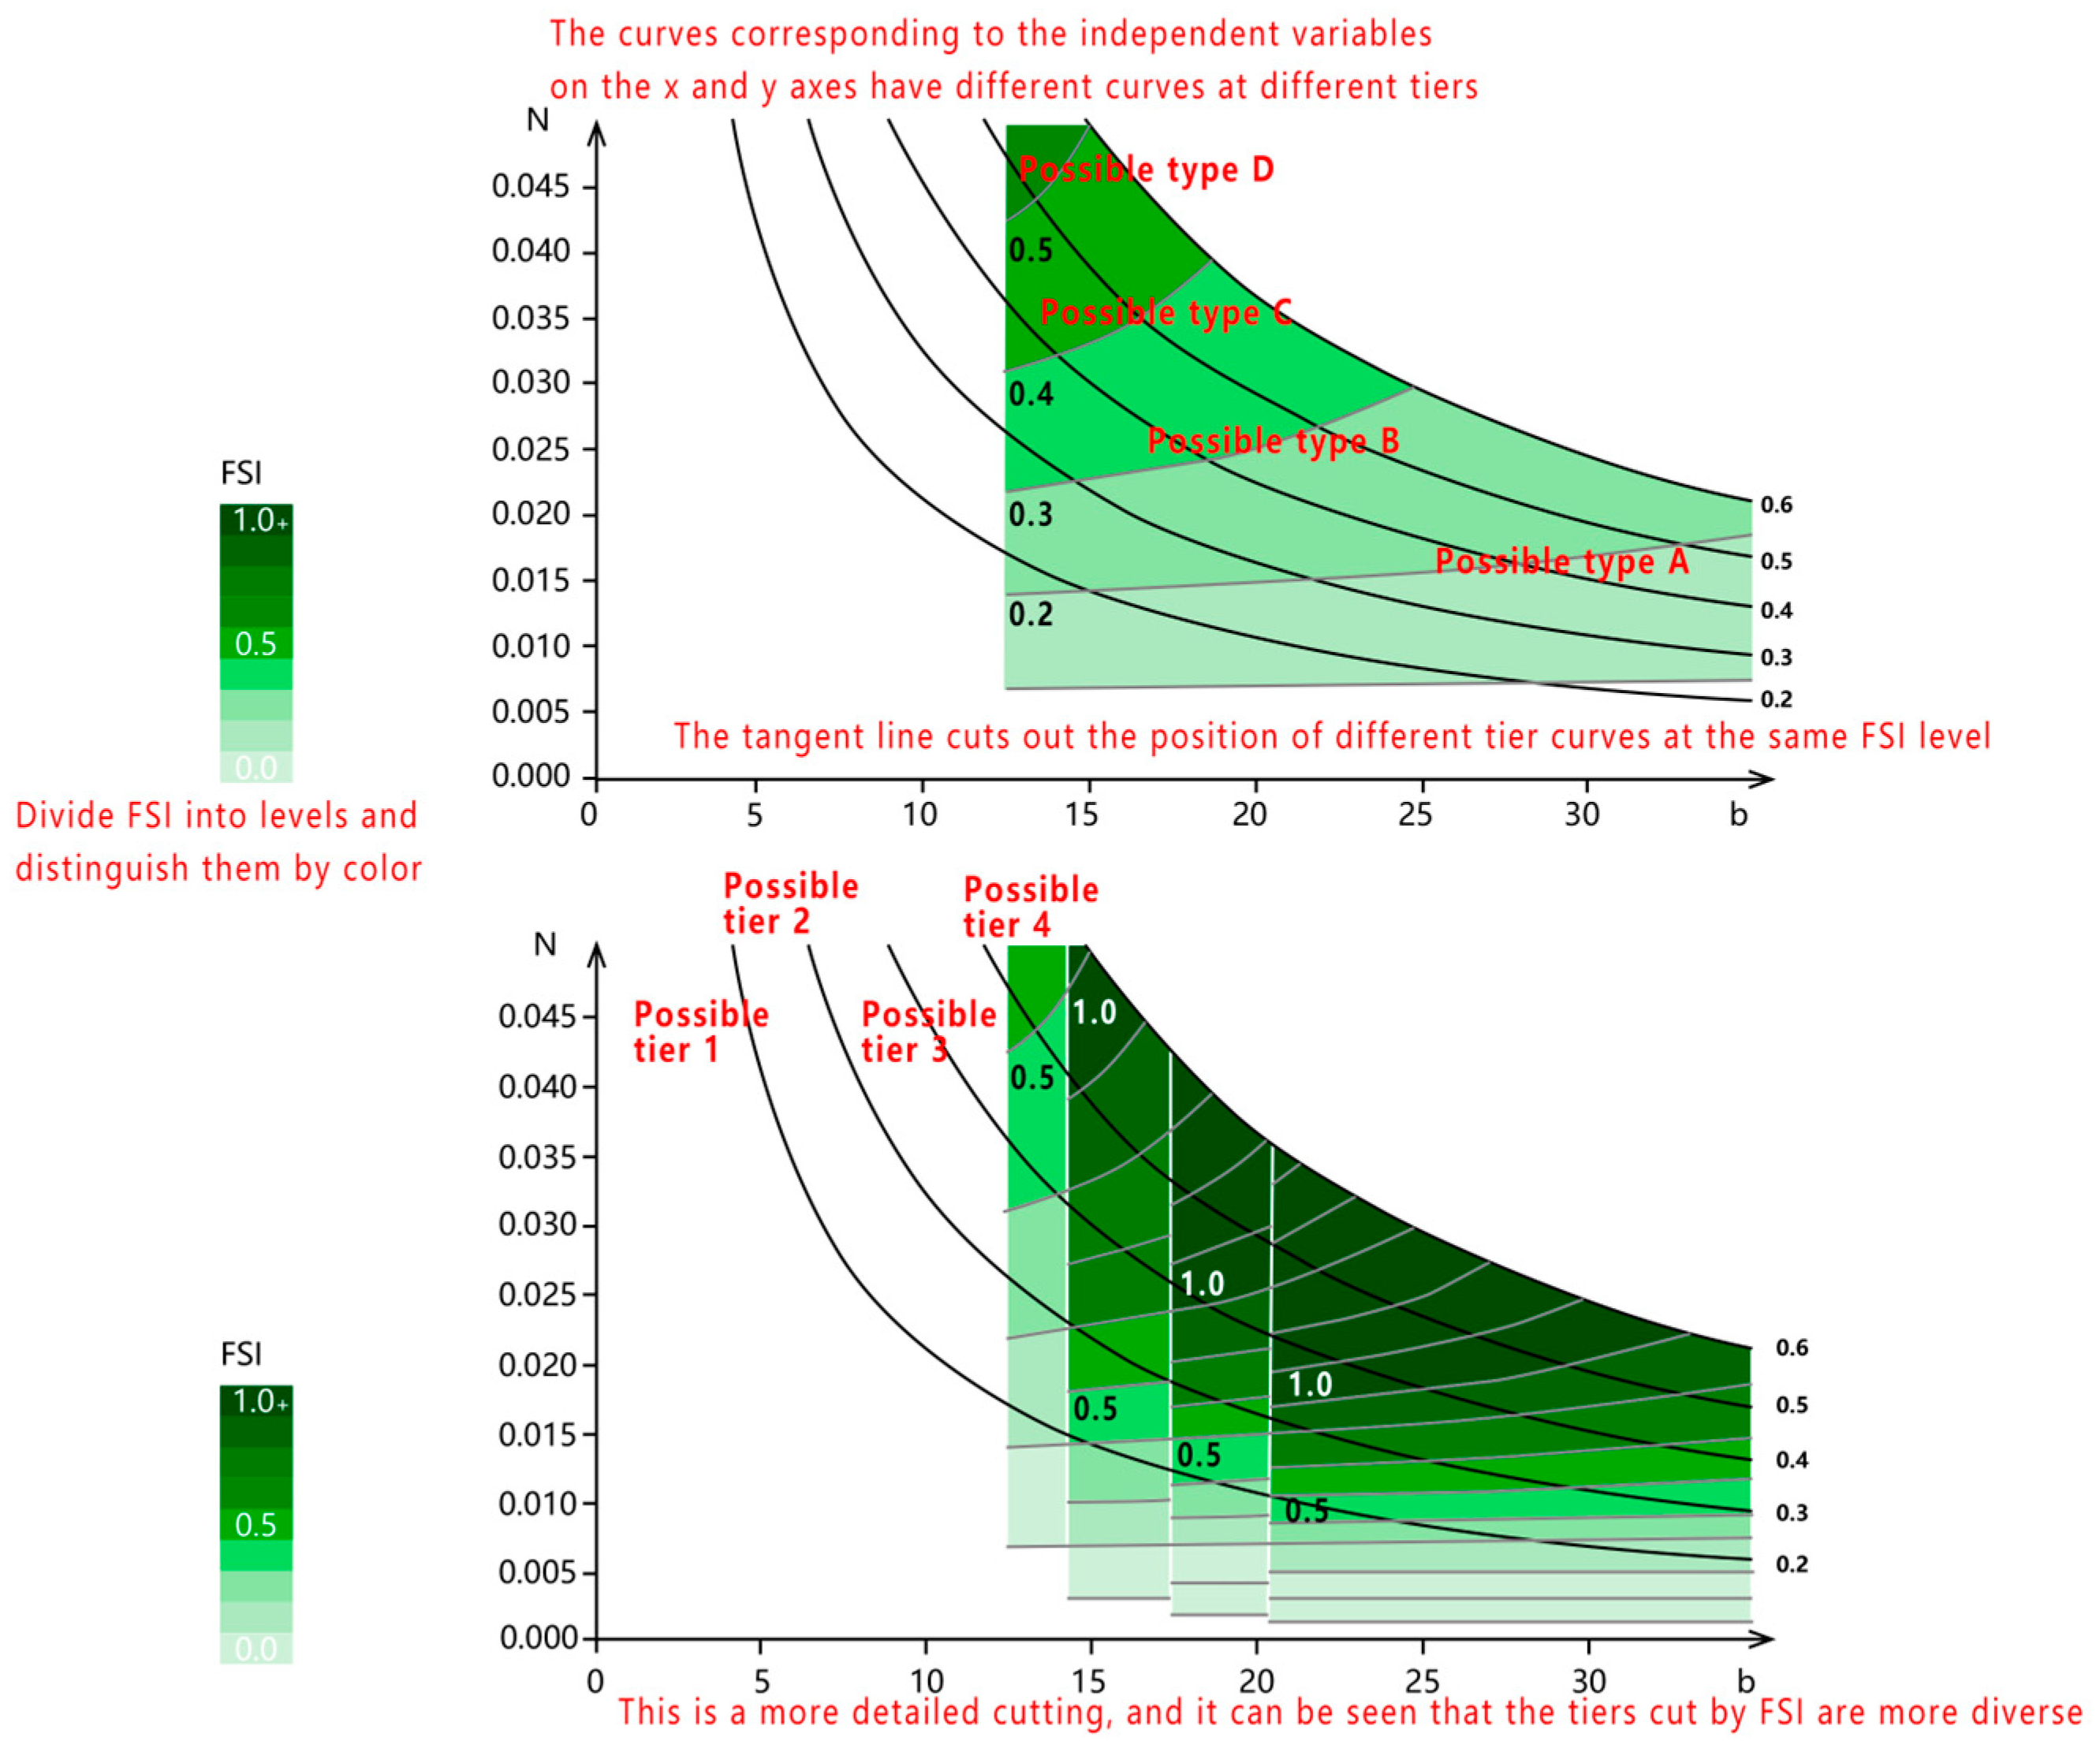
In Pont’s related research [
28], a paradigm of gradient visual guidelines is introduced (
Figure 3), illustrating how changes in two indicators vary across different gradients, each marked with corresponding colors. Beyond the use of color, height can also be employed as a three-dimensional representation of these indicators, thereby forming a spatial matrix. Mashhoodi B and Pont adopted a similar methodology in their 2011 study [
29] (
Figure 4), further emphasizing the applicability of gradient visual guidelines in visualizing complex relationships between variables.
2.3.4. Tier and Type Conversion
In visual guidelines, the basis for transitions between tiers and types is grounded in the changes of indicator intervals. Each type within a tier corresponds to a specific indicator interval, and as an indicator shifts from one interval to another, the associated type also changes accordingly. In Radberg J’s research [
30], multiple urban cases are analyzed using relevant indicators, and these cases are classified along gradient curves, with each urban instance corresponding to several indicator intervals. A similar methodology is evident in the studies conducted by Samira Elias and José Nuno Beirão [
31]. This study adopts their approach by delineating types through the establishment of indicator intervals, thereby enhancing the clarity and specificity of typological classifications.
2.3.5. Visual Guidelines of Typology
Utilizing diagrams to illustrate typology is an effective method for linking indicators with their corresponding forms, and there is a substantial body of prior research focused on visual guidelines within this context. For instance, Alexander proposed a viable inductive display method for classifying existing data [
32] (
Figure 5), which organizes displays based on the clustering of two indicators. Similarly, in TAN Zheng’s study [
33], the concept of “code city” was employed to intuitively represent indicators (
Figure 6), where the concentric circles of the city symbolize different levels, effectively corresponding to various types.
2.4. Research Question
Based on the literature review above, the following questions can be posed: In the context of high-building-density TOD development, how should indoor public spaces be incorporated into the incentive zoning process at a 3-D level to promote the optimization of existing urban space? After determining the method for 3-D incentive zoning, how can typology and diagrams be combined to connect indicators with forms, and how should diagrams be formed to create a practically meaningful visual guideline scheme?
The research framework is shown in
Figure 7.
2.5. Data Preparation
2.5.1. Sample Selection and Model Establishment
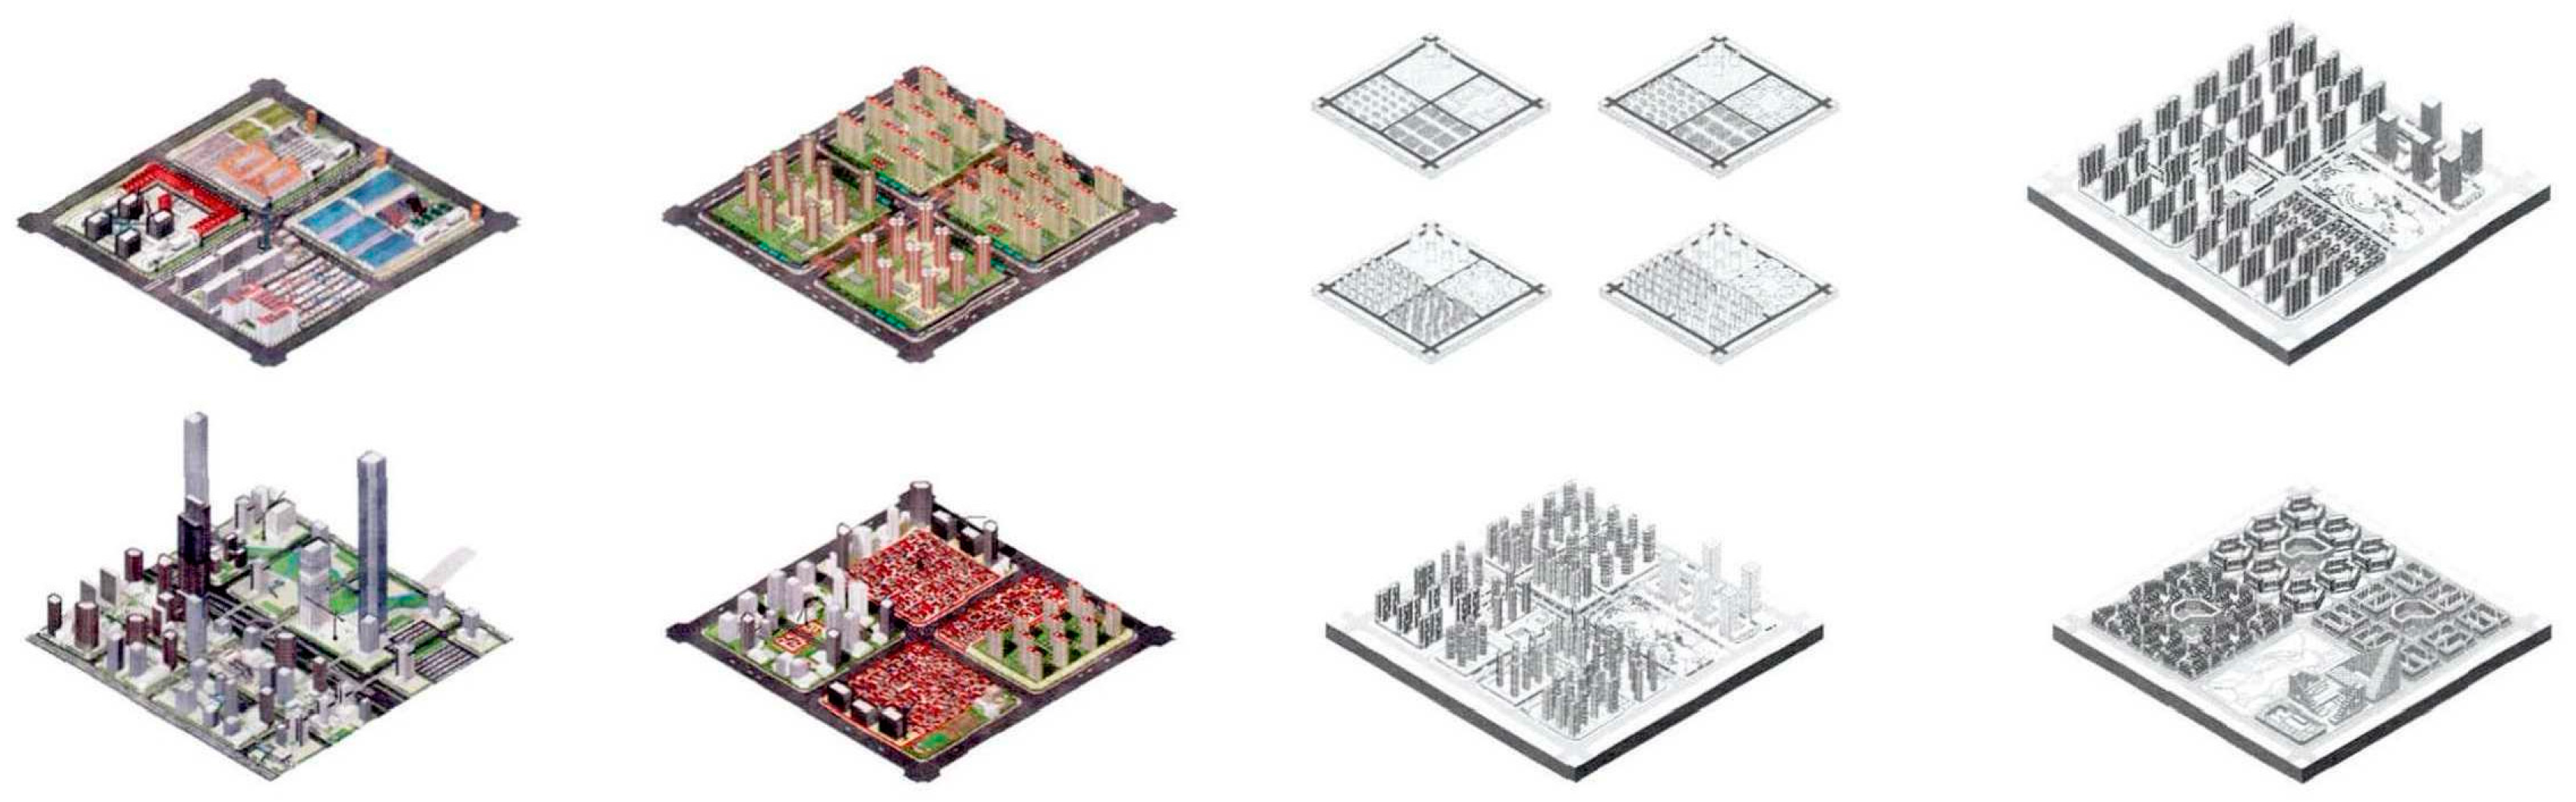
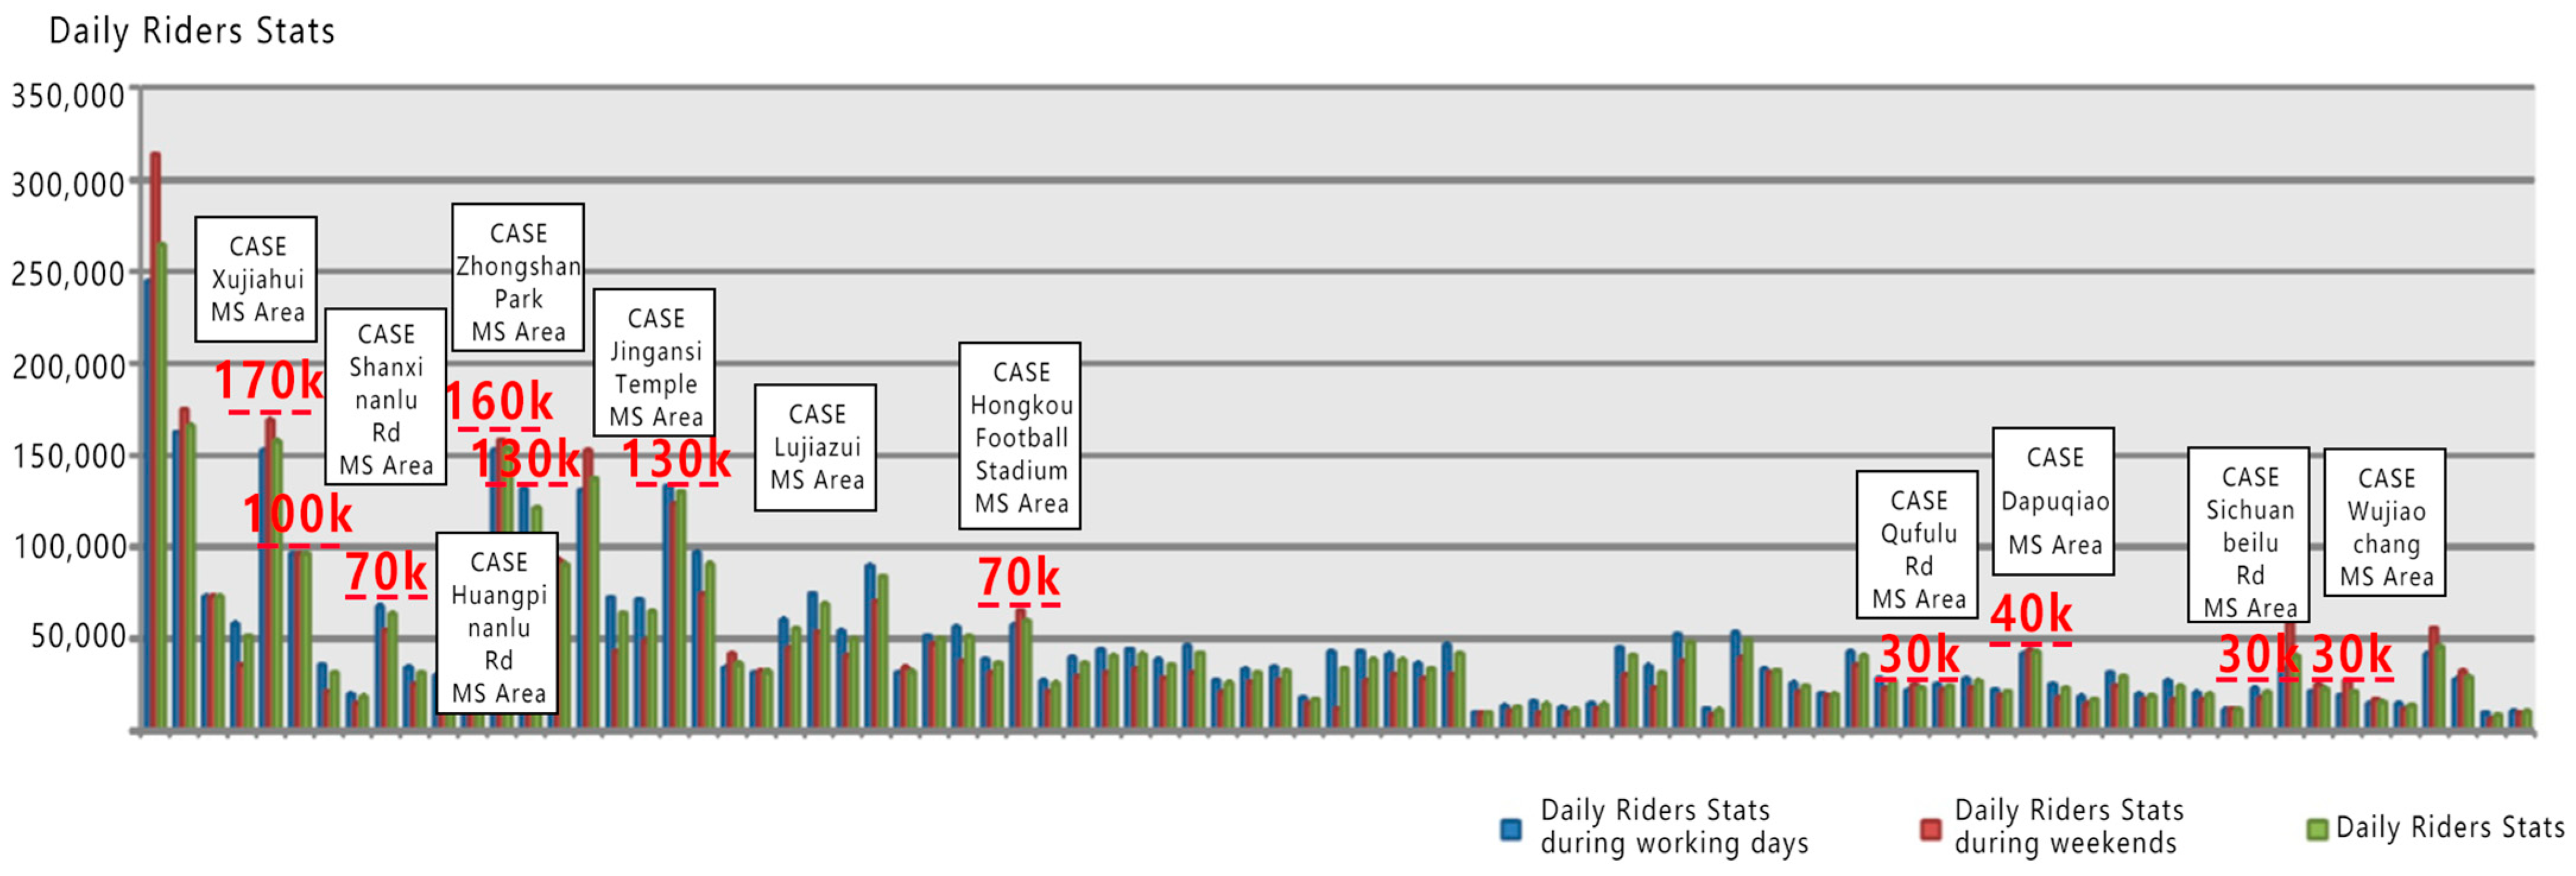
The public spaces in Shanghai’s subway-adjacent plots are situated in areas prone to excessive efficiency-driven development, with a scarcity of horizontal spatial resources and high building density. The more such an area is characterized by these conditions, the more apparent the conflict between developers’ profit motives and the public’s demand for public spaces becomes. Additionally, due to the involvement of three-dimensionality, privatization, and commercialization issues, the complexity of evaluating public spaces is further exacerbated. Large-scale TOD often leads to indoor public spaces that, due to excessive capital control and commercial overdevelopment, result in vitality being confined internally and a disconnect between internal and external relations, thereby affecting the balance between efficiency and fairness in urban spaces. As depicted in
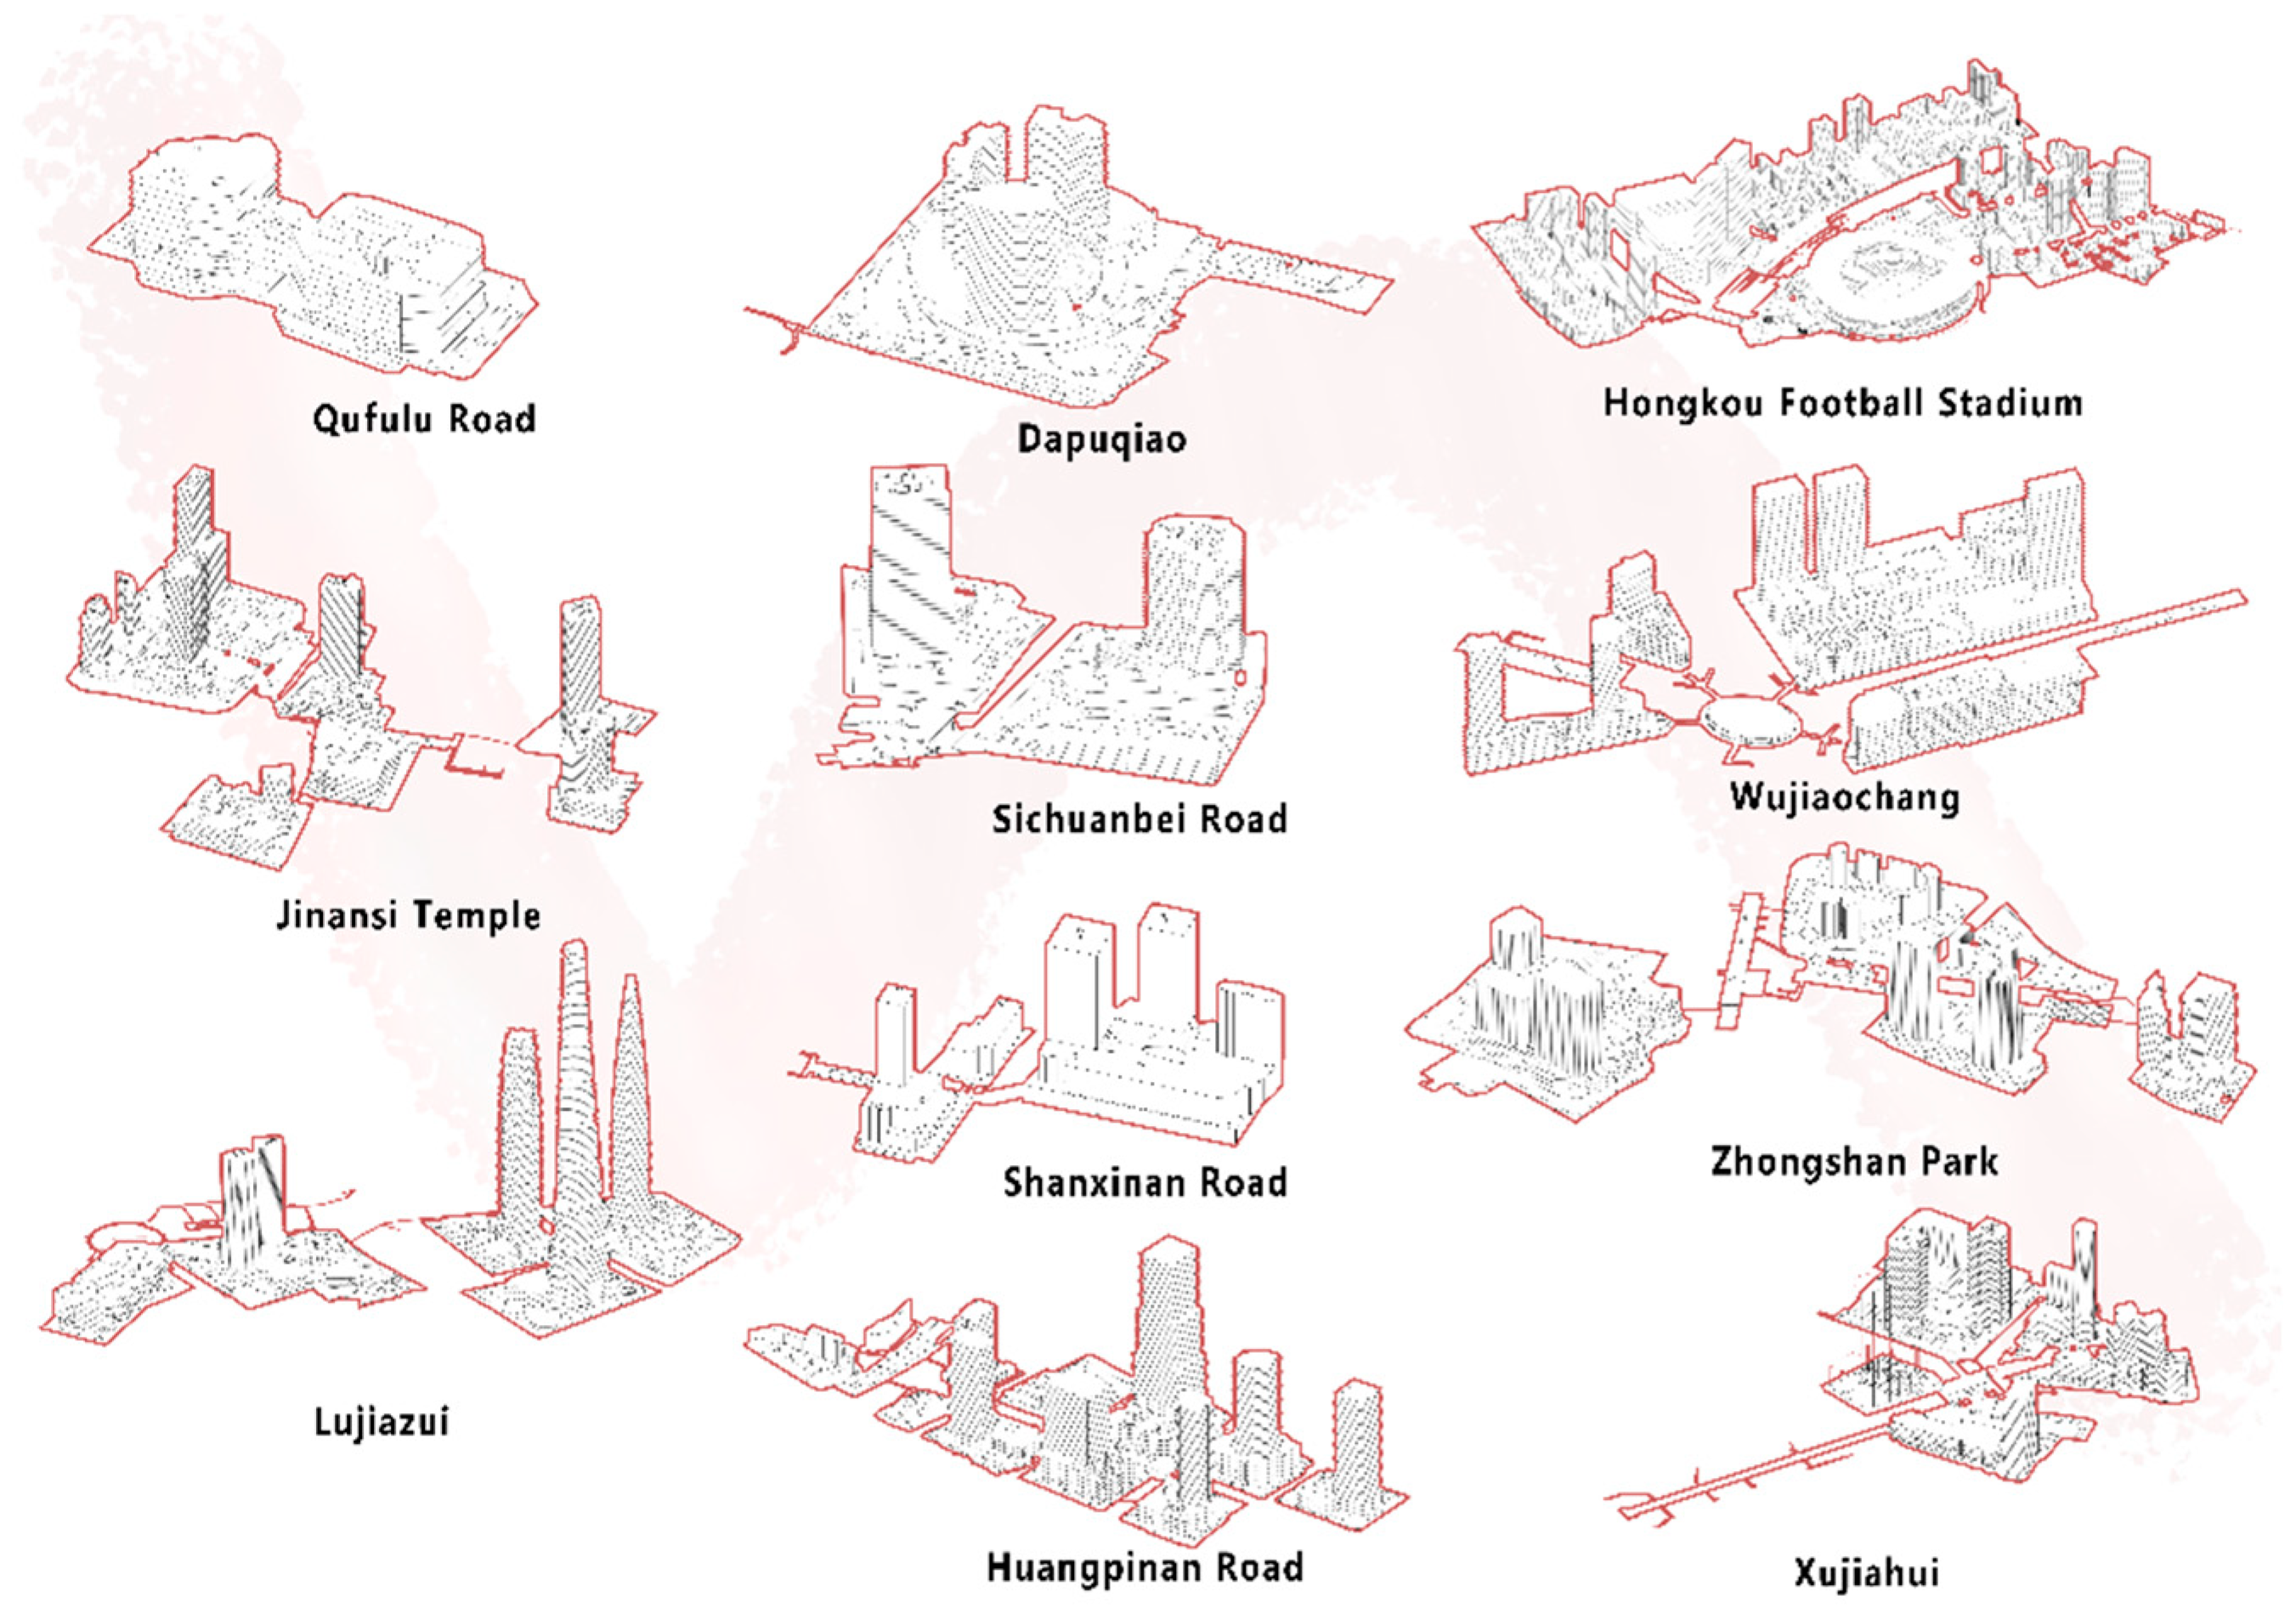
Figure 8, the research cases are sampled from 11 metro station areas with daily passenger flows ranging from 30,000 to 170,000 within a 500 m radius of Shanghai, encompassing 33 subway-adjacent plots (see
Figure 9 for the combination of 11 metro station areas). The metro station area cases cover small, medium, and large passenger flow station areas uniformly. The sampled TOD plots include fully open ground-level parks with underground commercial spaces (such as Huangpinanlu Road and Xiangdai Fasion Plaza) and landmark plots with extreme heights (such as Lujiazui and the International Financial Center). Station areas involving three-line interchanges include Xujiahui, Shaanxinanlu Road, and Zhongshan Park; those with two-line interchanges include Jingansi Temple, Hongkou Football Stadium, and Qufulu Road. Additionally, the Zhongshan Park station and the Hongkou Plaza have relatively developed three-dimensional pedestrian systems, featuring light rail, subway, and corresponding vertical connections.
For each of the 33 plots, SU modeling was performed (
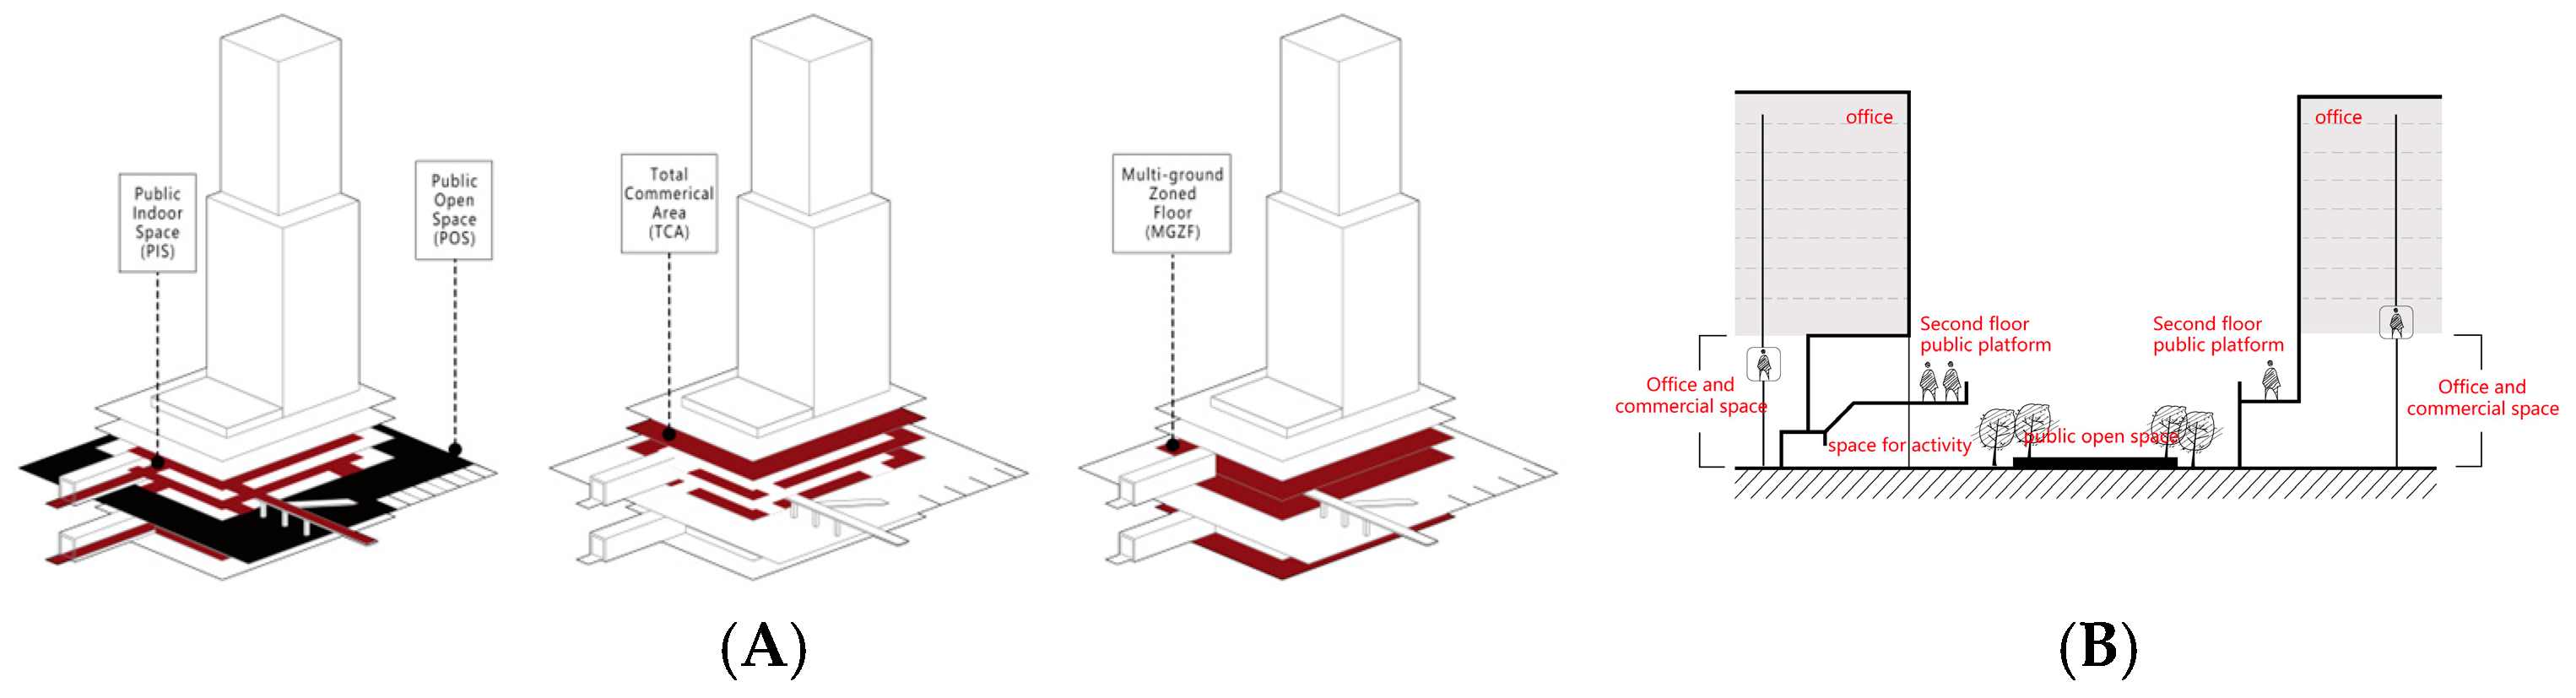
Figure 8). Key spatial parameters, including public indoor space area (PIS), public open space area (POS), total commercial area (TCA), and the number of multi-ground zoned floors (MGZFs), were determined through a combination of CAD measurements and field investigations; all indicators are shown in
Figure 10A.
Figure 10B is a similar schematic representation of the guidance and control of multi-ground public spaces in Japanese policies [
34]. At the same time, Francesco Rossini and Melody Yiu’s research also provided typology and guidance on indoor public spaces in Hong Kong in terms of planar form. At the same time, Francesco Rossini and Melody Yiu’s research also provided typology and guidance on indoor public spaces in Hong Kong in terms of planar form [
9] (
Figure 11).
2.5.2. Behavioral Data Collection
Data collection for this study employed behavioral classification annotation to accurately capture the specific uses of space and the density of population distribution. The area snapshot method was used to gather behavioral data from samples. To minimize fluctuations in pedestrian flow inherent to the snapshot method, public space behavior was sampled during four time slots on both weekdays and weekends: 10:30–11:30, 13:30–14:30, 15:30–16:30, and 18:30–19:30. Each time slot involved two rounds of sampling, resulting in a total of 16 rounds of full-day behavioral data annotations. Since the collected data were obtained on the same day, under the same weather conditions, and in the same season, they hold comparative significance across different cases. From a research methodology perspective, the precision must be sufficient to differentiate between indoor and outdoor areas as well as different elevation levels; therefore, geographical-level data cannot be used. Additionally, because it is necessary to distinguish between commercial and non-commercial stays, both indoors and outdoors, using WiFi probes is too detailed and thus unfeasible. Furthermore, involving 11 stations, different plots, and 33 complexes (both indoors and outdoors), as well as subway areas, requires significant volume and necessitates obtaining permission from numerous management and operational teams, making behavior recognition through surveillance videos impractical. Therefore, on-site observations have become almost the only feasible means of data collection that aligns with the objectives.
The behavioral data collected were manually categorized into five types: pedestrian flow, commercial stops, social stops, cultural stops, and resting seat reliance. The latter four categories were collectively defined as “stays”. Excluding commercial stops, the remaining non-commercial stays align with Jan Gehl’s concept of incidental urban space stay behavior [
17], serving as an indicator to assess the quality of public spaces.
3. Results
3.1. Clarification of the Dependent Variable in the Hedonic Price Method
3.1.1. Criteria for Selecting the Dependent Variable
Jan Gehl argues that spontaneous activities and social interactions are dependent on the overall social quality of a space [
17]. Thus, indicators related to social public activities on a given site can serve as measures of public space quality, providing a quantitative correspondence to the value in the Hedonic Price Method. Site attendance data, often used to quantify crowd presence, have been shown to generally represent space quality and user preferences [
35]. At the same time, the inherent conflict between efficiency and equity at both social and economic levels must be addressed [
2]. Therefore, public space quality should be evaluated from both efficiency and equity perspectives, ensuring that it provides benefits to developers and the public alike. The newly proposed value metrics that replace traditional price assessments should aim to balance these two dimensions, enhancing both social utility and economic efficiency.
3.1.2. GNCS_AR as the Dependent Variable
In the data preparation described above, non-commercial stays serve as a key indicator for evaluating public space quality. The volume of non-commercial stays reflects the positive contributions of public spaces to the public. Research has demonstrated that non-commercial activities can also stimulate commercial behavior [
36]. Longer stays in public spaces often lead to consumption, suggesting that up to a certain threshold, public spaces can enhance commercial activity. However, excessively large public spaces may face opposition from developers and dilute the density of stays. Therefore, the effect of space area must also be considered when analyzing the dependent variable.
To address this, the ratio of ground non-commercial stay to area (GNCS_AR) is proposed as an indicator to evaluate the balance between efficiency and equity in public space. GNCS_AR is calculated as the ratio of non-commercial stay volume to the total area of indoor and outdoor public spaces. Compared to the volume of non-commercial stays, this indicator more accurately reflects the efficiency and equity of public space quality. On one hand, dividing this indicator by area eliminates the impact of scale, indicating that for every additional unit of GNCS_AR, vitality becomes more concentrated. For these transit station-adjacent plots, if they cannot drive the development of surrounding areas and provide public spaces mainly focused on non-essential stays, it represents a significant waste of taxpayer contributions. The essence of the above statement is a balance between efficiency and equity. Besides the locational factors of these plots, the stay index proposed by Gehl involves fairness; when divided by area and transformed into a density-related indicator, it reflects efficiency concerning fairness. Additionally, focusing on similar density indicators aligns better with Asia’s high-density development status, as large plazas can easily attract large crowds, but the actual crowd density may be thin. As for accessibility, since these plot cases are all transit station-adjacent, with a sampling rule of connected plots within a 200 m radius, it can be considered that accessibility within the same station area is relatively equal.
In this study, GNCS_AR is used as the dependent variable within the Hedonic Price Method, representing the value that replaces traditional price-based assessments.
3.2. Hedonic Price Method Analysis
Using GNCS_AR as the dependent variable, the commercial-related indicators and public space-related indicators in
Table 4 are used as independent variables for stepwise multiple linear regression modeling in IBM SPSS Statistics 24 to establish the connection between commercial spaces and public spaces. The regression model is shown in
Table 5.
3.3. Multiple Linear Equation Analysis of GNCS_AR
From the regression model, it was found that MGZFs alone could not enter the multiple equation model. Without the participation of MGZFs, the multiple equation model could not analyze and explain the 3-D space. However, by adding RIOPS to MGZFs plus 1 into the equation, MGZFs can be included in the multiple equation (Model 3 in
Table 5). For ease of discussion, this ratio is named as the RIOPS_MGZF. The role of MGZFs plus 1 is to ensure that RIOPS_MGZF still holds when the number of MGZFs equals 0. Models 1 and 2 do not involve the RIOPS_MGZF, and their adjusted R
2 values are 0.211 and 0.309, respectively. Model 3 involves the RIOPS_MGZF, and its adjusted R
2 is 0.403, which is significantly better than Model 1 and Model 2. Therefore, Model 3 is used as the appropriate model for further discussion.
As shown in
Table 5, the formula for Model 3 is
Because the equation aims to cover different TOD complexes with large, medium, and small volumes and pedestrian flow as much as possible and temporarily streamline variables to eliminate the location differences of different metro station areas, without considering the energy level differences and development intensity changes brought by the location of metro station areas themselves, core plots in the metro station areas are chosen as the research object where possible. Nevertheless, the R2 value still reached 0.403.
In the model, RIOPS can be broken down as the ratio of PIS to POS, BC_VP can be broken down as the ratio of TCA to the sum of PIS and TCA, and RIOPS_MGZF can also be broken down as RIOPS divided by the number of MGZFs. Therefore, the above formula can be transformed, and the new model is
Analyzing Formula (1), it involves a total of five variables, which are the dependent variable GNCS_AR, and the independent variables MGZFs, PIS, POS, and TCA. The dependent variable GNCS_AR, as the expected target, is not considered in the scope. Among the four independent variables, cluster analysis is performed on two of them, and by using a typological approach, the relationship between the remaining two variables can be analyzed within a single tier.
3.4. Typology of POS and MGZFs for Tiers
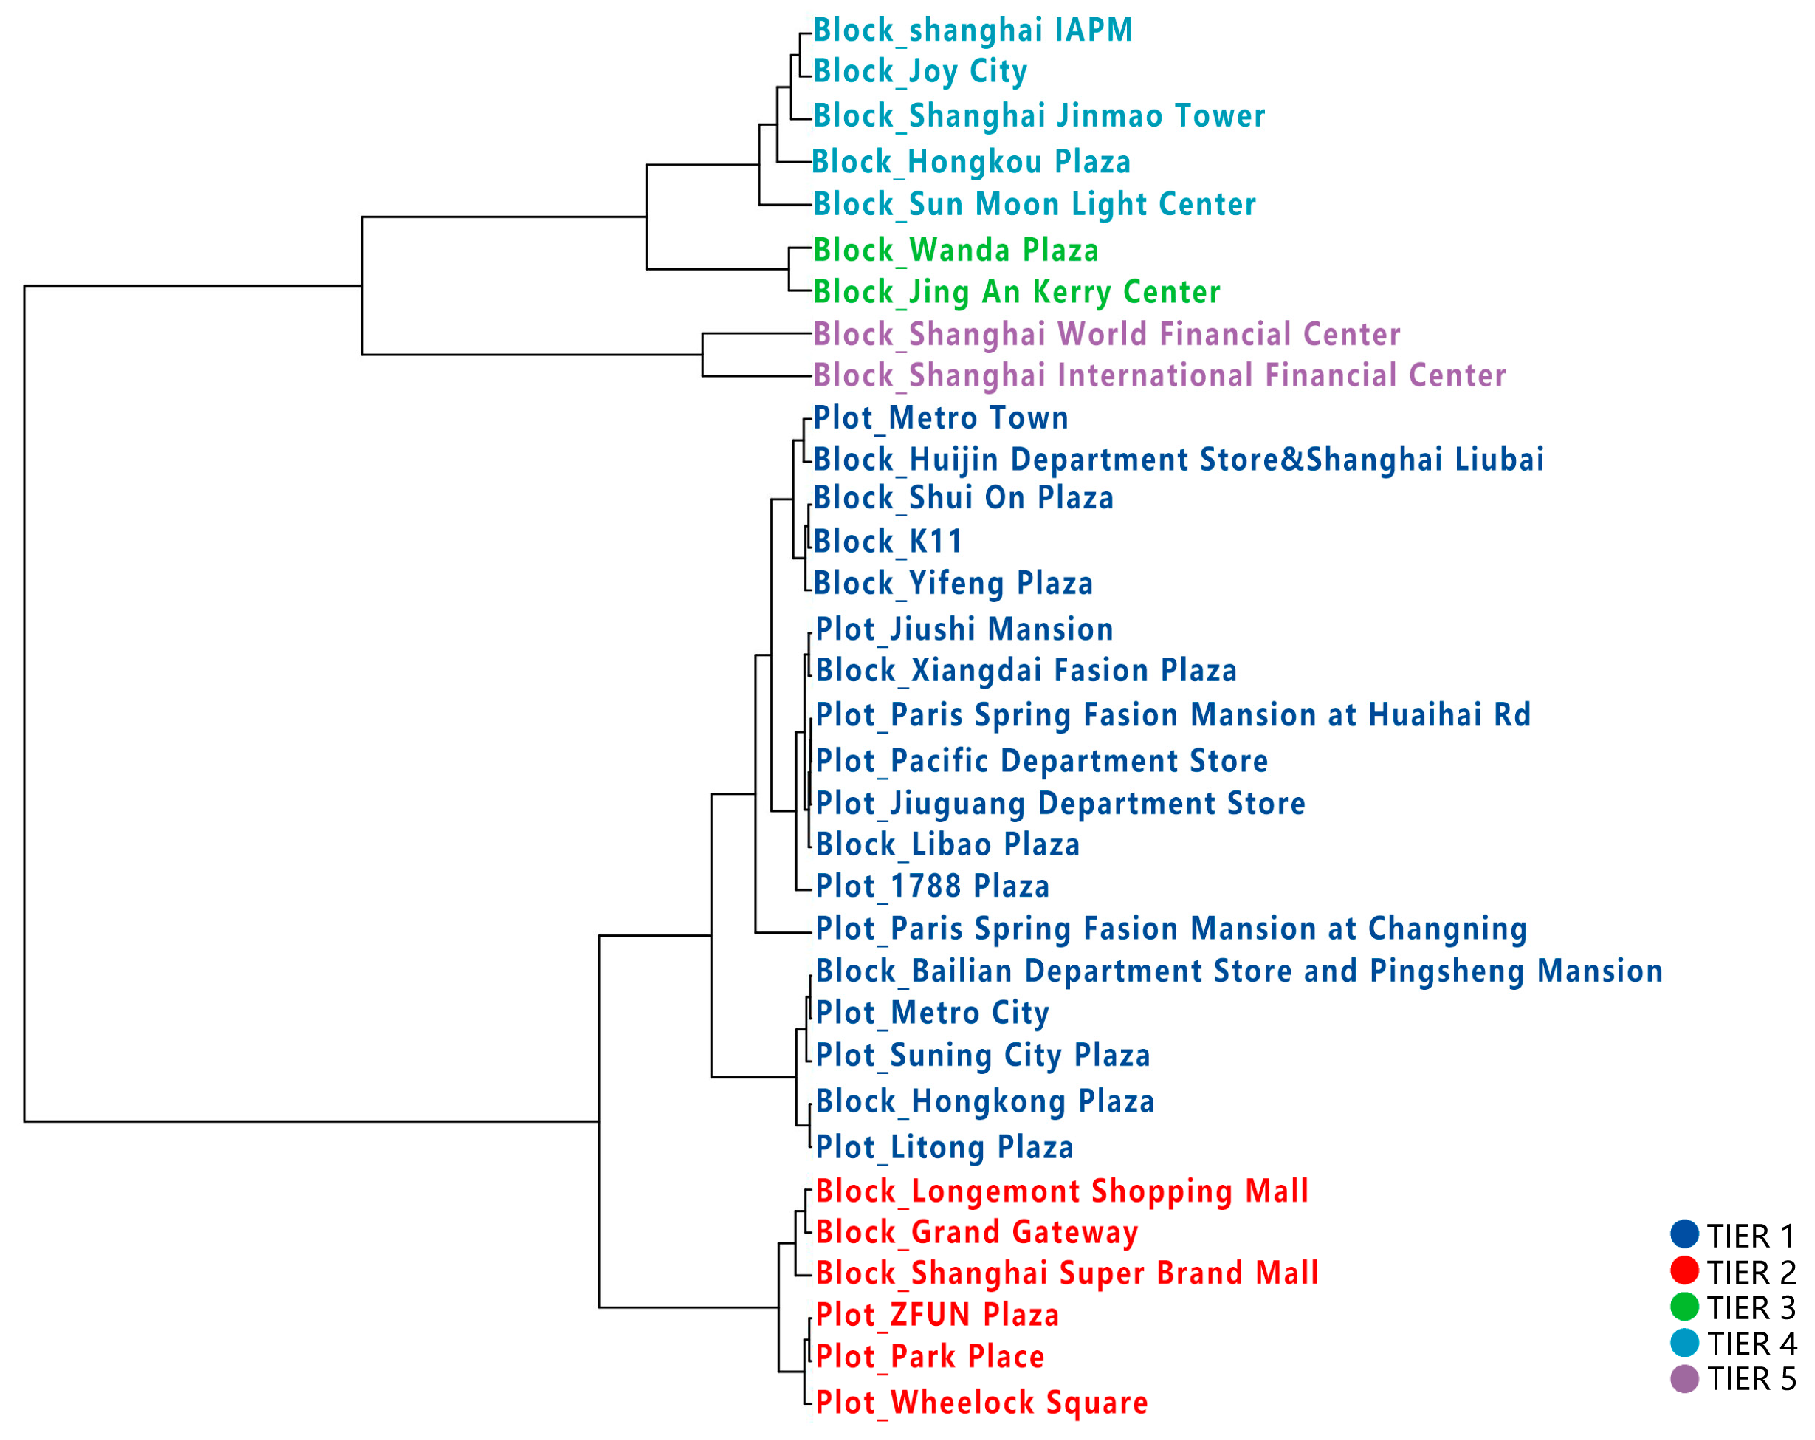
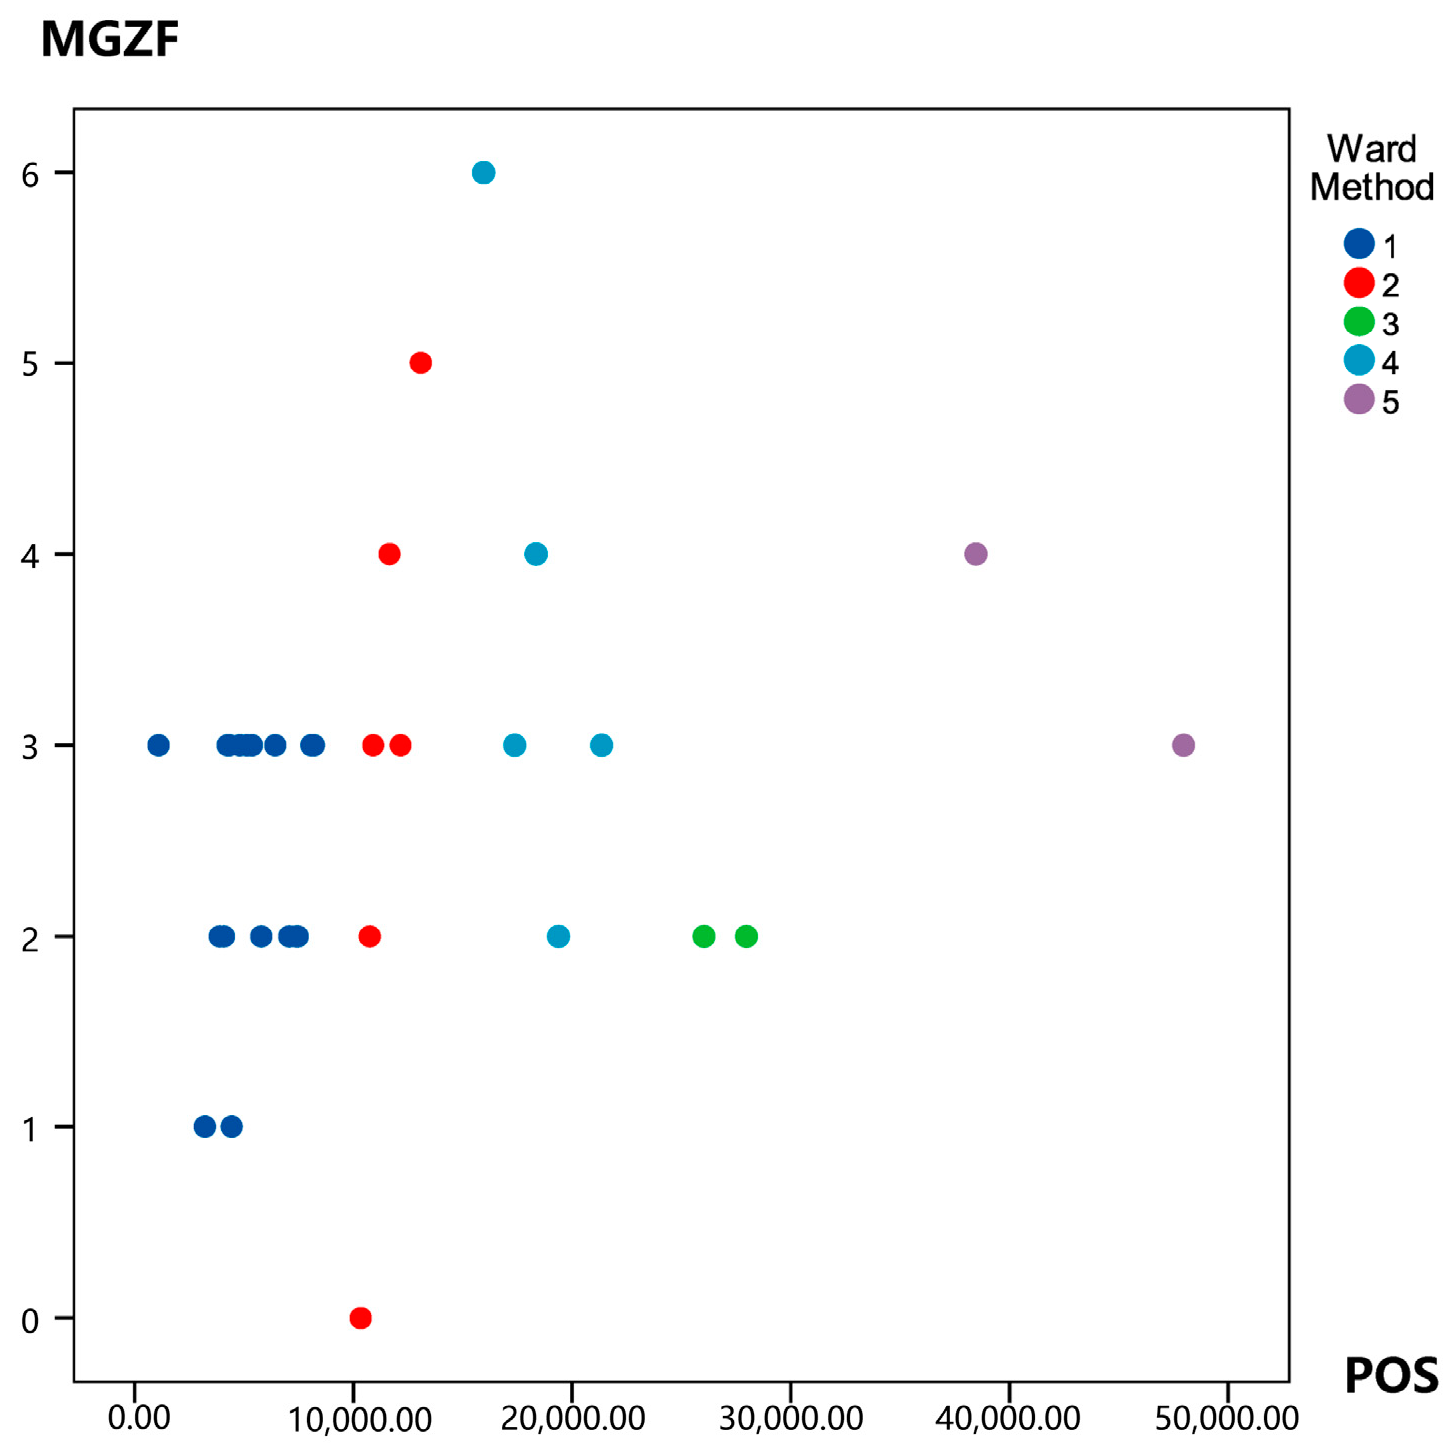
To analyze the transfer ratio of TCA to PIS in Formula (1), it is necessary to classify the other two independent variables, POS and MGZFs. The Wald method was used to cluster 33 rail transit complexes cases based on POS and MGZFs, and the clustering results are shown in
Figure 12 and
Figure 13.
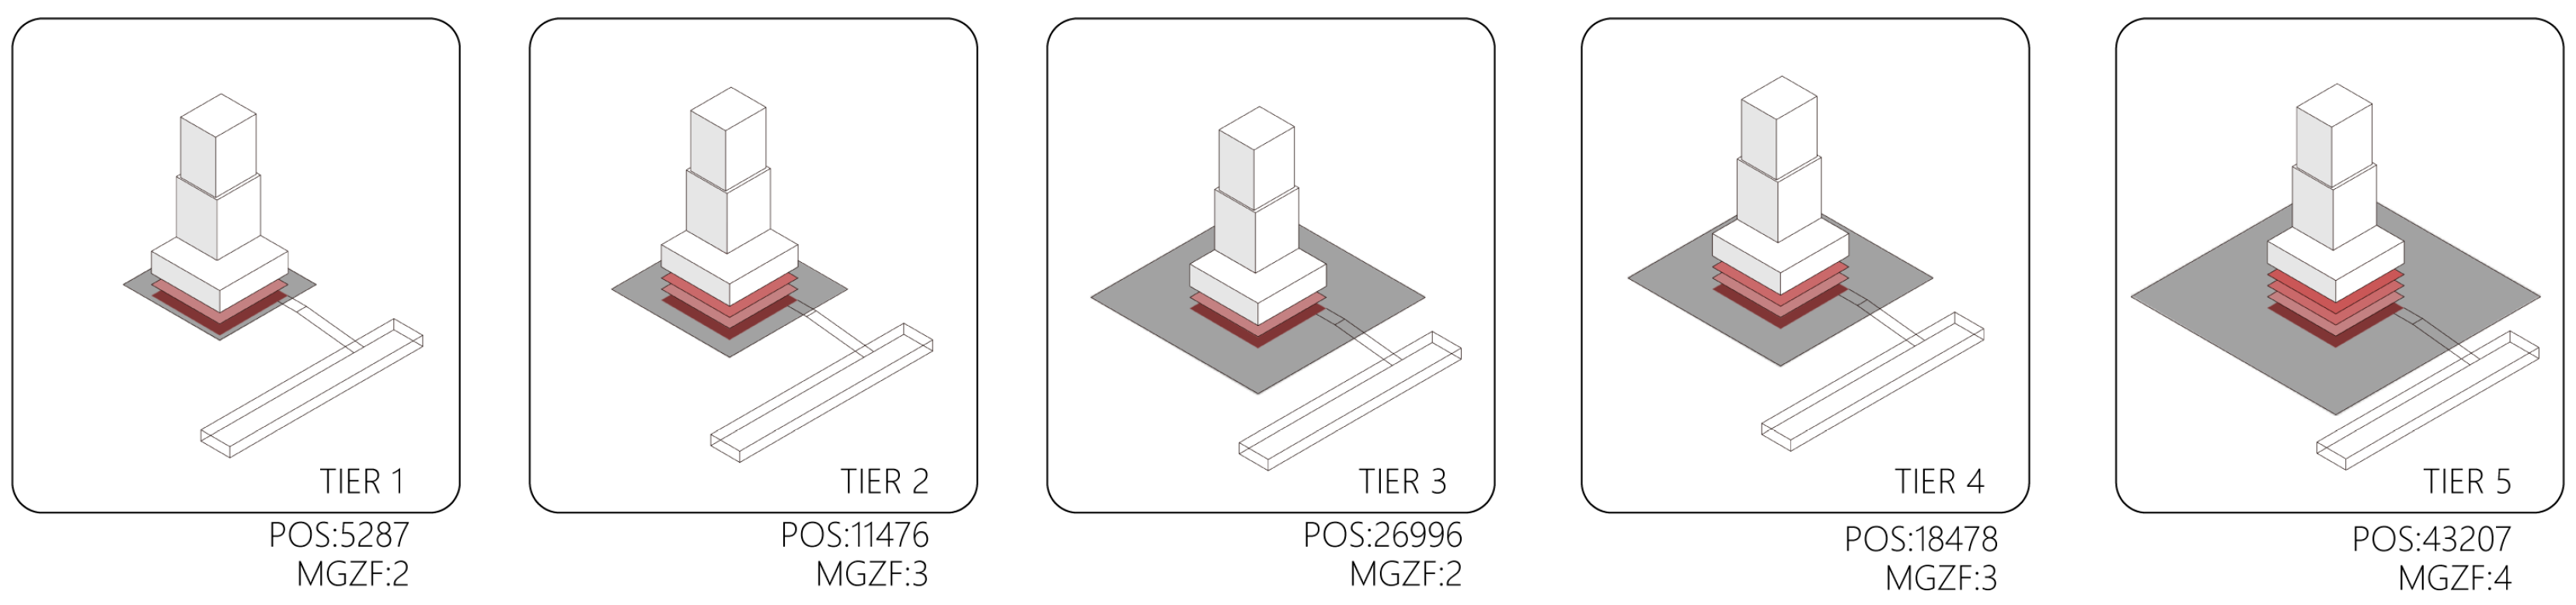
According to the results, the combination of the POS and MGZF variables can divide the rail transit complexes into five tiers: low number of MGZFs—small amount of POS (Tier 1), medium number of MGZFs—low amount of POS (Tier 2), low number of MGZFs—slightly larger amount of POS (Tier 3), medium number of MGZFs—medium amount of POS (Tier 4), and high number of MGZFs—abundant POS (Tier 5). For the five tiers, the mean integer value of each indicator within each tier was selected as the representative of the tier. Tier 1 has a representative MGZF value of 2 and a POS value of 5287; Tier 2 has a representative MGZF value of 3 and a POS value of 11,476; Tier 3 has a representative MGZF value of 2 and a POS value of 26,998; Tier 4 has a representative MGZF value of 3 and a POS value of 18,478; Tier 5 has a representative MGZF value of 4 and a POS value of 43,207. The abstract models corresponding to the five tiers are shown in
Figure 14, and the changes in formulas at different levels are presented in
Table 6.
3.5. Typology of PIS and TCA for Types
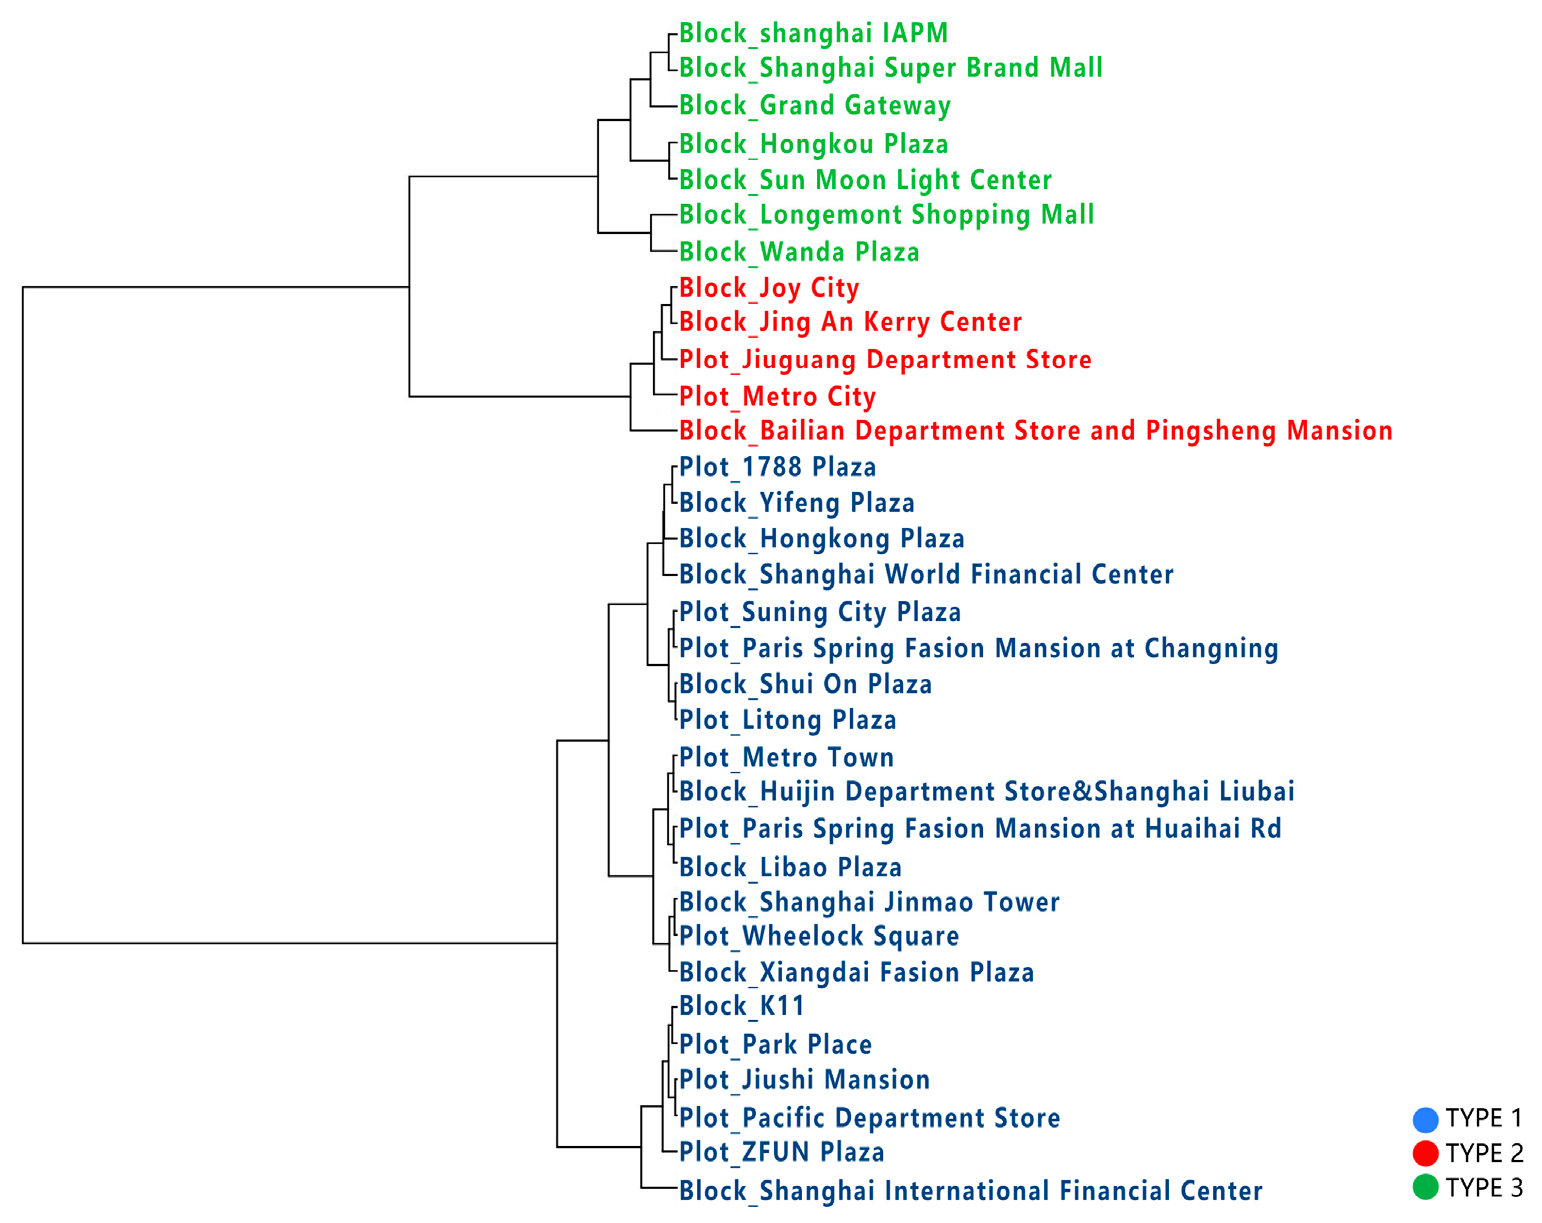
Since the Spearman correlation coefficient between TCA and PIS is 0.765, there is a significant correlation at the 0.01 level (two-tailed). Through cluster analysis of both variables (
Figure 15 and
Figure 16), it is known that there are only three possible combinations between TCA and PIS, namely three types: low TCA—low PIS (Type 1), medium TCA—medium PIS (Type 2), and high TCA—high PIS (Type 3).
For the three types, the mean integer value of each indicator within each type is selected as the representative of the type. The representative values for Type 1 are a TCA of 25,000 and a PIS of 5000; for Type 2, the representative values are a TCA of 100,000 and a PIS of 10,000; for Type 3, the representative values are a TCA of 150,000 and a PIS of 20,000. The abstract models corresponding to the three types are shown in
Figure 17.
4. Discussion
4.1. Spatial Matrix
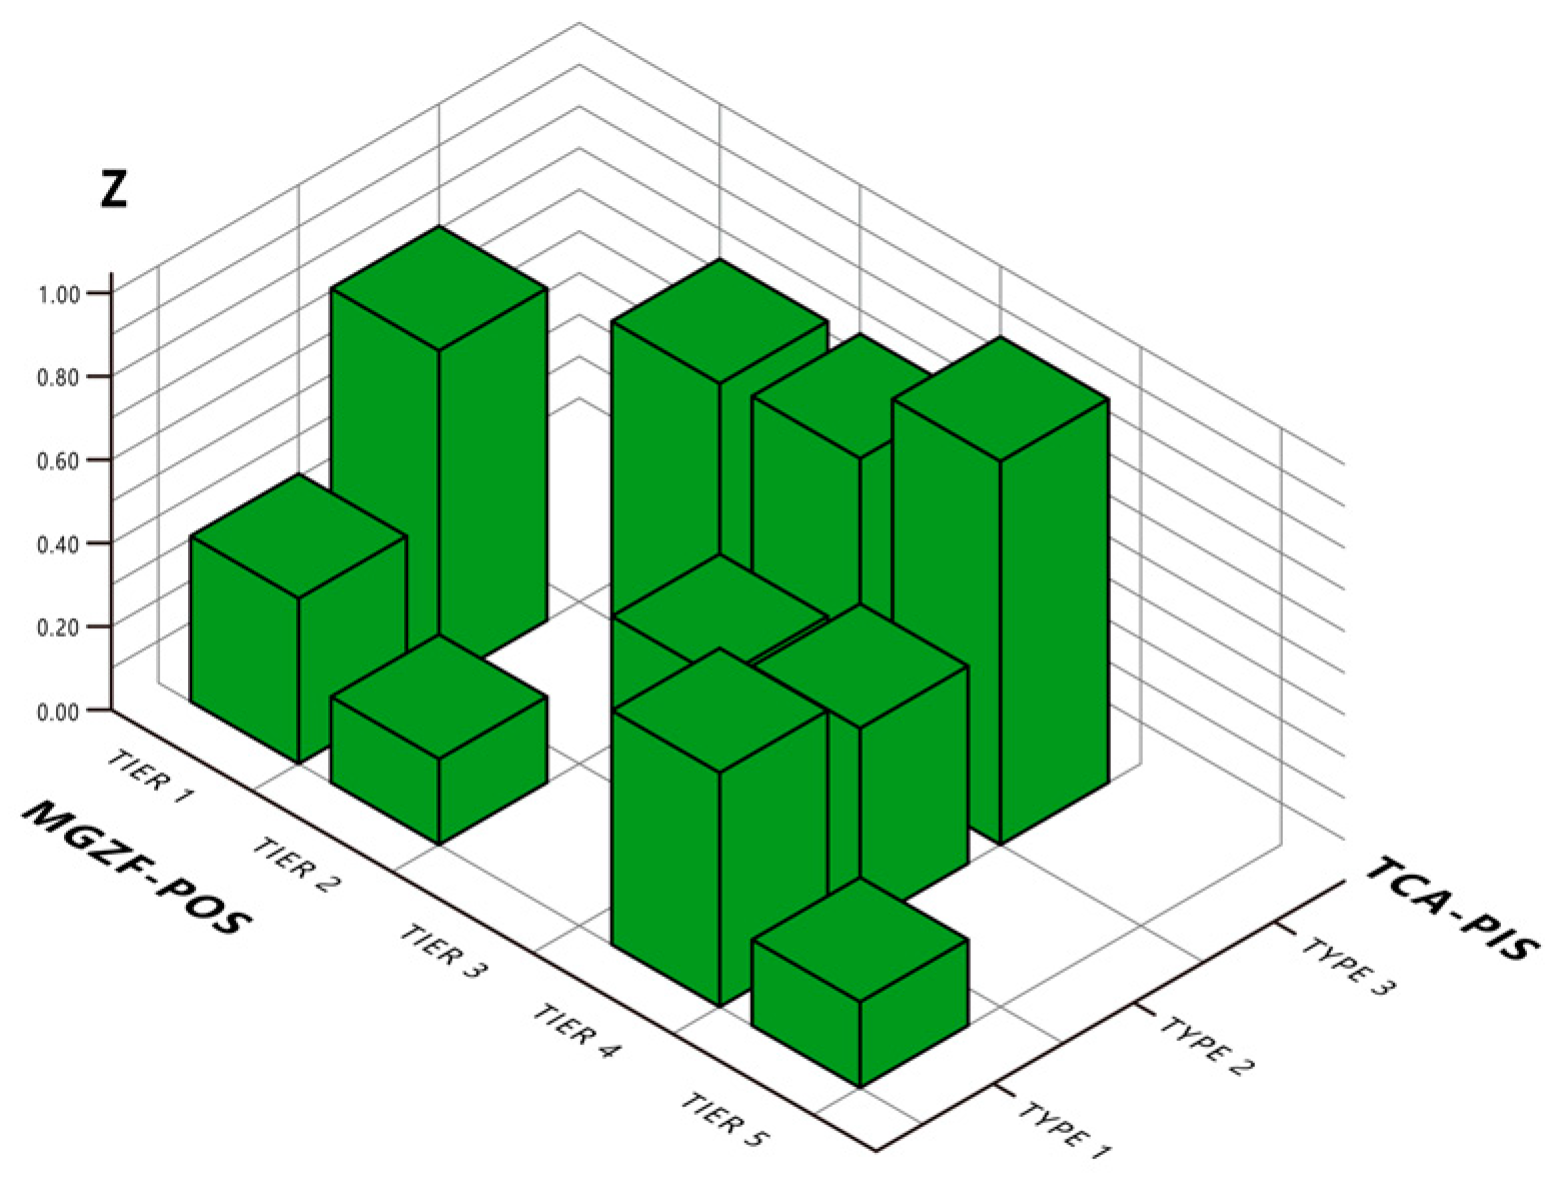
A spatial matrix related to the average value of GNCS_AR is generated using the tiers of POS and MGZFs, as well as the types of PIS and TCA (
Figure 18). In this matrix, the
x-axis represents the five tiers derived from the aforementioned typology, while the
y-axis represents the three types under each tier. The
z-axis, represented by the height of the bars, reflects the average GNCS_AR values, which indicate the balance between ‘efficiency’ and ‘equity’.
This spatial matrix provides an intuitive way to compare the performance of different combinations of PIS and TCA across the five tiers. By visualizing these relationships, it becomes easier to identify which ratios of PIS and TCA offer the most favorable balance between ‘efficiency’ (benefiting developers) and ‘equity’ (benefiting the public). This comparison allows for a more informed evaluation of public space optimization strategies within transit-oriented developments.
4.2. Type Transfer Under Five Tiers
To more intuitively observe type optimization under a single tier, a section of the spatial matrix was created using the “code city” model, as shown in
Figure 19. The “code city” is divided into three concentric circles: the outermost circle represents Type 1, the central circle represents Type 3, and the circle in between represents Type 2. By examining this cross-section, changes in the indoor public space area and commercial area indicators among the three types can be observed more clearly.
In certain tiers, some types may be absent, such as Type 3 in Tier 1. This absence is likely due to the lack of practical examples in real-world scenarios, as identified in the analysis of 33 plots across 11 rail transit stations. Further sample enrichment is needed to draw definitive conclusions about the absence of certain types.
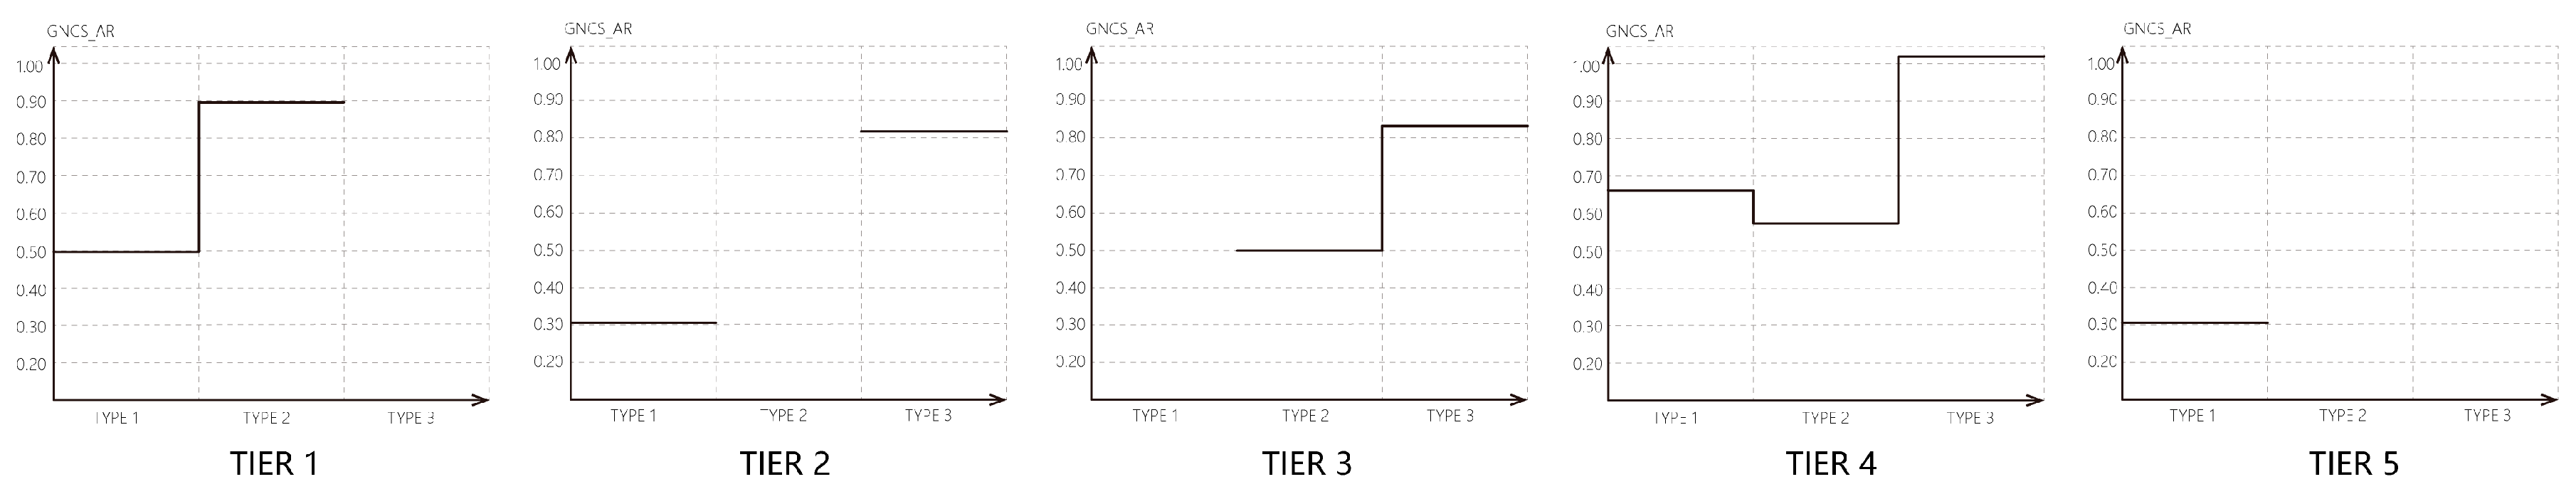
Among the existing types, there is a clear optimization relationship. Based on the spatial matrix heights, Type 2 offers significantly better public space quality than Type 1. To optimize the complex, transitioning from Type 1 to Type 2 can be achieved by adjusting the commercial area and indoor public space area. Specifically, adding 5000 m2 of indoor public space can allow for an increase of 50,000 m2 in commercial area while simultaneously enhancing public space quality. This optimization process can be gradual, with the exchange ratio between commercial area and indoor public space area progressively increasing to reach a 10:1 ratio, characteristic of Type 2.
The optimization process under the other four tiers follows the same logic as described above (
Figure 20).
4.3. Supplementary Explanation for Visualization
Certainly, the current types and visual attempts at guidance have not been empirically proven to ensure that all users share the same understanding and perception. The charts (
Table 7,
Table 8 and
Table 9 and
Figure 21) provided below offer a logical, conventional operational platform as a supplementary correction to the above visualizations, ensuring that all parties have a unified operational platform.
5. Conclusions
Multi-ground public spaces are a significant urban spatial form in the high-density urban environments of East Asia, particularly common in regions such as Tokyo, major Chinese cities, Hong Kong, and Singapore. However, in Europe and America, despite being the origin and application sites of TOD and incentive zoning, there is little combined analysis of these two fields. Policies and research from Hong Kong and Tokyo provide preliminary evidence, while this study advances the possibility of refining, visualizing, and three-dimensionalizing such practices with more empirical support.
5.1. Innovation in Dependent Variables
This study innovatively shifts the incentive zoning method from being based on price to being based on public space value. At the current stage, most high-density cities in East Asia are transitioning from large-scale development phases to urban renewal phases. The traditional incentive zoning methods based on economic pricing are not suitable for this stage. The goal of urban renewal is to enhance urban vitality rather than solely focusing on economic benefits. Therefore, there is a need to guide urban renewal from a perspective beyond just economic pricing. We have chosen GNCS_AR, an indicator that reflects the quality of public spaces, as the dependent variable to attempt a value-based incentive zoning approach.
5.2. Innovation in Indicators
By emulating the establishment of indicators such as FAR and building density, we have developed the RIOPS_MGZF indicator. This indicator incorporates various factors involved in incentive zoning and utilizes multivariate linear fitting to integrate MGZFs into the equation, thereby extending the significance of the equation into three-dimensional space. Most importantly, beyond its implications for spatial interpretation and area substitution, this indicator also holds significance for the typology of tiers and types. It bridges the three levels of form, indicators, and guidance, enhancing the applicability of the TOD concept in Asia with improved morphological and three-dimensional guidance frameworks.
6. Prospects
6.1. Application Scenarios
This article primarily focuses on subway-adjacent plots in high-density development areas of East Asia, characterized by prominent towers and three-dimensional public spaces formed through corridors. This is particularly evident in cities such as Hong Kong, Tokyo, and Shanghai, where the development contexts are highly similar. The findings of this study are particularly effective for comparing typical rail transit complexes in these regions. For other areas, such as developing countries or cities with significant cultural differences and policy distinctions, the applicability of these results requires further research. The visualization control methods discussed in this article are essentially customized for subway-adjacent plots in high-density urban areas of East Asia. Future research could consider adjusting these visualization control methods to accommodate regions with different characteristics.
6.2. Applicability of Typology and Visualization
Regarding the understanding of typology and visualization control, from an object perspective, the current control targets are subway-adjacent plots in high-density development areas of East Asia, which should include three-dimensional public spaces. The study has already considered factors such as population density and the possibility of planning policy adjustments for these areas. The construction or renovation of these objects primarily falls within the work scope of development teams, requiring no large-scale public participation but only the understanding of the two main parties involved in the negotiation, namely developers and the government. This type of visualization operation is an attempt; currently, government controls still mainly rely on table checking. The charts in
Section 4.3 ensure that both parties have a unified operational platform. Further research is needed to prove that the visualization control methods derived from this study can be understood by the public, developers, and the government without any misinterpretation.
Author Contributions
Conceptualization, Y.Z., A.L., and R.S.; methodology, Y.Z.; software, Y.Z. and R.S.; formal analysis, Y.Z.; data curation, Y.Z. and Y.Y.; writing—original draft, Y.Z.; visualization, Y.Z., A.L., and R.S.; supervision, Y.Y. All authors have read and agreed to the published version of the manuscript.
Funding
This research was funded by (1) NSFC Funding Program No. 52408029: Research on guidance and regulation index of developing three-dimensional railway transit block with public space vitality; (2) Key Laboratory of Ecology and Energy Saving Study of Dense Habitat, Ministry of Education (Tongji University), Open Research Program No. 20220107: TOD Plotting Design Guidelines Research on the Incentive Zoning Sending Area of Urban Base Public Space.
Data Availability Statement
The original contributions presented in the study are included in the article, further inquiries can be directed to the corresponding author.
Conflicts of Interest
The authors declare no conflict of interest.
References
- Webster, C. The new institutional economics and the evolution of modern urban planning: Insights, issues and lessons. Town Plan. Rev. 2005, 76, 455–484. [Google Scholar] [CrossRef]
- Lin, Y.; Yin, Z. Theoretical Path of Regulatory Planning Optimization to Promote the Flow of Land Development Right Elements. Planners 2021, 5–10. [Google Scholar]
- Cantillon, R. Essay on the Nature of Trade in General. Liberty Fund. Available online: https://search.ebscohost.com/login.aspx?direct=true&scope=site&db=nlebk&db=nlabk&AN=1052399 (accessed on 23 November 2024).
- Von Thünen, J.H. Der Isolierte Staat; BoD–Books on Demand; Salzwasser-Verlag Gmbh: Frankfurt-Nord-West, Germany, 2015. [Google Scholar]
- Whyte, W.H. City: Rediscovering the Center; University of Pennsylvania Press: Philadelphia, PA, USA, 2012. [Google Scholar]
- Yu, Y. A-Century Development of New York City’s Zoning Resolution (1916–2016) from the Perspective of Privately Owned Public Space Construction. Urban Plan. Int. 2016, 31, 98–109. [Google Scholar]
- Wu, C.; Wang, Z.; Lu, Z. Strategy of Urban Development from the View of Shibuya Hikarie. Archit. Tech. 2015, 40–47. Available online: https://kns.cnki.net/kcms2/article/abstract?v=Oa1N_PzK0nTQeGKTiCUWoCclhu3DVI50GAWQsFVgoPYyGe8wcTFiXP9QPI7Ph5h8SaLiXA7_sQipooGMCuoDN1paBvvauu-AArJsXvV7P9S2MXIT1rVsZd8JzqGa1mxX0RsY_tOkfjXb5U4lGiPXl3gB1M5DxjSTl6ysNes3Bld6z39c1jgNKYgCaj5sQ-iM9Kw4Nd44XrQ=&uniplatform=NZKPT&language=CHS (accessed on 23 November 2024).
- Yan, Y.; Xu, L.; Liu, H.; Xia, Z. Precondition of Railway Complex’s Urban Base Public Spaces as Incentive Zoning Sending Area Empirical Study on Public Space Quality and Accessibility. Time Archit. 2023, 2, 44–53. [Google Scholar] [CrossRef]
- Rossini, F.; Yiu, M.H.-L. Public open spaces in private developments in Hong Kong: New spaces for social activities? J. Urban. Int. Res. Placemaking Urban Sustain. 2020, 14, 237–261. [Google Scholar] [CrossRef]
- Calthorpe, P. The Next American Metropolis; Princeton Architectural Press: New York, NY, USA, 1993. [Google Scholar]
- Wang, L.; Xia, H. A Comprehensive Review of the Development Characteristics and Future Trends of TOD in Chinese Urban Rail Transit. Urban Rail Transit 2024, 1–15. [Google Scholar] [CrossRef]
- Rosen, S. Hedonic prices and implicit markets: Product differentiation in pure competition. J. Political Econ. 1974, 82, 34–55. [Google Scholar] [CrossRef]
- van Dijk, T.; Andersen, B.J. Government or Market: Competing Ideals in American Metropolitan Regions. In Regional Planning for Open Space; Routledge: London, UK, 2009. [Google Scholar]
- Punter, J. Urban design in central Sydney 1945–2002: Laissez-Faire and discretionary traditions in the accidental city. Prog. Plan. 2005, 63, 11–160. [Google Scholar] [CrossRef]
- Jim, C.Y.; Chen, W.Y. External effects of neighbourhood parks and landscape elements on high-rise residential value. Land Use Policy 2010, 27, 662–670. [Google Scholar] [CrossRef]
- Luo, Y.; Liu, G.; Xu, P. Research on Floor Area Ratio Equivalent Transfer under the Protection of Historical Blocks: Based on Hedonic Model. Constr. Econ. 2018, 39, 98–101. [Google Scholar] [CrossRef]
- Gehl, J. Life Between Buildings: Using Public Space; Island Press: Washington, DC, USA, 2011; Available online: http://site.ebrary.com/id/10571291 (accessed on 23 November 2024).
- Samant, S.R. Transit-Oriented Developments and Stratified Public Space Networks. In The Palgrave Handbook of Climate Resilient Societie; Springer International Publishing: Berlin/Heidelberg, Germany, 2021; pp. 1105–1145. [Google Scholar]
- Francis, M. Urban Open Space: Designing for User Needs; Island Press: Washington, DC, USA, 2003. [Google Scholar]
- Montgomery, J. Making a city: Urbanity, vitality and urban design. J. Urban Des. 1998, 3, 93–116. [Google Scholar] [CrossRef]
- Wang, Z.; Wu, M.; Dai, X.; Fang, J.; Hu, G. A Research on the Integration of Mixed-use Complexes. Pedestr. Syst. Metro System Urban Plan. Forum 2019, 63–71. [Google Scholar] [CrossRef]
- He, X.; Tao, Y.; Wang, Q.; Lin, H. A co-analysis framework for exploring multivariate scientific data. Vis. Inform. 2018, 2, 254–263. [Google Scholar] [CrossRef]
- Plunz, R. A History of Housing in New York City; Columbia University Press: Columbia, SC, USA, 2016. [Google Scholar]
- Punter, J. Design Guidelines in American Cities: A Review of Design Policies and Guidance in Five West Coast Cities; Liverpool University Press: Liverpool, UK, 1999. [Google Scholar]
- Russel, D.; Jordan, A. Environmental policy integration in the UK. In Governance for the Environment: A Comparative Analysis of Environmental Policy Integration; Edward Elgar: Cheltenham, UK, 2010; pp. 157–177. [Google Scholar]
- Whyte, W.H. The Social Life of Small Urban Spaces; Project for Public Spaces: New York, NY, USA, 2001. [Google Scholar]
- He, S. Urban Redevelopment Under Market Transition: A Case Study of Shanghai. Doctoral Dissertation, University of Southampton, Southampton, UK, 2006. [Google Scholar]
- Berghauser Pont, M.; Haupt, P. Spacematrix: Space, Density and Urban Form; Nai010 Publishers: Rotterdam, The Netherlands, 2021. [Google Scholar]
- Mashhoodi, B.; Berghauser Pont, M. Studying land-use distribution and mixed-use patterns in relation to density, accessibility and urban form. In Proceedings of the 18th International Seminar on Urban Form, Montréal, QC, Canada, 26–29 August 2011; pp. 1–19. [Google Scholar]
- Radberg, J. Towards a Theory of Sustainability and Urban Quality. In Evolving Environmental Ideals—Changing Way of Life, Values and Design Practices: IAPS 14 Conference Proceeding; Book of Proceedings, IAPS, 14; Royal Institute of Technology: Stockholm, Sweden, 1996. [Google Scholar]
- Elias, S.; Beirão, J.N. Evaluating Urbanity by Measuring Urban Morphology Attributes. In Proceedings of the International Symposium on Formal Methods in Architecture, Galicia, Spain, 24–28 May 2022; Springer: Berlin/Heidelberg, Germany, 2022; pp. 219–248. [Google Scholar]
- Alexander, E.R. Density measures: A review and analysis. J. Archit. Plan. Res. 1993, 10, 181–202. [Google Scholar]
- Tan, Z. Code City: Urban Diagramming as Criticism and Projection. New Archit. 2018, 138–143. [Google Scholar] [CrossRef]
- Dimmer, C.; Kurose, T.; Maekawa, A.; Tchapi, M.; Shih, P.Y.; Lien, C.; Hou, J.; Baba, Y.; Fuhrmann, E.S.; Beza, B.; et al. Privately Owned Public Space: The International Perspective; Center for Sustainable Urban Regeneration: New York, NY, USA, 2013. [Google Scholar]
- Han, S.; Song, D.; Xu, L.; Ye, Y.; Yan, S.; Shi, F.; Zhang, Y.; Liu, X.; Du, H. Behaviour in public open spaces: A systematic review of studies with quantitative research methods. Build. Environ. 2022, 223, 109444. [Google Scholar] [CrossRef]
- El Hedhli, K.; Chebat, J.C.; Sirgy, M.J. Shopping well-being at the mall: Construct, antecedents, and consequences. J. Bus. Res. 2013, 66, 856–863. [Google Scholar] [CrossRef]
Figure 1.
One of the visual guidelines in “New York Zoning Regulations”. (Originating from “New York Zoning Regulation 1916”).
Figure 1.
One of the visual guidelines in “New York Zoning Regulations”. (Originating from “New York Zoning Regulation 1916”).
Figure 2.
Explanation of FAR transfer in Seattle incentive zoning.
Figure 2.
Explanation of FAR transfer in Seattle incentive zoning.
Figure 3.
FSI scheme (Redraw based on the figure in “Spacematrix: Space, Density and Urban Form” [
28]).
Figure 3.
FSI scheme (Redraw based on the figure in “Spacematrix: Space, Density and Urban Form” [
28]).
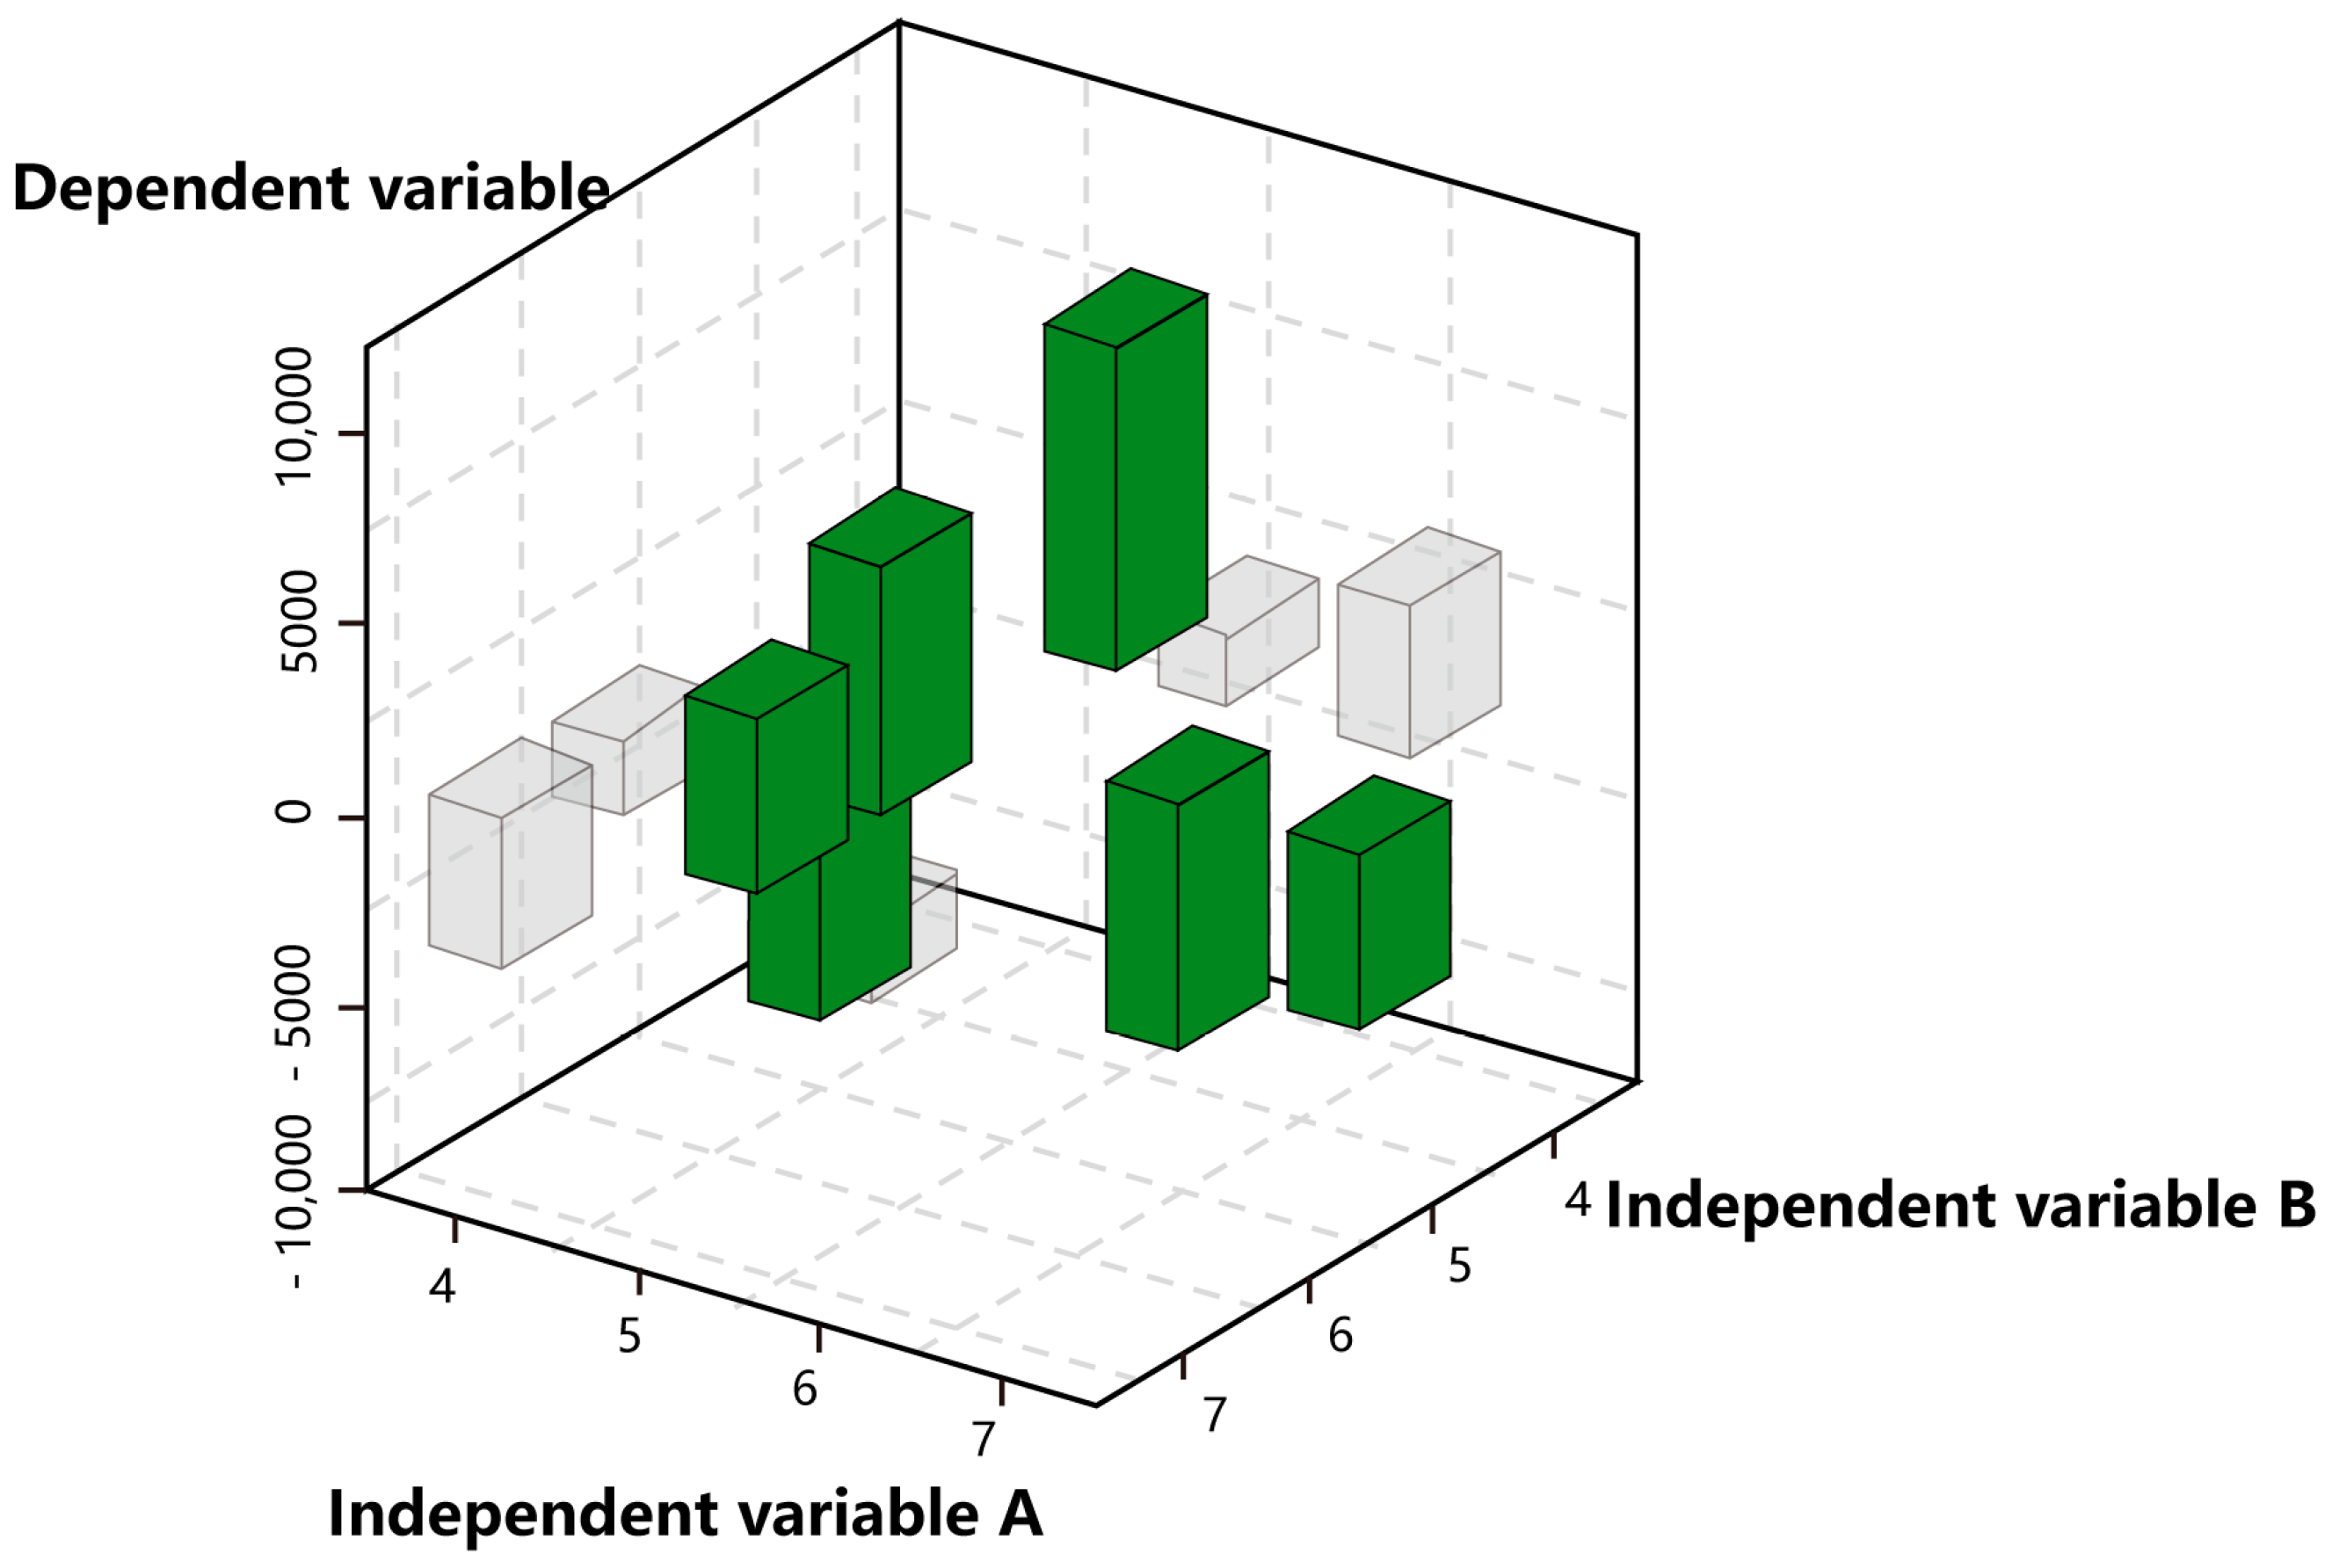
Figure 4.
Example of 3-D gradient control. (Redraw based on the figure in “Studying land-use distribution and mixed-use patterns in relation to density, accessibility and urban form” [
29]).
Figure 4.
Example of 3-D gradient control. (Redraw based on the figure in “Studying land-use distribution and mixed-use patterns in relation to density, accessibility and urban form” [
29]).
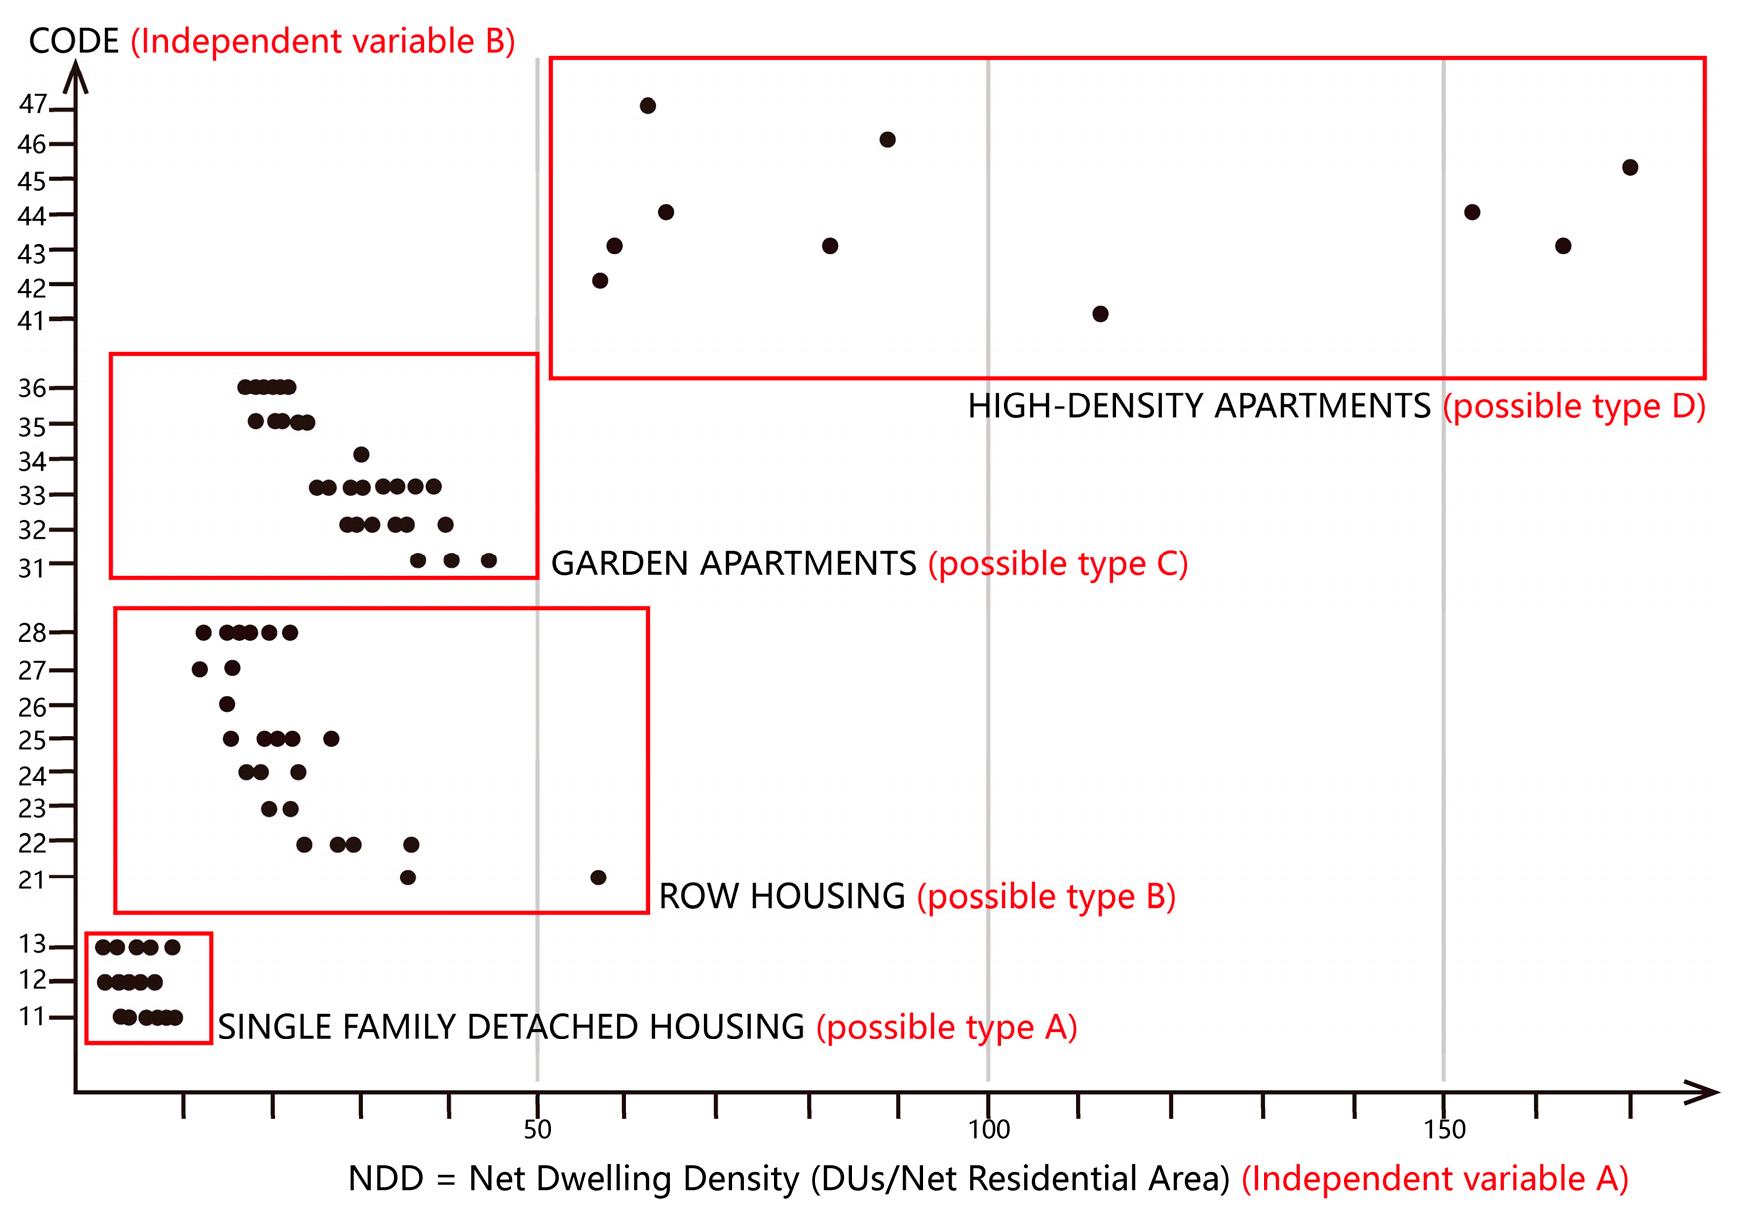
Figure 5.
Distribution of net dwelling density. (Redraw based on the figure in “Density measures: A review and analysis” [
32]).
Figure 5.
Distribution of net dwelling density. (Redraw based on the figure in “Density measures: A review and analysis” [
32]).
Figure 6.
Examples of “code city”. (Reprinted with permission from Ref. [
33]. 2018, ZHENG TAN).
Figure 6.
Examples of “code city”. (Reprinted with permission from Ref. [
33]. 2018, ZHENG TAN).
Figure 7.
Research framework.
Figure 7.
Research framework.
Figure 8.
Daily rider statistics of all metro station areas in Shanghai.
Figure 8.
Daily rider statistics of all metro station areas in Shanghai.
Figure 9.
Models of 11 metro station areas in Shanghai.
Figure 9.
Models of 11 metro station areas in Shanghai.
Figure 10.
(
A) Indicators of the study; (
B) location of case study urban living spaces in relation to large outdoor POPSs. ((
B): Redraw based on the figure in “Privately Owned Public Space: The International Perspective” [
34]).
Figure 10.
(
A) Indicators of the study; (
B) location of case study urban living spaces in relation to large outdoor POPSs. ((
B): Redraw based on the figure in “Privately Owned Public Space: The International Perspective” [
34]).
Figure 11.
Typology and control of indoor public spaces in Hong Kong in terms of plane form. (Redraw based on the figure in “Public open spaces in private developments in Hong Kong: New spaces for social activities?” [
9]).
Figure 11.
Typology and control of indoor public spaces in Hong Kong in terms of plane form. (Redraw based on the figure in “Public open spaces in private developments in Hong Kong: New spaces for social activities?” [
9]).
Figure 12.
Clustering of POS and MGZFs.
Figure 12.
Clustering of POS and MGZFs.
Figure 13.
Distribution of POS and MGZFs.
Figure 13.
Distribution of POS and MGZFs.
Figure 14.
By modeling, five tiers are generalized and visualized.
Figure 14.
By modeling, five tiers are generalized and visualized.
Figure 15.
Clustering of POS and MGZFs.
Figure 15.
Clustering of POS and MGZFs.
Figure 16.
Distribution of POS and MGZFs.
Figure 16.
Distribution of POS and MGZFs.
Figure 17.
In the modeling process, three types are visualized. Since there are two different trends, the generalized models corresponding to these trends are separated into groups.
Figure 17.
In the modeling process, three types are visualized. Since there are two different trends, the generalized models corresponding to these trends are separated into groups.
Figure 18.
Spatial matrix of GNCS_AR.
Figure 18.
Spatial matrix of GNCS_AR.
Figure 19.
(a) Section of spatial matrix (b) Section of code city in Tier 1.
Figure 19.
(a) Section of spatial matrix (b) Section of code city in Tier 1.
Figure 20.
Section of spatial matrix and code cities in Tiers 2–5.
Figure 20.
Section of spatial matrix and code cities in Tiers 2–5.
Figure 21.
Line charts of type transfer under five tiers.
Figure 21.
Line charts of type transfer under five tiers.
Table 1.
Case study of basic public space replacement policy in Tokyo, Japan.
Table 1.
Case study of basic public space replacement policy in Tokyo, Japan.
| Incentive Zoning Bonus Policy/Document | Japan’s Incentive Zoning Management for Base Connection, Commercial, Pedestrian Street and Other Zoning Elements |
|---|
| Tokyo Sugamo Urban Renewal Area Zoning Policy of FAR | Including the rectification of vacant land on connected plots (15~80%), the rectification of through passages (30%), the introduction of bustling two-story facilities (20%), the rectification of pedestrian overpasses and corridors (50%), the rectification of sidewalks (20%), plazas (20%), and living service functions (20%), and the introduction of facilities on the first floor outside of specific roads (10%). The subsidy can reach up to 650% of the standard FAR. |
| Tokyo Musashino’s Street District Reconstruction Policy | The upper limit of growth is 550%: necessary public facilities, public welfare facility construction projects (shopping mall construction, pedestrian dedicated road construction), and infrastructure projects that affect the land zoning form (integrating adjacent plots of 650–3000 m2 according to the terrain).
The upper limit of growth is 600%: square public space (FAR + 30%), pedestrian space construction (FAR + 20%), and pedestrian platform (+50%). |
| Ministry of Land, Infrastructure, Transport and Tourism’s Planning Document | Construction of commercial street (with catering, first-floor shops, pedestrian street) (+50% or 100%).
Construction of underground public pedestrian streets (underground pedestrian streets, mall passages) (+50% or 100%).
Construction of underground public spaces (connecting passages for subway entrance and exit facilities) (+50%).
Charm block construction (rest square and public space construction) (+50%). |
Table 2.
Case study of basic public space replacement policy in other countries.
Table 2.
Case study of basic public space replacement policy in other countries.
| Incentive Zoning Bonus Policy/Document | Other Countries’ Incentive Zoning Management for Base Connections, Commercial Purposes, Pedestrian Streets, and Other Zoning Elements |
|---|
| Project Management in Kunming, China | In this case, 1 square meter of public green space/public welfare facility/municipal supporting facility = 6 m2 of rewarding building areas, not exceeding 20% of the approved FAR. |
| FAR Calculation Regulations in Shenzhen, China |
Rewarding building area calculation for open spaces in architecture: The rewarding building area = K1 × the floor area of the open public space within the building.
K1: reward coefficient for the floor area of the open space within the building.
To create urban public passageways or urban public open spaces, or to use elevated floors as public parking or green leisure areas (i.e., open public spaces within the building), the following conditions must be met:
- (1)
Urban public passageways must be accessible throughout the day. - (2)
Elevated floors must be used as urban public squares. - (3)
Elevated floors must be used for public parking. - (4)
Elevated floors must be used for green leisure areas.
|
| 2014 New York Zoning Regulations | A table based on the cross-matrix of public plazas, arcade types, and incompatible zoning is formed using the displacement per square meter of POS (m2): public plazas are mostly 4–10, with higher floor area ratios leading to higher displacement multiples; arcades are mostly 2–6; sunken plazas connected to subways can reach 10; weather-protected pedestrian spaces can reach 16; and special areas can reach 18. |
Table 3.
Experience reference of domestic and foreign incentive zoning.
Table 3.
Experience reference of domestic and foreign incentive zoning.
| Source | Method | Formula |
|---|
| Sydney | HFS | HFSH = 0.5 × As × FSRH
HFSH—the reward area that can be obtained for the protection of architectural heritage
As—the area occupied by historical buildings
FSRH—the highest FAR when the plot is for commercial or other purposes |
| Taiwan | Land Value Equivalent Transfer Method | ΔSB = SA × PA/PB × RB
ΔSB—extra FAR the receiving area can obtain
SA—land area of sending area
PA—land value of sending area
PB—land value of receiving area
RB—FAR of receiving area |
| Gu Kunpeng | Method on the Conversion of Development Right Value | Price = (actual constructable quantity of site B − virtual constructable quantity of site B) × corresponding property price |
| Wang Lili | Market Comparison Method | Transfer in FAR index = (transfer out FAR × transfer out area floor price × policy incentive coefficient)/transfer in area floor price |
| Lu Yu, Lu Guiwen, Xu Pengpeng | Hedonic Price Method | The sample taken from Chongqing conforms to the model:
P = 161.936 + 273.866 × X1 + 0.248 × X2 + 20.848 × X4 − 25.258 × X9 − 43.434 × X11 − 29.108 × X13 − 42.102 × X15 + 2.620 × X16
(X1 to X16 are the factors affecting the price of urban residential land considered by the author, such as FAR, river view resources, etc.) |
Table 4.
Spearman’s correlation coefficients between public space-related indicators, commercial space-related indicators, and GNCS_AR.
Table 4.
Spearman’s correlation coefficients between public space-related indicators, commercial space-related indicators, and GNCS_AR.
| | Public Space-Related Indicators | Commercial Space-Related Indicators |
|---|
| | RIOPS_MGZF | MGZF | TPSA | PIS | OPS_VP | OPS_VR | PS_VR | RIOPS | OPS_CVP | COS_VR | BC_VP | CBVR |
|---|
| CALCULATION METHOD | RIOPS/(MGZF + 1) | | | | BUILDING AREA/POS | OPEN PUBIC PLACE/BUILDING AREA | TPSA/BUILDING AREA | PIS/POS | INDOOR SPACE/POS | POS/INDOOR SPACE | TCA/NDOOR SPACE | BUILDING AREA/BLOCK AREA |
| GNCS_AR | 0.431 * | 0.262 | 0.232 | 0.352 * | 0.414 * | −0.414 * | −0.183 | 0.502 ** | 0.604 ** | −0.570 ** | 0.435 * | 0.550 ** |
Table 5.
GNCS_AR multiple linear regression model.
Table 5.
GNCS_AR multiple linear regression model.
| | | Unstandardized Coefficients | | Standardized Coefficients | t | Sig. |
|---|
| | | B | Std.Error | Beta | | |
|---|
| Model 1 | (Constant) | 0.028 | 0.01 | | 2.897 | 0.007 |
| | RIOPS | 0.039 | 0.013 | 0.485 | 3.091 | 0.004 |
| Model 2 | (Constant) | 0.011 | 0.012 | | 0.92 | 0.365 |
| | RIPOS | 0.039 | 0.012 | 0.494 | 3.36 | 0.002 |
| | BC_VP | 0.002 | 0.001 | 0.342 | 2.329 | 0.027 |
| Model 3 | (Constant) | 0.015 | 0.011 | | 1.39 | 0.175 |
| | RIOPS | 0.086 | 0.022 | 1.075 | 3.847 | 0.001 |
| | BC_VP | 0.002 | 0.001 | 0.394 | 2.845 | 0.008 |
| | RIOPS_MGZF | −0.22 | 0.092 | −0.667 | −2.385 | 0.024 |
| a Dependent Variable: GNCS_AR | | | | | | |
Table 6.
Formulas at different tiers.
Table 6.
Formulas at different tiers.
| TIER | FORMULA |
|---|
| TIER 1 | |
| TIER 2 | |
| TIER 3 | |
| TIER 4 | |
| TIER 5 | |
Table 7.
The value of GNCS_AR for each type under each tier, as well as the indicator changes corresponding to the shifts between types and tiers.
Table 7.
The value of GNCS_AR for each type under each tier, as well as the indicator changes corresponding to the shifts between types and tiers.
| | TYPE X to TYPE X + 1 | TIER 1 | TIER 2 | TIER 3 | TIER 4 | TIER 5 |
|---|
| TYPE 1 | TCA + 75,780 PIS + 4218 | 0.04240594 | 0.022011107 | NO DATA | 0.059210196 | 0.019223622 |
| TYPE 2 | TCA + 75,601 PIS + 9384 | 0.085319414 | NO DATA | 0.043836317 | 0.0526709 | NO DATA |
| TYPE 3 | | NO DATA | 0.075758693 | 0.077333715 | 0.099071781 | NO DATA |
| TIER X to TIER X + 1 | | MGCF + 1POS + 6189 | MGCF-1POS + 15520 | MGCF + 1POS + 6189 | MGCF + 1POS + 6189 | |
Table 8.
Value domain of tiers.
Table 8.
Value domain of tiers.
| | POS (m2) | 0–8381.5 | 8381.5–19236 | 19236–22737 | 22737–30842.5 | ABOVE 30842.5 |
|---|
| MGZF | | | | | | |
| 0–2 | | TIER 1 | TIER 2 | TIER 3 | NO DATA | NO DATA |
| 3 | | TIER 1 | TIER 2 | NO DATA | TIER 4 | NO DATA |
| ABOVE 4 | | NO DATA | TIER 2 | NO DATA | NO DATA | TIER 5 |
Table 9.
Value domain of types.
Table 9.
Value domain of types.
| | TCA (m2) | 0–58936 | 58936–127040 | ABOVE 127040 |
|---|
| PIS (m2) | | | | |
| 0–5938 | | TYPE 1 | NO DATA | NO DATA |
| 5938–12739 | | NO DATA | TYPE 2 | NO DATA |
| ABOVE 12739 | | NO DATA | NO DATA | TYPE 3 |
| Disclaimer/Publisher’s Note: The statements, opinions and data contained in all publications are solely those of the individual author(s) and contributor(s) and not of MDPI and/or the editor(s). MDPI and/or the editor(s) disclaim responsibility for any injury to people or property resulting from any ideas, methods, instructions or products referred to in the content. |
© 2024 by the authors. Licensee MDPI, Basel, Switzerland. This article is an open access article distributed under the terms and conditions of the Creative Commons Attribution (CC BY) license (https://creativecommons.org/licenses/by/4.0/).


