Abstract
In recent years, highway infrastructure in the Ningxia region of China has rapidly advanced. Cement–loess is extensively utilized in the roadbed and foundation reinforcement. It is necessary to conduct micro–macro-analysis and model derivation of the electrical resistivity on Ningxia cement–loess, which are beneficial for both the practical application of electrical resistivity and the evaluation of the geotechnical properties of cement–loess. Therefore, a series of electrical resistivity measurements, microstructural observations (scanning electron microscopy), mineral analyses (thermogravimetric analysis), and theoretical analyses were adopted on the cement–loess. The following conclusions can be drawn: The electrical resistivity is negatively related to dry density and water content, while it is positively related to cement dosage and curing age. A cement dosage of 6% exhibits a lower hydration reaction potential compared to 12%, causing a slower increase in electrical resistivity. The formation of calcium silicate gel around particles results in particle clustering and pore filling, reducing the pore area and increasing electrical resistivity. Increased hydration also decreases microscopic orientation, contributing to a higher electrical resistivity of cement–loess. Finally, a new three-dimensional electrical resistivity model was created, finding that the electrical resistivity of Ningxia cement–loess was determined by the dry density, water content (ρd·w), cement dosage, and curing age (aw·T) in an exponential function form. The new three-dimensional electrical resistivity model could be used in the high-efficiency evaluation of the cement–loess geotechnical parameter, offering valuable insights for the monitoring and maintenance of road infrastructure.
1. Introduction
With the improvement in the highway network in the Ningxia region of China, most of the road sections need to go through collapsible loess. Generally, this loess under dry and slightly wet conditions has a certain structural strength; if the water content increases, the pore structure and inter-particle bonding are rapidly destroyed [1,2]. A lack of appropriate improvement can lead to the uneven settlement of the roadbed, pavement cracking, and landslide disasters, which brings great safety risks to highway transportation [3]. Due to the wide range of uses and economic benefits of cement–loess, along with the excellent performance of cement itself [4], it has been widely used in compaction piles, strengthening roadbeds, and preventing seepage and leakage in Ningxia highway engineering.
The electrical resistivity measurement method can be used to determine the geotechnical parameters and microscopic properties. Therefore, a series of scholars explored the relationship between soil electrical resistivity and physical or mechanical properties. Abu-Hassanein et al. [5] found that the electrical resistivity of compacted clay was closely related to saturation and compaction. In addition, the initial electrical resistivity of phosphate tailings was negatively correlated with shear strength, cohesion, and internal friction angle, which was helpful for the evaluation of the in situ properties of phosphate tailings [6]. Naseem et al. [7] established the correlation between conventional test data (liquid limit, proctor compaction test, and cohesion and internal friction angle) and electrical resistivity, and the established regression curve was used to determine the physical properties of sandy clay. Meanwhile, the electrical resistivity method can reflect the relationship between the mechanical properties of loess under load and dry–wet cycles, determining which factor can demonstrate the impact of dry–wet cycles conditions on compacted loess [8].
Regarding the electrical resistivity of cement–soil, Taylor et al. and Tashiro et al. [9,10] showed that there was a certain correlation between electrical resistivity and the cement hydration reaction. Moreover, the ion concentration had a significant effect on the electrical resistivity in the early hydration stage, and the compressive strength at 28 days was linearly related to the electrical resistivity at 72 h [11]. The cement could be used to solidify the contaminated soil, and the electrical resistivity method could reveal the effect of pollutants and cement types on the contamination degree of cement–soil. Liu et al. [12] proposed a predictive equation for electrical resistivity with the water–cement ratio and curing age, which can be applied to cement–soil detection. The microstructure of cement-solidified contaminated soil determined the electrical resistivity, which was directly proportional to the curing age and inversely proportional to the heavy metal concentration [13,14]. Therefore, it was found that the electrical resistivity could be used as a non-destructive testing method to evaluate the pollution level of contaminated sand. Heidari et al. [15] found that resistivity can be used to predict the durability of cement–soil under chloride ion erosion in seawater, as well as parameters such as the water–binder ratio and sediment–sand ratio. This is because resistivity is closely related to the porosity and pore solution of cement–soil. When the matrix is denser, water content is higher, and connectivity is better, the resistivity of the cement–soil decreases [16]. In summary, resistivity can sense the internal structure [17] and soil condition and establish correlations with its internal parameters.
Regarding the soil electrical resistivity models, Archie [18] ignored the conductivity of solid particles and only considered the conductivity path of free water between pores. An applicable electrical resistivity model was proposed for saturated non-cohesive soil and pure sandstone. Keller et al. [19,20] further studied the Archie model and considered the effects of soil particle factors on the electrical resistivity model. Then, an electrical resistivity model of unsaturated soil was established. Furthermore, Tumidajski et al. [21] conducted experimental research on the electrical resistivity of cement–soil. Based on the structural factors of this soil, they established an electrical resistivity model for cement–soil. Dong et al. [22] established a relevant relationship between the electrical resistivity of solidified contaminated soil, unconfined compressive strength, and pollution concentration. Zhang et al. [23] introduced a comprehensive parameter N to replace porosity based on the Archie formula, which can describe the effect of the solidifying agent dosage and the age hydration reaction on the porosity and saturation in solidified soil. Although scholars have already established regression models between soil resistivity and related factors, the study of influencing factors on the electrical resistivity of cement–loess is still not comprehensive enough. In addition, the electrical resistivity of other regions cannot be generalized to the Ningxia region. For example, the electrical resistivity of Gansu cement–loess is 200% higher than that of the Ningxia region, with a water content of around 15% [24].
In general, the electrical resistivity of soil mainly depends on the soil type, mineral composition, pore structure, water content, and dry density. Cement–loess is different from natural soils in terms of salinity, reactant, particle geometry, and microstructure [25,26]. To explore the electrical resistivity behavior and the detection method of cement–loess, a comprehensive experiment was conducted in this study. The electrical resistivity was measured under various conditions by using a self-made experimental apparatus. The effects of conditions on the electrical resistivity of cement–loess were discussed. Furthermore, the microstructure and mineral composites were investigated using SEM, TG/DTG, and XRD. Finally, a new three-dimensional electrical resistivity model was established to describe the electrical resistivity of cement–loess. Not only is this paper beneficial for the understanding of the electrical resistivity of cement–loess, but it also provides an efficient method for the future detection of Ningxia cement–loess.
2. Materials and Methods
2.1. Properties of Loess
The loess samples used in this study were taken from Haiping highway (Ningxia Province) engineering. Moreover, the loess samples were dried in a 105 °C oven, pulverized with a mallet, and passed through a 2 mm sieve. Table 1 shows the basic properties of loess, including its water content limit, maximum dry density, and optimal water content. The particle size distribution (Figure 1a) was measured by a (Dandong Baxter Bettersize2000LD laser, Dandong, China) particle size analyzer, which showed that the sand content (particle size > 0.075 mm) in the loess accounted for 16.51%, and the silt (0.005~0.075 mm) and clay (<0.005 mm) contents were 69.19% and 14.3%, respectively. The liquid and plastic limits (LP-100D liquid-plastic combine tester) of the loess were 24 and 15.1%, respectively. The maximum dry density was 1.88 g/cm3, and the optimal water content was 11%. The cement used for the test was ordinary cement. The mineral composition (Figure 1b) of the loess and cement materials was determined by XRD (Bruker D8 Advance X-ray Diffraction, Germany), which was SiO2, NaAlSi3O8, CaCO3, and Na zeolite. The element contents (Table 2) were measured by XRF (PANalytical AXios 4.0 kW X-ray fluorescence spectrometer, The Netherlands). Moreover, the main components of the cement were tricalcium silicate, dicalcium silicate, and tricalcium aluminate, and the major elements CaO and SiO2 accounted for 33.89 and 10.21%, respectively. The test water was ordinary tap water with an electrical conductivity of 203 μS/cm (25 °C).

Table 1.
The basic properties of loess.
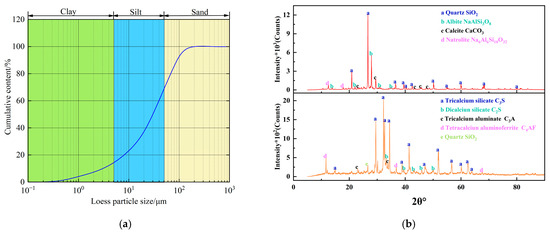
Figure 1.
Particle size distribution (a) and XRD results of loess and cement (b) [24].
Table 2.
The element contents of loess and cement/%.
2.2. Experimental Apparatus and Procedure
This study adopted the two-electrode method to measure the cement–loess electrical resistivity. According to standard ASTM [27], we designed and constructed an electrical resistivity testing box which was rectangular with an internal size of 12 cm × 4 cm × 7 cm. The inner layer was made of high-strength plexiglass, the outer layer was made of a 1 cm thick steel plate, and the electrodes in contact with the soil sample were made of stainless steel. The resistivity test instrument adopted a (VICTOR-4090A, Shenzhen, China) digital bridge with a maximum frequency of 100 kHz, 0.0001 Ω–99.99 MΩ resistance range, and maximum basic accuracy of 0.1%. The instrument can automatically identify and choose the appropriate test range according to the measured cement-loess. The digital bridge was clamped at both ends of the electrode through a crocodile clip, as shown in Figure 2, which was used to measure the electrical resistance directly. Then, the electrical resistivity could be further calculated based on the electrical resistance and the geometry of the cement–loess sample.
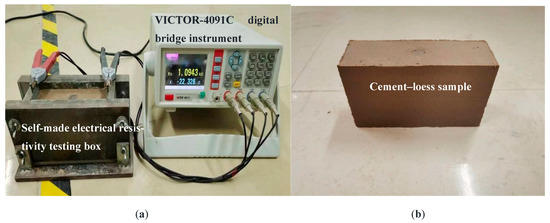
Figure 2.
A self-made electrical resistivity testing box: a VICTOR-4091C digital bridge instrument (a) and a cement–loess sample (b).
The experimental condition (Table 3) included four water contents, four dry densities, four curing ages, and three cement dosages, with a total of 192 cement–loess samples. The test procedure is as follows:
Table 3.
Experimental conditions.
- (1).
- According to the designed water content, dry density, and cement dosage, the corresponding mass of water, loess, and cement was mixed evenly and then layered into the test box to ensure uniform sample density.
- (2).
- The prepared cement–loess samples were wrapped with a plastic bag to prevent water content loss. After the labeling was completed, the samples were placed in a standard curing machine (temperature: 20 °C; humidity: 95%) with the corresponding curing ages (1, 7, 14, and 28 days).
- (3).
- A sample that reached the corresponding curing age was removed from the bag and quickly placed into the electrical resistivity testing box, the digital bridge instrument was connected with the electrical resistivity testing box, and then the electrical resistivity of the cement–loess sample was measured and recorded at the selected frequency of 50 kHz.
- (4).
- Different water contents (8 and 12.5%) and cement dosages (6, 9, and 12%) were selected for microscopic mechanism analysis at curing ages of 1, 7, and 28 days. After the measurement of electrical resistivity, the samples were terminated in their hydration reaction by low-temperature drying and sealed in a plastic bag for preservation [28].
- (5).
- The microscopic structure sample was cut and polished from an intact internal part, and the sample size was 1 cm × 1 cm × 0.5 cm. The SEM (Saimofei QuattroS, Waltham, MA, USA) was adopted to observe the microscopic structure.
- (6).
- Taken from the central part of the cement–loess samples, an agate mortar was used to grind the sample into a powder for XRD and TG/DTG (TA Q600, USA) experiments, which can reflect the changing mineral composition under various conditions.
3. Results and Discussion
3.1. Electrical Resistivity Behavior of Cement–Loess
3.1.1. Dry Density and Water Content
Figure 3 shows the relationship between electrical resistivity, water content, and dry density. It can be seen that the electrical resistivity of the cement–loess significantly decreases as the dry density rises. According to the three-element electrical resistivity model of cement–loess [20], the conductive path of the cement–loess is propagated in series and parallel along soil particles, water, and cement. Under the same water content, a lower dry density indicates that the air phase in the cement–loess is proportionally higher, leading to poor connectivity between the pore water and the loess particles, resulting in a higher electrical resistivity value. As the dry density gradually increases, the compaction degree of the cement–loess gradually increases. The air phase in the unit volume is discharged, and the proportion of solid and liquid phases increases in the cement–loess. Therefore, more conductive paths can be formed inside the cement–loess, including conductive paths formed between solid–solid, solid–liquid, and liquid–liquid phases, leading to a gradual decrease in the electrical resistivity.
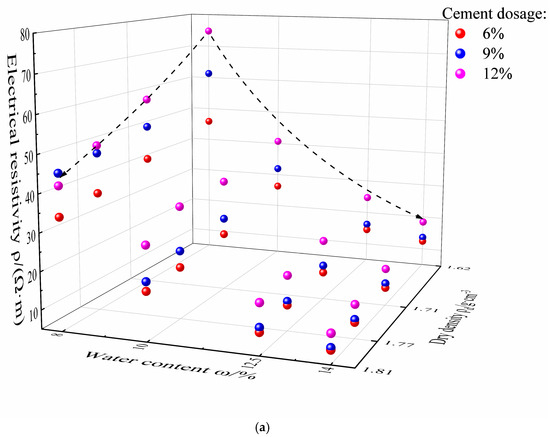
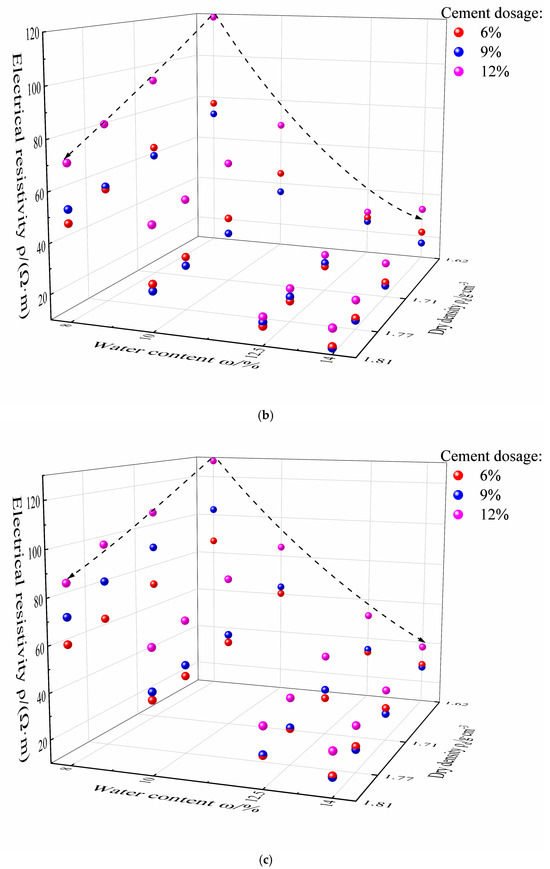
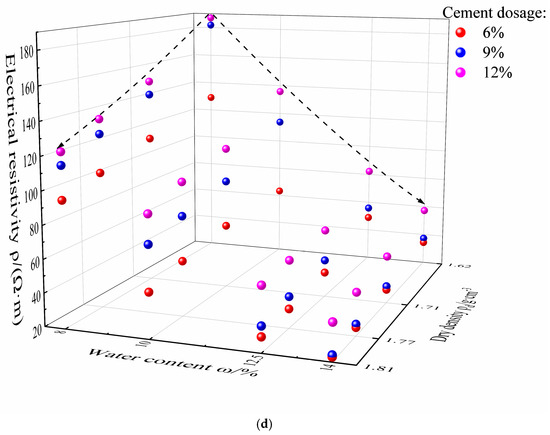
Figure 3.
The relationship between electrical resistivity, water content, and dry density at curing ages of 1 (a), 7 (b), 14 (c), and 28 days (d).
From Figure 3, it can be seen that the influence of water content on resistivity is significant when the water content is lower than the optimal value, and then, the influence of the water content decreases. Under the same dry density condition, the low-water-content sample has relatively scarce free water in its pores, and the air phase volume proportion in the internal pores is relatively high. Thus, the connecting channels that are formed by the pore water in the cement–loess are limited. These factors result in poor connectivity between pore water and loess particles, and the loess particles are loosely arranged with a smaller contact surface area, leading to a higher electrical resistivity. As the water content increases, the conductive path abilities become more obvious, and the electrical resistivity shows a significant downward trend [29]. When the water content is higher than the optimal value, a large number of double-layer conductive structures can be formed, and the water film can produce a wedging effect between loess particles. As a result, the electrical resistivity of cement–loess is significantly reduced by the soluble salts in the loess that dissolve in the pore water along with the replacement of the air phase by the liquid phase. However, the decreasing level of resistivity slows down and tapers off.
3.1.2. Curing Age and Cement Dosage
Figure 4 shows the relationship between electrical resistivity, curing age, and cement dosage. Moreover, the variation in the cement–loess electrical resistivity with the curing age is divided into reaction and growth stages under a cement dosage of 12%. During the reaction stage (1–7 days), the change in the electrical resistivity of cement–loess slows down. The second stage is the growth stage (i.e., 7–28 days), during which the internal C-S-H gel has a stronger bonding ability to the loess particles and the cement–loess becomes more compact, blocking the conduction path and rapidly increasing the electrical resistivity. On the other hand, the reaction and growth stages are almost the same under a cement dosage of 6%, which proves that the potential of the hydration reaction is not sufficient under a low cement dosage level. As the curing age increases, the water content gradually decreases due to the consumption of the hydration reaction, and the concentration of free water and ions within the pore channel decreases in synchrony, causing a reduction in the conductive paths and consequently leading to an increase in electrical resistivity.
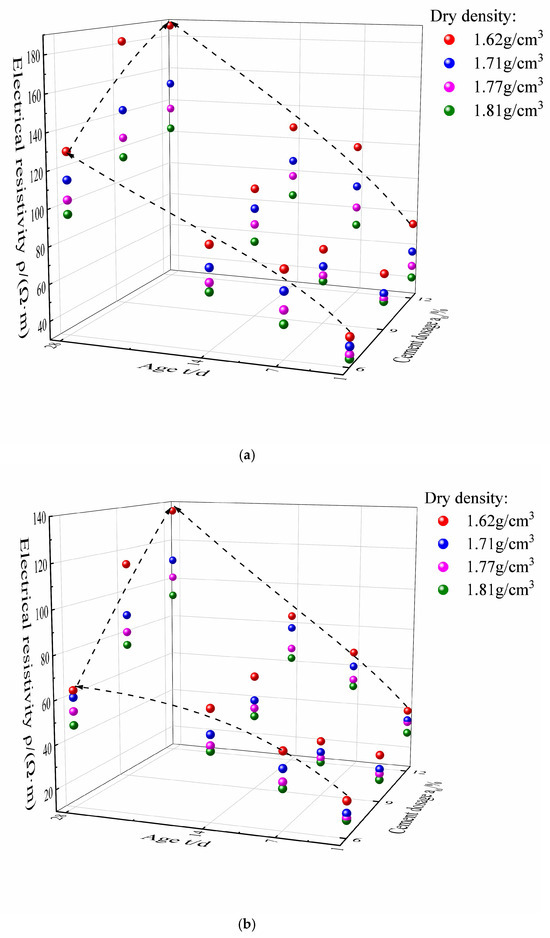
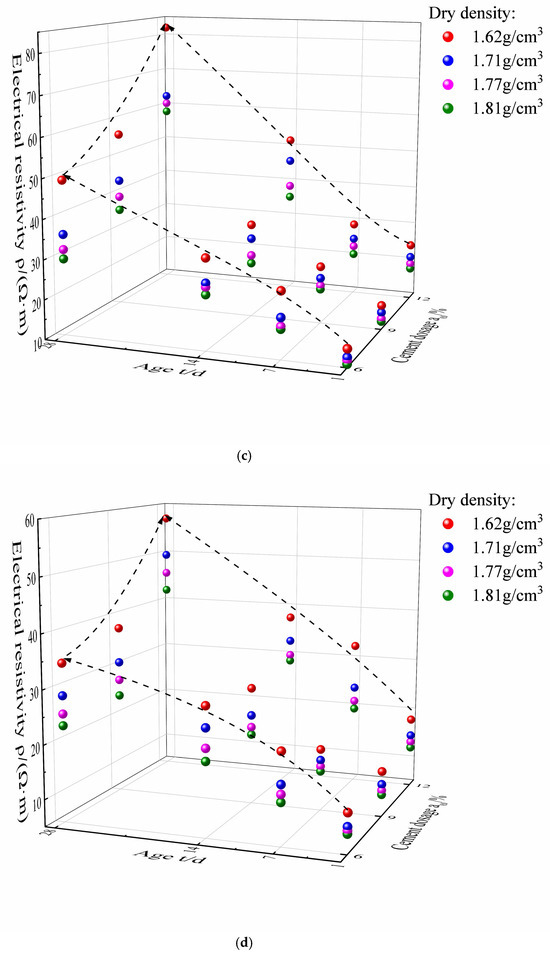
Figure 4.
The relationship between electrical resistivity, curing age, and cement dosage at water contents of 8 (a), 10 (b), 12.5 (c), and 14% (d).
As can be seen from Figure 4, the electrical resistivity roughly increases with the cement dosage. At curing ages between 1 and 7 days, the growth rate becomes smoother under the three cement dosages. However, the electrical resistivity has an obvious increasing trend at curing ages between 14 and 28 days, which is mainly because the cement dosage of 12% corresponds to more hydration than that at 6% beyond an adequate curing age. At the same time, the amount of cement hydration reaction products increases, which blocks the conductive path. Furthermore, the change in electrical resistivity with curing age under different cement dosages shows a similar trend, with a rapid increase in electrical resistivity as the curing age increases.
In this paper, the electrical resistivity of cement–loess was almost 1/2~1/15 of the resistivity of loess solidified with white-mud-based solid waste cementing material. In addition, the resistivity of cement–loess had an exponent relationship with the water content, whereas the resistivity of loess solidified with white-mud-based solid waste cementing material had a linear relationship [30]. For cement–fly ash-solidified soils, the electrical resistivity increased very quickly in the first day [13]. However, the increased rate of electrical resistivity grew slowly with time over the same duration.
3.2. Microstructure and Weight Loss Curve
3.2.1. Microstructure
As shown in Figure 5, the microstructure of the cement–loess was evaluated under various conditions (ρd = 1.62 and 1.77 g/cm3; ω = 12.5%; t = 28 days; aω = 9%). It can be observed that there are obvious differences in the pore distribution under the various dry densities, with small pores distributed densely in the cement–loess with a higher dry density. Specifically, the percentage of pore volume with 1.62 g/cm3 is much higher than that of 1.77 g/cm3 [31,32]. When the dry density decreases and the pore volume increases, there is reduced particle contact between cement–loess. This blocks the contact and connectivity between the soil particles, and the corresponding cement–loess has a higher resistivity. In addition, it can be seen that dense point-like hydration products form on the surface of the soil particles, filling the pores and further bonding the particles. Moreover, larger agglomerated structures of the particles and cement hydration products can be observed, which hinder the propagation of current, slowing down the decrease in electrical resistivity caused by the change in dry density.
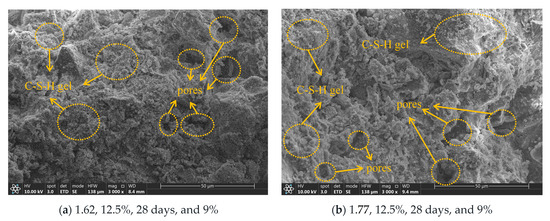
Figure 5.
Microstructures under different dry densities (dry density, water content, curing age, and cement dosage, respectively).
Figure 6 shows the changes in the microstructure of cement–loess under water contents of 8 and 12.5%. It shows that the water content affects the hydration reaction, which further influences the electrical resistivity. At the optimal water content, a thicker and more enveloping hydration product was formed on the surface of the loess particles, and the morphology of the loess particles gradually became less distinct. The C-S-H clusters were denser compared to those with lower water contents, and the loess particles merged with the cementing products with no visible distinction. This indicates that more hydration products are produced when the water content is abundant, and the hydration products further fill the pores and bind the loess particles, resulting in a less steep decline in electrical resistivity as compared to the water content increases in Section 3.1.1.
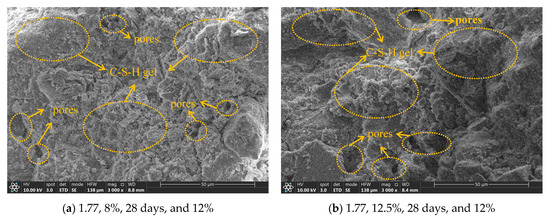
Figure 6.
Microstructures under different water contents (dry density, water content, curing age, and cement dosage, respectively).
Figure 7 shows the changes in the microstructure of cement–loess at different curing ages. As the cement component continued to undergo hydration reactions during the curing period, the surface hydration products and degree of bonding between particles were observed at different curing ages (1, 7, and 28 days). The hydration products such as calcium silicate gel that formed on the surface of the particles showed a clear increase with curing age, resulting in gradually clustering particles and further filling the pores and bonding loess particles, forming a more compact bonding structure. The amount of hydration products that formed changed from a dispersed distribution to a clustered pattern, and the contact and connection between particles changed. It can be clearly seen that the particles were wrapped from hydrates to form a network structure with surrounding particles, ultimately forming larger agglomerates and blocky structures. The internal structure of the cement–loess followed the curing age and gradually became denser, and the connectivity between pores continued to shrink, which caused the electrical resistivity to continue to increase under macroscopic conditions.
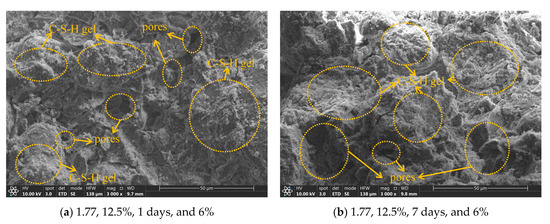
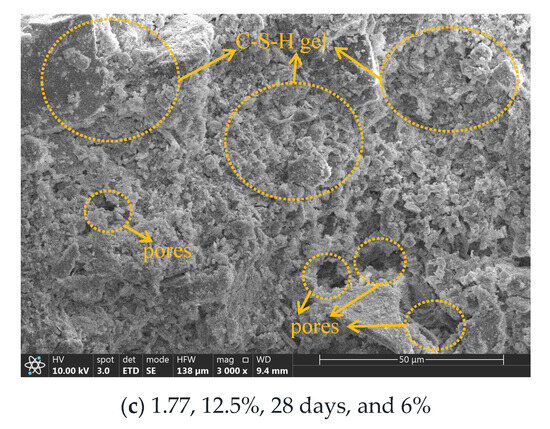
Figure 7.
Microstructures under different curing ages (dry density, water content, curing age, and cement dosage, respectively) [24].
Figure 8 and Figure 6a shows the changes in the microstructure of cement–loess under different cement dosages. The curing age affected the degree of cement hydration reaction, while the cement dosage affected the final amount of cementitious materials generated. A layer of C-S-H gel covering appeared on the surface of loess particles, and with an increasing cement dosage, the production of cementitious products increased. The structure characterized by a distribution of large and small pores became increasingly filled with cementitious materials, creating a bulky mass of amorphous gel clusters that surrounded dispersed blocks and particles at lower cement dosages. The C-S-H gel hydration products that formed at a cement dosage of 6% displayed a dispersed pattern on the surface of the particles, while at cement dosages of 9 and 12%, a dense and indistinguishable whole was formed between loess particles and cementitious materials. These microstructural changes due to varying cement dosages correspond to an increase in cement–loess electrical resistivity.
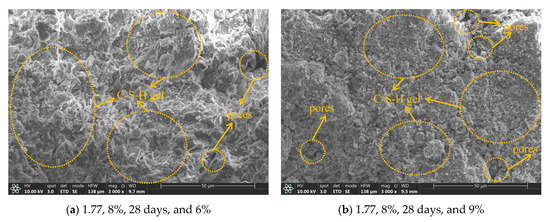
Figure 8.
Microstructure under different cement dosages (dry density, water content, curing age, and cement dosage, respectively).
By comparing the directional frequency, the orientation of cement–loess pores can be intuitively evaluated. When the distribution of directional frequencies is uneven, it indicates that the pores tend to appear within a specific range of angles, indicating a pronounced orientation of the soil. On the other hand, when the distribution of directional frequencies is more uniform, it suggests that the occurrence probability of pores is relatively equal across different angle ranges, indicating a more uniform orientation of the soil.
Based on the directional frequency distribution shown in Figure 9, the probability of the occurrence of cement–loess pores in different orientation angle ranges can be determined. For specimens under two different dry density conditions in Figure 9a, the specimen under high dry density conditions exhibits weak orientation frequencies at a dry density of 1.77%, a water content of 12.5%, a curing age of 28 days, and a cement dosage of 9%. In contrast, the specimen under low dry density conditions shows higher orientation frequencies, with a concentration of pores appearing at angles from 120 to 140° and 300 to 320°, indicating a more pronounced orientation. Furthermore, higher water content and longer aging periods show a more uniform range of pore angles and weaker orientation frequencies. Moreover, the orientation frequencies are more uniform under the higher water content and curing age in Figure 9b,c, further proving that the hydration reaction causes a uniform trend in orientation frequencies. However, under the three cement dosage conditions in Figure 9d, the directional frequency corresponding to a cement dosage of 9% is the most uniform, and the corresponding electrical resistivity value does not significantly differ from that under a cement content of 12%, as shown in Figure 4a. Therefore, it can be preliminarily concluded that there is a negative correlation between electrical resistivity values and orientation. In other words, the electrical resistivity under the condition of 9% cement content is due to a large amount of hydration products clogging the pores of the cemented loess, and the weaker orientation increases the curvature of the specimen, weakening the current pathway and resulting in an increase in resistivity.
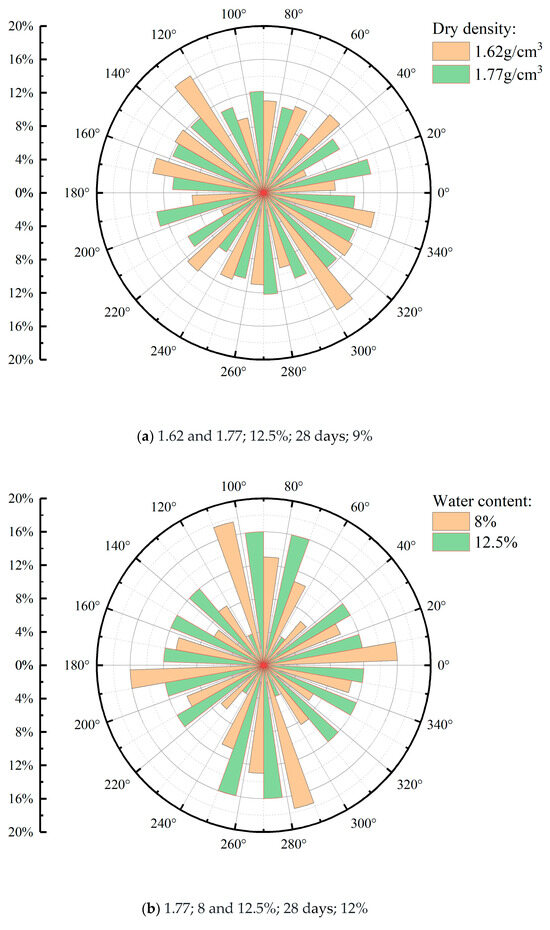
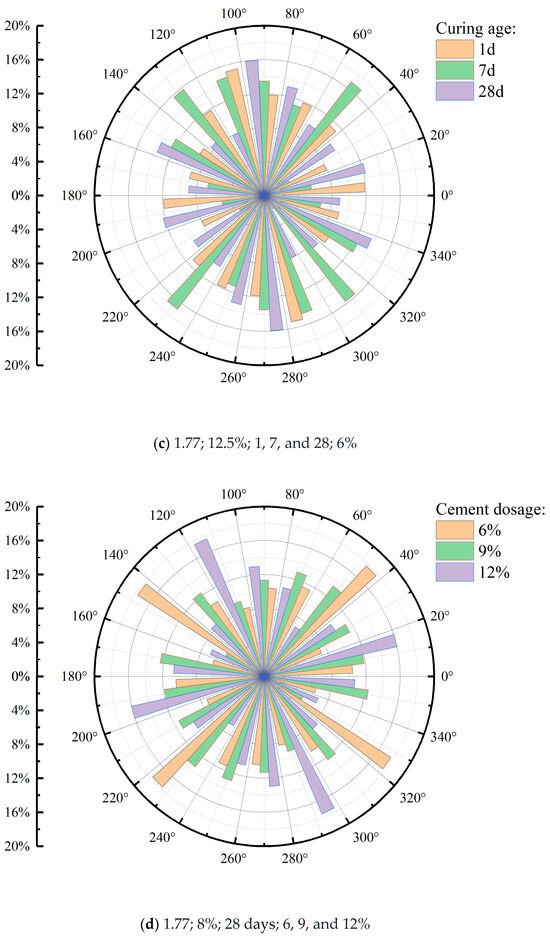
Figure 9.
The directional frequency distribution of cement–loess pores under the conditions (dry density; water content; curing age; cement dosage, respectively) of different dry densities (a), different water contents (b), different curing ages (c), and different cement dosages (d).
For the analysis of pore number and pore size, we selected the conditions of Figure 7 and Figure 8, which contain a larger number of microstructural SEM images, to conduct the analysis of average pore diameter and pore area ratio. In Figure 10a, as the curing age increases, small pores are gradually filled by cementitious products, resulting in a decrease in the proportion of pores smaller than 1 μm over time. The filling of small pores by cementitious products, along with the partial filling of larger pores, leads to a more uniform average pore diameter. In Figure 10b, the increase in the cement dosage provides a stable source for the synthesis of cementitious products, resulting in the generation of more cementitious products. This explains why the pore area ratio decreases as the cement dosage increases.
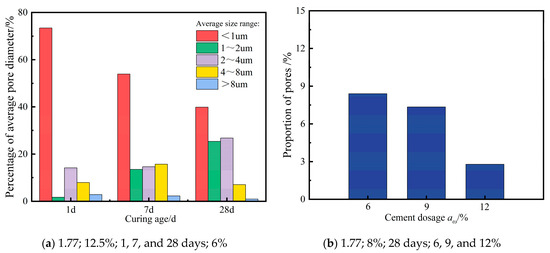
Figure 10.
Pore sizes and percentages at different curing ages and different cement dosages.
3.2.2. Weight Loss Curve
TG/DTG can prove the changes in hydration products and mineral composition of cement–loess. The four factors affecting the cement–loess were analyzed and compared. The crystalline water of C-S-H gel hydration products was detected at decomposition temperatures of 50 to 200 °C using TG/DTG, while calcium hydroxide (CH) produced by the hydration reaction in the specimen underwent a dehydration reaction between 400 and 500 °C, and the mass loss between 600 and 750 °C was related to the decomposition of calcium carbonate (CC) [33,34,35]. The hydration products C-S-H gel and CH in the specimen mainly originated from the following reactions of C3S and C2S. By analyzing the components of the cement–loess based on the above theories, the changes in electrical resistivity were further explained through variations in mass changes in the TG/DTG curve.
Figure 11 shows the comparison of TG/DTG results of cement–loess with different dry densities. The higher-dry-density specimens produce slightly more hydration products, but the difference is not significant. The fluctuation in the sample mass loss rate mainly comes from the calcite component of the loess; this is not discussed further. The compaction degree is greater for specimens with higher dry densities, resulting in a noticeable decrease in electrical resistivity. Figure 12 shows the comparison of TG/DTG results of cement–loess with various water contents and cement dosages. The weight loss of hydration products increases when the water content and cement dosage are higher. It is noteworthy that the higher the water content, the higher the weight loss of CH. This indicates the generation of calcium hydroxide in the specimens, which also explains the slower decrease in resistivity with increasing water content. Figure 13 shows the TG/DTG results of cement–loess at different curing ages. The weight loss of hydration products increased significantly with the age of curing. The depletion of water and the accumulation of cementation products in the long-maintained soil gradually obstructed the conductive paths, leading to a macroscopic increase in the electrical resistivity of the cement–loess.
Figure 11.
Comparative analysis of TG/DTG under different dry densities (ω = 12.5%, t = 28 days, aω = 9%).
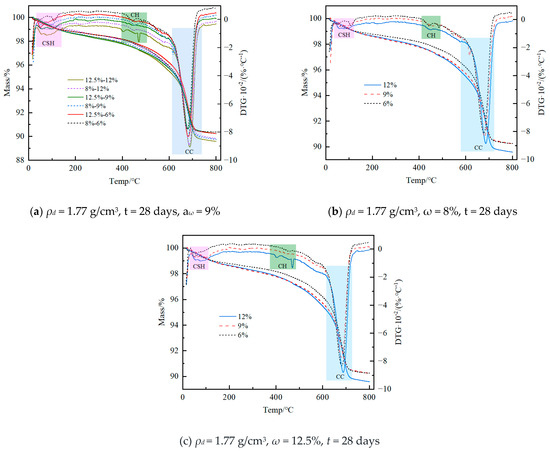
Figure 12.
Comparative analysis of TG/DTG under different water contents (a) and cement dosages (b,c).
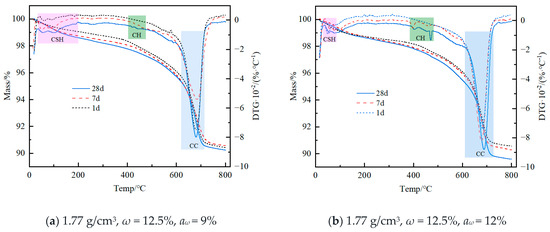
Figure 13.
Comparative analysis of TG/DTG under different curing ages.
3.3. Electrical Resistivity Model
As discussed in Section 3.1 and Section 3.2, the electrical resistivity of cement–loess is affected by the dry density, water content, curing age, and cement dosage. Therefore, it is necessary to construct a model that can reflect the multiple influencing factors on the electrical resistivity of cement–loess. Then, the dry density of cement–loess can be calculated based on the electrical resistivity model, which can be used to detect the cement–loess piles in the future.
Derivation of Electrical Resistivity Model
In 1942, a relationship was found between resistivity and porosity that was only applicable to saturated, cohesionless soil and pure sandstone by neglecting the solid-phase conductivity and only considering the conductive path of free water in the pores [18].
where ρ and ρw represent the electrical resistivity of the soil and pore water, respectively (Ω·m); a is a calculation parameter; n represents porosity; and m represents the cementation factor.
Subsequently, a resistivity model applicable to unsaturated soil was established [19]:
where Sr is the saturation of the sample (%) and p is the calculation parameter of saturation Sr.
Equation (2) takes into account the influence of porosity and saturation on the soil electrical resistivity. To analyze the influence of dry density and water content on the electrical resistivity, porosity and saturation in Equation (2) are replaced by the equivalent conversion formulas of the three soil parameters. Substituting Equations (3) and (4) into Equation (2), we can obtain Equation (5) [24].
where w is the water content; dw is the density of water; and ds is the relative density of soil particles.
Therefore, the resistivity equation (Equation (5)) can be simplified as a correlation between resistivity, water content, and dry density, as the resistivity of water ρw, density of water dw, and relative density of soil particles ds remain constant.
With regard to Equation (6) and the correlation with the experimental data, an analysis of the relationship between resistivity, dry density, and water content (ρd·w) was established.
The variation in the electrical resistivity of cement–loess with dry density and water content (ρd·w) is shown in Figure 14, in which it can be observed that the electrical resistivity of cement–loess decreases with an increase in dry density and water content. The data show a certain regularity with Equation (6), but there is significant scatter between the data and the fitted curve. In addition, the calculation parameters a and b show significant differences under three cement dosage conditions. For cement–loess, the connectivity of pores, which are filled with cementitious materials produced by the cement hydration reaction, affects the magnitude of electrical resistivity. Therefore, relying solely on dry density and water content cannot fully reflect the variation in the electrical resistivity in cement–loess.
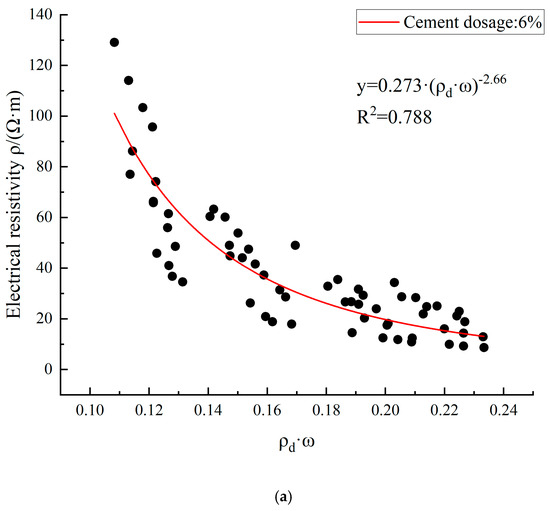
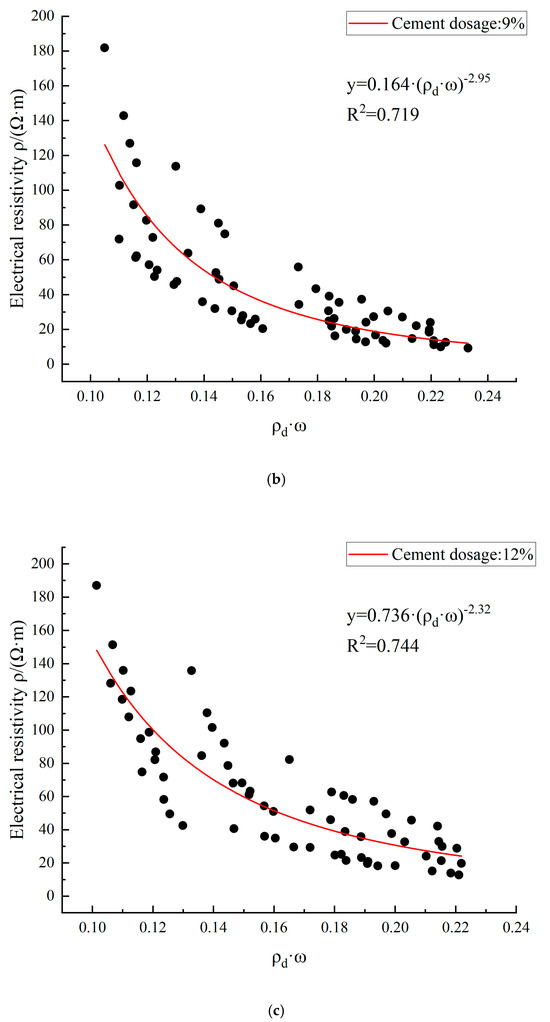
Figure 14.
The fitting curves of cement–loess resistivity with dry density and water content (ρd·ω) under cement dosages of 6 (a), 9 (b), and 12% (c).
As mentioned in Section 3.2, the cement component in the loess undergoes a hydration reaction. With the increase in curing age, the amount of cementitious material accumulates, leading to changes in the bonding and pore filling of the loess, resulting in changes in the electrical resistivity. Therefore, the electrical resistivity model for the cement–loess should consider the curing age and cement dosage. Zhang et al. [23] established an empirical model with the comprehensive parameter N, which was modified from the Archie resistivity, as shown in Equations (7) and (8). In this equation, cement dosage aw, porosity n, and curing age T were considered.
where nt is the porosity of the sample after curing, aw is the cement dosage, T is the curing age, and β is the curing age index reflecting the variation in resistivity with age. In addition, Equation (8) can also be recognized as a form of comprehensive parameter N. However, it is not suitable to replace nt with ρd·w directly. ρd·w can be expressed with a different calculation parameter in Equation (8). Therefore, ρd·w and (8) were treated independently in this study, which can be finally represented as Equation (9). As can be seen from Equation (9), the electrical resistivity of cement–loess can be expressed as a three-dimensional face by ρd·w and aw·T.
where parameter c is the calculation parameter of ρd·w and aw·T, parameter e reflects the variation in electrical resistivity with ρd·w, and parameter f reflects the variation in electrical resistivity with aw·T.
To further validate the applicability of Equation (9), the electrical resistivity data under different conditions were fitted with dry density, water content, curing age, and cement dosage using the four-variable equation (Equation (9)) with correlation coefficients R2 greater than 0.93. After fitting all the data in the origin with the function of nonlinear surface fitting, a three-dimensional surface can be obtained (Figure 15). This indicates that the electrical resistivity has a good power-law relationship with the established overall factors, implying that the fitted equation can serve as a model for evaluating the parameters of Ningxia cement–loess. Specifically, Equation (6) can be further substituted into Equation (9), which is used to predict dry density using electrical resistivity, water content, cement dosage, and curing age. In addition, electrical resistivity and water content can be measured in situ, and cement dosage and curing age can be obtained from the project design information. Therefore, the dry density and compaction coefficient can be calculated directly from the in situ measurement value. Tumidajski’s [21] model considered the resistivity of pore water, curing age, and void ratio. However, his model cannot reflect the cement dosage contribution. Dong et al.’s [36] model considered the cement dosage contribution but neglected the dry density. Moreover, other electrical resistivity models of soil did not reflect the contribution of cement [37]. Based on the data in Figure 4 and Figure 14, we found that the electrical resistivity could not be predicted well without the cement dosage and dry density. Otherwise, the input parameters (ρd·w and aw·T) of the electrical resistivity model of this paper could be easily obtained. In addition, the parameters e and f (in Table 4) expressed the change in the input parameters. Therefore, the electrical resistivity in this paper obtained good fit results in Figure 15.
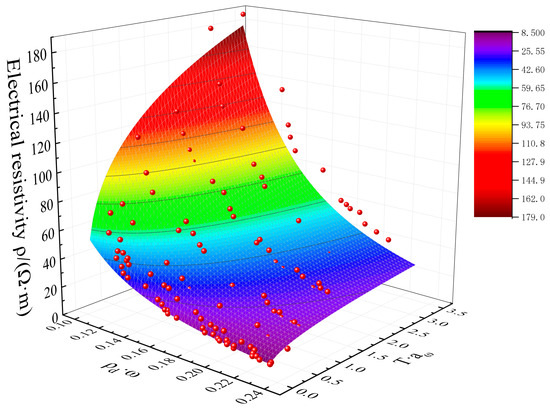
Figure 15.
The fitting curves of cement–loess resistivity with dry density, water content, curing age, and cement dosage.
Table 4.
The parameters of the fitting curve.
4. Conclusions
In this study, a series of electrical resistivity experiments on cement–loess were conducted, and then, microscopic methods were adopted to prove its electrical resistivity laws. Finally, a modified electrical resistivity model was established, considering dry density, water content, cement dosage, and curing age. The following conclusions can be drawn:
- (1).
- The electrical resistivity of cement–loess decreased with the dry density and water content, whereas it increased with the cement dosage and curing age. If the water content was higher than its optimal value (11%), the reduction in electrical resistivity was 23.4%, which was 38.1% lower than that at a water content of 8~10%. This included the soluble salts in the loess that dissolve in the pore water. In addition, the hydration reaction potential was insufficient when using a cement dosage of 9% compared to that achieved at 12%. Therefore, the electrical resistivity at a cement dosage of 12% was 22.8% higher than that at a cement dosage of 9% at a curing age of 28 days.
- (2).
- A higher cement dosage, increased water content, and extended curing age contributed to improved hydration reactions within the cement–soil system. As a result, a greater quantity of C-S-H gel was produced. The hydration reaction consumed the water in the soil, and the filling of the pores by the hydration products reduced the pores and increased the resistivity. Additionally, the increase in hydration reduced the orientation microscopically, which induced the increase in cement–loess electrical resistivity.
- (3).
- A modified Archie resistivity formula was used to establish a power-law regression model, which considers ρd·w and aw·T independently. Further, a three-dimensional fitting model was established using water content, dry density, curing age and cement dosage as comprehensive influencing factors. Finally, the prediction accuracy of the electrical resistivity model was 0.94 R2. Therefore, the electrical resistivity could quantitatively express the influencing factors, which proved that the electrical resistivity is very important.
- (4).
- In the practical application, we can adopt the same-sized electrodes from this study, and the electrical resistivity values in the field would be almost identical to the experimental ones. In future studies, the relationship between mechanical characteristics and electrical resistivity should be explored. Moreover, a quick and multi-featured piece of detection equipment will be developed based on the electrical resistivity. In addition, a calibration method will be explored in cement–loess, which can reduce the detection time and cost.
Author Contributions
Conceptualization, Z.X. and C.Y.; methodology, Z.X., Q.D., J.G., Y.Z., C.Y. and J.W.; software, Y.Z.; validation, Q.D., J.G. and Y.Z.; formal analysis, Z.X.; investigation, Q.D., J.G., Y.Z. and Z.Z.; data curation, Q.D., J.G. and Z.Z.; writing—original draft preparation, Z.X., Q.D., J.G., Y.Z. and Z.Z.; writing—review and editing, C.Y. and J.W.; supervision, Z.X., C.Y., J.W., F.H., L.L. and Y.M.; project administration, J.W., F.H., L.L. and Y.M.; funding acquisition, Z.X., C.Y., J.W., F.H., L.L. and Y.M. All authors have read and agreed to the published version of the manuscript.
Funding
This research is supported by the National Natural Science Foundation of China (41902280); the Ningxia Hui Autonomous Region Transportation Department project (202200192); the Shaanxi Provincial Association for Science and Technology Young Talents Support Program foundation (20210422); the Chinese postdoctoral science foundation (2022M710486); the Natural Science Basic Research Project of Shaanxi Province (2023-JC-QN-0445); and the Basic research expenses for central universities of Chang’an University (300102212101).
Data Availability Statement
Data available on request due to privacy.
Conflicts of Interest
Author Jie Wang, Longshan Li and Yongzhi Ma are employed by the Ningxia Haiping Expressway Management Co., Ltd. Author Fangyuan Han is Ningxia Communications Construction Co., Ltd. The remaining authors declare that the research was conducted in the absence of any commercial or financial relationships that could be construed as a potential conflict of interest.
References
- Wang, J.; Zhang, D.; Chen, C.; Wang, S. Measurement and modelling of stress-dependent water permeability of collapsible loess in China. in China. Eng. Geol. 2020, 266, 105393. [Google Scholar] [CrossRef]
- Yang, H.; Xie, W.; Liu, Q.; Zhu, R.; Liu, Y. Three-stage collapsibility evolution of Malan loess in the Loess Plateau. Catena 2022, 217, 106482. [Google Scholar] [CrossRef]
- Derbyshire, E. Geological hazards in loess terrain, with particular reference to the loess regions of China. Earth-Sci. Rev. 2001, 54, 231–260. [Google Scholar] [CrossRef]
- Kara, C.; Kutuk, S.; Kutuk-Sert, T. Improvement of the durability of concrete by substitution of raw ground colemanite. Case Stud. Constr. Mater. 2023, 19, e02393. [Google Scholar] [CrossRef]
- Abu-Hassanein, Z.S.; Benson, C.H.; Blotz, L.R. Electrical Resistivity of Compacted Clays. J. Geotech. Eng. 1996, 122, 397–406. [Google Scholar] [CrossRef]
- Chen, Y.; Wei, Z.; Irfan, M.; Xu, J.; Yang, Y. Laboratory investigation of the relationship between electrical resistivity and geotechnical properties of phosphate tailings. Measurement 2018, 126, 289–298. [Google Scholar] [CrossRef]
- Naseem, A.; Jalal, F.; Naseem, A. Predicting sandy-clayey soil properties using electrical resistivity testing. Proc. Inst. Civ. Eng. Geotech. Eng. 2020, 173, 21–29. [Google Scholar] [CrossRef]
- Zhou, Y.; Li, G.; Ma, W.; Chen, D.; Wang, F.; Mao, Y.; Du, Q.; Zhang, J.; Tang, L. Experimental Study on Electric Resistivity Characteristics of Compacted Loess under Different Loads and Drying-Wetting Cycles. Adv. Civ. Eng. 2021, 2021, 1–12. [Google Scholar] [CrossRef]
- Taylor, M.A.; Arulanandan, K. Relationships between electrical and physical properties of cement pastes. Cem. Concr. Res. 1974, 4, 881–897. [Google Scholar] [CrossRef]
- Tashiro, C.; Ikeda, K.; Inoue, Y. Evaluation of pozzolanic activity by the electric resistance measurement method. Cem. Concr. Res. 1994, 24, 1133–1139. [Google Scholar] [CrossRef]
- Yousuf, F.; Wei, X. Investigation of the early-age microstructural development of hydrating cement pastes through electrical resistivity measurements. Case Stud. Constr. Mater. 2020, 13, e00391. [Google Scholar] [CrossRef]
- Liu, S.Y.; Du, Y.J.; Han, L.H.; Gu, M.F. Experimental study on the electrical resistivity of soil–cement admixtures. Environ. Geol. 2008, 54, 1227–1233. [Google Scholar] [CrossRef]
- Liu, J.; Zha, F.; Xu, L.; Kang, B.; Tan, X.; Deng, Y.; Yang, C. Mechanism of stabilized/solidified heavy metal contaminated soils with cement-fly ash based on electrical resistivity measurements. Measurement 2019, 141, 85–94. [Google Scholar] [CrossRef]
- Liu, X.; Xu, X.; Dong, X.; Park, J.; Shen, J.; Rezania, S. Properties of copper-contaminated sand before and after stabilization using electrical resistivity measurement. Fresenius Environ. Bulletion 2019, 28, 2807–2815. [Google Scholar]
- Heidari, P.; Rivard, P.; Wilson, W. Multi-objective optimization of cement-based systems containing marine dredged sediment. Constr. Build. Mater. 2024, 439, 137228. [Google Scholar] [CrossRef]
- Li, M.; Zhong, J.; Li, G.; Zhang, Q.; Cen, F.; Gao, P. Study on the Performance of Polymer-Modified Conductive Cement-Based Materials. Buildings 2023, 13, 2961. [Google Scholar] [CrossRef]
- Sun, Z.; He, W.; Niu, D.; Zhang, L.; Su, L.; Wang, X.; Sun, Z.; He, W.; Niu, D.; Zhang, L.; et al. Resistivity Prediction Model for Basalt–Polypropylene Fiber-Reinforced Concrete. Buildings 2022, 13, 84. [Google Scholar] [CrossRef]
- Archie, G.E. The Electrical Resistivity Log as an Aid in Determining Some Reservoir Characteristics. Trans. AIME 1942, 146, 54–62. [Google Scholar] [CrossRef]
- Keller, G.V.; Frischknecht, F.C. Electrical Methods in Geophysical Prospecting, 1st ed.; Pergamon press: Oxford, UK, 1987; Available online: https://lib.ugent.be/catalog/rug01:001374307 (accessed on 10 April 2023).
- Mitchell, J.K.; Arulanandan, K. Electrical Dispersion in Relation to Soil Structure. J. Soil Mech. Found. Div. 1968, 94, 447–471. [Google Scholar] [CrossRef]
- Tumidajski, P.J.; Schumacher, A.S.; Perron, S.; Gu, P.; Beaudoin, J.J. On the relationship between porosity and electrical resistivity in cementitious systems. Cem. Concr. Res. 1996, 26, 539–544. [Google Scholar] [CrossRef]
- Dong, X.; Song, Z.; Chen, Y.F. Electrical resistivity and strength properties of sodium hydroxide contaminated soil solidified with cement. Mater. Test. 2016, 58, 82–87. [Google Scholar] [CrossRef]
- Zhang, D.; Chen, L.; Liu, S. Key parameters controlling electrical resistivity and strength of cement treated soils. J. Central S. Univ. 2012, 19, 2991–2998. [Google Scholar] [CrossRef]
- Wang, J.; Han, F.Y.; Li, L.S.; Ma, Y.Z.; Gao, J.Q.; Zhang, Y.; Xue, Z.J. Electrical Resistivity Response Law and Model of Ningxia Cement Loess. J. Earth Sci. Environ. 2024. in press (In Chinese) [Google Scholar]
- Alsharari, B.; Olenko, A.; Abuel-Naga, H. Modeling of electrical resistivity of soil based on geotechnical properties. Expert Syst. Appl. 2020, 141, 112966. [Google Scholar] [CrossRef]
- Kibria, G.; Hossain, M.S. Investigation of Geotechnical Parameters Affecting Electrical Resistivity of Compacted Clays. J. Geotech. Geoenvironmental Eng. 2012, 138, 1520–1529. [Google Scholar] [CrossRef]
- ASTM G187-18; Standard Test Method for Measurement of Soil Resistivity Using the Two-Electrode Soil Box Method. ASTM International: West Conshohocken, PA, USA, 2018.
- Bahafid, S.; Ghabezloo, S.; Duc, M.; Faure, P.; Sulem, J. Effect of the hydration temperature on the microstructure of Class G cement: C-S-H composition and density. Cem. Concr. Res. 2017, 95, 270–281. [Google Scholar] [CrossRef]
- Li, J.; Zhang, T.; Zhou, Z.; Li, D.; Teng, J. Study on Acoustic–Electric Response Characteristics of Unsaturated Loess under Different Moisture Content. Buildings 2024, 14, 819. [Google Scholar] [CrossRef]
- Xue, Z.; Zhang, Y.; Luo, J.; Yan, C.; Xu, Z.; Wang, J.; Han, F.; Li, L.; Ma, Y.; Jia, X.; et al. Elastic modulus, water stability and resistivity for loess solidified with white mud based solid waste cementing material: Mechanism analysis and relationship establishment. Case Stud. Constr. Mater. 2024, 21, e03791. [Google Scholar]
- Kutuk, S.; Bolat, S.; Terzioglu, C.; Altintas, S.P. An investigation of magnetoresistivity properties of an Y3Ba5Cu8Oy bulk superconductor. J. Alloys Compd. 2015, 650, 159–164. [Google Scholar] [CrossRef]
- Kutuk, S.; Bolat, S. Analysis of structural, electrical, and levitation properties of (RE: Nd, Sm, Gd) BCO-358 superconducting ceramics prepared by a modified MPMG technique. J. Mater. Sci. 2022, 57, 1198–1214. [Google Scholar] [CrossRef]
- Wang, S.; He, X.; Li, J.; Li, S.; Qin, H.; Ma, Y.; Ma, H.; Gong, S.; Niu, Z. Effect of Consistency Limit on the Strength of Cement-Solidified Dredged Sludge: Modelling and Micro-Mechanism. Water 2022, 14, 1959. [Google Scholar] [CrossRef]
- Jeong, Y.; Yum, W.S.; Moon, J.; Oh, J.E. Utilization of precipitated CaCO3 from carbon sequestration of industrially emitted CO2 in cementless CaO-activated blast-furnace slag binder system. J. Clean. Prod. 2017, 166, 649–659. [Google Scholar] [CrossRef]
- Kim, M.S.; Jun, Y.; Lee, C.; Oh, J.E. Use of CaO as an activator for producing a price-competitive non-cement structural binder using ground granulated blast furnace slag. Cem. Concr. Res. 2013, 54, 208–214. [Google Scholar] [CrossRef]
- Dong, X.Q.; Zhang, S.H.; Su, N.N.; Huang, X.E.; Bai, X.H. Effects of contaminated soil on electrical resistivity and strength of cemented soil. China Civ. Eng. J. 2015, 48, 91–98. (In Chinese) [Google Scholar] [CrossRef]
- Chen, Y.C.; Huang, X.; Chen, X.J.; Ding, K.; Xu, K.Y. Relationship between unconfined compressive strength and electrical resistivity of red clay under dry and wet cycles. J. Guangxi Univ. (Nat. Sci. Ed.) 2010, 45, 1267–1275. (In Chinese) [Google Scholar] [CrossRef]
Disclaimer/Publisher’s Note: The statements, opinions and data contained in all publications are solely those of the individual author(s) and contributor(s) and not of MDPI and/or the editor(s). MDPI and/or the editor(s) disclaim responsibility for any injury to people or property resulting from any ideas, methods, instructions or products referred to in the content. |
© 2024 by the authors. Licensee MDPI, Basel, Switzerland. This article is an open access article distributed under the terms and conditions of the Creative Commons Attribution (CC BY) license (https://creativecommons.org/licenses/by/4.0/).