Article

A Mesoscopic Approach for the Numerical Simulation of a Mass Concrete Structure Construction Using Post-Cooling Systems

by
Igor A. Fraga
1,2,
Ana B. C. G. Silva
1,3 and
Eduardo M. R. Fairbairn
1,*
1
Civil Engineering Program, Federal University of Rio de Janeiro, Rio de Janeiro 21941-972, Brazil
2
Building Technical School, Fluminense Federal Institute of Education, Science and Technology, Campos dos Goytacazes 28498-900, Brazil
3
Polytechnical School, Federal University of Rio de Janeiro, Rio de Janeiro 21941-971, Brazil
*
Author to whom correspondence should be addressed.
Buildings 2024, 14(10), 3232; https://doi.org/10.3390/buildings14103232
Submission received: 10 September 2024 / Revised: 24 September 2024 / Accepted: 8 October 2024 / Published: 12 October 2024
(This article belongs to the Section Building Structures)

Abstract

This study introduces an innovative numerical approach to simulate the construction of large concrete structures incorporating post-cooling systems employing the finite element method (FEM). The proposed methodology integrates critical construction parameters, including temperature control mechanisms, while accounting for concrete hydration and environmental conditions. Compared to traditional discrete models, this approach provides similar accuracy with substantially reduced computational costs, enhancing predictive capabilities in the thermal analysis of mass concrete. The method was applied to simulate the construction of a water intake pillar at the Tocoma hydroelectric plant in Venezuela, where the simulated results closely matched in situ temperature measurements. The findings highlight the method’s efficiency and accuracy in simulating post-cooling systems, offering a practical solution for improving the safety and cost-effectiveness in large-scale concrete construction projects.

1. Introduction

Massive concrete structures exhibit distinct behavior attributed to their substantial concrete volume and, consequently, elevated cement consumption. This characteristic makes them more susceptible to cracking in the construction process, primarily induced by the temperature rise during the cement hydration process. The exothermic and thermoactivated nature of this reaction results in volume fluctuations, and if these variations are constrained, tensions arise, potentially causing material cracking. In this context, a recent RILEM State of the Art Report [1] categorizes these structures as those in which early-age effects of cementitious materials, such as heat generation and autogenous shrinkage, may culminate in cracking.
Thus, an in-depth and specific understanding of the behavior of such structures is fundamental for the prediction of material cracking, a fact that has motivated several studies in this field, whether applied in the experimental or computational area, in order to study the effects of thermal and mechanical phenomena on mass concrete, as shown in Ulm and Coussy [2,3,4], Azenha [5], Xin et al. [6] and Castilho et al. [7].
Concrete is widely recognized as a heterogeneous material with multi-scale characteristics, ranging from the nanometric scale of hydrates to the macroscopic scale of real structures. Numerous studies have explored the complexities of concrete at different scales, offering valuable insights into both its thermochemical and mechanical behavior as observed by Gimenes et al. [8], Huang et al. [9], Tu and Zhang [10], Zhang et al. [11], Li et al. [12] and Li et al. [13]. While multi-scale modeling can provide a more detailed representation of concrete’s heterogeneity, for the purposes of this study, a mesoscopic approach was adopted. This is particularly suitable for massive concrete structures, such as hydroelectric power plants, where the the size of the finite elements allows the material to be treated as homogeneous and isotropic without significantly affecting the accuracy of the analysis. However, for smaller structures, where the heterogeneities of the material have a more pronounced effect, different modeling approaches, such as multi-scale or micromechanical models, would be necessary.
Massive concrete structures experience significant temperature increases due to the exothermic nature of the cement hydration reaction combined with concrete’s relatively low thermal conductivity. This temperature rise leads to two types of thermal gradients within the concrete. The first is a spatial gradient, which corresponds to temperature differences between different points in the structure at a given moment. The second is a temporal gradient, where a specific point in the structure undergoes temperature changes over time. Considering the thermal expansion properties of concrete and the structural restraints that limit free deformation, both spatial and temporal gradients can induce strains and stresses in concrete elements. If these strains or stresses exceed certain limits, undesirable thermal cracks may develop [1].
The production of heat and the subsequent increase in concrete temperature demand thorough consideration, as they not only contribute to these gradients but are also associated with deleterious phenomena, such as Delayed Ettringite Formation (DEF). Several studies have established a correlation between early thermal fields reaching temperatures of approximately 65 °C and the occurrence of DEF.
Considering the significant impact of heat generation resulting from hydration on structural durability, alongside the considerable costs and safety standards inherent in construction and infrastructure projects, the potential for thermal cracking in young concrete has remained a prominent concern within the engineering community since the first applications of massive concrete.
Hence, a thorough analysis of both the construction phase and the subsequent period is recommended. In the event of detecting a propensity for cracking, various measures can be implemented to mitigate early stresses. For instance, one effective strategy involves reducing the concrete temperature post-placement by circulating water or air through tubes embedded in the formwork, employing a post-cooling system.
This technique, first developed by the Bureau of Reclamation in 1933 [14], was implemented during the construction of the Hoover Dam (Nevada/Arizona, USA) to carefully control the internal temperature of the concrete within predefined project limits. This was achieved through the active circulation of water (or another cooling fluid) or air through tubes embedded in the material. The primary objective is to prevent thermal cracks by controlling the concrete’s temperature, particularly during the hydration phase, to minimize volumetric variations caused by temperature fluctuations. Designing post-cooling systems involves optimizing tube properties, such as geometric layout, heat transfer, fluid flow, and inlet/outlet temperatures, to achieve the desired reduction in peak temperature while minimizing the power energy consumption of the system [15,16,17].
Examples of structures and their corresponding typical tube layouts are illustrated in Figure 1. While the technique has shown significant effectiveness [1], it comes with substantial costs associated with design, material acquisition, installation, and efficient operation. Consequently, its widespread application is primarily limited to larger projects, such as dams, where internal cooling can be implemented before filling or sealing the joint [18]. The post-cooling system can be activated within the first few days after pouring, enabling the precise thermal control of the concrete. Additionally, post-cooling finds applications in various structures, including but not limited to concrete segments for immersed tunnels, retaining walls, and slabs, all of which are widely utilized today [19,20,21,22].
Advancements in understanding have led to theories that model the cement hydration reaction as an exothermic and thermally activated process. Building on these theories, sophisticated numerical models have been developed. Combined with the evolution of hardware and software technologies, these models have become highly complex, allowing simulations that closely approximate reality in terms of geometry and the phenomenological aspects considered [23].
Numerous studies offer numerical solutions to simulate heat reduction through post-cooling systems in concrete using the discrete approach, with notable contributions from researchers such as Myers et al. [24], You et al. [25], Liu et al. [26], Zhong et al. [27], Ding and Chen [28], Nguyen et al. [29] and Yang et al. [30,31], who have conducted extensive studies in this field. However, the discrete process increases the size of the thermal problem, leading to potential issues of convergence. Zhu [32] and Conceição et al. [33] have already delved into this topic, proposing equivalent methods to replicate the effects of cooling tubes.
The equivalent approach developed by Zhu [32] models the cooling effect of pipes as a negative heat rate source in the heat balance equation. Each pipe cools a cylindrical region of concrete, with the size based on the spacing between pipes. The method simplifies the cooling process by representing the average temperature of the concrete cylinder using functions that describe the tube cooling effect. This approach effectively balances the heat generated by cement hydration with the heat removed by the cooling tube, providing a simplified yet accurate method for simulating the cooling in large concrete structures.
The Equivalent Cooling Surfaces (ECSs) method [33] is proposed as an alternative to the existing discrete cooling approach. Unlike traditional methods, the ECS approach represents cooling coils as internal thermal boundaries, applying Newton’s cooling law to describe the heat flux between the concrete and the cooling pipes.
The heat flux is calculated based on an equivalent convection coefficient, which simplifies the heat transfer process between the concrete and the cooling surface. This method allows for efficient heat transfer calculations while bypassing the complexity of modeling the vertical temperature gradients in the concrete lift that arise in traditional methods.
In light of these considerations, the present work adopts a mesoscopic-scale approach, comprehensively considering all phenomena associated with the material. This study introduces a novel numerical model for coupling the post-cooling system within the thermochemical analysis of massive concrete structures, representing a significant advancement in FEM computational methods applied to this field. This approach aims to reduce computational costs related to the discretization of fluid–solid interaction, ensuring precise and efficient results in simulating the construction of large structures.
Additionally, this work introduces an innovative numerical approach to simulate the construction of large-scale concrete structures, encompassing construction parameters, layered or sliding formwork simulation, thermochemical aspects of hydration, and a post-cooling system employing water circulation through tubes integrated into the formworks, with a system control parameters (on/off) adjusted based on concrete temperature. The conception of our approach was inspired by the contributions of Silva et al. [34], who implemented a thermoregulation model representing the heat transfer dynamics from arteries to tissues within the human body.
To validate this approach, a simulation of concrete slab construction was conducted using data obtained from a previously constructed and tested slab in the FURNAS laboratory (Goiania/GO). The same mesh, material parameters, and boundary conditions were replicated in the DIANA FEA software, version 10.5, for a subsequent comparison of results [35]. Following successful validation, the construction of a water intake pillar for the Tocoma hydroelectric plant in Venezuela was simulated, and the results were compared with the field data obtained during the actual construction. The computational modeling utilized the finite element method (FEM) within a parallel environment, developed in the FORTRAN programming language. This system was integrated into the DAMTHE 2.0 software, a product of research conducted by PEC/COPPE/UFRJ, which incorporates contributions from the authors [23].
It should be pointed out that concrete is widely recognized as a heterogeneous material with multi-scale characteristics, ranging from the nanometric scale of hydrates to the macroscopic scale of real structures. Numerous studies have explored the complexities of concrete at different scales, offering valuable insights into both its thermochemical and mechanical behavior. While multi-scale modeling can provide a more detailed representation of concrete’s heterogeneity, for the purposes of this study, a mesoscopic approach was adopted. This is particularly suitable for massive concrete structures, such as hydroelectric power plants, where the scale of the elements allows the material to be treated as homogeneous and isotropic without significantly affecting the accuracy of the analysis. However, for smaller structures, where the heterogeneities of the material have a more pronounced effect, different modeling approaches, such as multi-scale or micromechanical models, would be necessary. Future advancements in multi-scale modeling, as highlighted by recent studies, provide important avenues for further exploration and will be considered in subsequent research.

2. Numerical Modeling

2.1. Mass Concrete

As introduced above, the construction of massive concrete structures requires a careful understanding of the material’s mechanical integrity from the moment of its placement. This assessment is necessary due to the potential susceptibility of these structures to early-age cracking induced by thermal deformations and/or autogenous shrinkage resulting from the cement hydration reaction [36].
Thus, a thorough understanding of thermochemical phenomena in concrete is crucial for accurately simulating construction processes. In this context, the numerical model employed in this study relies on the thermochemical coupling theory introduced by Ulm and Coussy [2]. This theory deduces the equations governing the problem within a thermodynamic framework for porous media. It considers the interplay between hydration reactions, temperature variations, and alterations in concrete properties. The perspective outlined by Ulm and Coussy [3] considers concrete as a chemically reactive porous medium. In its initial phase, it exists as a fluid composed of free water and air, undergoing a transformation into a porous solid state upon reaching its percolation threshold ( α 0 )—the precise moment when the shift occurs from a material in suspension to a solid state. Beyond this threshold, the mechanical properties of the material come into play, encompassing features such as Young’s modulus, compressive and tensile strength, Poisson’s ratio, and more. Additionally, it is at this point that the formed skeleton may start to exhibit cracking. Because the cement hydration reaction is an exothermic and thermoactivated chemical process, as the reaction proceeds, it releases heat, causing an increase in the temperature of the cement mass. This rise in temperature, in turn, influences the kinetics of the hydration reaction. This phenomenon has implications for the mechanical behavior of the material since the progression of the hydration reaction is directly correlated with the evolution of its material properties, such as elastic modulus, strength, creep, and shrinkage [37]. This evolution is commonly referred to as the “aging” of concrete. Consequently, it is possible to define the degree of hydration α [ 0 , 1 ] as a normalized variable that expresses the evolution of the hydration reaction. It can be expressed as a normalization of the variable m representing the variation in the skeleton mass:
α = m ( t ) m t = , α [ 0 , 1 ]
In additional studies Ulm and Coussy [4], the authors’ theory explains the progression of the hydration reaction in a particular concrete mass, incorporating factors such as its exothermic nature and thermoactivation. The development of thermal fields within a designated volume is elucidated through the resolution of the equation governing this process. As a result, the equation portraying the temporal advancement of heat, accounting for thermochemical coupling (where hydration heat generation interacts with thermoactivation), can be expressed within the theoretical framework as follows:
C p T ˙ = Q ˙ + L α ˙ + λ 2 T
In the given context, C p signifies the specific heat of concrete, Q ˙ represents the heat flow generated by a heat source (e.g., a post-cooling system), λ denotes the thermal conductivity, L stands for a material constant that is positively valued due to the exothermic nature of the reaction, and α ˙ embodies the reaction speed, denoting the rate at which the degree of hydration increases (derived from the time derivative of m). The term corresponding to the thermochemical coupling is L α ˙ , which represents the generation of heat by the hydration reaction. The initial fields are given by
T = T ¯ ( Γ T , t ) i n Γ T
q . N = q ¯ ( Γ q , t ) i n Γ q
q . N = h p r . ( T T a m b ) i n Γ C , R
where q ¯ ( Γ q , t ) denotes the flow within the Γ q segment of the contour; T ¯ ( Γ T , t ) is the temperature prescribed in Γ T ; Equation (5) represents the heat exchange through convection and radiation at the continuum boundaries with the environment, accounting for an average exchange coefficient ( h p r ), Γ = Γ T Γ q Γ C , R ; and N denotes the outward normal vector at the boundary.
Through Equation (2), it is possible to calculate the temperature field as a function of the heat generated, represented by the term L α ˙ .
It is also noted that to find the numerical solution of Equation (2), it is necessary to calculate the hydration field, that is, it is necessary to know α for all time steps that you want to obtain the field of temperatures T. Consequently, to solve Equation (2), it is necessary to first determine the hydration kinetics ( α ˙ ( α ) ) for each time step.
In this sense, considering the kinetics of this hydration in an integrated way, through the basic model for cementitious materials, Ulm and Coussy [2,3,4] proposed Equation (6) to describe the evolution of the cement skeleton mass, measured by the variation of the degree of hydration with time.
α ˙ = d α d t = A ˜ ( α ) exp E a R T ,
where A ˜ ( α ) is called normalized affinity and encompasses the physical effects corresponding to the increase in hydrate mass, diffusion, viscosity, and the chemical affinity itself. This is the only property of concrete that is independent of temperature.
The thermoactivation effect is represented in the equation by the exponential factor as a function of temperature, exp E a R T , explaining that the reaction intensifies when temperatures are higher. The terms E a , R and T are defined as the activation energy, the universal constant of perfect gases, and temperature, respectively. It should be noted that, in this model, E a is considered constant over time.
Thus, it is evident that if there is knowledge of a curve A ˜ ( α ) x α , it will be possible to solve Equation (2), as long as there is, for each time step, in addition to the temperatures T, the degrees of hydration α .
The values of A ˜ ( α ) , which are an intrinsic measure of the reaction kinetics, can be obtained experimentally through adiabatic tests or through uniaxial compression isothermal tests performed at different ages.

2.2. Post-Cooling System

The oldest and foremost principle to consider is the conservation of mass, applicable either in a closed system or in the context of mass continuity within a flowing system. Drawing from engineering thermodynamics, Bejan [38,39] and Cengel [40] revisit the mass conservation statement for a control volume, as shown in Equation (7):
M c v t = i n l e t m ˙ o u t l e t m ˙
where M c v is the mass that is trapped instantaneously inside the control volume (cv), while m ˙ values are the mass flow rates associated with a flow into and out of the control volume.
Considering u, v and w as the local velocity components at the point ( x , y , z ) , as shown in Figure 2, the mass conservation equation stipulates that
ρ t + ( ρ u ) x + ( ρ v ) y + ( ρ w ) z = 0
In practical applications, fluid flow through a pipe is often approximated as one-dimensional, meaning that the properties vary only in the direction of flow [40]. This simplification allows us to assume that all properties are uniform across any cross-section perpendicular to the flow direction and can be represented by their average values over that cross-section.
Besides that, due to the no-slip condition, the fluid velocity within a tube is zero at the surface and reaches a maximum at the center. To facilitate analysis in this work, we adopt a mean velocity u w , which remains constant when the tube’s cross-sectional area is constant.
Although, in actual heating and cooling applications, the mean velocity may vary slightly because of density changes with temperature, the fluid properties were treated as constants at an average temperature for this study, as illustrated in Figure 3.
The value of the mean velocity u w in a tube is determined from the requirement that the conservation of mass principle is satisfied. That is,
m ˙ = ρ u w A w = A w ρ u ( r i , x ) d A w
where m ˙ is the mass flow rate, ρ the density of the fluid and A w is the cross sectional area. Then, the mean velocity for a circular tube of inner radius r i can be expressed as demonstrated in Equation (10).
u w = 2 r i 2 0 r i u ( r i , x ) r i d r i
When the fluid is heated as it flows through a tube, the temperature of the fluid at any cross-section changes from T c at the surface of the concrete to some minimum at the tube center. In this workm a mean temperature T w that remains uniform at a cross-section is convenient, as expressed in Equation (11) and illustrated in Figure 3.
T w = 2 u m r i 2 0 r i T ( r i , x ) u ( r i , x ) r i d r i
When a fluid is heated, its mean temperature changes along the flow direction. This change must comply with the conservation of energy principle. Specifically, the energy transported by the fluid through a cross-section ( E ˙ w ) in actual flow must be equal to the energy that would be transported through the same cross-section if the fluid were at a constant temperature T w . Mathematically, this relationship can be expressed as
E ˙ w = m ˙ C p w T w = m ˙ C p w T δ m ˙ = A w ρ C p w T u d A w
where C p w is the specific heat of the fluid.
The conservation of energy for the steady flow of a fluid in a tube can be expressed as
Q ˙ = m ˙ C p w ( T w i T w 0 )
where T w i and T w 0 are the mean fluid temperatures at the exit and inlet of the tube, respectively, and Q ˙ is the rate of heat transfer to the fluid.
The thermal conditions at the surface were approximated to be constant surface heat flux ( q ˙ = c o n s t a n t ), as shown in Figure 3. Surface heat flux is expressed by Newton’s law of cooling:
q ˙ = h ( T c T w )
where h is the local transfer coefficient.
Considering that h and thus T c T w are constant, as the fluid properties remain constant during flow, the slope of the mean fluid temperature T w can be determined by applying the steady-flow energy balance to a tube slice of thickness d x shown in Figure 3. This gives
m ˙ C p w d T w = q ˙ P d x d T w d x = q ˙ P m ˙ C p w = c o n s t a n t
where P is the perimeter of the tube.
Then, the mean fluid temperature at the tube exit becomes
T w i = T w 0 + q ˙ P l m ˙ C p w
where l is the length of the section of the tube.
Combining Equations (9), (14) and (16) gives
T w i = T w 0 + h ( T c 0 T w 0 ) P l ρ u w A w C p w
q ˙ = ρ u w A w C p w ( T w i T w 0 ) P l
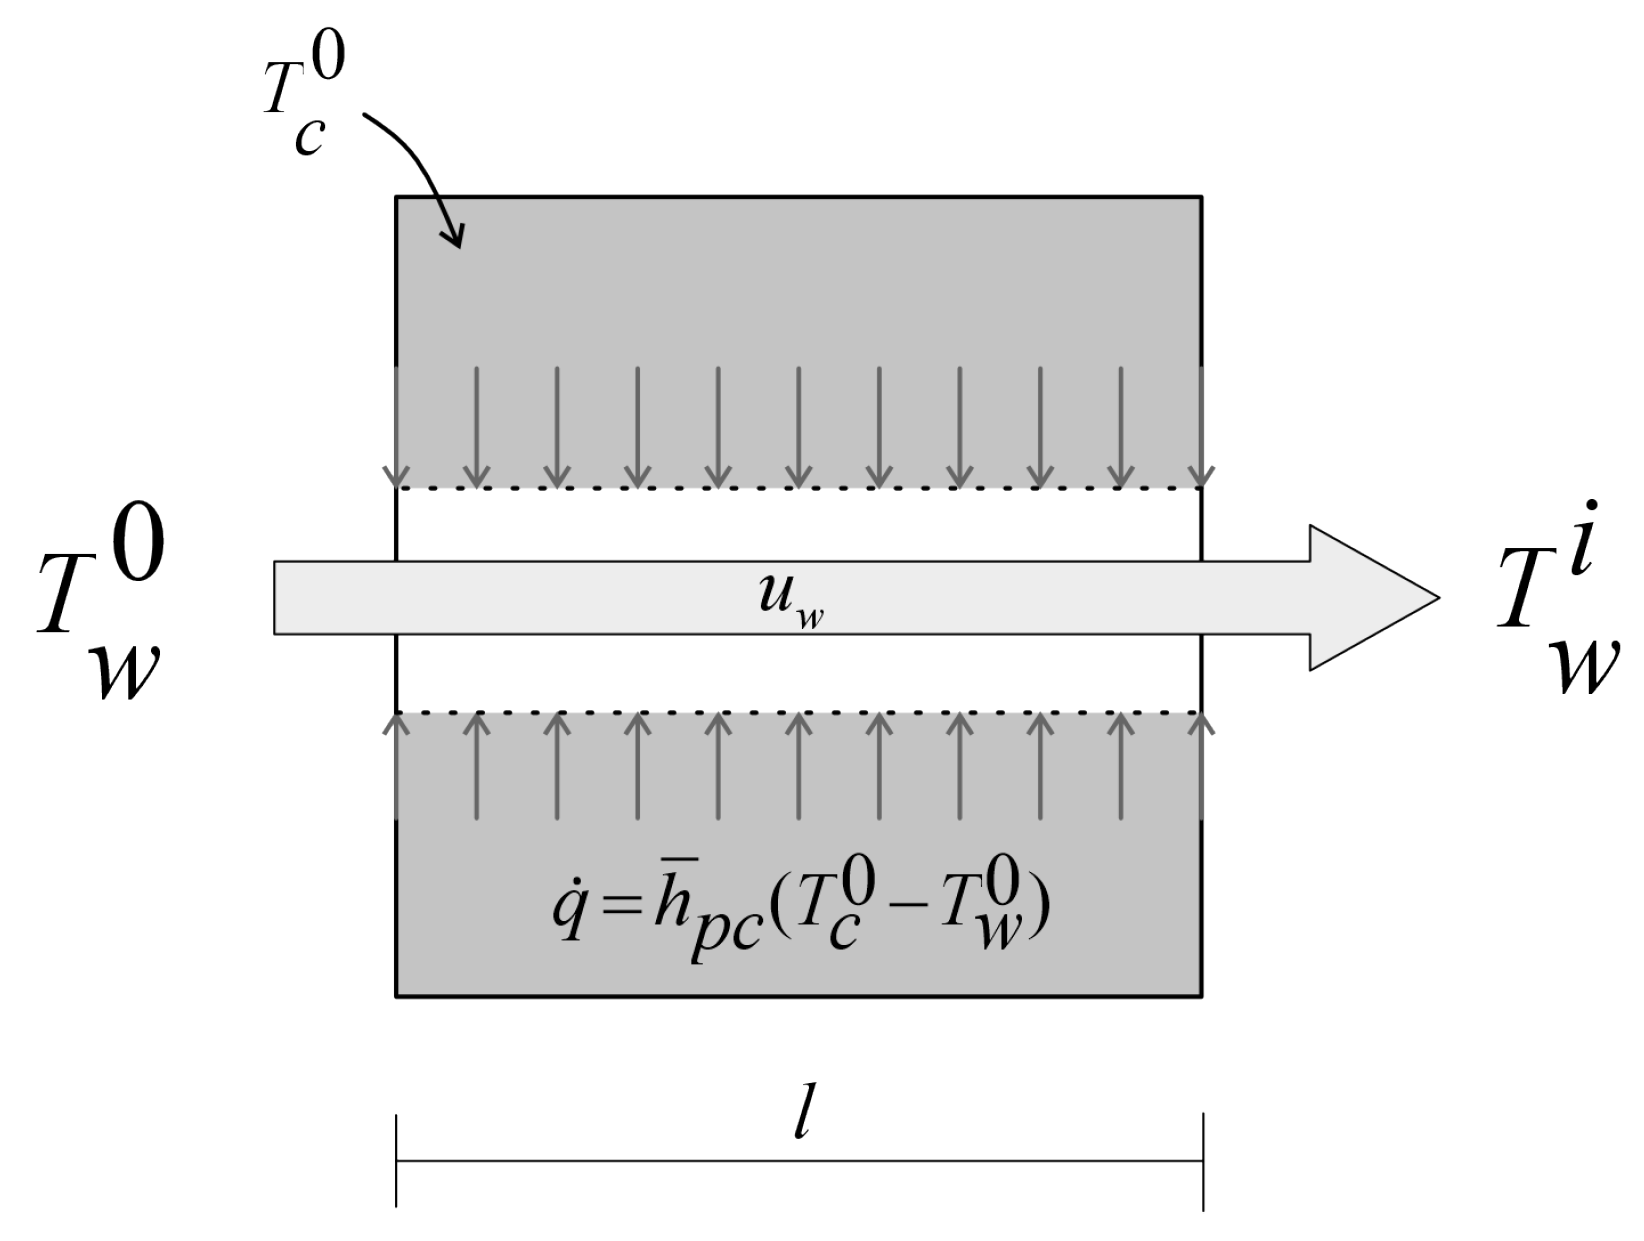
Applying the theoretical formulation to the implementation of a numerical solution for the post-cooling of concrete structures, an arbitrary volume is considered, as illustrated in Figure 4, consisting of two distinct materials: concrete and coolant fluid.
At the outset, this volume is treated as a singular isolated element to simplify the fluid–solid interaction. Through Equations (17) and (18), the outlet temperature T w i of the fluid and the heat flow generated by this heat exchange are determined.
It is important to emphasize that assuming a direct relationship to the convection exchange between the fluid and the concrete volume element, while disregarding conduction exchanges among the various materials of the arbitrary volume, may not be sufficient to represent its behavior. This is because the conduction exchange occurs with the inner wall of the tube, which, in turn, conducts heat through conduction to its external diameter among its thickness, and this, in turn, conducts heat in a flow to the edges of the concrete element.
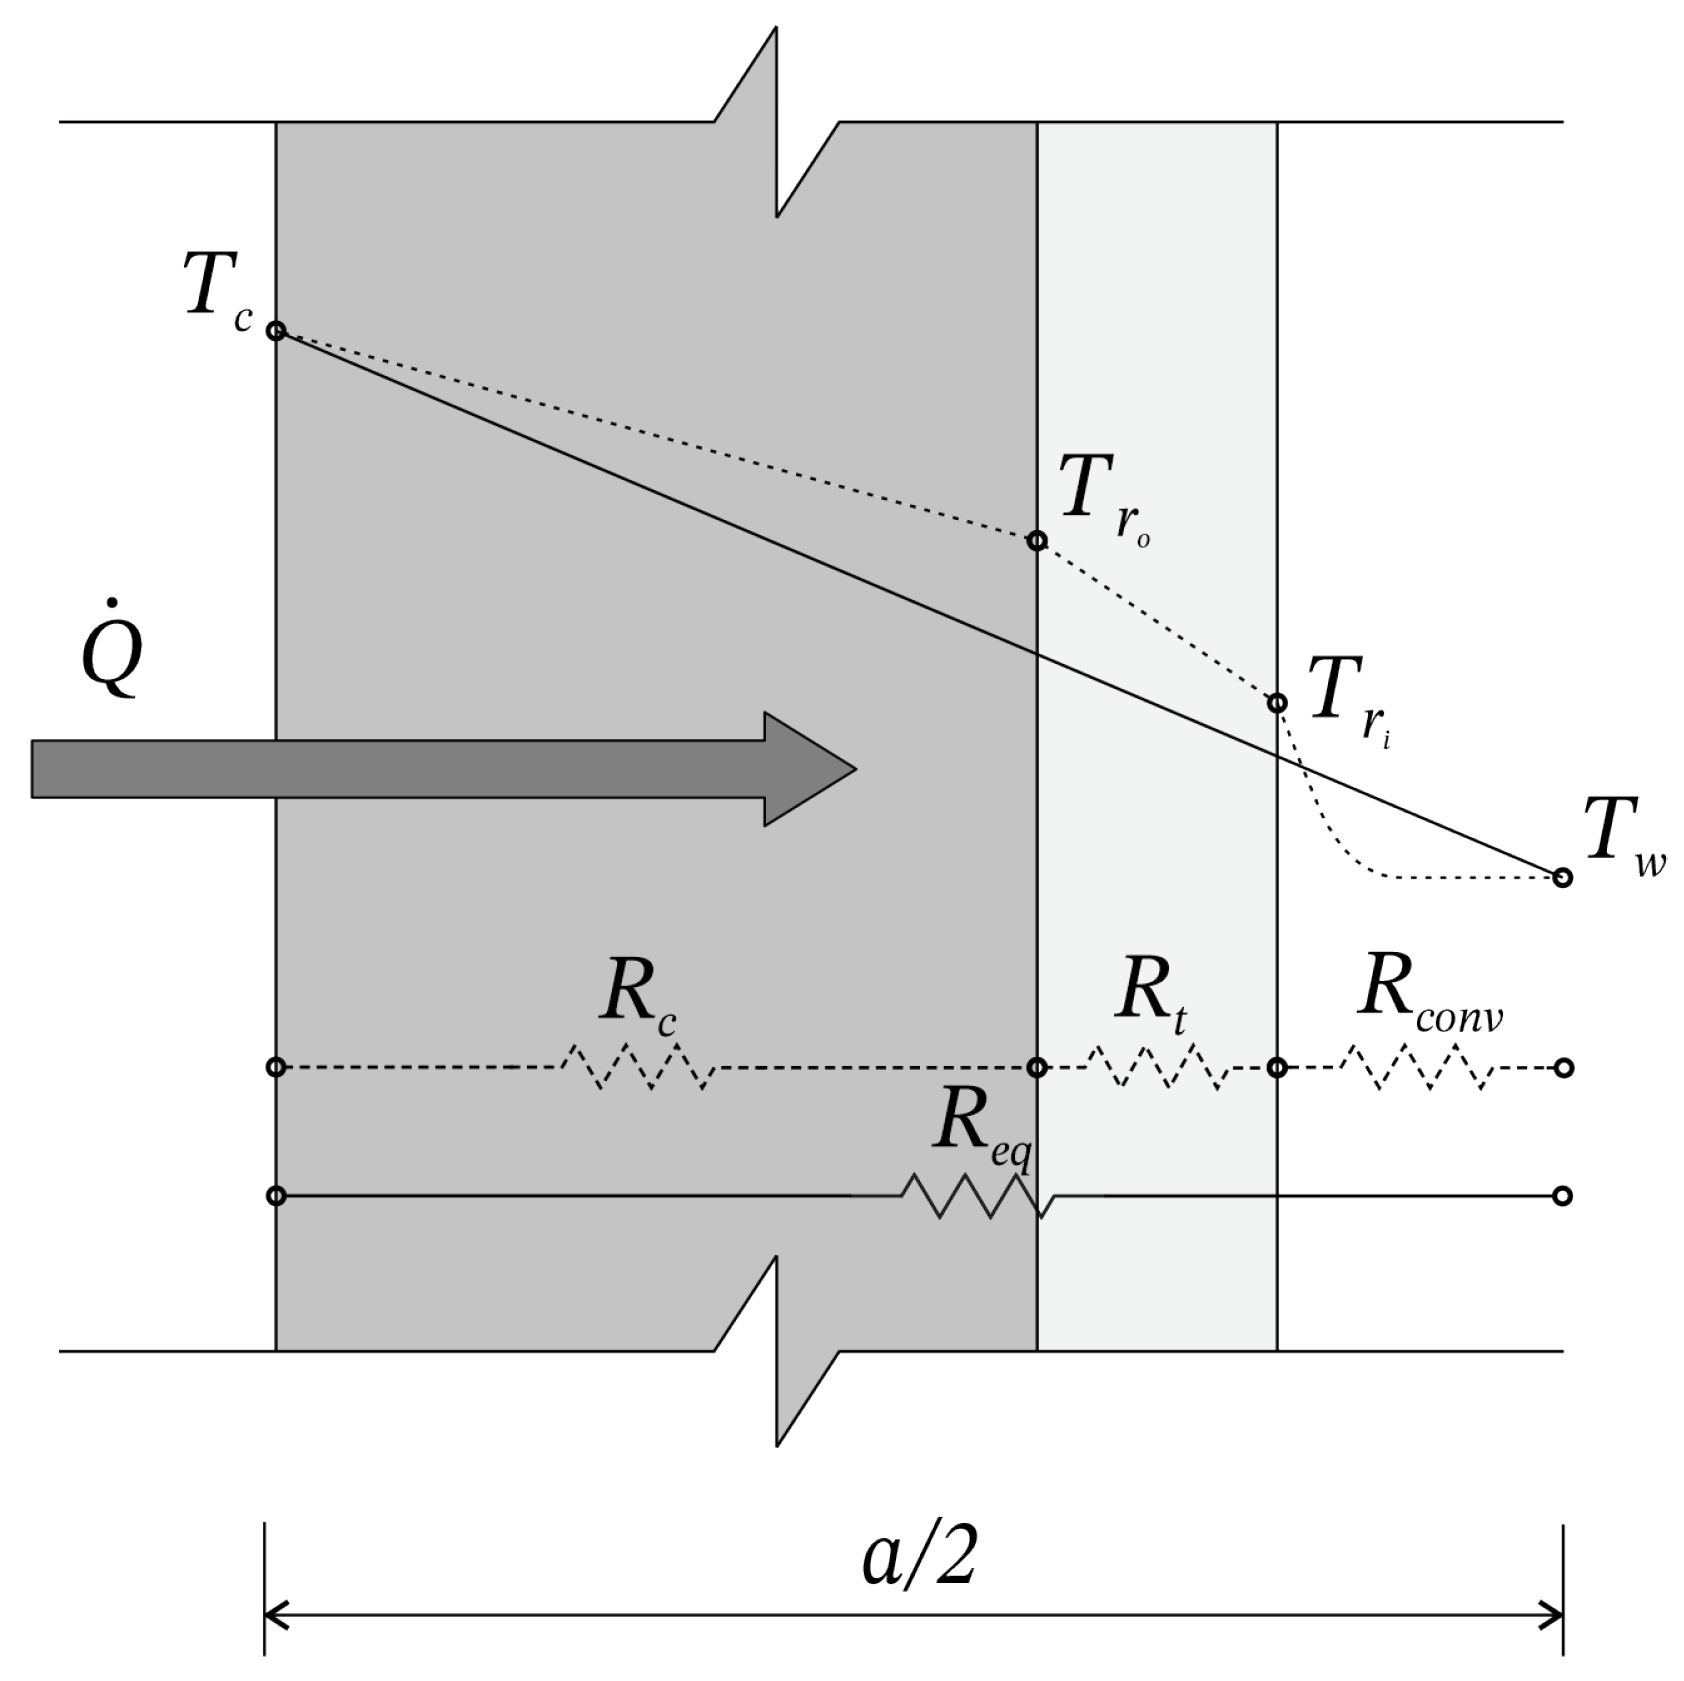
Therefore, it is not well balanced by purely applying Equation (5), assuming that the entire convective exchange capacity occurs within a specific time interval δ t . In this context, this work aimed to analytically determine a weighting factor to effectively represent the equivalent heat exchange flow. This was achieved through the determination of an equivalent convection exchange parameter, h ¯ p c , acquired from the element’s equivalent thermal resistance R e q , as shown in Equations (26) and (28) and illustrated in Figure 5.
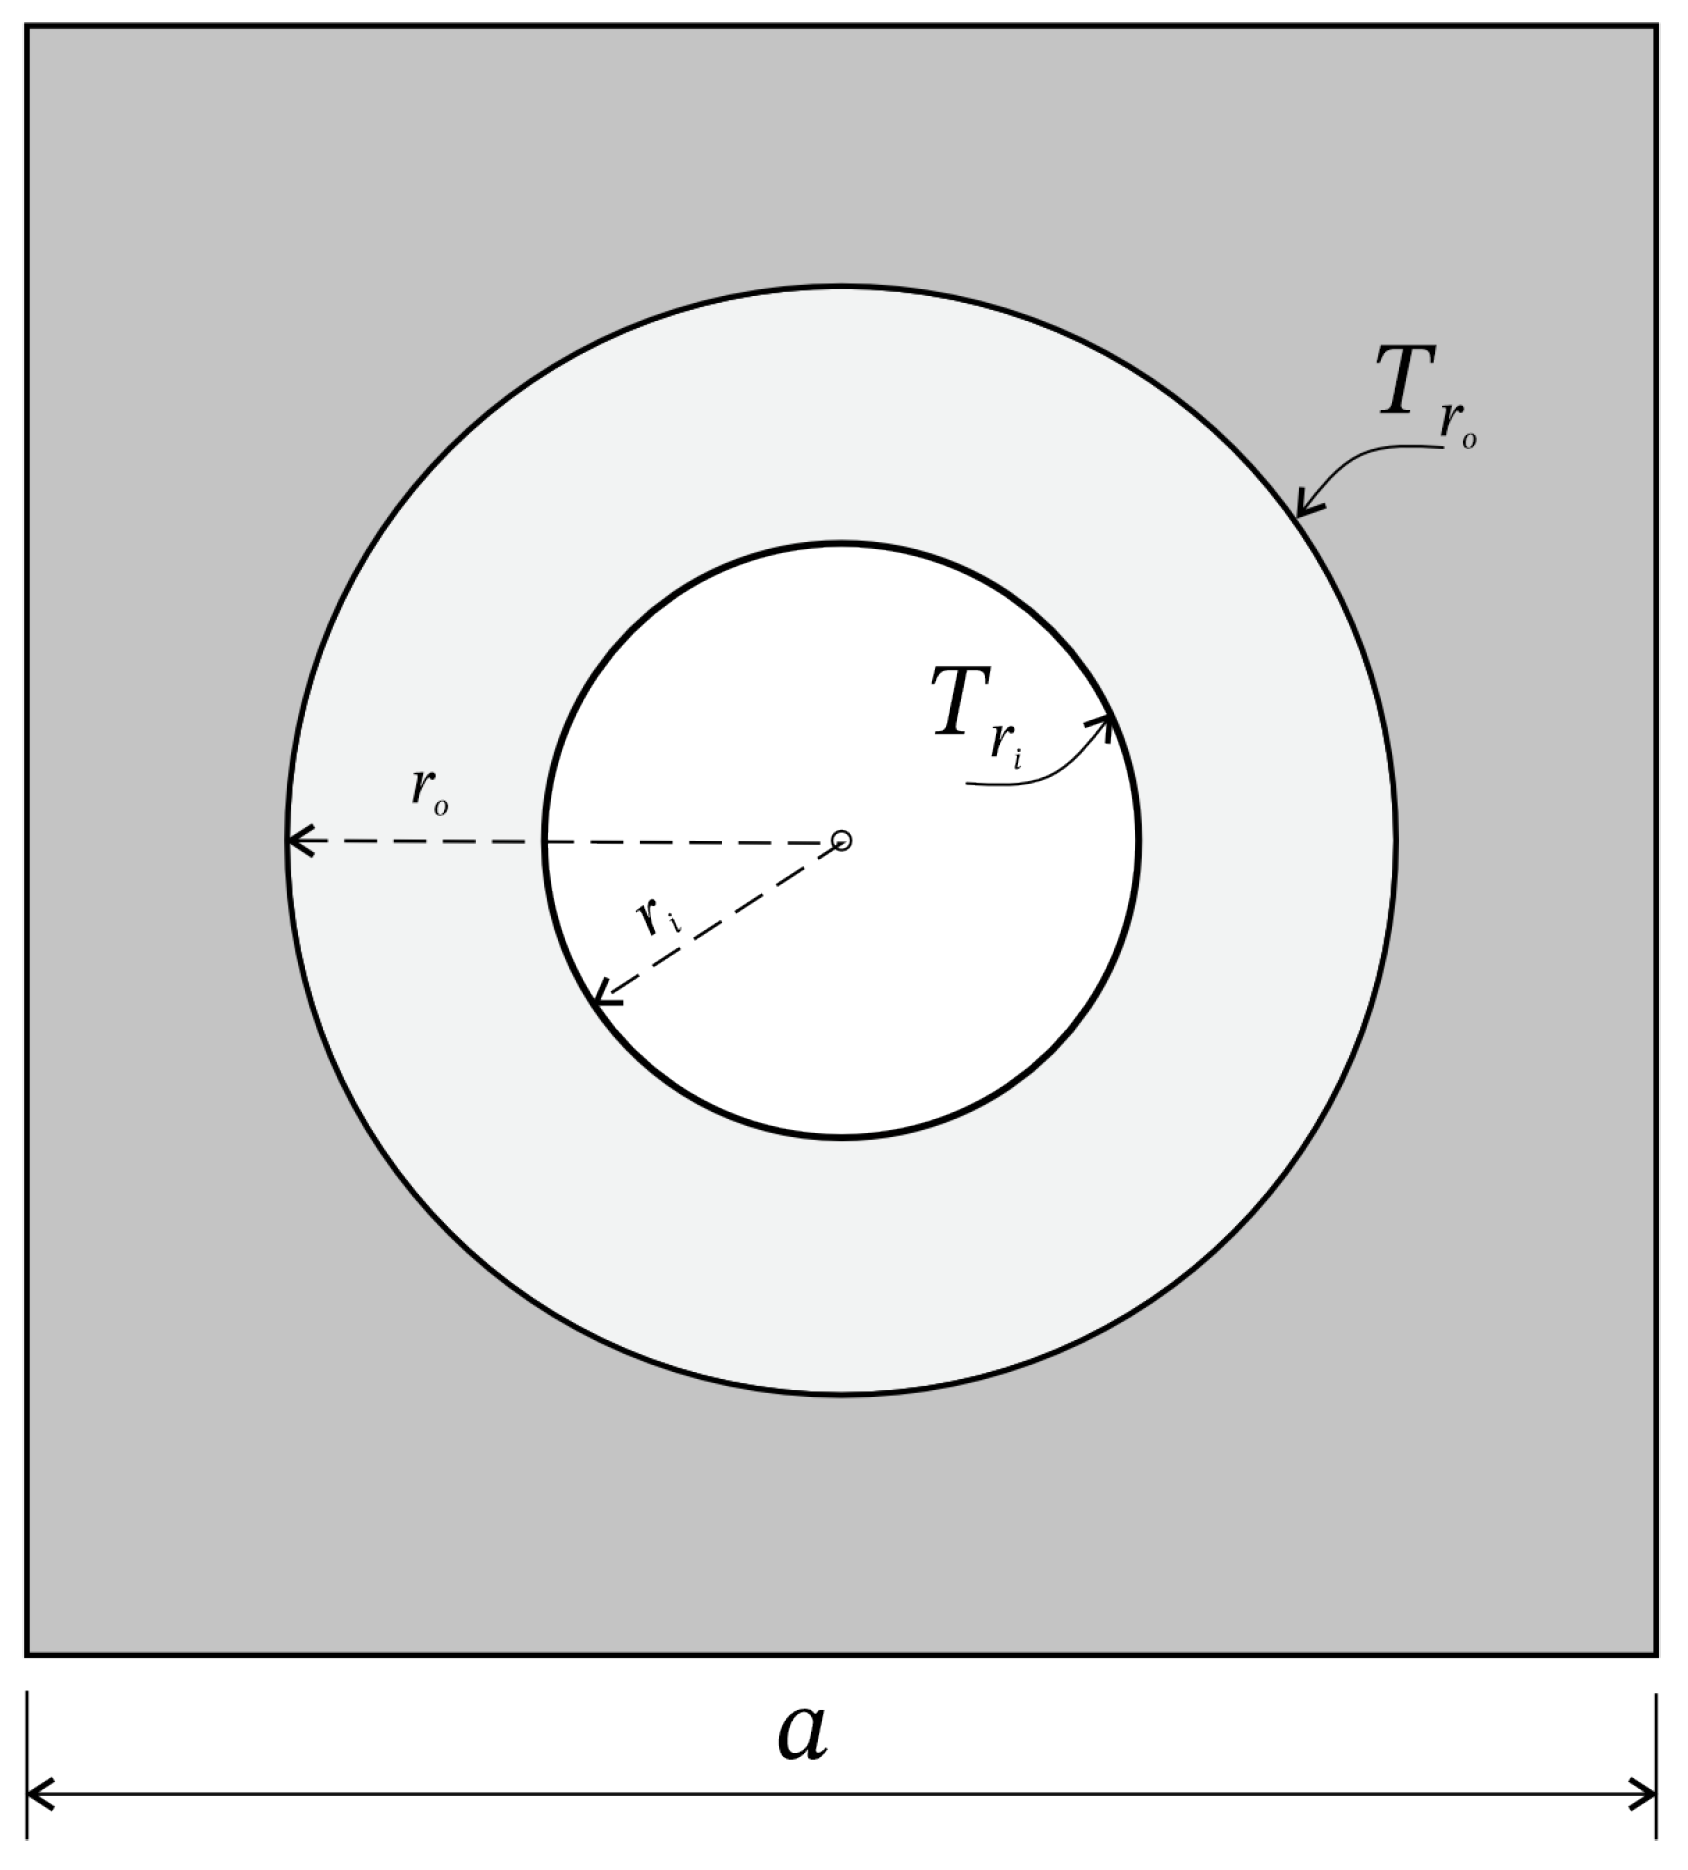
To achieve the equivalent thermal resistance, a circular pipe is characterized by an inner radius r i , an outer radius r o , a length l, and an average thermal conductivity λ t . The pipe is maintained at constant temperatures of T r i and T r o . For one-dimensional steady heat conduction through the cylindrical layer, the heat transfer is described by Fourier’s law, as depicted in Equation (19) and illustrated in the Figure 6.
Q ˙ = λ t A d T d r
where A = 2 π r l is the heat transfer area at location r. As A depends on r and it varies in the direction of heat transfer, integrating from r i to r o , it is possible to write Equation (20).
Q ˙ = λ t 2 π l T r i T r o l n ( r o / r i )
As Q ˙ is considered constant at δ t , this equation can be rearranged in terms of its thermal resistance, namely R t , and expressed by Equation (21).
Q ˙ = T r i T r o R t
In this context, managing steady heat transfer through composite materials involves assigning additional resistances in series for each extra layer [40]. This bridges the temperature gap from T c to T w , resulting in an equivalent thermal resistance R e q = R c o n v + R t + R c , as illustrated in Figure 5.
Here, R c and R t represent the thermal resistances of the concrete and wall tube, respectively. At least R c o n v is the convective thermal resistance between the fluid and the wall tube, as described in Equations (22)–(24).
R c o n v = 1 h w 2 π l
R t = l n ( r o / r i ) λ t 2 π l
R c = l n ( 1.08 a / 2 r o ) λ c 2 π l
where h w represents the convective heat transfer coefficient between the coolant and the wall tube. According to Cengel [40] and Bejan [39], for fully developed laminar flow in a circular tube subjected to a constant surface heat flux, the Nusselt number is 4.36. Notably, there is no dependence on the Reynolds or Prandtl numbers, leading to the following expression for h w as shown in Equation (25):
h w = 4.36 λ w 2 r i
The thermal conductivity of the fluid, tube, and concrete, denoted, respectively, as λ w , λ t and λ c , are temperature-dependent. In this setting, it becomes feasible to formulate the equivalent thermal resistance in accordance with Equations (22)–(25):
R e q = 1 2 π l 1 2.18 λ w + l n ( r o / r i ) λ t + l n ( 1.08 a / 2 r o ) λ c
Under these conditions, the application of the equivalent thermal resistance concept allows the determination of the equivalent convection exchange parameter, as represented by Equations (27) and (28).
Q ˙ = h ¯ p c P l ( T c 0 T w 0 ) = ( T w 0 T c 0 ) R e q
h ¯ p c = 1 2 π r i l 1 R e q
Time t 0 is defined as the moment when the fluid enters the element, while t i marks the instant when the fluid exits the element. The determination of these times is based on a function of the fluid velocity and the length of the tube section. The time interval δ t is characterized by the exchange time between the two materials and is defined by the duration a specific fluid control volume remains within the solid, as illustrated in Figure 7 and expressed in Equation (29).
δ t = t i t o = l u w
Assuming m ˙ = ρ υ w A w = ρ V ˙ = ρ V δ t , where V is the fluid volume, we obtain Equations (30) and (31).
T w i = T w 0 + h ¯ p c ( T c 0 T w 0 ) P l ρ V C p w δ t
q ˙ = ρ V C p w ( T w i T w 0 ) P l δ t
In conclusion, the heat flow generated is distributed within the volume of the element and is incorporated as a new heat source in the thermochemical coupling (TC) of the software, as illustrated in Equation (32).
Q = ρ V C p w ( T w i T w 0 )
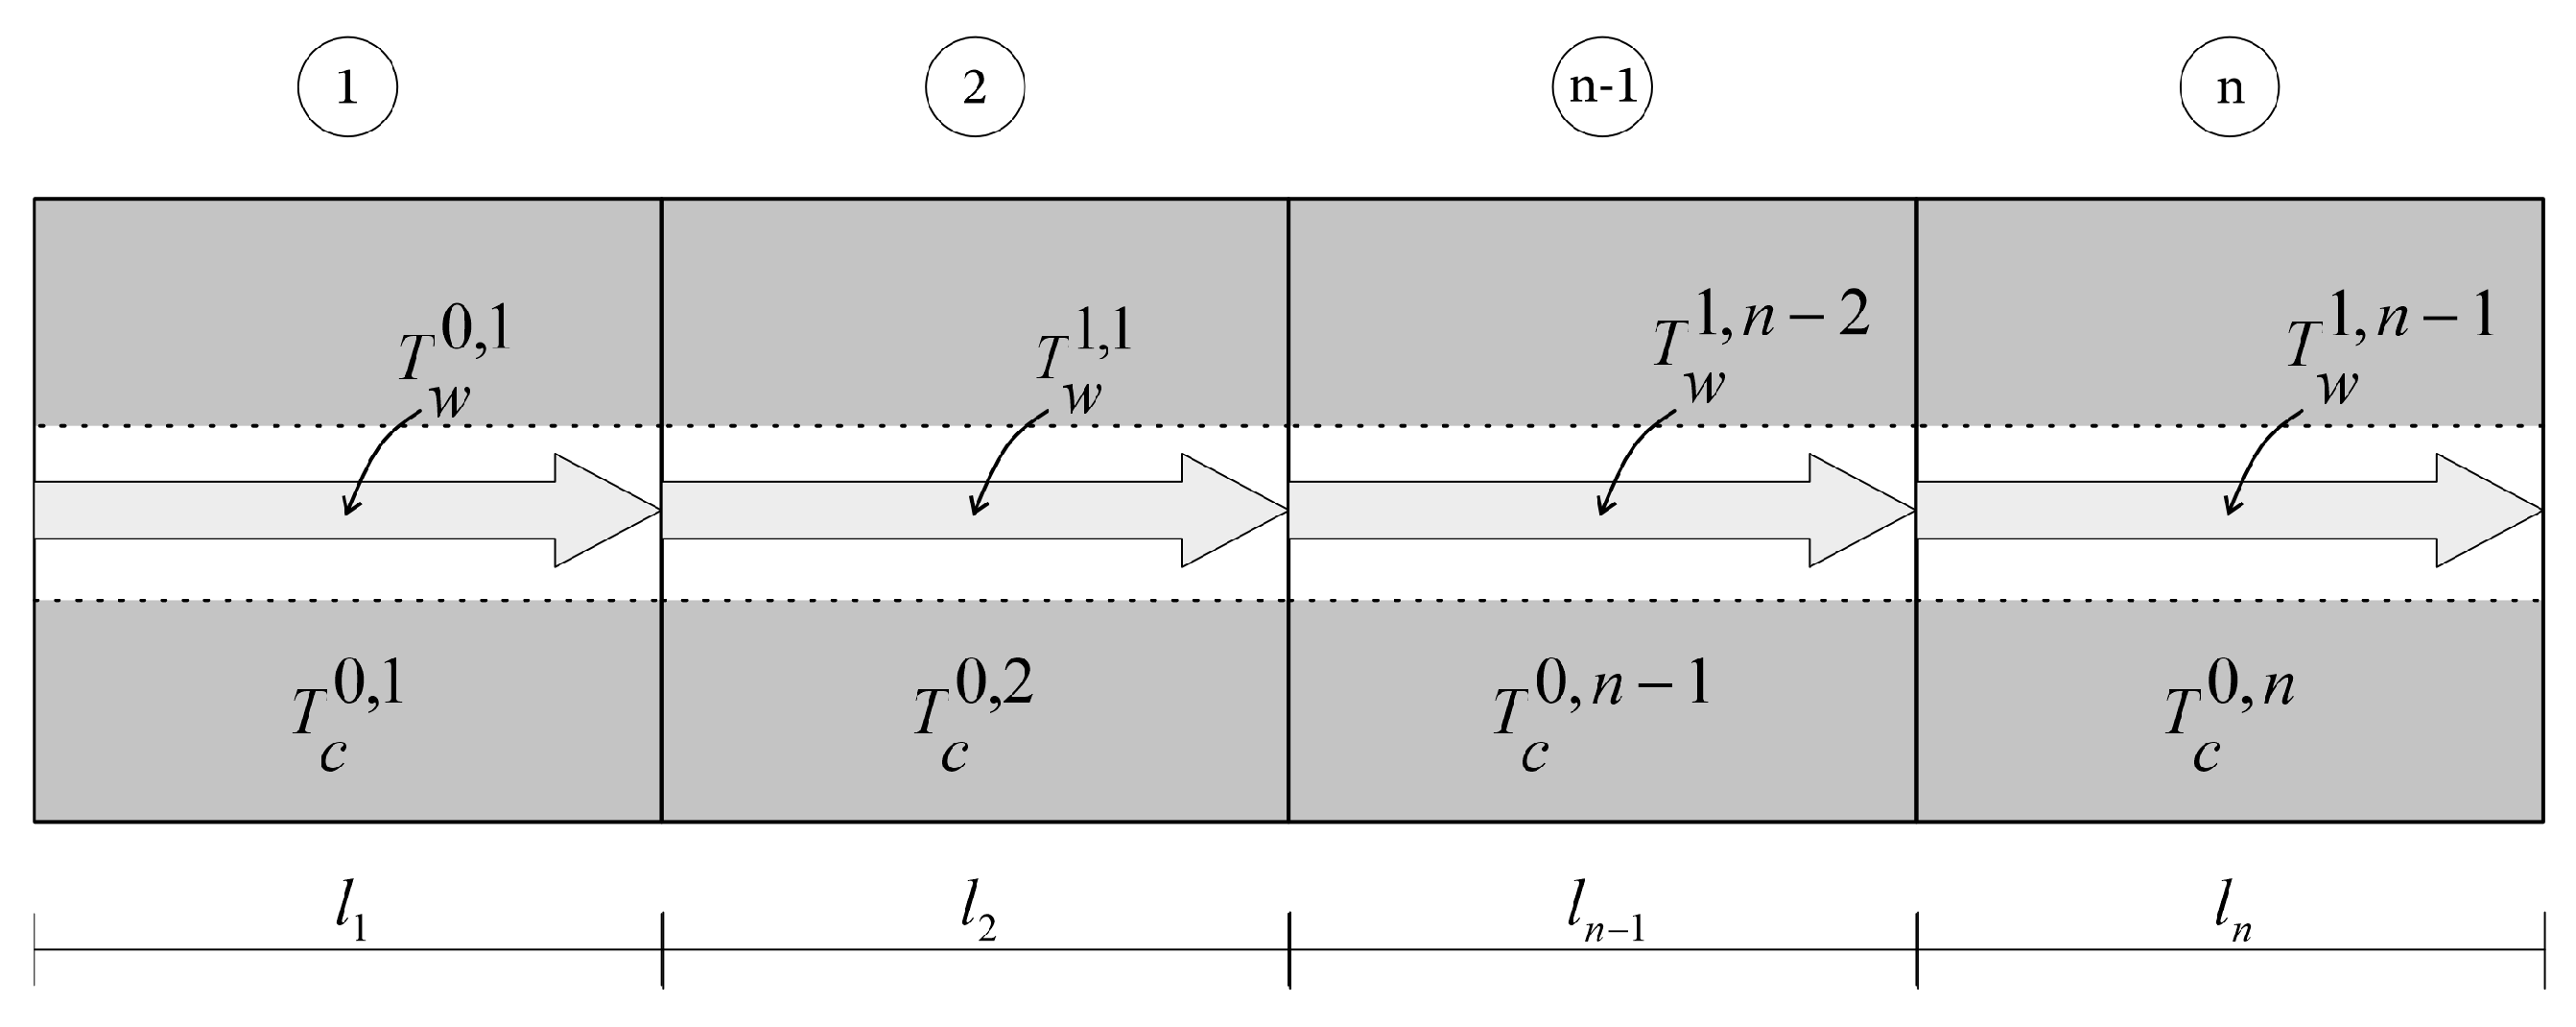
To implement the model in the finite element software DAMTHE 2.0, the tube is represented and applied using interconnected hexahedral elements of the concrete mesh. This elements are flagged in the geometry of the mass concrete structure, and each element serves as a control volume. Consequently, to simulate fluid flow along the pipe, the fluid’s inlet temperature in a given element is consistently determined by the outlet temperature of the preceding element. This relationship is defined by Equation (33) and illustrated in Figure 8.
T w 0 , k = T w 1 , k 1
Given that the initial temperatures at time t 0 are prescribed for both materials and the fluid inlet temperature in the first element, T w 0 , 1 , remains constant, a new exit temperature is computed for each T w i , n element during each time step δ t . Additionally, a heat source in the Q p c n element is calculated, as depicted in Figure 9.
Following the computation of the heat sources generated by the post-cooling system, the resulting heat source will be incorporated into the iterative solution of Equation (2). Subsequently, the mesh’s mixed elements (comprising concrete and coolant) will be treated as active concrete elements.
Moreover, the cooling system is activated once a predefined temperature at a specific point in the structure is reached. This condition is crucial to comply with the specifications of post-cooling projects, which dictate the temperature threshold for initiating the cooling system, as well as its shutdown.

2.3. Layered Construction

The finite element simulation method is based on element activation through a comprehensive mesh reading. The adopted strategy outlines a predefined concrete placement plan, specifying the number of construction layers ( n l a y ) , the time ( t l a y ) , and the temperature of placement for each layer ( T c 0 ) . The finite element mesh is then read, associating each element with a corresponding construction stage.
As the analysis progresses, when the placement time for a new layer is reached, associated elements are activated, and boundary conditions are updated. The initial displacement and stress values for newly placed elements are considered null. This process involves rebuilding matrices from finite element problems, incorporating new elements, and maintaining displacement, stress, temperature, and hydration degree fields for assembling linear equation systems.

3. Validation

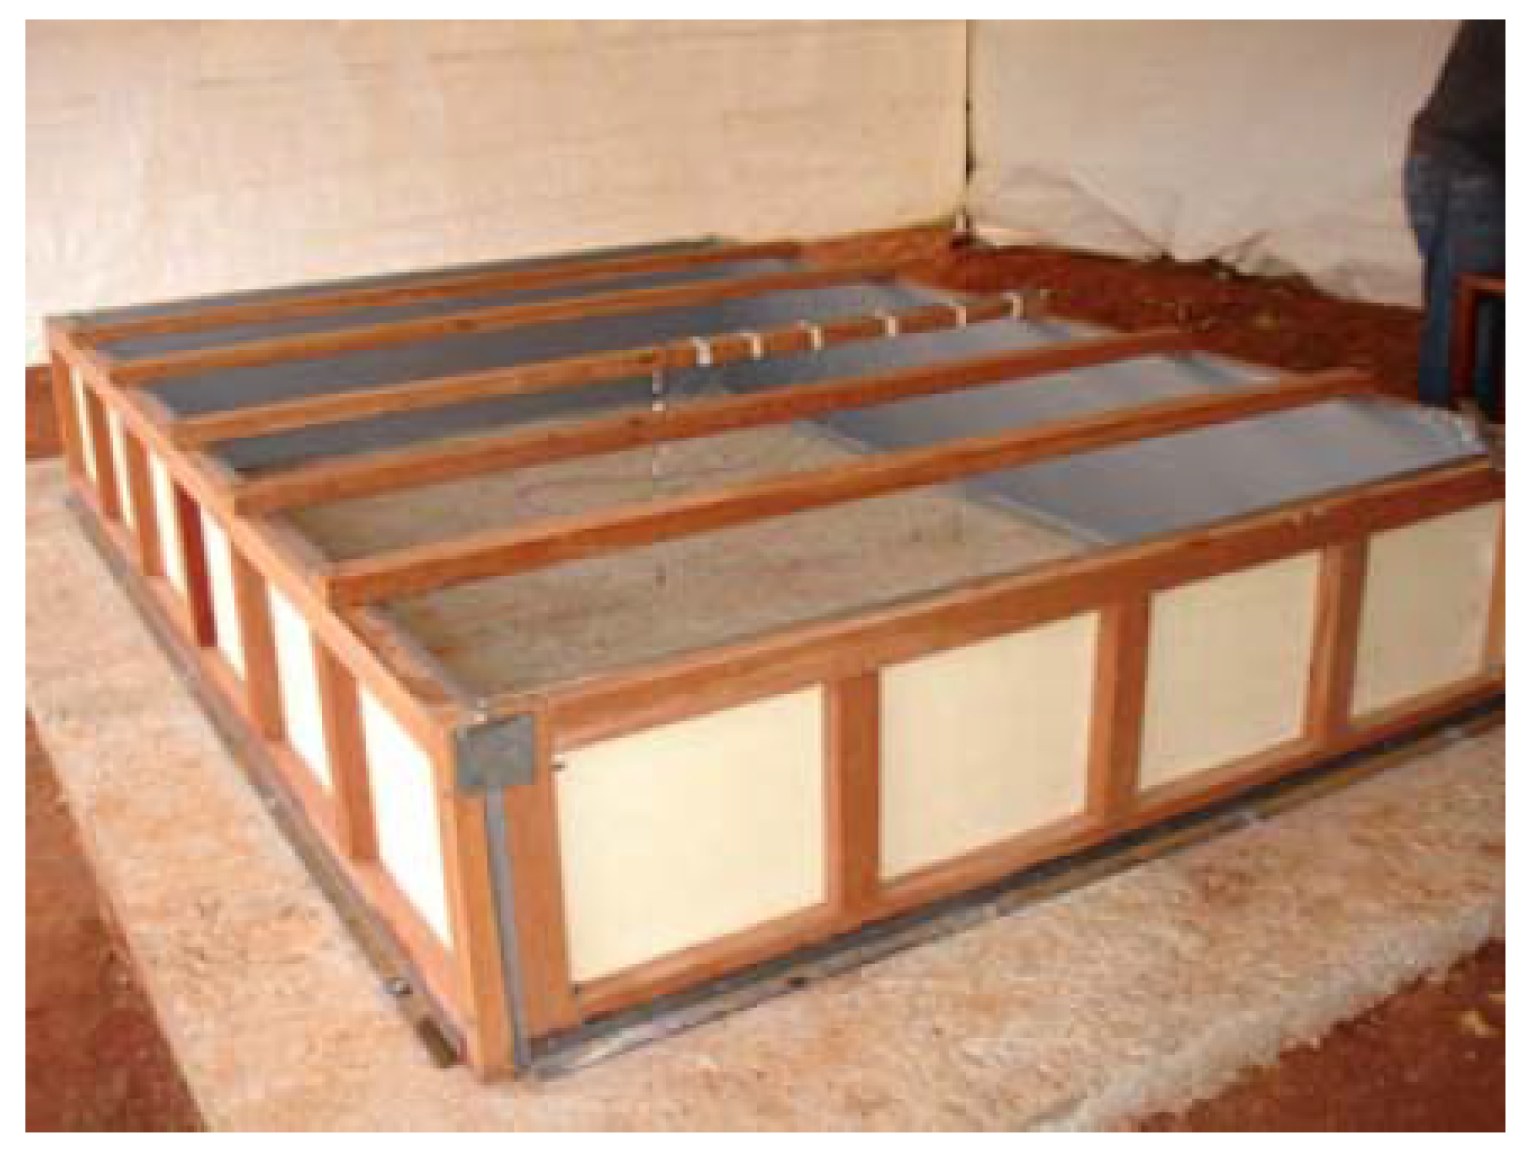
The construction of a concrete slab (3.0 × 2.0 × 0.5 m), built in a single layer/step on 10 cm of concrete was simulated to validate the proposed numerical approach. The finite element program used for simulation was DAMTHE 2.0, implemented in the FORTRAN programming language and developed by researchers at PEC/COPPE/UFRJ, including the authors of this study. The objective was to use data from experimental tests conducted on a slab at the FURNAS laboratory in Goiânia/GO, Brazil (Figure 10). These data served as a starting point for adjusting the numerical model to achieve a reference simulation that accurately represented the conducted tests, including the thermochemical properties of the materials used.
Following that, a sequence of elements was activated using the same mesh to simulate a concrete post-cooling pipeline. This system was not experimentally tested, and its inclusion served only to simulate and validate the approach proposed by the authors. The identical mesh, along with the same material parameters and boundary conditions, was replicated in the DIANA FEA software for the subsequent comparison of the results.
The DIANA FEA uses the discrete method to simulate cooling pipes, while the mean bulk water temperature variation T m along the pipe length x can be represented as Equation (34).
m ˙ w C p w T w x = h w P ( T c T w )
In this context, m ˙ is the water mass flow rate, C p w is the specific heat of water, h w is the convection coefficient between the water and the surrounding concrete, P is the pipe perimeter, and T c is the concrete temperature around the cooling pipe surface. Further details about Equation (34) can be found in Yang et al. [30]. If T c > T w , heat is transferred to the water, and T w increases with x. In this method, the cooling tube is made discrete by several 2D finite elements (FE) connected in series.
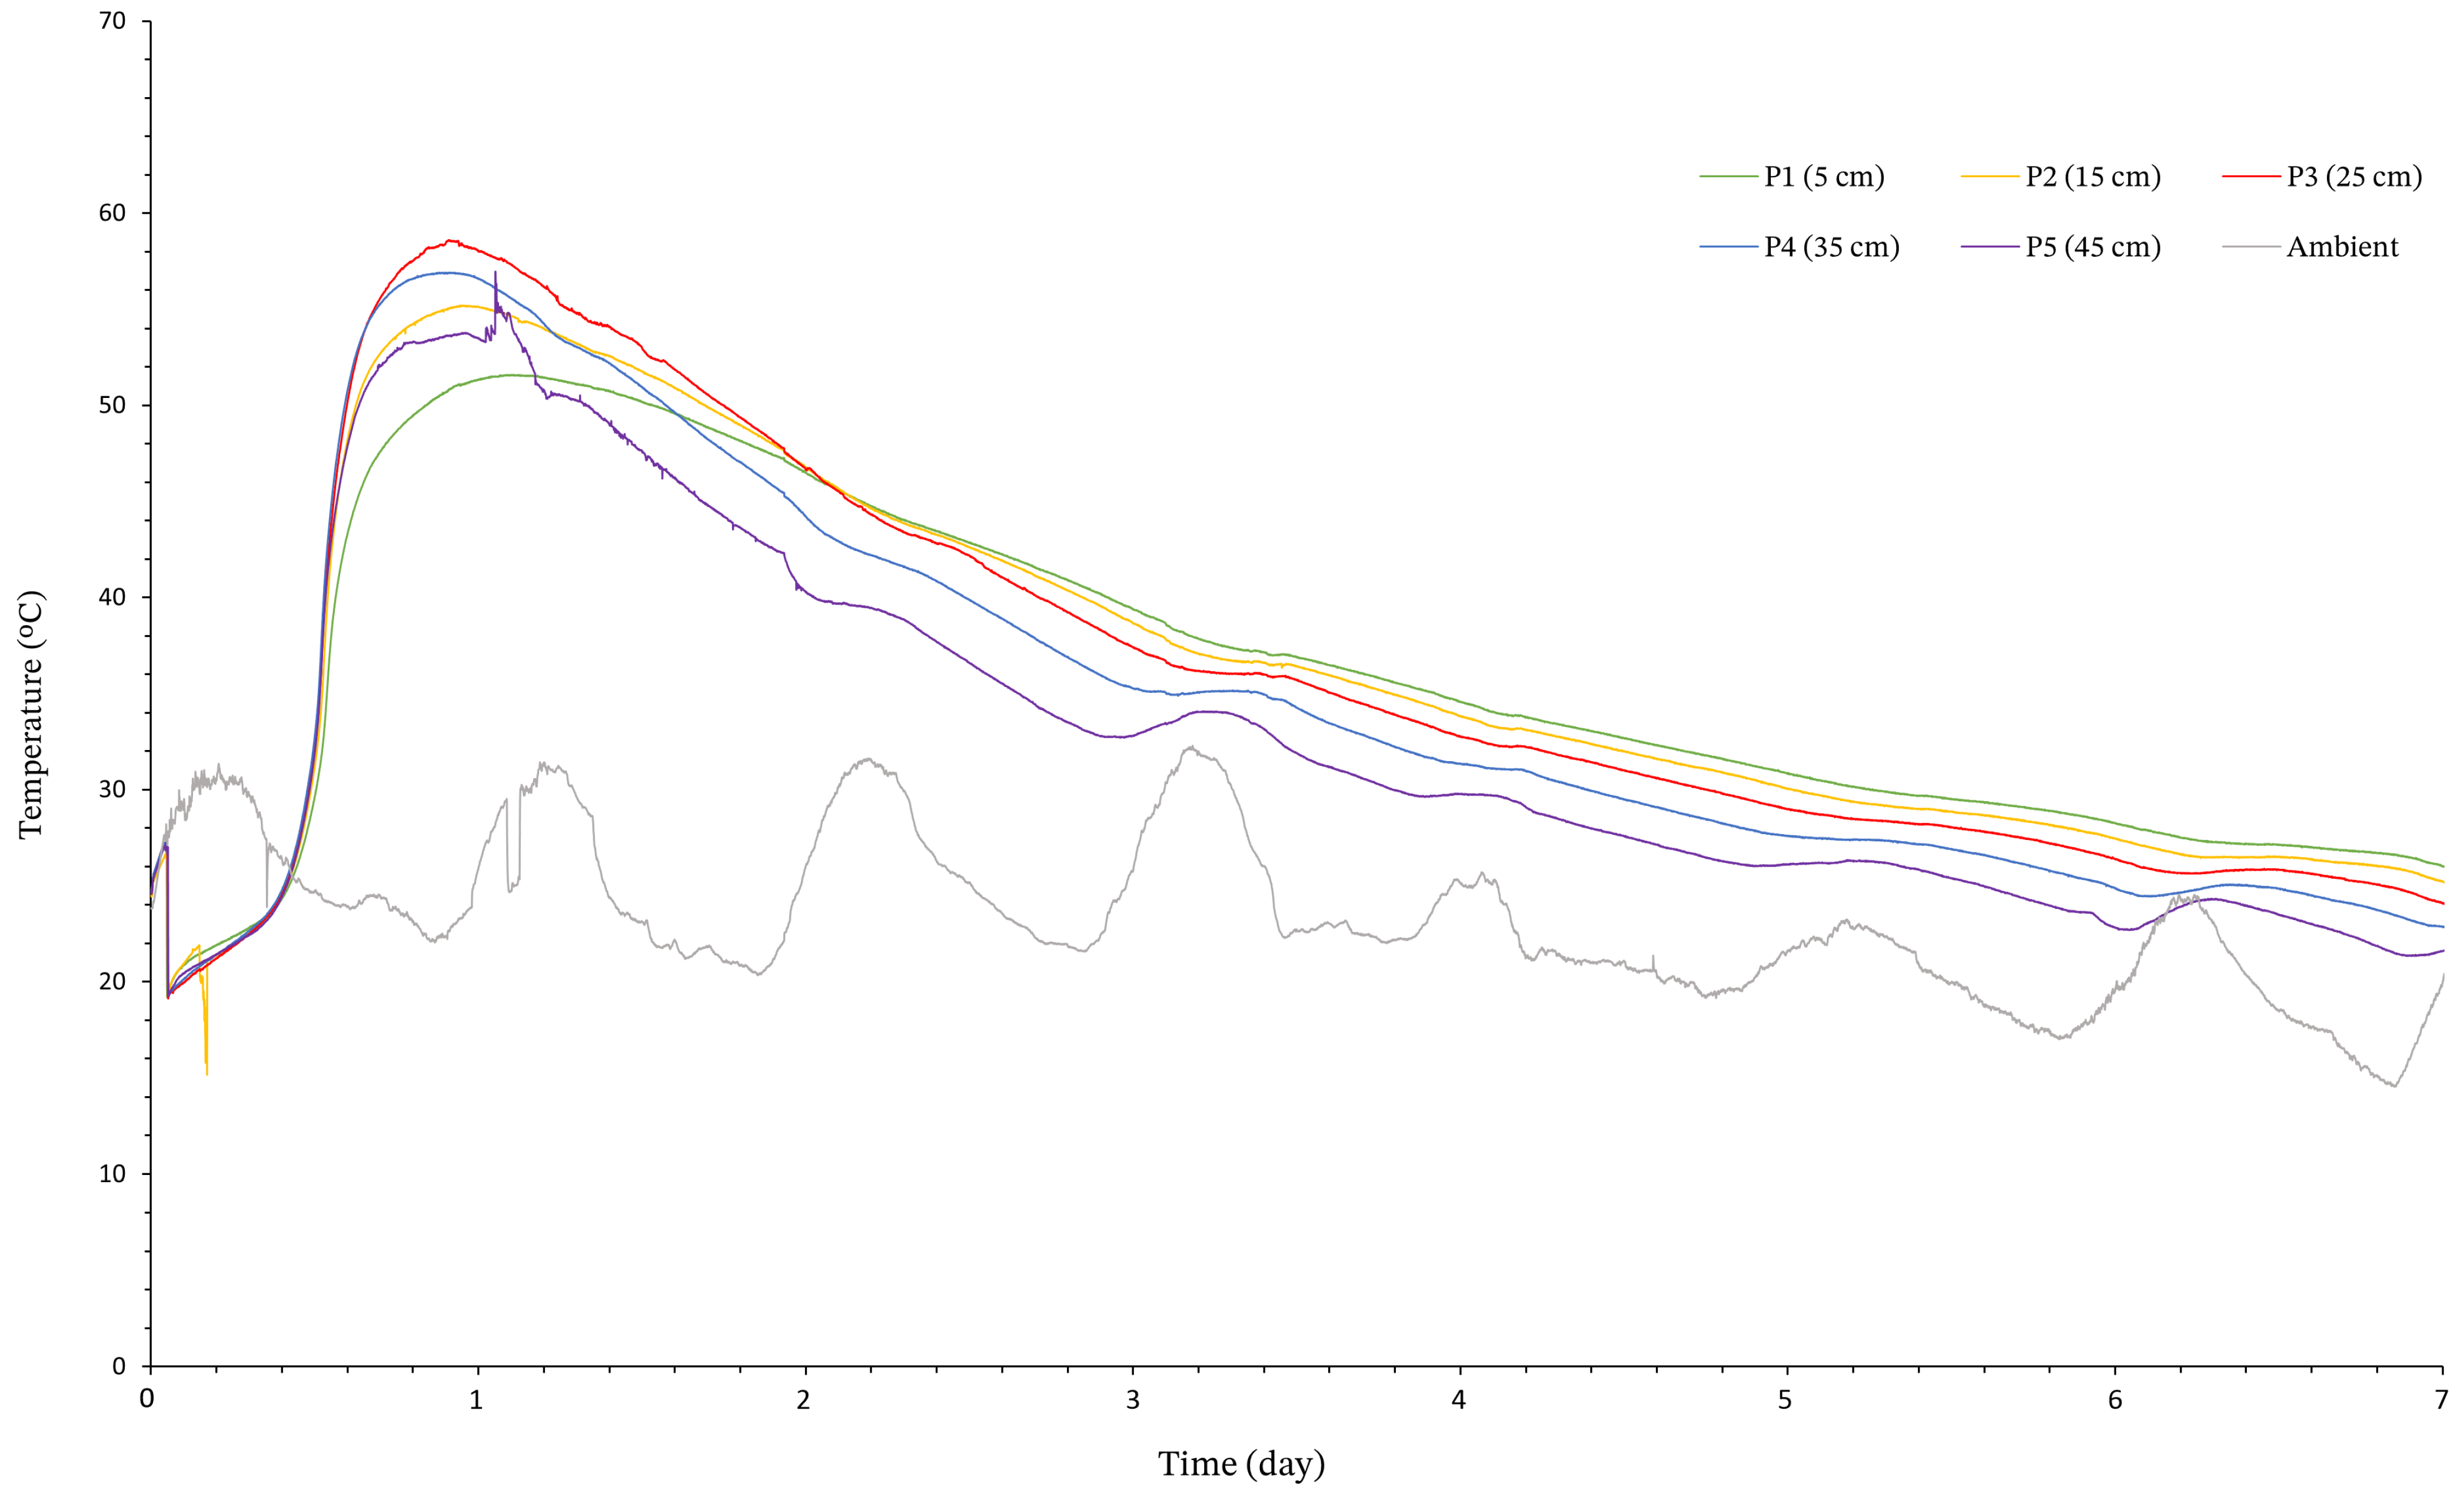
The temperatures measured during the experimental test were automatically obtained using the LYNX equipment from COPPE/LABEST and performed by FURNAS/Eletrobras. Temperatures were recorded at the center and edge of the slab, with thermometers at variable heights, as shown in Figure 11, where 0 corresponds to the base of the slab and 50 cm to the top, in the boundary.
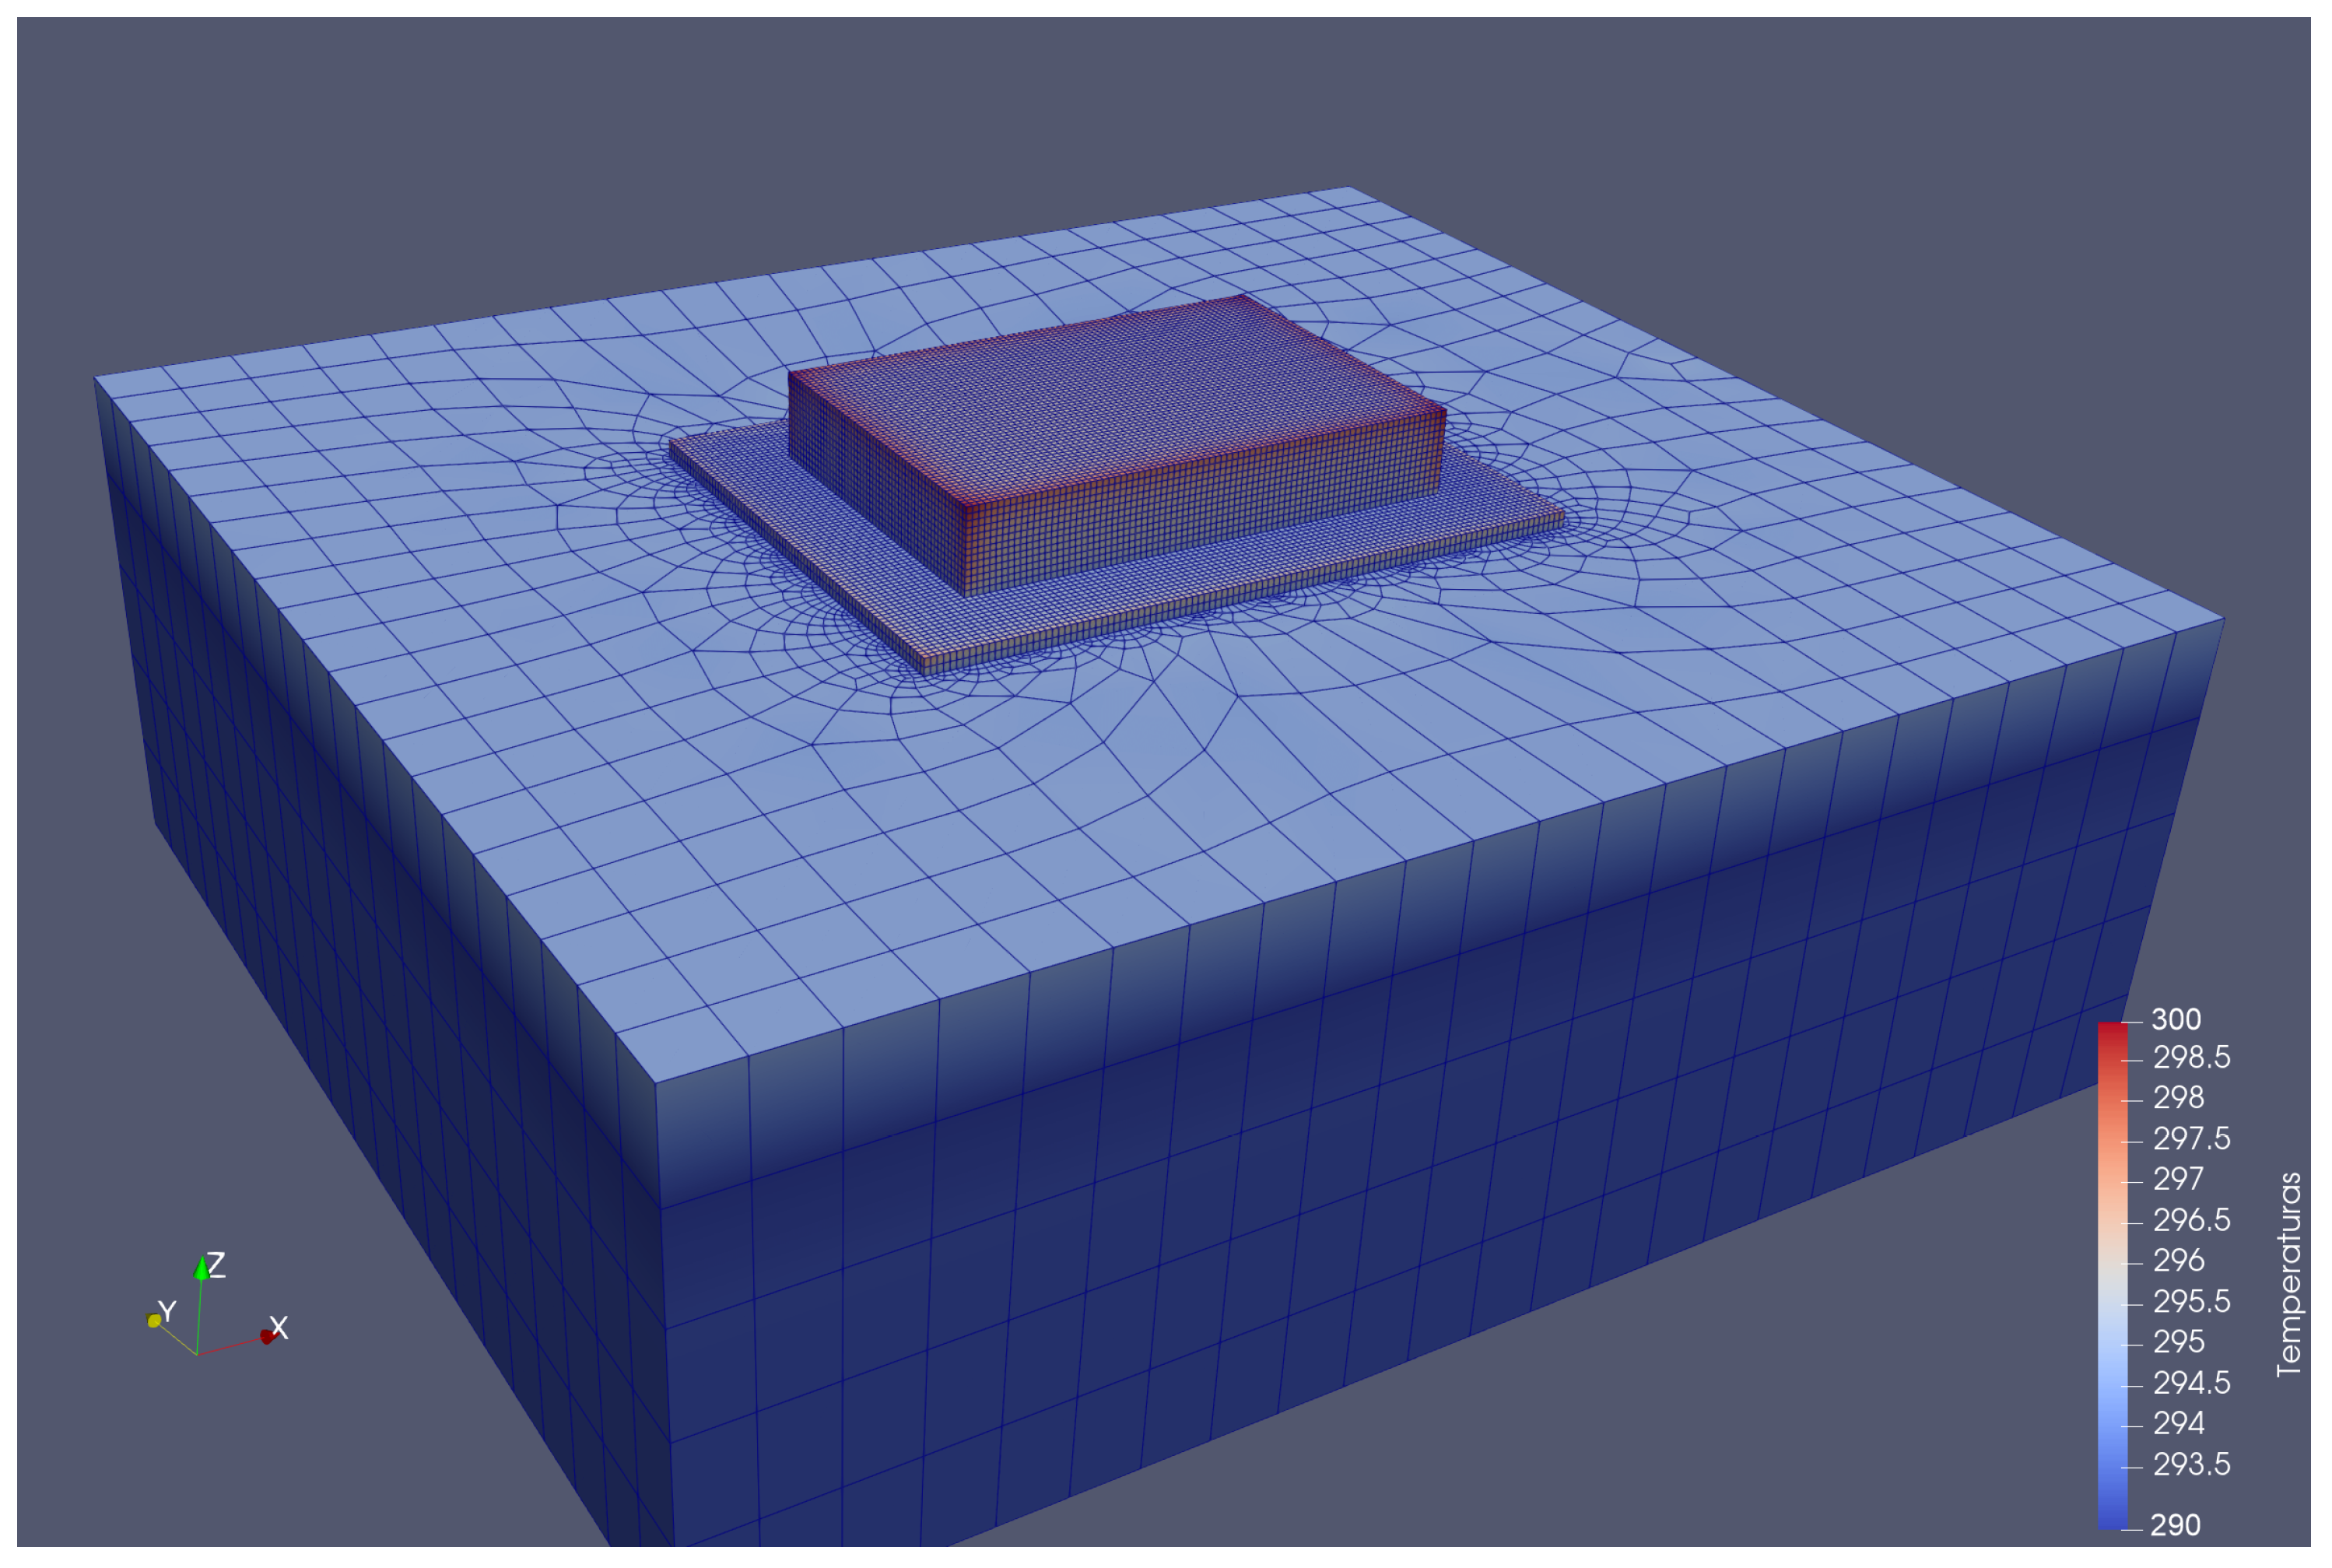
Figure 12 presents the geometry used for the numerical simulation of the slab. Three different materials were considered, with different thermal and mechanical properties: the soil, the concrete base, and the concrete of the slab itself. Material properties are shown in Table 1.
In the thermal analysis for the external surfaces of concrete and rock, heat exchange by convection was considered with a surface coefficient (h = 10 W m−2 K−1) and ambient temperature according to field measurements.
As a criterion for validating the developed numerical model, the temperature rise in the central node of the structure was compared with the built slab. The meshes of both simulations are defined by 145,380 nodes and 132,225 hexahedral elements, as shown in Figure 12.
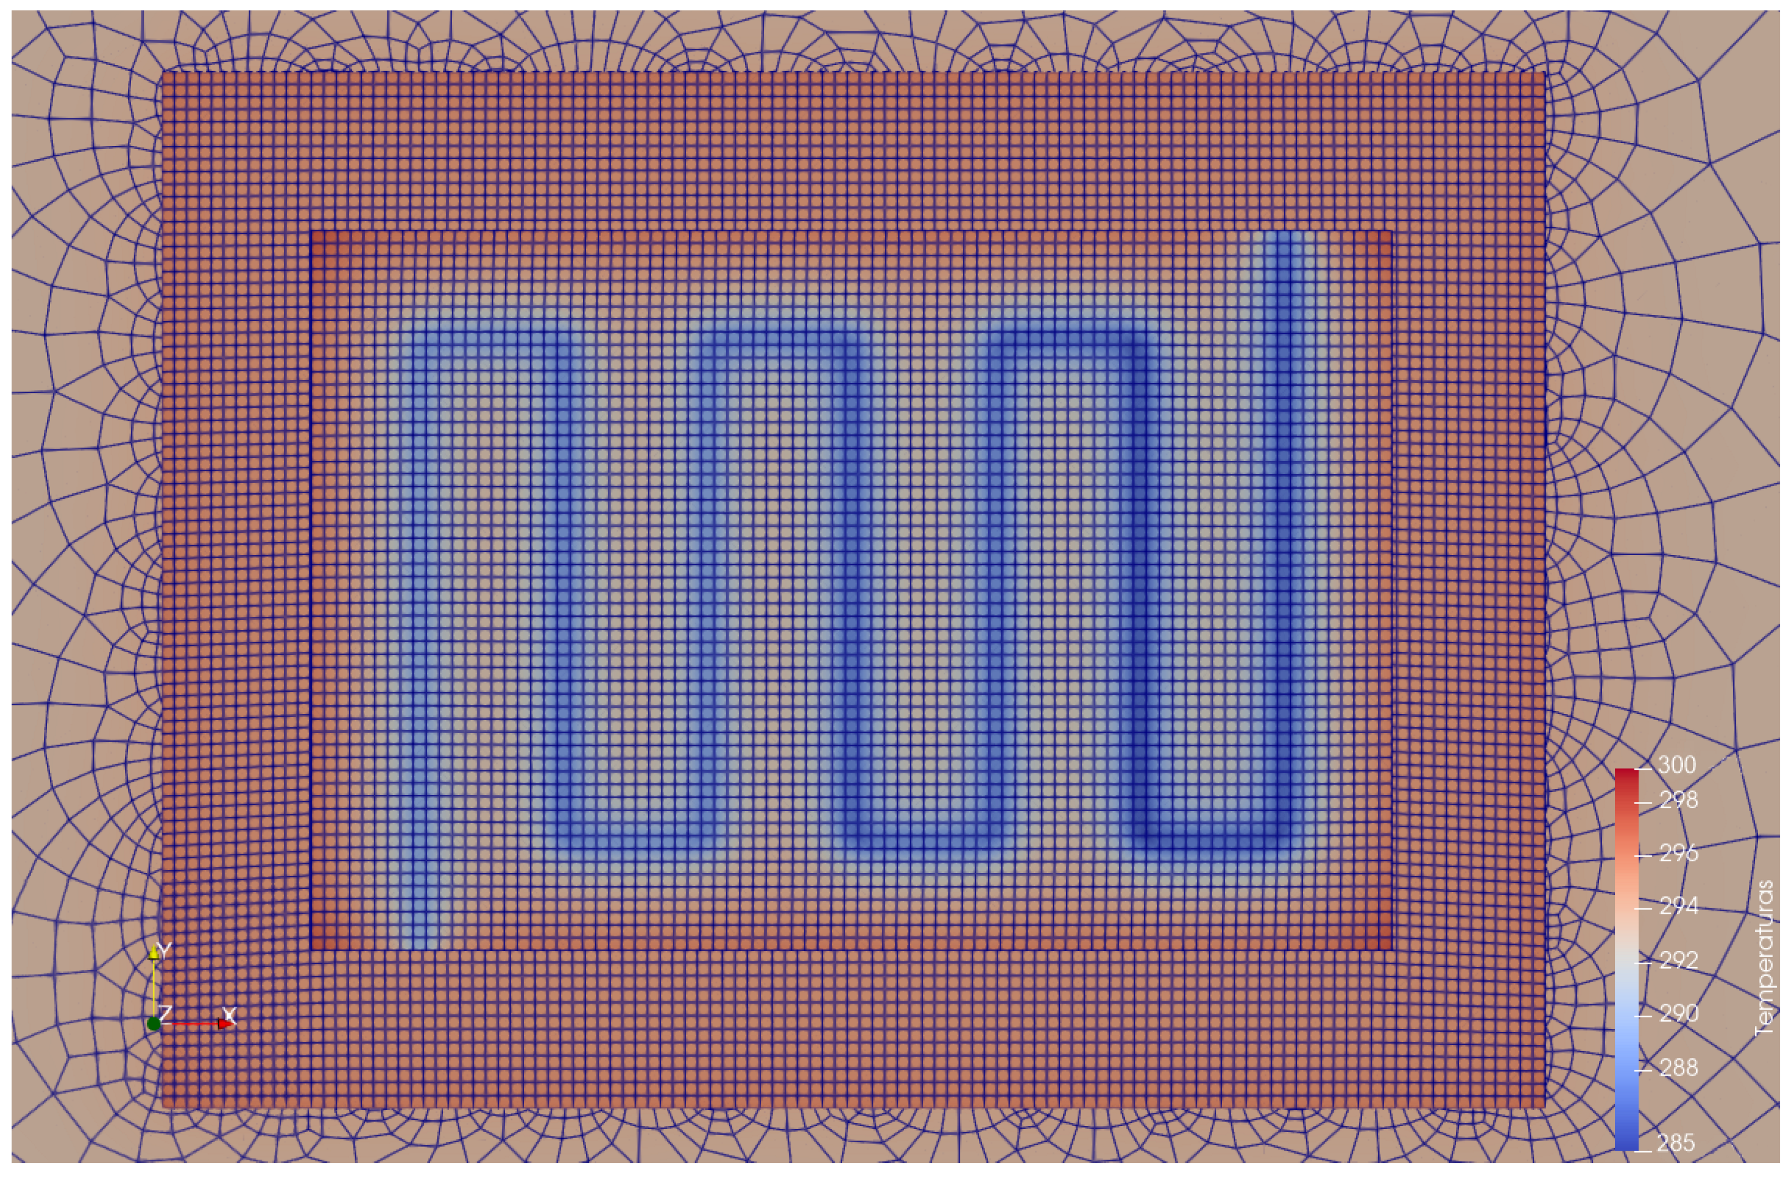
After this procedure, the temperature increase in the model was simulated by employing the post-cooling system, with the initial concrete conditions set as T c 0 , 1 = T c 0 , n = 293 K. The inlet cooling water temperature remains constant at T w 0 , 1 = 283 K throughout the entire simulation, and 356 contiguous elements were activated for the pipeline simulation.
The selected pipe spacing was 50 cm, maintaining a minimum clearance of 25 cm from the pipe to the external surface. The positioning was at the middle height of the slab at 25 cm, as shown in Figure 13.
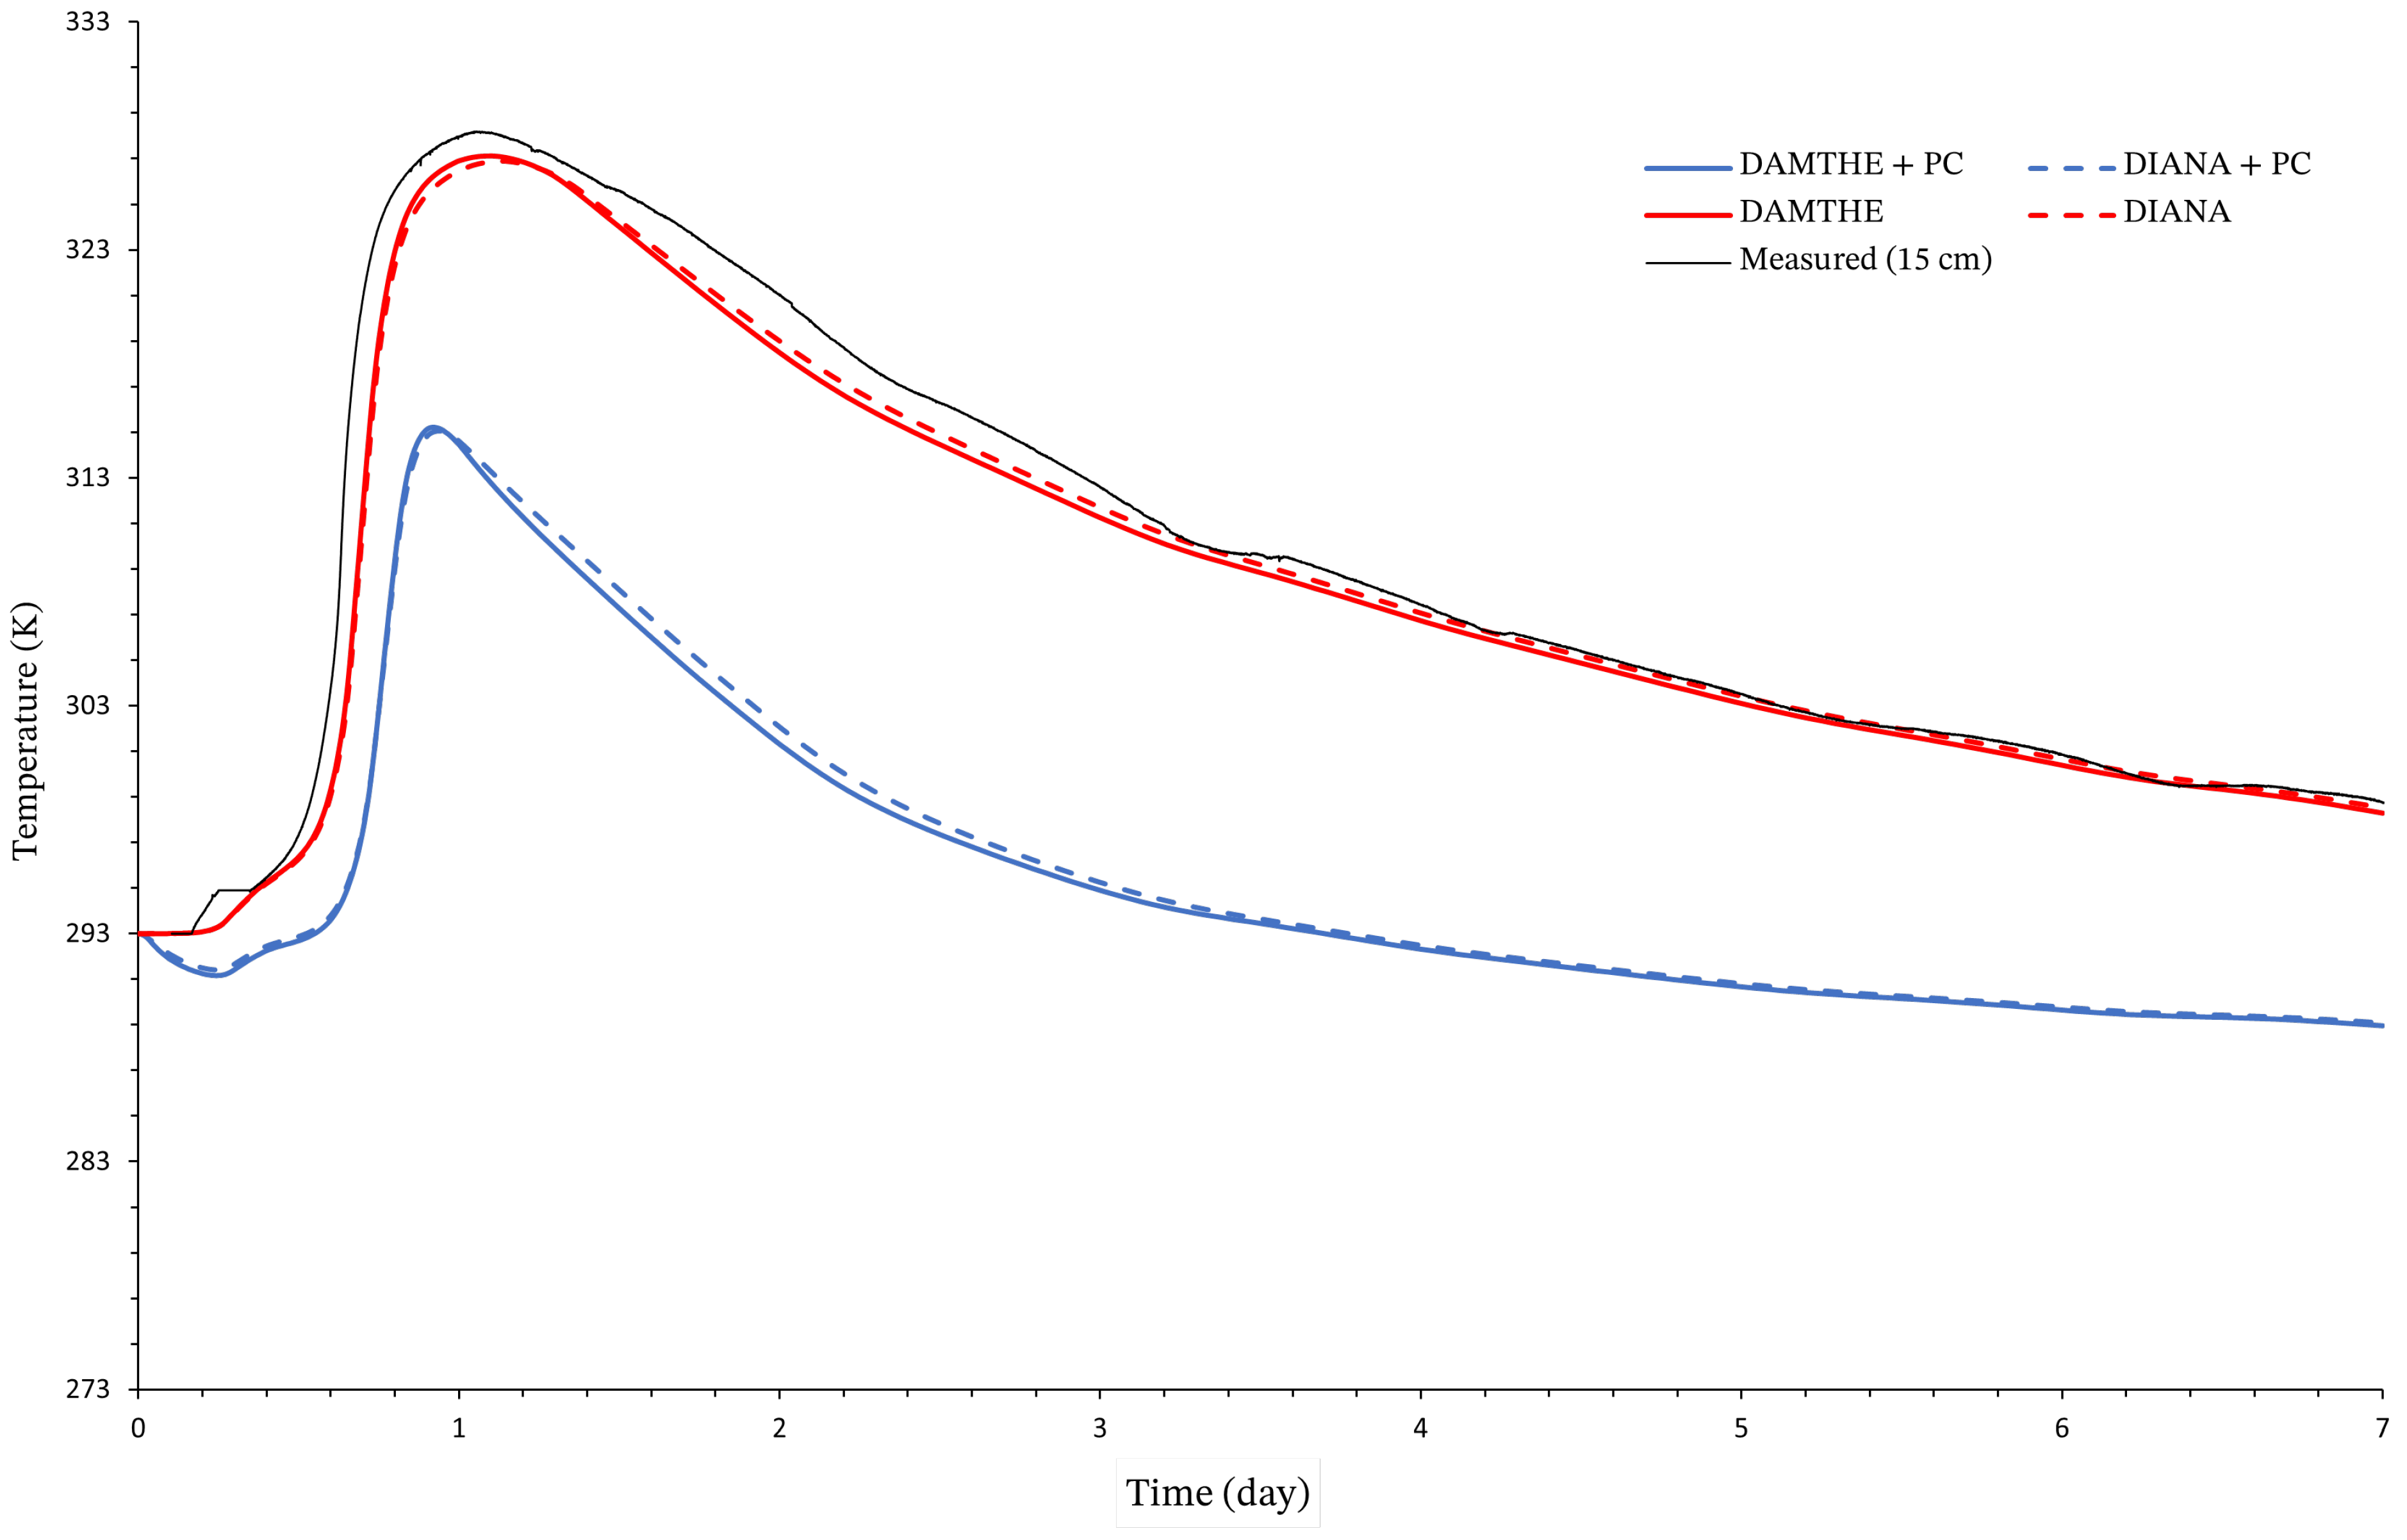
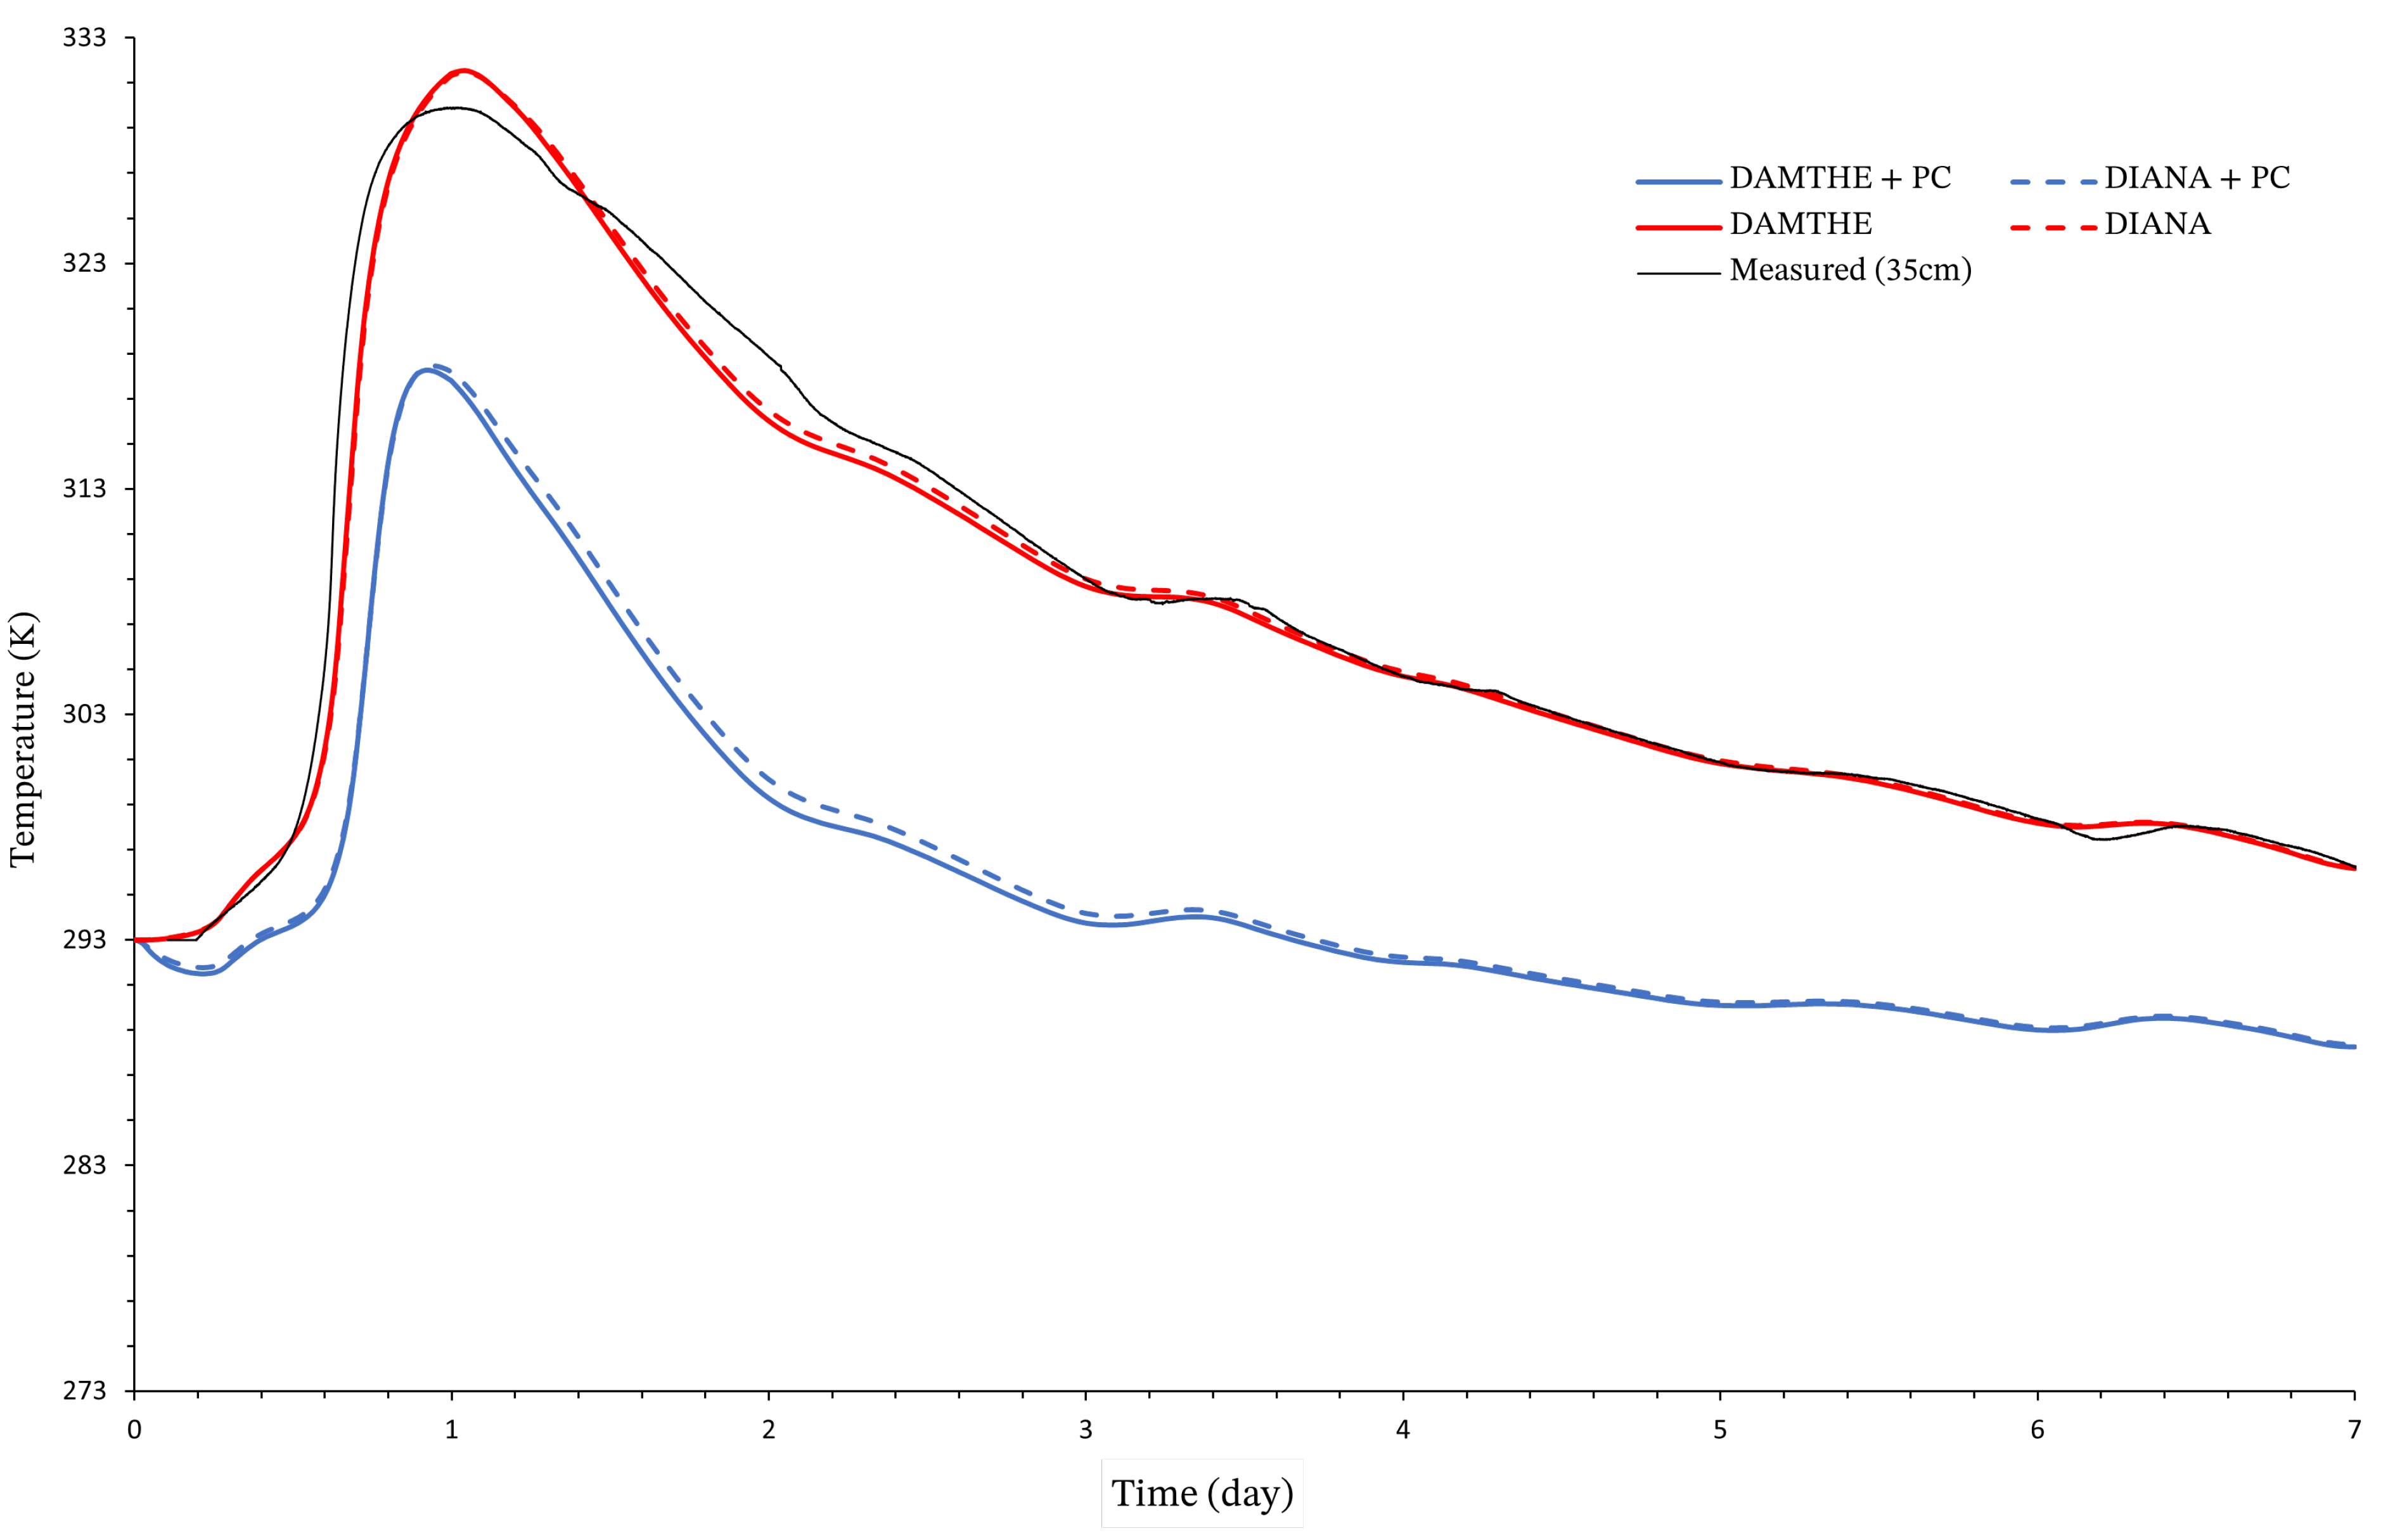
Figure 14, Figure 15 and Figure 16 presents the temperature results obtained by the proposed model compared with the temperature data obtained by DIANA FEA to post-cooling system. In addition, the temperatures of the simulation without the post-cooling system were also presented for both software and compared with the experimental data to validate the mesh and the thermochemical simulated parameters. It is possible to verify that both results show similar behavior.
In this study, the same time-stepping scheme was adopted for both models to ensure a straightforward comparison of the results. In this sense, the calculation (CPU) time required by DIANA FEA 2.0 was 7.75 times greater than the DAMTHE 2.0.

4. Sensitivity and Convergence Analysis

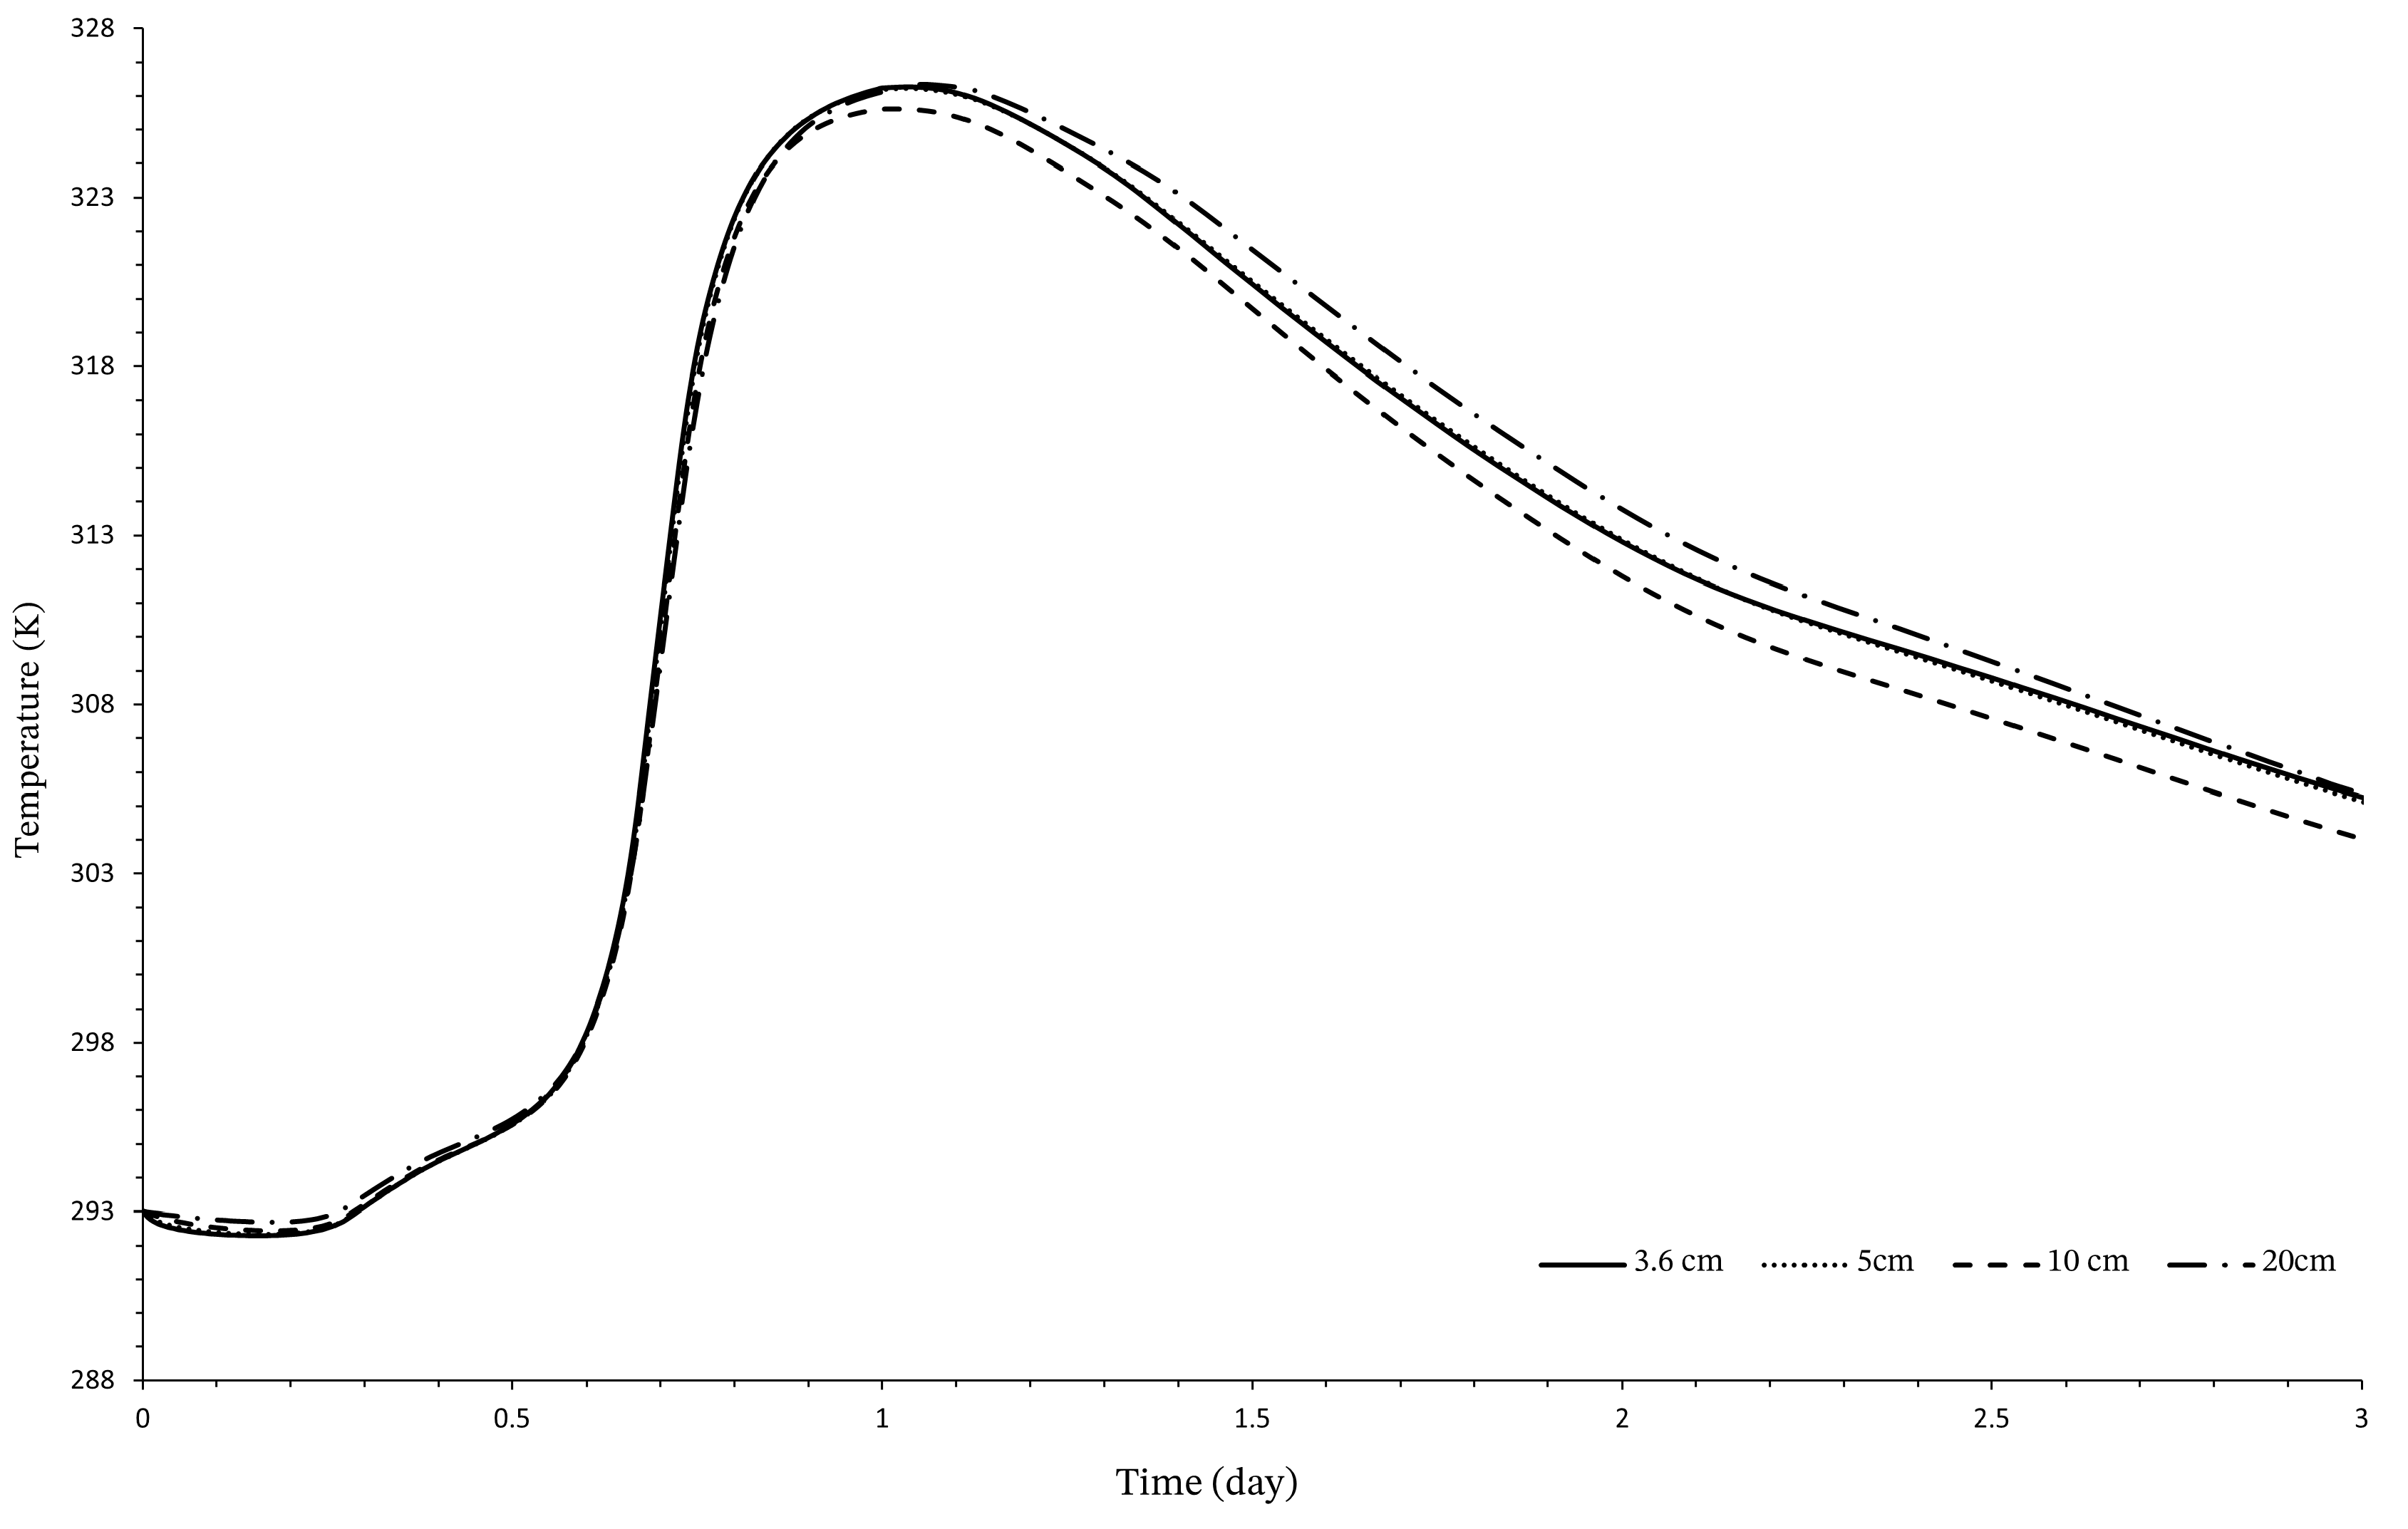
To assess the model’s sensitivity to mesh element sizes and verify the convergence of the finite element solution, a mesh analysis was performed on the validation example using element sizes of 3.6 cm, 5 cm, 10 cm, and 20 cm. The simulations were performed with consistent material properties and boundary conditions across all mesh sizes to ensure comparability as shown in Table 2.
The parameter h ¯ p c is dependent on the element size, as shown in Equation (28), therefore ensuring the objectivity of the model. In all simulations, the thermal conductivities of the materials, λ w , λ t and λ c , were 0.61 W/m K, 60 W/m K, and 1.56 W/m K, respectively. The results, presented in Figure 17, demonstrate that as the mesh is refined, the model’s predictions converge toward a stable solution, with the 20 cm mesh already providing an acceptable solution.

5. Case Study: Construction of Water Intake Structure Pillar of a Hydroelectric Power Plant

5.1. Layered Construction

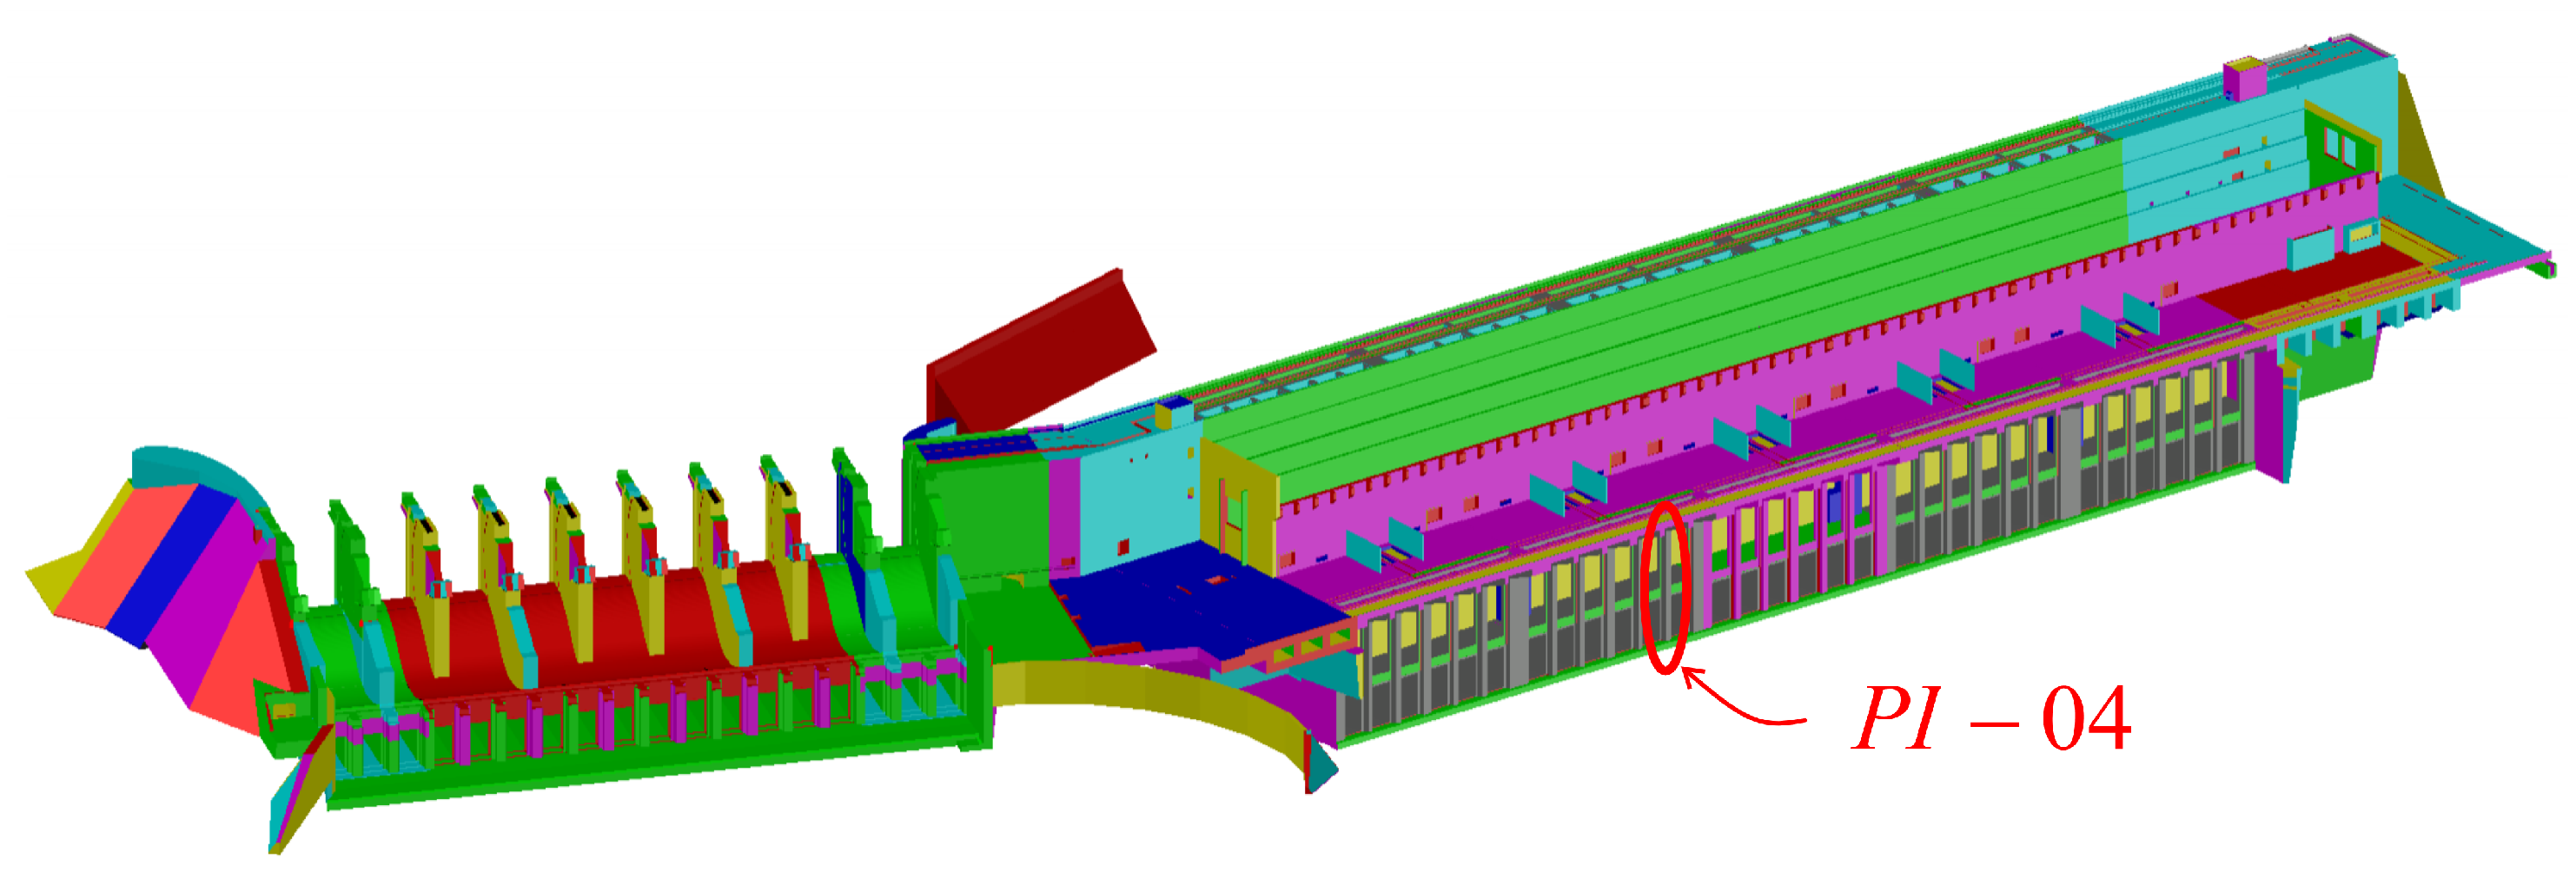
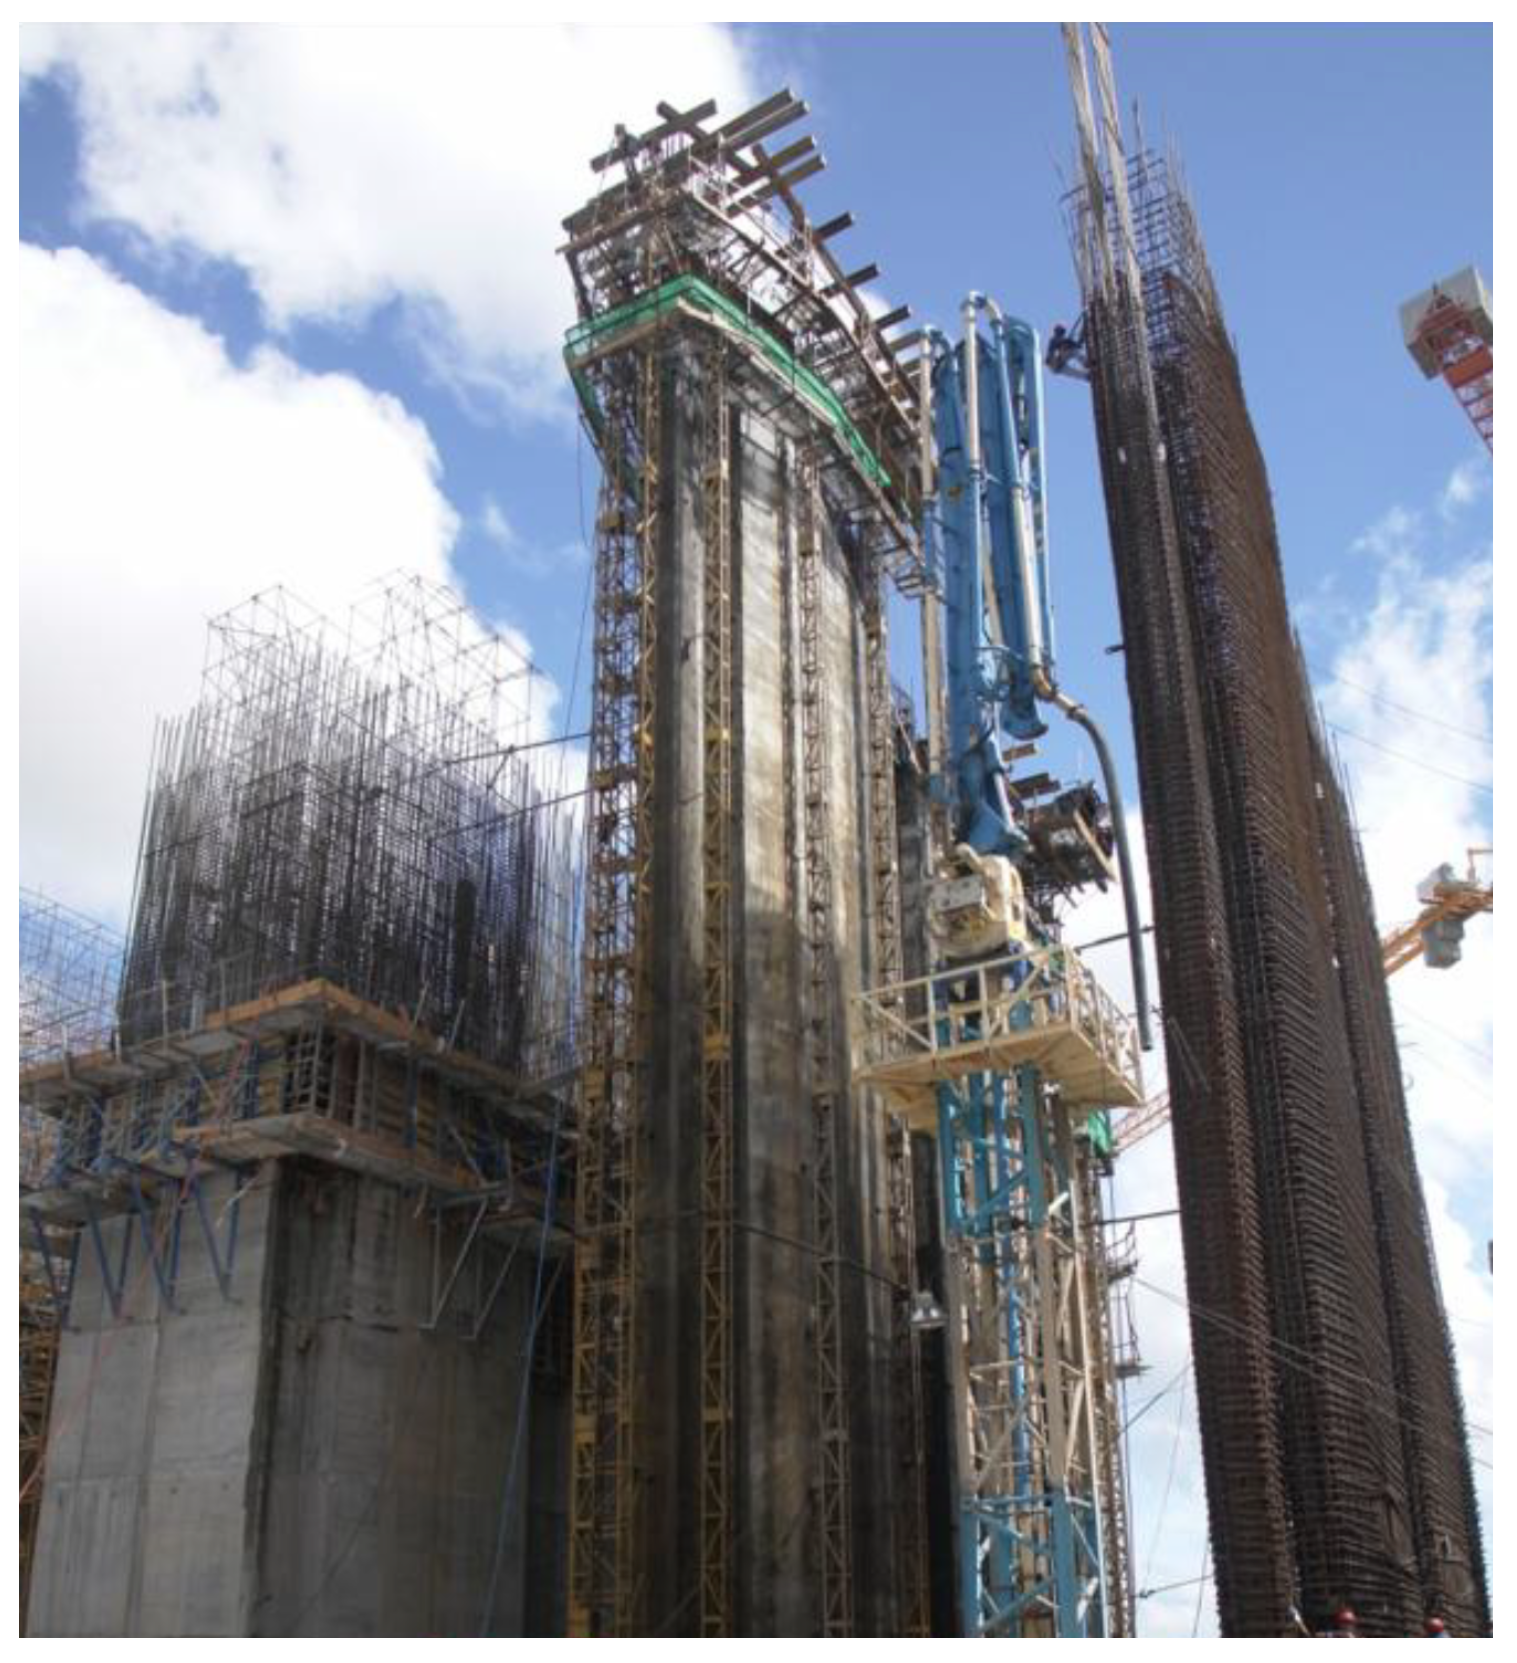
The numerical approach proposed here was implemented for the analysis of the construction of the water intake structure pillar, designated as PI-04, as shown in Figure 18 and Figure 19, as part of a significant 2160 MW hydropower plant construction in Venezuela. This project, referred to as the “Manuel Piar Project” or “Tocoma Project”, represents the most recent development along the Lower Caroni River.
As detailed in Arreaza [41], the initial project was conceived with the idea of employing scaffolding utilizing conventional climbing formwork techniques, typically constructed from wood or metal, with a height of 1.5 m. Although this approach proved viable in certain areas, challenges emerged when applying the conventional climbing formwork system to structures requiring a significant height. Additionally, the uniform geometry of the massive structure’s pillars necessitated frequent interruptions every 1.5 m (or in some cases 3 m) to assemble a new segment identical to the previous one. This, coupled with routine repairs and joint treatments, hindered the continuous progress of the work within the designated timelines.
Hence, the construction site team, in collaboration with the technical team and external consultants, assessed the adoption of the sliding formwork technique for continuous concreting [41]. This evaluation aimed to ensure the safety, cost-effectiveness, and timely completion of the project. Numerous technical-scientific studies were conducted to observe the thermochemical–mechanical behavior of the main structures of the Tocoma Hydroelectric Power Plant. Additionally, the use of the post-cooling system was explored as a technique to dissipate thermal stresses in the concrete during its hardening, enhancing the overall safety measures.
The implementation of the post-cooling system enabled a notable reduction in the construction duration for casting structures utilizing a sliding formwork. While the estimated time to complete the entire PI-04 structure with conventional formwork was 118 days, integrating sliding formwork alongside post-cooling to mitigate concrete cracking led to the successful assembly of the pillar within 35 days (inclusive of pre-assembly and formwork preparation). This achievement, reaching a height of 33.8 m, underscores the efficacy of the approach in expediting construction timelines.
Although the original construction costs without the post-cooling system are not available, the system’s implementation significantly reduced construction time, leading to substantial indirect financial benefits. The total cost of the post-cooling system, including materials, installation, and equipment (such as chillers and pumps), amounted to 82,000 USD, along with 3195 USD for materials and labor [41]. While the initial cost is notable, the time savings of approximately 70%, along with optimized labor and the prevention of thermal-related issues such as cracking, justify the investment, making the post-cooling system a highly efficient and cost-effective solution for large concrete structures.

5.2. Construction Parameters

The thermal properties of the material employed in the analyses were experimentally obtained. The assessment of the thermochemical behavior of the concrete during the construction phase of the analyzed pillar was conducted, considering continuous concreting with sliding forms at an estimated rate of 10 cm/h or prioritizing the time indicated in the thermocouple report. The pouring temperatures adopted ranged between 283 K and 288 K in accordance with the thermocouple report. The concrete cooling system, implemented through two pipes at heights of 0.80 m and 2.00 m from the foundation, is initiated when the concrete reaches a temperature of 293 K at the respective thermocouple, with a flow rate ranging from 15 to 17 L/min.
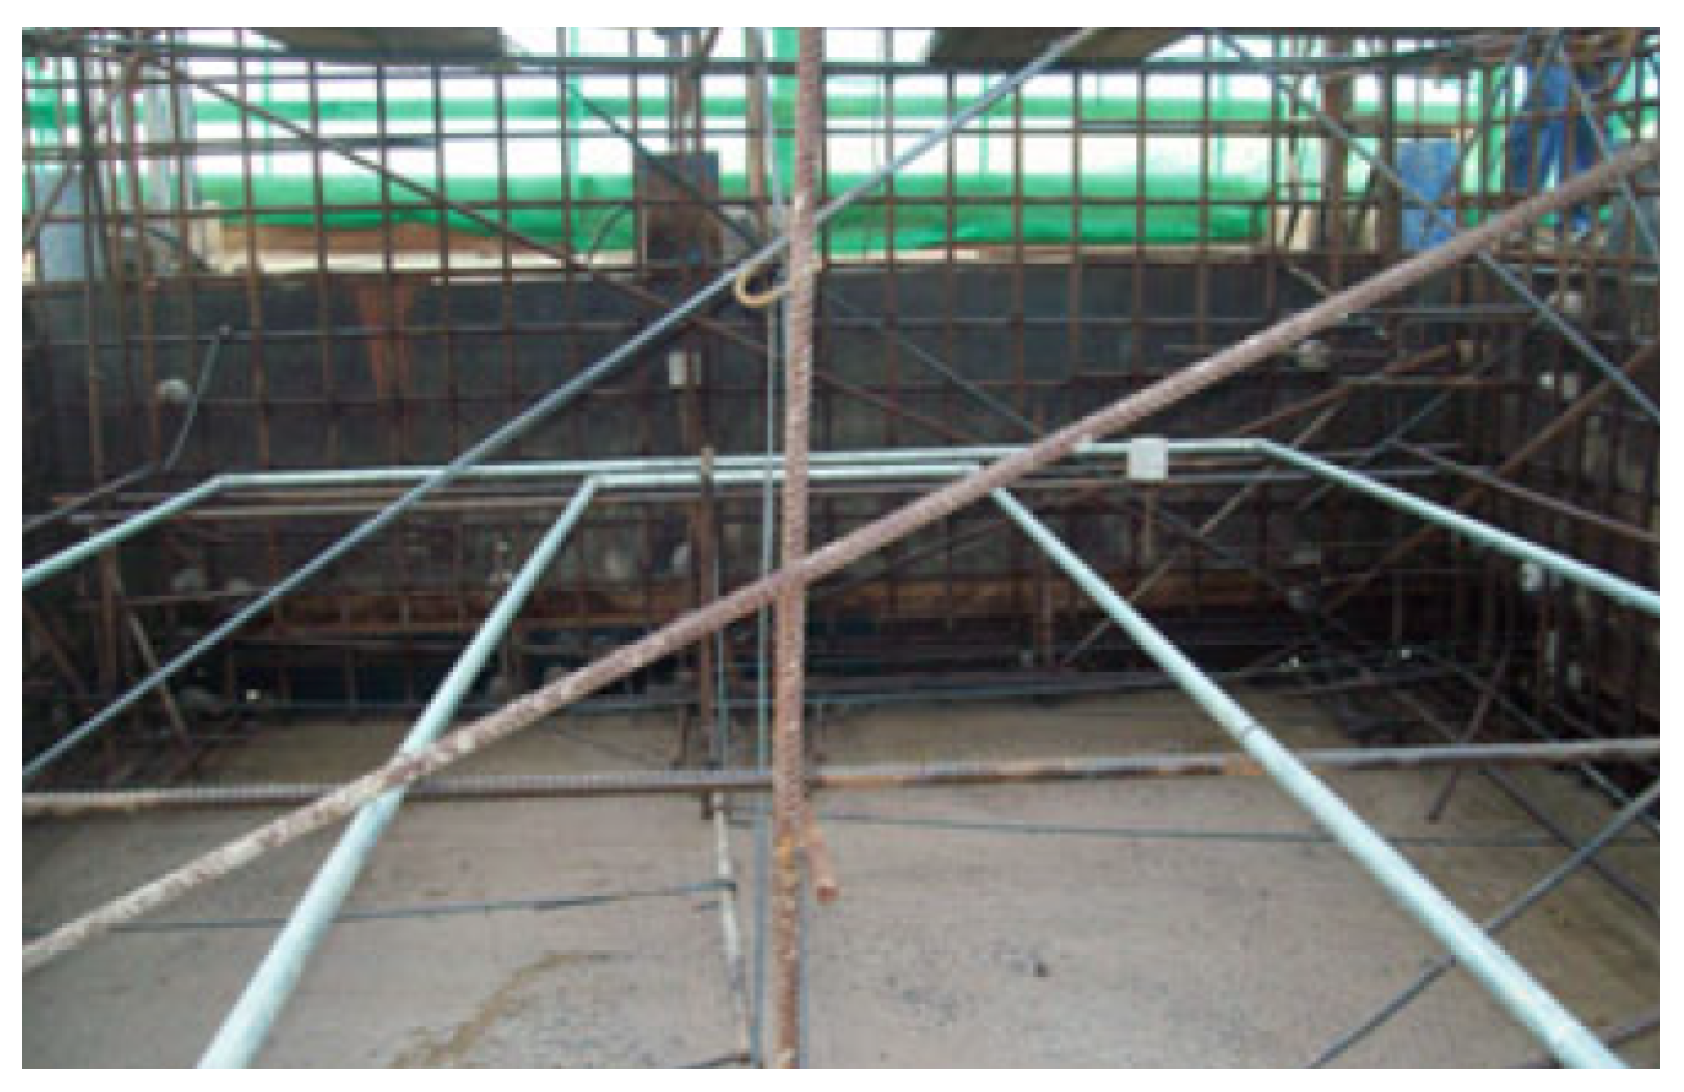
The coolant fluid utilized was water at a temperature of 285 K, flowing through threaded pipes made of galvanized carbon steel, with a diameter of 1 inch (0.0254 m), as shown in Figure 20.
While the concrete structure includes steel reinforcement, the proportion of steel to the total volume of concrete in large structures such as gravity dams, including the Tocoma Hydroelectric Power Plant, is relatively small. The amount of reinforcement typically adheres to the minimum requirements established by local standards. This can give the impression of a significant amount of steel, but it is, in fact, minimal in relation to the concrete volume. As such, the steel mesh is not expected to significantly influence the thermal conductivity of the mass concrete. Studies such as those by Velasco [42] and Hilaire [43] have demonstrated that even with higher reinforcement percentages than those used in dams, the impact of reinforcement on the thermal properties of mass concrete is minimal. Therefore, the model reasonably assumes that the concrete behaves homogeneously with respect to its thermal properties.

5.3. Geometry and Mesh

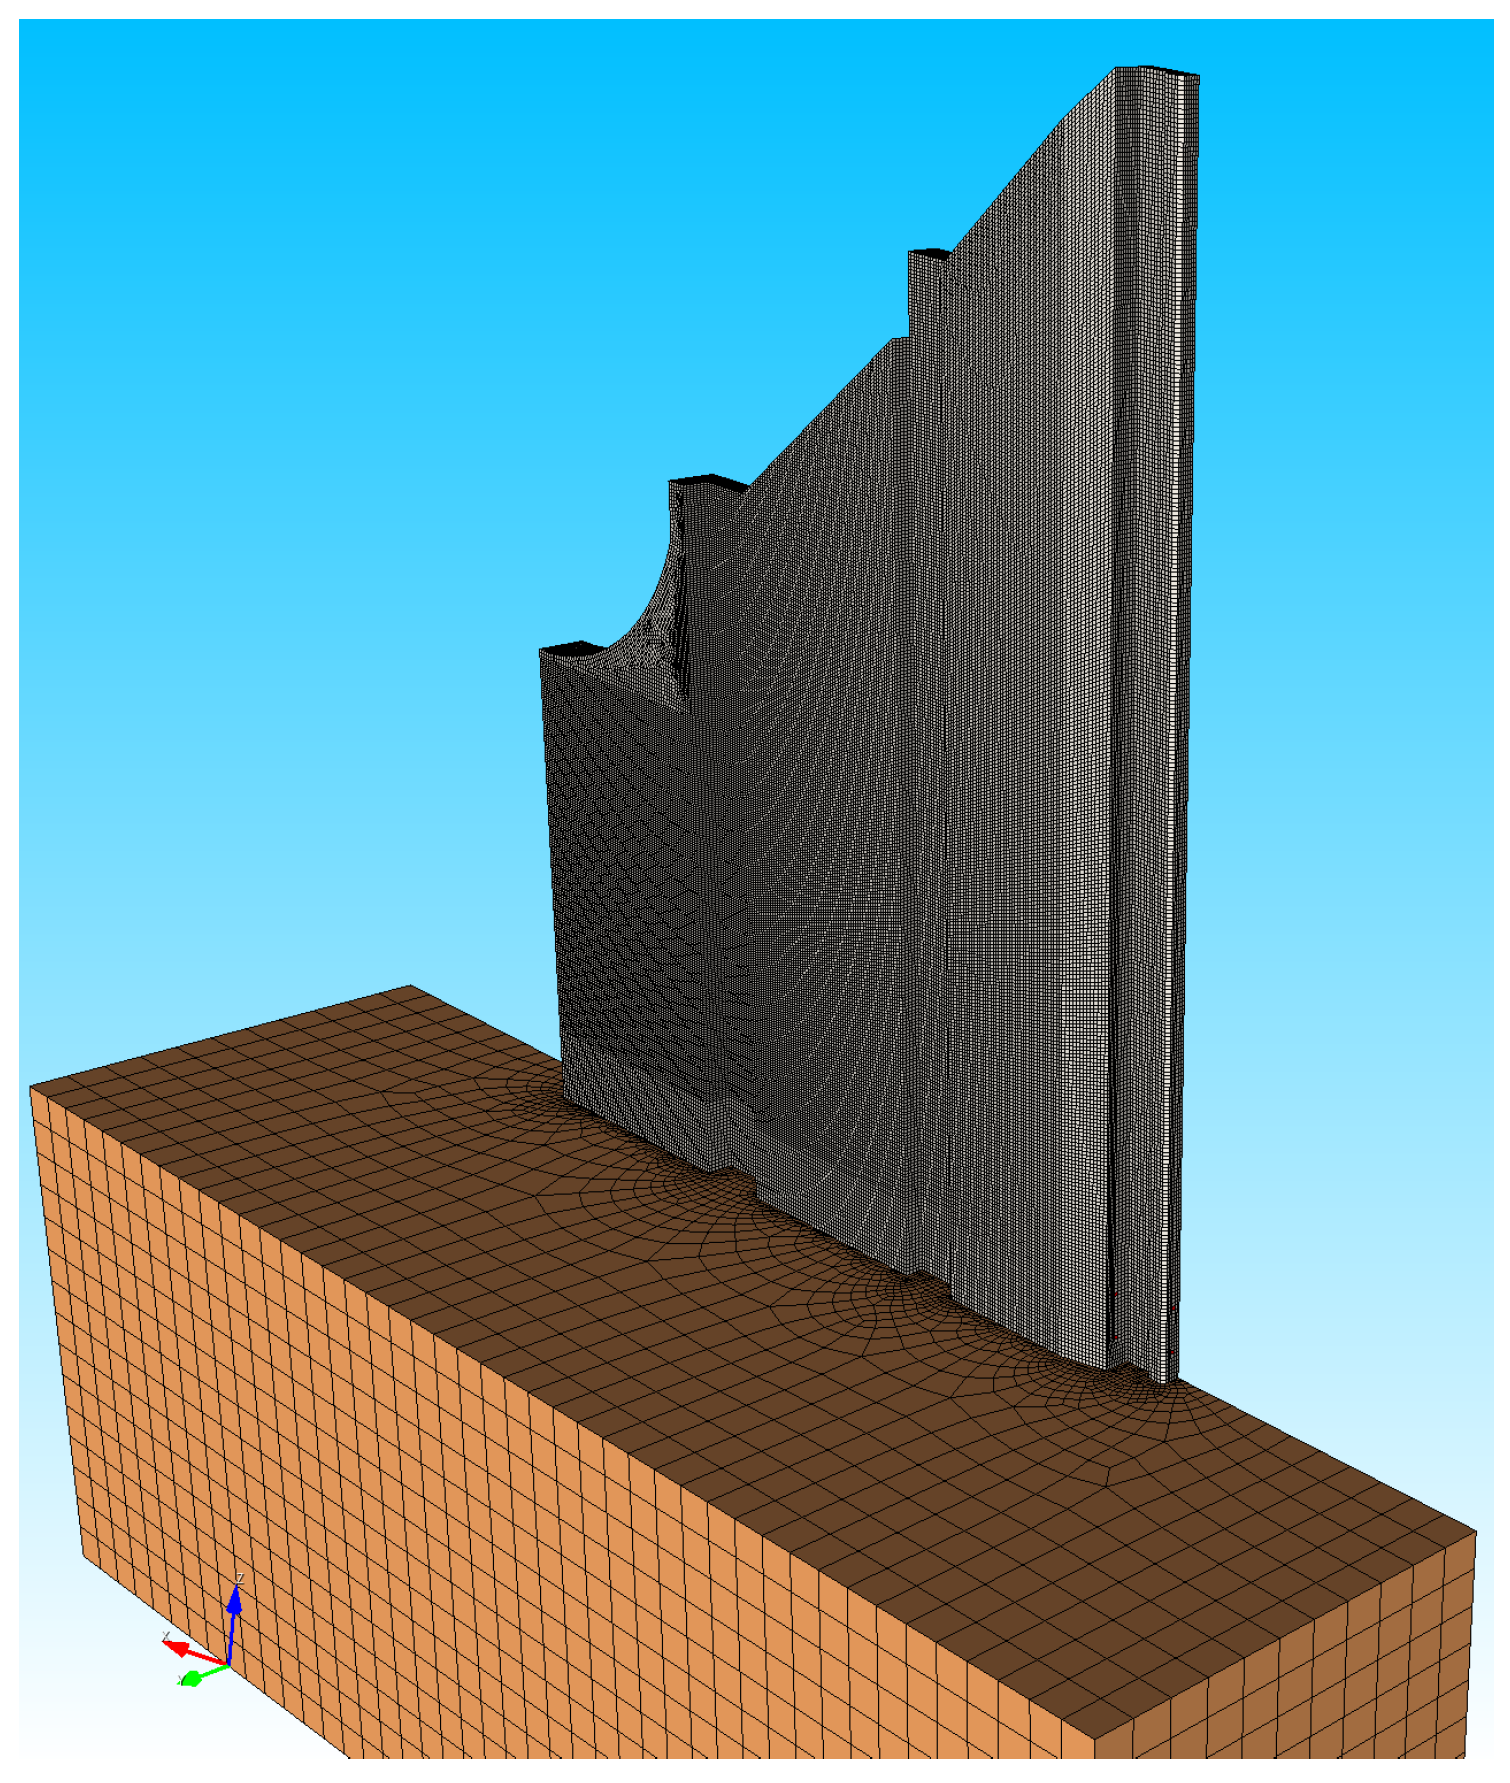
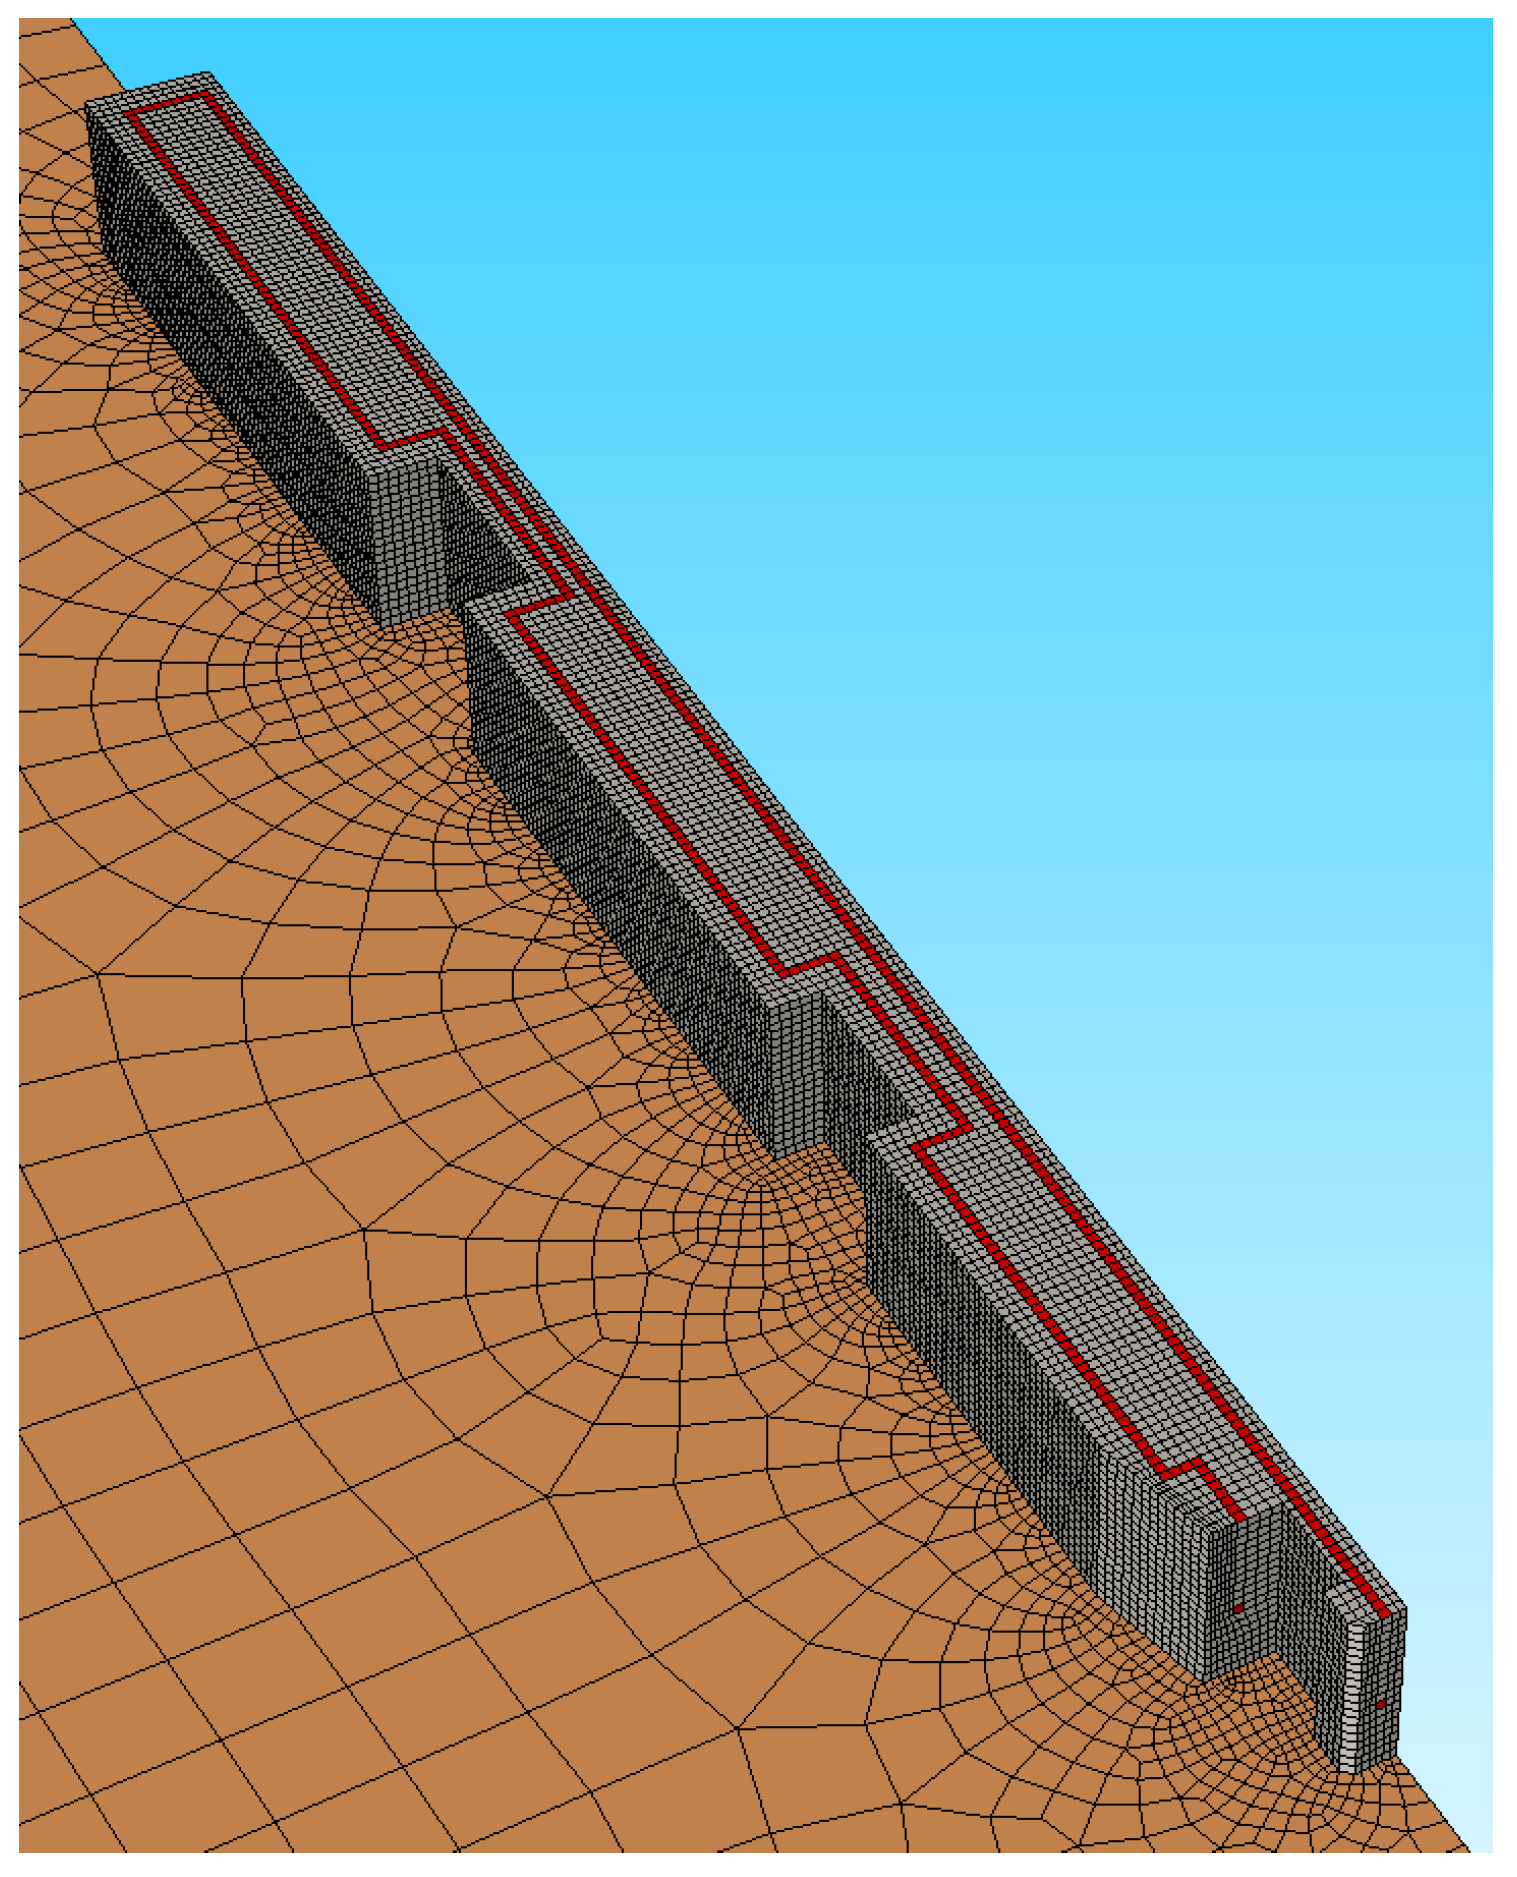
The analyzed structure has approximate dimensions of 2.6 m in width, 24.0 m in length, and 33.8 m in height, constructed over rock. Given these dimensions, the symmetry of the problem was taken into account, representing half of the pillar and the cooling system with a symmetry plane along its main axis, as illustrated in Figure 21 and Figure 22.
The simulation mesh consists of 970,560 nodes and 888,143 hexahedral elements, and the initial concrete temperature used was the in situ measurement, as shown in Figure 23.
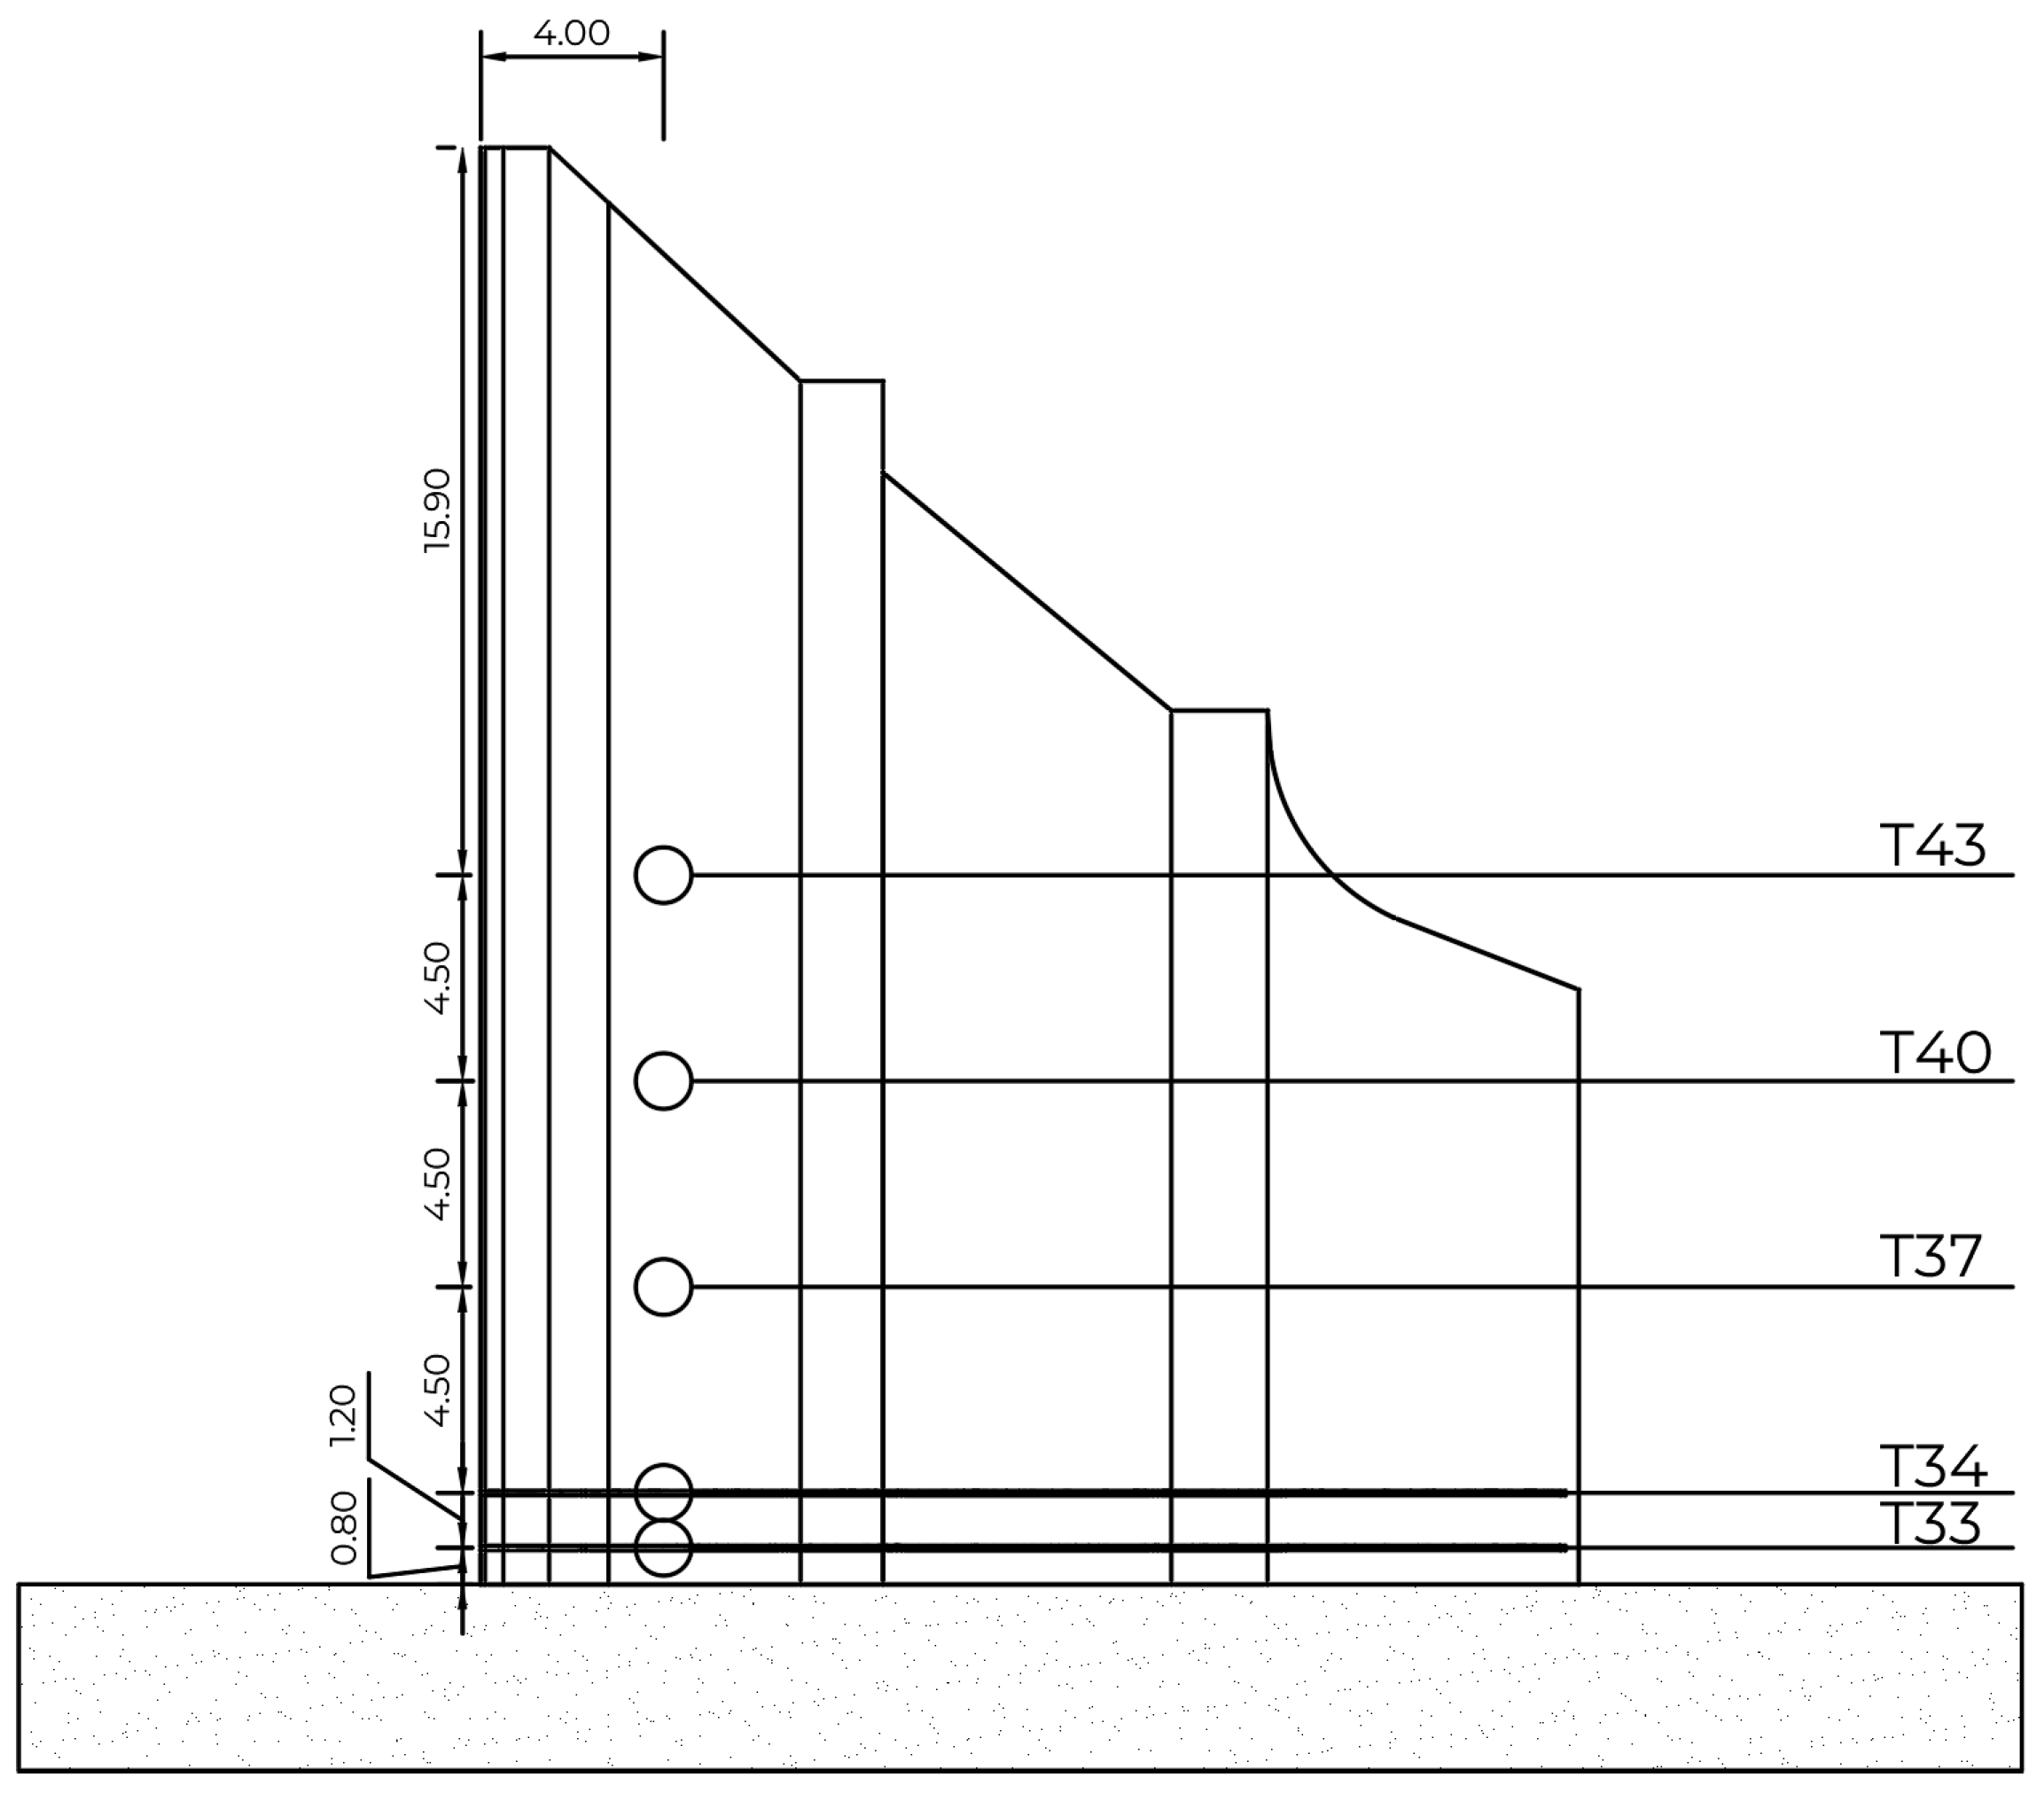
To streamline the presentation of results, control nodes were designated for the thermocouples installed at different heights during the construction of the pillar, as outlined in Table 3 and Figure 24.
The boundary conditions for the thermochemical problem involve external surfaces of concrete and the foundation in contact with the air or bounded by forms, treated as convection with a surface exchange coefficient ( h = 11.0 W / ( m 2 K ) ). Additionally, concrete and foundation surfaces resulting from the virtual cut are treated as adiabatic walls.
The ambient temperature was considered according to the evolution of the temperature measured in the field during the casting and curing of the PI-04 pillar, as shown in Figure 23.

5.4. Material Properties

For characterization purposes, the concrete has a compressive strength of 28 MPa, comprising 230 kg/m3 of cement, 13 kg/m3 of silica fume, 1226 kg/m3 of coarse aggregate, 560 kg/m3 of fine aggregate, and 156 kg/m3 of water.
To determine the adiabatic temperature rise curve of the concrete, a reverse analysis was conducted using temperature measurements obtained from the instrumentation of the PI-04, accompanied by local environmental temperature measurements. The selected thermocouple was positioned at a height of 6.5 m in the structure (TP-37). As demonstrated by Fairbairn et al. [23], this height was chosen because it was deemed sufficiently distant from the cooling tubes, minimizing their interference in the temperature rise. These temperatures were recorded during and after the continuous casting of the pillar and modeled using a function known as the Hill function, defined by Equation (35) presented below.
T ( t ) = T t n k n + t n
where k = 1.35 , n = 2.80 , T o = 283 K, and T = 316.5 K.
The other material properties are listed in Table 4.

5.5. Results

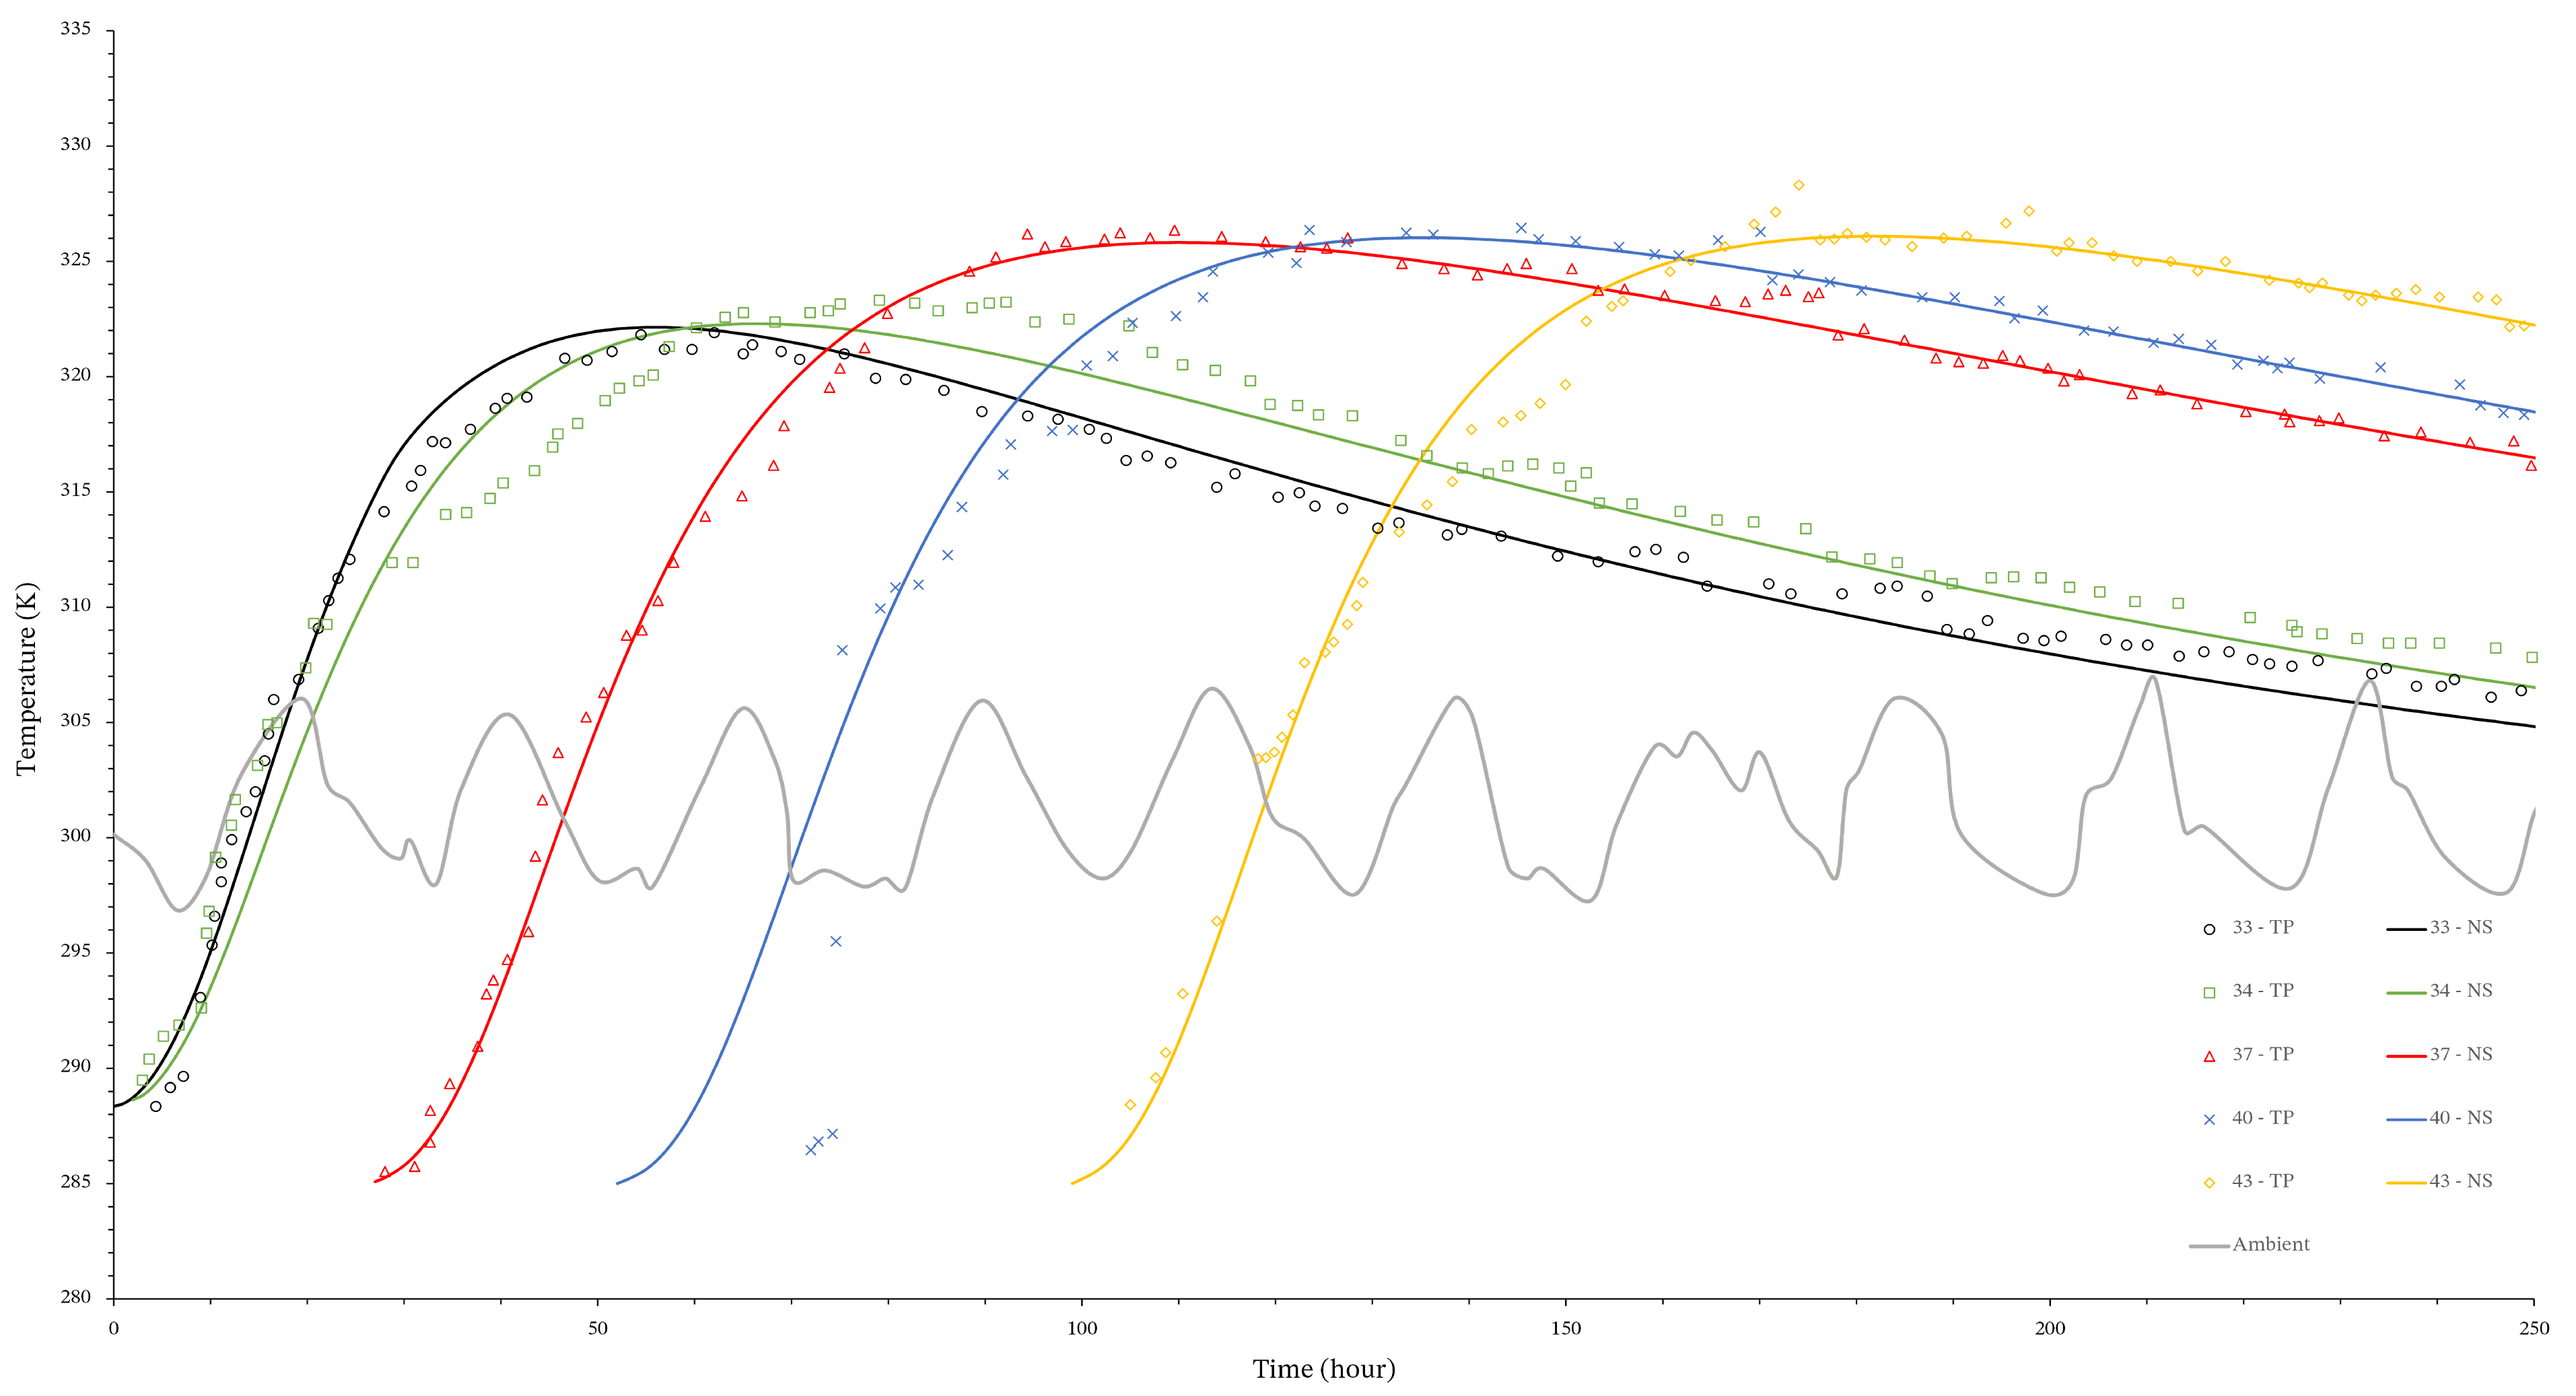
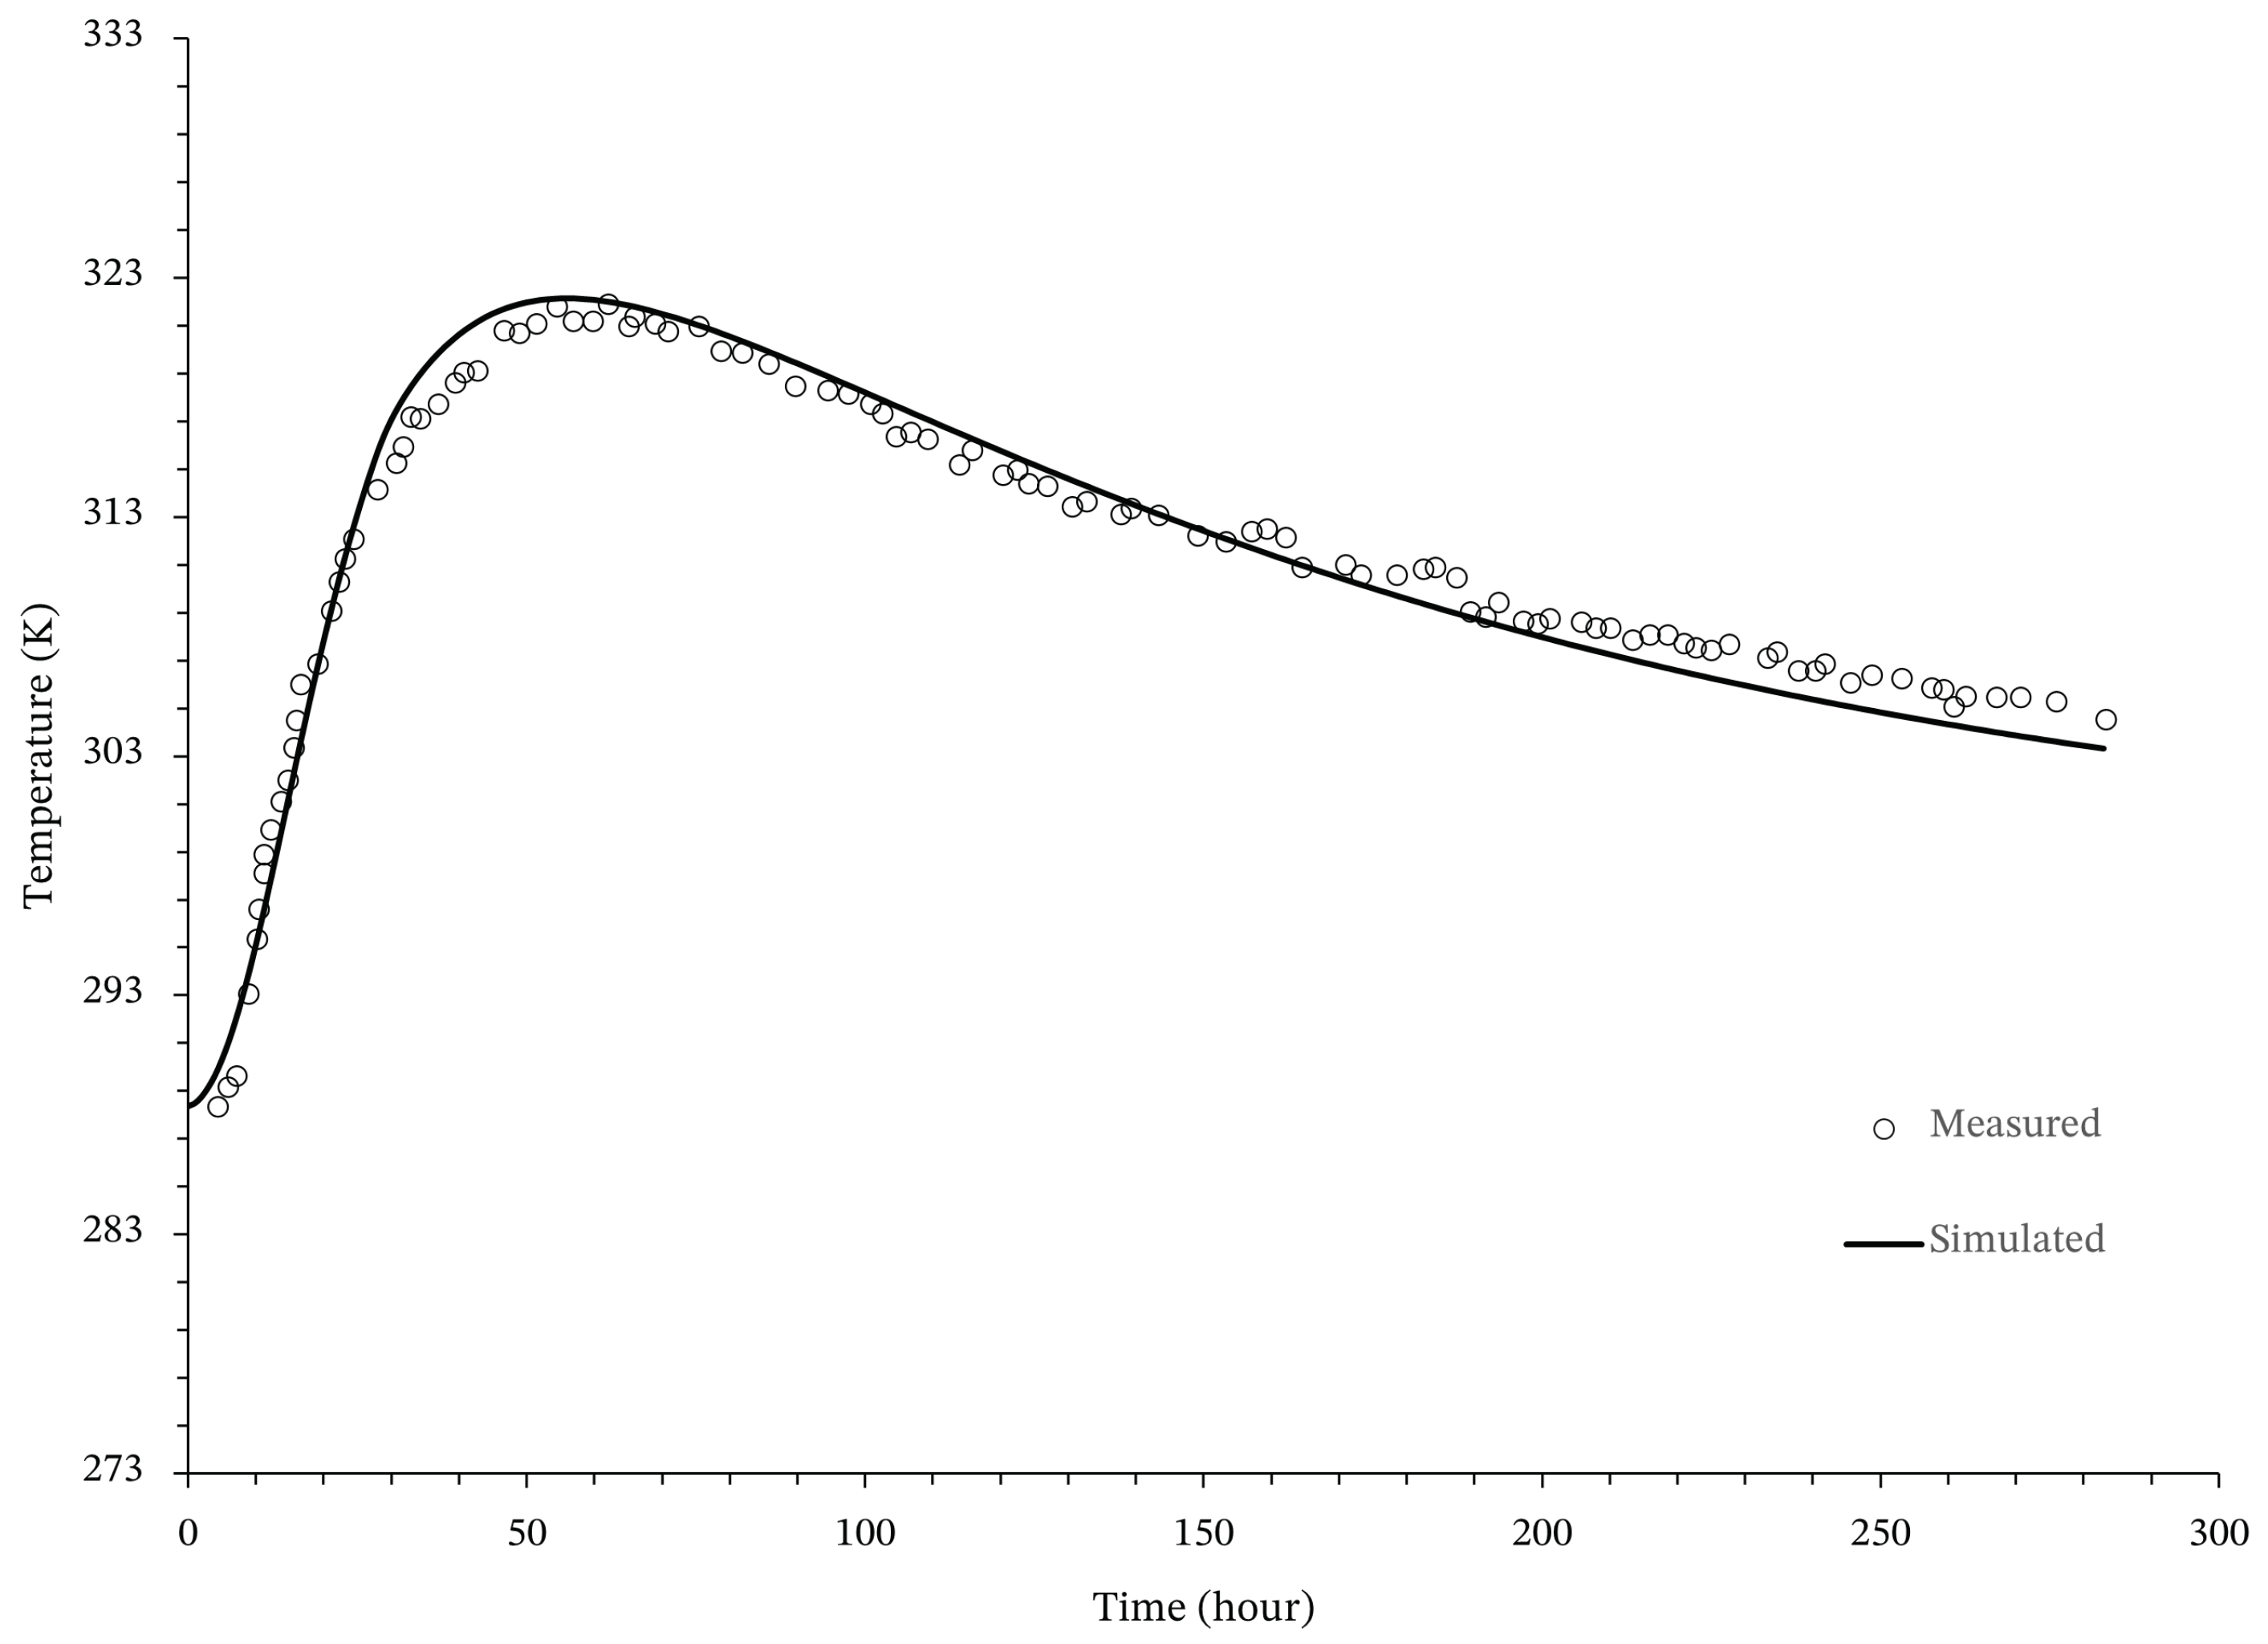
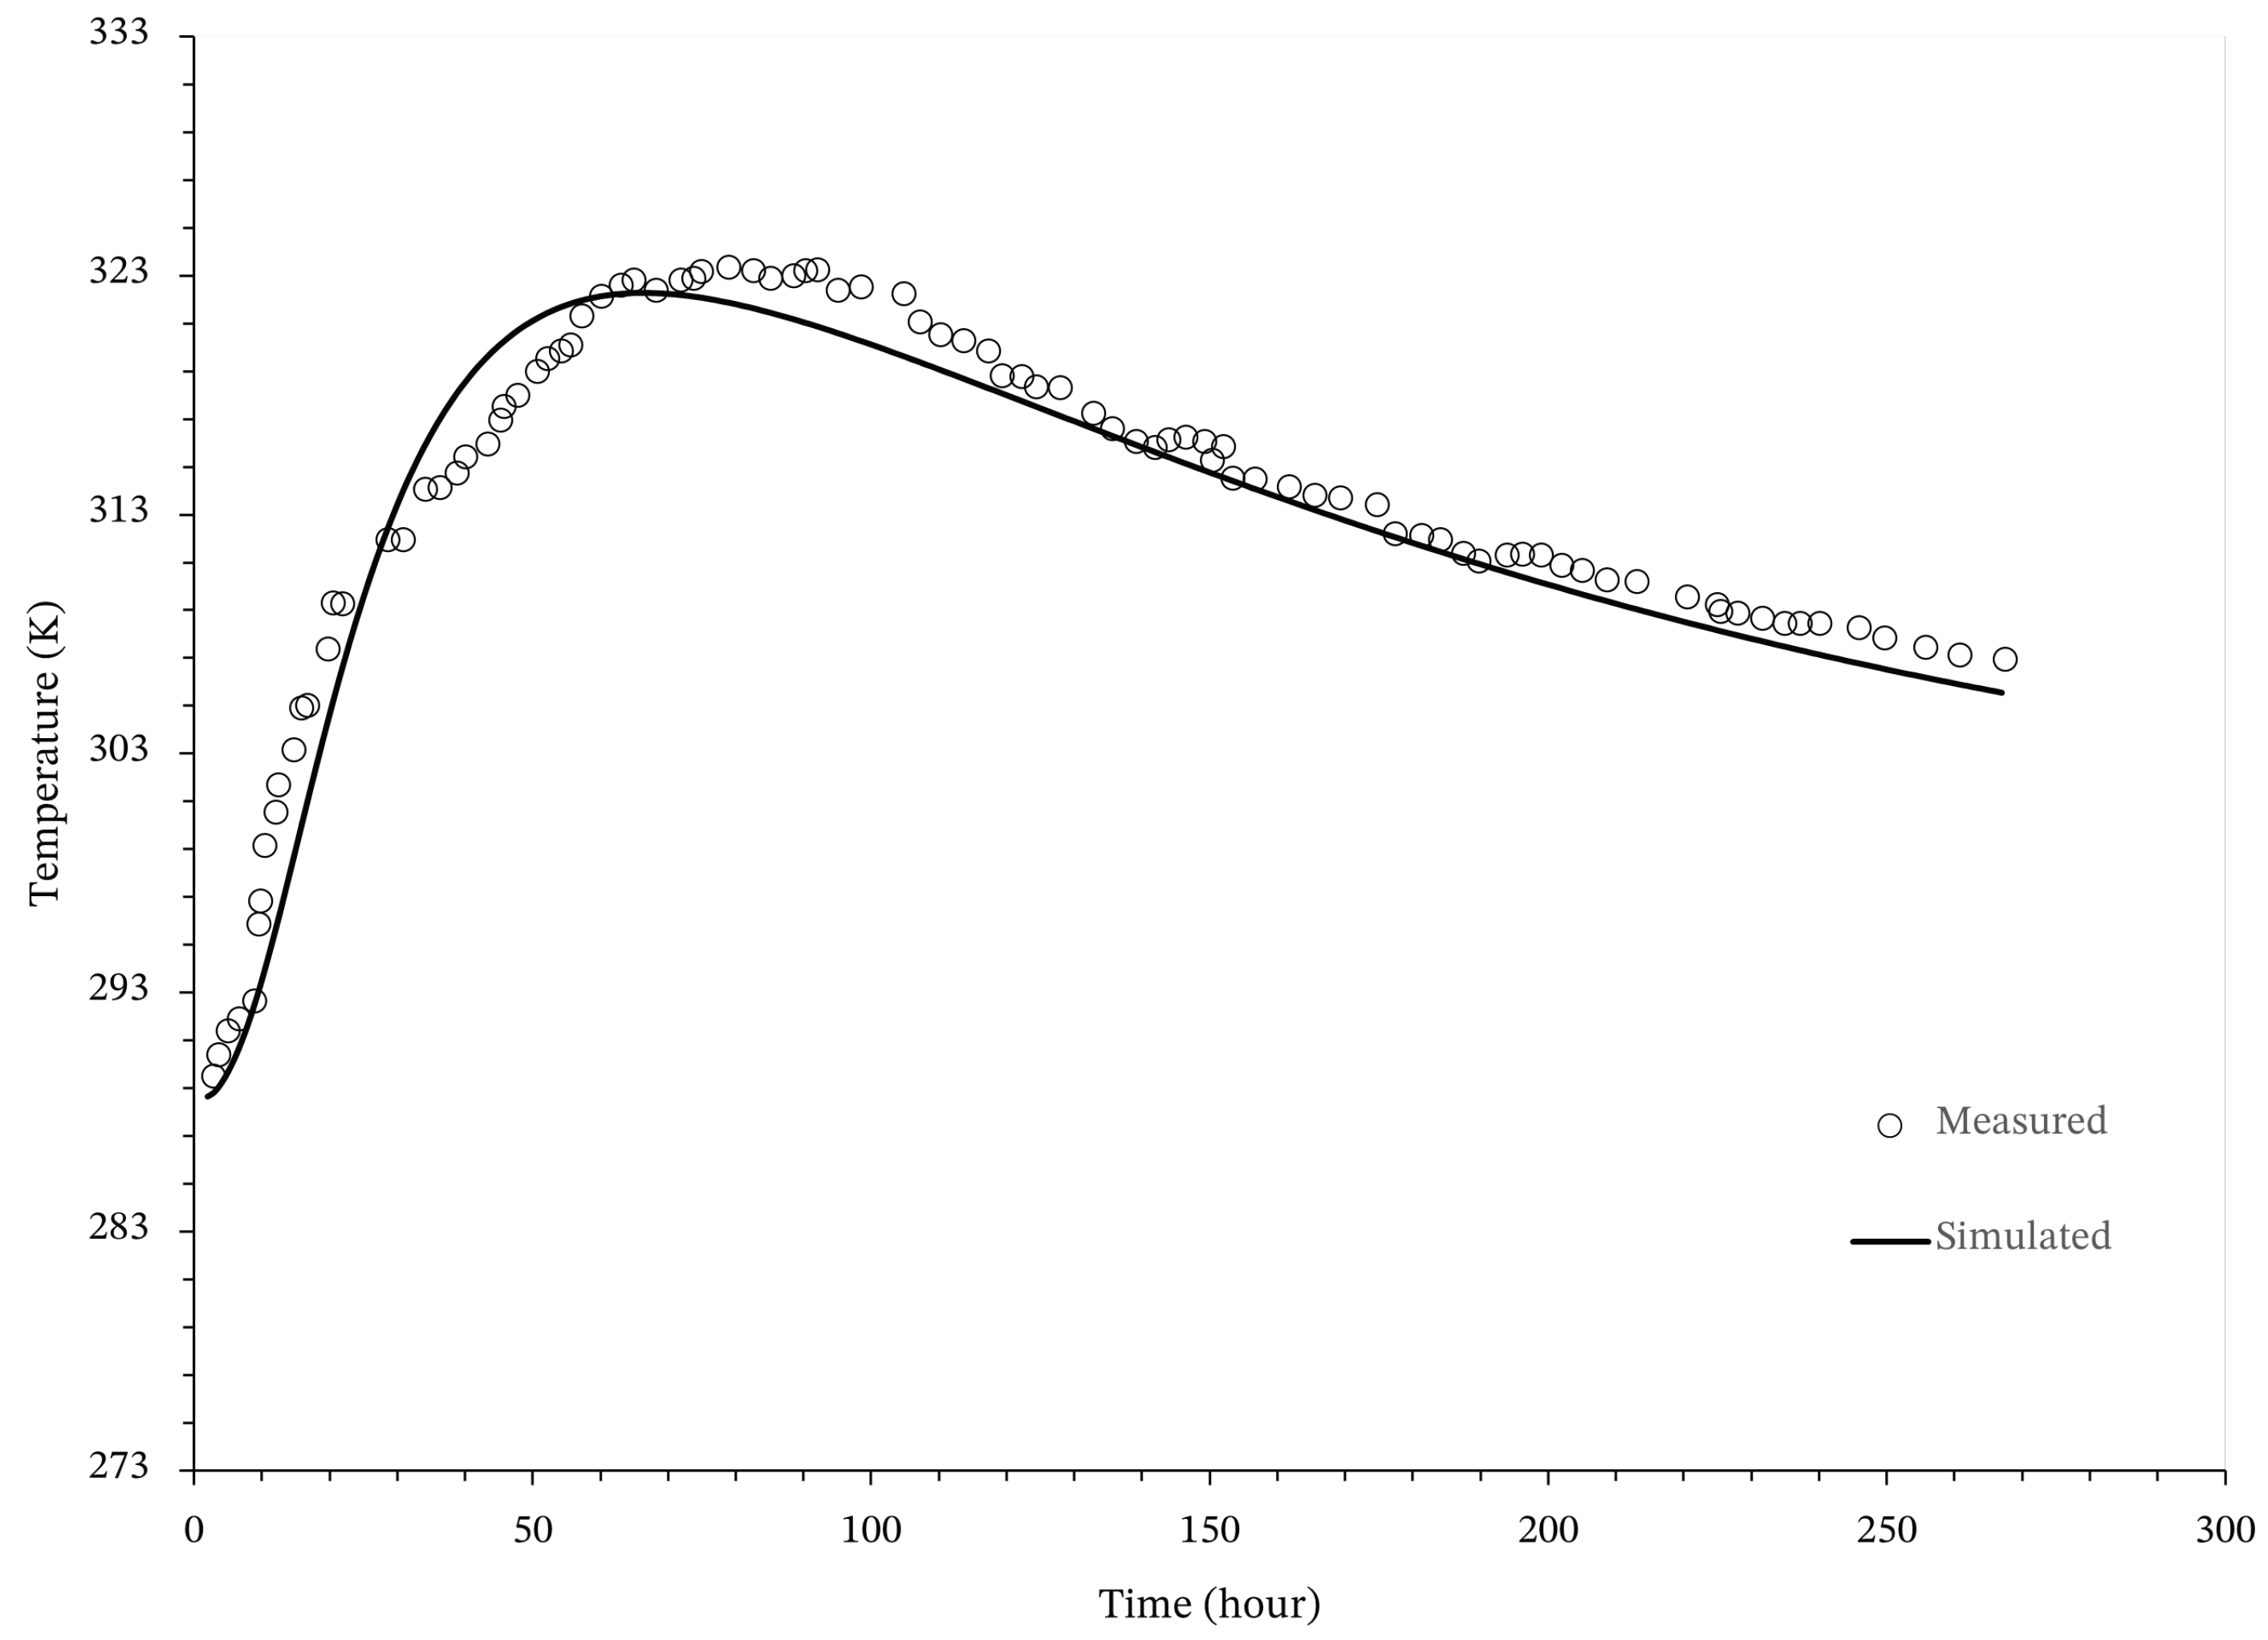
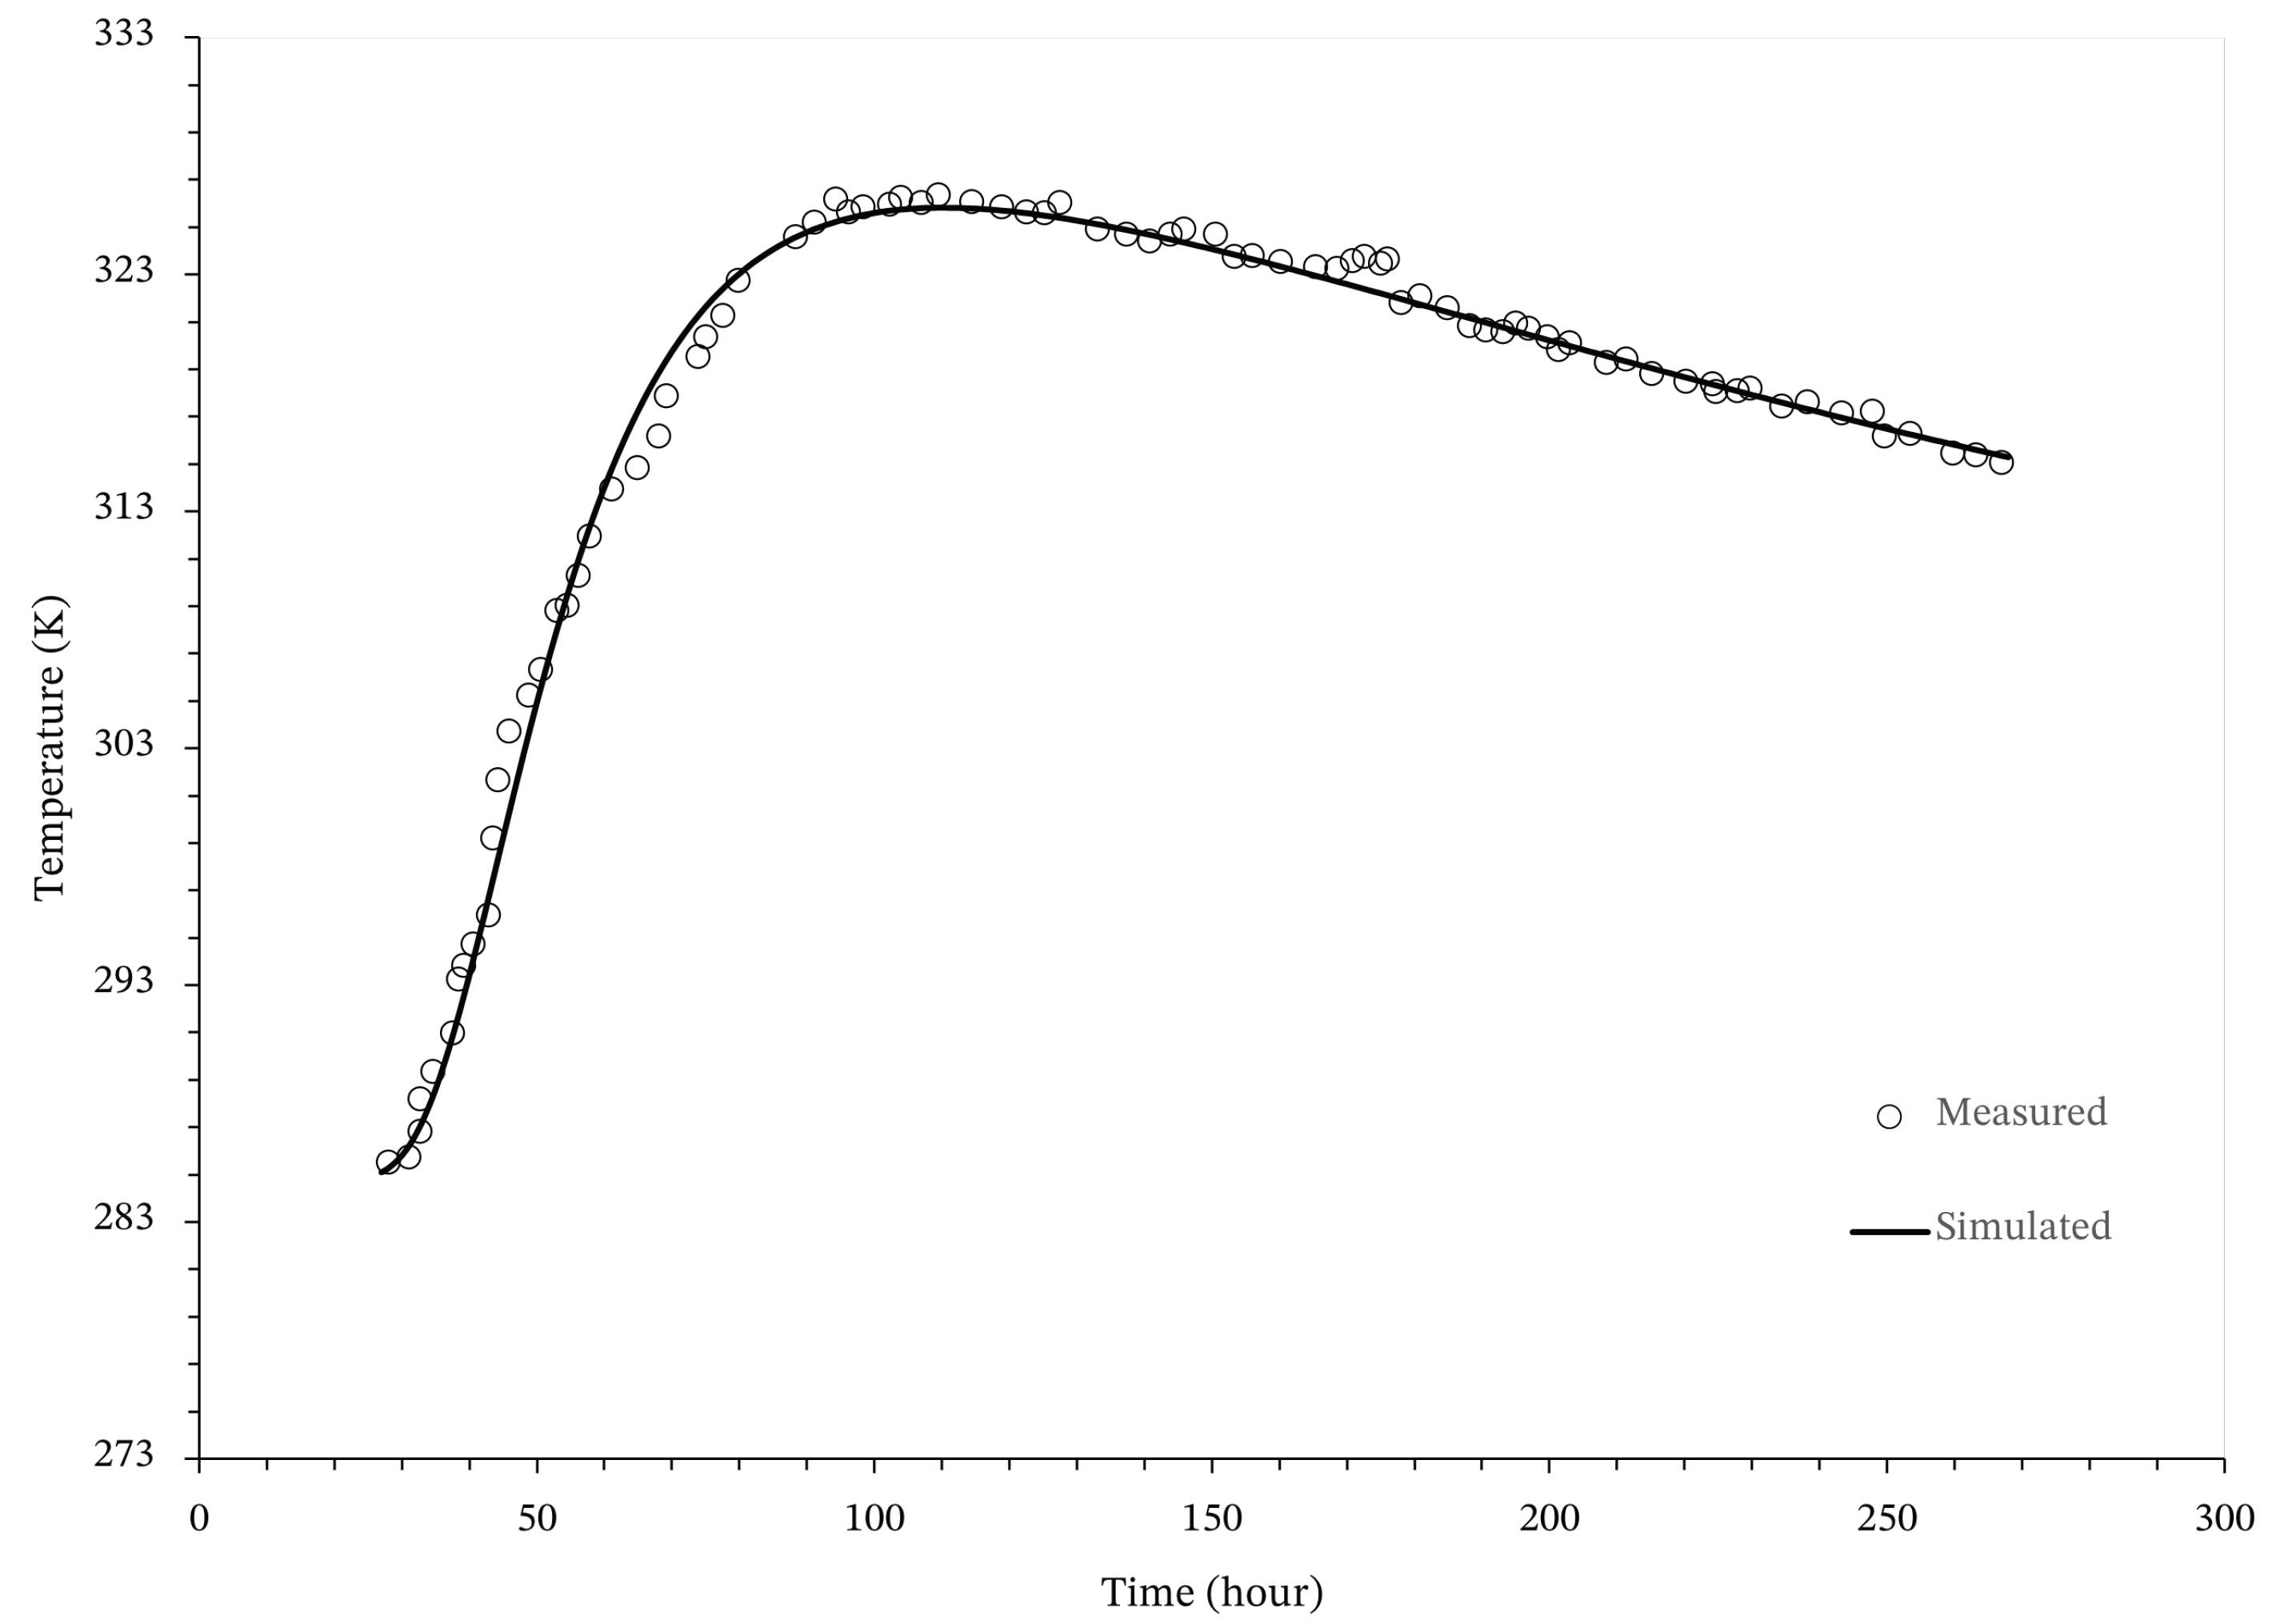
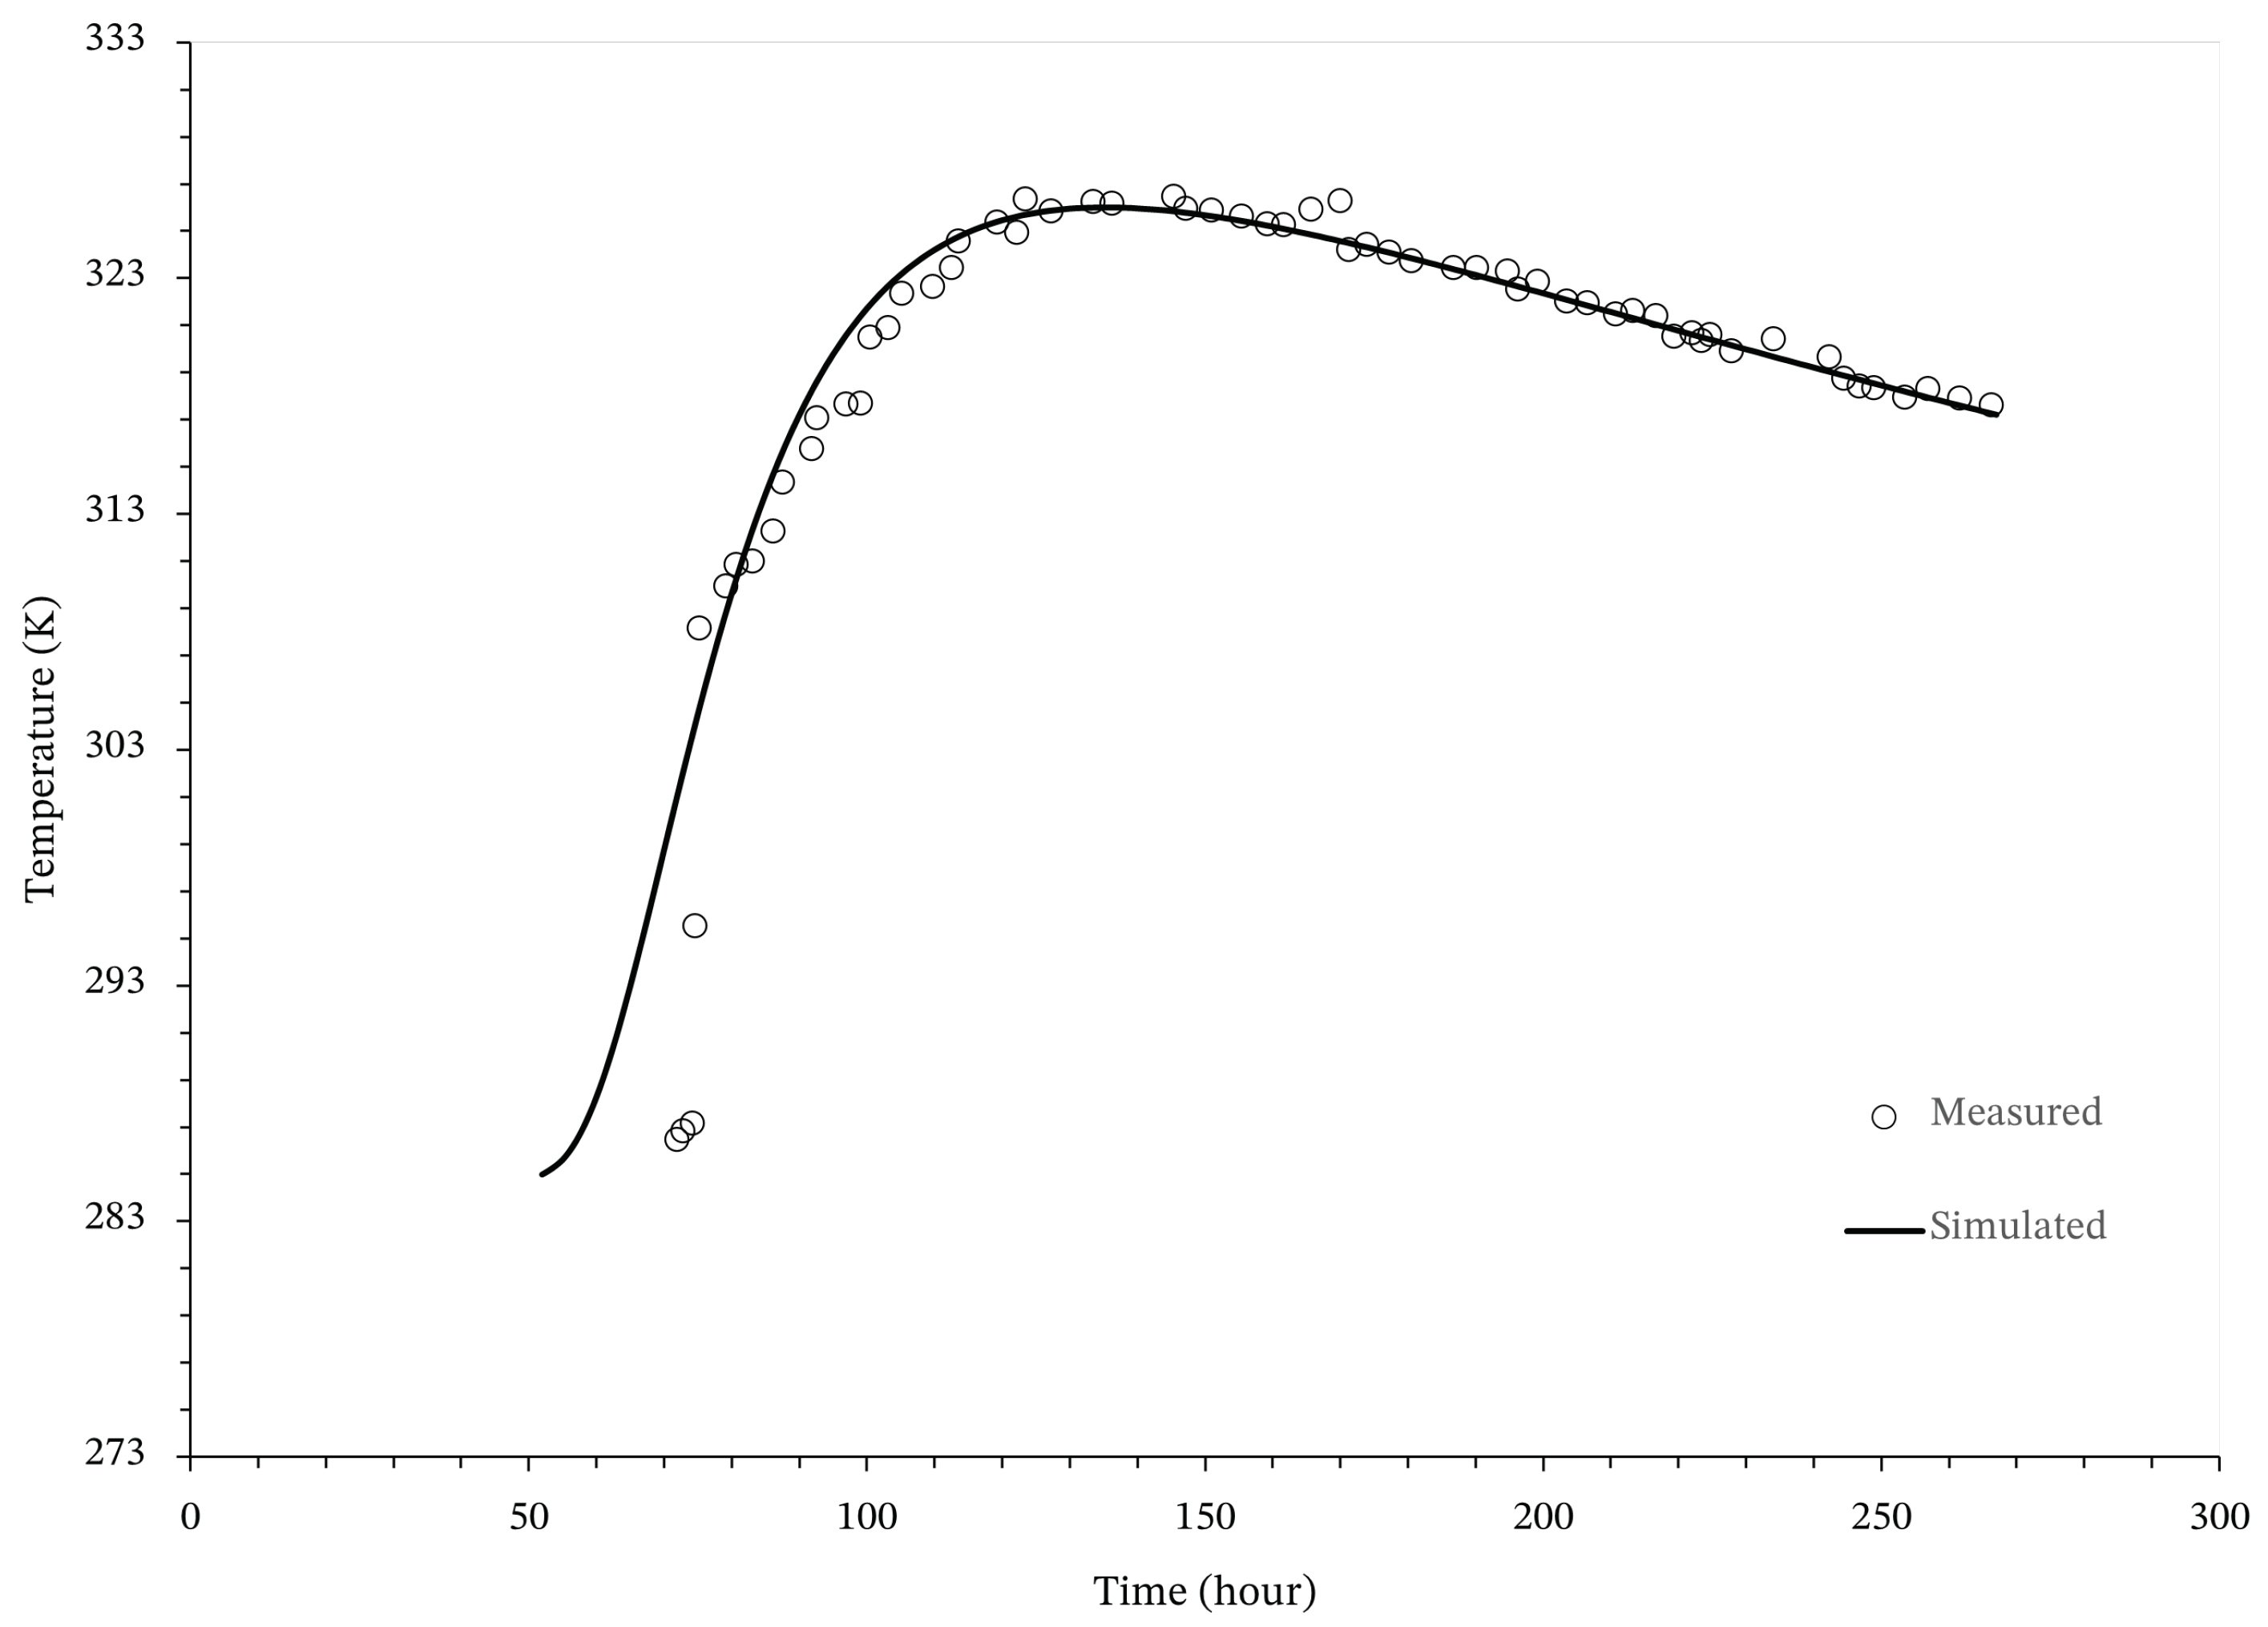
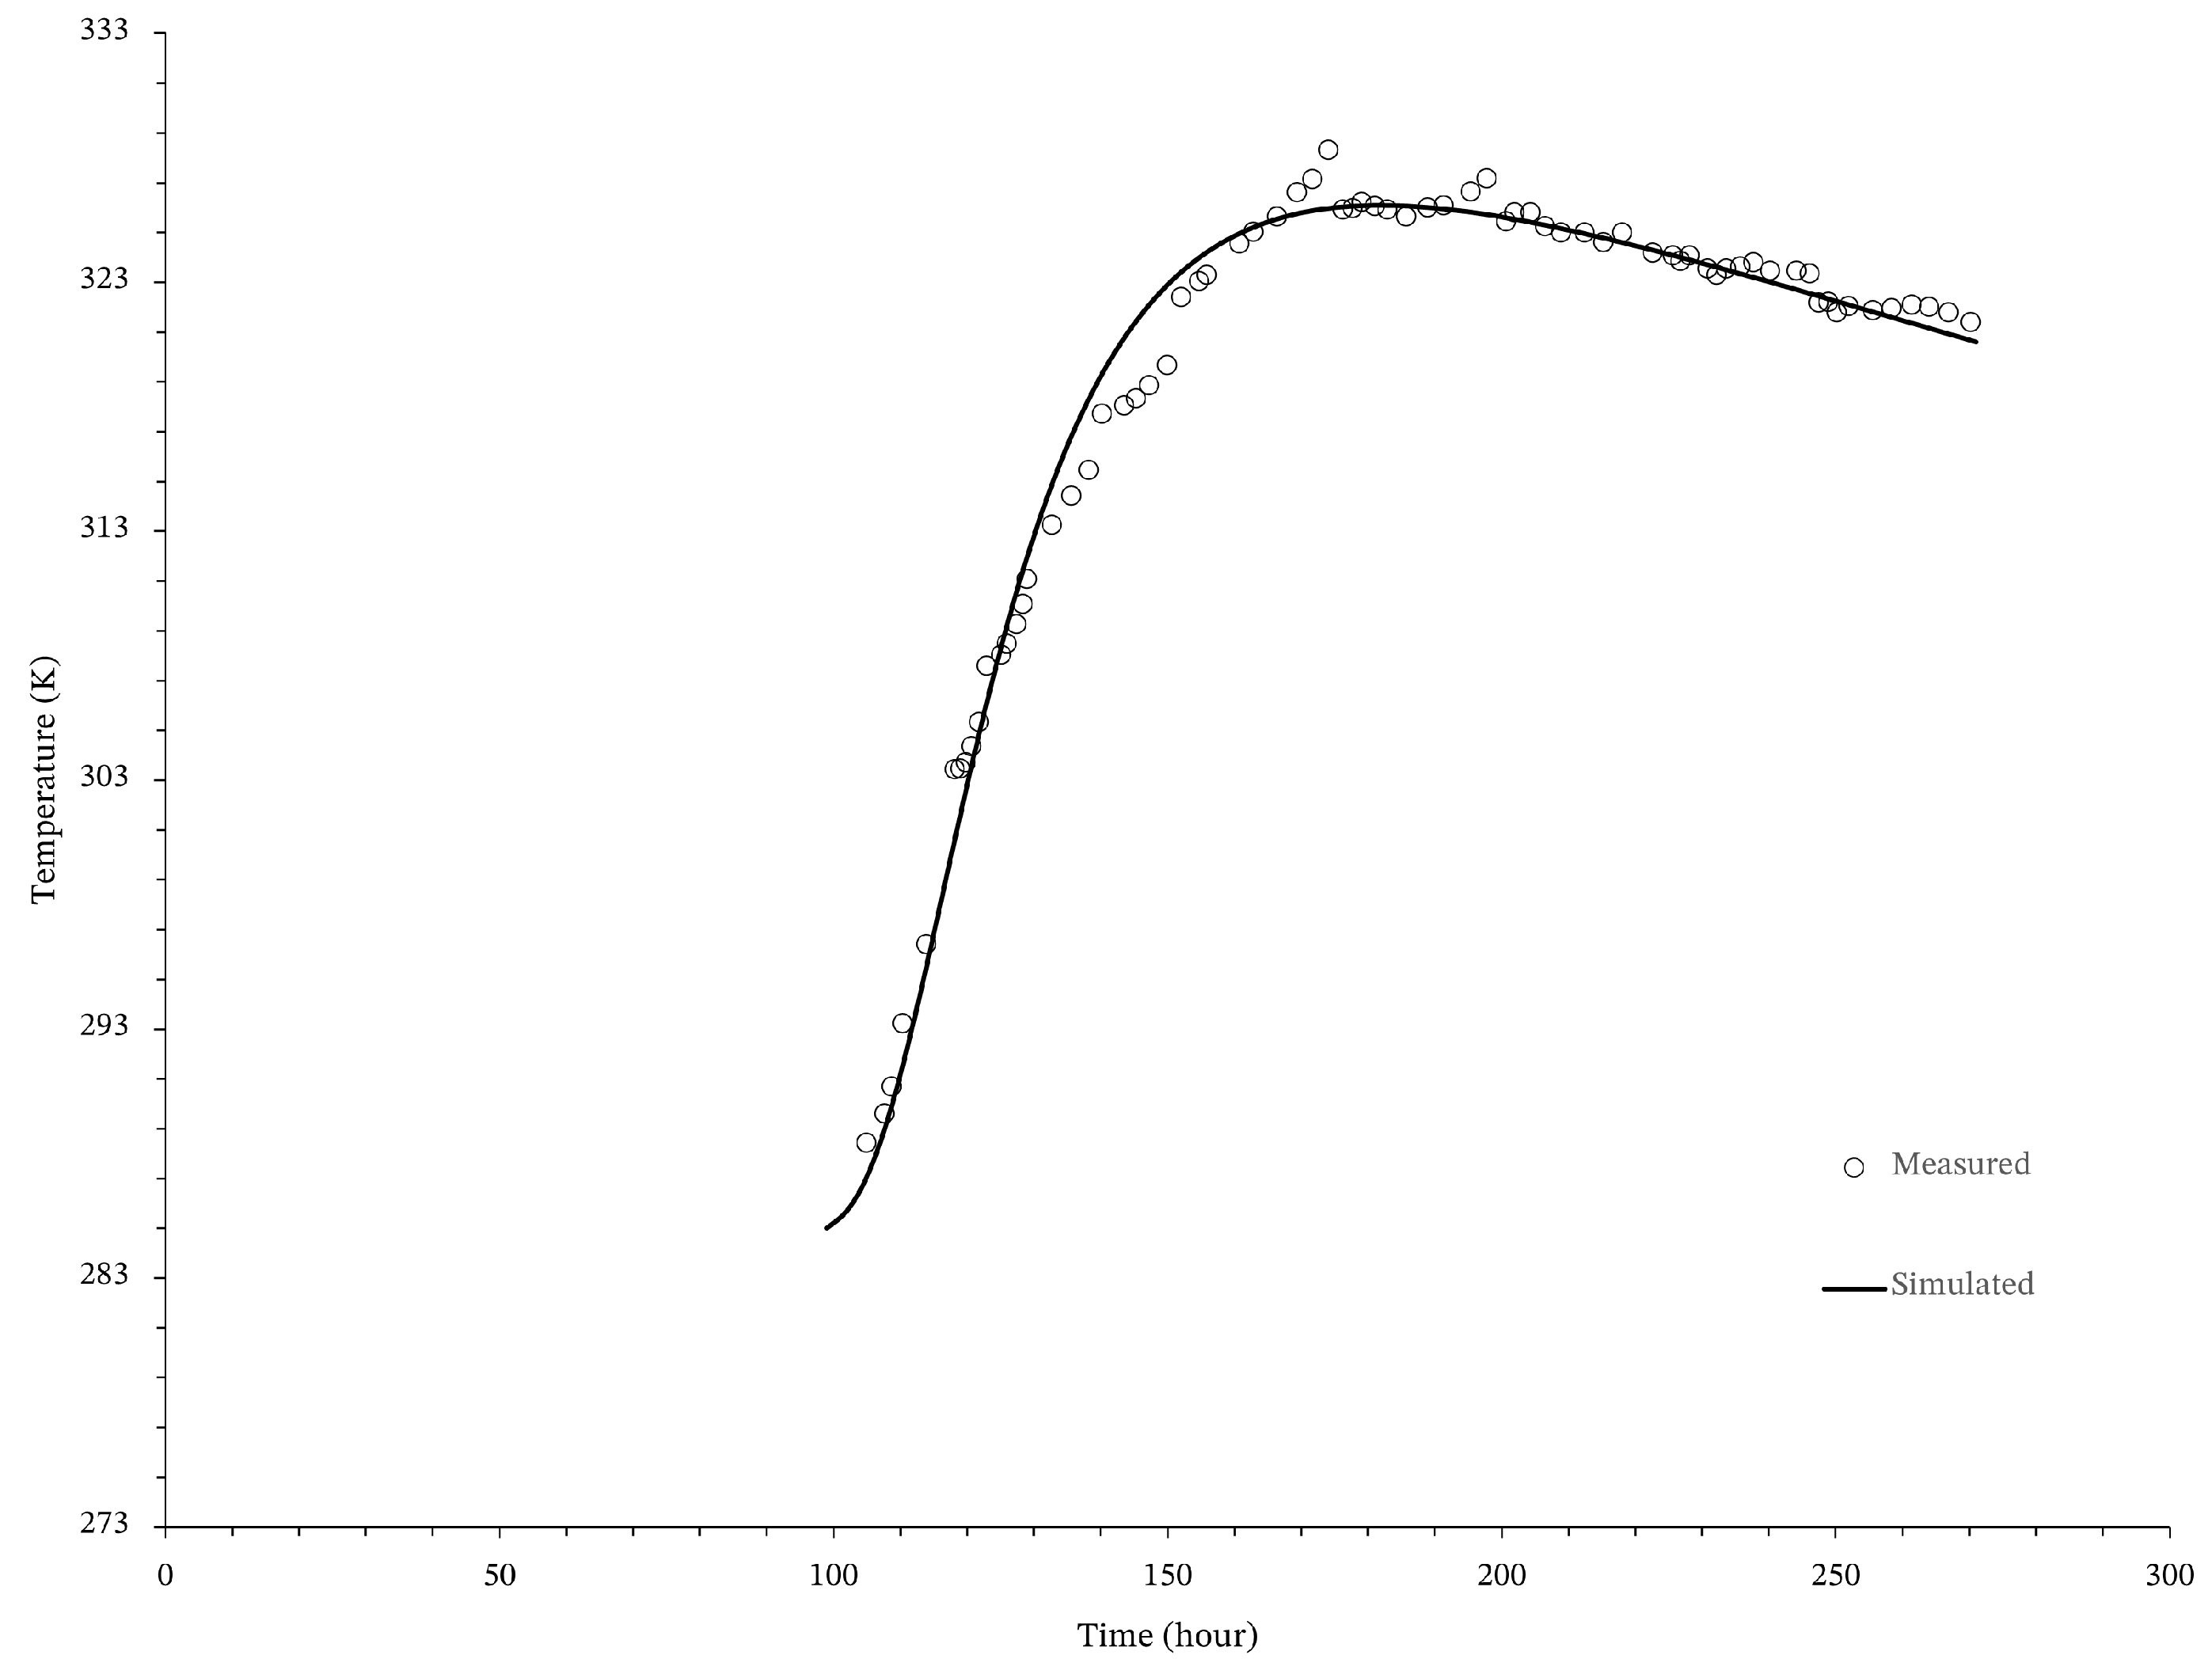
The temperatures obtained numerically through simulation were compared with those obtained in the field. Both were plotted in Figure 25, Figure 26, Figure 27, Figure 28 and Figure 29 at the nodes corresponding to the thermocouple positions.
The numerical and experimental results in Figure 23 demonstrate good alignment at earlier stages, validating the accuracy of the finite element model. However, a deviation is observed in Figure 28 within the drift ratio range of 60 to 80 h. This discrepancy is likely attributed to the initial noise in the experimental readings, which were later corrected. These data points were retained to maintain the integrity of the dataset, as there was no direct involvement in the experimental procedures, and it was deemed inappropriate to classify them as outliers without further verification.
Discrepancies between numerical simulations and field measurements are not uncommon, particularly in large-scale structures such as dams. Factors contributing to these variations may include differences in ambient temperature measurements, variations in concrete placement temperatures, timing inconsistencies during construction, and the use of a simplified heat transfer model that combines convection and radiation into a single coefficient. Despite this localized deviation, the overall agreement between the numerical and experimental results supports the robustness of the model for simulating massive concrete structures.
The temperatures from all thermocouples, as well as the ambient temperature, are shown in Figure 23 and the layered simulation results are presented in Figure 30.

6. Discussion and Conclusions

This study introduces an innovative numerical approach to simulate the construction of large-scale concrete structures, incorporating post-cooling systems. This approach includes considerations for various construction parameters, such as layered or sliding formwork simulation; thermal properties and the geometry of tube, fluid velocity, and initial temperature; and the control of initiating and shutting down the post-cooling system based on concrete temperature variations. The temperature results obtained by the implemented model, in the validation step, compared with the temperature data obtained by DIANA FEA to the same mesh, materials parameters, and boundary conditions, demonstrate similar behavior. This observation holds true for both scenarios, i.e., scenarios with and without the post-cooling system deployed during the hydration period.
This strategic control not only helps prevent thermal cracking, thereby mitigating the impact of thermal gradients, but also facilitates the simulation of project construction instructions, allowing significant savings in the construction of large structures. Additionally, the approach involves a thorough examination of thermochemical aspects related to the hydration process.
The computational time required by the validation model running on the DIANA FEA software was 7.75 times longer than that of DAMTHE 2.0.
The analysis of the construction of the water intake structure pillar of the Tocoma project exhibited great agreement with the in situ temperature values, highlighting the model’s proficiency in replicating the behavior of the post-cooling system during the construction of large-scale layered structures.
In conclusion, this method serves as a viable alternative to the discrete approach, offering similar results while requiring significantly less computational effort. This efficiency makes it particularly advantageous for real-world numerical simulations of large concrete structures during construction.

Author Contributions

Conceptualization, I.A.F., A.B.C.G.S. and E.M.R.F.; Methodology, I.A.F. and A.B.C.G.S.; Software, I.A.F. and A.B.C.G.S.; Validation, I.A.F. and E.M.R.F.; Formal analysis, I.A.F., A.B.C.G.S. and E.M.R.F.; Investigation, E.M.R.F.; Resources, E.M.R.F.; Writing—original draft, I.A.F.; Writing—review and editing, A.B.C.G.S. and E.M.R.F.; Supervision, A.B.C.G.S. and E.M.R.F.; Project administration, E.M.R.F.; Funding acquisition, E.M.R.F. All authors have read and agreed to the published version of the manuscript.

Funding

This study was financed by Brazilian scientific agencies, namely the Conselho Nacional de Desenvolvimento Científico e Tecnológico (CNPq), and the Coordenação de Aperfeiçoamento de Pessoal de Nível Superior (CAPES)—Finance Code 001.

Data Availability Statement

The data presented in this study are available in the article.

Conflicts of Interest

The authors declare no conflict of interest.

References

  1. Fairbairn, E.; Azenha, M. Thermal Cracking of Massive Concrete Structures: State of the Art Report of the RILEM Technical Committee 254-CMS; Technical Report, RILEM; Springer: Cham, Switzerland, 2018. [Google Scholar] [CrossRef]
  2. Ulm, F.J.; Coussy, O. Modeling of thermochemomechanical couplings of croncrete at early ages. J. Eng. Mech. 1995, 121, 785–794. [Google Scholar] [CrossRef]
  3. Ulm, F.J.; Coussy, O. Strength Growth as Chemo-Plastic Hardening in Early Age Concrete. J. Eng. Mech. 1996, 122, 1123–1132. [Google Scholar] [CrossRef]
  4. Ulm, F.J.; Coussy, O. Couplings in early-age concrete: From material modeling to structural design. Int. J. Solids Struct. 1998, 35, 4295–4311. [Google Scholar] [CrossRef]
  5. Azenha, M. Numerical Simulation of the Structural Behaviour of Concrete Since Its Early Ages. Ph.D. Thesis, Faculdade de Engenharia da Universidade do Porto, Porto, Portugal, 2009. [Google Scholar]
  6. Xin, J.; Zhang, G.; Liu, Y.; Wang, Z.; Wu, Z. Effect of temperature history and restraint degree on cracking behavior of early-age concrete. Constr. Build. Mater. 2018, 192, 381–390. [Google Scholar] [CrossRef]
  7. Castilho, E.; Schclar, N.; Tiago, C.; Farinha, M.L.B. FEA model for the simulation of the hydration process and temperature evolution during the concreting of an arch dam. Eng. Struct. 2018, 174, 165–177. [Google Scholar] [CrossRef]
  8. Gimenes, M.; Cleto, P.R.; Rodrigues, E.A.; Lloberas-Valls, O.; Manzoli, O.L. Modeling the effect of material heterogeneity on the thermo-mechanical behavior of concrete using mesoscale and stochastic field approaches. Theor. Appl. Fract. Mech. 2024, 133, 104622. [Google Scholar] [CrossRef]
  9. Huang, Y.J.; Natarajan, S.; Zhang, H.; Guo, F.-Q.; Xu, S.-L.; Zeng, C.; Zheng, Z.-S. A CT image-driven computational framework for investigating complex 3D fracture in mesoscale concrete. Cem. Concr. Compos. 2023, 143, 105270. [Google Scholar] [CrossRef]
  10. Tu, W.; Zhang, M. Multiscale microstructure and micromechanical properties of alkali-activated concrete: A critical review. Cem. Concr. Compos. 2024, 152, 105664. [Google Scholar] [CrossRef]
  11. Zhang, Y.; Lei, Q.; Zhao, W.; Yang, Y.; Wang, Y.; Yan, Z.; Zhu, H.; Ju, J.W. An improved micromechanical model for the thermal conductivity of multi-scale fiber reinforced ultra-high performance concrete under high temperatures. Mater. Des. 2023, 236, 112503. [Google Scholar] [CrossRef]
  12. Li, X.; Zhang, Y.; Liu, J.; Zuo, X. Multi-scale numerical simulation on mechanical strength of concrete based on its microstructural evolution. Constr. Build. Mater. 2024, 443, 137672. [Google Scholar] [CrossRef]
  13. Li, X.N.; Zuo, X.B.; Li, L.; Liu, J.H. Multiscale modeling and simulation on mechanical behavior of fiber reinforced concrete. Int. J. Solids Struct. 2024, 286–287, 112569. [Google Scholar] [CrossRef]
  14. ACI. Guide to Mass Concrete; ACI Manual of Concrete Practice; American Concrete Institute: Farmington, MI, USA, 2005. [Google Scholar]
  15. Tasri, A.; Susilawati, A. Effect of cooling water temperature and space between cooling pipes of post-cooling system on temperature and thermal stress in mass concrete. J. Build. Eng. 2019, 24, 100731. [Google Scholar] [CrossRef]
  16. Kheradmand, M.; Azenha, M.; Vicente, R.; de Aguiar, J.L. An innovative approach for temperature control of massive concrete structures at early ages based on post-cooling: Proof of concept. J. Build. Eng. 2020, 32, 101832. [Google Scholar] [CrossRef]
  17. Kheradmand, M.; Vicente, R.; Azenha, M.; de Aguiar, J.L.B. A New Sustainable System for Piped Water Cooling of Mass Concrete Structures; Springer International Publishing: Berlin/Heidelberg, Germany, 2023; pp. 421–430. [Google Scholar]
  18. ICOLD. Cnventional Methods in Dam Construction; International Commission on Large Dams: Paris, France, 1990; Volume Bulletin 76. [Google Scholar]
  19. Baber, J.; Salet, T.A.M.; Lundberg, J.K. Øresund tunnel control of early age cracking. Proc. IABSE Stockh. Colloquium Tunn. Struct. 1998, 78, 175–180. [Google Scholar]
  20. Kim, J.K.; Kim, K.H.; Yang, J.K. Thermal analysis of hydration heat in concrete structures with pipe cooling system. Comput. Struct. 2001, 79, 163–171. [Google Scholar] [CrossRef]
  21. Lunniss, R.; Baber, J. Immersed Tunnels; CRC Press: Boca Raton, FL, USA; Taylor and Francis Group: Boca Raton, FL, USA, 2013. [Google Scholar]
  22. Sfikas, I.; Ingham, J.; MacDonald, J. Using finite element analysis to assess the thermal behaviour of concrete structures. Concrete 2017, 50–52. [Google Scholar]
  23. Fairbairn, E.; Silvoso, M.; Koenders, E.; Ribeiro, F.; Toledo, R.D. Thermo-chemo-mechanical cracking assessment for early-age mass concrete structures. Concr. Int. 2012, 34, 30–35. [Google Scholar]
  24. Myers, T.; Fowkes, N.; Ballim, Y. Modeling the cooling of concrete by piped water. J. Eng. Mech. 2009, 135, 1375–1383. [Google Scholar] [CrossRef]
  25. You, K.; Wang, F.; Wang, L.; Zhao, Z.; Liu, Y. A faster iterative method for solving temperature field of mass concrete with cooling pipes. AIP Conf. Proc. 2017, 1839, 020079. [Google Scholar] [CrossRef]
  26. Liu, X.; Zhang, C.; Chang, X.; Zhou, W.; Cheng, Y.; Duan, Y. Precise simulation analysis of the thermal field in mass concrete with a pipe water cooling system. Appl. Therm. Eng. 2015, 78, 449–459. [Google Scholar] [CrossRef]
  27. Zhong, R.; Hou, G.P.; Qiang, S. An improved composite element method for the simulation of temperature field in massive concrete with embedded cooling pipe. Appl. Therm. Eng. 2017, 124, 1409–1417. [Google Scholar] [CrossRef]
  28. Ding, J.; Chen, S. Simulation and feedback analysis of the temperature field in massive concrete structures containing cooling pipes. Appl. Therm. Eng. 2013, 61, 554–562. [Google Scholar] [CrossRef]
  29. Nguyen, T.C.; Nguyen, T.; Nguyen, V.; Do, T.M.D. Finite element analysis of temperature and stress fields in the concrete mass with pipe-cooling. Structutal Integr. Life 2020, 20, 131–135. [Google Scholar]
  30. Yang, J.K.; Lee, Y.; Kim, J.K. Heat transfer coefficient in flow convection of pipe-cooling system in massive concrete. J. Adv. Concr. Technol. 2011, 9, 103–114. [Google Scholar] [CrossRef]
  31. Yang, J.; Hu, Y.; Zuo, Z.; Jin, F.; Li, Q. Thermal analysis of mass concrete embedded with double-layer staggered heterogeneous cooling water pipes. Appl. Therm. Eng. 2012, 35, 145–156. [Google Scholar] [CrossRef]
  32. Zhu, B. Effect of cooling by water flowing in nonmetal pipes embedded in mass concrete. J. Constr. Eng. Manag. 2019, 125, 61–68. [Google Scholar] [CrossRef]
  33. Conceição, J.; Faria, R.; Azenha, M.; Miranda, M. A new method based on equivalent surfaces for simulation of the post-cooling in concrete arch dams during construction. Eng. Struct. 2020, 209, 109976. [Google Scholar] [CrossRef]
  34. Silva, A.; Laszczk, J.; Wrobel, L.; Ribeiro, F.; Nowak, A. A thermoregulation model for hypothermic treatment of neonates. Med. Eng. Phys. 2016, 38, 988–998. [Google Scholar] [CrossRef]
  35. Ferreira, D. (Ed.) DIANA Users Manual; DIANA FEA: Delft, The Netherlands, 2022. [Google Scholar]
  36. Rita, M. Otimização da Fase Construtiva de Estruturas de Concreto Massa em Ambiente Paralelo. Ph.D. Thesis, UFRJ, Rio de Janeiro, Brazil, 2015. [Google Scholar]
  37. De Faria, E. Predição da Exotermia da Reação de Hidratação do Concreto Através de Modelo Termo-quíMico e Modelo de Dados. Ph.D. Thesis, UFRJ, Rio de Janeiro, Brazil, 2004. [Google Scholar]
  38. Bejan, A. Heat Transfer; John Wiley and Sons, Inc.: Hoboken, NJ, USA, 1993. [Google Scholar]
  39. Bejan, A. Convection Heat Transfer; John Wiley and Sons, Inc.: Hoboken, NJ, USA, 2013. [Google Scholar]
  40. Cengel, Y. Heat Transfer: A Practical Approach; McGraw-Hill: New York, NY, USA, 2002. [Google Scholar]
  41. Arreaza, R. Utilizacion del sistema de postcooling para ejecutar vaciados masivos de granedes alturas. Premio Destaque Odebrecht 2011, 11, 1–35. [Google Scholar]
  42. Velasco, R.V. Concretos Auto-Adensáveis Reforçados com Elevadas Frações Volumétricas de Fibras de Aço: Propriedades ReolóGicas, fíSicas, mecâNicas e téRmicas. Ph.D. Thesis, UFRJ, Rio de Janeiro, Brazil, 2008. [Google Scholar]
  43. Hilaire, A. Etude des Déformations Différées des Bétons en Compression et en Traction, du Jeune au Long Terme: Application Aux Enceintes de Confinement. Ph.D. Thesis, École normale supérieure de Cachan—ENS Cachan, Cachan, France, 2014. [Google Scholar]
Figure 1. Examples of structures with post-cooling systems.
Buildings 14 03232 g001
Figure 2. Mass conservation on a control volume.
Buildings 14 03232 g002
Figure 3. Schematic of the tube and energy interactions within a differential control volume. Realistic and idealized functions representing the distribution of velocity and temperature in the tube.
Buildings 14 03232 g003
Figure 4. Concrete and fluid volume model.
Buildings 14 03232 g004
Figure 5. Thermal resistances of the concrete, wall tube and fluid (left to right).
Buildings 14 03232 g005
Figure 6. Cross-section of the concrete, tube, and fluid (outer to inner).
Buildings 14 03232 g006
Figure 7. Heat exchange in the element and temperatures at instants t 0 and t i .
Buildings 14 03232 g007
Figure 8. Fluid flow along the pipe of n elements.
Buildings 14 03232 g008
Figure 9. Post-cooling iteration algorithm.
Buildings 14 03232 g009
Figure 10. Slab shape tested and monitoring thermometers coupled to the LYNX platform (COPPE/FURNAS).
Buildings 14 03232 g010
Figure 11. Temperatures in the concrete and ambient surroundings measured during the experimental test.
Buildings 14 03232 g011
Figure 12. The finite element geometry mesh as built without post-cooling elements.
Buildings 14 03232 g012
Figure 13. The finite element geometry mesh with activated post-cooling elements.
Buildings 14 03232 g013
Figure 14. Temperature results at the center of the structure (15 cm) for the simulations—with and without the post-cooling system—and the experimental measurements.
Buildings 14 03232 g014
Figure 15. Temperature results at the center of the structure (25 cm) for the simulations—with and without post-cooling system—and the experimental measurements.
Buildings 14 03232 g015
Figure 16. Temperature results at the center of the structure (35 cm) for the simulations—with and without post-cooling system—and the experimental measurements.
Buildings 14 03232 g016
Figure 17. Temperature results at the center of the structure for the simulations.
Buildings 14 03232 g017
Figure 18. Geometry of the Tocoma Hydroelectric Power Plant and the location of PI-04.
Buildings 14 03232 g018
Figure 19. The construction of water intake pillars at the Tocoma Hydroelectric Power Plant, including the PI-04, which incorporates a framework.
Buildings 14 03232 g019
Figure 20. Post-cooling pipe installation on the spillway pillar of the Tocoma Hydroelectric Power Plant (photograph by W.P. Andrade).
Buildings 14 03232 g020
Figure 21. The hexahedral finite element mesh geometry of PI-04.
Buildings 14 03232 g021
Figure 22. The hexahedral finite element mesh geometry of post-cooling elements in PI-04.
Buildings 14 03232 g022
Figure 23. Temperature rise read in thermocouples (TPs) compared to the corresponding numerical simulation (NS) and the ambient temperature measured during the construction.
Buildings 14 03232 g023
Figure 24. The position of thermocouples in the center of the structure.
Buildings 14 03232 g024
Figure 25. Temperature rise at node 928,420 (33-NS) and thermocouple (33-TP).
Buildings 14 03232 g025
Figure 26. Temperature rise at node 913,294 (34-NS) and thermocouple (34-TP).
Buildings 14 03232 g026
Figure 27. Temperature rise at node 882,914 (37-NS) and thermocouple (37-TP).
Buildings 14 03232 g027
Figure 28. Temperature rise at node 852,534 (40-NS) and thermocouple (40-TP).
Buildings 14 03232 g028
Figure 29. Temperature rise at node 822,154 (43-NS) and thermocouple (43-TP).
Buildings 14 03232 g029
Figure 30. Distribution of temperatures (K) during the simulation of the construction of the PI-04 pillar in layers at t = 1, 5, 20, 40, 80, 120, 195 and 300 h.
Buildings 14 03232 g030
Table 1. Material properties: concrete, coolant, tube and rock.
ParameterValueUnitEquations
l0.03600m(28) and (32)
a0.03600m(26) and (32)
b0.03600m(26) and (32)
δ t 0.07200s(30)
ρ 1000.00kg/m3(32)
C p c 1086.00J/kg K(2)
C p w 4184.00J/kg K(32)
C p r o c k 800.000J/kg K(2)
λ c 1.56000W/m K(2) and (26)
λ w 0.61000W/m K(26)
λ r o c k 2.50000W/m K(2)
u w 0.50000m/s(26)
r i 0.01270m(26)
r o 0.01535m(26)
h ¯ p c 2000.00W/m2 K(28)
E a / R 4000.00K(6)
Table 2. Table of parameters.
la r i r o h ¯ pc NodesElements
(m) (m) (m) (m) (W/m2 K) No. No.
0.2000.2000.01270.0153539.256247343955
0.1000.1000.01270.0153550.426721,44318,588
0.0500.0500.01270.0153570.482997,78787,300
0.0360.0360.01270.0153586.8548145,380132,225
Table 3. Position and height of the thermocouples.
NodeX-AxisY-AxisZ-AxisThermocouple (TC)
928,4204.000.000.8033
913,2944.000.002.0034
882,9144.000.006.5037
852,5344.000.0011.0040
822,1544.000.0015.5043
Table 4. Material properties: concrete, water, tube, and rock.
ParameterValueUnitEquations
l0.10000m(28) and (32)
a0.10000m(26) and (32)
b0.10000m(26) and (32)
δ t 0.20000s(30)
ρ 1000.00kg/m3(32)
C p c 933.000J/kg K(2)
C p w 4192.00J/kg K(32)
C p r o c k 870.000J/kg K(2)
λ c 2.33000W/m K(2) and (26)
λ w 0.58000W/m K(26)
λ t 60.0000W/m K(26)
λ r o c k 2.50000W/m K(2)
u w 0.50000m/s(26)
r i 0.01270m(26)
r e 0.01535m(26)
h w 99.6500W/m2 K(26)
h ¯ p c 59.6000W/m2 K(28)
E a / R 4000.00K(6)
Disclaimer/Publisher’s Note: The statements, opinions and data contained in all publications are solely those of the individual author(s) and contributor(s) and not of MDPI and/or the editor(s). MDPI and/or the editor(s) disclaim responsibility for any injury to people or property resulting from any ideas, methods, instructions or products referred to in the content.