
The Effects of Economic Sector GDP on Low-Income Housing Supply, Colombia’s Regions Case

 and
and
Abstract
1. Introduction
2. Literature Review
2.1. The Importance of Low-Income Housing Development in Order to Reduce Poverty
2.2. The Role of Low-Income Housing in the Building Housing Sector
3. Method
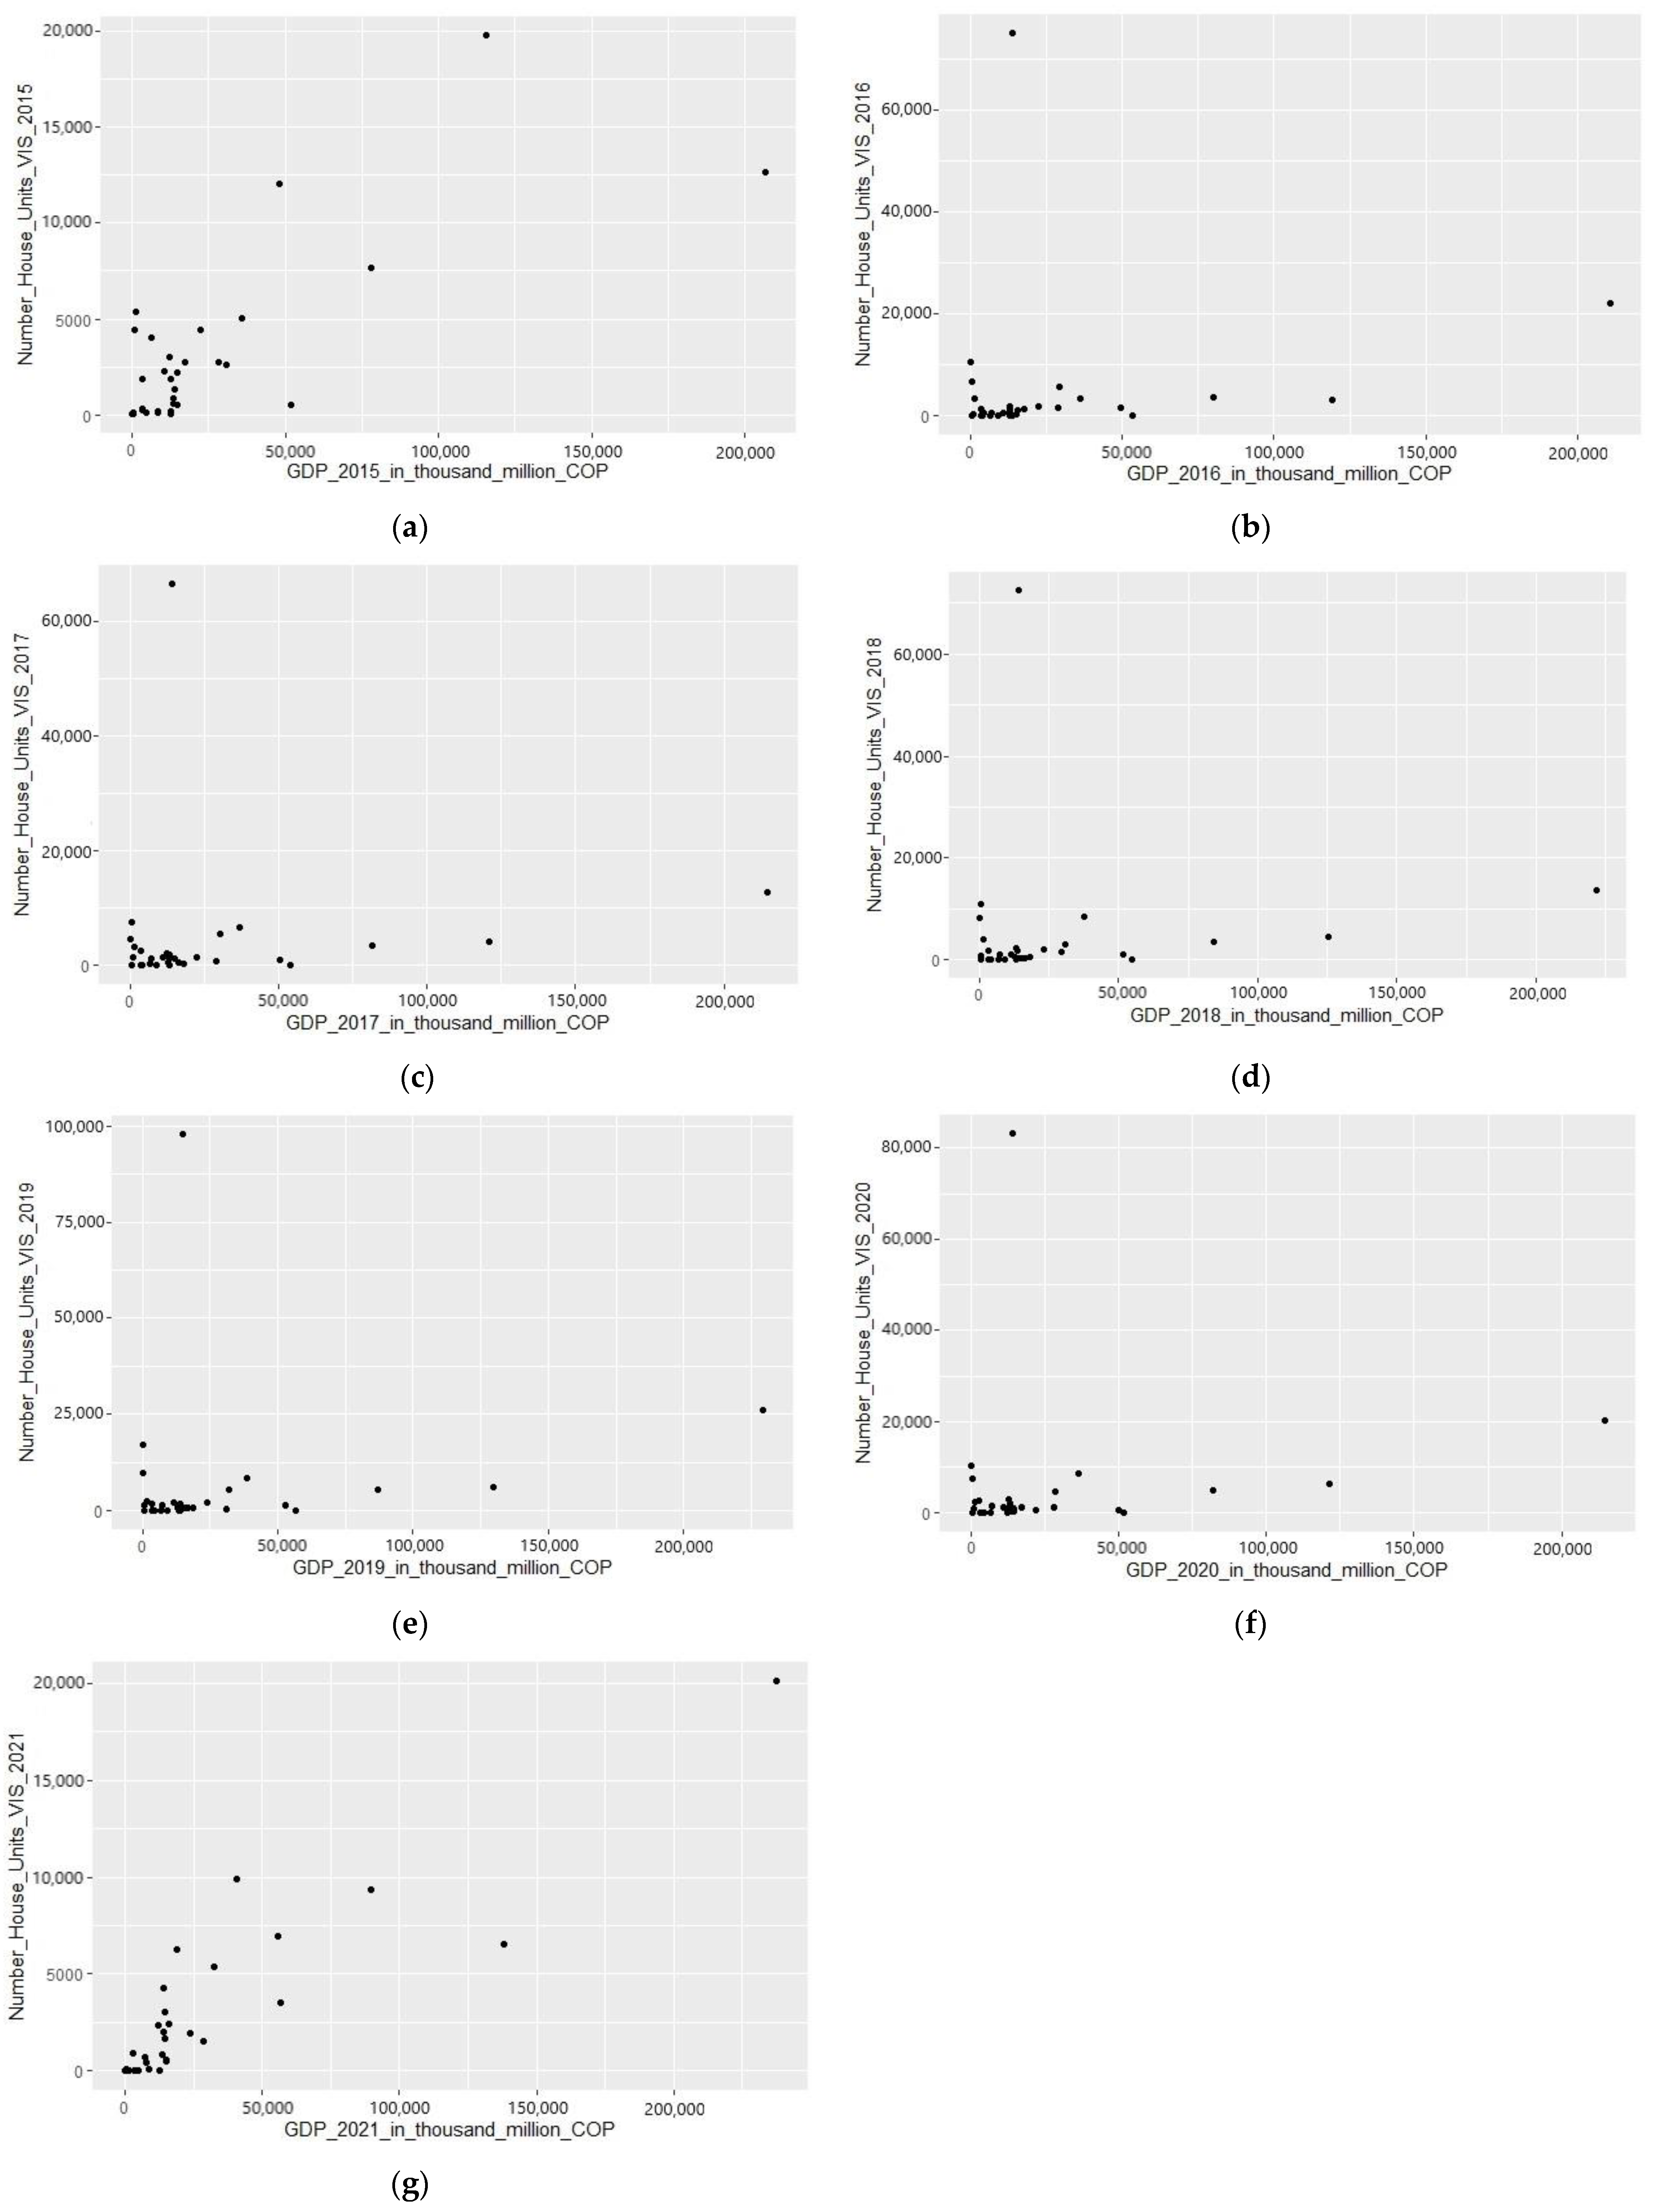
- Number of licensed VIS units reported for Colombia as a whole and for each of the 33 departments, 2015–2021.
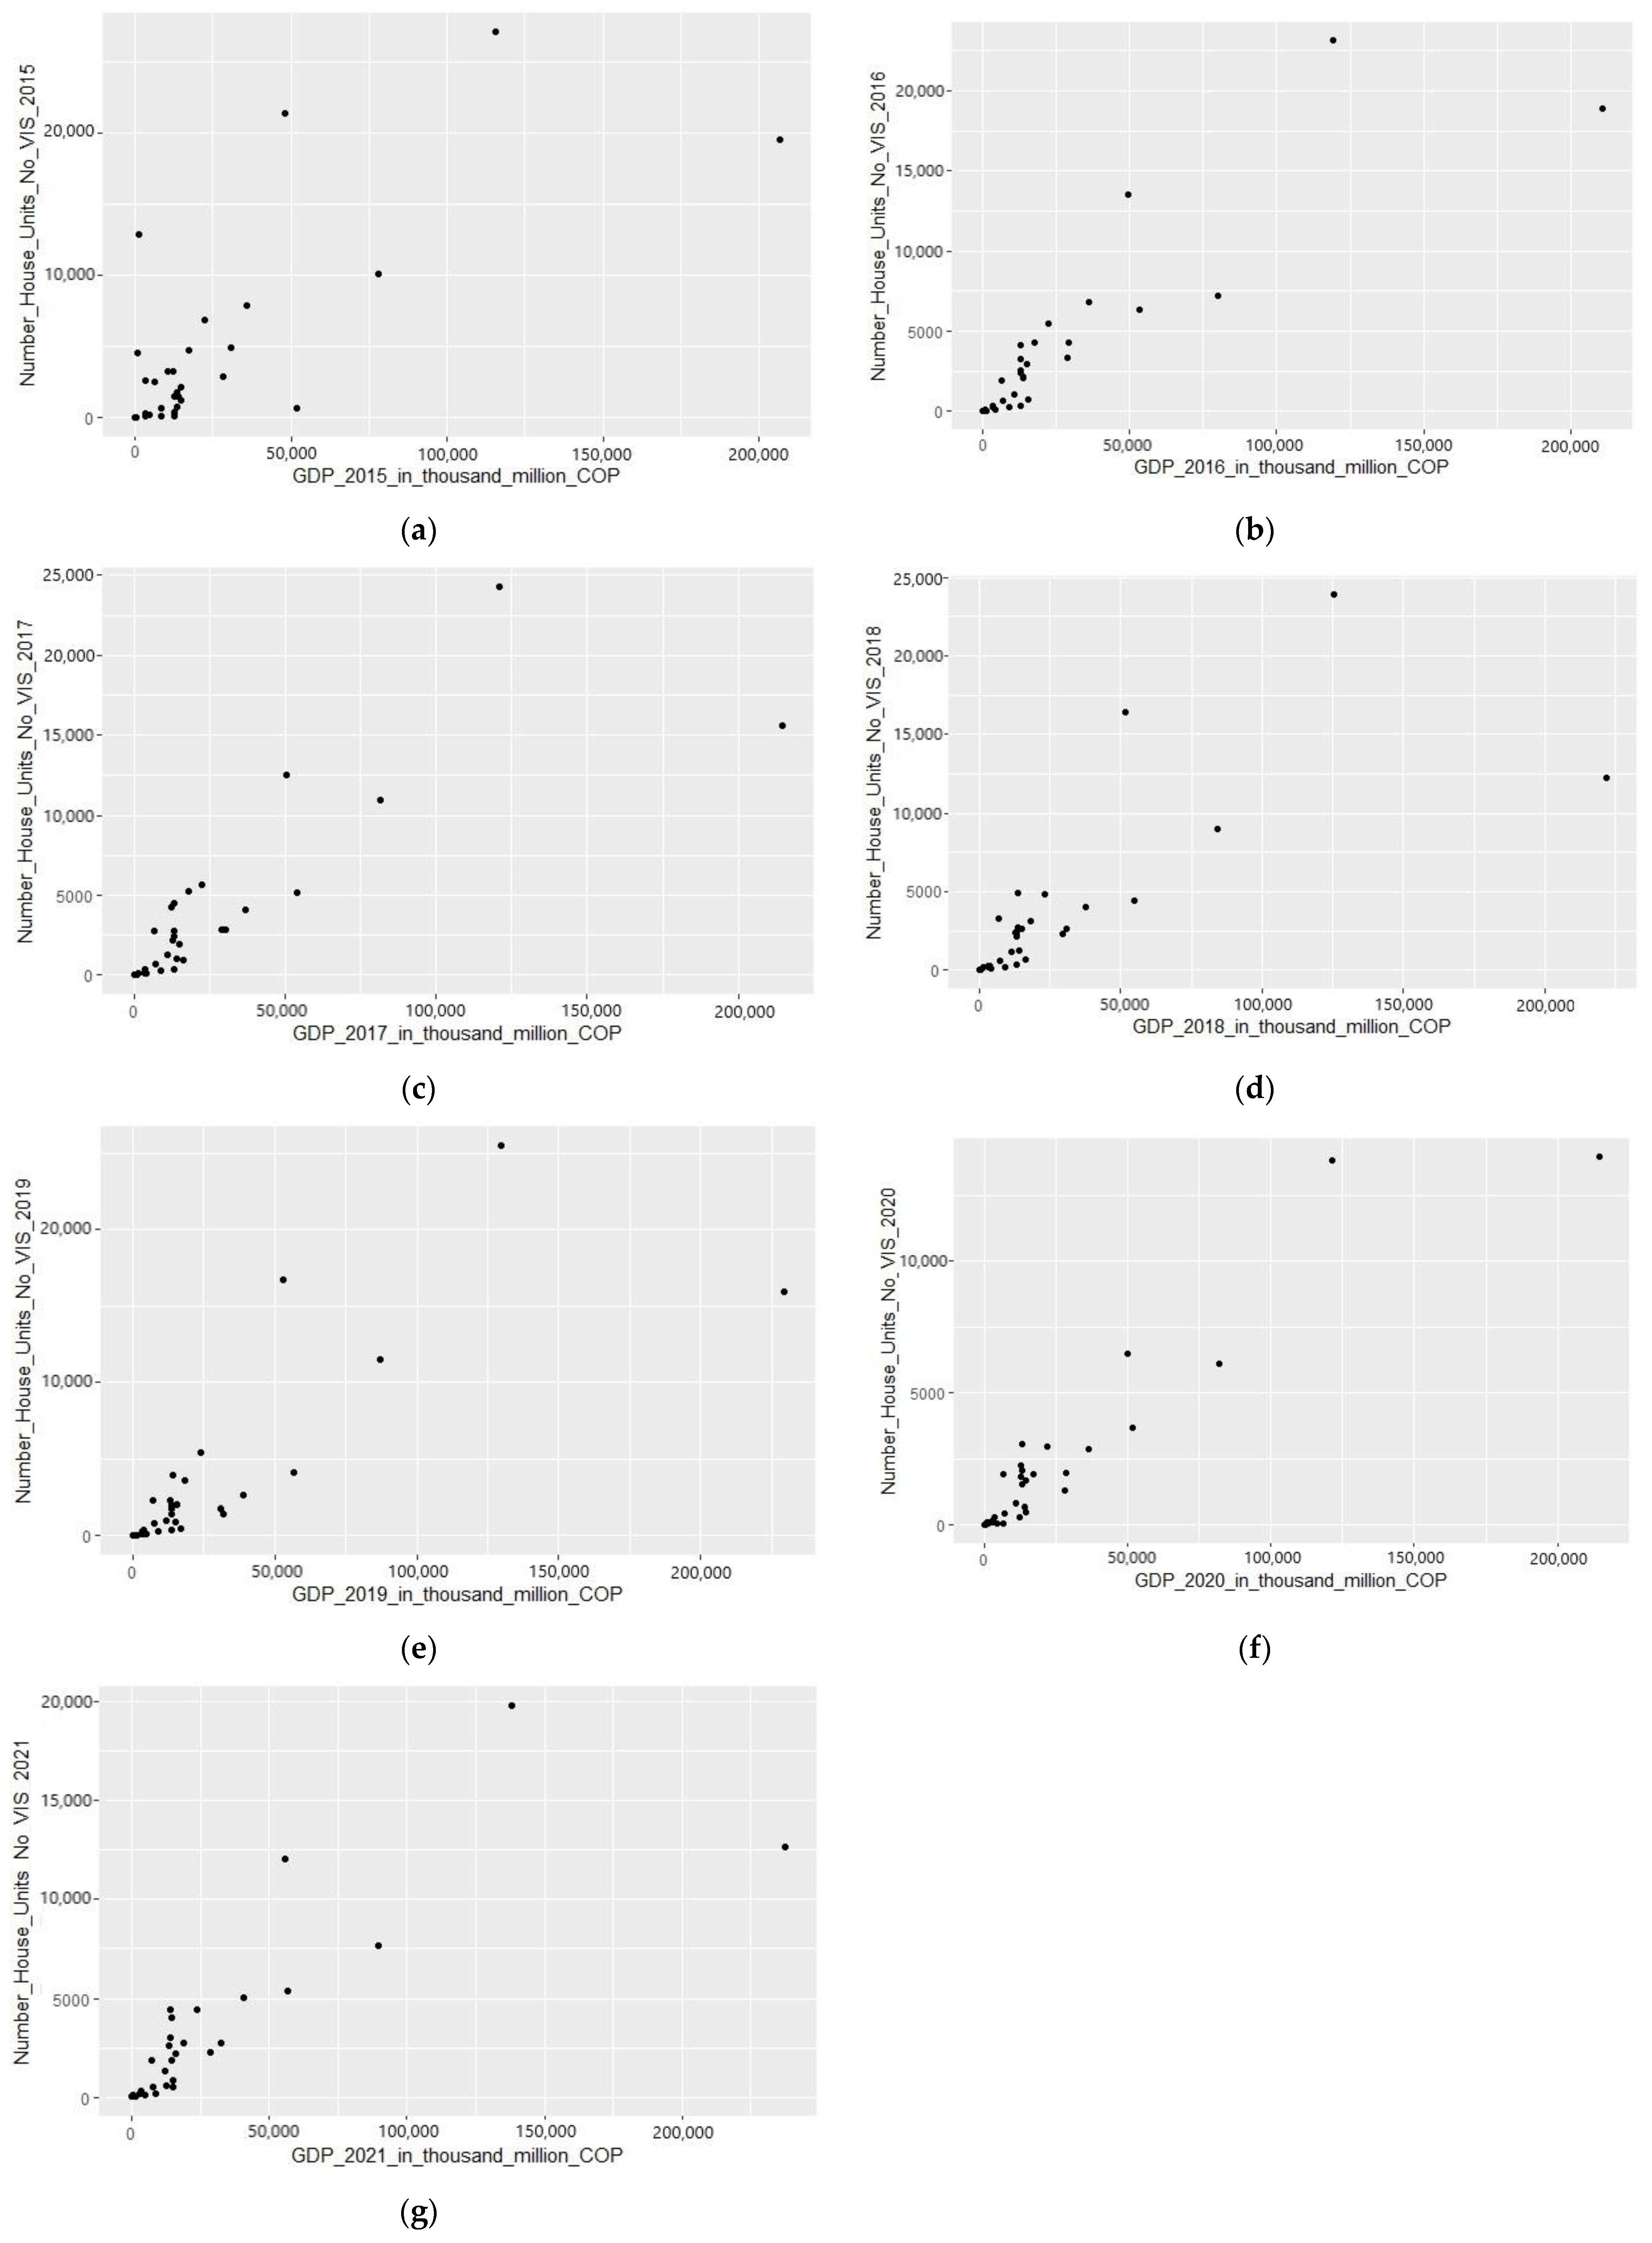
- Number of licensed non-VIS units reported for Colombia as a whole and for each of the 33 departments, 2015–2021.
- Departmental GDP for the manufacturing industry, 2015–2021, for each of the 33 departments.
- Departmental GDP for the construction industry, 2015–2021, for each of the 33 departments.
- Departmental GDP for the real estate industry, 2015–2021, for each of the 33 departments.
- Departmental GDP for the finance and insurance industry, 2015–2021, for each of the 33 departments.
- Departmental GDP for the mining industry, 2015–2021, for each of the 33 departments.
- Departmental GDP for the farming, livestock, forestry, and hunting and fishing (agriculture) industry, 2015–2021, for each of the 33 departments.
- Overall GDP or total departmental GDP, 2015–2021, for each of the 33 departments.
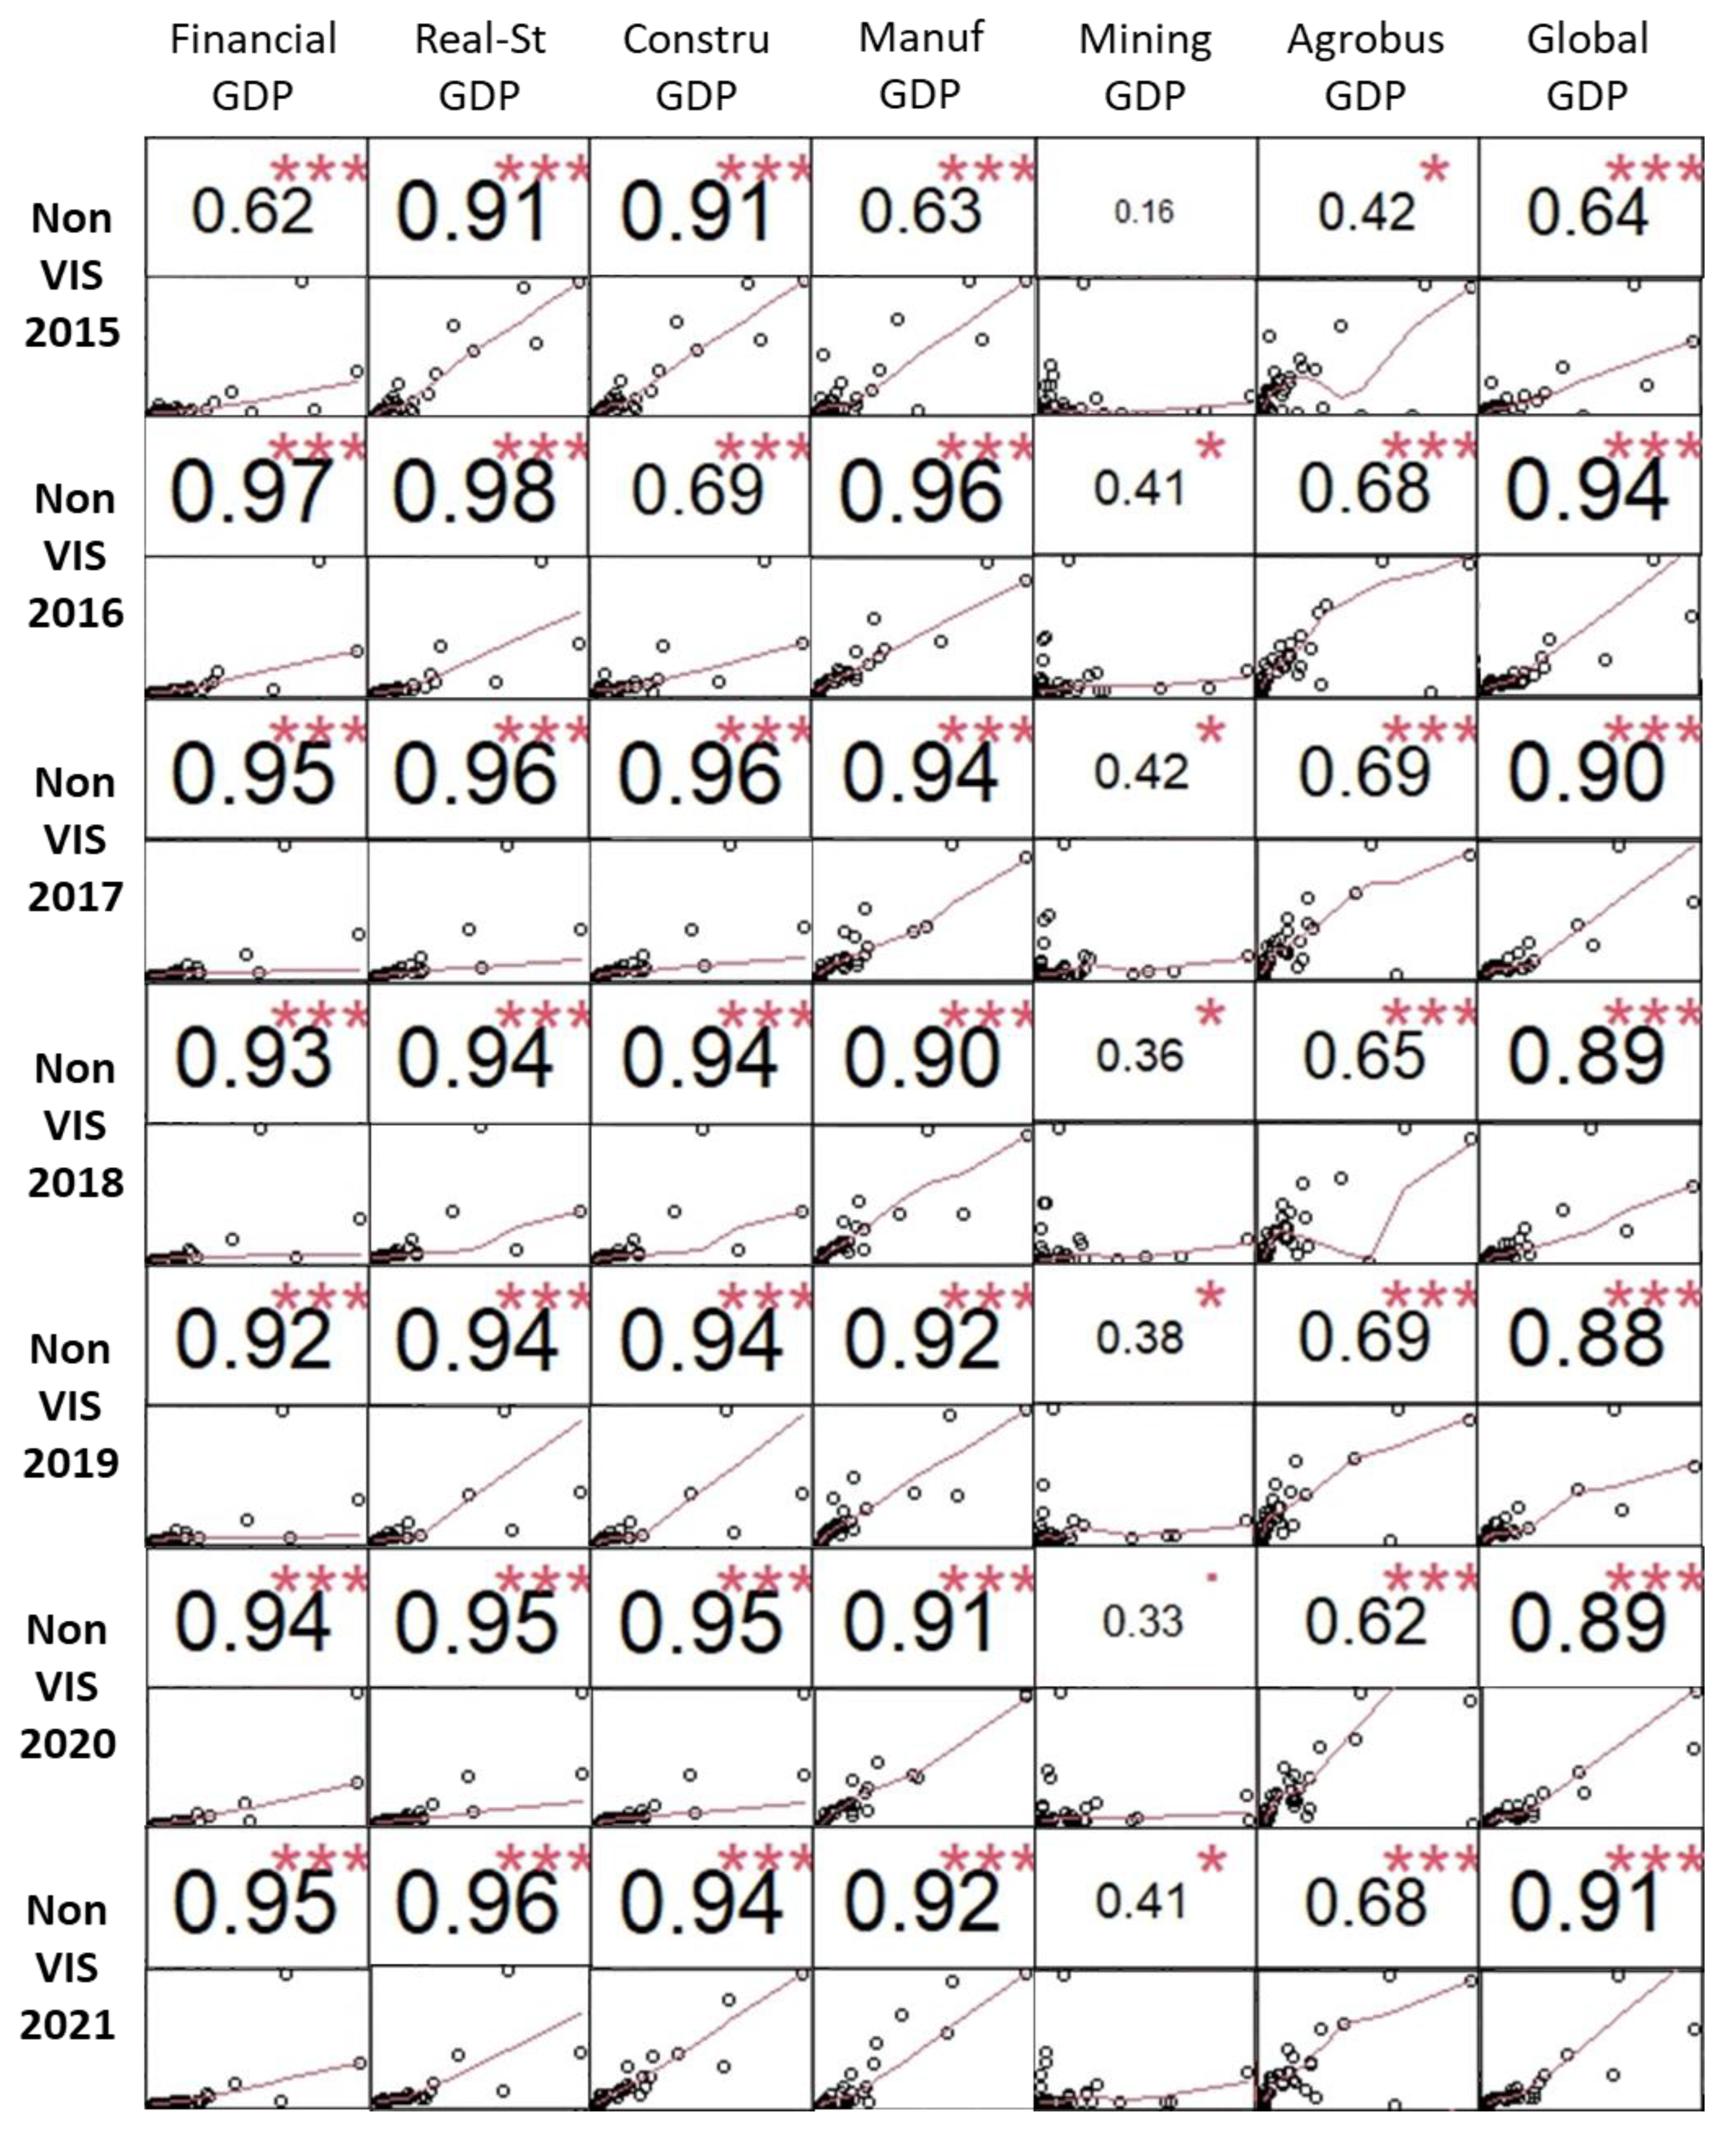
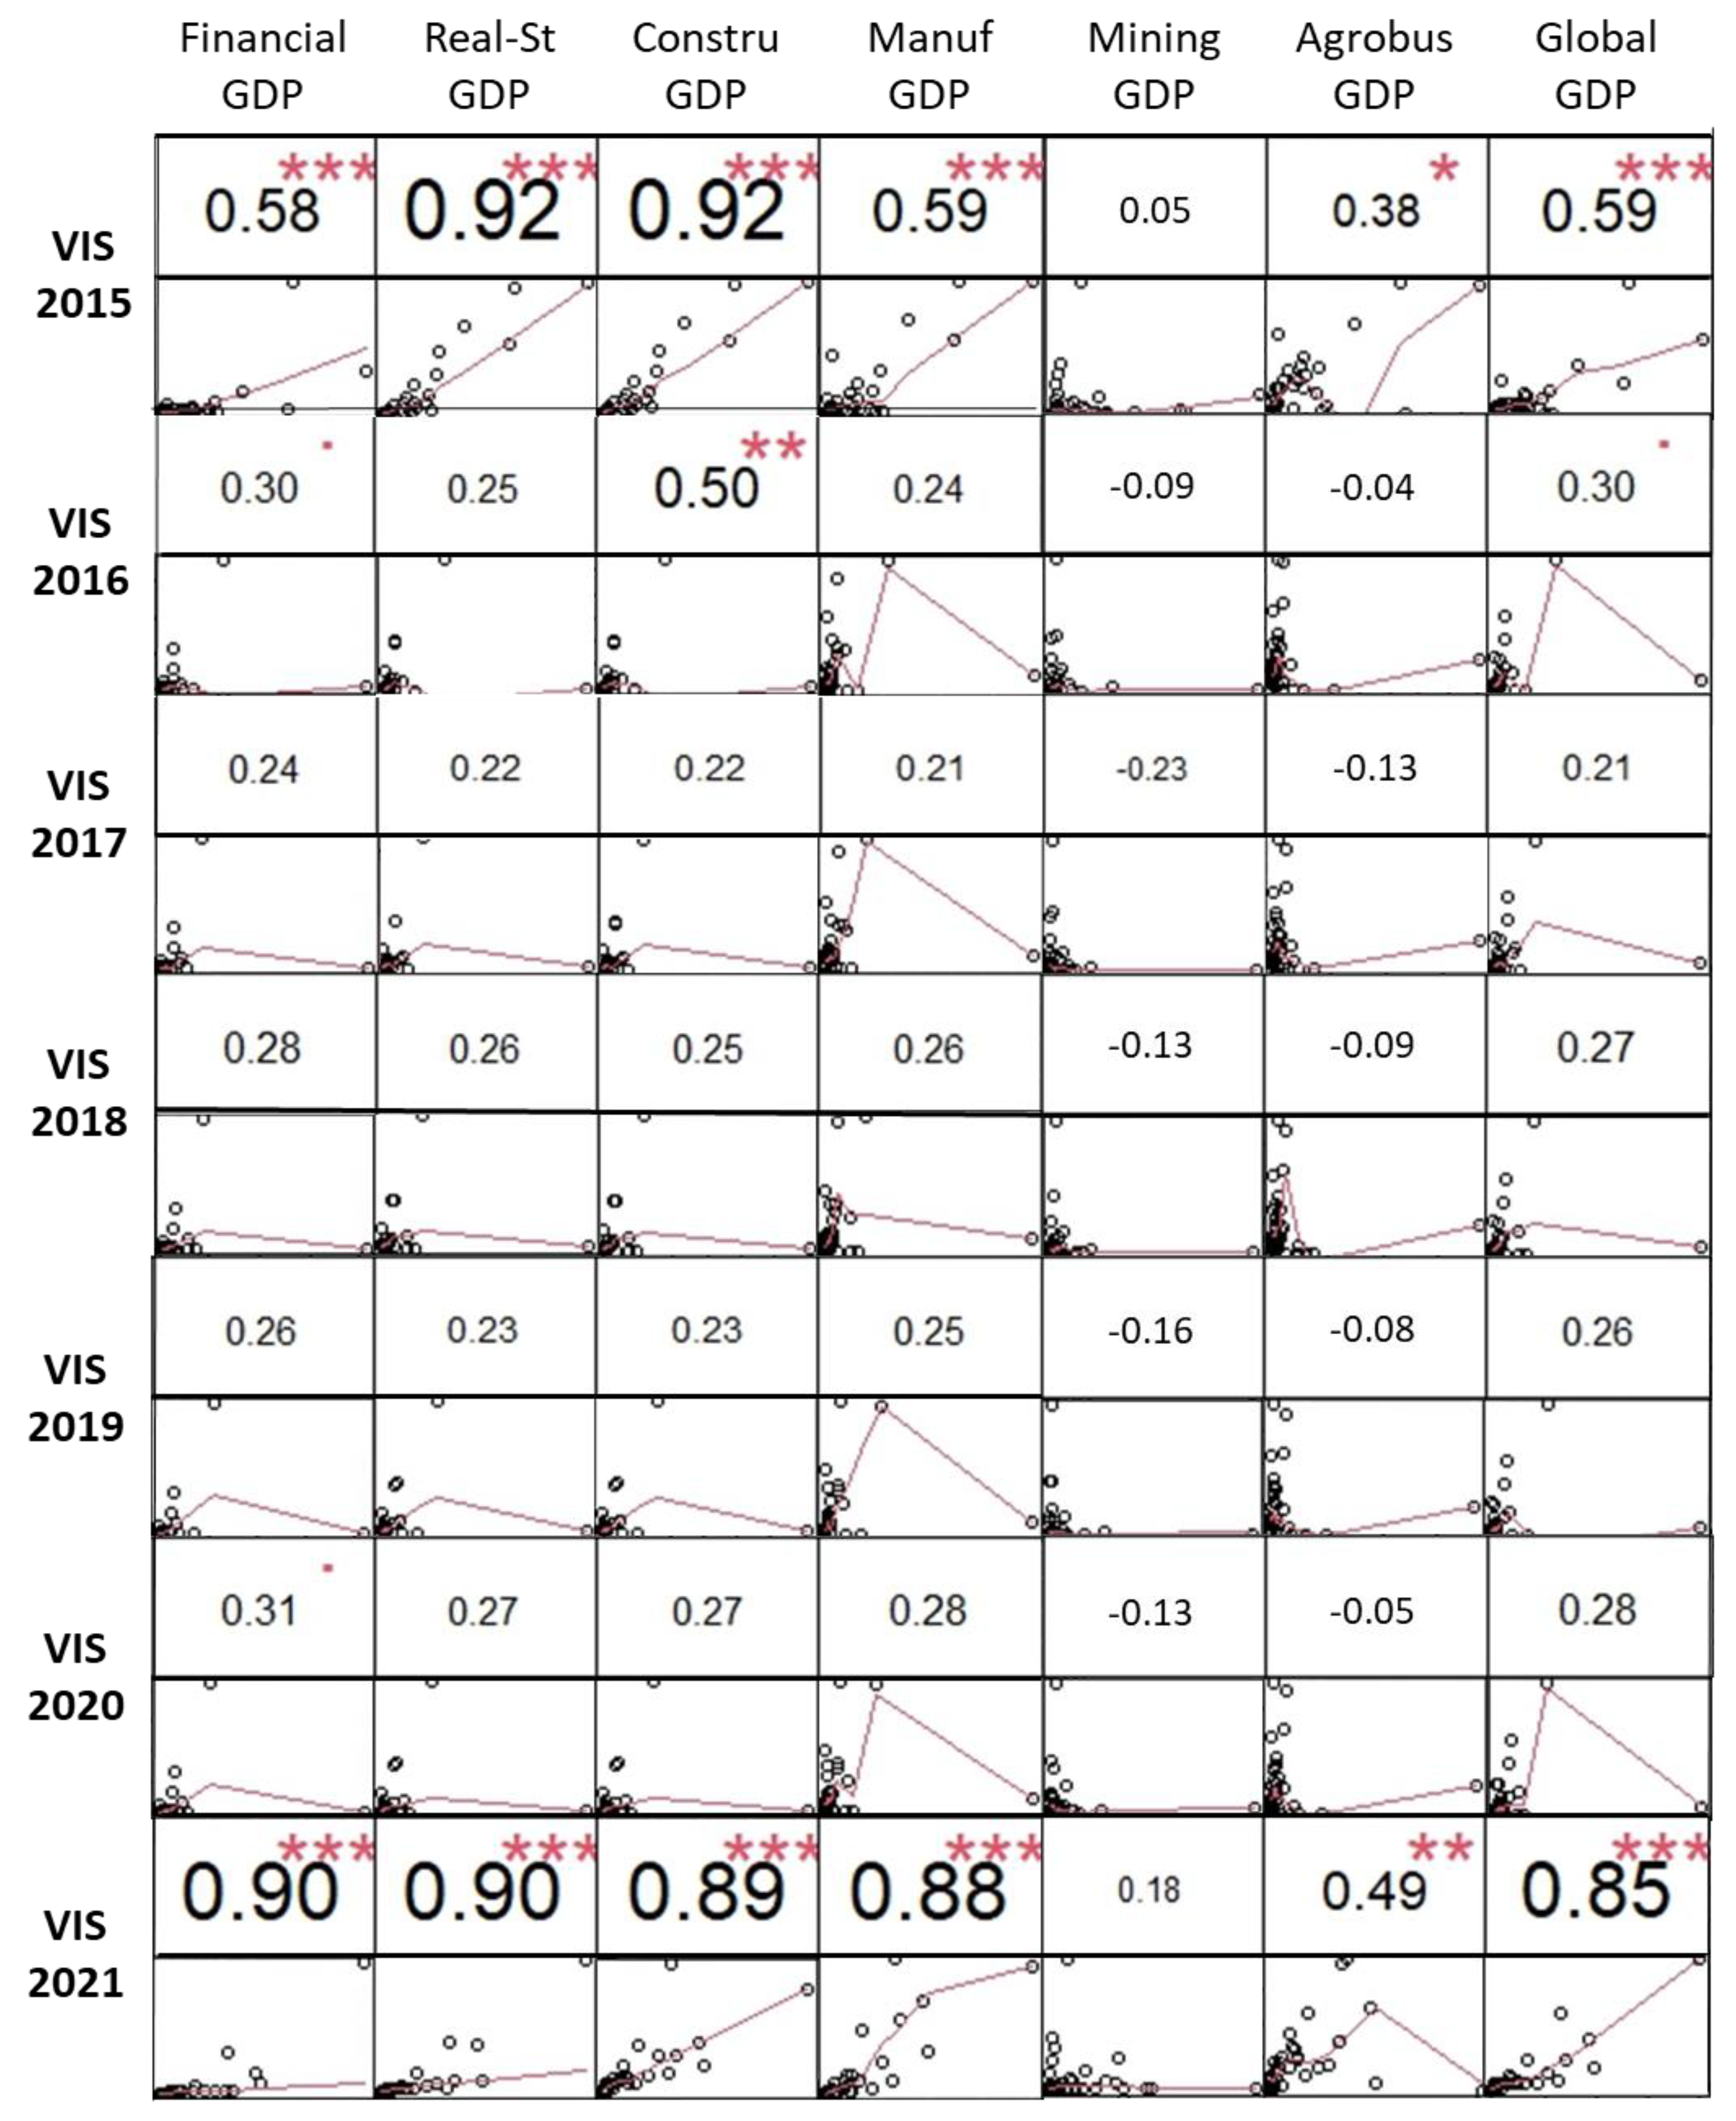
- Chart.Correlation (selected data group, method = “spearman”).
- The general economic performance of the country’s departments (measured based on the overall GDP).
- The economic performance for the main economic industries in Colombia (GDP by industry).
4. Results
4.1. Correlation between the Finance and Insurance Industry’s GDP and Number of Housing Units
4.2. Correlation between the Real Estate Industry’s GDP and Number of Housing Units
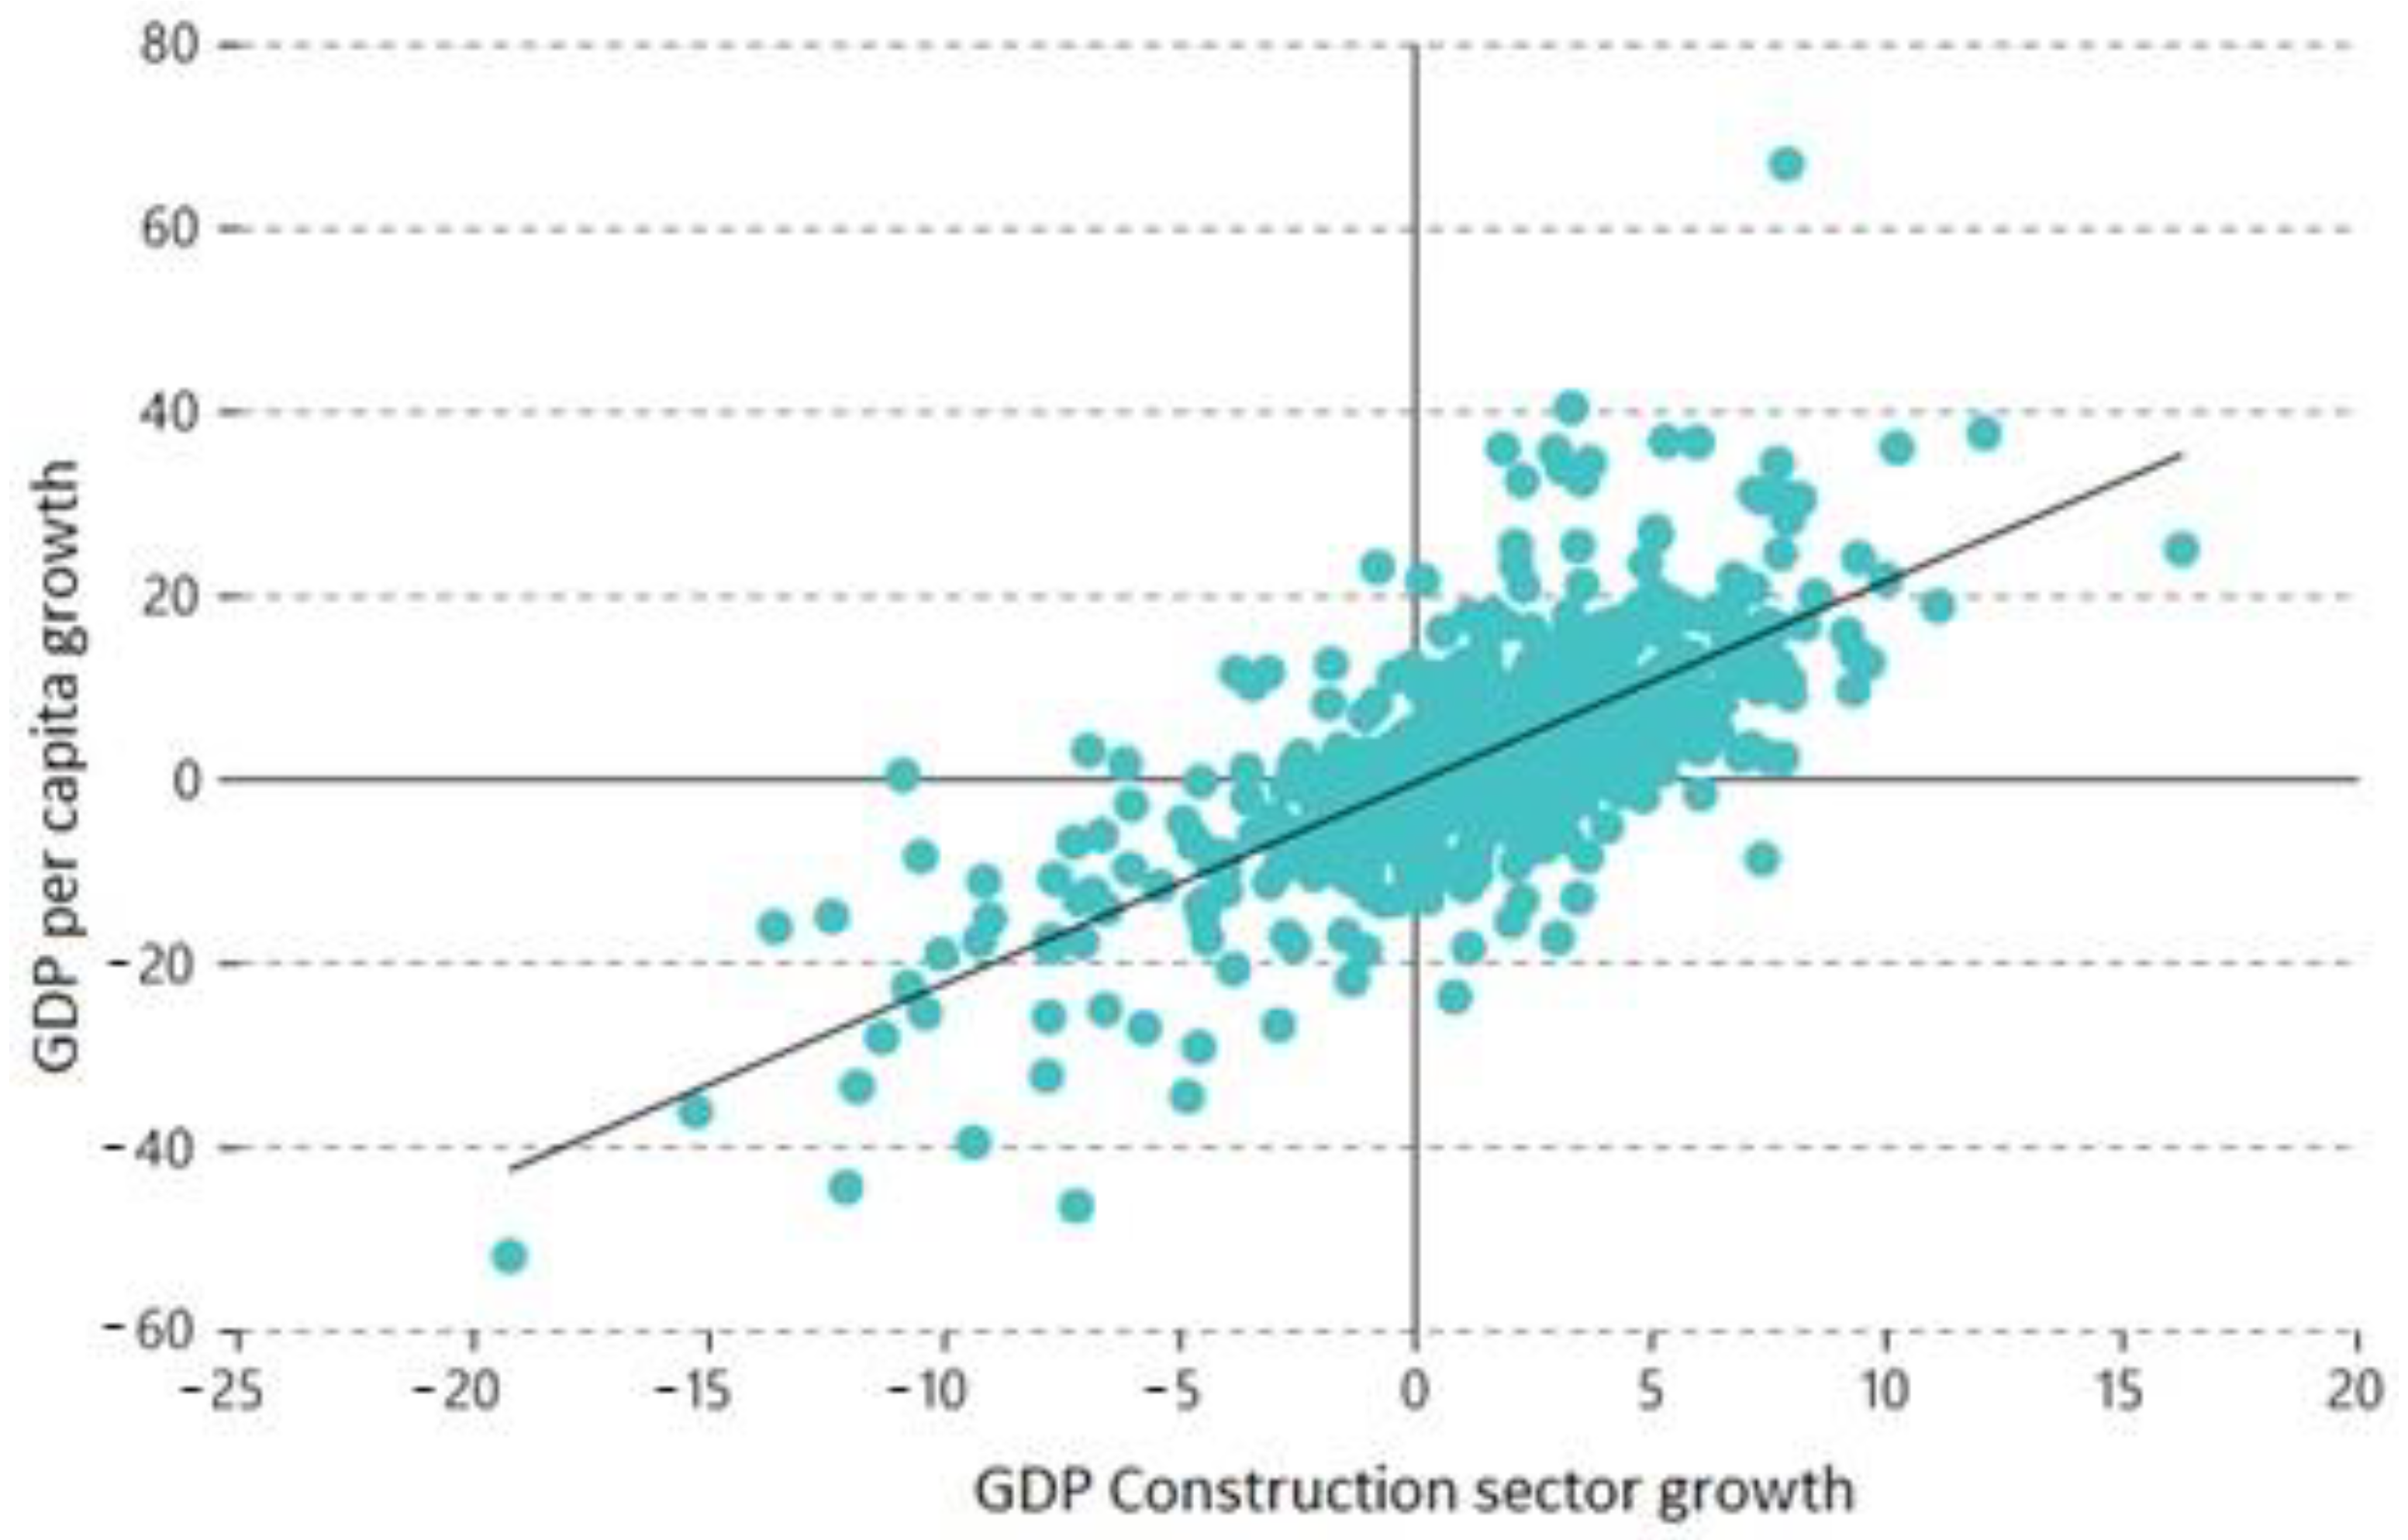
4.3. Correlation between the Construction Industry’s GDP and Number of Housing Units
4.4. Correlation between the Manufacturing Industry’s GDP and Number of Housing Units
4.5. Correlation between the Mining Industry’s GDP and Number of Housing Units
4.6. Correlation between the agrobusiness Industry’s GDP and Number of Housing Units
4.7. Correlation between Global GDP and Number of Housing Units
4.8. Low-Income (VIS) Housing
4.9. Non-VIS Housing
4.10. Correlation between the Number of Victims of Internal Displacement in Colombia and the Number of VIS Housing Units
5. Discussion
6. Conclusions
Author Contributions
Funding
Data Availability Statement
Conflicts of Interest
Appendix A

| Analisys Data | p-Value | Normally Distributed |
|---|---|---|
| Number_House Units_NoVIS_2015 | 3.31 × 10⁻⁷ | NO |
| Number_House Units_NoVIS_2016 | 2.52 × 10⁻⁴ | NO |
| Number_House Units_NoVIS_2017 | 2.57 × 10⁻⁴ | NO |
| Number_House Units_NoVIS_2018 | 8.88 × 10⁻⁵ | NO |
| Number_House Units_NoVIS_2019 | 2.52 × 10⁻⁵ | NO |
| Number_House Units_NoVIS_2020 | 7.55 × 10⁻⁵ | NO |
| Number_House Units_NoVIS_2021 | 5.02 × 10⁻⁷ | NO |
| Number_House Units_VIS_2015 | 5.02 × 10⁻⁴ | NO |
| Number_House Units_VIS_2016 | 5.29 × 10⁻⁸ | NO |
| Number_House Units_VIS_2017 | 4.01 × 10⁻⁸ | NO |
| Number_House Units_VIS_2018 | 5.05 × 10⁻⁸ | NO |
| Number_House Units_VIS_2019 | 6.12 × 10⁻⁸ | NO |
| Number_House Units_VIS_2020 | 5.30 × 10⁻⁸ | NO |
| Number_House Units_VIS_2021 | 4.35 × 10⁻⁷ | NO |
| Departmental_Manufacturing_GDP_2015 | 3.52 × 10⁻⁵ | NO |
| Departmental_Manufacturing_GDP_2016 | 3.87 × 10⁻⁵ | NO |
| Departmental_Manufacturing_GDP_2017 | 4.50 × 10⁻⁵ | NO |
| Departmental_Manufacturing_GDP_2018 | 4.73 × 10⁻⁵ | NO |
| Departmental_Manufacturing_GDP_2019 | 4.66 × 10⁻⁵ | NO |
| Departmental_Manufacturing_GDP_2020 | 5.70 × 10⁻⁵ | NO |
| Departmental_Manufacturing_GDP_2021 | 4.99 × 10⁻⁸ | NO |
| Departmental_Construction_GDP_2015 | 6.45 × 10⁻⁴ | NO |
| Departmental_Construction_GDP_2016 | 4.76 × 10⁻⁴ | NO |
| Departmental_Construction_GDP_2017 | 1.93 × 10⁻⁴ | NO |
| Departmental_Construction_GDP_2018 | 1.03 × 10⁻⁴ | NO |
| Departmental_Construction_GDP_2019 | 1.42 × 10⁻⁴ | NO |
| Departmental_Construction_GDP_2020 | 1.89 × 10⁻⁷ | NO |
| Departmental_Construction_GDP_2021 | 1.39 × 10⁻⁷ | NO |
| Departmental_Real_State_GDP_2015 | 2.53 × 10⁻⁷ | NO |
| Departmental_Real_State_GDP_2016 | 2.69 × 10⁻⁷ | NO |
| Departmental_Real_State_GDP_2017 | 2.81 × 10⁻⁷ | NO |
| Departmental_Real_State_GDP_2018 | 2.85 × 10⁻⁷ | NO |
| Departmental_Real_State_GDP_2019 | 2.91 × 10⁻¹⁰ | NO |
| Departmental_Real_State_GDP_2020 | 2.95 × 10⁻⁷ | NO |
| Departmental_Real_State_GDP_2021 | 3.11 × 10⁻¹⁰ | NO |
| Departmental_Financial_Insurance_GDP_2015 | 4.79 × 10⁻⁸ | NO |
| Departmental_Financial_Insurance_GDP_2016 | 4.71 × 10⁻⁸ | NO |
| Departmental_Financial_Insurance_GDP_2017 | 4.65 × 10⁻⁸ | NO |
| Departmental_Financial_Insurance_GDP_2018 | 4.70 × 10⁻⁸ | NO |
| Departmental_Financial_Insurance_GDP_2019 | 4.75 × 10⁻⁸ | NO |
| Departmental_Financial_Insurance_GDP_2020 | 4.74 × 10⁻⁸ | NO |
| Departmental_Financial_Insurance_GDP_2021 | 4.72 × 10⁻¹¹ | NO |
| Departmental_Mining_GDP_2015 | 3.75 × 10⁻⁶ | NO |
| Departmental_Mining_GDP_2016 | 3.36 × 10⁻⁶ | NO |
| Departmental_Mining_GDP_2017 | 3.31 × 10⁻⁹ | NO |
| Departmental_Mining_GDP_2018 | 3.09 × 10⁻⁶ | NO |
| Departmental_Mining_GDP_2019 | 1.95 × 10⁻⁶ | NO |
| Departmental_Mining_GDP_2020 | 1.25 × 10⁻⁹ | NO |
| Departmental_Mining_GDP_2021 | 2.42 × 10⁻⁹ | NO |
| Departmental_Agrobusiness_GDP_2015 | 2.10 × 10⁻² | NO |
| Departmental_Agrobusiness_GDP_2016 | 1.83 × 10⁻² | NO |
| Departmental_Agrobusiness_GDP_2017 | 2.30 × 10⁻² | NO |
| Departmental_Agrobusiness_GDP_2018 | 2.01 × 10⁻² | NO |
| Departmental_Agrobusiness_GDP_2019 | 1.86 × 10⁻² | NO |
| Departmental_Agrobusiness_GDP_2020 | 1.95 × 10⁻² | NO |
| Departmental_Agrobusiness_GDP_2021 | 1.43 × 10⁻⁵ | NO |
| Departmental_Global_GDP_2015 | 1.24 × 10⁻⁵ | NO |
| Departmental_Global_GDP_2016 | 1.21 × 10⁻⁵ | NO |
| Departmental_Global_GDP_2017 | 1.18 × 10⁻⁵ | NO |
| Departmental_Global_GDP_2018 | 1.08 × 10⁻⁵ | NO |
| Departmental_Global_GDP_2019 | 1.06 × 10⁻⁵ | NO |
| Departmental_Global_GDP_2020 | 9.73 × 10⁻⁶ | NO |
| Departmental_Global_GDP_2021 | 9.13 × 10⁻⁹ | NO |
| Department | rho | Department | rho |
|---|---|---|---|
| COLOMBIA | 0.9642857 | GUAVIARE | 1.0000000 |
| AMAZONAS | 0.9642857 | HUILA | 1.0000000 |
| ANTIOQUIA | 1.0000000 | LA_GUAJIRA | 0.9642857 |
| ARAUCA | 0.8928571 | MAGDALENA | 0.9642857 |
| ATLANTICO | 0.8928571 | META | 0.8928571 |
| BOGOTA | 0.9642857 | NARINO | 1.0000000 |
| BOLIVAR | 0.9642857 | NORTE SANTANDER | 0.8928571 |
| BOYACA | 1.0000000 | PUTUMAYO | 0.7857143 |
| CALDAS | 1.0000000 | QUINDIO | 1.0000000 |
| CAQUETA | 1.0000000 | RISARALDA | 1.0000000 |
| CASANARE | 0.8928571 | SAN_ANDRES | 0.9642857 |
| CAUCA | 1.0000000 | SANTANDER | 0.9642857 |
| CESAR | 0.8928571 | SUCRE | 0.9642857 |
| CHOCO | 0.9642857 | TOLIMA | 1.0000000 |
| CORDOBA | 1.0000000 | VALLE | 1.0000000 |
| CUNDINAMARCA | 0.6071429 | VAUPES | 0.7500000 |
| GUAINIA | 0.7500000 | VICHADA | 1.0000000 |
| Department | # House Units VIS 2015 | # House Units VIS 2016 | # House Units VIS 2017 | # House Units VIS 2018 | # House Units VIS 2019 | # House Units VIS 2020 | # House Units VIS 2021 |
|---|---|---|---|---|---|---|---|
| AMAZONAS | 122 | 170 | 0 | 0 | 0 | 0 | 102 |
| ANTIOQUIA | 19,755 | 3252 | 4129 | 4407 | 6141 | 6241 | 6564 |
| ARAUCA | 92 | 564 | 63 | 86 | 6 | 4 | 4 |
| ATLANTICO | 5038 | 3538 | 6635 | 8366 | 8496 | 8629 | 9899 |
| BOGOTA | 12,632 | 22,147 | 12,840 | 13,600 | 26,006 | 20,161 | 20,104 |
| BOLIVAR | 2737 | 5823 | 5632 | 3099 | 5579 | 4664 | 5387 |
| BOYACA | 4405 | 1975 | 1454 | 1954 | 2012 | 578 | 1915 |
| CALDAS | 1871 | 1770 | 1339 | 436 | 602 | 1340 | 1692 |
| CAQUETA | 301 | 6 | 1 | 107 | 11 | 0 | 0 |
| CASANARE | 623 | 25 | 33 | 233 | 50 | 14 | 29 |
| CAUCA | 2210 | 458 | 1156 | 316 | 782 | 893 | 2398 |
| CESAR | 526 | 1057 | 636 | 438 | 836 | 334 | 494 |
| CHOCO | 243 | 34 | 0 | 0 | 0 | 0 | 0 |
| CORDOBA | 896 | 74,985 | 66,561 | 72,421 | 97,729 | 83,068 | 587 |
| CUNDINAMARCA | 12,044 | 1679 | 1087 | 1049 | 1291 | 535 | 6986 |
| GUAINIA | 75 | 6818 | 7567 | 10,926 | 17,010 | 7488 | 0 |
| GUAVIARE | 97 | 385 | 1508 | 702 | 1479 | 868 | 2 |
| HUILA | 4460 | 0 | 0 | 0 | 200 | 239 | 2042 |
| LA_GUAJIRA | 183 | 0 | 0 | 0 | 205 | 3 | 92 |
| MAGDALENA | 1328 | 665 | 1456 | 1119 | 2201 | 1136 | 2387 |
| META | 2293 | 1588 | 776 | 1525 | 389 | 1114 | 1558 |
| NARINO | 2643 | 1077 | 2031 | 472 | 687 | 3049 | 874 |
| NORTE SANTANDER | 2986 | 147 | 598 | 2218 | 403 | 329 | 4266 |
| PUTUMAYO | 200 | 1416 | 2539 | 1813 | 1854 | 2677 | 909 |
| QUINDIO | 1878 | 0 | 302 | 0 | 11 | 217 | 698 |
| RISARALDA | 4000 | 737 | 1865 | 1901 | 1893 | 1965 | 3013 |
| SAN_ANDRES | 45 | 3433 | 3225 | 4041 | 2340 | 2380 | |
| SANTANDER | 5393 | 0 | 0 | 0 | 0 | 0 | 3498 |
| SUCRE | 521 | 661 | 1293 | 1143 | 1296 | 1549 | 408 |
| TOLIMA | 2757 | 1343 | 238 | 564 | 726 | 1151 | 6286 |
| VALLE | 7640 | 3622 | 3500 | 3535 | 5467 | 4952 | 9371 |
| VAUPES | 52 | 10,595 | 4576 | 8335 | 9754 | 10,358 | 3 |
| VICHADA | 33 | 0 | 0 | 1 | 2 | 0 | 42 |
| Department | # House Units No VIS 2015 | # House Units No VIS 2016 | # House Units No VIS 2017 | # House Units No VIS 2018 | # House Units No VIS 2019 | # House Units No VIS 2020 | # House Units No VIS 2021 |
|---|---|---|---|---|---|---|---|
| AMAZONAS | 40 | 65 | 19 | 14 | 29 | 55 | 122 |
| ANTIOQUIA | 27,074 | 23,120 | 24,251 | 23,875 | 25,446 | 13,829 | 19,755 |
| ARAUCA | 194 | 140 | 105 | 118 | 117 | 51 | 92 |
| ATLANTICO | 7869 | 6795 | 4069 | 3999 | 2674 | 2858 | 5038 |
| BOGOTA | 19,512 | 18,857 | 15,562 | 12,281 | 15,969 | 13,946 | 12,632 |
| BOLIVAR | 2867 | 4289 | 2856 | 2624 | 1391 | 1987 | 2737 |
| BOYACA | 6887 | 5474 | 5665 | 4814 | 5436 | 2964 | 4405 |
| CALDAS | 1553 | 2415 | 2461 | 2757 | 1788 | 2085 | 1871 |
| CAQUETA | 293 | 353 | 334 | 253 | 363 | 298 | 301 |
| CASANARE | 747 | 381 | 401 | 342 | 414 | 322 | 623 |
| CAUCA | 2149 | 2920 | 1935 | 2658 | 2002 | 1698 | 2210 |
| CESAR | 1218 | 740 | 951 | 678 | 501 | 511 | 526 |
| CHOCO | 154 | 155 | 136 | 193 | 121 | 120 | 243 |
| CORDOBA | 1792 | 2059 | 1058 | 1261 | 876 | 704 | 896 |
| CUNDINAMARCA | 21,347 | 13,532 | 12,573 | 16,409 | 16,734 | 6497 | 12,044 |
| GUAINIA | 14 | 27 | 48 | 34 | 35 | 38 | 75 |
| GUAVIARE | 155 | 95 | 56 | 15 | 21 | 93 | 97 |
| HUILA | 4524 | 2150 | 2797 | 2162 | 1451 | 1567 | 4460 |
| LA_GUAJIRA | 689 | 244 | 248 | 188 | 275 | 82 | 183 |
| MAGDALENA | 1505 | 1083 | 1262 | 1210 | 997 | 824 | 1328 |
| META | 3291 | 3311 | 2841 | 2293 | 1789 | 1327 | 2293 |
| NARINO | 4973 | 3230 | 4294 | 2369 | 2329 | 2254 | 2643 |
| NORTE SANTANDER | 3302 | 2547 | 2221 | 2358 | 2007 | 1813 | 2986 |
| PUTUMAYO | 447 | 300 | 170 | 276 | 292 | 176 | 200 |
| QUINDIO | 2581 | 1900 | 2804 | 3270 | 2320 | 1934 | 1878 |
| RISARALDA | 2562 | 4159 | 4499 | 4954 | 3974 | 3048 | 4000 |
| SAN_ANDRES | 93 | 61 | 117 | 178 | 55 | 53 | 45 |
| SANTANDER | 12,897 | 6314 | 5168 | 4398 | 4096 | 3705 | 5393 |
| SUCRE | 683 | 694 | 668 | 635 | 842 | 429 | 521 |
| TOLIMA | 4789 | 4264 | 5283 | 3102 | 3636 | 1911 | 2757 |
| VALLE | 10,113 | 7228 | 10,971 | 8986 | 11,543 | 6135 | 7640 |
| VAUPES | 15 | 31 | 23 | 30 | 32 | 29 | 52 |
| VICHADA | 8 | 7 | 11 | 6 | 8 | 5 | 33 |
| Department | General GDP 2015 | General GDP 2016 | General GDP 2017 | General GDP 2018 | General GDP 2019 | General GDP 2020 | General GDP 2021 |
|---|---|---|---|---|---|---|---|
| AMAZONAS | 593 | 614 | 630 | 648 | 666 | 615 | 677 |
| ANTIOQUIA | 115,446 | 119,046 | 120,973 | 125,173 | 129,672 | 121,300 | 137,977 |
| ARAUCA | 4534 | 4272 | 4168 | 4293 | 4596 | 4565 | 4757 |
| ATLANTICO | 35,716 | 36,347 | 36,779 | 37,610 | 38,690 | 36,173 | 40,643 |
| BOGOTA | 206,478 | 210,683 | 214,484 | 221,652 | 229,314 | 214,485 | 237,244 |
| BOLIVAR | 28,105 | 29,285 | 30,271 | 30,804 | 31,920 | 28,623 | 32,610 |
| BOYACA | 22,165 | 22,341 | 22,574 | 23,237 | 23,732 | 21,709 | 23,518 |
| CALDAS | 12,514 | 12,821 | 13,043 | 13,395 | 13,798 | 13,174 | 14,604 |
| CAQUETA | 3350 | 3427 | 3454 | 3525 | 3596 | 3387 | 3634 |
| CASANARE | 13,305 | 12,938 | 12,960 | 13,291 | 13,493 | 12,245 | 12,396 |
| CAUCA | 14,622 | 14,975 | 14,876 | 15,139 | 15,614 | 14,630 | 16,019 |
| CESAR | 14,570 | 15,676 | 16,123 | 16,090 | 16,646 | 14,256 | 14,828 |
| CHOCO | 3571 | 3765 | 3482 | 3202 | 3341 | 3264 | 3508 |
| CORDOBA | 13,657 | 13,731 | 13,920 | 14,196 | 14,774 | 13,915 | 15,269 |
| CUNDINAMARCA | 48,055 | 49,601 | 50,409 | 51,551 | 52,890 | 49,779 | 55,575 |
| GUAINIA | 307 | 307 | 304 | 313 | 322 | 293 | 334 |
| GUAVIARE | 8666 | 676 | 692 | 693 | 715 | 683 | 742 |
| HUILA | 677 | 13,636 | 13,212 | 13,369 | 13,754 | 13,144 | 14,221 |
| LA_GUAJIRA | 8666 | 8891 | 8996 | 8977 | 8955 | 6684 | 8857 |
| MAGDALENA | 13,805 | 10,869 | 10,990 | 11,248 | 11,525 | 10,832 | 12,112 |
| META | 10,514 | 28,904 | 29,022 | 29,404 | 30,800 | 28,105 | 28,788 |
| NARINO | 30,712 | 12,760 | 12,441 | 12,643 | 13,064 | 12,501 | 13,698 |
| NORTE SANTANDER | 12,230 | 13,041 | 12,940 | 13,347 | 13,550 | 12,804 | 14,157 |
| PUTUMAYO | 12,534 | 3450 | 3386 | 3393 | 3284 | 2830 | 3080 |
| QUINDIO | 3481 | 6624 | 6736 | 6793 | 6968 | 6550 | 7338 |
| RISARALDA | 6381 | 13,027 | 13,202 | 13,551 | 13,969 | 13,185 | 14,649 |
| SAN_ANDRES | 12,656 | 1305 | 1343 | 1373 | 1416 | 1139 | 1442 |
| SANTANDER | 1253 | 53,175 | 54,065 | 54,942 | 56,515 | 51,681 | 56,567 |
| SUCRE | 51,999 | 6807 | 6982 | 7108 | 7366 | 6928 | 7667 |
| TOLIMA | 17,381 | 17,708 | 17,936 | 18,120 | 18,512 | 17,237 | 18,828 |
| VALLE | 78,074 | 80,022 | 81,447 | 84,172 | 87,023 | 81,835 | 89,872 |
| VAUPES | 233 | 236 | 239 | 248 | 257 | 237 | 258 |
| VICHADA | 529 | 529 | 541 | 556 | 581 | 554 | 600 |
| Department | Agrobus GDP 2015 | Agrobus GDP 2016 | Agrobus GDP 2017 | Agrobus GDP 2018 | Agrobus GDP 2019 | Agrobus GDP 2020 | Agrobus GDP 2021 |
|---|---|---|---|---|---|---|---|
| AMAZONAS | 96 | 94 | 98 | 102 | 104 | 113 | 114 |
| ANTIOQUIA | 6153 | 6363 | 6567 | 6678 | 6897 | 7024 | 7459 |
| ARAUCA | 748 | 767 | 840 | 866 | 885 | 902 | 957 |
| ATLANTICO | 330 | 353 | 375 | 392 | 405 | 411 | 436 |
| BOGOTA | 12 | 12 | 13 | 13 | 13 | 13 | 13 |
| BOLIVAR | 1196 | 1218 | 1280 | 1335 | 1374 | 1449 | 1469 |
| BOYACA | 2143 | 2186 | 2405 | 2449 | 2528 | 2571 | 2574 |
| CALDAS | 1274 | 1211 | 1262 | 1281 | 1311 | 1328 | 1305 |
| CAQUETA | 460 | 498 | 509 | 504 | 526 | 541 | 533 |
| CASANARE | 1220 | 1427 | 1525 | 1528 | 1555 | 1583 | 1686 |
| CAUCA | 1693 | 1766 | 1852 | 1826 | 1884 | 1903 | 1997 |
| CESAR | 1256 | 1169 | 1243 | 1276 | 1326 | 1343 | 1376 |
| CHOCO | 582 | 619 | 651 | 637 | 668 | 687 | 707 |
| CORDOBA | 1543 | 1478 | 1496 | 1529 | 1557 | 1595 | 1613 |
| CUNDINAMARCA | 6300 | 6592 | 7112 | 7277 | 7471 | 7594 | 7896 |
| GUAINIA | 25 | 26 | 29 | 30 | 30 | 32 | 32 |
| GUAVIARE | 326 | 140 | 144 | 146 | 147 | 149 | 157 |
| HUILA | 129 | 2266 | 2275 | 2319 | 2368 | 2439 | 2441 |
| LA_GUAJIRA | 326 | 332 | 374 | 375 | 387 | 391 | 392 |
| MAGDALENA | 2112 | 1591 | 1706 | 1706 | 1744 | 1744 | 1746 |
| META | 1576 | 2464 | 3050 | 3053 | 3123 | 3185 | 3431 |
| NARINO | 2361 | 1730 | 1841 | 1887 | 1916 | 2006 | 2013 |
| NORTE SANTANDER | 1767 | 1220 | 1248 | 1271 | 1299 | 1323 | 1330 |
| PUTUMAYO | 1199 | 191 | 181 | 186 | 187 | 192 | 197 |
| QUINDIO | 191 | 973 | 1017 | 1027 | 1056 | 1057 | 1121 |
| RISARALDA | 934 | 828 | 839 | 849 | 887 | 898 | 925 |
| SAN_ANDRES | 845 | 15 | 14 | 15 | 15 | 17 | 17 |
| SANTANDER | 15 | 3928 | 4191 | 4301 | 4452 | 4471 | 4557 |
| SUCRE | 3793 | 656 | 695 | 694 | 702 | 729 | 752 |
| TOLIMA | 2737 | 2744 | 2776 | 2734 | 2783 | 2840 | 2937 |
| VALLE | 4329 | 4394 | 4416 | 4558 | 4674 | 4856 | 4913 |
| VAUPES | 17 | 18 | 18 | 19 | 19 | 19 | 18 |
| VICHADA | 172 | 173 | 173 | 177 | 182 | 186 | 192 |
| Department | Mining GDP 2015 | Mining GDP 2016 | Mining GDP 2017 | Mining GDP 2018 | Mining GDP 2019 | Mining GDP 2020 | Mining GDP 2021 |
|---|---|---|---|---|---|---|---|
| AMAZONAS | 1 | 1 | 1 | 1 | 1 | 1 | 1 |
| ANTIOQUIA | 2430 | 2593 | 2187 | 2200 | 2188 | 2611 | 2960 |
| ARAUCA | 1704 | 1530 | 1404 | 1509 | 1691 | 1724 | 1677 |
| ATLANTICO | 96 | 102 | 105 | 105 | 113 | 92 | 99 |
| BOGOTA | 322 | 338 | 333 | 334 | 333 | 222 | 221 |
| BOLIVAR | 677 | 731 | 709 | 723 | 821 | 721 | 771 |
| BOYACA | 2109 | 1962 | 1812 | 1784 | 1661 | 1432 | 1158 |
| CALDAS | 141 | 192 | 188 | 165 | 165 | 205 | 205 |
| CAQUETA | 16 | 16 | 14 | 14 | 13 | 11 | 11 |
| CASANARE | 6351 | 5981 | 5974 | 6177 | 6177 | 5263 | 4865 |
| CAUCA | 392 | 320 | 228 | 166 | 167 | 120 | 123 |
| CESAR | 4985 | 6177 | 6380 | 6113 | 6338 | 4579 | 4113 |
| CHOCO | 913 | 967 | 654 | 334 | 370 | 429 | 428 |
| CORDOBA | 201 | 225 | 220 | 237 | 298 | 353 | 334 |
| CUNDINAMARCA | 489 | 481 | 477 | 447 | 395 | 292 | 234 |
| GUAINIA | 33 | 29 | 22 | 19 | 21 | 12 | 22 |
| GUAVIARE | 3639 | 2 | 2 | 2 | 2 | 2 | 2 |
| HUILA | 3 | 906 | 844 | 835 | 824 | 790 | 760 |
| LA_GUAJIRA | 3639 | 3585 | 3418 | 3325 | 3166 | 1424 | 2853 |
| MAGDALENA | 1015 | 43 | 40 | 38 | 38 | 31 | 36 |
| META | 39 | 14,824 | 13,976 | 13,955 | 14,888 | 13,226 | 12,377 |
| NARINO | 16,456 | 645 | 226 | 120 | 119 | 77 | 77 |
| NORTE SANTANDER | 486 | 401 | 390 | 395 | 326 | 294 | 197 |
| PUTUMAYO | 395 | 1190 | 1183 | 1097 | 957 | 653 | 694 |
| QUINDIO | 1366 | 25 | 25 | 24 | 24 | 16 | 17 |
| RISARALDA | 27 | 52 | 47 | 46 | 46 | 45 | 43 |
| SAN_ANDRES | 45 | 1 | 1 | 1 | 1 | 1 | 1 |
| SANTANDER | 1 | 2145 | 2166 | 2341 | 2232 | 1866 | 1780 |
| SUCRE | 2367 | 42 | 47 | 47 | 48 | 47 | 46 |
| TOLIMA | 720 | 593 | 656 | 597 | 596 | 537 | 491 |
| VALLE | 160 | 151 | 128 | 132 | 141 | 92 | 109 |
| VAUPES | 1 | 1 | 1 | 1 | 1 | 1 | 1 |
| VICHADA | 2 | 2 | 2 | 2 | 2 | 1 | 1 |
| Department | Finan Ins GDP 2015 | Finan Ins GDP 2016 | Finan Ins GDP 2017 | Finan Ins GDP 2018 | Finan Ins GDP 2019 | Finan Ins GDP 2020 | Finan Ins GDP 2021 |
|---|---|---|---|---|---|---|---|
| AMAZONAS | 15 | 15 | 15 | 15 | 16 | 16 | 17 |
| ANTIOQUIA | 5517 | 5687 | 5992 | 6237 | 6660 | 6828 | 7171 |
| ARAUCA | 61 | 60 | 60 | 60 | 63 | 64 | 66 |
| ATLANTICO | 1469 | 1500 | 1579 | 1647 | 1753 | 1791 | 1817 |
| BOGOTA | 17,123 | 17,717 | 18,722 | 19,404 | 20,600 | 21,070 | 21,794 |
| BOLIVAR | 648 | 669 | 702 | 722 | 765 | 782 | 805 |
| BOYACA | 401 | 411 | 430 | 448 | 475 | 485 | 502 |
| CALDAS | 388 | 397 | 417 | 433 | 455 | 466 | 482 |
| CAQUETA | 84 | 86 | 90 | 93 | 99 | 101 | 104 |
| CASANARE | 175 | 165 | 173 | 178 | 188 | 191 | 196 |
| CAUCA | 259 | 252 | 263 | 270 | 286 | 292 | 301 |
| CESAR | 256 | 264 | 277 | 287 | 303 | 310 | 318 |
| CHOCO | 61 | 63 | 66 | 67 | 72 | 73 | 75 |
| CORDOBA | 338 | 322 | 322 | 325 | 347 | 355 | 367 |
| CUNDINAMARCA | 582 | 602 | 632 | 652 | 694 | 710 | 735 |
| GUAINIA | 6 | 6 | 6 | 6 | 7 | 7 | 7 |
| GUAVIARE | 138 | 13 | 13 | 14 | 15 | 15 | 16 |
| HUILA | 14 | 364 | 383 | 397 | 420 | 430 | 444 |
| LA_GUAJIRA | 138 | 134 | 140 | 144 | 151 | 154 | 161 |
| MAGDALENA | 355 | 281 | 295 | 305 | 323 | 329 | 338 |
| META | 273 | 434 | 454 | 469 | 493 | 501 | 513 |
| NARINO | 425 | 351 | 370 | 385 | 407 | 417 | 429 |
| NORTE SANTANDER | 342 | 379 | 398 | 412 | 438 | 448 | 463 |
| PUTUMAYO | 371 | 53 | 55 | 57 | 61 | 62 | 64 |
| QUINDIO | 52 | 190 | 200 | 208 | 222 | 227 | 235 |
| RISARALDA | 186 | 457 | 478 | 495 | 522 | 533 | 550 |
| SAN_ANDRES | 445 | 35 | 37 | 38 | 40 | 41 | 42 |
| SANTANDER | 34 | 1237 | 1303 | 1360 | 1443 | 1470 | 1516 |
| SUCRE | 1200 | 164 | 172 | 179 | 189 | 194 | 199 |
| TOLIMA | 454 | 464 | 484 | 501 | 529 | 541 | 557 |
| VALLE | 2853 | 2945 | 3112 | 3236 | 3456 | 3523 | 3599 |
| VAUPES | 3 | 2 | 3 | 3 | 3 | 3 | 3 |
| VICHADA | 11 | 10 | 9 | 9 | 10 | 10 | 11 |
| Department | RealSt GDP 2015 | RealSt GDP 2016 | RealSt GDP 2017 | RealSt GDP 2018 | RealSt GDP 2019 | RealSt GDP 2020 | RealSt GDP 2021 |
|---|---|---|---|---|---|---|---|
| AMAZONAS | 12 | 25 | 24 | 24 | 25 | 25 | 26 |
| ANTIOQUIA | 19,967 | 11,790 | 10,578 | 11,097 | 11,613 | 11,790 | 12,287 |
| ARAUCA | 134 | 167 | 154 | 159 | 164 | 167 | 173 |
| ATLANTICO | 5916 | 2887 | 2620 | 2732 | 2830 | 2887 | 2950 |
| BOGOTA | 19,243 | 31,480 | 29,022 | 30,138 | 31,047 | 31,480 | 32,062 |
| BOLIVAR | 4688 | 2134 | 1951 | 2027 | 2092 | 2134 | 2169 |
| BOYACA | 2819 | 1403 | 1265 | 1322 | 1375 | 1403 | 1458 |
| CALDAS | 1767 | 956 | 879 | 910 | 941 | 956 | 975 |
| CAQUETA | 98 | 276 | 255 | 265 | 273 | 276 | 281 |
| CASANARE | 318 | 383 | 356 | 370 | 379 | 383 | 396 |
| CAUCA | 2618 | 791 | 721 | 753 | 777 | 791 | 809 |
| CESAR | 562 | 836 | 767 | 795 | 821 | 836 | 848 |
| CHOCO | 31 | 78 | 73 | 76 | 78 | 78 | 80 |
| CORDOBA | 1422 | 527 | 493 | 510 | 523 | 527 | 539 |
| CUNDINAMARCA | 10,815 | 2523 | 2242 | 2359 | 2473 | 2523 | 2615 |
| GUAINIA | 8 | 10 | 9 | 10 | 10 | 10 | 10 |
| GUAVIARE | 12 | 34 | 32 | 33 | 34 | 34 | 36 |
| HUILA | 484 | 840 | 781 | 810 | 829 | 840 | 859 |
| LA_GUAJIRA | 53 | 397 | 364 | 379 | 391 | 397 | 406 |
| MAGDALENA | 458 | 746 | 685 | 711 | 736 | 746 | 764 |
| META | 672 | 971 | 902 | 933 | 960 | 971 | 1003 |
| NARINO | 355 | 1125 | 1030 | 1074 | 1110 | 1125 | 1153 |
| NORTE SANTANDER | 841 | 1326 | 1226 | 1270 | 1311 | 1326 | 1354 |
| PUTUMAYO | 29 | 158 | 148 | 153 | 156 | 158 | 160 |
| QUINDIO | 341 | 804 | 736 | 765 | 794 | 804 | 822 |
| RISARALDA | 1819 | 1047 | 966 | 1003 | 1035 | 1047 | 1071 |
| SAN_ANDRES | 16 | 63 | 63 | 65 | 67 | 63 | 64 |
| SANTANDER | 9535 | 4420 | 4133 | 4257 | 4346 | 4420 | 4545 |
| SUCRE | 587 | 414 | 389 | 400 | 409 | 414 | 422 |
| TOLIMA | 1890 | 1151 | 1059 | 1099 | 1133 | 1151 | 1176 |
| VALLE | 13,646 | 11,353 | 10,545 | 10,922 | 11,200 | 11,353 | 11,661 |
| VAUPES | 0 | 10 | 10 | 10 | 10 | 10 | 10 |
| VICHADA | 4 | 25 | 23 | 24 | 25 | 25 | 26 |
| Department | Const GDP 2015 | Const GDP 2016 | Const GDP 2017 | Const GDP 2018 | Const GDP 2019 | Const GDP 2020 | Const GDP 2021 |
|---|---|---|---|---|---|---|---|
| AMAZONAS | 12 | 21 | 23 | 24 | 24 | 25 | 25 |
| ANTIOQUIA | 20,435 | 9933 | 10,296 | 10,578 | 11,097 | 11,613 | 8566 |
| ARAUCA | 141 | 146 | 150 | 154 | 159 | 164 | 164 |
| ATLANTICO | 6128 | 2483 | 2539 | 2620 | 2732 | 2830 | 1828 |
| BOGOTA | 20,069 | 27,584 | 28,334 | 29,022 | 30,138 | 31,047 | 6832 |
| BOLIVAR | 4530 | 1820 | 1885 | 1951 | 2027 | 2092 | 2432 |
| BOYACA | 2954 | 1183 | 1225 | 1265 | 1322 | 1375 | 1874 |
| CALDAS | 1717 | 843 | 868 | 879 | 910 | 941 | 768 |
| CAQUETA | 98 | 240 | 249 | 255 | 265 | 273 | 290 |
| CASANARE | 307 | 339 | 349 | 356 | 370 | 379 | 326 |
| CAUCA | 2644 | 661 | 692 | 721 | 753 | 777 | 1044 |
| CESAR | 556 | 731 | 747 | 767 | 795 | 821 | 689 |
| CHOCO | 32 | 66 | 68 | 73 | 76 | 78 | 131 |
| CORDOBA | 1377 | 468 | 483 | 493 | 510 | 523 | 687 |
| CUNDINAMARCA | 11,017 | 2002 | 2129 | 2242 | 2359 | 2473 | 2454 |
| GUAINIA | 8 | 9 | 9 | 9 | 10 | 10 | 40 |
| GUAVIARE | 12 | 348 | 30 | 32 | 33 | 34 | 44 |
| HUILA | 483 | 30 | 760 | 781 | 810 | 829 | 1054 |
| LA_GUAJIRA | 55 | 348 | 356 | 364 | 379 | 391 | 601 |
| MAGDALENA | 468 | 717 | 682 | 685 | 711 | 736 | 633 |
| META | 638 | 667 | 873 | 902 | 933 | 960 | 1019 |
| NARINO | 354 | 843 | 1008 | 1030 | 1074 | 1110 | 915 |
| NORTE SANTANDER | 864 | 983 | 1211 | 1226 | 1270 | 1311 | 1173 |
| PUTUMAYO | 30 | 1119 | 144 | 148 | 153 | 156 | 218 |
| QUINDIO | 349 | 141 | 700 | 736 | 765 | 794 | 428 |
| RISARALDA | 1811 | 666 | 923 | 966 | 1003 | 1035 | 669 |
| SAN_ANDRES | 17 | 860 | 61 | 63 | 65 | 67 | 29 |
| SANTANDER | 9276 | 59 | 4013 | 4133 | 4257 | 4346 | 3198 |
| SUCRE | 617 | 3853 | 381 | 389 | 400 | 409 | 599 |
| TOLIMA | 1989 | 978 | 1019 | 1059 | 1099 | 1133 | 1233 |
| VALLE | 14,011 | 9630 | 10,049 | 10,545 | 10,922 | 11,200 | 3249 |
| VAUPES | 0 | 9 | 10 | 10 | 10 | 10 | 20 |
| VICHADA | 4 | 22 | 23 | 23 | 24 | 25 | 47 |
| Department | Manuf GDP 2015 | Manuf GDP 2016 | Manuf GDP 2017 | Manuf GDP 2018 | Manuf GDP 2019 | Manuf GDP 2020 | Manuf GDP 2021 |
|---|---|---|---|---|---|---|---|
| AMAZONAS | 11 | 34 | 38 | 37 | 34 | 25 | 12 |
| ANTIOQUIA | 19,853 | 9041 | 9677 | 10,346 | 10,189 | 7212 | 21,810 |
| ARAUCA | 134 | 316 | 224 | 175 | 191 | 159 | 140 |
| ATLANTICO | 5992 | 2951 | 3127 | 2812 | 2426 | 1722 | 6613 |
| BOGOTA | 19,680 | 10,576 | 10,855 | 10,873 | 9729 | 6970 | 20,226 |
| BOLIVAR | 4274 | 3360 | 3531 | 3173 | 3291 | 2385 | 5198 |
| BOYACA | 2981 | 2335 | 2403 | 2580 | 2544 | 1912 | 3086 |
| CALDAS | 1639 | 966 | 925 | 944 | 902 | 710 | 1977 |
| CAQUETA | 99 | 449 | 407 | 397 | 346 | 286 | 104 |
| CASANARE | 298 | 537 | 395 | 404 | 410 | 316 | 369 |
| CAUCA | 2642 | 1442 | 1252 | 1308 | 1340 | 1016 | 2691 |
| CESAR | 563 | 751 | 674 | 700 | 705 | 585 | 627 |
| CHOCO | 31 | 210 | 187 | 183 | 171 | 128 | 33 |
| CORDOBA | 1341 | 1168 | 1077 | 943 | 975 | 707 | 1555 |
| CUNDINAMARCA | 10,680 | 4118 | 3947 | 3831 | 3539 | 2516 | 11,815 |
| GUAINIA | 7 | 46 | 44 | 48 | 46 | 35 | 9 |
| GUAVIARE | 53 | 76 | 78 | 57 | 55 | 49 | 12 |
| HUILA | 12 | 1741 | 1280 | 1167 | 1162 | 930 | 534 |
| LA_GUAJIRA | 53 | 644 | 739 | 676 | 661 | 541 | 58 |
| MAGDALENA | 485 | 1066 | 867 | 826 | 738 | 548 | 527 |
| META | 464 | 1628 | 1375 | 1458 | 1410 | 1025 | 755 |
| NARINO | 652 | 1336 | 1159 | 1147 | 1154 | 932 | 384 |
| NORTE SANTANDER | 355 | 1598 | 1323 | 1407 | 1248 | 1011 | 881 |
| PUTUMAYO | 860 | 301 | 242 | 263 | 233 | 197 | 32 |
| QUINDIO | 30 | 744 | 717 | 620 | 569 | 398 | 374 |
| RISARALDA | 336 | 952 | 890 | 897 | 881 | 698 | 2005 |
| SAN_ANDRES | 1723 | 44 | 43 | 39 | 38 | 30 | 18 |
| SANTANDER | 16 | 6027 | 5593 | 4822 | 4914 | 3338 | 10,028 |
| SUCRE | 8327 | 688 | 693 | 685 | 729 | 605 | 614 |
| TOLIMA | 1897 | 1505 | 1582 | 1533 | 1485 | 1132 | 1872 |
| VALLE | 13,729 | 3394 | 3581 | 3899 | 3804 | 2729 | 14,710 |
| VAUPES | 0 | 27 | 26 | 28 | 28 | 20 | 0 |
| VICHADA | 4 | 52 | 58 | 58 | 63 | 47 | 4 |
References
- United Nations Development Programme UNDP. Los ODS en Acción. 2022. Available online: https://www.undp.org/es/sustainable-development-goals (accessed on 1 December 2022).
- Ministry of Housing, City and Territory. Republic of Colombia. 2022. Available online: https://www.minvivienda.gov.co/viceministerio-de-vivienda/vis-y-vip (accessed on 10 October 2022).
- Inter-American Development Bank (IDB). El Sector Vivienda: Motor de Recuperación Económica y Desarrollo Sostenible. 2021. Available online: https://blogs.iadb.org/ciudades-sostenibles/es/dia-mundial-del-habitat-2021/ (accessed on 10 October 2022).
- Economic Commission for Latin America and the Caribbean (ECLAC). La Vivienda y la Ciudad Son Motores Para la Reac-tivación Económica, la Disminución de Brechas Sociales y Ambientales e Instrumentos para una Recuperación Transformadora. 2022. Available online: https://www.cepal.org/es/comunicados/la-vivienda-la-ciudad-son-motores-la-reactivacion-economica-la-disminucion-brechas (accessed on 10 October 2022).
- Economic Commission for Latin America and the Caribbean (ECLAC). Efectos Socioeconómicos de la Construcción de Viviendas en la Reactivación Pos-COVID-19: Inversión y Empleo Sectorial en Chile, Colombia, el Ecuador, México, el Perú y la República Dominicana, Documentos de Proyectos (LC/TS.2022/157). 2022. Available online: Chrome-extension://efaidnbmnnnibpcajpcglclefindmkaj/https://repositorio.cepal.org/server/api/core/bitstreams/00226e9b-9915-4170-8831-8d80497154db/content (accessed on 3 November 2023).
- Ministry of Labor. Republic of Colombia. 2023. Available online: https://www.mintrabajo.gov.co/empleo-y-pensiones/movilidad-y-formacion/grupo-de-gestion-de-la-politica-de-migracion-laboral/ii-poblacion-objetivo/trabajadores-migrantes-internos (accessed on 3 December 2023).
- National Department of Statistics DANE. Republic of Colombia. Regional GDP. 2023. Available online: https://www.dane.gov.co/index.php/estadisticas-por-tema/cuentas-nacionales/cuentas-nacionales-departamentales (accessed on 1 February 2022).
- Urban Studies Institute IEU, Universidad Nacional de Colombia. Mayor Venta de VIS Puede Indicar Crisis en el Sector de la Construcción. (Higher VIS Sales May Indicate Crisis in the Construction Sector). 2020. Available online: http://ieu.unal.edu.co/en/medios/noticias-del-ieu/item/mayor-venta-de-vis-puede-indicar-crisis-en-el-sector-de-la-construccion (accessed on 1 December 2022).
- Economic Commission for Latin America and the Caribbean (ECLAC, UN). Base de Datos y Publicaciones Estadísticas CEPALSTAT. 2022. Available online: https://statistics.cepal.org/portal/cepalstat/dashboard.html?indicator_id=33&area_id=400&lang=es (accessed on 1 December 2022).
- National Department of Statistics DANE. Republic of Colombia. Special: International Day of the Population. 2023. Available online: https://www.dane.gov.co/files/indicadores-ods/doc-ODS-DiaMundialdelaPoblacion-jul2023.pdf (accessed on 3 December 2023).
- United Nations International Chidren´s Emergency Fund UNICEF. Migración en América Latina. 2018. Available online: https://www.unicef.org/uruguay/comunicados-prensa/migraci%C3%B3n-en-am%C3%A9rica-latina (accessed on 1 December 2022).
- Economic Commission for Latin America and the Caribbean (ELAC, UN). Acerca de Migración Interna. 2022. Available online: https://www.cepal.org/es/temas/migracion/acerca-migracion-interna (accessed on 1 December 2022).
- Banco de la República de Colombia (Bank of the Republic of Colombia). El nexo entre Desarrollo y Migración Interna en Colombia. 2022. Available online: https://www.banrep.gov.co/es/el-nexo-desarrollo-y-migracion-interna-colombia (accessed on 1 February 2022).
- Economic Commission for Latin America and the Caribbean (ECLAC, UN). Dinámica de la Pobreza en Colombia en el Siglo XXI. 2022. Available online: https://www.cepal.org/es/publicaciones/47796-dinamica-la-pobreza-colombia-siglo-xxi (accessed on 1 February 2022).
- United Nations Development Programme UNDP. Migración en Colombia y Respuestas de Política Pública. 2022. Available online: https://www.undp.org/es/latin-america/publicaciones/migracion-en-colombia-y-respuestas-de-politica-publica (accessed on 1 February 2022).
- Chiodelli, F. International Housing Policy for the Urban Poor and the Informal City in the Global South: A Non-diachronic Review. J. Int. Dev. 2016, 28, 788–807. [Google Scholar] [CrossRef]
- Sengupta, U.; Murtagh, B.; D’ottaviano, C.; Pasternak, S. Between enabling and provider approach: Key shifts in the national housing policy in India and Brazil. Environ. Plan. C Politi Space 2018, 36, 856–876. [Google Scholar] [CrossRef]
- de Duren, N.R.L. The social housing burden: Comparing households at the periphery and the centre of cities in Brazil, Colombia, and Mexico. Int. J. Hous. Policy 2018, 18, 177–203. [Google Scholar] [CrossRef]
- Gilbert, A. Rental Market and Rental Policies in Less Developed Countries. In The International Encyclopedia of Housing and Home; Elsevier: Amsterdam, The Netherlands, 2012; pp. 35–45. [Google Scholar] [CrossRef]
- Molina, I.; Czischke, D.; Rolnik, R. Housing policy issues in contemporary South America: An introduction. Int. J. Hous. Policy 2019, 19, 277–287. [Google Scholar] [CrossRef]
- Donoso, R.E.; Elsinga, M. Management of low-income condominiums in Bogotá and Quito: The balance between property law and self-organisation. Int. J. Hous. Policy 2018, 18, 312–334. [Google Scholar] [CrossRef]
- Gonzalez, C.G. Squatters, Pirates, and Entrepreneurs: Is Informality the Solution to the Urban Housing Crisis? Univ. Miami Inter-Am. Law Rev. 2009, 40, 239–259. Available online: http://www.jstor.org/stable/25593614 (accessed on 1 December 2022).
- Balchin, P.N.; Stewart, J. Social housing in Latin America: Opportunities for affordability in a region of housing need. J. Hous. Built Environ. 2001, 16, 333–341. [Google Scholar] [CrossRef]
- Rojas, E. “No time to waste” in applying the lessons from Latin America’s 50 years of housing policies. Environ. Urban. 2019, 31, 177–192. [Google Scholar] [CrossRef]
- Trallero, M. The Upgrading Links between Urban Services, Housing, Tenure Security and Governance. Specialization Thesis, Escola de Camins, UPC Barcelona-Tech, Barcelona, Spain, 2014; 75p. Available online: https://upcommons.upc.edu/bitstream/handle/2099.1/24221/Memory.pdf (accessed on 1 December 2022).
- Bonells, C.F.U.; Torner, F.M. El rol de los servicios urbanos en la legalización predial y la generación de calidad urbana y valor del suelo. Aplicación al caso de Cúcuta (Colombia). Hábitat Y Soc. 2015, 8, 113–145. [Google Scholar] [CrossRef]
- Aliu, I.R. Sustainable housing development dynamics in the Global South: Refl ections on theories, strategies and constraints. Bull. Geogr. Socio-Econ. Ser. 2022, 56, 83–100. [Google Scholar] [CrossRef]
- Murray, C.; Clapham, D. Housing policies in Latin America: Overview of the four largest economies. Int. J. Hous. Policy 2015, 15, 347–364. [Google Scholar] [CrossRef]
- Colombian Chamber of Construction CAMACOL. With the Reactivation of Social Housing, the Expected Growth of the Economy could be Doubled. 2023. Available online: https://camacol.co/actualidad/noticias/con-la-reactivacion-de-la-vivienda-social-se-podria-duplicar-el-crecimiento (accessed on 3 December 2023).
- Ordóñez Aparicio, L. El Mercado Global y la Ciudad de los Pobres: La Política de Vivienda Social en Colombia, 2010–2018; Universidad de Los Andes: Bogotá, Colombia,, 2019; Available online: http://hdl.handle.net/1992/34094 (accessed on 15 February 2023).
- Arku, G. The housing and economic development debate revisited: Economic significance of housing in developing countries. J. Hous. Built Environ. 2006, 21, 377–395. [Google Scholar] [CrossRef]
- Oluku, U.; Cheng, S. A Regional Analysis of the Relationship Between Housing Affordability and Business Growth. Econ. Dev. Q. 2021, 35, 269–286. [Google Scholar] [CrossRef]
- Anthony, J. Economic Prosperity and Housing Affordability in the United States: Lessons from the Booming 1990s. Hous. Policy Debate 2018, 28, 325–341. [Google Scholar] [CrossRef]
- Mast, E. JUE Insight: The effect of new market-rate housing construction on the low-income housing market. J. Urban Econ. 2023, 133, 103383. [Google Scholar] [CrossRef]
- Rodríguez-Pose, A.; Storper, M. Housing, urban growth and inequalities: The limits to deregulation and upzoning in reducing economic and spatial inequality. Urban Stud. 2020, 57, 223–248. [Google Scholar] [CrossRef]
- Bramley, G.; Pawson, H. Low Demand for Housing: Incidence, Causes and UK National Policy Implications. Urban Stud. 2002, 39, 393–422. [Google Scholar] [CrossRef]
- Ha, S.-K. Low-income housing policies in the Republic of Korea. Cities 1994, 11, 107–114. [Google Scholar] [CrossRef]
- Ikejiofor, U. Tyranny of inappropriate policies. Cities 1998, 15, 429–436. [Google Scholar] [CrossRef]
- Choguill, C.L. Housing policy trends in Bangladesh. Cities 1993, 10, 326–336. [Google Scholar] [CrossRef]
- Yang, T.; Pan, H.; Zhang, X.; Greenlee, A.; Deal, B. How neighborhood conditions and policy incentives affect relocation outcomes of households from low-income neighborhoods—Evidence from intra-city movement trajectories. Cities 2021, 119, 103415. [Google Scholar] [CrossRef]
- Fernandez, R.; Aalbers, M.B. Housing Financialization in the Global South: In Search of a Comparative Framework. Hous. Policy Debate 2019, 30, e0194. [Google Scholar] [CrossRef]
- Marcos, M.; García, D.M.; Módenes, J.A. Who needs housing in Latin America? Co-residence in housing deficit estimates. Rev. Bras. De Estud. De Popul. 2022, 39, e0194. [Google Scholar] [CrossRef]
- Marcos, M.; Módenes, J.A. The demographic component of urban housing needs in latin america: The case of Buenos Aires. Doc. D’analisi Geogr. 2021, 67, 265–292. [Google Scholar] [CrossRef]
- Londoño, D.E.; GarcíaCardona, A.A.; Ospino, E. Guidelines for sustainable social interest housing Study Case: Medellín (Colombia). Opcion 2019, 35, 314–346. Available online: https://www.scopus.com/inward/record.uri?eid=2-s2.0-85073409032&partnerID=40&md5=e86ddff9b88352f424f92b46a1b5606d (accessed on 1 December 2022).
- Colombian Chamber of Construction CAMACOL; Servicio Nacional de Aprendizaje SENA. Proyecto de Investigación del Sector de la Construcción de Edificaciones en Colombia; CAMACOL: Bogotá, Colombia; SENA: Antioquia, Colombia, 2015; 244p, ISBN 978-958-98413-1-0. [Google Scholar]
- Colombian Chamber of Construction CAMACOL. Los Pasos Hacia la Reactivación de la Economía Colombiana. Informe Económico No. 109. 12p. 2020. Available online: https://camacol.co/sites/default/files/descargables/Informe%20Econ%C3%B3mico%20109%20VF_%20Formato%202.pdf (accessed on 1 February 2022).
- Colombian Chamber of Construction CAMACOL. Proyección Sectorial: PIB Edificador 2022. Informe económico No. 112. 12 p. 2021. Available online: https://camacol.co/sites/default/files/descargables/Informe%20Econ%C3%B3mico%20112%20VF_%20Formato.pdf (accessed on 1 February 2022).
- National Department of Statistics DANE, Republic of Colombia. Migración Interna en Colombia a Partir del Censo General 2005. 2006. Available online: https://www.dane.gov.co/files/censos/presentaciones/migracion_interna.pdf (accessed on 1 February 2022).
- El Tiempo. Las Cifras que Demuestran por qué Colombia es un País de Migraciones. 2023. Available online: https://www.eltiempo.com/colombia/otras-ciudades/especial-con-datos-sobre-las-migraciones-internas-en-colombia-264990#:~:text=En%20territorios%20como%20Magdalena%2C%20Sucre,del%20Choc%C3%B3%2C%20Nari%C3%B1o%20y%20Cauca (accessed on 3 December 2023).
- Murad, R. Estudio Sobre la Distribución Espacial de la Población en Colombia. 2003. Available online: https://repositorio.cepal.org/bitstream/handle/11362/7186/1/S0311812_es.pdf (accessed on 1 February 2022).
- Ramírez, C.; Zuluaga, M.; Perilla, C. Perfil migratorio de Colombia. Organización Internacional para las Migraciones OIM. 2010. Available online: https://www.cancilleria.gov.co/sites/default/files/planeacion_estrategica/Transparencia/estudio_oim_con_el_apoyo_de_colombia_nos_une_y_otras_entidades.pdf (accessed on 1 February 2022).
- Colombian Chamber of Construction CAMACOL. Construction in Data. 2023. Available online: https://camacol.co/informacion-economica (accessed on 3 December 2023).
- Ramachandran, K.M.; Tsokos, C.P. Goodness-of-Fit Tests Applications. In Mathematical Statistics with Applications in R; Elsevier: Amsterdam, The Netherlands, 2015; pp. 371–408. [Google Scholar] [CrossRef]
- Hauke, J.; Kossowski, T. Comparison of values of Pearson’s and Spearman’s correlation coefficients on the same sets of data. Quaest. Geogr. 2011, 30, 87. [Google Scholar] [CrossRef]

| Percentage of UBN Inhabitants | Percentage of Inhabitants in Extreme Poverty or Misery | Percentage of Overcrowded UBN Inhabitants | Percentage of Housing for UBN Inhabitants | Percentage of Basic Public Services for UBN Inhabitants |
|---|---|---|---|---|
| −0.84 | −0.82 | −0.80 | −0.75 | −0.75 |
Disclaimer/Publisher’s Note: The statements, opinions and data contained in all publications are solely those of the individual author(s) and contributor(s) and not of MDPI and/or the editor(s). MDPI and/or the editor(s) disclaim responsibility for any injury to people or property resulting from any ideas, methods, instructions or products referred to in the content. |
© 2024 by the authors. Licensee MDPI, Basel, Switzerland. This article is an open access article distributed under the terms and conditions of the Creative Commons Attribution (CC BY) license (https://creativecommons.org/licenses/by/4.0/).
Share and Cite
Urazán-Bonells, C.F.; Rondón-Quintana, H.A.; Caicedo-Londoño, M.A. The Effects of Economic Sector GDP on Low-Income Housing Supply, Colombia’s Regions Case. Buildings 2024, 14, 267. https://doi.org/10.3390/buildings14010267
Urazán-Bonells CF, Rondón-Quintana HA, Caicedo-Londoño MA. The Effects of Economic Sector GDP on Low-Income Housing Supply, Colombia’s Regions Case. Buildings. 2024; 14(1):267. https://doi.org/10.3390/buildings14010267
Chicago/Turabian StyleUrazán-Bonells, Carlos Felipe, Hugo Alexander Rondón-Quintana, and María Alejandra Caicedo-Londoño. 2024. "The Effects of Economic Sector GDP on Low-Income Housing Supply, Colombia’s Regions Case" Buildings 14, no. 1: 267. https://doi.org/10.3390/buildings14010267
APA StyleUrazán-Bonells, C. F., Rondón-Quintana, H. A., & Caicedo-Londoño, M. A. (2024). The Effects of Economic Sector GDP on Low-Income Housing Supply, Colombia’s Regions Case. Buildings, 14(1), 267. https://doi.org/10.3390/buildings14010267