1. Introduction
Precast Concrete (PC) elements are commonly prefabricated at manufacturing plants and transported to construction sites, where they are connected by grouting or welding to form an assembled monolithic structure [
1]. Thus, the PC system is an efficient method that could allow for a shortened construction period and ensure uniformity and high quality of structural members compared to a conventional cast-in-place concrete system [
2,
3,
4,
5]. In the case of structural walls, which are primary lateral force-resisting elements, the size of each member is substantial, and thus, the construction of this member requires a significant time compared to other structural members. Utilizing the PC wall system makes it possible to shorten the construction period, thereby leading to a reduction in construction costs. However, due to the limitations of transportation and erection equipment, the width of PC walls is often smaller than that of a typical cast-in-place concrete wall. Thus, the assembly of PC wall elements is required, along with a substantial number of joint connections. The structural behavior of these connections could have a significant impact on the overall performance of PC wall elements [
1]. Therefore, the design of these connections needs to consider various factors, including strength, stiffness, and energy dissipation capacity, to ensure practicality and reliability [
6]. Inadequate design of PC wall joints, particularly if they have insufficient shear strength and ductility, can lead to the initiation of cracks and damages, resulting in a degradation in overall structural performance.
Generally, there are two types of vertical joints used for connecting PC wall elements: wet and dry joints. Existing research suggests that wet joints are more effective in ensuring the integrity and stiffness of the overall structure [
7,
8,
9]. This enhanced performance stems from the installation of connecting materials and subsequent concrete or mortar casting, resulting in superior shear transfer capacity. However, compared to dry joints, wet joints are more complex to construct, pose challenges in quality control, and incur higher costs [
10]. Traditional wet joints often involve processing dowel rebars into U-shapes. However, manual fabrication becomes increasingly cumbersome as the diameter of the rebars increases [
11]. Moreover, the widely used vertical joint with wire loops may exhibit insufficient ductility, leading to a brittle failure mode [
12]. Consequently, this deficiency may result in undesirable deformation and damage at the joint, compromising its continuity and potentially jeopardizing overall structural integrity. Therefore, to mitigate this risk under earthquake loads, efficiently controlling and dissipating energy within the joint is crucial [
13].
Typical dry joints connect PC walls using welding bolts, plates, and other components. This approach offers improved structural performance compared to wet joints, particularly in terms of ductility and energy-dissipation capacity [
14,
15,
16,
17]. Dry joints generally facilitate construction due to their ease of assembly, but they require specific attention to maintain their performance. Exposed elements like bolts and plates are prone to corrosion and loss after assembly, necessitating finishing treatments or periodic maintenance. Welded plate connections, a popular dry joint method, provide excellent shear resistance but exhibit relatively lower ductility capacity [
18]. Additionally, some dry joints utilize complex shapes with the aim of incorporating damping effects in the connection [
2,
5,
19].
Therefore, to address the limitation of existing vertical joints, this study presents a novel vertical joint for enhanced constructability and ductile behavior in PC walls. The proposed joint utilizes high-tension bolts for efficient assembly of wall panels. To assess its shear performance, test specimens were constructed and rigorously evaluated under direct shear loading. Based on these results, large-scale wall specimens incorporating the developed vertical joint were fabricated. The seismic performance of these PC walls was subsequently assessed through static cyclic loading tests.
2. Proposed Vertical Joint
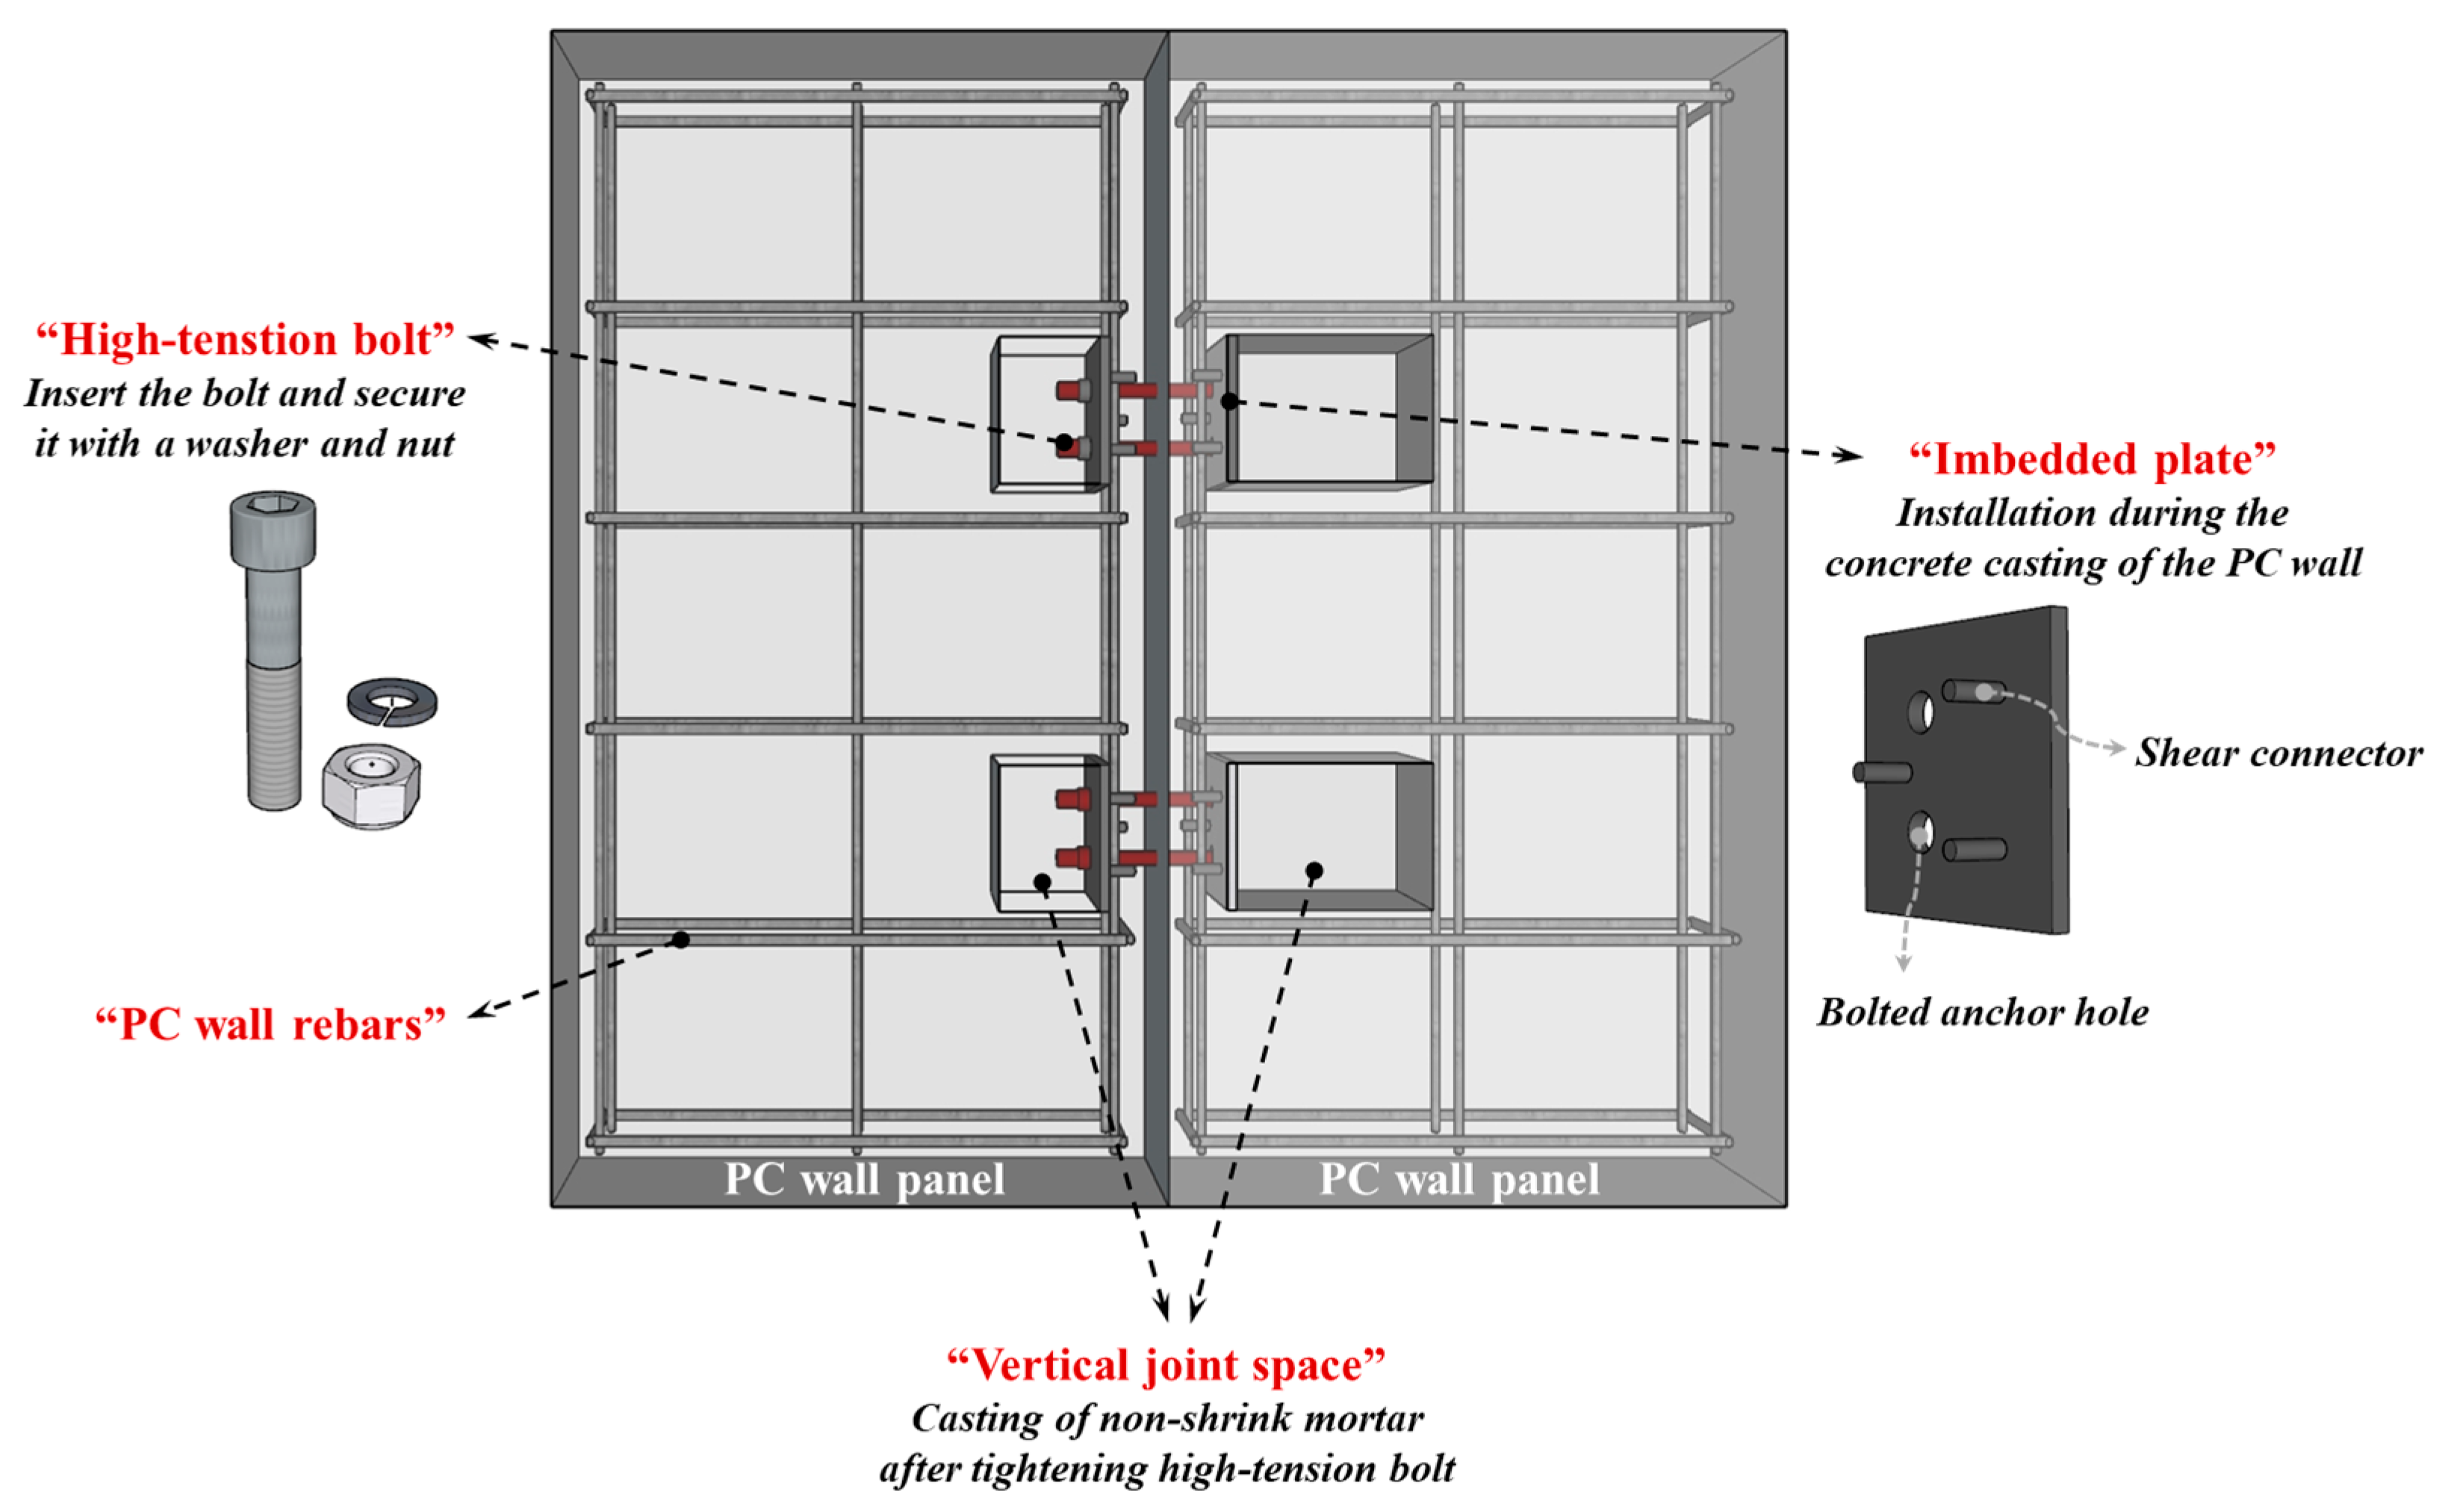
A novel vertical joint with high-tension bolts has been developed to enhance the ductile behavior of PC walls and address corrosion issues prevalent in existing dry joint methods. An overview of the vertical joint with high-tension bolts is illustrated in
Figure 1. The proposed system involves pre-forming a joint space within the PC walls using formworks before concrete casting. The size of this space is determined by the length of the high-tension bolts, which are subsequently fastened within this prepared joint. Non-shrink grout is then injected to complete the assembly.
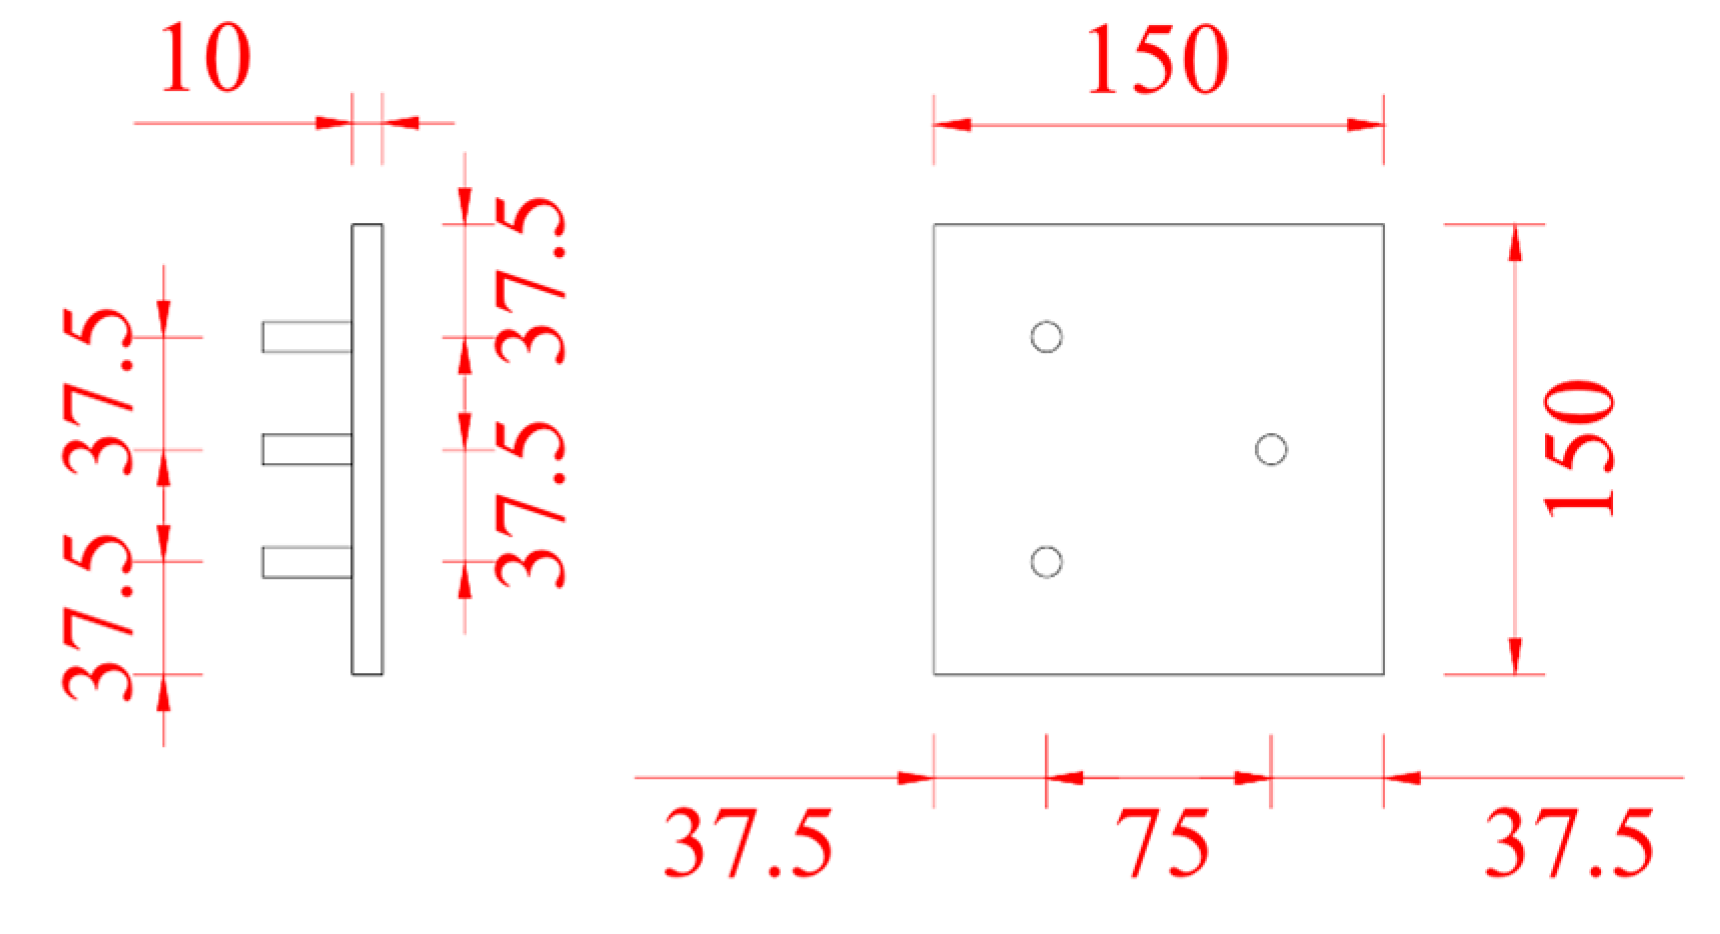
To address potential cracking and bearing failure during bolt installation and under load, a prefabricated plate is embedded within the wall on the bolt-receiving side. It also helps prevent bearing failure at the connection point where stress concentrates when loads are applied to the wall. The embedded plate is made of SS400 material and includes holes for fastening high-tension bolts. In addition, on the surface of the plate that contacts the concrete, there is a welded shear connector. This is designed to enhance the integrity of the concrete of the wall.
Figure 2 provides a detailed illustration of the embedded plate. To ensure the high-tension bolts remain functional before the failure of PC walls, the specification and quantity of the high-tension bolts were selected based on the calculated shear strength. F10T-M20 standard bolts with a length of 180 mm were utilized for direct shear tests, while F10T-M22 standard bolts of the same length were employed for the static cyclic tests.
3. Shear Performance of the Proposed Vertical Joint
3.1. Details of Specimens
As detailed in
Table 1 and
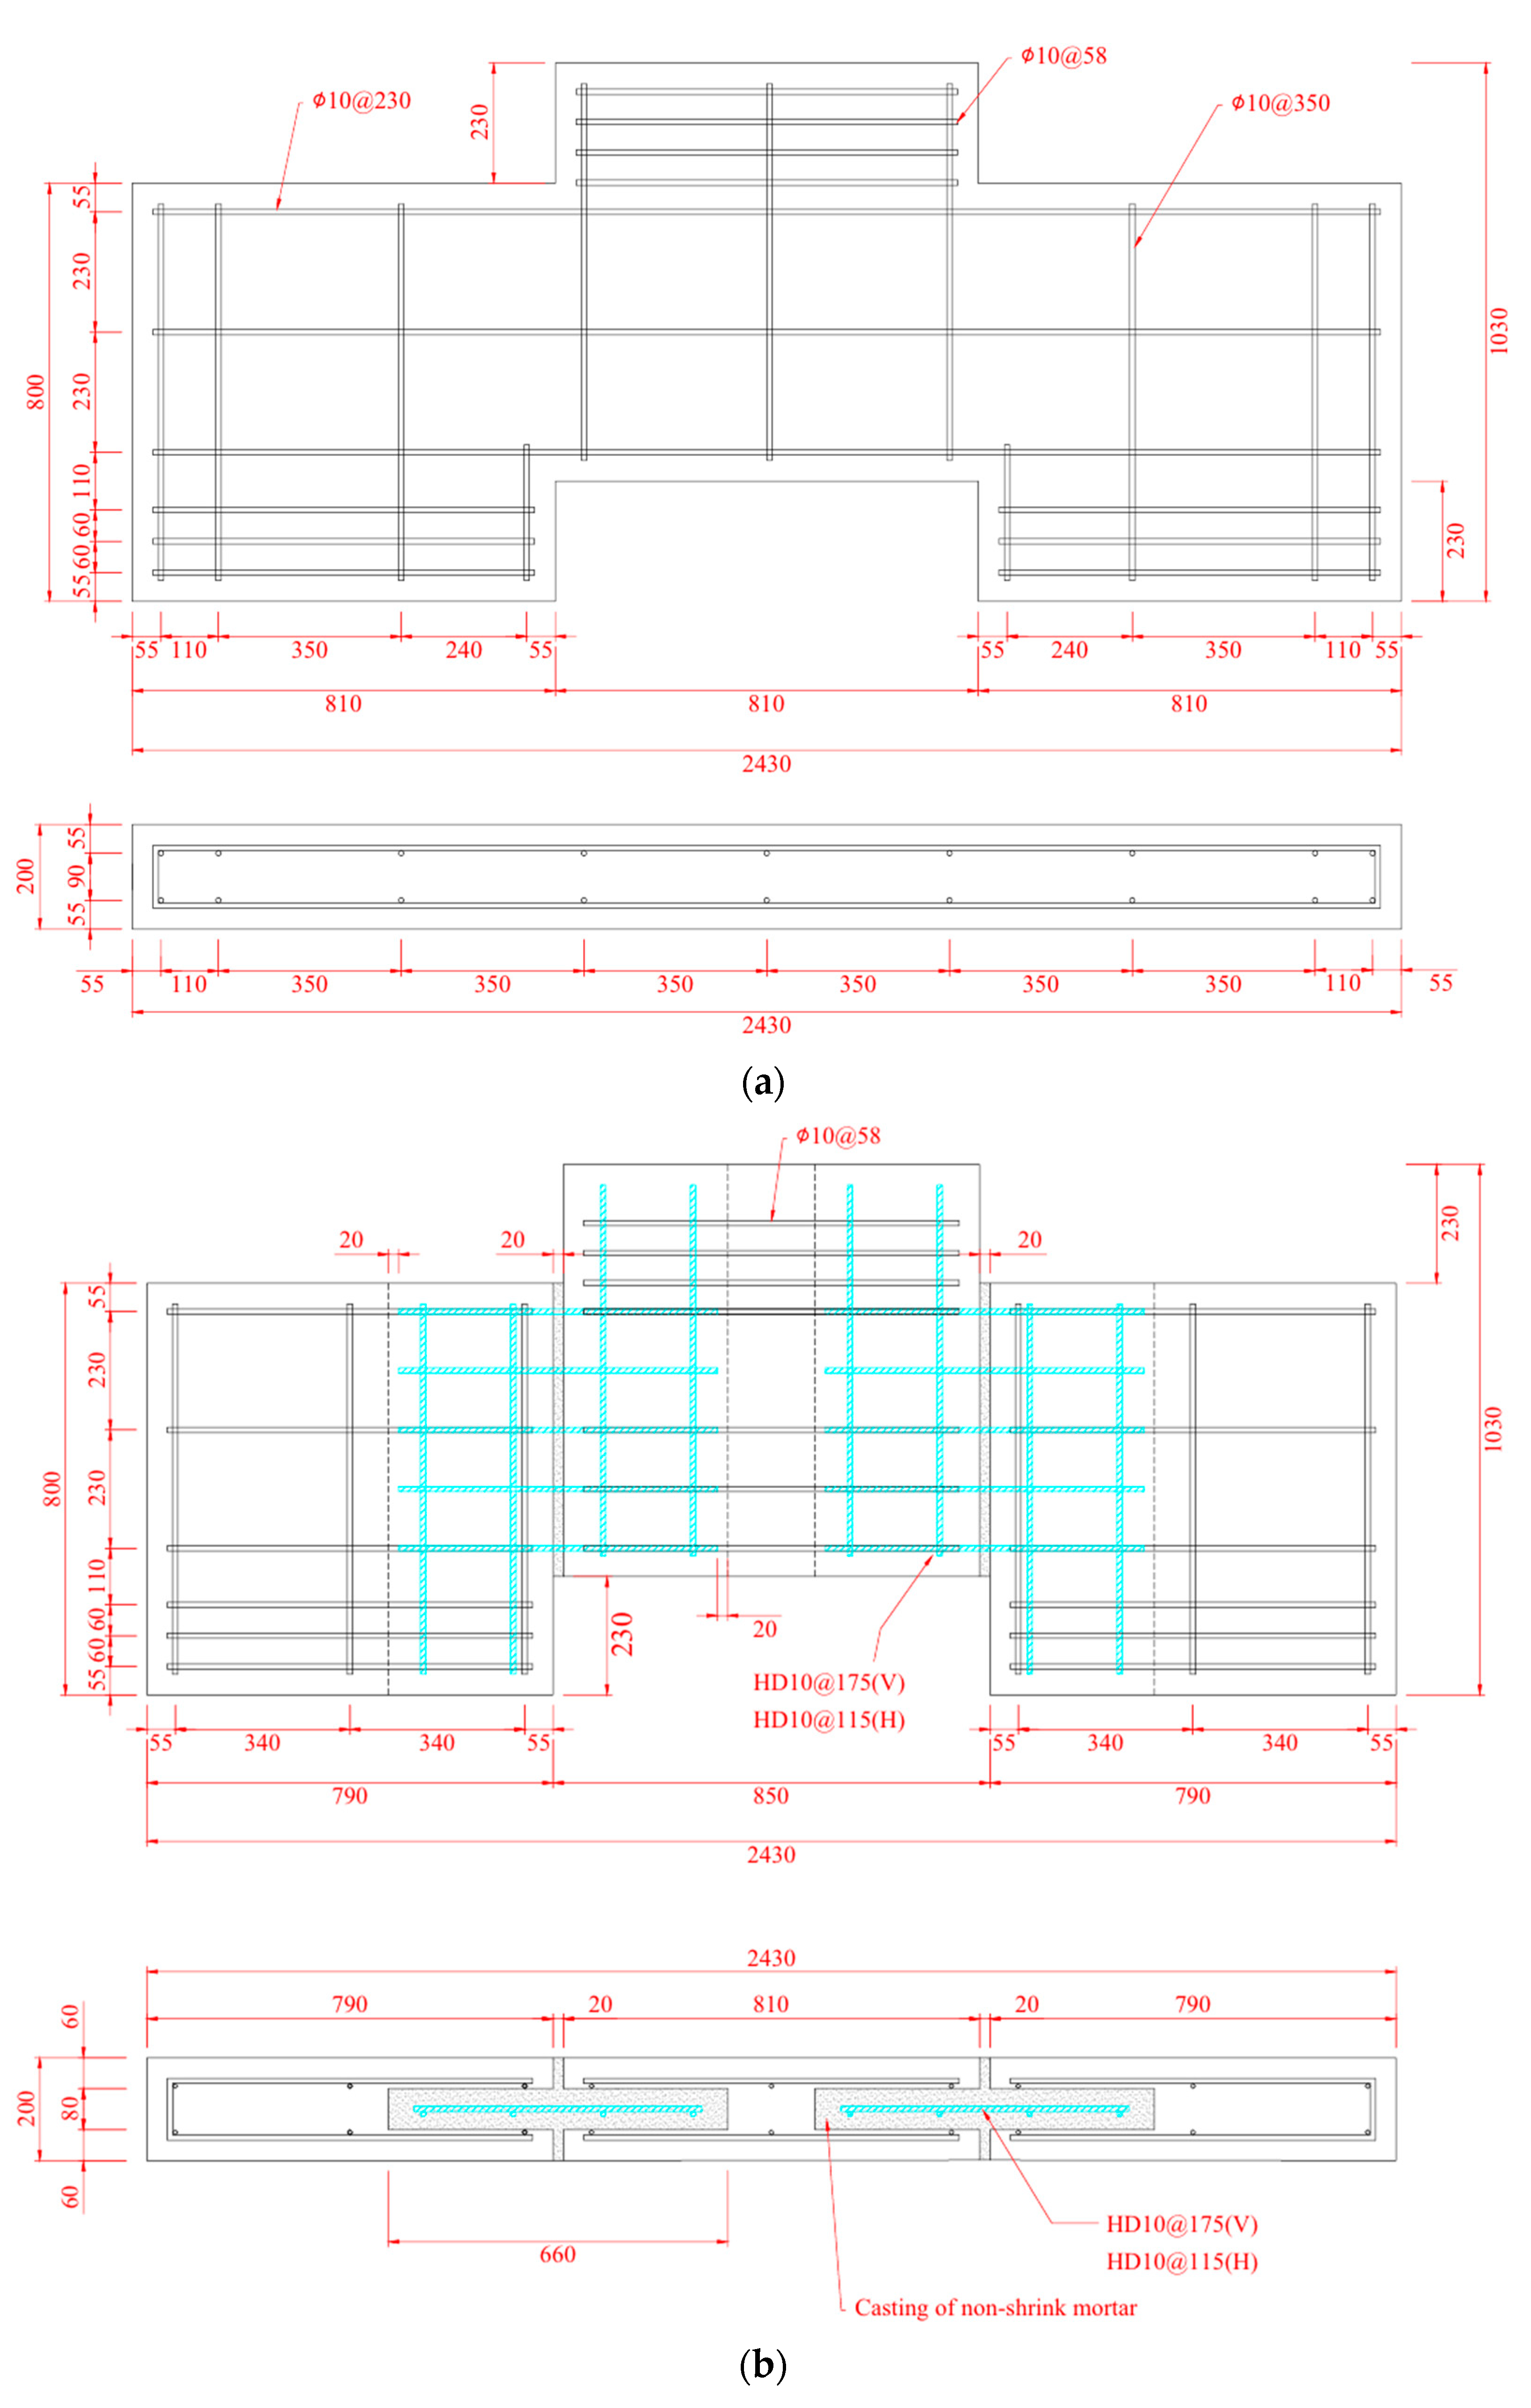
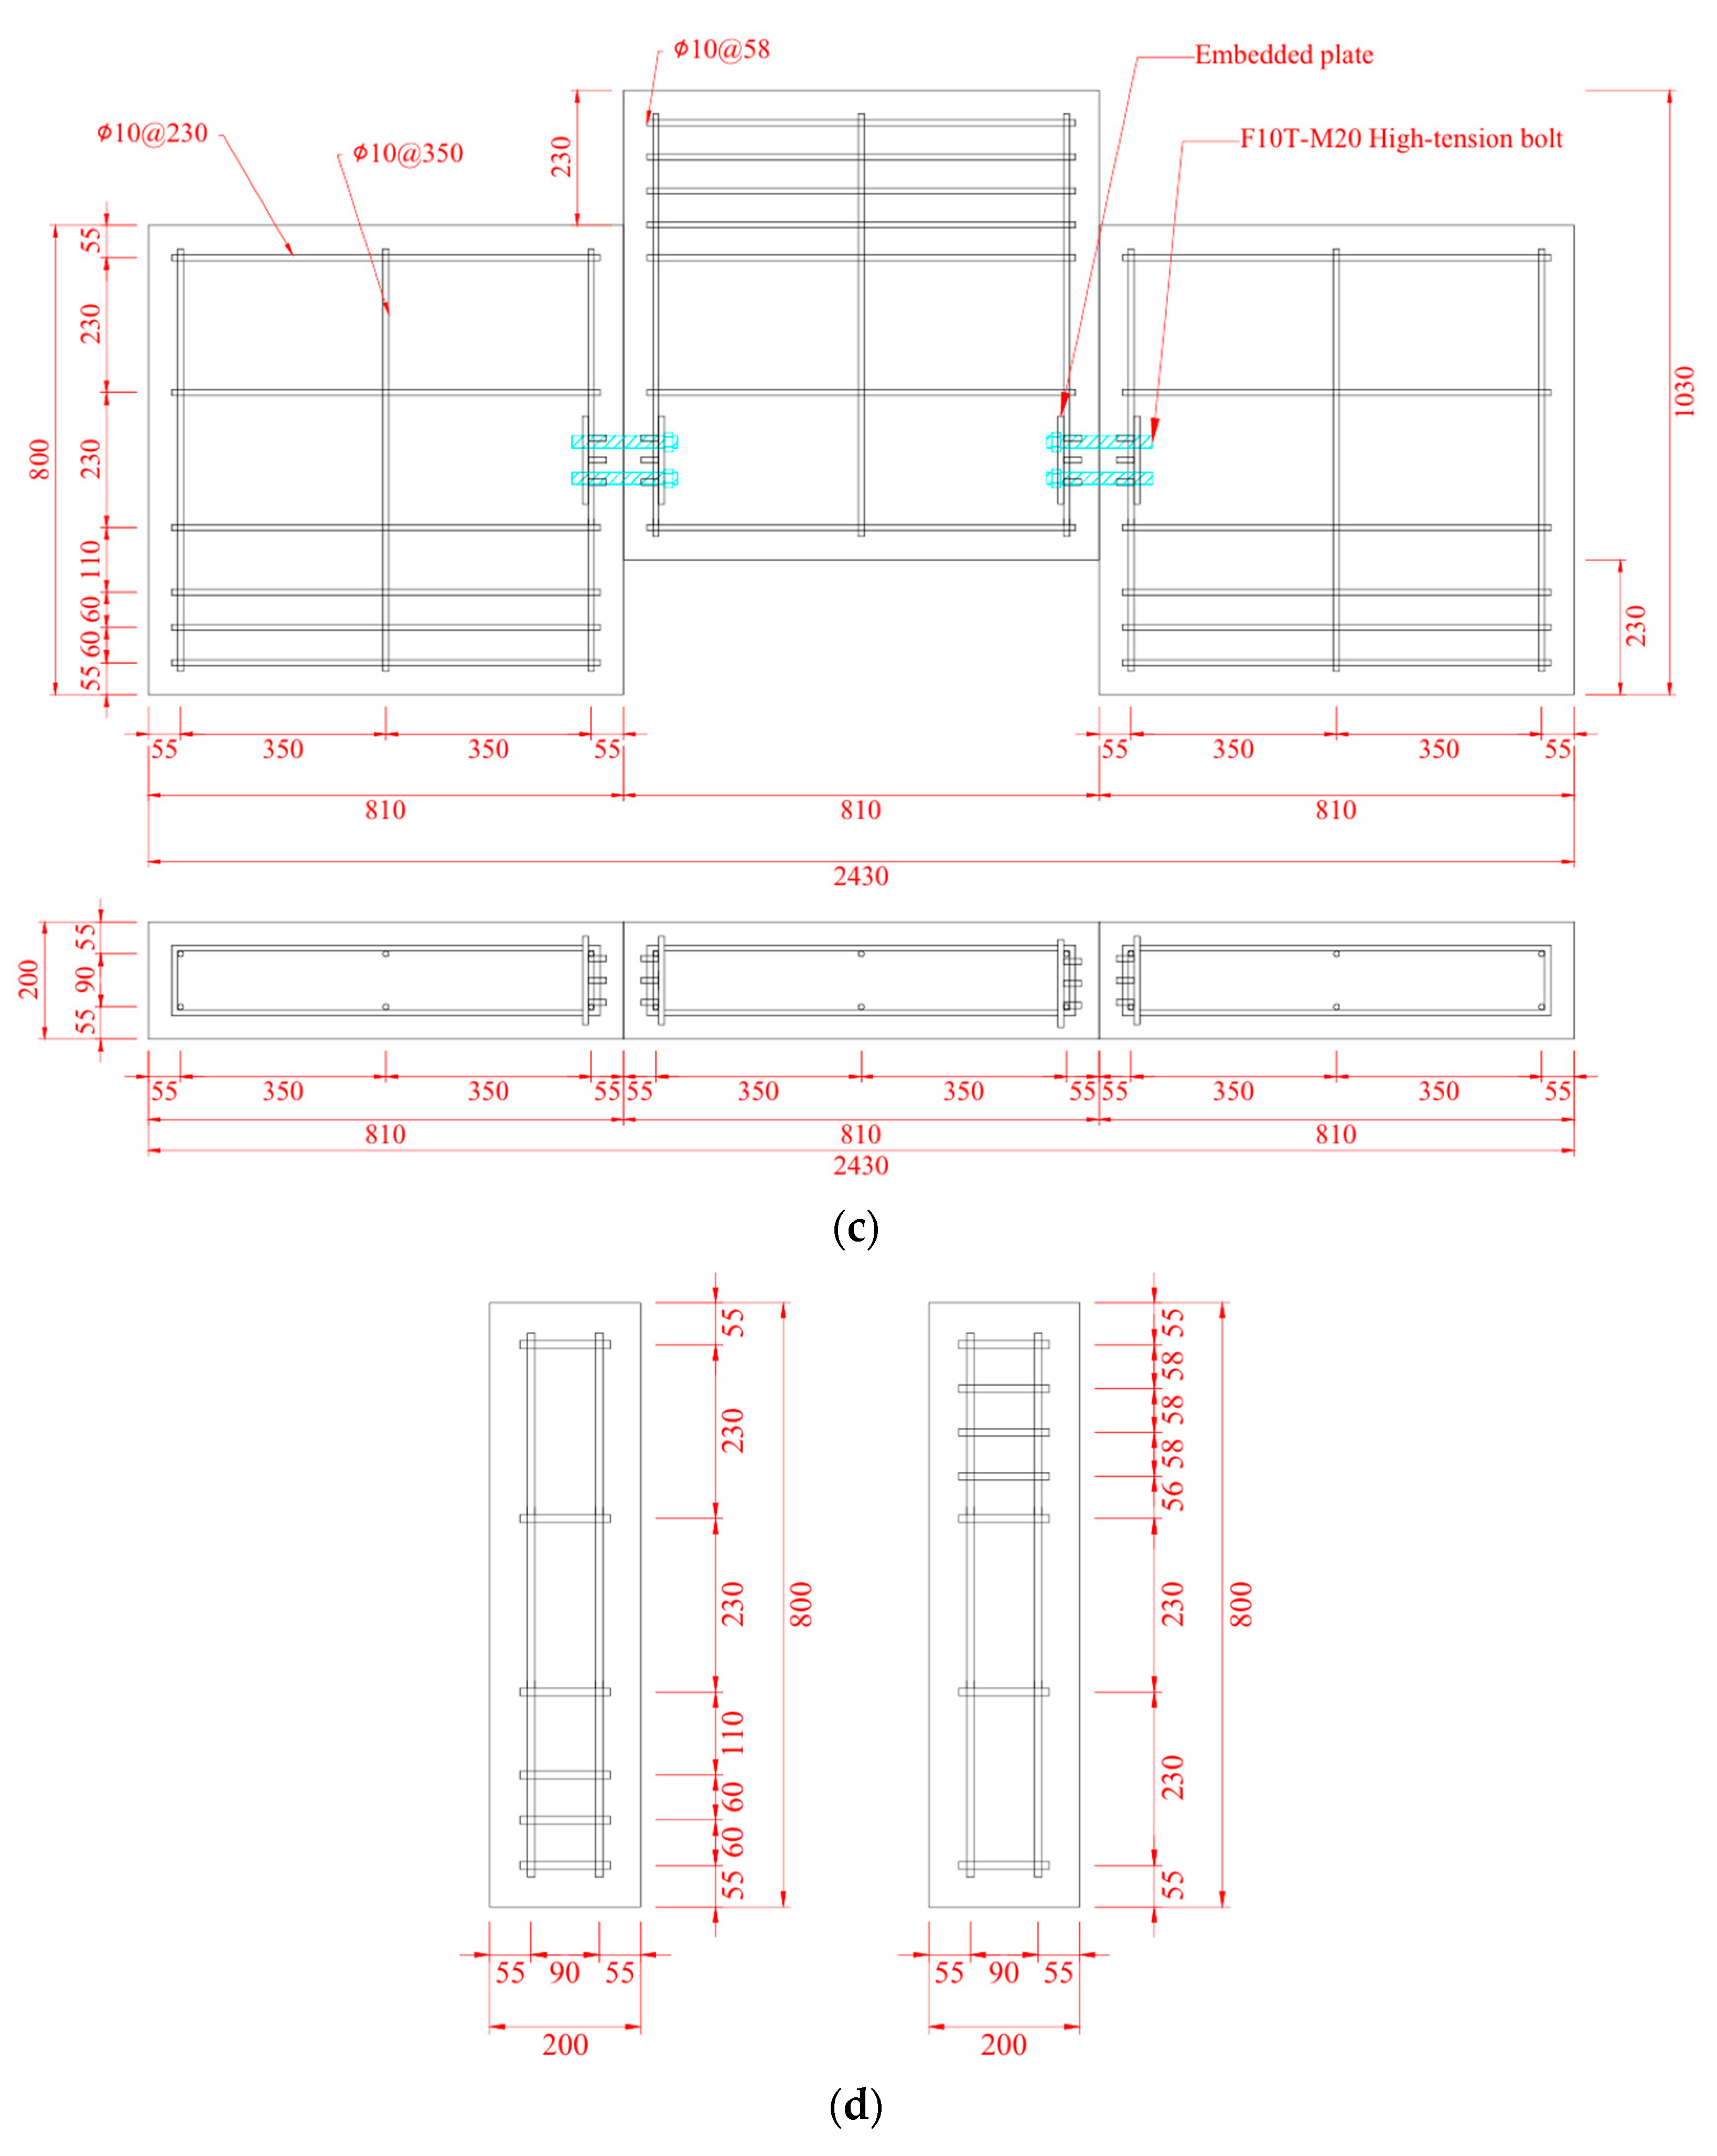
Figure 3, three specimens were designed and constructed to evaluate the shear performance of the proposed vertical joint: a cast-in-place concrete wall (S-CIPW), a PC wall with the conventional wet joint (S-PWR), and a PC wall with the proposed joint (S-PWB). PC wall specimens feature two joints connecting three PC wall panels, with the load applied to the central panel’s upper section. The width of the wall panels varies for each specimen due to the different applied slit sizes. However, for consistent experimental comparison, their overall assembled length is designed to be 2430 mm. The thickness and height of all wall panels are 200 mm and 800 mm, respectively. Additionally, all specimens have identical horizontal and vertical reinforcement ratios of 0.53% and 0.26%, respectively.
S-CIPW serves as the reference specimen for evaluating the performance of the PC wall with the proposed vertical joint. It comprises three wall panels cast simultaneously as a single unit. The S-PWR specimen was designed to represent an improved version of the conventional wet joint for PC walls. Structural defects in the existing wet joint of the PC wall can frequently occur due to interference between the installed transverse reinforcement and insufficient transverse rebar ratio. In addition, the wet joint, as described previously, is often susceptible to significant shear cracking and abrupt force reduction at peak load. To address these vulnerabilities, the S-PWR employs a widened joint slit (20 mm) and an increased transverse reinforcement ratio (0.31%). Compared to previous experimental studies involving similar PC wall joints [
4,
20,
21], the transverse reinforcement ratio represents a significant increase, ranging from 14.81% to 121.43%, exceeding the typical range for such applications. The estimated shear stress corresponding to nominal shear strength for the S-PWR joint is 0.82 MPa, which is 14.81% to 121.43% higher than those reported in previous studies. A 20 mm slit between the two wall panels is selected to minimize issues such as leakage, condensation, and insulation problems in the joint while considering construction errors.
The S-PWB is the PC wall specimen with the proposed high-tension bolted vertical joint aimed to enhance ductility compared to the conventional vertical joint. The joint details of the S-PWB are described in the previous section. Two vertical connection units with F10T-M20 standard bolts are installed to evaluate the shear capacity and performance of the S-PWB joint.
3.2. Material Properties
For each test specimen, three concrete cylinder samples, with a radius of 100 mm and a height of 200 mm, and three mortar cube samples with dimensions of 50 mm × 50 mm × 50 mm were tested. The concrete compressive strengths of S-CIPW, S-PWR, and S-PWB are 23.68 MPa, 23.96 MPa, and 23.51 MPa, respectively. The compressive strengths of the mortar cast to the vertical joints of S-PWR and S-PWB are 58.51 MPa and 53.50 MPa, respectively. The transverse reinforcements in the PC wall and vertical joint utilize 10 mm diameter rebars. The tensile test results of these rebars indicate a yield strength, ultimate strength, and yield strain of 439.0 MPa, 584.36 MPa, and 0.002, respectively.
3.3. Experimental Program
The setup for the direct shear test is illustrated in
Figure 4. To prevent the horizontal slippage of the specimen during the experiment, cubes and steel plates were fixed to both ends of the specimen. A large-scale testing machine with a 5MN capacity (CCH-5000kN, Shimadzu, Kyoto, Japan) at the Intelligent Construction System Core-Support Center at Keimyung University was utilized to apply monotonic loading at a rate of 0.5 mm/min at the top of the central wall. Measurements were collected at a rate of 20 samples per sec using a static data logger (YCAM-500A, KYOWA, Tokyo, Japan). The experiment continued until a reduction of over 20% in maximum load or failure of the specimen occurred. A total of eight Linear Variable Displacement Transducers (LVDTs) were employed to measure the deformation of specimens, as shown in
Figure 5. To measure the vertical displacement of the central wall in the direction of the load, two LVDTs were vertically installed in front of and behind the central wall (L3, L4). Additionally, two LVDTs were horizontally installed at the ends of the wall to measure the overall horizontal displacement of the specimen (L1, L2). Finally, to measure the shear deformation of the vertical joint, four LVDTs were installed in an “X” configuration (L5 to L8).
3.4. Experimental Results
3.4.1. Crack Patterns
The crack patterns at the failure for each specimen are presented in
Figure 6. For the specimen S-CIPW, the initial cracks occurred at the connection areas and the bottom of the central wall when the load reached 390 kN. Upon reaching 980 kN, cracks developed at the bottom of both the left and right walls. Furthermore, at a load of 1200 kN, spalling began on the upper and lower sides of both walls, and diagonal cracks occurring at the vertical joints gradually extended, leading to the ultimate failure of the specimen. In the case of S-CIPW, the initial cracks extended to approximately 58% of the connection height, and shear cracks were relatively prevalent throughout the connection and the entire wall. This is attributed to the integral casting of the wall, which resulted in high strength and stiffness, allowing for the rapid attainment of high loads within a relatively short duration.
The load on the specimen S-PWR increased sharply from 130 kN to 330 kN without any visible cracks. Cracks emerged at the upper part of the vertical joint when the load reached 400 kN and further propagated along the mortar at 550 kN. Following the attainment of the maximum load, spalling of the mortar within the joint occurred, leading to the development of significant shear cracks as they extended from the joint into the central wall. Subsequently, the experiment was terminated with the failure of the vertical joint.
The initial crack in the specimen S-PWB occurred at the vertical joint when the load reached 130 kN. Shear cracks began to develop in the upper and lower parts of the joint at 300 kN. Upon reaching a load of 530 kN, significant spalling of the concrete and mortar near the joint occurred, leading to the termination of the experiment. The specimen S-PWB exhibited a comparatively higher number of cracks than other specimens. This can be attributed to the use of high-tension bolts in the vertical joint for enhanced ductility, allowing the specimen to undergo relatively large displacements compared to other specimens.
3.4.2. Force–Displacement Relationship
The experimental results obtained from direct shear tests are summarized in
Table 2, and the force–displacement relationships for the specimens are presented in
Figure 7. The ultimate displacement is defined as the displacement at the point when the load is reduced by 20% after reaching the maximum load. The initial stiffnesses of S-PWR and S-PWB decreased by 3.85% and 65.38%, respectively, compared to S-CIPW. The maximum forces of those specimens also decreased by 59.06% and 64.66%, respectively. In terms of ultimate displacement, S-PWR showed a decrease of 6.54%, while S-PWB exhibited a significant increase of 410.47%. Compared to S-PWR with improved wet joints, the maximum load of S-PWB with high-tension bolted dry joints decreased by 13.67%, while its ultimate displacement increased by 446.20%. The lower maximum strength of S-PWB can be attributed to the application of dry joints. Both PC wall specimens showed incomplete monolithic structural behavior due to the presence of vertical joints, leading to lower initial stiffnesses and maximum forces compared to S-CIPW. However, considering the overall behavior, both PC wall specimens did not exhibit sudden failure after reaching the maximum force, unlike S-CIPW. S-PWB with vertical joints with high-tension bolts exhibited superior ductile behavior with a maximum displacement at failure that was approximately five times larger than that of the S-CIPW. Additionally, both S-PWR and S-PWB effectively controlled crack formation and damage at comparable load points.
3.4.3. Shear Deformation
To measure the shear deformation of the vertical joint in the PC wall specimen, “X”-shaped LVDTs were installed as described in
Figure 5. Shear deformation was evaluated as the average shear strain (
using Equation (1), and its configuration is illustrated in
Figure 8. The force–average shear strain relationship shown in
Figure 8 shows a similar trend to the force–displacement relationship shown in
Figure 7. The maximum average shear strain for the specimens S-CIPW, S-PWR, and S-PWB were 0.0022, 0.0196, and 0.1327, respectively. In comparison to the shear strain observed in S-CIPW, the specimens S-PWR and S-PWB exhibit significantly higher values, with increases of 790.91% and 5931.82%, respectively. Despite the significantly higher shear strain, S-PWR and S-PWB did not exhibit abrupt failure after reaching the maximum force, indicating the effective control of crack and damage.
3.4.4. Strain
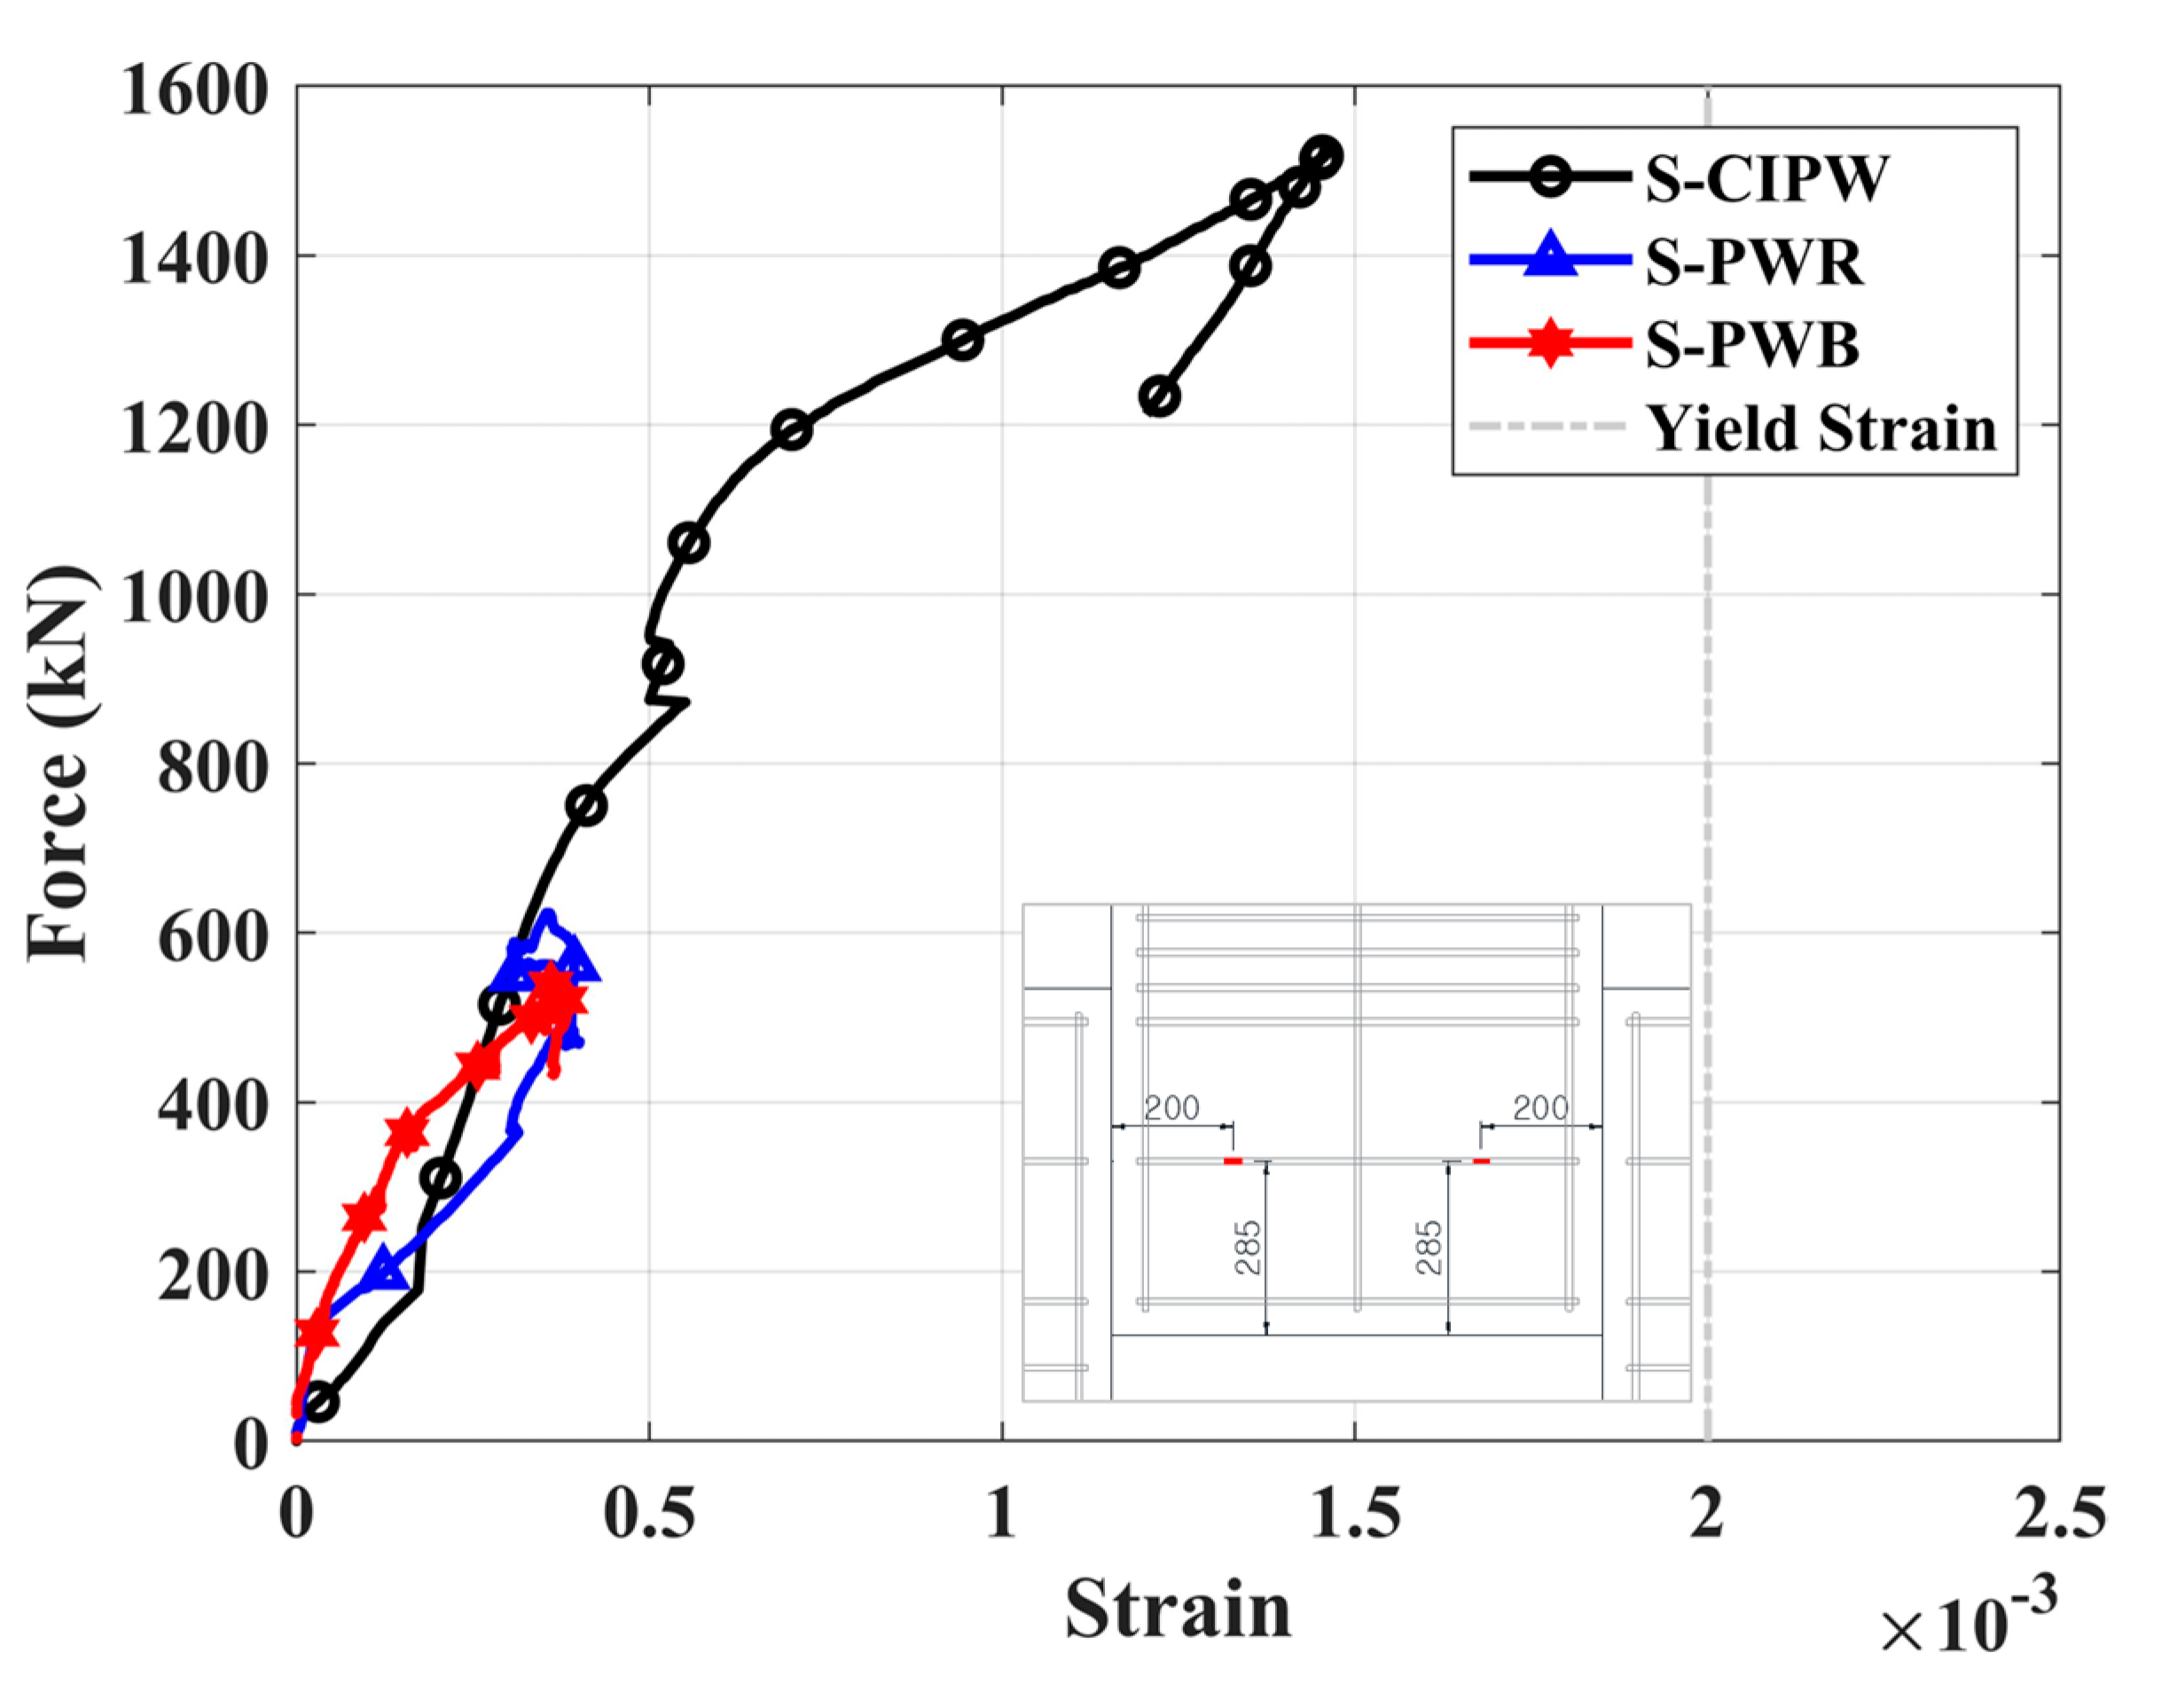
Significant changes in the strain of wall rebars did not occur, except for the horizontal rebars near the vertical joint. The positions and the force–strain relationships of these horizontal reinforcements are illustrated in
Figure 9. The strains depicted in
Figure 9 represent average values obtained from measurements taken at 200 mm from both left and right vertical joints and 285 mm above the bottom of the central wall.
As shown in
Figure 9, the wall rebars in all three specimens did not yield until the tests were terminated. The strains increased until reaching the maximum force and then showed a tendency to either maintain or decrease. In the case of S-CIPW, the wall strain significantly increased until reaching the maximum force, after which it rapidly decreased. The observed strain trend is deemed to be a result of the swift decrease in force after reaching the maximum force, ultimately leading to specimen failure. Furthermore, despite the specimen having the smallest ultimate displacement among the three specimens, its strain is the most significant.
The wall strain of S-PWB, which showed the largest ultimate displacement and suffered the most severe damage, was the smallest among the three specimens. It can be inferred that significant stress concentration on the high-tension bolts in the vertical joint caused substantial deformation in that area but relatively minimal deformation in the wall. Therefore, it is concluded that the proposed vertical joint effectively secures the deformation capacity of the wall itself.
4. Seismic Performance of PC Wall with the Proposed Vertical Joint
4.1. Details of Specimens
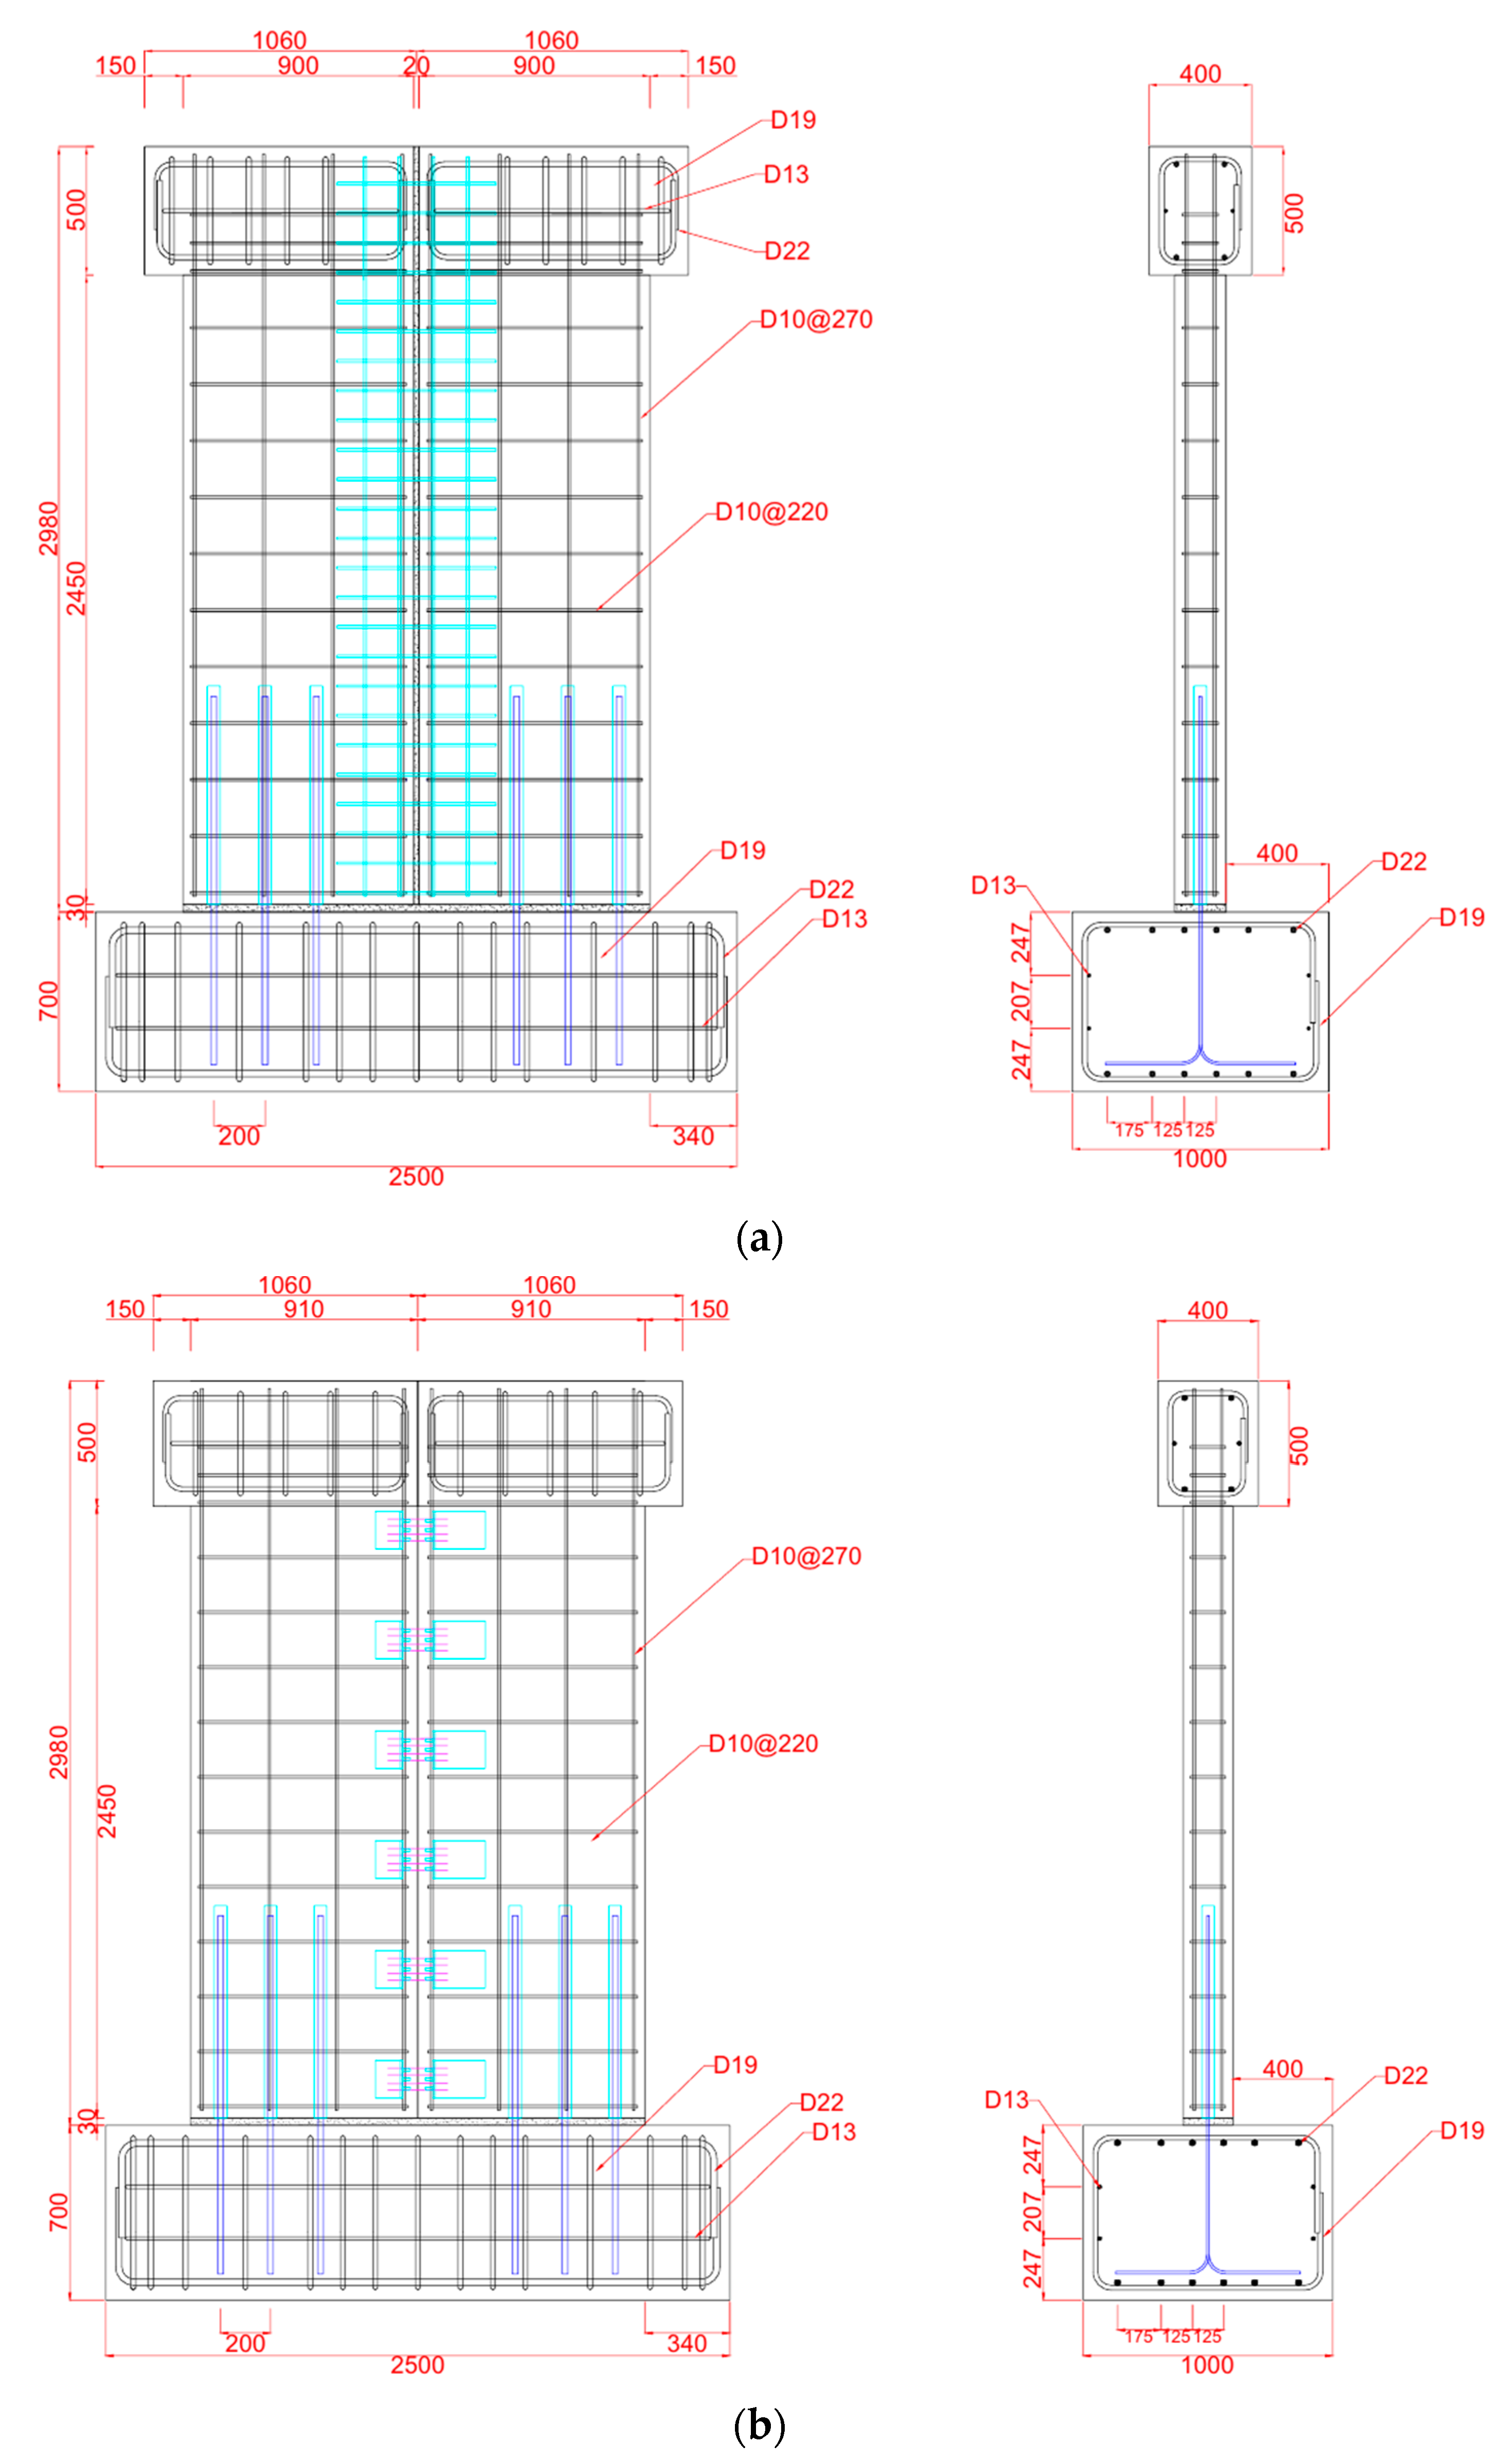
Two specimens were constructed to evaluate the seismic performance of PC walls with developed vertical joints, and static cyclic loading tests were conducted. The details of the specimens are presented in
Figure 10 and
Table 3. Each specimen has a configuration with a vertical joint between two wall panels. The vertical joints of the specimens used in the static cyclic loading tests are the same as those employed in the previous shear tests. The specimen C-PWR with an improved vertical wet joint serves as a reference specimen for comparing the performance of specimen C-PWB, which incorporates developed vertical dry joints.
For C-PWR, a 20 mm slit is applied between the two wall panels, and reinforcements with a diameter of 10 mm are utilized at the vertical joint. C-PWB represents a PC wall with proposed high-tension bolts in the vertical joint aimed at enhancing ductility compared to the PC wall with the conventional vertical joint. The number of high-tension bolts is determined by considering the initial stiffness from the previous shear test, as shown in
Table 2. By comparing the initial stiffnesses of S-CIPW and S-PWB, the shear strength and the number of high-tension bolts per unit length that satisfies 50% of the stiffness of S-CIPW are calculated. These values are then applied to the detailed design of the static cyclic loading test to determine the required number of bolts, resulting in 12 F10T-M22 standard bolts.
Additionally, to simulate the realistic structural behavior of PC walls, horizontal joints with corrugated tubes were applied between the bottom of the wall panels and the footing. Corrugated tubes are typically fabricated from corrugated alloys to enhance adhesion between the metal tube and concrete. After installing connecting rebars inside the corrugated tube, the joint is activated by casting the grout in the duct [
22]. Corrugated tube joints, designed to facilitate stress transfer longitudinal direction, offer the advantage of applying uniform compressive forces to the grout, thereby inhibiting splitting failure [
23].
The primary objective of this experiment is to evaluate the performance of the developed vertical joints. Therefore, to prevent failure due to the horizontal joints formed by the corrugated tubes and to ensure the integrity of the specimens, a shear friction design was implemented. The shear strength of the horizontal joints was designed to be approximately 1.7 times the shear friction strength specified in design codes for the horizontal connection in the PC wall, aiming to prevent failure caused by the horizontal joint formed by the corrugated ducts. Three corrugated tubes with a diameter of 50 mm each were installed per wall panel, and inside these ducts, a diameter of 22 mm rebars with a yield strength of 500 MPa were placed.
The clear height and thickness of the PC walls are 2450 mm and 200 mm, respectively. For the horizontal joint described previously, the thickness of the mortar pad cast between the bottom of the wall panel and the cap beam is 30 mm. The wall panel width and slit of C-PWR are 900 mm and 20 mm, while the wall panel width of C-PWB is 910 mm. Thus, the overall PC wall width, including the vertical joint and two panels, is identical to 1820 mm for both specimens.
4.2. Material Properties
For each test specimen, three concrete cylinders with a radius of 100 mm and a height of 200 mm and three mortar cube samples with dimensions of 50 mm × 50 mm × 50 mm were tested. The concrete compressive strengths of C-PWR and C-PWB are 27.44 MPa and 28.53 MPa, respectively. The compressive strengths of the mortar cast to the vertical joints of C-PWR and C-PWB are 60.34 MPa and 63.43 MPa, respectively. The tensile test results of 10 mm diameter rebars employed in PC walls and vertical joints reveal yield strength, ultimate strength, and yield strain values of 456.17 MPa, 569.53 MPa, and 0.0023, respectively. The yield strength, ultimate strength, and yield strain of 22 mm diameter rebars inside the corrugated tubes used for the horizontal joint are 552.20 MPa, 690.74 MPa, and 0.0028, respectively.
4.3. Experimental Program
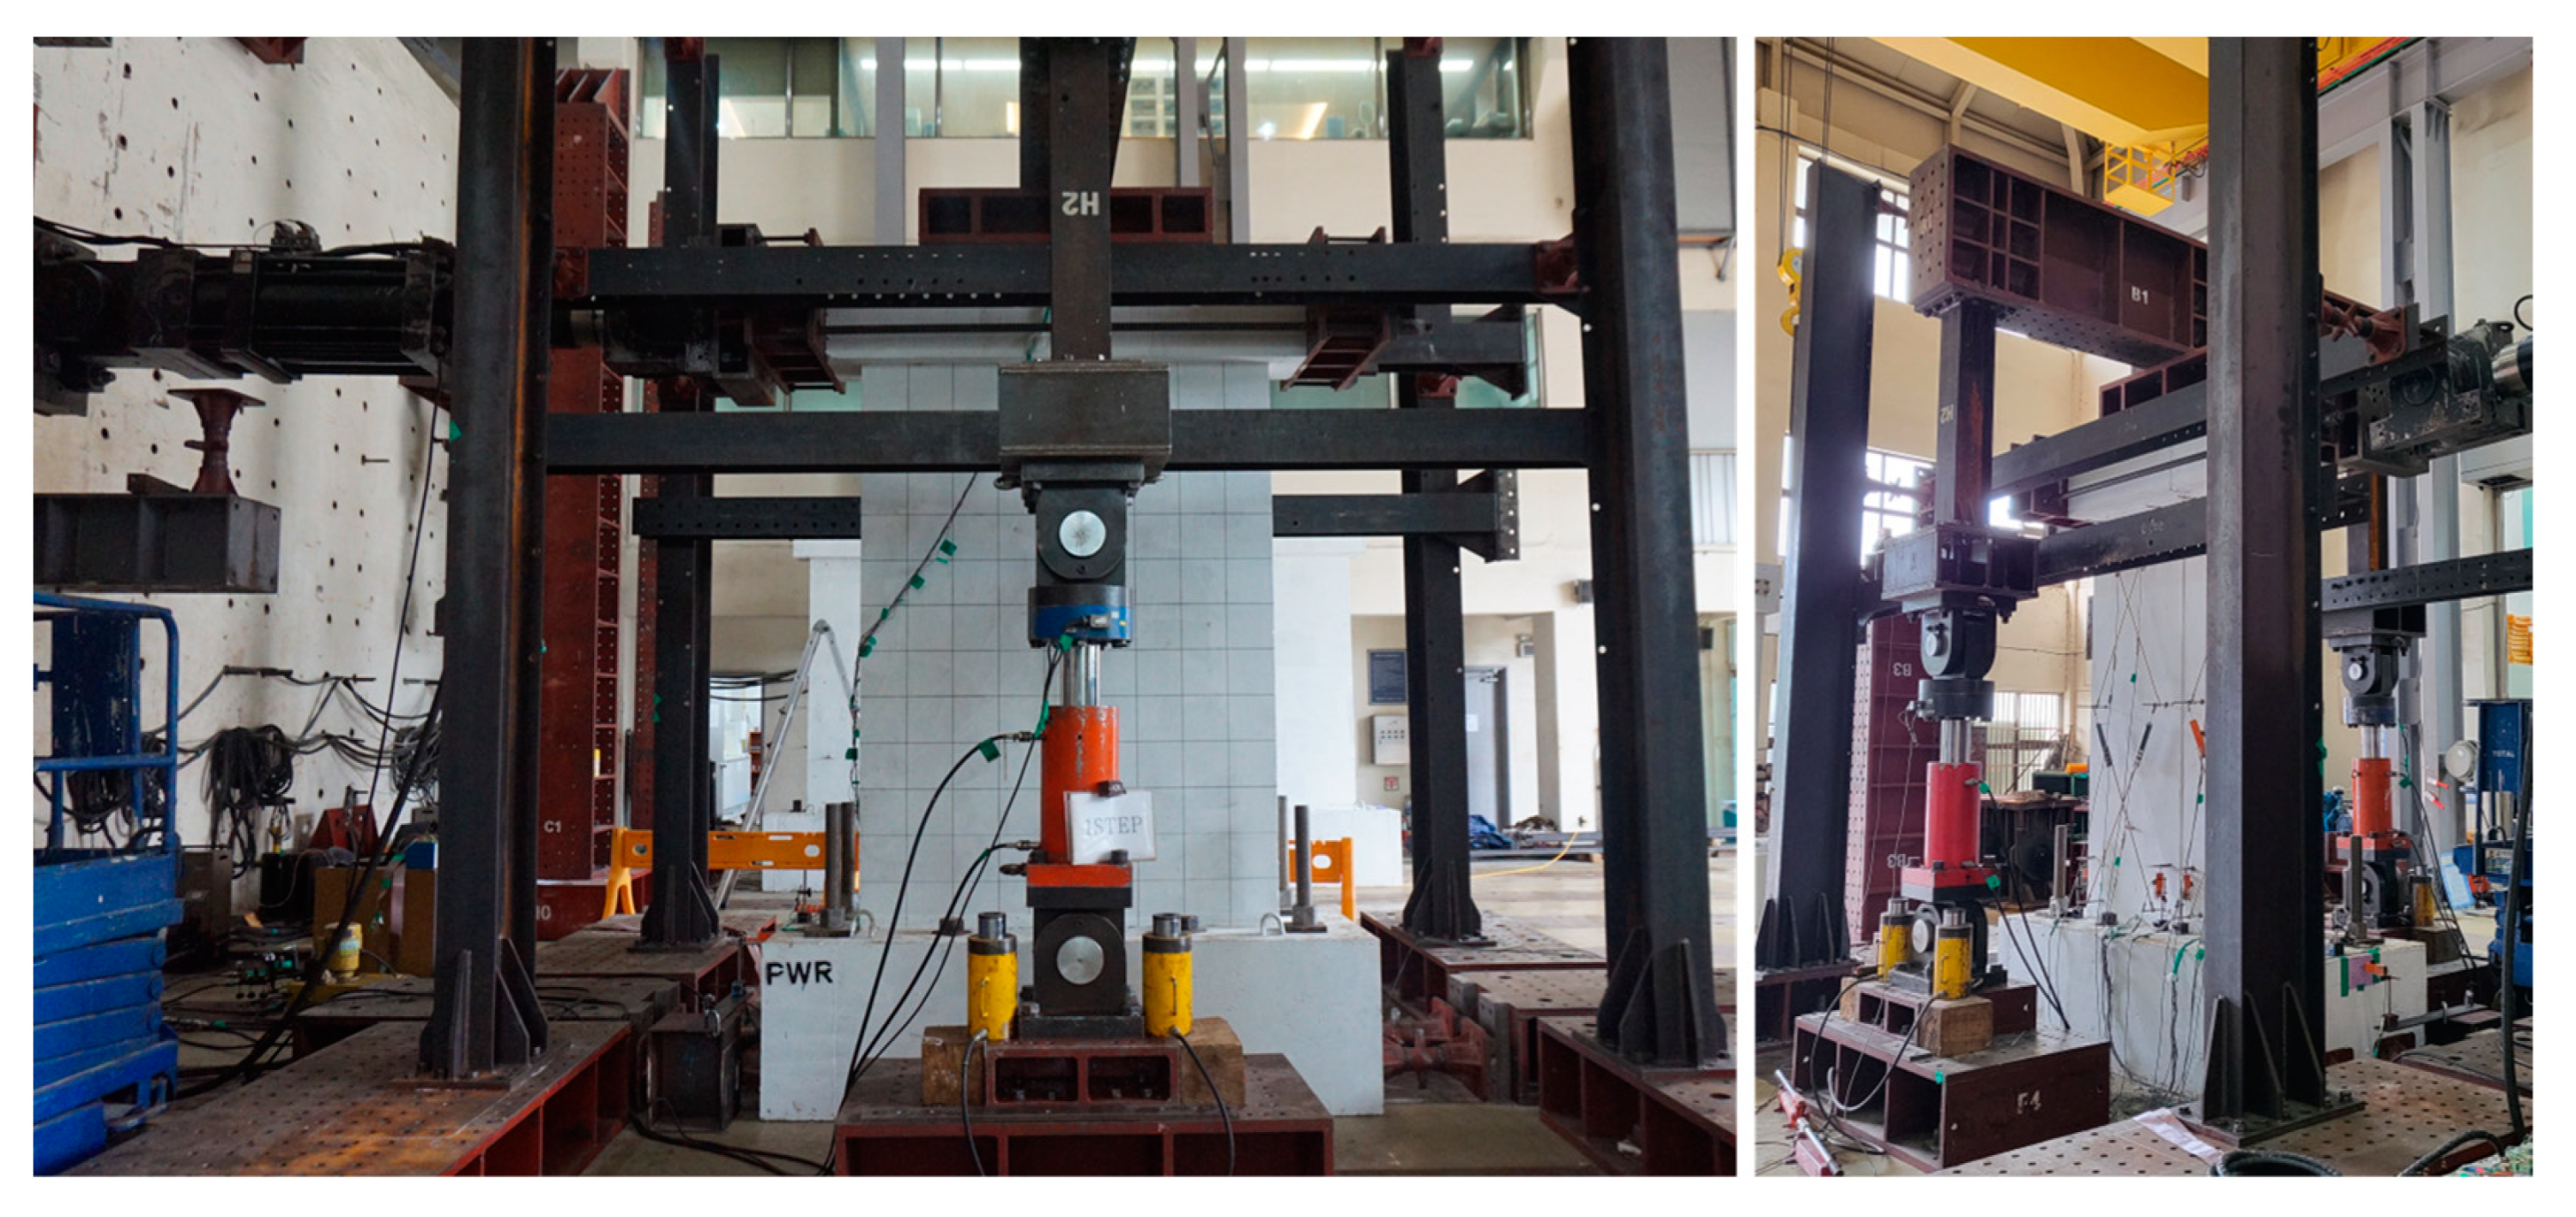
The setup for the static cyclic loading test is illustrated in
Figure 11. Eight dywidag thread bars were employed at the support of the specimens to securely fasten them to the reaction floor. In addition, to prevent out-of-plane deformation of the test specimens during experiments, steel rods were used to fix the space between the upper frame on the wall and the column frame. To ensure a uniform distribution of the applied axial load across the entire wall, a rigid frame was installed at the top of the specimens. A horizontal actuator with a capacity of 2000 kN was used to apply lateral forces, while two vertically installed hydraulic jacks with a capacity of 1000 kN each were responsible for applying compressive axial load. The data acquisition for these tests was performed at a rate of 1 sample per sec using a static data logger (JSM-350-32, JOOSHIN, Hanam-si, Kyeonggi-do, Republic of Korea).
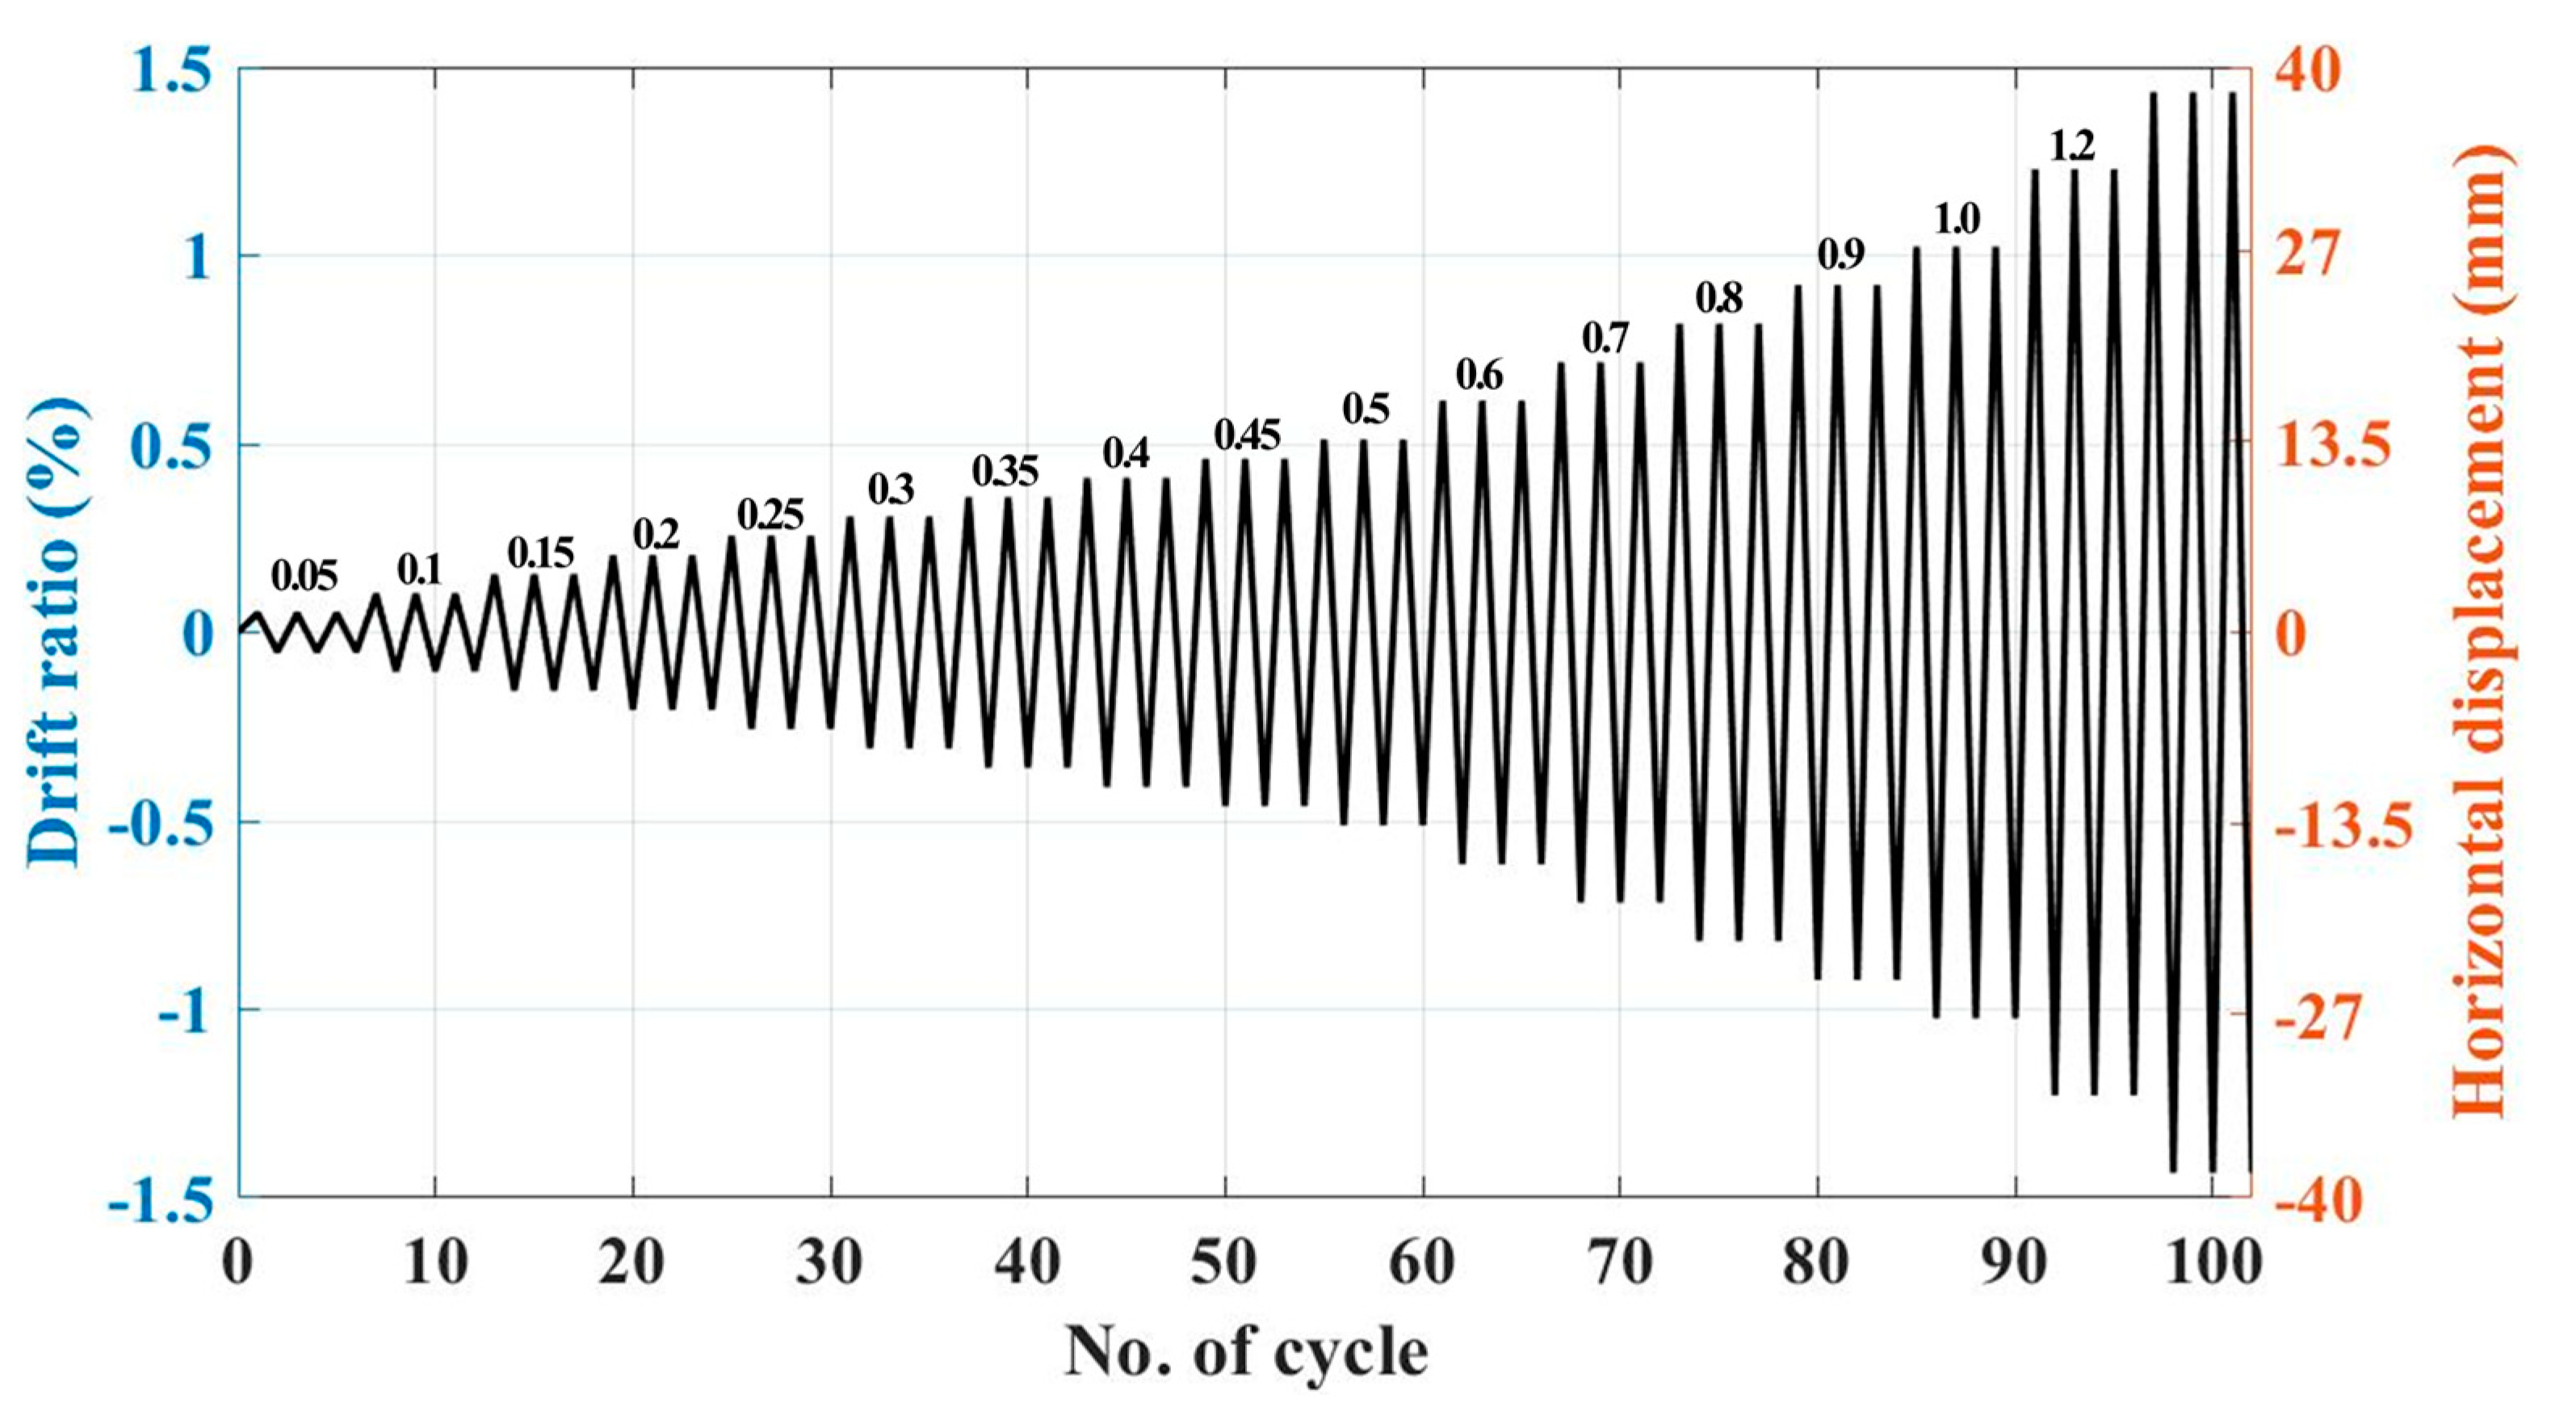
Figure 12 shows the applied lateral displacement history for the static cyclic loading tests under a constant axial load of 1092 kN, representing 10% of the ultimate axial capacity of the wall. The lateral displacement history was generated with multiple cycles at each displacement level to reflect the effect of strength degradation characteristics. The experiments were terminated either upon failure of the test specimens due to their inability to withstand the applied load or when the lateral load decreased to 80% of its maximum.
LVDTs and strain gauges were utilized to measure the strains of rebars and deformation of test specimens. As shown in
Figure 13a, a total of 17 LVDTs were installed. Four LVDTs were positioned horizontally (L1 to L4, L17) to measure the lateral displacement at the loading point, the rotation of the bottom cap beam, and the deformation of the mortar pad at the horizontal joint. Additionally, to monitor the occurrence of rocking of the wall panels due to horizontal joints, four LVDTs were installed vertically at each end of the wall panel (L13 to L16). “X”-shaped LVDTs were also installed to measure the shear deformation occurring on the wall panel surfaces (L5 to L12). To assess the strain of the rebars in the wall, strain gauges were installed, as depicted in
Figure 13b, focusing on the plastic hinge region and the vertical joint.
4.4. Experimental Results
4.4.1. Crack Patterns
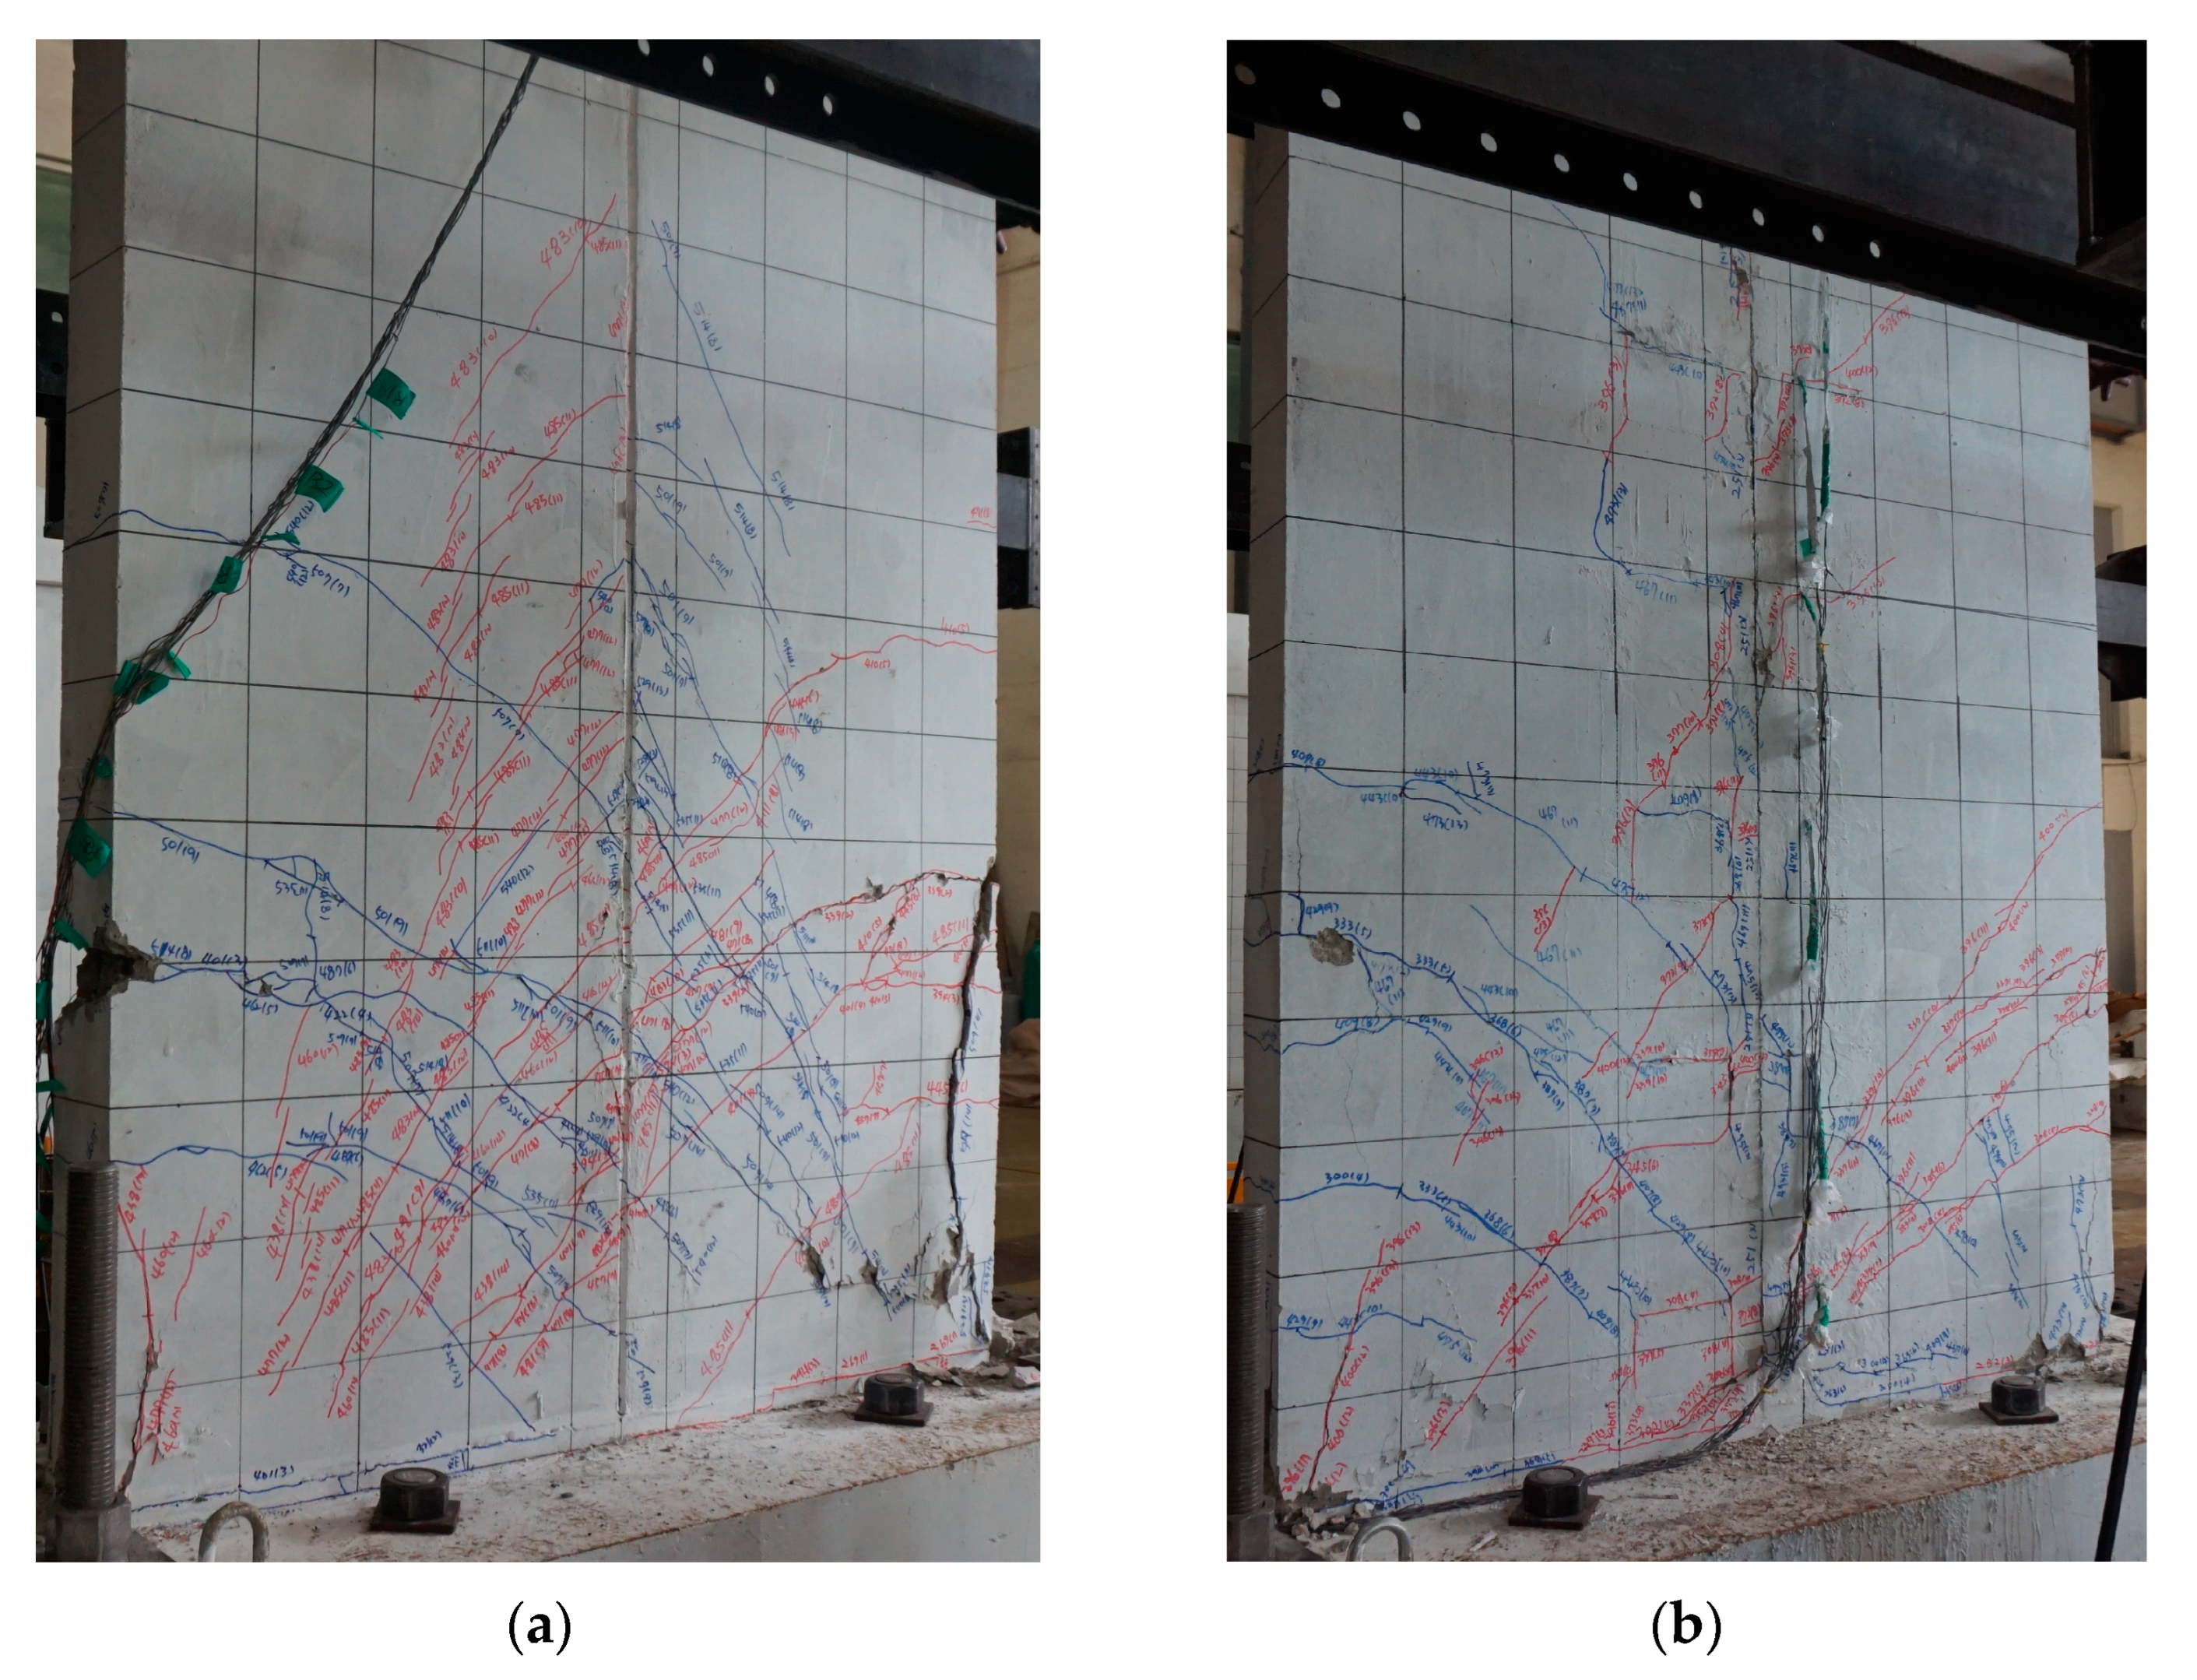
Figure 14 shows the crack patterns of the specimens at the end of testing. At a drift ratio of 0.05%, the initial crack in the specimen C-PWR with the wet vertical joint occurred horizontally at the interface of the mortar pad in the horizontal joint. Subsequently, multiple cracks propagated through the wall panel and vertical joint. As the drift ratio reached 0.4%, numerous cracks occurred horizontally and diagonally at the upper part of the wall panel. At a drift ratio of 0.5%, cracks concentrated near the mortar in the vertical joint, and at a drift ratio of 0.8%, concrete spalling began at the central and lower sides of the wall panel. These cracks continued to propagate and expand until the drift ratio reached 1.0%, at which point the section with spalling experienced further failure, leading to the termination of the experiment.
At a drift ratio of 0.1%, specimen C-PWB with the dry vertical joint experienced the first crack horizontally at the interface of the mortar pad between the bottom of the wall and the cap beam. Subsequently, multiple cracks developed at the lower part of the wall panel. Upon reaching a drift ratio of 0.45%, numerous cracks occurred at the interface of the vertical joint at the upper part of the wall panel, gradually expanding until concrete spalling occurred at a drift ratio of 0.8%. As the drift ratio increased, the crack width expanded, leading to the failure of the lower and central sides of the wall panel at a drift ratio of 1.1%, ultimately concluding the test.
As described above, the overall crack patterns of both specimens appeared similar. However, cracks and damage in C-PWR were more severe throughout the entire wall panel and near the vertical joint compared to those in C-PWB. Particularly, a noticeable reduction in both the number and width of cracks, along with a significant decrease in the spalled concrete of the wall panel, was observed in C-PWB. Therefore, it can be inferred that the proposed high-tension bolt vertical joint has a significant effect on controlling cracks and reducing damage in both the wall panel and the vertical joint.
4.4.2. Force–Drift Ratio Relationship
The experimental results of the specimens subjected to static cyclic loadings are summarized in
Table 4.
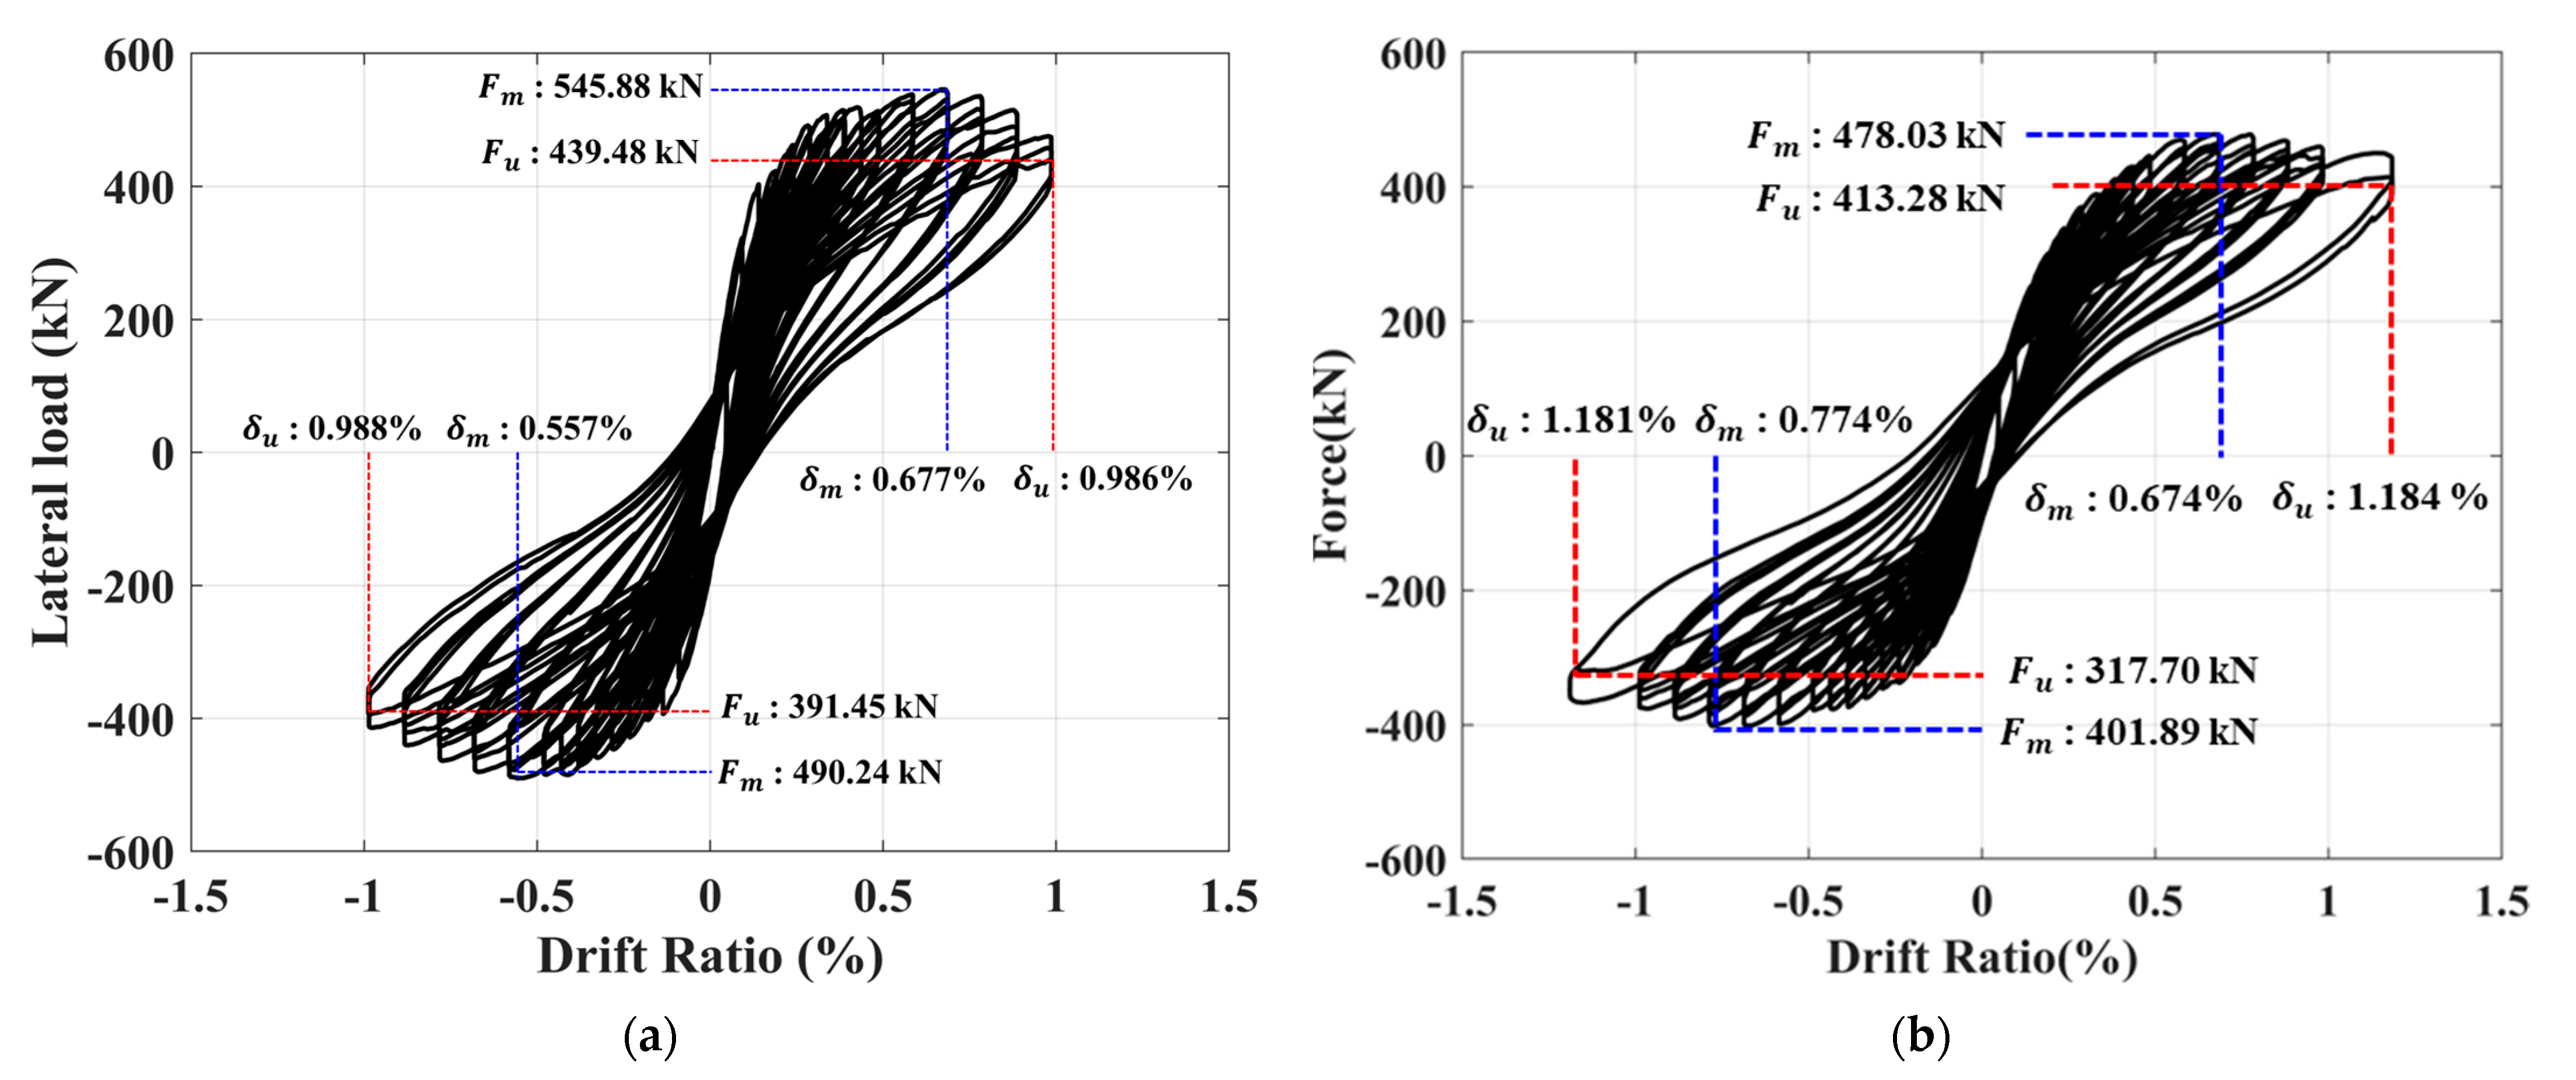
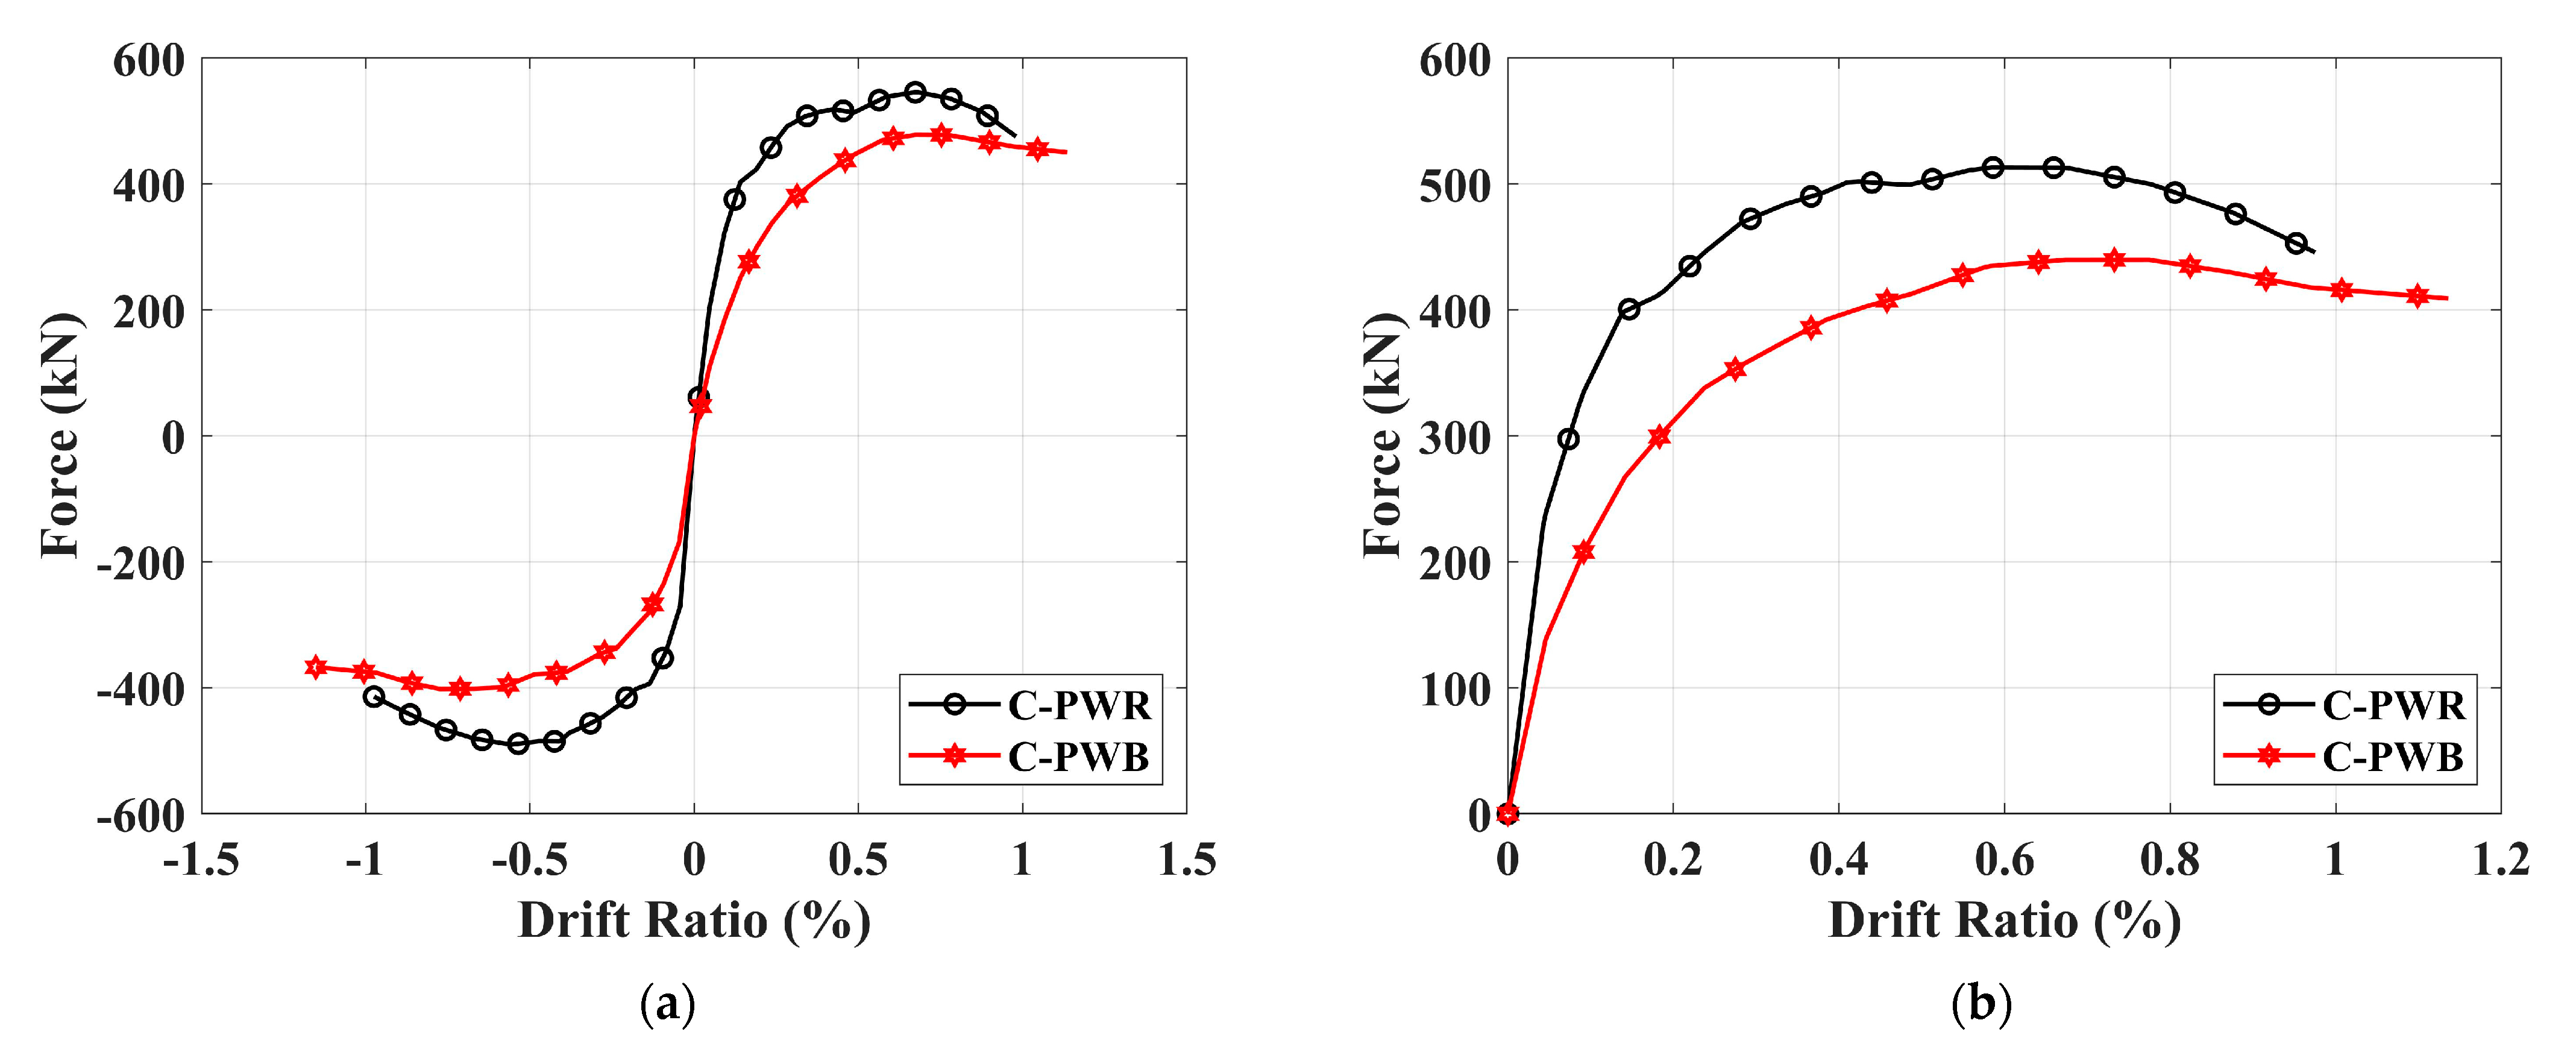
Figure 15 shows the force–drift ratio relationships of test specimens, while
Figure 16 shows their envelope curves and average envelope curves. The average maximum strengths of the specimens C-PWR and C-PWB are 518.06 kN and 439.96 kN, respectively. Compared to the reference specimen C-PWR, C-PWB showed a 15.08% decrease in average maximum strength. However, the ultimate displacement at which the experiment terminated increased by 19.86% for C-PWB. Furthermore, C-PWB showed a relatively gradual reduction in force compared to C-PWR. C-PWB employs high-tension bolts alone, creating a dry connection between the PC wall panels. Conversely, C-PWR utilizes a wet joint with high-strength mortar over a larger area, effectively mimicking the behavior of a monolithic CIP wall. Thus, the observed lower strength and stiffness in C-PWB originate from these fundamental differences in connection type. Nevertheless, considering the developed specimen C-PWB aimed at enhancing ductility, its performance is deemed satisfactory, as evidenced by the observed trends of strength reduction and increased ultimate displacement rate compared to C-PWR.
4.4.3. Stiffness Degradation
The relationships of stiffness degradation for both test specimens are illustrated in
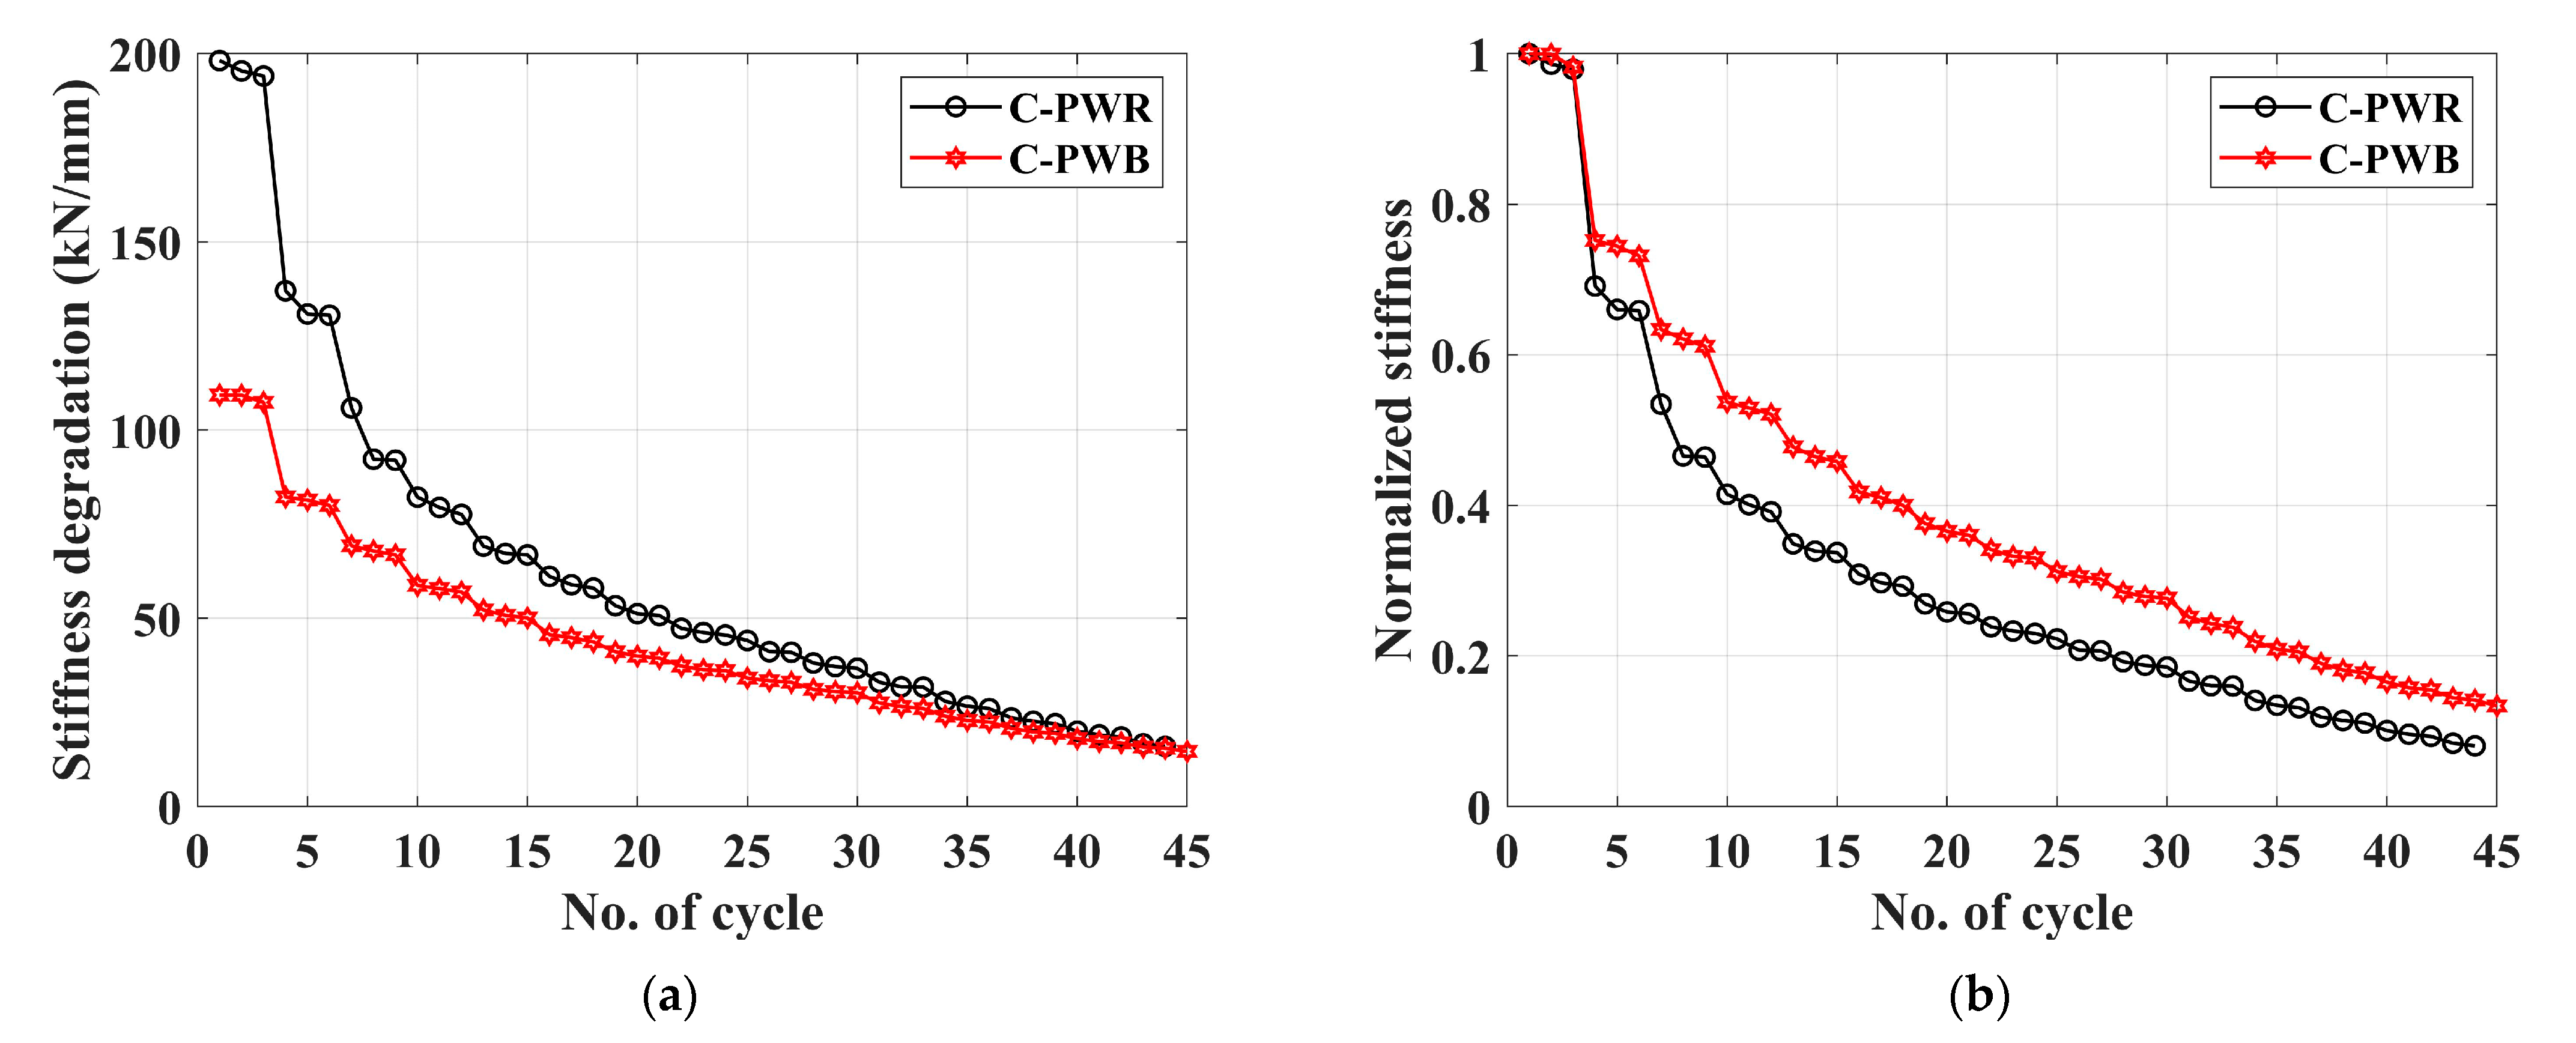
Figure 17.
Figure 17a represents the stiffness degradation concerning the initial stiffness, while
Figure 17b demonstrates the normalized stiffness degradation with respect to the initial stiffness. The initial stiffness of C-PWR and C-PWB is 198.18 kN/mm and 109.33 kN/mm, respectively, resulting in a 44.83% reduction in C-PWB compared to C-PWR. For both specimens, the most significant stiffness degradation occurred as the drift ratio increased from 0.05% to 0.1%, with reductions of 90.86% and 24.80% for C-PWR and C-PWB, respectively. Comparing the point where 50% of the initial stiffness is reduced, C-PWB exhibited a delay of 62.5% compared to C-PWR based on cycles. Similarly, at the point where 70% of the initial stiffness is reduced, C-PWB showed a 64.71% delay compared to C-PWR. In comparison to C-PWB, the substantial cracks and damages across the vertical joints and the entire wall of C-PWR, as the drift ratio increased, led to a more pronounced stiffness degradation. Therefore, it can be concluded that the application of the proposed vertical joint with high-tension bolts in this study results in a relatively lower initial stiffness but effectively delays the rate of stiffness degradation, ultimately preventing the abrupt failure of the wall.
4.4.4. Ductility
The ductility was calculated as the ratio of the yield displacement to the ultimate displacement from the average envelop curve shown in
Figure 16b. The yield displacement was defined by the energy equivalent method, and the ultimate displacement was defined as the point where the load decreased by 20% after reaching its maximum. The ductility for each specimen is detailed in
Table 5.
Despite a remarkable 19.86% increase in ultimate displacement for C-PWB compared to C-PWR, its ductility ratio of 4.93 only showed a modest 1.23% increase over 4.87 for C-PWR. This seemingly counterintuitive finding can be explained by the influence of initial stiffness and peak load timing on the calculated yield displacement. C-PWB had a 44.83% lower initial stiffness and reached its peak load 17.34% later than C-PWR. These factors contributed to a delayed yield displacement for C-PWB, leading to a smaller relative increase in ductility despite its improved ultimate capacity. Additionally, the horizontal joints likely induced hinge-like behavior in the lower section of the wall, further contributing to delayed yielding and affecting overall behavior.
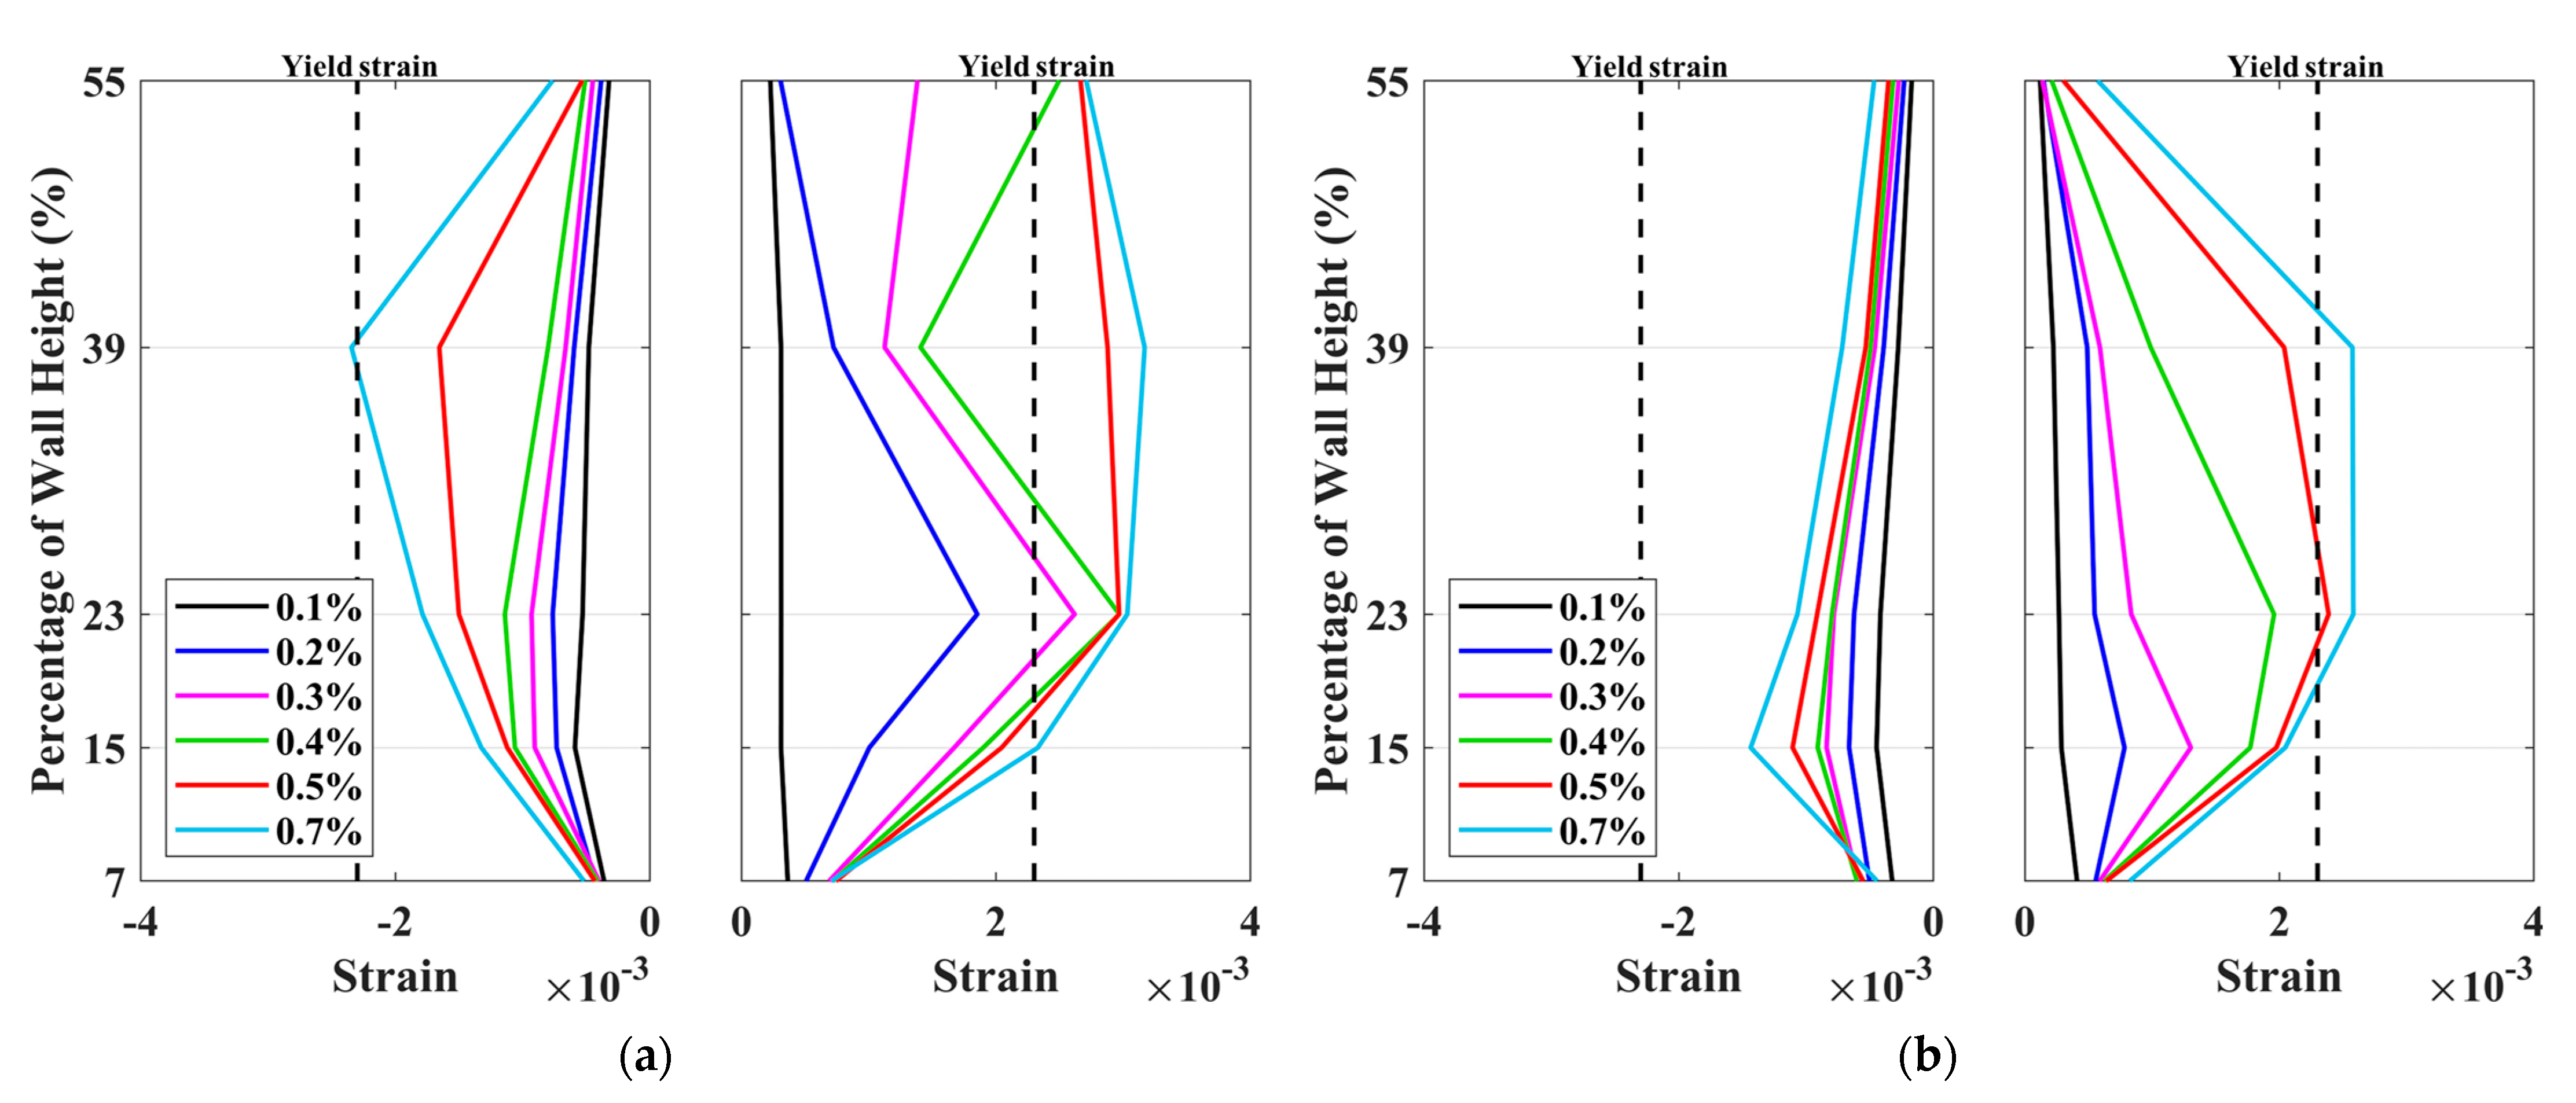
4.4.5. Strain Distribution
The strain distributions of vertical and horizontal rebars in the PC wall for each specimen are illustrated in
Figure 18 and
Figure 19, respectively. The first yielding in vertical rebar of C-PWR occurred at a height corresponding to 23% of the total wall height when the drift ratio reached 0.3%. In contrast, the vertical rebar of C-PWB yielded first at the same height but with a drift ratio of 0.5%. Contrary to the typical trend of increasing deformation closer to the bottom of the wall, both specimens exhibited a significant increase in strain between 20% and 40% of the wall height. It could be inferred that premature damage in the mortar pad of a horizontal joint at the bottom of the wall caused the lower part of the wall to behave like a hinge, resulting in predominant yielding in the upper region. Additionally, the increased stiffness in the lower part due to the application of the corrugated tube could lead to significant deformation near the injection of the corrugated tube.
Figure 18 clearly shows that the observed strains of C-PWB with a 19.86% higher ultimate drift ratio are lower than those of C-PWR. This suggests that the application of the vertical joint with high-tension bolts to the PC wall contributes to better performance in terms of deformation capacity. Furthermore, as shown in
Figure 19, both specimens’ horizontal reinforcement did not yield until the end of the experiment, yet their strain distribution was similar.
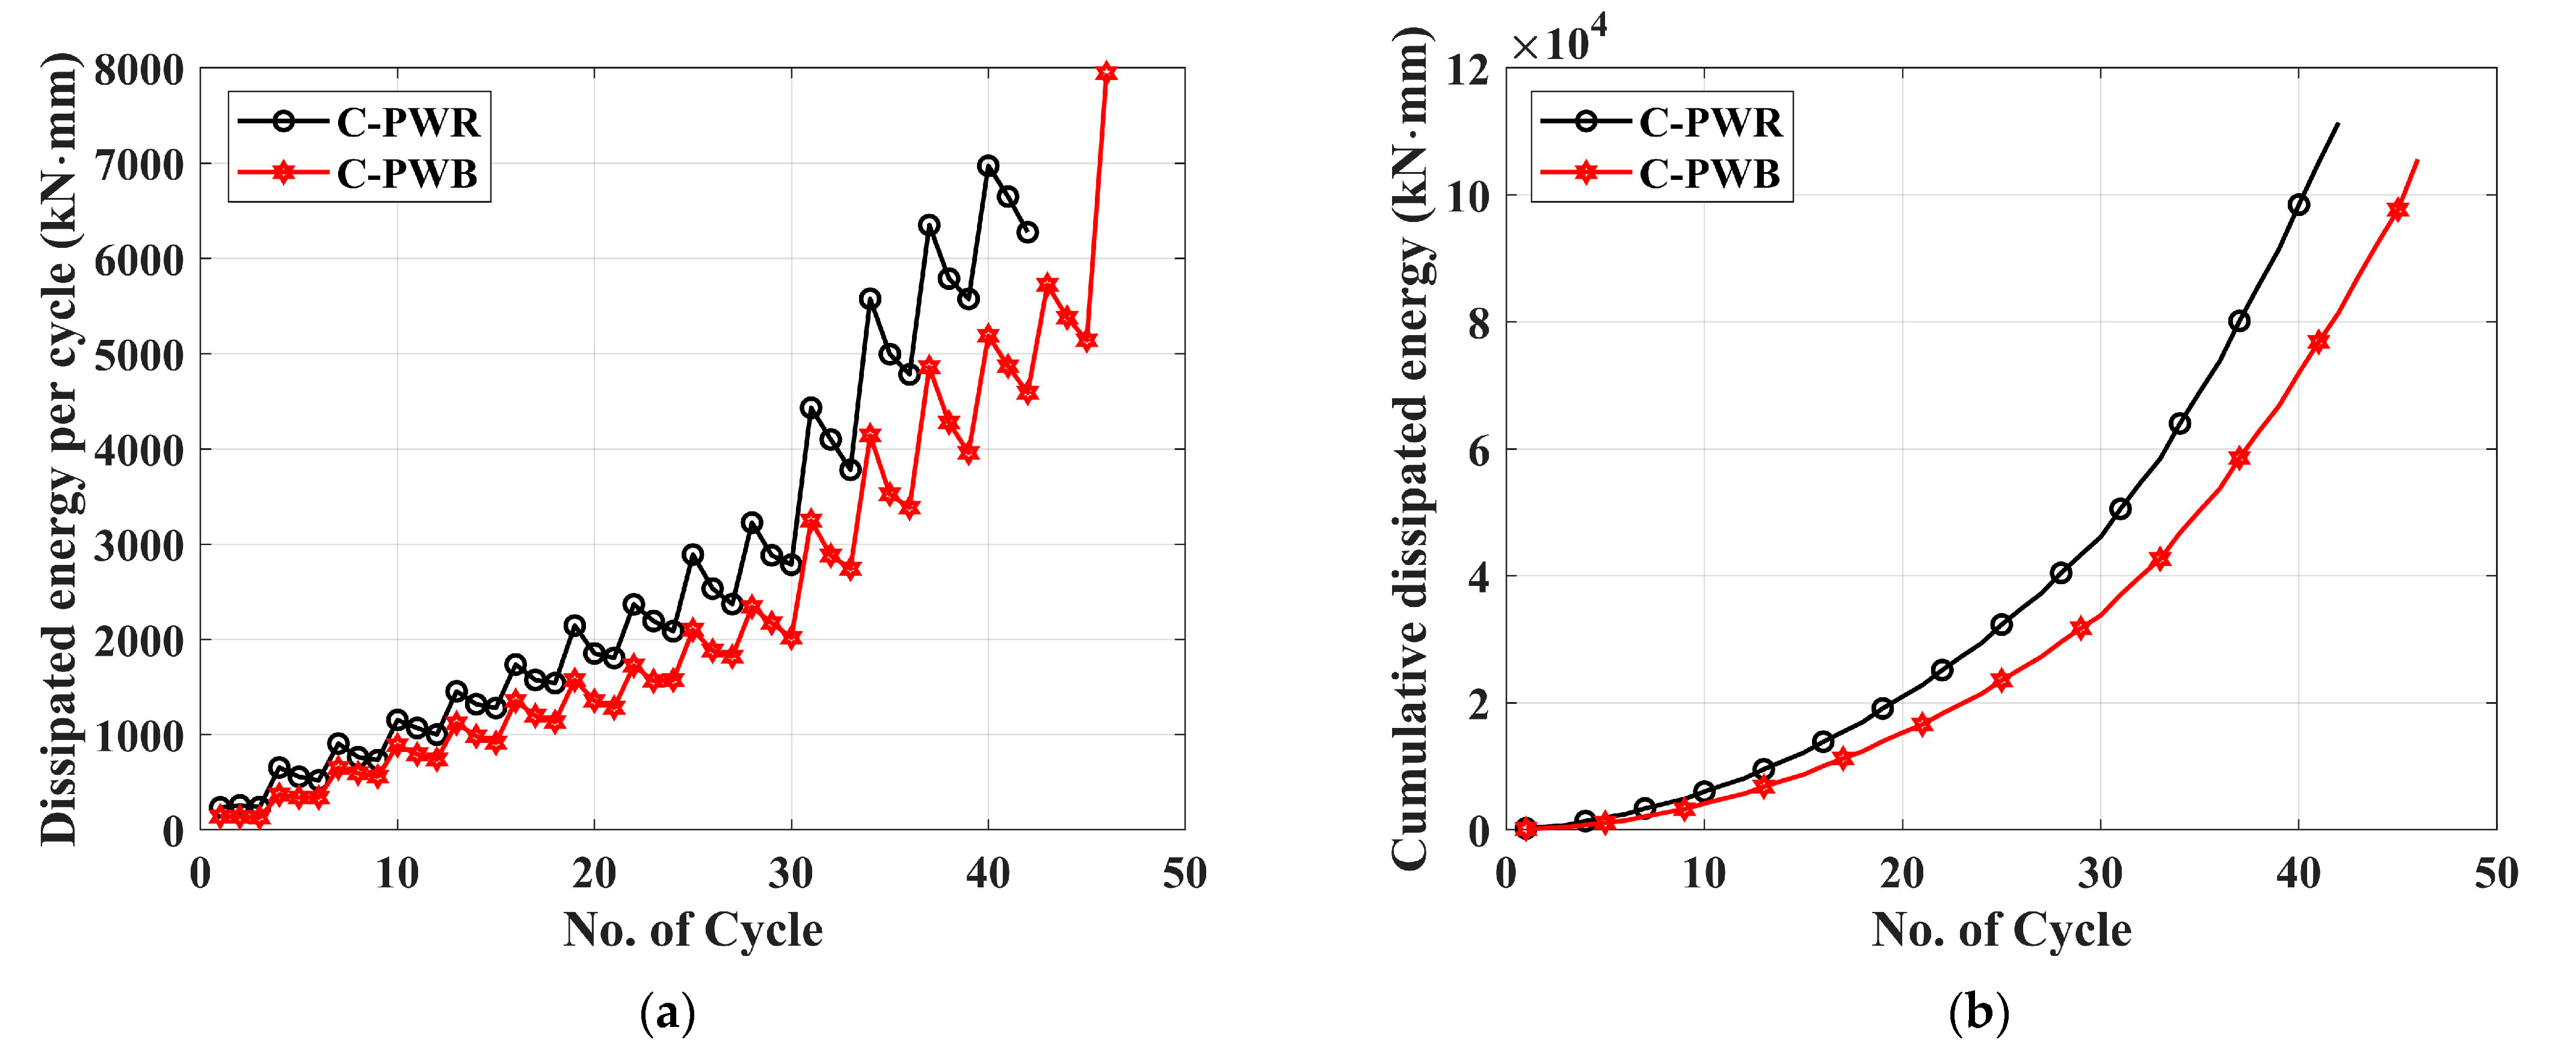
4.4.6. Energy-Dissipation Capacity
Figure 20 illustrates the energy dissipation per cycle, calculated by the area enclosed by the hysteresis curve, and the cumulative dissipated energy. Both specimens initially exhibited comparable energy dissipation as the loading cycles increased. A significant increase in dissipated energy occurred after 30 cycles (corresponding to a drift ratio of 0.5%). Notably, C-PWB achieved the highest energy dissipation just before failure (at a drift ratio of 1.1%). This peak dissipation coincided with the formation of numerous cracks near the wall and joint areas, accompanied by a substantial increase in crack width. In terms of cumulative energy dissipation, C-PWR consistently showed higher values than C-PWB across all cycles. Ultimately, the cumulative dissipated energy of C-PWB was 5.21% lower than that of C-PWR. This can be attributed to the relatively higher lateral stiffness and force of C-PWR, along with its transverse reinforcement ratio in the vertical joint exceeding the typical range by at least 14.81%, leading to more ductile behavior. Therefore, considering that C-PWB achieved 94.79% of the cumulative dissipated energy of C-PWR, the PC wall with the proposed vertical joint incorporating high-tension bolts could provide sufficient seismic performance in terms of energy dissipation.
5. Conclusions
This study introduces a novel vertical joint for PC walls utilizing high-tension bolts and experimentally assesses its effectiveness in enhancing shear and seismic performance. The shear behavior of three specimens is investigated through direct shear tests, while the seismic performance of a PC wall incorporating the proposed joint is evaluated through two static cyclic tests. The most important findings are summarized below.
Direct shear test results showed that the stiffness and strength of the PC wall with the proposed joint were lower than those of the cast-in-place concrete wall and the PC wall with the wet joint. However, the ultimate displacement increased significantly by more than 400%. In addition, the PC wall with the proposed joint did not exhibit sudden load reduction or failure, and it showed significant ductile behavior. In particular, it was found to be effective in suppressing shear cracks and damage in the PC wall.
Static cyclic loading test results showed that the maximum strength and initial stiffness of the PC wall with the proposed joint were reduced by 15% and 44%, respectively, compared to the PC wall with wet joints. However, the ultimate drift ratio increased by about 20%. Despite the decrease in initial stiffness and strength of the PC wall with the proposed joint compared to the PC wall with wet joints, the energy-dissipation capacity was similar.
Taking into account the observations from experiments in this study, the proposed joint exhibits remarkable deformation capacity, comparable energy dissipation despite reduced initial stiffness and strength, and effective crack control in PC walls. Therefore, it can be concluded that the proposed high-tension bolted vertical joint is effective in mitigating damage and improving the ductile behavior of PC walls.
While this study focused on static loading conditions and limited material composition, further research is necessary to comprehensively assess the proposed vertical joint system. Notably, future investigations should explore its behavior under realistic earthquake loads, analyze the influence of key component material compositions, and evaluate its long-term durability under diverse environmental conditions. Investigating these aspects in future research could provide valuable insights and potentially expand the system’s practical applications.


