Article

Utilizing Design Objectives and Key Performance Indicators as a Means for Multi-Species Building Envelopes

1
Faculty of Architecture and Town Planning, Technion Israel Institute of Technology, Haifa 3200003, Israel
2
School of Life Sciences, Technical University of Munich, 85354 Freising, Germany
3
Studio Animal-Aided Design, Dresdener Str. 26, 10999 Berlin, Germany
4
Department for Landscape Architecture and Landscape Planning, Technical University Vienna, 1040 Vienna, Austria
5
Architecture and Design Department, University of Genoa, 16123 Genoa, Italy
*
Author to whom correspondence should be addressed.
Buildings 2024, 14(1), 250; https://doi.org/10.3390/buildings14010250
Submission received: 14 November 2023 / Revised: 20 December 2023 / Accepted: 25 December 2023 / Published: 16 January 2024
(This article belongs to the Special Issue Multispecies Architectural Design: Challenges and Opportunities)

Abstract

:
Population growth, urbanization, and climate change have significantly contributed to environmental degradation, posing severe consequences for humans and other species. By integrating ecological objectives with human-centric goals, a path towards a sustainable, multi-species future is possible. Current sustainable design principles have shown positive environmental impacts by addressing human-centric objectives such as enhancing green infrastructure, energy efficiency, thermal comfort, and more. However, the incorporation of multi-species design criteria remains unresolved. This paper proposes a conceptual framework in which human-centric and ecological design objectives are defined and associated through the selection of key performance indicators (KPIs) represented by numerical thresholds. But, while the objective-KPI relationship is an established path in architectural design, the same does not apply for preserving and promoting biodiversity. The proposed conceptual framework identifies, defines, and associates the relevant objective-KPI relationships for all stakeholders and becomes the basis for evaluating the project computationally. Such an approach is currently lacking.

1. Introduction

In the coming years, humanity will face dramatic challenges relating to population growth, urbanization, and climate change. Urban resilience towards a sustainable and safe future requires understanding the complexity that governs urban environments and how we need to design our communities and buildings per se [1]. The rising rate of environmental degradation has led government sectors, policymakers, and professional practitioners towards the establishment of Sustainable Development Goals (SDGs) through green infrastructure and green building practices [2,3]. Such goals are mainly underlined in the work of the UN SDG [4]. This work entails the implementation of human-centric objectives, i.e., enhancing thermal comfort (indoors/outdoors), advancing energy efficiency, improving air quality, reducing noise pollution, promoting green infrastructure, and more [5,6,7,8,9,10].
However, human impact on the physical environment, as a result of the above pressing issues, affects ecosystem services on a global as well as local scale [10,11,12,13]. Nevertheless, conventional architecture, as well as green architecture, is mainly human-centric, and the setting of ecological design objectives alongside the architectural ones is not common practice. Different ranges of ecosystem functions, relating to different contexts, climates, and data collection, need to be adapted to a variety of contexts, with the urban environment being one of them. In this paper, we introduce ‘ecological design objectives’, characterized by non-human stakeholders and formulated based on ecological knowledge to meet the needs of these stakeholders. The introduction of ecological knowledge into architectural design through the consideration of other stakeholders will enhance biodiversity within the urban fabric.
Architectural design requires criteria for evaluation, i.e., design objectives towards improving a building’s performance [14,15]. Topics could refer to accessibility, architectural composition, cost-effectiveness, preservation, sustainability, and more. Objectives are perceived as project goals that are identified early in the design process, relate to the project context, and become part of the traditional design brief [16,17,18]. Indicators can evaluate these goals and confirm success or failure. In that respect, key performance indicators (KPIs) offer a systematic approach by evaluating performance in reference to the objectives set [19]. Concerning the environmental performance of sustainable buildings aiming to reduce environmental impact, for example, indexes are needed for measuring environmental performance [20]. The process requires the selection of sustainable building indicators as well as their degree of importance. So, an objective-KPI framework needs to be developed.
We propose that ecological parameters, e.g., the composition and distribution of plants and animals, together with the ecological objectives that may accompany them, are integrated into urban planning through the design of the building envelope. The envelope becomes a multi-species living space supporting the lives of diverse inhabitants, including procaryotes, fungi, algae, mosses, ferns, vascular plants, unicellular and multicellular animals, and humans. Weisser et al. (2022) suggested that multi-species design can be applied to ecolopes, i.e., ECOlogical building enveLOPE, where the stakeholders are humans, plants (including fungus), animals, and microbiota [21,22]. Weisser et al. (2022) brought forward the requirement for evaluating the performance of multi-species design through the selection of KPIs, defined for each stakeholder [22].
However, currently, there is no architectural or ecological framework to support multi-species design. In addition, the main professions that have traditionally built the urban environment are landscape architects, architects, urban planners, and landscape planners. This means that informed ecological knowledge on green infrastructure is currently lacking, i.e., ecological knowledge integrated into architectural design, contributing both to human well-being and nature conservation. Nevertheless, the advanced knowledge of ecosystem services and ecological design necessitated in planning has to come from a multidisciplinary approach [23,24,25]. Therefore, we propose the addition of a new layer of information in the sustainable design of cities that considers ecological parameters alongside architectural design by developing a conceptual framework for multi-species design. The process entails ecological design objectives alongside architectural design objectives, through the selection of suitable KPIs.
Regarding the allocation of KPIs to different stakeholders, our approach involves utilizing a range of KPIs. We advocate for an adaptable strategy that embraces diverse perspectives on defining objectives. As a result, the KPIs presented here are not definitive but rather exemplify the rationale behind several potential approaches to KPI implementation. An important consideration in the objective-KPI relationships is that they have to be computable for evaluation as part of the project’s future steps. In addition, the objectives of human and non-human stakeholders can be contradictory or synergistic.
The following sections introduce a multi-species objective-KPI framework through multi-stakeholder objectives and the connections with the KPIs that define them. This paper begins (Section 2) with a background section on integrating ecological design objectives into the architectural design environment. Section 3 delves deeper into the objective-KPI relationships for all stakeholders through the introduction of generic themes that the KPIs may derive from. Section 4 discusses the potential common ground between human-centric design and the integration of other stakeholders within building design. Section 5 puts forward the requirements for the evaluation of the project through the integration of an ecological modeling layer (plants, animals, and microbiota) into the 3-dimensional architectural environment (humans). The process suggests linking quantifiable KPIs to architectural and ecological objectives. It does so through KPI synergies and trade-offs, represented by numerical thresholds, through the “nested hierarchy” methodology.
This paper concludes with an outline of the computational methodology supported by a preliminary case-study example. While the computational approach has not been fully explored to-date, its realization will enhance planning practices by introducing combined architectural and ecological knowledge.
The project’s key definitions are the following:
  • Ecological design objectives: design objectives for non-human stakeholders.
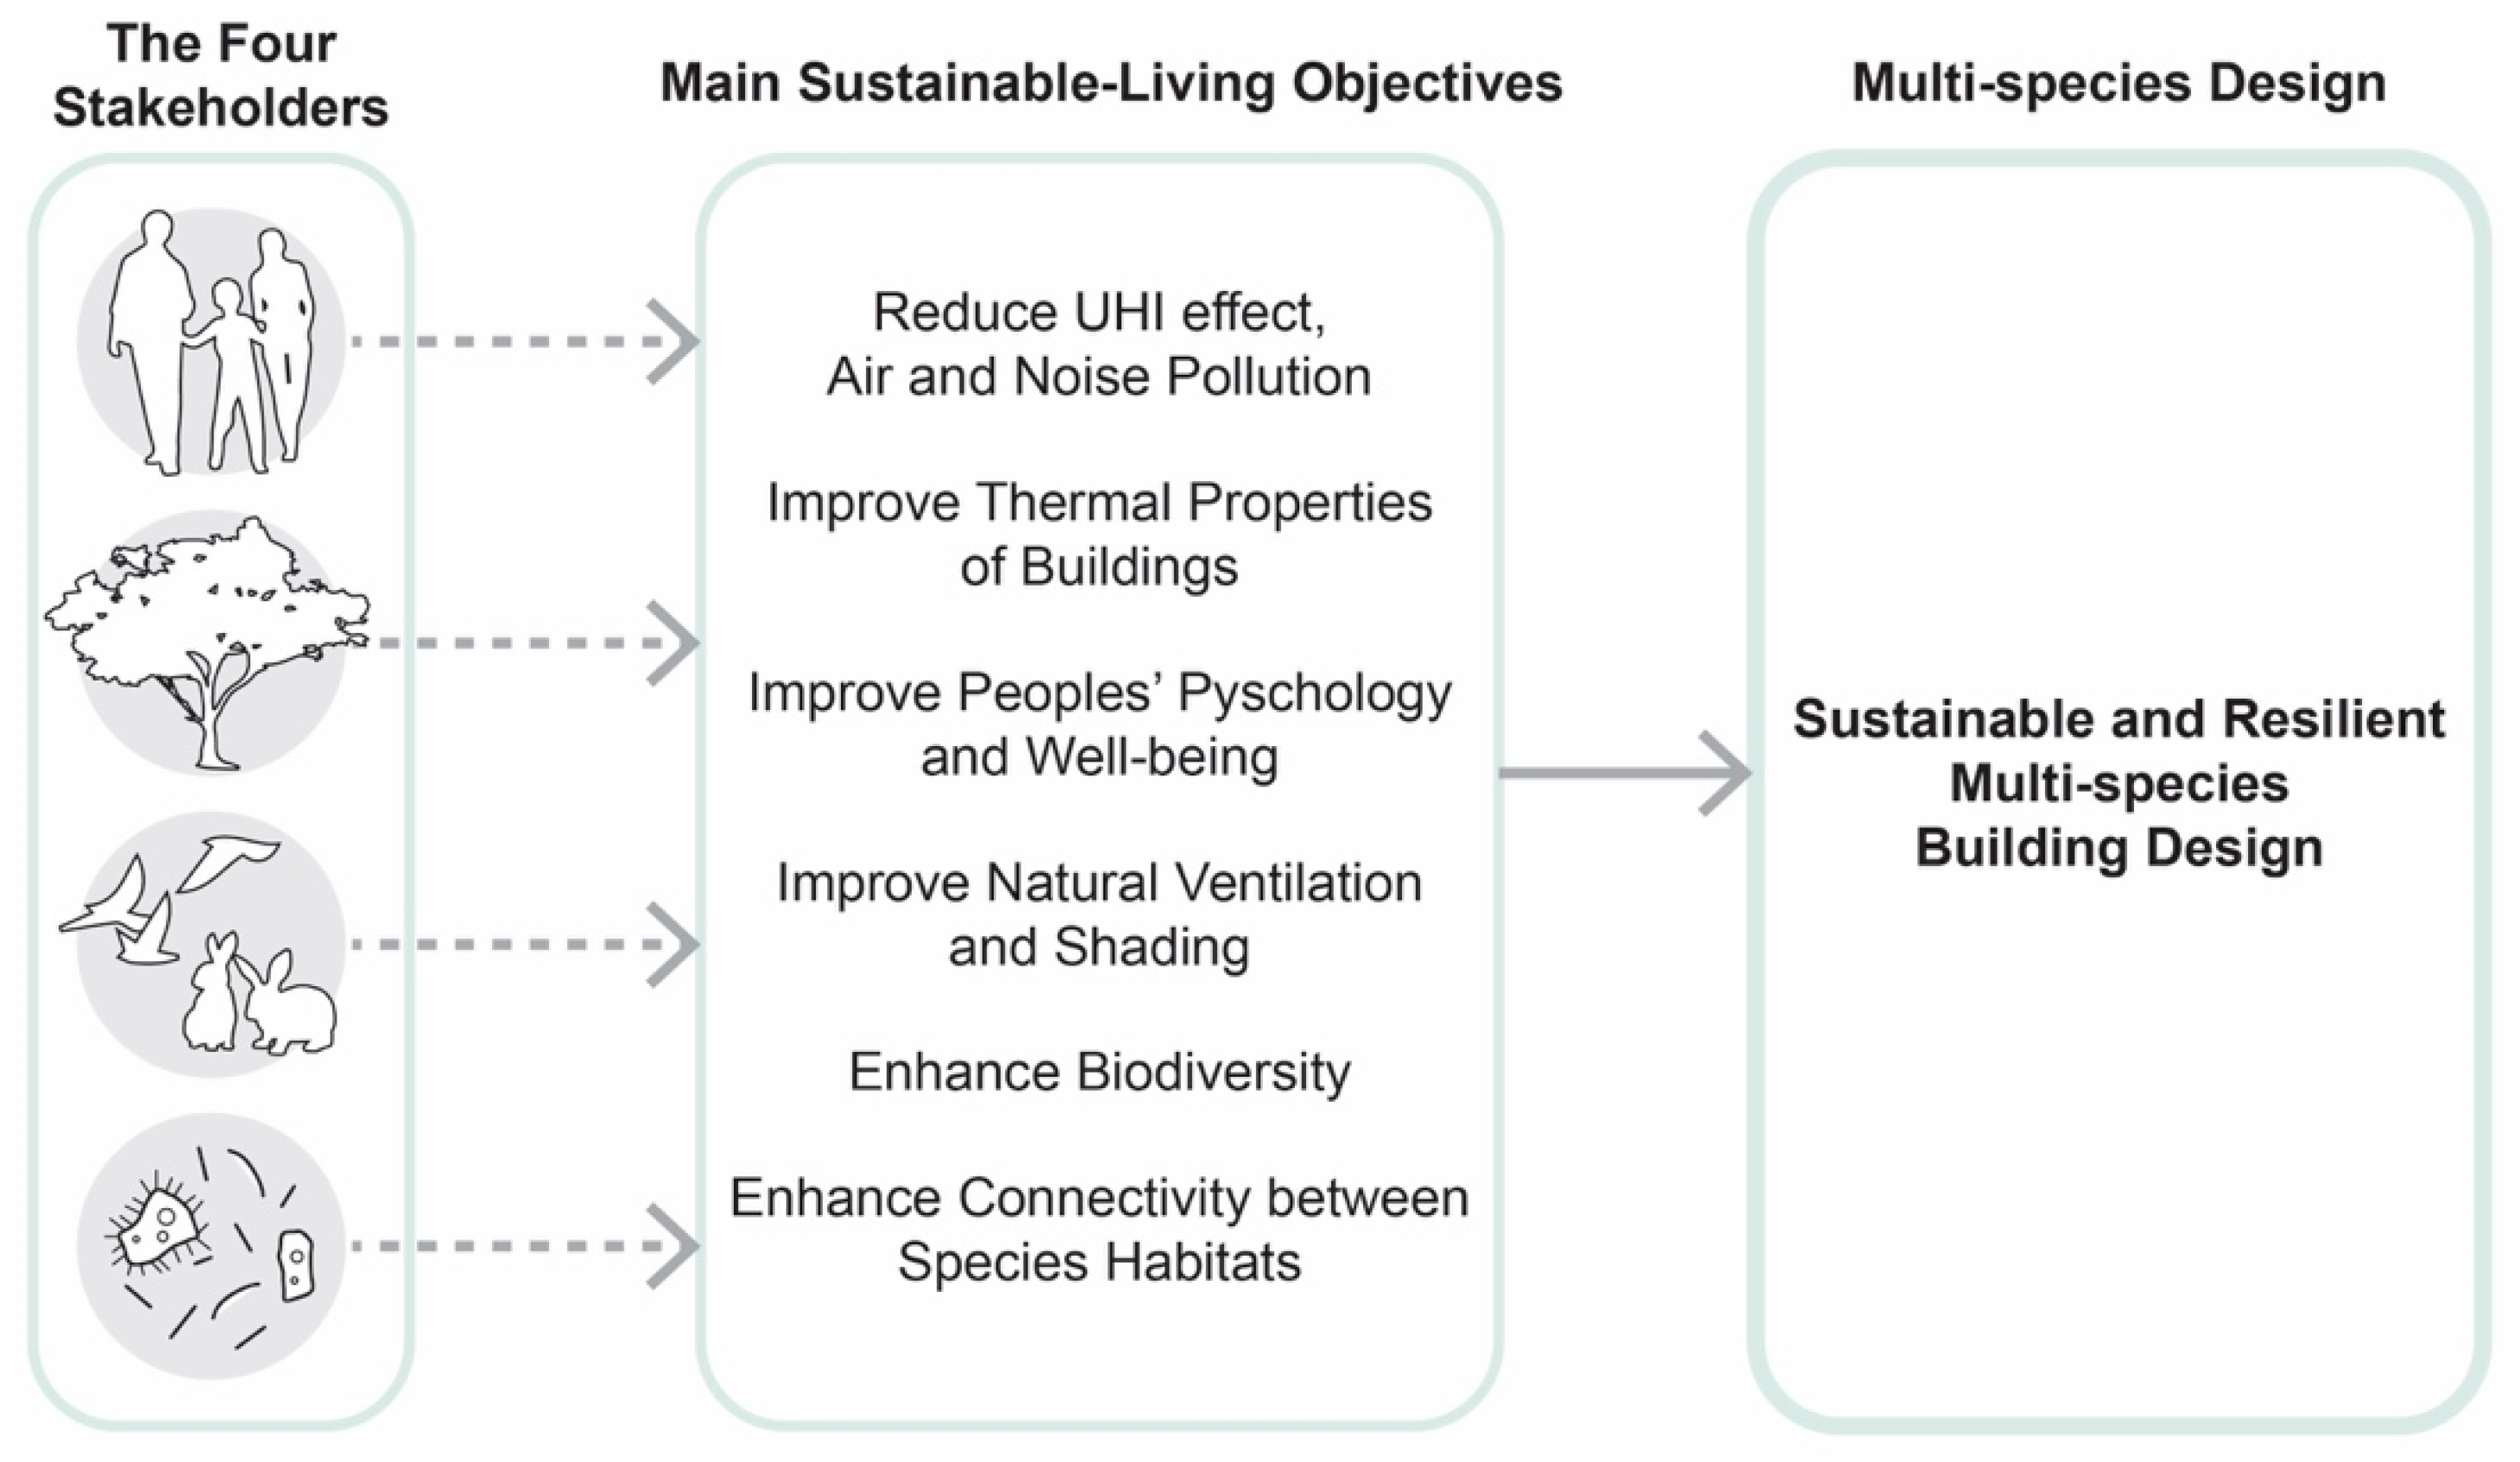
  • Stakeholders: humans, plants, animals, and microbiota.
  • KPIs: General indicators of performance that focus on critical aspects of outputs or outcomes [19].
  • Objectives: Direction of decision-making attributes to improve upon the decision-making problem [26].
  • Goals: Goals are quantitative representations of objectives expressed in a specific space and time [26].
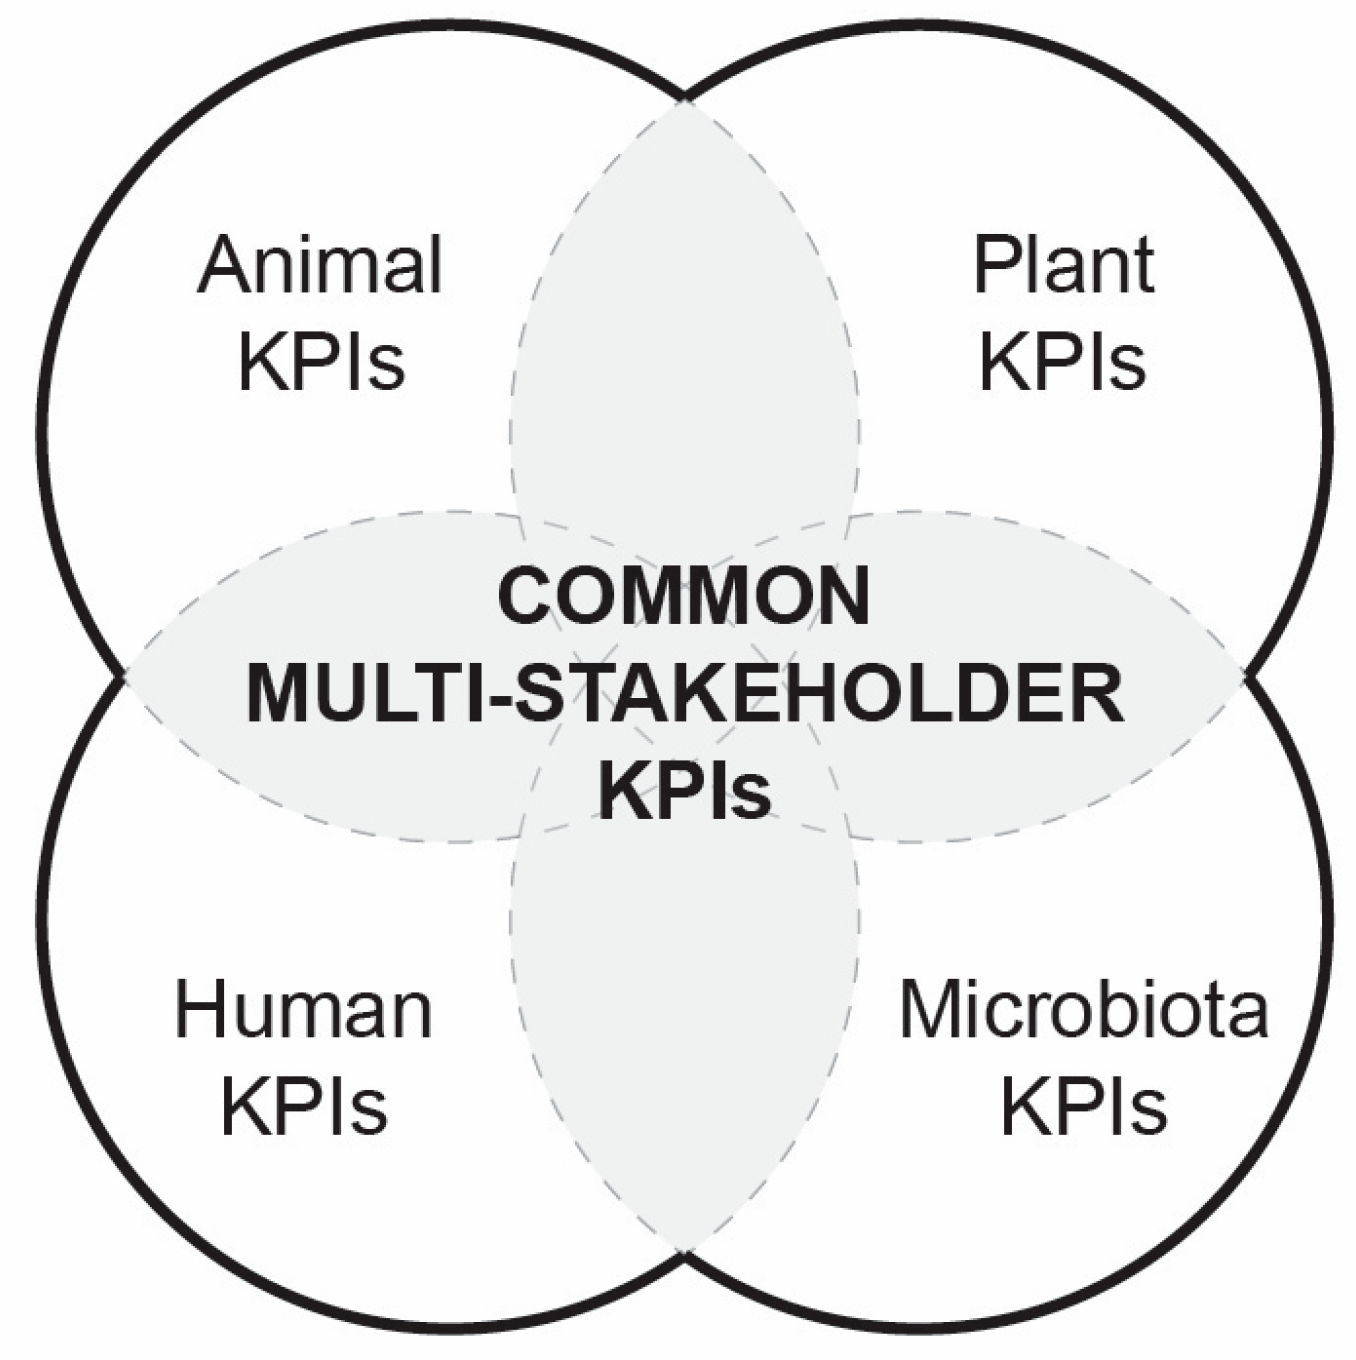
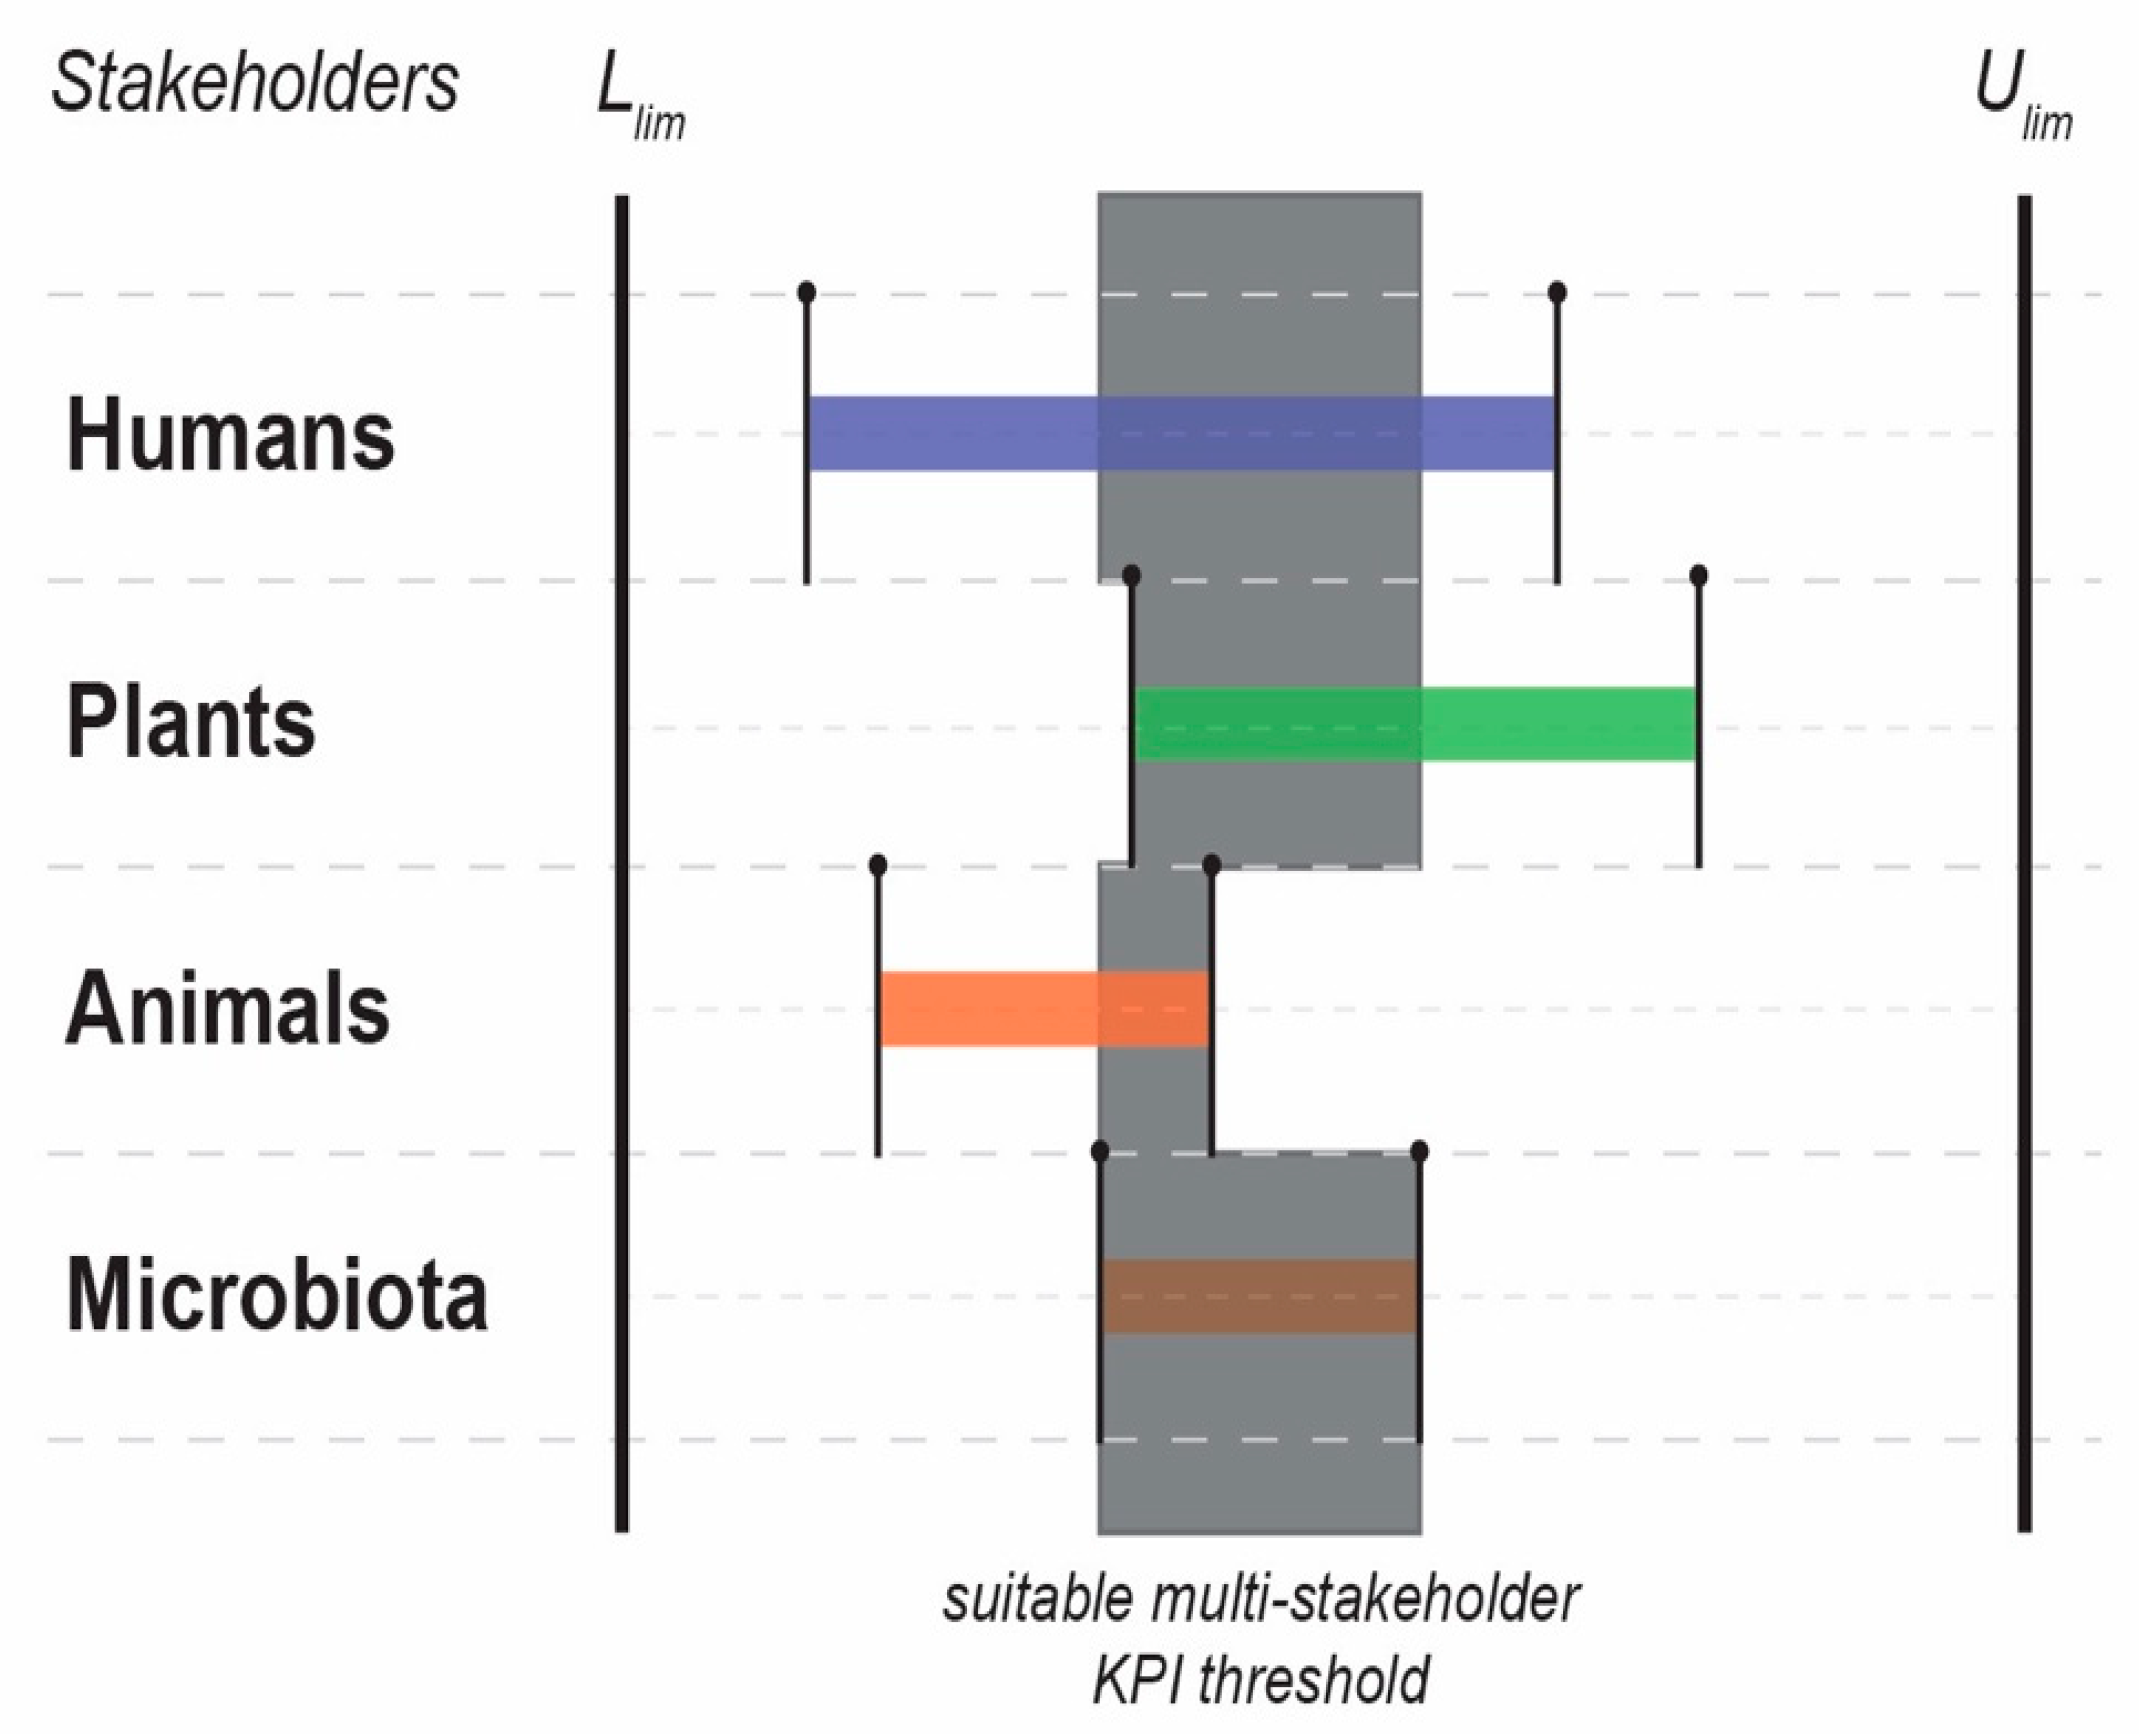
  • Common KPIs: Common KPIs are described by overlapping thresholds used to correlate between the stakeholders (a minimum of two) within the optimization process.
  • Nested hierarchy: A hierarchical strategy, like Matryoshka dolls, is to associate descriptive objectives with quantifiable key performance indicators.

2. Ecological Design Objectives

Urbanization affects land transformations and their ecosystem properties, such as biodiversity [27,28], biogeochemical cycles [29,30], local climatic conditions [31,32,33], and species abundance [34,35,36]. As anthropogenic environments expand, it becomes even more important for scientists to predict the biological responses to different and interacting pressures in order to design effective management strategies [37,38]. However, ecological and environmental processes, as well as the interactions between humans and natural systems, are multifaceted and require higher levels of interactions and feedback dynamics. Traditional approaches have primarily concentrated on integrating natural ecosystems into the urban environment by establishing protected areas, such as nature parks and reserves, and creating ecological corridors [39]. While these approaches have provided significant benefits, they are no longer sufficient to address the escalating rate of species extinction and the diminishing human-nature interactions [40].
The urban species pool is affected by several hierarchical filters. These include regional climate and biogeographical factors, socioeconomic and cultural factors, human land-use, and migratory species that spent a portion of their life-cycle in the area or were introduced by humans, intentionally or unintentionally [41]. Questions arise on how many and which species are able to live within the urban environment [42,43], as well as what conditions cities can provide for the regional species pool [44]. Urban landscaping portrays a high heterogeneity in scales, varying between green patches, parks, and meadows, scattered within the gray infrastructure. Studies on the spatiotemporal changes of landscape patterns in response to urbanization revealed that green patch size, shape, connectivity, and percentage of valuable habitats preserved were the most important attributes [45,46]. These small and disconnected green urban patches still provide spaces for biodiversity while forming interconnected ecological networks [47].
However, given the increasing urbanization on a global scale, better solutions need to be developed in order to preserve, enhance, and create more ecologically valuable options that facilitate connectivity between urban habitats [48,49,50]. Yet, contrary to human-centric objectives, non-human objectives are not so clearly and easily defined. Today, we have numerous examples of human-centric objectives to be achieved through nature-based solutions and green infrastructure, such as cooling, noise reduction, and pollution reduction through vegetation. Thus, non-human stakeholders, in particular plants and, to a lesser degree, animals and microbiota, are already involved in human-centric design. But current objective-KPI relationships derive from the perspective of enhancing human well-being.
The same is true for ‘sustainable design’, ‘sustainable building’, and ‘green building’ practices. These commonly used terms are assessed through rating systems towards better environmental outcomes, however, with an anthropocentric character [51,52]. Similarly, ‘ecosystem services’ portray mainly human-centric objectives with no clear benefits to other stakeholders [53,54]. On the other hand, initiatives such as ‘regenerative design’ and ‘healthy ecosystem’ present better correlations in human-nature relationships, though methodology and performance are still unclear [55,56]. The acknowledgement that cities may also serve as biodiversity hotspots emphasizes the necessity for pioneering research endeavors that investigate the possibilities of integrating nature-based design strategies at the building scale [57].
In this paper, we discuss a building envelope design from the point of view of the different stakeholders to mitigate the numerous environmental issues that cities create. Currently, informed knowledge of the ecological benefits of green infrastructure is lacking. Such knowledge includes aspects of ecological connectivity, food resources, plant and animal habitats, and more. Grobman et al. discussed current perceptions and trends of multi-species design at the building scale while pointing out the challenges and gaps for achieving this goal [21]. The review underlines that a successful outcome requires a systematic design approach for integrating ecological design objectives with architectural ones. Here, we explore the dynamics of architecture and ecology through the objective-KPI methodology.
We suggest clearly differentiating objectives for each of the four main stakeholders (humans, plants, animals, and microbiota) so that they are considered and applied in the same way as the human-centric objectives during design. The aim is to introduce ecological services alongside human welfare benefits through a multi-objective methodology [58]. This process dictates the implementation of KPIs that relate to the functions of all four stakeholders instead of just humans. The end-result is the optimization and evaluation of designs through KPI thresholds that range within acceptable values for all stakeholders. In relation to the non-human stakeholder KPIs, we identified several requirements that the objective KPI framework should meet:
  • Present sound ecological knowledge;
  • Acknowledge that biodiversity is multi-scalar with relationships between the scales (diversity of species and ecosystems, local and regional diversity);
  • Acknowledge that biodiversity is multidimensional, with relationships between the dimensions (taxonomic and functional diversity);
  • Acknowledge existing frameworks and metrics already in use in biodiversity conservation, restoration, and/or monitoring;
  • Integrate nicely into the next step, which is the computational aspect of this project.
In the following sections, we focus on the objective-KPI relationships that involve human and non-human stakeholders. Current research refers mainly to human-plant stakeholder relationships.

3. Methods: Defining Objective-KPI Relationships

When deciding upon the main objectives that guide the design process and the KPIs that define them, expert knowledge as well as a literature review are of critical importance [59,60]. Mosca and Perini’s review of architectural KPIs highlights the growing interest in using KPIs as performance indicators in the design process, with building sustainability having the highest rate of occurrence [61]. Selvan et al. conducted a systematic literature review on integrating ecological knowledge into architectural design [60]. In the review, common term occurrences were extracted for the multiple-criteria decision-making (MCDM) processes, some of which could possibly represent KPIs.
So, the KPIs that drive the design process originate from the adoption of certain methodologies. The challenge is to create a framework to identify, define, associate, and evaluate relevant KPIs for the effective monitoring of objectives. Kylili et al. (2016) discussed ‘sustainable building renovation’ KPIs through the employment of generic categories and sub-categories. These included economic KPIs, environmental KPIs, social KPIs, and more as the most frequently employed KPIs [62]. In this research paper, the following generic categories, referred to as themes, have been identified. They frame the sustainable well-being of human and non-human stakeholders. The themes support the multi-species objective-KPI relationships through the employment of a range of KPIs that may derive from them and act as performance measurement for the objectives set.
To explain our methodological approach, we commence with four generic themes well-known in human-centric architectural design, describing key human comfort conditions [40,63,64,65,66,67]. These are: abiotic conditions, urban noise, air quality, psychology, and well-being. Following that, we discuss the same themes in relation to the other stakeholders, i.e., plants, animals, and microbiota, and address potential correlations. The themes assist in drawing specific objective-KPI relationships. For example, ‘to increase/reduce solar radiation’ may be an objective, whose KPI ‘solar radiation’ is grouped in the theme of abiotic conditions, quantified by “W/m2”.
For multi-species design, non-human stakeholder objectives are feasible in a similar manner to nature conservation, such as species-based (focus on threatened species), biodiversity-based (maximize species richness), habitat-based (restore habitat that occurs in the surrounding area), and more. Contrary to the human-centric design objectives, the setting of ecological design objectives, e.g., the ‘increase of urban habitat species’ as part of architectural design strategies, is not a common practice. For example, ‘Enhance Species Diversity’, quantified by the KPI ‘Species Richness’ [68], is not applicable architecturally, meaning that currently there is no correlation between form and the number of species present. The proposed approach dictates a new methodology, presented further down in this paper through the ‘nested hierarchy’ [69].
The following non-human objective-KPI relationships originating from the generic themes serve as indicators. While some may be important in the functions of plant, animal, and soil communities, correlations may not be as direct. However, there are examples of direct associations, such as between tree abundance and soil volume, as well as between plant biomass and shading percentage. Further research on ecological design objectives will consider more direct ecological correlations, like the ones that exist between ‘enhancing ecosystem stability’ and ‘functional group (FG) biomass’. FG allows for the clustering of species with similar characteristics. Examples of multi-stakeholder objective-KPI relationships in relation to the proposed themes are presented in Table 1.

3.1. Human-Centric Objectives and KPIs

3.1.1. KPIs Related to Abiotic Conditions

Abiotic factors, or climatic variations, have a profound effect on human health and well-being. The relationships formed between people’s thermal comfort perception and outdoor atmospheric conditions are a topic of increasing interest [70,71,72]. Studies have explored the relationships between thermal comfort and environmental conditions, such as air temperature, intensity of solar radiation, wind speed and direction, relative humidity, mean radiant temperature, and more [64,65]. Other studies point out the importance of land surface temperatures and their spatial variations within a city environment [73,74,75]. So, if the human-centric objective relates to some form of thermal comfort, the above parameters could be considered relevant KPIs.
For example, increased winds on a building site could be filtered using vegetation on and around the building, while the relevant KPI could be “m/s”. Another example is heat stress under daytime summer conditions, which is in direct relationship to the presence of shaded vs. unshaded (exposed solar radiation) environments using vegetation, trees, etc. In that case scenario, the human-centric objective relating to human thermal comfort could be ‘to increase green vegetation’, with the relevant KPI being ‘solar radiation’, measured in “W/m2”. So, non-human stakeholders, in this case plants, modulate the environment for humans, and thus, the KPIs concerning abiotic conditions can also include measures involving plants.
Other, similar examples could relate to humidity, stormwater, etc. The soil-plant interactions, including the physical, chemical, and biological properties of soil, play an important role in rainwater retention as well as the immobilization of pollutants, amongst other important topics in urban sustainability [76,77,78]. And while the water interception of plants has positive effects on human thermal comfort [79], rainwater retention through the soil-plant systems offers positive solutions against flooding in the built environment [80]. On-site rainwater treatment techniques have been greatly emphasized through ‘urban water management concepts’ [81], ‘water sensitive urban design’ [82], ‘low impact development on stormwater management’ [83,84], and other similar technologies that treat rainwater at its source. The above goals could be seen as potential objectives, while the relevant KPI here could be “soil volume”, measured in “m3 or L”.

3.1.2. KPIs Related to Noise Levels

An increasingly important urban environmental challenge nowadays is road traffic noise pollution [85,86]. Three-dimensional noise maps are gradually becoming more common in densely populated urban areas and major urban cities for the characterization of noise levels in accordance with international standards on noise control [87,88,89,90,91]. According to the World Health Organization (WHO), 0 dB is considered the hearing threshold at which it is possible to hear a signal, 50 dB is the level of acoustic comfort, 65 dB is a desirable limit, 85 dB may result in damage to the ear, and 120 dB relates to a pain threshold [92,93,94]. Urban environments today mainly range between 45 dB (quiet neighborhood streets) and more than 80 dB (busy roads and highways). Effective management of urban noise-induced areas includes noise assessment reports, while further research is needed on both the ecological and human-related consequences of chronic noise exposure.
Plants can also mitigate urban noise, and hence a noise-related KPI may refer to the addition of plants. For example, mitigation strategies involve the use of vegetation on building envelopes and low-profile barriers [95], while research outcomes reveal that the noise absorption qualities of plants depend on the leaf shape, size, thickness, and height of the plant [96,97]. The noise absorption qualities of specific plant and vegetation formations have also been a topic of interest in research studies [98,99,100]. Lacasta et al.’s (2016) comparison study between a traditional wall and a green wall revealed an absorption coefficient of 0.7 and a reduction of 4 dB due to the vegetated volumes [101]. Moreover, research revealed that soil volume performs well at low sound frequencies, whereas vegetation performs better at middle and high frequencies. In addition, dry soil has higher absorption rates than in the case of increased soil saturation [98]. So, if the design brief dictates a need for reducing ‘noise levels’, then the relevant KPIs could be referring to the volume of plants and soil.

3.1.3. KPIs Related to Air Quality

The elevated pollutant concentrations of urban environments worldwide [102,103], in line with the impacts of climate change and weather variability [104], dictate the implementation of effective management strategies. Plants can also be used to improve the quality of the air. Current studies focus on the absorption qualities of harmful substances in indoor plants [105,106], while research on the air pollution mitigation qualities of outdoor plants is evolving [107]. The Gourdji (2018) study discusses the pollution reductions of different green roofs, with a focus on the capabilities of plants in reducing the levels of particular matter (PM), ozone (O3), and nitrogen dioxide (NO2) [108]. Chen et al.’s (2016) study on the effectiveness of different plant species in removing PM from Beijing’s air revealed that it was relevant to species selection [109]. Still, similar studies recognize green infrastructure (GI) as one of several promising passive control systems for air pollution [110], while a pollution-free urban environment enhances the health and well-being of all life present in such an environment. Similarly, to the noise levels section above, if the design brief dictates a need for enhancing air quality, then also the KPI becomes ‘air quality’ and is quantified by measuring, for example, the percentage of harmful particles in the air.

3.1.4. KPIs Related to Psychological and Indirect Health Issues

Experiences with natural environments can have beneficial effects on human well-being, such as forest bathing [111,112,113]. Such experiences embody different kinds and scales of nature, from wilderness [114] to neighborhood parks [115], gardens [116], and green design around residences [117]. Hartig and Kahn’s (2016) study supports the idea that acknowledging the psychological benefits of nature will assist in better integrating nature into architecture, infrastructure, public spaces, and urban areas [66]. Research supports the psychological benefits of just viewing natural features [118], while animal contributions can also provide positive benefits, e.g., through bird song. Kardan et al.’s (2001) demographic study in Toronto underlines the importance of green infrastructure on public health and, more precisely, the correlations between ‘tree density’ and incidence numbers of heart and metabolic disease [119]. An increasing number of research examples also relate nature exposure to a decrease in other health risks, such as the risk of developing allergies, with microbes being implicated as the mediating agent [120]. However, psychology and well-being, as themes relating to human-centric objectives and their association to quantifiable KPIs, are considered more abstract than the ones mentioned above.

3.2. Animal, Plant, and Microbiota Objectives and KPIs

3.2.1. KPIs Related to Abiotic and Biotic Conditions

In regards to species, environmental conditions determine and control their key life-cycle transitions [121]. Overall, for each environmental factor, an organism has a tolerance range within which it is able to survive. This tolerance range could be the proposed KPI threshold in this case. The environmental factors affecting species are divided into biotic (living) and abiotic (nonliving) factors [122,123]. Regarding abiotic environmental data and the 3D urban environment, lines are drawn between species distribution and species richness, i.e., how plants are affected by the shading of buildings [124], how the water flow affects soil development [125], how the built environment upsets plant dispersal [126], and more. Biotic conditions, on the other hand, influence animal movement and, thereby, their home range formation possibilities [127]. Biotic factors include impacts by members of the same and other species on the development and survival of the individual, i.e., species present in the regional pool [128,129].
The main abiotic factors are light, temperature, water, and atmospheric gases that influence the form and function of the individual during evolution, while during its lifetime they affect species distribution and species richness [130,131]. Species richness and distribution are also relevant to the region-specific historical variations in climate and habitat [132,133,134,135,136]. Signifying what differences exist in the species richness of similar assemblages in different regions is a norm [137,138,139]. Vegetation variation also depends on other environmental variables, such as altitude and slope, annual precipitation, water availability, and physical and chemical soil properties [140,141]. In regards to vegetation, important variables are temperature, rainfall, topography, and soil type formation [142,143,144], while soil-vegetation relationships determine species abundance. On the other hand, depending on the local climatic conditions, the relationships formed between plant spatial patterns and ‘water infiltration capacity’ determine plant community compositions, i.e., the percentage of species in semi-arid sites, as a result of the hydro-physical properties of soil [145].
The above-described abiotic factors influence each species differently. Meaning that the objective-KPI relationships of the non-human stakeholders become more challenging. One way to approach this issue is by describing specific species, or even better, in terms of simplicity and reduced computational power, FG. Ecologically, this means that the objective could be in relation to enhancing a specific plant species, or FG, and the KPI helps to accommodate such a goal. In that case, a more direct approach to the ecological objective-KPI relationships could be, for example, to ‘enhance ecosystem stability’ with the relevant KPI being the ‘biomass of animal group X’.

3.2.2. Noise Levels Related KPIs

Studies also focus on the effect of anthropogenic noise on wildlife [146,147]. Evidence suggests that noise levels impact acoustically oriented animals while also influencing the distributions of organisms with no clear links to the acoustic realm [148,149]. Noise levels may alter species behavioral patterns, such as acoustic communication, foraging, and movement [150,151], while there is also documented evidence of changes to species physiology, fitness, population dynamics, and ecosystem functioning [152,153]. Further research suggests that species may also be affected by noise distributions in relatively quiet areas adjacent to the noise-exposed ones [154]. In that respect, noise levels could be a proposed KPI measured in decibels, similarly to the noise levels KPI discussed previously for humans.
However, as noise is only relevant to some animals, e.g., mammals, the noise KPI becomes less important among ecological KPIs. Nevertheless, in terms of the ecological objective-KPI relationships, connectivity is quite important, and connectivity is impacted by roads. As roads are also a source of noise, there is a clear connection between connectivity, as a potential KPI, that influences both connectivity and noise levels. In that respect, the quality of the roads designed in terms of the accessibility of cars, humans, and animals plays an important consideration. Through these kinds of relationships, it is possible to state that KPIs could relate to architectural features and environmental parameters, underlying the possible synergies and trade-offs between the different stakeholders.

3.2.3. Air Quality-Related KPIs

Drawing parallels to humans, animals are also affected by poor air quality, especially traffic-related air pollution (TRAP). Respiratory complications and lung inflammations are common diseases among urban animals, including feral dogs, pigeons, and squirrels [155,156,157]. Research revealed that air pollution is mostly detrimental to smaller-scale animals, particularly birds [158,159,160]. Additionally, ozone has been shown to decrease photosynthesis rates in plants [161]. On the other hand, plants absorb air pollutants mainly through their leaves, and while this is an established human-centric strategy for improving air quality [162], air pollution negatively impacts plant growth and structure [163]. Another consequence of air pollution is acid rain, caused by the burning of fossil fuels. The effects of this increase the acidity of lakes and ponds, greatly affecting fish and other living organisms [164]. Acid rain also makes the soil more acidic, resulting in the removal of soil minerals and nutrients while increasing the availability of toxic heavy metals, affecting plants and animals alike [165,166]. And while the above examples are only beginning to frame the environmental consequences of poor air quality, the ecological design objectives are numerous, with the relating KPI, similar to the human one, being ‘air quality’, quantified by the percentage of harmful particles in the air.

3.2.4. KPIs Related to Well-Being and Indirect Health Issues

Given the increase in urban sprawl, questions arise on how to best promote human and wildlife existence in the urban environment. “One Health” framework is a newly formed operational definition jointly created by the Food and Agriculture Organization of the United Nations (FAO), the World Organization for Animal Health (OIE), the United Nations Environment Program (UNEP), and the World Health Organization (WHO) [167]. The One Health approach aims towards the sustainable balance and optimization of people, animals, and ecosystems by recognizing that all three are closely linked and interdependent [168]. In that respect, enhancing the urban environment through green infrastructure, including trees, flowers, wetlands, ponds, and their connections, can increase species habitats and ecological functions [169,170]. Examples of objective-KPI relationships here are ‘connectivity between green patches’, as well as ‘percentage of green volume’.

4. Results: Common Objectives and Common KPIs

The above themes on human and non-human stakeholders underline ecological dynamics and human comfort conditions. Human health and well-being are contingent on certain thresholds and conditions in the outdoor environment. Regarding non-human stakeholders, whether an urban location may provide an individual with a place to live is dependent on a number of conditions that relate to the appropriateness of the environment for the individual to complete its life cycle [171,172,173,174]. Such conditions are relevant to adequate access to food, mates, chances of survival, and environmental conditions. The benefits of such connections are multi-dimensional and create a common ground between human-centric design and the integration of other stakeholders within building design strategies. The list of themes could expand to incorporate further relationships between the stakeholders. Regarding the non-human objective-KPI approach, relationships could refer to urban ecosystem stability, ecosystem services, and others.
On the building envelope scale, which is the focus of this paper, design objectives relate to the interactions between the stakeholders (animals, plants, humans, and microbiota). So, objectives inform the boundaries of the design brief, guided by the KPIs. In short, KPIs form the multi-species design components of the envelope by providing a structure that quantifies design objectives. Canepa et al. (2022) and Weisser et al. (2022) first introduced non-human stakeholders into the design brief as part of the ECOLOPES project [22,175]. Figure 1 presents specific examples of human-centric design objectives that have paved their way into planning strategies and building design, alongside potential design objectives relating to non-human stakeholders. The illustration underlines the fact that for the realization of a multi-species building design, it becomes important to consider design objectives for all four stakeholders, as depicted on the left-hand side of the figure.
Figure 2 illustrates anthropocentric and ecological design objectives, as these are defined by purely anthropocentric or ecological design goals, as well as having a common middle ground of objectives and KPIs. This common ground of KPIs between the stakeholders defines the synergies and trade-offs between them. For example, human-centric KPIs can partially depend on ecological design KPIs through the incorporation of ecosystem services, i.e., noise being dampened by plant cover, while ecological and human-based KPIs may derive from a similar basis, a common ground, i.e., the ‘light’ conditions needed for biomass also relate to ‘solar radiation’ strategies applied to building design. So, KPIs evaluate human-nature interactions by measuring the consequences of a particular design for human well-being (objective) and for the abundance of non-human inhabitants (objective). Such complex relationships describe how abiotic conditions (such as precipitation, temperature, solar radiation, etc.) interact with the architectural design to ensure human comfort conditions while also providing an adequate environment for plants, animals, and microbiota.
Common stakeholders’ KPIs are evaluated in accordance with the KPI thresholds defined for each stakeholder. Figure 3 illustrates such relationships where common KPIs, like, for example, light conditions and solar radiation, are depicted as having different thresholds for each stakeholder while also showing the possible correlations between them. Common KPI thresholds draw lines of communication between the different stakeholders while developing the multi-criteria analysis and rating strategies for the design solutions.
Table 1 provides a list of possible objective-KPI relationships, divided in accordance with the generic themes. Objectives can be assigned to a specific theme or multiple themes based on their targets, while KPIs provide the numerical thresholds of the different variables. In brackets, adjacent to the proposed objectives, are the stakeholders that the objectives may refer to. Assigning an objective to a KPI theme means that the objective is evaluated in relation to the KPI thresholds. For example, the human objective to “enhance thermal comfort”, found under the Abiotic Conditions theme, is associated with the “solar radiation” KPI and quantified by “W/m2”. Similarly, the objective to “enhance light conditions”, again under the Abiotic Conditions theme, is associated with the “Lighting and Glare” KPI and is quantified by the “shading %”. By forming quantifiable objective-KPI relationships for all four stakeholders, it becomes possible to evaluate a multi-species envelope, i.e., an ecolope [22], computationally.

5. Evaluation: Overall KPIs Framework for Computation

The above methodology entails linking quantifiable KPIs to architectural and ecological objectives. However, a challenge is whether a quantifiable KPI can be computed or not, due to a lack of ecological simulation tools adaptable for both design and ecology [22]. In this process, it is important to consider what currently exists in terms of architectural and ecological computational engines and what gaps need to be bridged for the evaluation of the project. The ECOLOPES methodology, which this research paper refers to, suggests the integration of an ecological modeling layer (plants, animals, and microbiota) into the 3-dimensional architectural environment (humans). In that respect, the successful integration of KPIs within the simulation environment ensures that the stakeholder’s thresholds are met. However, while most KPIs, e.g., listed in Table 1, can be easily simulated within 3D modeling environments, the same does not apply for ecological simulations.
The introduction of ecological knowledge into architectural design poses a number of challenges due to the differences in technical requirements and decision-making support systems between the two disciplines [68], including potential conflicting design criteria [175]. A challenge is how to combine the modeling of ecological processes with the 3D architectural modeling environment under the requirements of a specific site. In addition, the technical aspects, further issues include aspects of interdisciplinary collaboration as well as the complex and temporal nature of natural systems vs. the modeling legacy of the 3D architectural environment. Such a computational platform is currently lacking. The task requires the integration, translation, and transformation of architectural and ecological correlations into actionable knowledge for multi-species computational design.
ECOLOPES approaches this through a simulation platform that combines plant functional groups (PFG) and animal functional groups (AFG) as biological units, as well as a soil development and classification model. In terms of ecological modeling, while there are examples of simulation engines integrating ecological processes with land managers’ behaviors [176,177], urban biodiversity is not explored to that extent, with the various ecological filters relating mainly to natural environments [178,179,180]. Regarding the urban environment, the ecological processes differ, and that is mainly because of the presence of humans [22,40]. Home range formation models (HRFM) are able to model the suitability of a cell in relation to an individual, as well as community responses and species interactions [22]. Regarding linking ecological KPIs with the 3D architectural design, in existing ecological plant modeling, we have identified the following three: light conditions, soil volume, and soil properties, used in FATE-HD [177].
ECOLOPES also puts forward an extra level of detailing that deals with the microscale of architectural building design. One answer to this scale reduction in line with the general complexity of ecological systems is suggested through the use of FG [181]. Ecologically, maximizing the number of species on a 2D planar site (resolutions of 1 m2 to 1 km2 max) is a reasonable objective for the plant stakeholder, and it is quantifiable, at least theoretically. But, to compute the number of FG a particular building can support on its 3D envelope (resolution of cm or greater), the ecological model should link architectural design to the living conditions of species. Since such a model does not exist, a KPI referring to the number of FGs cannot be calculated. ECOLOPES is currently developing such a model, making it possible to calculate KPIs relating to the number and spatial distribution of individual FGs on the envelope. This will allow analyzing the relationships between ecological KPIs and abiotic environmental factors, like the ones mentioned previously, e.g., soil volume and light conditions or shading percentage.
In architecture, several 3D architectural simulation environments today enable the modeling of relatively complex urban geometries while calculating the energy fluxes between the building and environmental parameters, such as temperature, solar radiation, wind speed, and more. A smaller number also allows for the simulation of other variables, like soil volume and water retention, that relate to KPI thresholds important in this research. One such tool is ENVI-met, which enables the simulation of soil, vegetation, atmosphere, and buildings alongside the inclusion of surface vegetation, i.e., grass, bushes, etc. [182]. The program’s database can also be altered to fit specific requirements in terms of specific plant species. However, it is currently missing information on the local species pool that the multi-species envelope commands. Nevertheless, adding individual species would not be applicable, as that would greatly increase the simulation load, an issue that can be resolved with the use of FG. However, ecologically, ENVI-met is not the right tool to model plant communities realistically, as it ignores competition.
Rhinoceros 3D modeling software, developed by McNeel, is an open development platform that enables third-party plugin development. Grasshopper, a visual programming tool tightly integrated into the Rhino UI, contains numerous plugins for parametric design. Some of these plugins support the computation for the proposed architectural and ecological objective-KPI methodology. For example, solar radiation can be calculated for any place on the envelope of a building using the Ladybug plugin [183], and it can be used as a KPI for plant growth, as plant growth increases with increasing light availability. In addition, the parametric modeling tool, Grasshopper, provides the platform to support ecologically informed plugins for design generation within a computer-aided design environment. This will aid in forming the desired correlations between architecture and ecology that are necessary to evaluate the multi-stakeholder project.
Future steps also need to be made for the integration of further KPIs in the ecological simulation process, such as temperature levels, water retention, and more. A proposed solution would be to start with what already exists to test the accuracy of the methodology, i.e., the implementation of the conceptual framework within a computational environment, while also proceeding to integrate further ecological KPIs. The end-result of the computational framework will be a multi-disciplinary tool that provides expertise to designers, architects, planners, and ecologists for making more efficient design decisions on sustainable building and urban planning strategies.

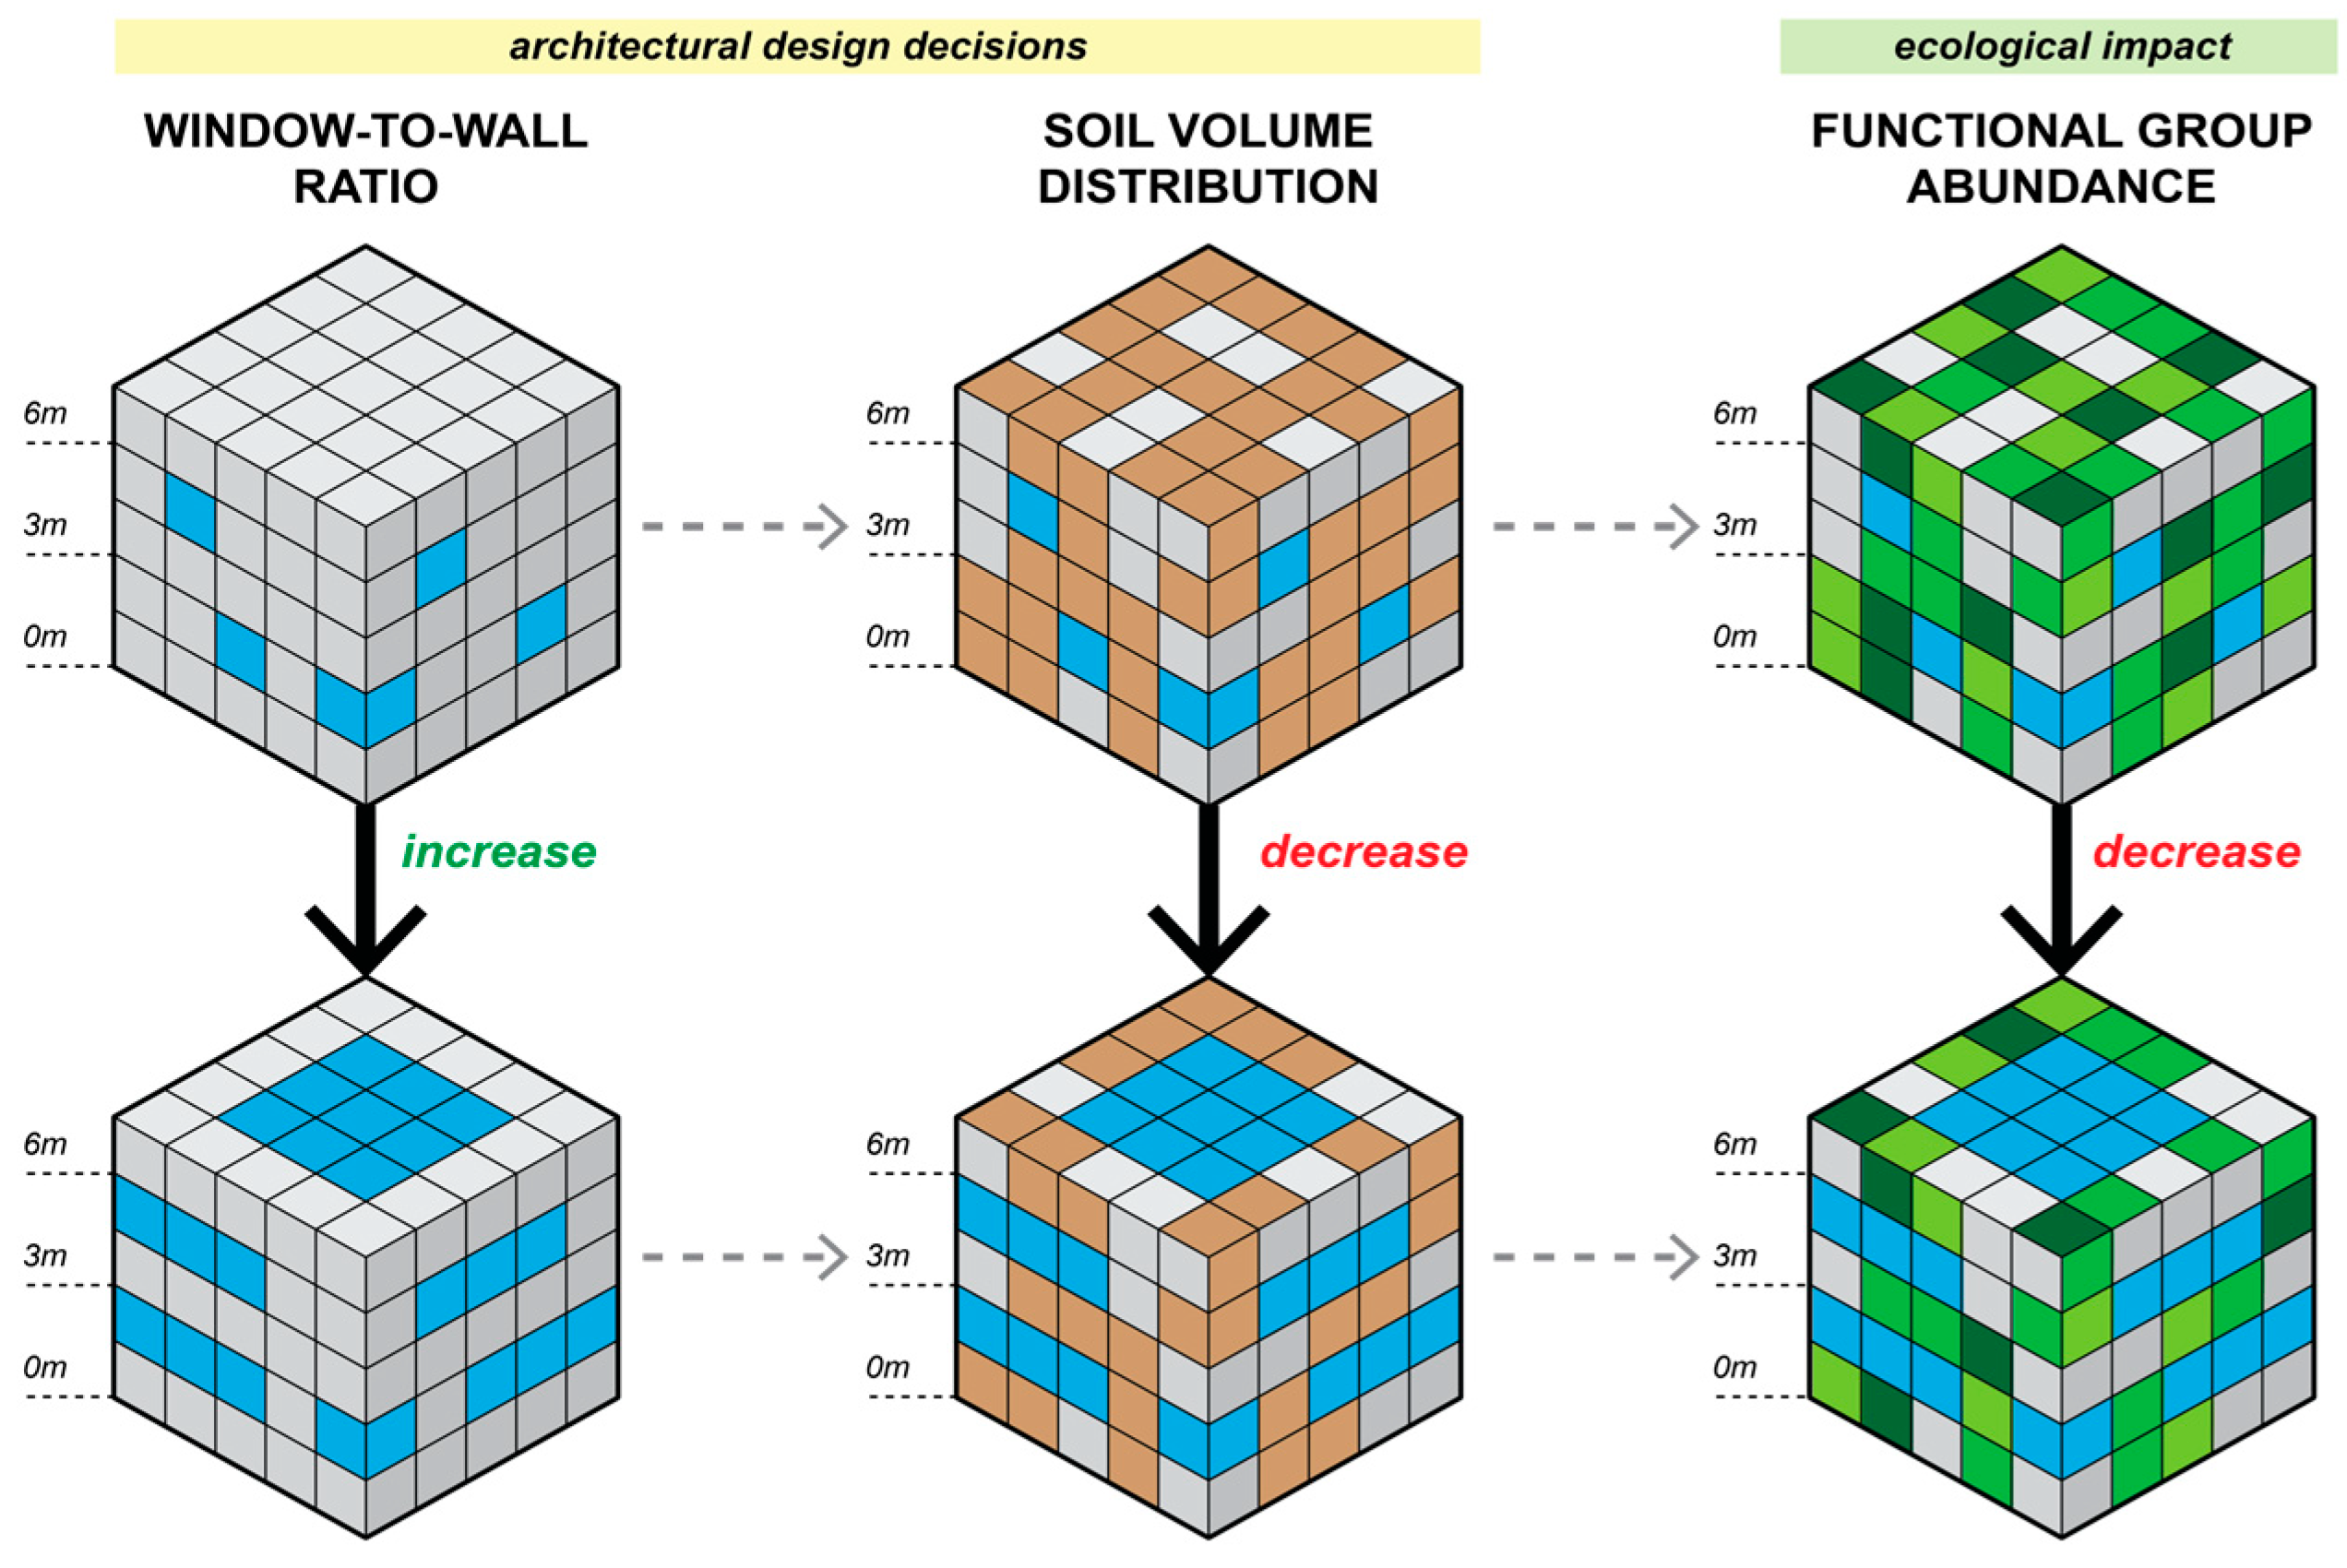
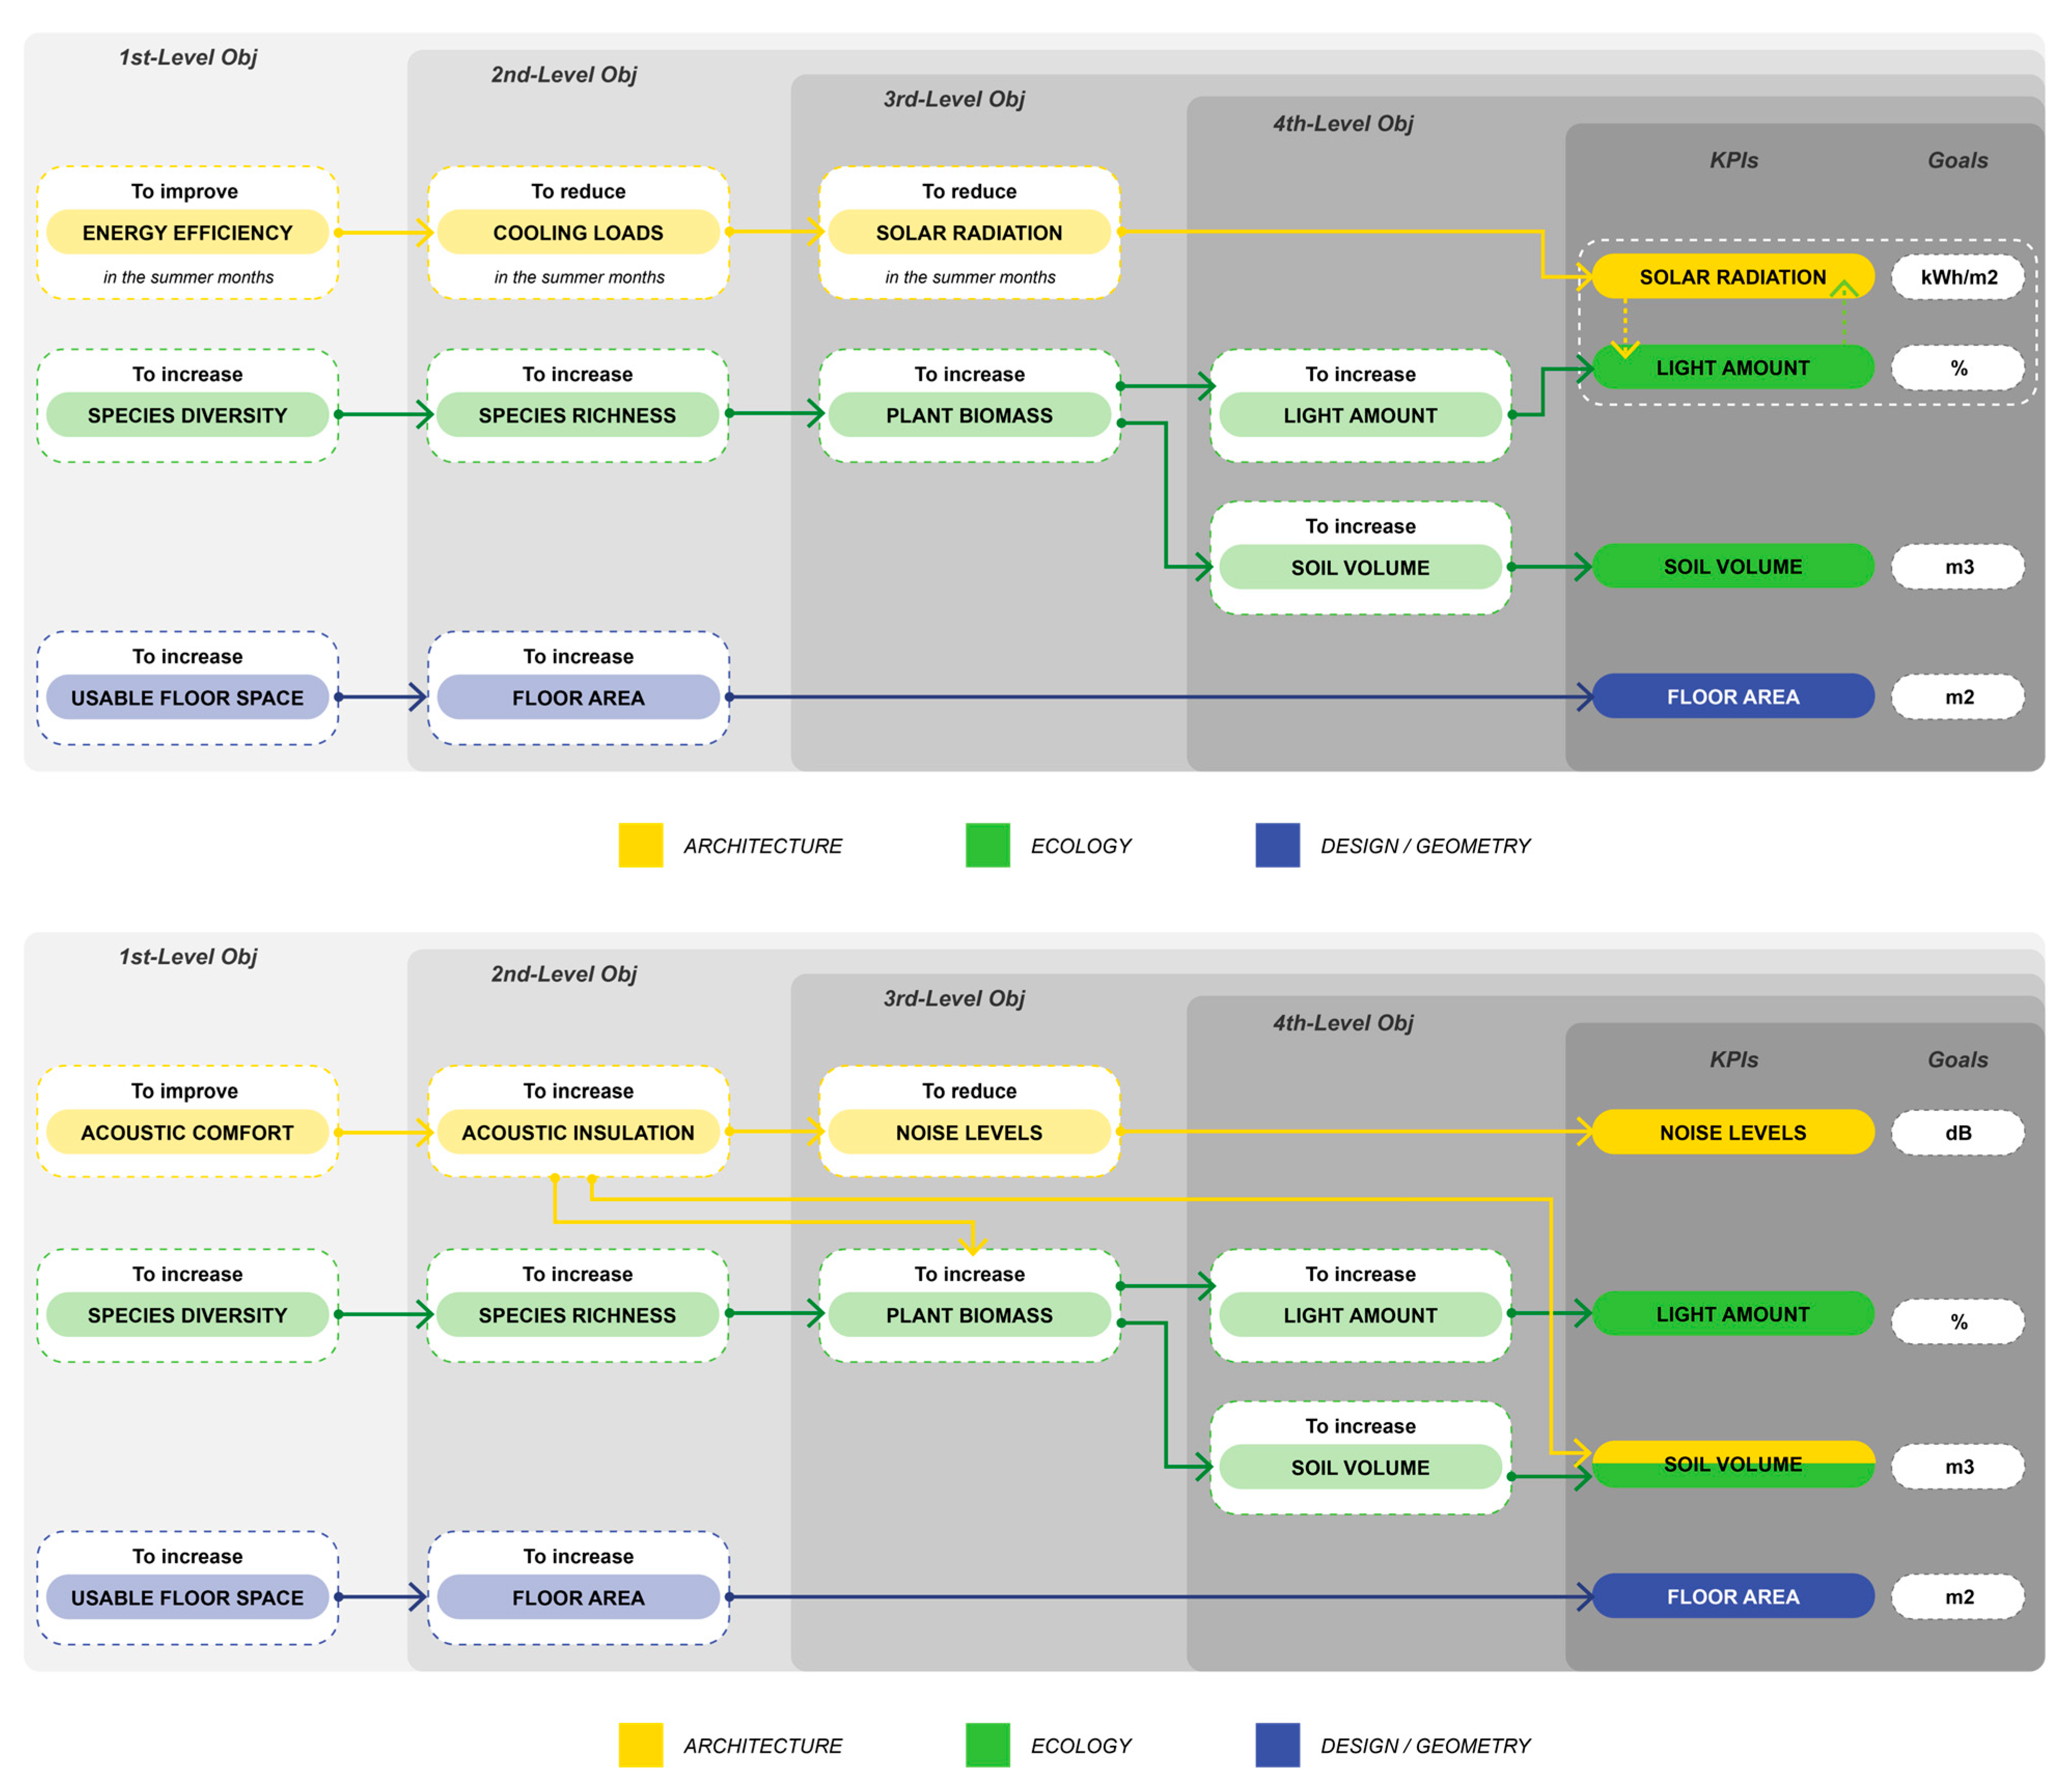
5.1. An Example of Human-Centric and Ecological Design Correlations

A challenge in the multi-species objective-KPI methodology is that ecological design objectives account only partially for the complexity inherent in ecology, which results in simplifications of their evaluation. To bridge the gap between ecological design objectives and measurable indicators, objectives are linked to quantifiable KPIs through the establishment of a ‘nested hierarchy’. ‘Nested hierarchies’ are integrated into the design decision-making process by defining objectives, described by KPIs, and represented using goals, i.e., target levels expressed in a specific space and time. This means that objectives frame the KPI directions, i.e., to maximize or minimize a certain threshold, while goals represent numerical KPI values. ‘Nested hierarchy’ also establishes connections between higher-level objectives (Enhance Species Diversity) and lower-level objectives (Species Richness) towards the creation of synergies and trade-offs between architecture and ecology on the road towards an optimum outcome.
The ‘nested hierarchy’ methodology was first presented by Selvan et al. to evaluate multi-species design performances [69]. In this paper, we depict examples relating both to a trade-off and a synergy between human-centric and ecological objectives (Figure 4). The top diagram is a trade-off example where the human objective to improve ‘energy efficiency’ (first level objective) translates into reducing ‘cooling loads’ during the summer (second level objective) and reducing ‘solar radiation’ (third level objective), quantified by “kWh/m2” (KPI). The ecological objective to increase ‘species diversity’ (first level objective), which relates to an increase of ‘species richness’ (second level objective), and the increase of ‘plant biomass’ (third level objective), is quantified by an increase in the ‘light amount’ (%) and ‘soil volume’ (m3) KPIs. However, the decrease in solar radiation from the first and the increase in light from the second are counteractive, resulting in a trade-off. In the lower diagram, the human objective to improve ‘acoustic comfort’ (first level objective) relates to an increase in ‘acoustic insulation’ (second level objective) and the reduction of ‘noise levels’ (third level objective), quantified by the KPI noise levels in “dB”. Here, the ecological objective to increase ‘species richness’ relates to the increase of ‘soil volume’ KPI, which also helps to reduce ‘noise levels’, resulting in a synergy between the stakeholders.
The end geometric parameters could account for potentially conflicting optimization directions until they are optimized without compromising each other, i.e., KPI thresholds between stakeholders [184]. The analysis that takes place along the way enables the evaluation of the correlations between architectural and ecological knowledge. Inherent challenges facing multi-species envelopes include how to evaluate data from the different disciplines to be integrated in a meaningful way and how the proposed data-driven design process and simulation results can encapsulate the various sub-systems and their interactions in the best possible way.

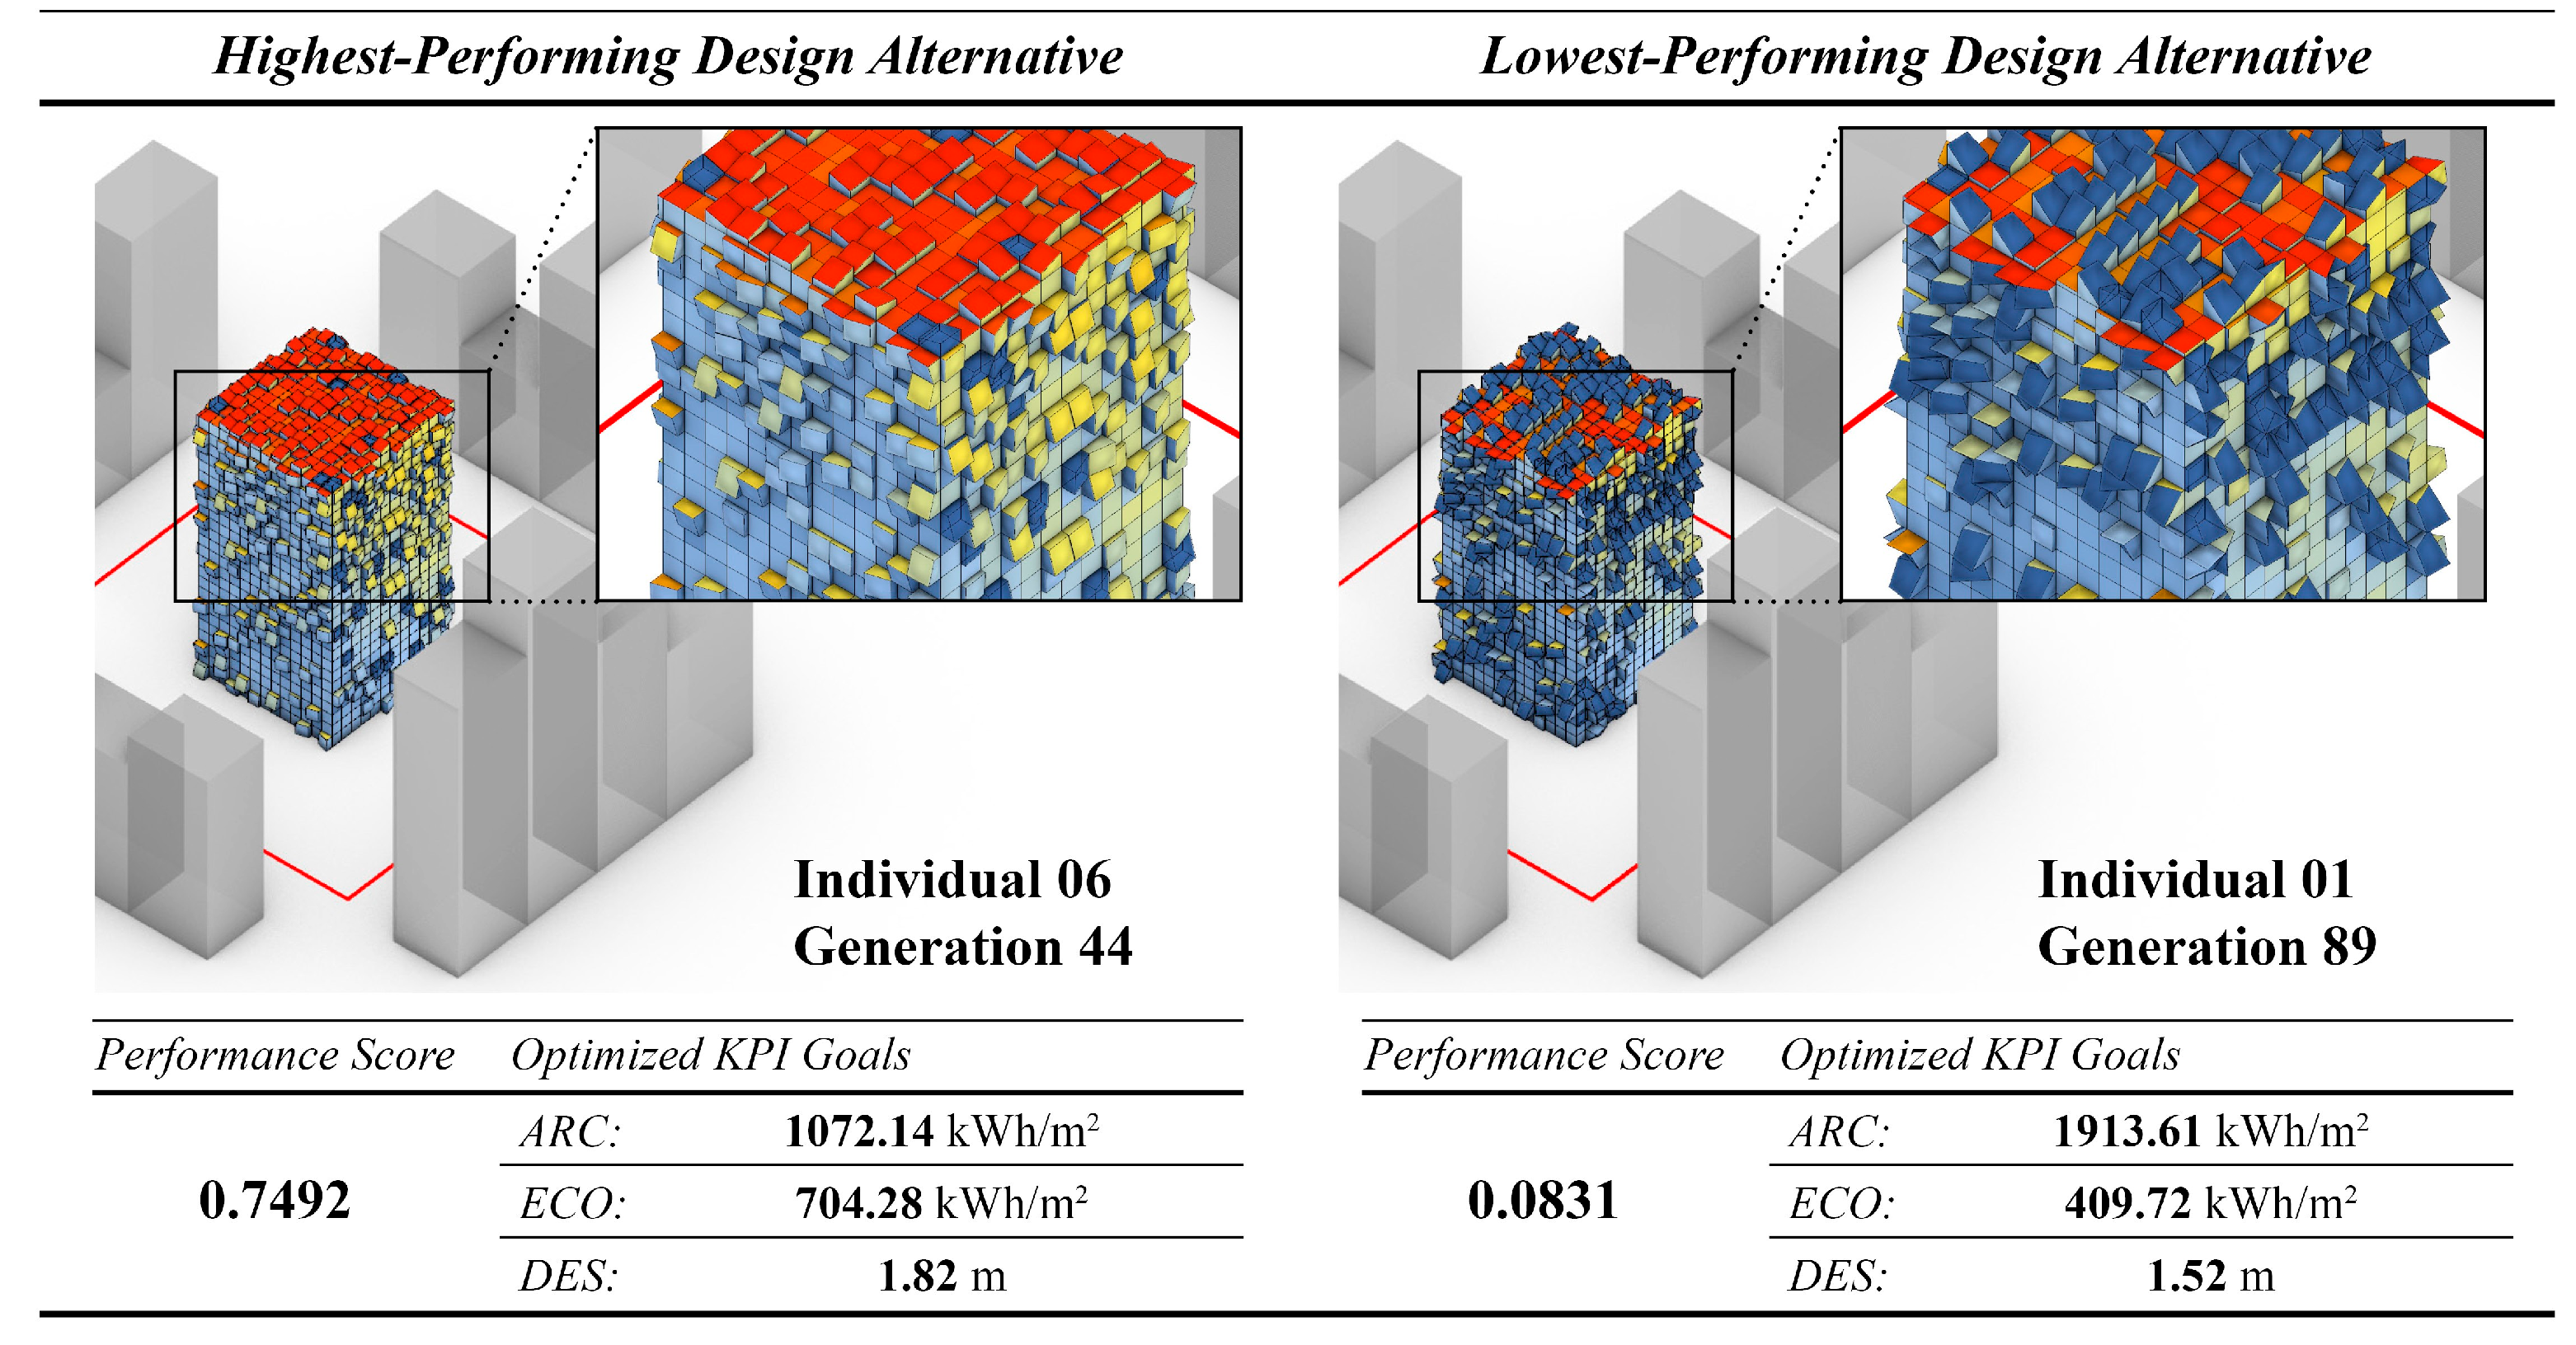
5.2. Selecting Case-Study KPIs

Even though a simulation model of architectural and ecological correlations is still lacking, this section aims to give an example of architectural design configured with the addition of non-human stakeholders. Stakeholder KPIs relate to fundamental key life-cycle thresholds that define each one, for example, light intensity (in relation to plant interaction) and solar radiation (in relation to human thermal comfort). Further ecological information that is required in the evaluation of the multi-species envelope, such as leaf shape, size, thickness, or plant spatial patterns, describes the properties of plants and is not considered a KPI. This is also the case with the biological properties of soil, which play a vital role in soil-plant interactions [177]. Soil volume, on the other hand, which is a measure of species habitat quality, root depth, etc., as well as influencing other parameters, i.e., acoustics and air quality, can be considered a KPI, with its thresholds varying according to the specific requirements of the locality and the synergies/trade-offs between the other stakeholders.
In addition, it is important to consider the interactions of the 3D urban environment (orientation, land formation, building geometry, etc.) with the local environmental conditions and the presence of humans, plants, animals, and microbiota. The proposed multi-species design cases will be generated using a data-driven approach guided by the selection of KPIs, as these are defined by the different stakeholders. For example, the architectural geometry of the façade, in relation to floor height, panel surface inclination, openings, etc., as well as the soil volume, water retention, and FG abundance, will be designed in a way that encapsulates architectural design and ecological knowledge gained through the created synergies and trade-offs (Figure 5). Such complex relationships can be considered by also acknowledging the need for a design KPI.
A design KPI may also serve as an indication of habitat diversity and could relate to the ‘number of FG KPI that measures species richness and biodiversity [185]. Additionally, species richness is relative to annual precipitation, temperature, light levels, and soil volume, all of which could be considered potential KPIs that drive the design process [186]. Studies have reported that a lack of species richness within urban environments is due to the shortage of natural habitats and habitat heterogeneity [185,187,188]. It is anticipated that a proposed building simulation approach will be able to evaluate the ECOLOPE design cases and quantify such relationships at the scale of the building. Currently, without a working simulation model, we can assume links between ecological KPIs and functional traits and also between certain functional traits and environmental factors, which may not be entirely correct but seem like logical first steps for a first trial.
Selvan et al. tested a component of the multi-species computational framework, i.e., ECOLOPES, through a case study using the MCDM technique in Grasshopper [69]. The architectural objective was to “improve thermal comfort” during summer, and the ecological objective was to “improve plant growth”, using the common KPI “solar radiation” for both stakeholders. The objective-KPI relationships between the stakeholders were evaluated through the “nested hierarchy”. The outcome was based on a trade-off between the need to minimize solar radiation to satisfy the human objective and the need to maximize light requirements for the plants (shading %). To achieve optimum shading vs. light variations, one more objective was used to “increase panel variation”, using “standard deviation” as a KPI. Results were ranked according to the highest and lowest performance scenarios using TOPSIS. Figure 6 depicts the highest-performing and lowest-performing correlation scenarios for optimum results between the stakeholders. More case studies are required to test the objective-KPI relationships using additional KPIs, building design variations, algorithms, parameters, patterns, and predictions, as well as stakeholder combinations, in order to evaluate more precise correlations.
Regarding assigning KPIs priorities, one way could be the importance of a KPI to a stakeholder’s vitality, as well as the number of associations that exist between a KPI, the different stakeholders, and the number of objectives, meaning that the higher the number of associations, the higher the importance of the KPI. Additionally, measurable KPIs take precedence over more abstract ones, i.e., psychological parameters and well-being (Table 1), as they can be integrated easier in the next step, which is building simulation. Other KPIs emerge from the specific characteristics of the locality, defined by the design brief. For example, in the case of increased outdoor noise for a building located near a highway, building acoustics will relate to the morphology of the façade and the inclusion of soil volume on the building fabric, defined by the ‘noise levels’ KPI (refer to Figure 5 bottom). So, KPI priorities are formed relative to other KPIs, using the “nested hierarchy” strategy. The outcome will portray the best possible conditions for all multi-species envelope inhabitants, i.e., the stakeholders, under the specific local conditions.

6. Conclusions

Multi-species design has the potential to act as an enabler of human–nature interactions, overcoming the human–nature dichotomy as well as the difficulty of providing green spaces within a dense city fabric. On one hand, it benefits different species by providing additional urban habitats as well as connectivity and movement between them. On the other hand, it benefits humans by enhancing their health and well-being, increasing one’s exposure to natural environments, assisting in the improvement of city air quality, thermal comfort, and more. The result will be an architectural, ecological, technological, and cultural edifice.
The aim of this paper, which is part of the wider ECOLOPES research program, was the setting of a conceptual framework that defines objective-KPI relationships between the different stakeholders towards the design of a multi-species building envelope, i.e., ecolope. The proposed framework explores the objective-KPI relationships created between architectural parameters and ecological function. Multi-species design requires ecological knowledge to be available to the designer during the architectural design process. This is achieved by including other stakeholders alongside current human-centric design practices. The process involves the development of a design approach based on a wide range of expert knowledge on architectural and ecological principles. The task is to find architectural solutions that enable synergies and limit conflicts between the different inhabitants and named stakeholders.
Design objectives are stated at the beginning of a project, and their applicability is tested through the selection of KPIs that essentially guide the design. The proposed methodology underlines the use of common KPIs between the stakeholders while acknowledging each stakeholder’s thresholds. By assigning quantifiable KPIs to all four stakeholders, i.e., humans, plants, animals, and microbiota, it will become possible to evaluate and optimize design outcomes computationally. One challenge is how to develop multi-stakeholder design strategies to meet the requirements of a specific site. Ecologically, this involves a reduction in scale, from the bigger scale of landscape urbanism and its limitations within the dense urban environment to the much smaller scale of the building envelope. Another challenge is the ability to define measurable stakeholder KPIs that can be used for design generation and optimization.
Successful correlations between the objective-KPI framework of human and non-human stakeholders will essentially form new knowledge in architectural design. For example, the multi-species envelope design may be evaluated in relation to species diversity, species habitat, and others, along with architectural composition. The outcome will be knowledge-based and data-driven by combining ecological modeling with 3D architectural computation. We are also aware of the challenges such a project might have in relation to people’s perceptions and reactions to it, and we hope that through the accumulation of knowledge, it will be possible to present a comprehensive, all-round view to the public and prospective stakeholders on this research results.
The multidisciplinary character of the project and the challenges faced have been outlined in various sections of this paper. The exchange of professional knowledge between the different disciplines is discussed through the objective-KPI framework. ECOLOPES brought together several professionals, including professors, research fellows, Ph.D.’s, and masters students, from different disciplines and specializations, including architecture, ecology, and computer science. This work entailed numerous conceptual and technical meetings, both online and in person, workshops, conferences, and talks between the team members representing four prominent universities. ECOLOPES findings have been presented at several international conferences and exhibitions. The proposed simulation environment has the capability to become an important aspect of urban planning, complementing other approaches, such as nature conservation within cities, by providing expertise to architects, planners, and ecologists.

Author Contributions

Conceptualization, S.T.S., W.W.W., Y.J.G. and S.B.; methodology, S.T.S., Y.J.G. and S.B.; formal analysis, W.W.W., J.J. and T.E.H.; writing—original draft preparation S.T.S.; writing—review and editing, W.W.W., J.J., T.E.H., K.P., F.M., S.U.S., L.W., Y.J.G. and S.B.; visualization S.T.S. and S.U.S.; supervision, Y.J.G. and S.B.; project administration, S.T.S.; funding acquisition Y.J.G. and S.B. All authors have read and agreed to the published version of the manuscript.

Funding

This work is supported by the H2020-EU.1.2.1.-FET Open project ECOLOPES [Grant Agreement ID 964414].

Data Availability Statement

The raw data supporting the conclusions of this article will be made available by the authors on request.

Acknowledgments

This research paper is part of the wider research work of ECOLOPES, or Ecological Envelopes. The authors are grateful for the support and contributions of the members of the ECOLOPES consortium on this study and towards further research developments.

Conflicts of Interest

Authors Jens Joschinski and Thomas E. Hauck were employed by the company Studio Animal- Aided Design. The remaining authors declare that the research was conducted in the absence of any commercial or financial relationships that could be construed as a potential conflict of interest.

References

  1. Kapucu, N.; Ge, Y.G.; Martín, Y.; Williamson, Z. Urban resilience for building a sustainable and safe environment. Urban Gov. 2021, 1, 10–16. [Google Scholar] [CrossRef]
  2. Hensel, D.S. Ecological prototypes: Initiating design innovation in green construction. Sustainability 2020, 12, 5865. [Google Scholar] [CrossRef]
  3. Meir, I.A.; Peeters, A.; Pearlmutter, D.; Halasah, S.; Garb, Y.; Davis, J.-M. An assessment of regional constraints, needs and trends. Adv. Build. Energy Res. 2012, 6, 173–211. [Google Scholar] [CrossRef]
  4. UN: Department of Economic and Social Affairs The 17 Goals; United Nations Department of Global Communications: New York, NY, USA, 2023.
  5. ASHRAE (Ed.) ASHRAE Airflow around buildings. In 2009 ASHRAE Handbook—Fundamentals (SI); ASHRAE (American Society of Heating Refrigerating and Air-Conditioning Engineers): Altanta, GA, USA, 2009; ISBN 9781933742557. [Google Scholar]
  6. Sadineni, S.B.; Madala, S.; Boehm, R.F. Passive building energy savings: A review of building envelope components. Renew. Sustain. Energy Rev. 2011, 15, 3617–3631. [Google Scholar] [CrossRef]
  7. Saroglou, T.; Theodosiou, T.; Meir, I.A. Improving the Energy Efficiency of a Mediterranean High-Rise Envelope. CTBUH J. Int. J. Tall Build. Urban Habitat 2020, 20–27. Available online: https://global.ctbuh.org/resources/papers/download/4301-improving-the-energy-efficiency-of-a-mediterranean-high-rise-envelope.pdf (accessed on 24 December 2023).
  8. Saroglou, T.; Meir, I.A.; Theodosiou, T.; Givoni, B. Towards energy efficient skyscrapers. Energy Build. 2017, 149, 437–449. [Google Scholar] [CrossRef]
  9. Gaspari, J.; Fabbri, K.; Lucchi, M. The use of outdoor microclimate analysis to support decision making process: Case study of Bufalini square in Cesena. Sustain. Cities Soc. 2018, 42, 206–215. [Google Scholar] [CrossRef]
  10. Moscovitz, O.; Barath, S. A Generative Design Approach to Urban Sustainability Rating Systems During Early-Stage Urban Development. In Proceedings of the 27th International Conference of the Association for Computer-Aided Architectural Design Research in Asia, Sydney, Australia, 9–15 April 2022; Volume 1, pp. 171–180. [Google Scholar] [CrossRef]
  11. Barnosky, A.D.; Hadly, E.A.; Bascompte, J.; Berlow, E.L.; Brown, J.H.; Fortelius, M.; Getz, W.M.; Harte, J.; Hastings, A.; Marquet, P.A.; et al. Approaching a state shift in Earth’s biosphere. Nature 2012, 486, 52–58. [Google Scholar] [CrossRef]
  12. Chapin, F.S.; Power, M.E.; Pickett, S.T.A.; Freitag, A.; Reynolds, J.A.; Jackson, R.B.; Lodge, D.M.; Duke, C.; Collins, S.L.; Power, A.G.; et al. Earth Stewardship: Science for action to sustain the human-earth system. Ecosphere 2011, 2, art89. [Google Scholar] [CrossRef]
  13. Groffman, P.M.; Avolio, M.; Cavender-Bares, J.; Bettez, N.D.; Grove, J.M.; Hall, S.J.; Hobbie, S.E.; Larson, K.L.; Lerman, S.B.; Locke, D.H.; et al. Ecological homogenization of residential macrosystems. Nat. Ecol. Evol. 2017, 1, 0191. [Google Scholar] [CrossRef]
  14. Jonsson, H.; Rudberg, M. KPIs for measuring performance of production systems for residential building: A production strategy perspective. Constr. Innov. 2017, 17, 381–403. [Google Scholar] [CrossRef]
  15. Sørnes, K.; Sørensen, Å.L.; Almås, A.-J.; Mysen, M. Analysis of Goals and KPIs in Design Projects; PI-SEC: Oslo, Norway, 2016. [Google Scholar]
  16. Ghazvini, K.; Zandieh, M.; Vafamehr, M. Exploring KPIS Utilization Effects on Decision Making for the Architectural Design Process in Industrial Buildings. Civ. Environ. Eng. 2020, 16, 198–209. [Google Scholar] [CrossRef]
  17. Ceschin, F.; Gaziulusoy, I. Evolution of design for sustainability: From product design to design for system innovations and transitions. Des. Stud. 2016, 47, 118–163. [Google Scholar] [CrossRef]
  18. Grobman, Y.J. Building the Digital World—Architectural Design Methods Based on the Use of Digital Tools–Performance Based Form Generation and Optimization. Ph.D. Thesis, Technion-Israel Institute of Technology, Haifa, Israel, 2008. [Google Scholar] [CrossRef]
  19. Chan, A.P.C.; Chan, A.P.L. Key performance indicators for measuring construction success. Benchmarking 2004, 11, 203–221. [Google Scholar] [CrossRef]
  20. Maslesa, E.; Jensen, P.A.; Birkved, M. Indicators for quantifying environmental building performance: A systematic literature review. J. Build. Eng. 2018, 19, 552–560. [Google Scholar] [CrossRef]
  21. Grobman, Y.J.; Weisser, W.; Shwartz, A.; Ludwig, F.; Kozlovsky, R.; Ferdman, A.; Perini, K.; Hauck, T.E.; Selvan, S.U.; Saroglou, S.; et al. Architectural Multispecies Building Design: Concepts, Challenges, and Design Process. Sustainability 2023, 15, 15480. [Google Scholar] [CrossRef]
  22. Weisser, W.W.; Hensel, M.; Barath, S.; Culshaw, V.; Grobman, Y.J.; Hauck, T.E.; Joschinski, J.; Ludwig, F.; Mimet, A.; Perini, K.; et al. Creating ecologically sound buildings by integrating ecology, architecture and computational design. People Nat. 2022, 1–17. [Google Scholar] [CrossRef]
  23. Saunders, W. Designed Ecologies: The Landscapes of Kongjian Yu; Birkhäuser: Basel, Switzerland, 2012. [Google Scholar]
  24. Steiner, F.; Simmons, M.; Gallagher, M.; Ranganathan, J.; Robertson, C. The ecological imperative for environmental design and planning. Front. Ecol. Environ. 2013, 11, 355–361. [Google Scholar] [CrossRef] [PubMed]
  25. Botequilha Leitão, A.; Ahern, J. Applying landscape ecological concepts and metrics in sustainable landscape planning. Landsc. Urban Plan. 2002, 59, 65–93. [Google Scholar] [CrossRef]
  26. Masud, A.S. A Study of Multiple Objective Decision Making-Methods and Applications. Ph.D. Thesis, Kansas State University, Manhattan, KS, USA, 1978. [Google Scholar]
  27. Jim, C.Y. Landscape of a Suburban Neighbourhood in Hong Kong. Landsc. Urban Plan. 1993, 23, 2–3. [Google Scholar] [CrossRef]
  28. Savard, J.P.L.; Clergeau, P.; Mennechez, G. Biodiversity concepts and urban ecosystems. Landsc. Urban Plan. 2000, 48, 131–142. [Google Scholar] [CrossRef]
  29. McDonnell, M.J.; Pickett, S.T.A. Ecosystem Structure and Function along Urban-Rural Gradients: An Unexploited Opportunity for Ecology. Ecology 1990, 71, 1232–1237. [Google Scholar] [CrossRef]
  30. Bennett, E.M. Soil Phosphorus Concentrations in Dane County, Wisconsin, USA: An Evaluation of the Urban-Rural Gradient Paradigm. Environ. Manag. 2003, 32, 476–487. [Google Scholar] [CrossRef] [PubMed]
  31. White, M.A.; Nemani, R.R.; Thornton, P.E.; Running, S.W. Satellite Evidence of Phenological Differences Between Urbanized and Rural Areas of the Eastern United States Deciduous Broadleaf Forest. Ecosystems 2002, 5, 260–273. [Google Scholar] [CrossRef]
  32. Zhang, J.; Dong, W.; Wu, L.; Wei, J.; Chen, P.; Lee, D.K. Impact of land use changes on surface warming in China. Adv. Atmos. Sci. 2005, 22, 343–348. [Google Scholar] [CrossRef]
  33. Zhou, L.; Dickinson, R.E.; Tian, Y.; Fang, J.; Li, Q.; Kaufmann, R.K.; Tucker, C.J.; Myneni, R.B. Evidence for a significant urbanization effect on climate in China. Proc. Natl. Acad. Sci. USA 2004, 101, 9540–9544. [Google Scholar] [CrossRef] [PubMed]
  34. Morelli, F.; Benedetti, Y.; Ibáñez-Álamo, J.D.; Jokimäki, J.; Mänd, R.; Tryjanowski, P.; Møller, A.P. Evidence of evolutionary homogenization of bird communities in urban environments across Europe. Glob. Ecol. Biogeogr. 2016, 25, 1284–1293. [Google Scholar] [CrossRef]
  35. Ibáñez-Álamo, J.D.; Rubio, E.; Benedetti, Y.; Morelli, F. Global loss of avian evolutionary uniqueness in urban areas. Glob. Chang. Biol. 2017, 23, 2990–2998. [Google Scholar] [CrossRef]
  36. Duchamp, J.E.; Swihart, R.K. Shifts in bat community structure related to evolved traits and features of human-altered landscapes. Landsc. Ecol. 2008, 23, 849–860. [Google Scholar] [CrossRef]
  37. Urban, M.C.; Bocedi, G.; Hendry, A.P.; Mihoub, J.-B.; Pe’er, G.; Singer, A.; Bridle, J.R.; Crozier, L.G.; De Meester, L.; Godsoe, W.; et al. Improving the forecast for biodiversity under climate change. Science 2016, 353, aad8466. [Google Scholar] [CrossRef]
  38. Ceballos, G.; Ehrlich, P.R.; Barnosky, A.D.; García, A.; Pringle, R.M.; Palmer, T.M. Accelerated modern human–induced species losses: Entering the sixth mass extinction. Sci. Adv. 2015, 1, e1400253. [Google Scholar] [CrossRef]
  39. Palomo, I.; Montes, C.; Martín-López, B.; González, J.A.; García-Llorente, M.; Rente, P.A.; Mora, M.R.G. Incorporating the Social–Ecological Approach in Protected Areas in the Anthropocene. Bioscience 2014, 64, 181–191. [Google Scholar] [CrossRef]
  40. Sandifer, P.A.; Sutton-Grier, A.E.; Ward, B.P. Exploring connections among nature, biodiversity, ecosystem services, and human health and well-being: Opportunities to enhance health and biodiversity conservation. Ecosyst. Serv. 2015, 12, 1–15. [Google Scholar] [CrossRef]
  41. Aronson, M.F.J.; Nilon, C.H.; Lepczyk, C.A.; Parker, T.S.; Warren, P.S.; Cilliers, S.S.; Goddard, M.A.; Hahs, A.K.; Herzog, C.; Katti, M.; et al. Hierarchical filters determine community assembly of urban species pools. Ecology 2016, 97, 2952–2963. [Google Scholar] [CrossRef]
  42. La Sorte, F.A.; Lepczyk, C.A.; Aronson, M.F.J.; Goddard, M.A.; Hedblom, M.; Katti, M.; MacGregor-Fors, I.; Mörtberg, U.; Nilon, C.H.; Warren, P.S.; et al. The phylogenetic and functional diversity of regional breeding bird assemblages is reduced and constricted through urbanization. Divers. Distrib. 2018, 24, 928–938. [Google Scholar] [CrossRef]
  43. Piano, E.; Souffreau, C.; Merckx, T.; Baardsen, L.F.; Backeljau, T.; Bonte, D.; Brans, K.I.; Cours, M.; Dahirel, M.; Debortoli, N.; et al. Urbanization drives cross-taxon declines in abundance and diversity at multiple spatial scales. Glob. Chang. Biol. 2020, 26, 1196–1211. [Google Scholar] [CrossRef] [PubMed]
  44. Sweet, F.S.T.; Apfelbeck, B.; Hanusch, M.; Monteagudo, C.G.; Weisser, W.W. Data from public and governmental databases show that a large proportion of the regional animal species pool occur in cities in Germany. J. Urban Ecol. 2022, 8, juac002. [Google Scholar] [CrossRef]
  45. Weng, Y.C. Spatiotemporal changes of landscape pattern in response to urbanization. Landsc. Urban Plan. 2007, 81, 341–353. [Google Scholar] [CrossRef]
  46. Su, J.; Zhang, R.; Wu, M.; Yang, R.; Liu, Z.; Xu, X. Correlation between Spatial-Temporal Changes in Landscape Patterns and Habitat Quality in the Yongding River Floodplain, China. Land 2023, 12, 807. [Google Scholar] [CrossRef]
  47. Goddard, M.A.; Dougill, A.J.; Benton, T.G. Scaling up from gardens: Biodiversity conservation in urban environments. Trends Ecol. Evol. 2010, 25, 90–98. [Google Scholar] [CrossRef]
  48. Forman, R.T.; Collinge, S.K. Nature conserved in changing landscapes with and without spatial planning. Landsc. Urban Plan. 1997, 37, 129–135. [Google Scholar] [CrossRef]
  49. CBD. Cities and Biodiversity Outlook: A Global Assessment of the Links between Urbanization, Biodiversity, and Ecosystem Services; CBD: Montreal, QC, Canada, 2012. [Google Scholar] [CrossRef]
  50. Fineschi, S.; Loreto, F. A Survey of Multiple Interactions Between Plants and the Urban Environment. Front. For. Glob. Chang. 2020, 3, 30. [Google Scholar] [CrossRef]
  51. Xie, X.; Lu, Y.; Gou, Z. Green Building Pro-Environment Behaviors: Are Green Users Also Green Buyers? Sustainability 2017, 9, 1703. [Google Scholar] [CrossRef]
  52. Liu, T.; Chen, L.; Yang, M.; Sandanayake, M.; Miao, P.; Shi, Y.; Yap, P.-S. Sustainability Considerations of Green Buildings: A Detailed Overview on Current Advancements and Future Considerations. Sustainability 2022, 14, 14393. [Google Scholar] [CrossRef]
  53. Fedele, G.; Locatelli, B.; Djoudi, H. Mechanisms mediating the contribution of ecosystem services to human well-being and resilience. Ecosyst. Serv. 2017, 28, 43–54. [Google Scholar] [CrossRef]
  54. Lapointe, M.; Gurney, G.G.; Coulthard, S.; Cumming, G.S. Ecosystem services, well-being benefits and urbanization associations in a Small Island Developing State. People Nat. 2021, 3, 391–404. [Google Scholar] [CrossRef]
  55. Pavez, F.; Maxwell, D.; Bunster, V. Regenerative Design Performance assessment: A critical review. In Proceedings of the 55th International Conference of the Architectural Science Association 2022, Perth, Australia, 1–2 December 2022. [Google Scholar]
  56. Cole, R.J. Regenerative design and development: Current theory and practice. Build. Res. Inf. 2012, 40, 1–6. [Google Scholar] [CrossRef]
  57. Weller, R.; Drozdz, Z.; Kjaersgaard, S.P. Hotspot cities: Identifying peri-urban conflict zones. J. Landsc. Archit. 2019, 14, 8–19. [Google Scholar] [CrossRef]
  58. Zhang, L.; Xie, L.; Xiao, Y. Maximising the benefits of regulatory ecosystem services via spatial optimisation. J. Clean. Prod. 2021, 291, 125272. [Google Scholar] [CrossRef]
  59. ALwaer, H.; Clements-Croome, D.J. Key performance indicators (KPIs) and priority setting in using the multi-attribute approach for assessing sustainable intelligent buildings. Build. Environ. 2010, 45, 799–807. [Google Scholar] [CrossRef]
  60. Selvan, S.U.; Saroglou, S.T.; Joschinski, J.; Calbi, M.; Vogler, V.; Barath, S.; Grobman, Y.J. Toward multi-species building envelopes: A critical literature review of multi-criteria decision-making for design support. Build. Environ. 2023, 231, 110006. [Google Scholar] [CrossRef]
  61. Mosca, F.; Perini, K. Reviewing the Role of Key Performance Indicators in Architectural and Urban Design Practices. Sustainability 2022, 14, 14464. [Google Scholar] [CrossRef]
  62. Kylili, A.; Fokaides, P.A.; Lopez Jimenez, P.A. Key Performance Indicators (KPIs) approach in buildings renovation for the sustainability of the built environment: A review. Renew. Sustain. Energy Rev. 2016, 56, 906–915. [Google Scholar] [CrossRef]
  63. Davis, M.J.M.; Tenpierik, M.J.; Ramírez, F.R.; Pérez, M.E. More than just a Green Facade: The sound absorption properties of a vertical garden with and without plants. Build. Environ. 2017, 116, 64–72. [Google Scholar] [CrossRef]
  64. Andrade, H.; Alcoforado, M.J.; Oliveira, S. Perception of temperature and wind by users of public outdoor spaces: Relationships with weather parameters and personal characteristics. Int. J. Biometeorol. 2011, 55, 665–680. [Google Scholar] [CrossRef] [PubMed]
  65. Saroglou, T.; Itzhak-Ben-Shalom, H.; Meir, I.A. Pedestrian thermal perception: Studies around two high-rise buildings in the Mediterranean climate. Build. Res. Inf. 2021, 50, 171–191. [Google Scholar] [CrossRef]
  66. Hartig, T.; Kahn, P.H., Jr. Living in cities, naturally. Science 2016, 352, 938–940. [Google Scholar] [CrossRef]
  67. Aleksandrowicz, O.; Saroglou, T.; Pearlmutter, D.; Planning, T.; Campus, S.B.; Development, E. Evaluation of Summer Mean Radiant Temperature Simulation in Envi-Met in a Hot Mediterranean Climate. Build. Environ. 2023, 245, 110881. [Google Scholar] [CrossRef]
  68. Weisser, W.W.; Roscher, C.; Meyer, S.T.; Ebeling, A.; Luo, G.; Allan, E.; Beßler, H.; Barnard, R.L.; Buchmann, N.; Buscot, F.; et al. Biodiversity effects on ecosystem functioning in a 15-year grassland experiment: Patterns, mechanisms, and open questions. Basic Appl. Ecol. 2017, 23, 1–73. [Google Scholar] [CrossRef]
  69. Selvan, S.U.; Saroglou, S.T.; Mosca, F.; Tyc, J.; Joschinski, J.; Calbi, M.; Vogler, V.; Weisser, W.W.; Grobman, Y.G.; Barath, S. Multi-species building envelopes: Developing a multi-criteria design decision-making methodology for cohabitation. In Proceedings of the Human-Centric. 28th International Conference of the Association for Computer-Aided Architectural Design Research in Asia (CAADRIA), Ahmedebad, India, 2 March 2023; pp. 645–654. [Google Scholar]
  70. Johansson, E.; Emmanuel, R. The influence of urban design on outdoor thermal comfort in the hot, humid city of Colombo, Sri Lanka. Int. J. Biometeorol. 2006, 51, 119–133. [Google Scholar] [CrossRef]
  71. Binarti, F.; Koerniawan, M.D.; Triyadi, S.; Utami, S.S.; Matzarakis, A. A review of outdoor thermal comfort indices and neutral ranges for hot-humid regions. Urban Clim. 2020, 31, 100531. [Google Scholar] [CrossRef]
  72. Höppe, P. The physiological equivalent temperature—A universal index for the biometeorological assessment of the thermal environment. Int. J. Biometeorol. 1999, 43, 71–75. [Google Scholar] [CrossRef] [PubMed]
  73. Anderson, J.R.; Hardy, E.E.; Roach, J.; Witmer, R.E. A Land Use And Land Cover Classification System For Use With Remote Sensor Data; Geological Survey Professional Paper 964; United States Government Printing Office: Washington, DC, USA, 1976. [Google Scholar]
  74. Mallick, J. Land Characterization Analysis of Surface Temperature of Semi-Arid Mountainous City Abha, Saudi Arabia Using Remote Sensing and GIS. J. Geogr. Inf. Syst. 2014, 6, 664–676. [Google Scholar] [CrossRef]
  75. Aleksandrowicz, O.; Pearlmutter, D. The significance of shade provision in reducing street-level summer heat stress in a hot Mediterranean climate. Landsc. Urban Plan. 2023, 229, 104588. [Google Scholar] [CrossRef]
  76. Rodríguez-Espinosa, T.; Navarro-Pedreño, J.; Gómez-Lucas, I.; Jordán-Vidal, M.M.; Bech-Borras, J.; Zorpas, A.A. Urban areas, human health and technosols for the green deal. Environ. Geochem. Health 2021, 43, 5065–5086. [Google Scholar] [CrossRef] [PubMed]
  77. Burghardt, W.; Morel, J.L.; Zhang, G.-L. Development of the soil research about urban, industrial, traffic, mining and military areas (SUITMA). Soil Sci. Plant Nutr. 2015, 61, 3–21. [Google Scholar] [CrossRef]
  78. Cébron, A.; Zeghal, E.; Usseglio-Polatera, P.; Meyer, A.; Bauda, P.; Lemmel, F.; Leyval, C.; Maunoury-Danger, F. BactoTraits—A functional trait database to evaluate how natural and man-induced changes influence the assembly of bacterial communities. Ecol. Indic. 2021, 130, 108047. [Google Scholar] [CrossRef]
  79. Pérez, G.; Perini, K. Nature Based Strategies for Urban and Building Sustainability; Elsevier: Amsterdam, The Netherlands, 2018; ISBN 9780128121504. [Google Scholar]
  80. Qin, Y. Urban flooding mitigation techniques: A systematic review and future studies. Water 2020, 12, 3579. [Google Scholar] [CrossRef]
  81. Mitchell, V.G. Applying Integrated Urban Water Management Concepts: A Review of Australian Experience. Environ. Manag. 2006, 37, 589–605. [Google Scholar] [CrossRef]
  82. Wong, T.H.F. Water sensitive urban design-the journey thus far. Australas. J. Water Resour. 2006, 10, 213–222. [Google Scholar] [CrossRef]
  83. Eckart, K.; McPhee, Z.; Bolisetti, T. Performance and implementation of low impact development—A review. Sci. Total Environ. 2017, 607–608, 413–432. [Google Scholar] [CrossRef]
  84. Lim, H.S.; Lu, X.X. Sustainable urban stormwater management in the tropics: An evaluation of Singapore’s ABC Waters Program. J. Hydrol. 2016, 538, 842–862. [Google Scholar] [CrossRef]
  85. Echevarria Sanchez, G.M.; Van Renterghem, T.; Thomas, P.; Botteldooren, D. The effect of street canyon design on traffic noise exposure along roads. Build. Environ. 2016, 97, 96–110. [Google Scholar] [CrossRef]
  86. Benocci, R.; Bisceglie, A.; Angelini, F.; Zambon, G. Influence of traffic noise from local and surrounding areas on high-rise buildings. Appl. Acoust. 2020, 166, 107362. [Google Scholar] [CrossRef]
  87. Butler, D. Sound and vision. Nature 2004, 427, 480–481. [Google Scholar] [CrossRef] [PubMed]
  88. ISO 9613-2:1996; Acoustics—Attenuation of Sound during Propagation Outdoors—Part 2: General Method of Calculation. International Organization for Standardization: Geneva, Switzerland, 1996.
  89. Hood, R.A. Accuracy of calculation of road traffic noise. Appl. Acoust. 1987, 21, 139–146. [Google Scholar] [CrossRef]
  90. Department of Transport Welsh Office. Calculation of Road Traffic Noise; Her Majesty’s Stationery Office: London, UK, 1988.
  91. Kim, R.; den Berg, M. Summary of Night Noise Guidelines for Europe. Noise Health 2010, 12, 61–63. [Google Scholar] [CrossRef] [PubMed]
  92. Héroux, M.E.; Babisch, W.; Belojevic, G.; Brink, M.; Janssen, S.; Lercher, P.; Paviotti, M.; Pershagen, G.; Waye, K.P.; Preis, A.; et al. WHO Environmental Noise Guidelines for the European Region; WHO: Geneva, Switzerland, 2015. [Google Scholar]
  93. Van Den Berg, M. Night noise guidelines for Europe. In Proceedings of the Turkish Acoustical Society-36th International Congress and Exhibition on Noise Control Engineering, INTER-NOISE 2007 ISTANBUL, Istanbul, Turkey, 28–31 August 2007; Volume 7, pp. 5016–5025. [Google Scholar]
  94. Oquendo-Di Cosola, V.; Olivieri, F.; Ruiz-García, L. A systematic review of the impact of green walls on urban comfort: Temperature reduction and noise attenuation. Renew. Sustain. Energy Rev. 2022, 162, 112463. [Google Scholar] [CrossRef]
  95. Van Renterghem, T.; Forssén, J.; Attenborough, K.; Jean, P.; Defrance, J.; Hornikx, M.; Kang, J. Using natural means to reduce surface transport noise during propagation outdoors. Appl. Acoust. 2015, 92, 86–101. [Google Scholar] [CrossRef]
  96. Smyrnova, Y.; Kang, J.; Hornikx, M.; Forssén, J. Effect of vegetation on noise propagation in streets and squares. Proc. Inst. Acoust. 2012, 34, 57–67. [Google Scholar]
  97. HOSANNA, Technical Report 5.3, Acoustic Simulation Tools for Urban Streets/Squares Integrating Vegetation. 2011. Available online: http://www.greener-cities.eu/ (accessed on 24 December 2023).
  98. D’Alessandro, F.; Asdrubali, F.; Mencarelli, N. Experimental evaluation and modelling of the sound absorption properties of plants for indoor acoustic applications. Build. Environ. 2015, 94, 913–923. [Google Scholar] [CrossRef]
  99. Van Renterghem, T.; Botteldooren, D.; Verheyen, K. Road traffic noise shielding by vegetation belts of limited depth. J. Sound Vib. 2012, 331, 2404–2425. [Google Scholar] [CrossRef]
  100. Attal, E.; Dubus, B.; Leblois, T.; Cretin, B. An optimal dimensioning method of a green wall structure for noise pollution reduction. Build. Environ. 2021, 187, 107362. [Google Scholar] [CrossRef]
  101. Lacasta, A.M.; Penaranda, A.; Cantalapiedra, I.R.; Auguet, C.; Bures, S.; Urrestarazu, M. Acoustic evaluation of modular greenery noise barriers. Urban For. Urban Green. 2016, 20, 172–179. [Google Scholar] [CrossRef]
  102. Mukherjee, A.; Agrawal, M. World air particulate matter: Sources, distribution and health effects. Environ. Chem. Lett. 2017, 15, 283–309. [Google Scholar] [CrossRef]
  103. Kumar, P.; Khare, M.; Harrison, R.M.; Bloss, W.J.; Lewis, A.C.; Coe, H.; Morawska, L. New directions: Air pollution challenges for developing megacities like Delhi. Atmos. Environ. 2015, 122, 657–661. [Google Scholar] [CrossRef]
  104. Tibbetts, J.H. Air Quality and Climate Change: A Delicate Balance. Environ. Health Perspect. 2015, 123. [Google Scholar] [CrossRef] [PubMed]
  105. Van den Berg, A.E. Health Impacts of Healing Environments; UMCG: Groningen, The Netherlands, 2005. [Google Scholar]
  106. Guieysse, B.; Hort, C.; Platel, V.; Munoz, R.; Ondarts, M.; Revah, S. Biological treatment of indoor air for VOC removal: Potential and challenges. Biotechnol. Adv. 2008, 26, 398–410. [Google Scholar] [CrossRef]
  107. Barwise, Y.; Kumar, P. Designing vegetation barriers for urban air pollution abatement: A practical review for appropriate plant species selection. Npj Clim. Atmos. Sci. 2020, 3, 12. [Google Scholar] [CrossRef]
  108. Gourdji, S. Review of plants to mitigate particulate matter, ozone as well as nitrogen dioxide air pollutants and applicable recommendations for green roofs in Montreal, Quebec. Environ. Pollut. 2018, 241, 378–387. [Google Scholar] [CrossRef]
  109. Chen, L.; Liu, C.; Zou, R.; Yang, M.; Zhang, Z. Experimental examination of effectiveness of vegetation as bio-filter of particulate matters in the urban environment. Environ. Pollut. 2016, 208, 198–208. [Google Scholar] [CrossRef]
  110. Gallagher, J.; Baldauf, R.; Fuller, C.H.; Kumar, P.; Gill, L.W.; McNabola, A. Passive methods for improving air quality in the built environment: A review of porous and solid barriers. Atmos. Environ. 2015, 120, 61–70. [Google Scholar] [CrossRef]
  111. Ruimtelijk, M.N. Nature and Health: The Influence of Nature on Social, Psychological and Physical Well-Being; The Health Council of the Netherlands: The Hague, The Netherlands, 2004. [Google Scholar]
  112. Bringslimark, T.; Hartig, T.; Patil, G.G. The psychological benefits of indoor plants: A critical review of the experimental literature. J. Environ. Psychol. 2009, 29, 422–433. [Google Scholar] [CrossRef]
  113. Fleming, W.; Shwartz, A. Nature interactions and their associations with connection to nature and well-being varies between different types of green spaces. People Nat. 2023, 1–14. [Google Scholar] [CrossRef]
  114. Kaplan, S.; Talbot, J.F. Psychological Benefits of a Wilderness Experience. In Human Behavior and Environment; Altman, I., Wohlwill, J.F., Eds.; Springer: Boston, MA, USA, 1983; pp. 163–203. ISBN 978-1-4613-3539-9. [Google Scholar]
  115. Grahn, P.; Stigsdotter, U.A. Landscape planning and stress. Urban For. Urban Green. 2003, 2, 1–18. [Google Scholar] [CrossRef]
  116. Dunnett, N.; Qasim, M. Perceived Benefits to Human Well-being of Urban Gardens. Horttechnology 2000, 10, 40–45. [Google Scholar] [CrossRef]
  117. Wells, N.M.; Evans, G.W. NEARBY NATURE A Buffer of Life Stress Among Rural Children. Environ. Behav. 2003, 35, 311–330. [Google Scholar] [CrossRef]
  118. Kaplan, R. The Nature of the View from Home. Environ. Behav. 2001, 33, 507–542. [Google Scholar] [CrossRef]
  119. Kardan, O.; Gozdyra, P.; Misic, B.; Moola, F.; Palmer, L.J.; Paus, T.; Berman, M.G. Neighborhood greenspace and health in a large urban center. Sci. Rep. 2015, 5, 11610. [Google Scholar] [CrossRef]
  120. Andersen, L.; Corazon, S.S.; Stigsdotter, U.K. Nature Exposure and Its Effects on Immune System Functioning: A Systematic Review. Int. J. Environ. Res. Public Health 2021, 18, 1416. [Google Scholar] [CrossRef]
  121. Bosch, T.C.G.; Adamska, M.; Augustin, R.; Domazet-Loso, T.; Foret, S.; Fraune, S.; Funayama, N.; Grasis, J.; Hamada, M.; Hatta, M.; et al. How do environmental factors influence life cycles and development? An experimental framework for early-diverging metazoans. BioEssays 2014, 36, 1185–1194. [Google Scholar] [CrossRef]
  122. Potts, L.J.; Gantz, J.D.; Kawarasaki, Y.; Philip, B.N.; Gonthier, D.J.; Law, A.D.; Moe, L.; Unrine, J.M.; McCulley, R.L.; Lee, R.E.; et al. Environmental factors influencing fine-scale distribution of Antarctica’s only endemic insect. Oecologia 2020, 194, 529–539. [Google Scholar] [CrossRef] [PubMed]
  123. Soberón, J.; Nakamura, M. Niches and distributional areas: Concepts, methods, and assumptions. Proc. Natl. Acad. Sci. USA 2009, 106, 19644–19650. [Google Scholar] [CrossRef] [PubMed]
  124. Tan, P.Y.; Ismail, M.R. Bin Building shade affects light environment and urban greenery in high-density residential estates in Singapore. Urban For. Urban Green 2014, 13, 771–784. [Google Scholar] [CrossRef]
  125. McGrane, S.J. Impacts of urbanisation on hydrological and water quality dynamics, and urban water management: A review. Hydrol. Sci. J. 2016, 61, 2295–2311. [Google Scholar] [CrossRef]
  126. Robledo-Arnuncio, J.J.; Klein, E.K.; Muller-Landau, H.C.; Santamaría, L. Space, time and complexity in plant dispersal ecology. Mov. Ecol. 2014, 2, 1–17. [Google Scholar] [CrossRef]
  127. Simkin, R.D.; Seto, K.C.; McDonald, R.I.; Jetz, W. Biodiversity impacts and conservation implications of urban land expansion projected to 2050. Proc. Natl. Acad. Sci. USA 2022, 119, e2117297119. [Google Scholar] [CrossRef] [PubMed]
  128. Rodriguez, J.; Hortal, J.; Nieto, M. An evaluation of the influence of environment and biogeography on community structure: The case of Holarctic mammals. J. Biogeogr. 2006, 33, 291–303. [Google Scholar] [CrossRef]
  129. Nieto, M.; Hortal, J.; Martínez-Maza, C.; Morales, J.; Ortiz-Jaureguizar, E.; Pelaez-Campomanes, P.; Pickford, M.; Prado, J.L.; Rodríguez, J.; Senut, B.; et al. Historical Determinants of Mammal Diversity in Africa: Evolution of Mammalian Body Mass Distribution in Africa and South America During Neogene and Quarternary Times. African Biodivers. 2007, 287–295. [Google Scholar] [CrossRef]
  130. Elith, J.; Graham, C.H.; Anderson, R.P.; Dudík, M.; Ferrier, S.; Guisan, A.; Hijmans, R.J.; Huettmann, F.; Leathwick, J.R.; Lehmann, A.; et al. Novel methods improve prediction of species’ distributions from occurrence data. Ecography 2006, 29, 129–151. [Google Scholar] [CrossRef]
  131. Gough, L.; Grace, J.B.; Taylor, K.L. The Relationship between Species Richness and Community Biomass: The Importance of Environmental Variables. Oikos 1994, 70, 271–279. [Google Scholar] [CrossRef]
  132. Hawkins, B.A.; Porter, E.E. Relative influences of current and historical factors on mammal and bird diversity patterns in deglaciated North America. Glob. Ecol. Biogeogr. 2003, 12, 475–481. [Google Scholar] [CrossRef]
  133. Svenning, J.-C.; Skov, F. The relative roles of environment and history as controls of tree species composition and richness in Europe. J. Biogeogr. 2005, 32, 1019–1033. [Google Scholar] [CrossRef]
  134. Montoya, D.; Rodríguez, M.A.; Zavala, M.A.; Hawkins, B.A. Contemporary richness of holarctic trees and the historical pattern of glacial retreat. Ecography 2007, 30, 173–182. [Google Scholar] [CrossRef]
  135. Hortal, J.; Rodríguez, J.; Nieto-Díaz, M.; Lobo, J.M. Regional and environmental effects on the species richness of mammal assemblages. J. Biogeogr. 2008, 35, 1202–1214. [Google Scholar] [CrossRef]
  136. Maestre, F.T.; Escudero, A. Is the patch size distribution of vegetation a suitable indicator of desertification processes? Ecology 2010, 91, 3742–3745. [Google Scholar] [CrossRef]
  137. Ricklefs, R.E.; Latham, R.E.; Qian, H. Global Patterns of Tree Species Richness in Moist Forests: Distinguishing Ecological Influences and Historical Contingency. Oikos 1999, 86, 369. [Google Scholar] [CrossRef]
  138. Willig, M.R.; Kaufman, D.M.; Stevens, R.D. Latitudinal Gradients of Biodiversity: Pattern, Process, Scale, and Synthesis. Annu. Rev. Ecol. Evol. Syst. 2003, 34, 273–309. [Google Scholar] [CrossRef]
  139. Ur Rahman, A.; Khan, S.M.; Ahmad, Z.; Alamri, S.; Hashem, M.; Ilyas, M.; Aksoy, A.; Dülgeroğlu, C.; Shahab Ali, G.K. Impact of multiple environmental factors on species abundance in various forest layers using an integrative modeling approach. Glob. Ecol. Conserv. 2021, 29, e01712. [Google Scholar] [CrossRef]
  140. Kamrani, A.; Jalili, A.; Naqinezhad, A.; Attar, F.; Maassoumi, A.A.; Shaw, S.C. Relationships between environmental variables and vegetation across mountain wetland sites, N. Iran. Biologia 2011, 66, 76–87. [Google Scholar] [CrossRef]
  141. Zhang, X.; Wang, H.; Wang, R.; Wang, Y.; Liu, J. Relationships Between Plant Species Richness and Environmental Factors in Nature Reserves at Different Spatial Scales. Polish J. Environ. Stud. 2017, 26, 2375–2384. [Google Scholar] [CrossRef]
  142. Khan, M.; Khan, S.M.; Ilyas, M.; Alqarawi, A.A.; Ahmad, Z.; Abd Allah, E.F. Plant species and communities assessment in interaction with edaphic and topographic factors, an ecological study of the mount Eelum District Swat, Pakistan. Saudi J. Biol. Sci. 2017, 24, 778–786. [Google Scholar] [CrossRef]
  143. Zhang, H.; Qian, Y.; Wu, Z.; Wang, Z. Vegetation-environment relationships between northern slope of Karlik Mountain and Naomaohu Basin, East Tianshan Mountains. Chinese Geogr. Sci. 2012, 22, 288–301. [Google Scholar] [CrossRef]
  144. Ahmad, Z.; Khan, S.M.; Abd_Allah, E.F.; Alqarawi, A.A.; Hashem, A. Weed species composition and distribution pattern in the maize crop under the influence of edaphic factors and farming practices: A case study from Mardan, Pakistan. Saudi J. Biol. Sci. 2016, 23, 741–748. [Google Scholar] [CrossRef]
  145. Pueyo, Y.; Moret-Fernández, D.; Saiz, H.; Bueno, C.G.; Alados, C.L. Relationships Between Plant Spatial Patterns, Water Infiltration Capacity, and Plant Community Composition in Semi-arid Mediterranean Ecosystems Along Stress Gradients. Ecosystems 2013, 16, 452–466. [Google Scholar] [CrossRef]
  146. Francis, C.D.; Barber, J.R. A framework for understanding noise impacts on wildlife: An urgent conservation priority. Front. Ecol. Environ. 2013, 11, 305–313. [Google Scholar] [CrossRef]
  147. Barber, J.R.; Crooks, K.R.; Fristrup, K.M. The costs of chronic noise exposure for terrestrial organisms. Trends Ecol. Evol. 2010, 25, 180–189. [Google Scholar] [CrossRef] [PubMed]
  148. Shannon, G.; McKenna, M.F.; Angeloni, L.M.; Crooks, K.R.; Fristrup, K.M.; Brown, E.; Warner, K.A.; Nelson, M.D.; White, C.; Briggs, J.; et al. A synthesis of two decades of research documenting the effects of noise on wildlife. Biol. Rev. 2016, 91, 982–1005. [Google Scholar] [CrossRef]
  149. Francis, C.D.; Kleist, N.J.; Ortega, C.P.; Cruz, A. Noise pollution alters ecological services: Enhanced pollination and disrupted seed dispersal. Proc. R. Soc. B Biol. Sci. 2012, 279, 2727–2735. [Google Scholar] [CrossRef]
  150. Slabbekoorn, H.; Peet, M. Birds sing at a higher pitch in urban noise. Nature 2003, 424, 267. [Google Scholar] [CrossRef]
  151. Kern, J.M.; Radford, A.N. Anthropogenic noise disrupts use of vocal information about predation risk. Environ. Pollut. 2016, 218, 988–995. [Google Scholar] [CrossRef]
  152. Kleist, N.J.; Guralnick, R.P.; Cruz, A.; Lowry, C.A.; Francis, C.D. Chronic anthropogenic noise disrupts glucocorticoid signaling and has multiple effects on fitness in an avian community. Proc. Natl. Acad. Sci. USA 2018, 115, E648–E657. [Google Scholar] [CrossRef] [PubMed]
  153. Simpson, S.D.; Radford, A.N.; Nedelec, S.L.; Ferrari, M.C.O.; Chivers, D.P.; McCormick, M.I.; Meekan, M.G. Anthropogenic noise increases fish mortality by predation. Nat. Commun. 2016, 7, 10544. [Google Scholar] [CrossRef] [PubMed]
  154. Senzaki, M.; Kadoya, T.; Francis, C.D. Direct and indirect effects of noise pollution alter biological communities in and near noise-exposed environments. Proc. R. Soc. B Biol. Sci. 2020, 287, 20200176. [Google Scholar] [CrossRef]
  155. Torres-Blas, I.; Horsler, H.; Paredes, U.M.; Perkins, M.; Priestnall, S.L.; Brekke, P. Impact of exposure to urban air pollution on grey squirrel (Sciurus carolinensis) lung health. Environ. Pollut. 2023, 326, 121312. [Google Scholar] [CrossRef] [PubMed]
  156. Calderon-Garciduenas, L.; Maronpot, R.R.; Torres-Jardon, R.; Henriquez-Roldan, C.; Schoonhoven, R.; Acuna-Ayala, H.; Villarreal-Calderon, A.; Nakamura, J.; Fernando, R.; Reed, W.; et al. DNA Damage in Nasal and Brain Tissues of Canines Exposed to Air Pollutants Is Associated with Evidence of Chronic Brain Inflammation and Neurodegeneration. Toxicol. Pathol. 2003, 31, 524–538. [Google Scholar] [CrossRef] [PubMed]
  157. Sicolo, M.; Tringali, M.; Fumagalli, P.; Santagostino, A. Columba livia as a Sentinel Species for the Assessment of Urban Air Genotoxicity. Arch. Environ. Contam. Toxicol. 2010, 59, 484–491. [Google Scholar] [CrossRef] [PubMed]
  158. Richard, F.-J.; Southern, I.; Gigauri, M.; Bellini, G.; Rojas, O.; Runde, A. Warning on nine pollutants and their effects on avian communities. Glob. Ecol. Conserv. 2021, 32, e01898. [Google Scholar] [CrossRef]
  159. Sanderfoot, O.V.; Holloway, T. Air pollution impacts on avian species via inhalation exposure and associated outcomes. Environ. Res. Lett. 2017, 12, 083002. [Google Scholar] [CrossRef]
  160. Peach, W.J.; Mallord, J.W.; Ockendon, N.; Orsman, C.J.; Haines, W.G. Depleted suburban house sparrow Passer domesticus population not limited by food availability. Urban Ecosyst. 2018, 21, 1053–1065. [Google Scholar] [CrossRef]
  161. Reich, P.B.; Amundson, R.G. Ambient Levels of Ozone Reduce Net Photosynthesis in Tree and Crop Species. Science 1985, 230, 566–570. [Google Scholar] [CrossRef]
  162. Lu, S.; Yang, X.; Li, S.; Chen, B.; Jiang, Y.; Wang, D.; Xu, L. Effects of plant leaf surface and different pollution levels on PM2.5 adsorption capacity. Urban For. Urban Green. 2018, 34, 64–70. [Google Scholar] [CrossRef]
  163. Anand, P.; Mina, U.; Khare, M.; Kumar, P.; Kota, S.H. Air pollution and plant health response-current status and future directions. Atmos. Pollut. Res. 2022, 13, 101508. [Google Scholar] [CrossRef]
  164. Likens, G.E. Acid Rain. In Fundamentals of Ecosystem Science; Elsevier: Amsterdam, The Netherlands, 2021; pp. 293–299. ISBN 9780128127629. [Google Scholar]
  165. Diatta, J.; Youssef, N.; Tylman, O.; Grzebisz, W.; Markert, B.; Drobek, L.; Wünschmann, S.; Bebek, M.; Mitko, K.; Lejwoda, P. Acid rain induced leakage of Ca, Mg, Zn, Fe from plant photosynthetic organs–Testing for deciduous and dicotyledons. Ecol. Indic. 2021, 121, 107210. [Google Scholar] [CrossRef]
  166. Kumar, S. Acid Rain-The Major Cause of Pollution: Its Causes, Effects. Int. J. Appl. Chem. 2017, 13, 53–58. [Google Scholar]
  167. World Health Organization. Tripartite and Unep Support OHHLEP’s Definition of “One Health”; WHO: Geneva, Switzerland, 2021. [Google Scholar]
  168. Kaswa, R.; Von Pressentin, K.; Nair, A.; Murphy, S. One World, One Health: A growing need for an integrated global health approach. South African Fam. Pract. 2023, 65, a5693. [Google Scholar] [CrossRef]
  169. Alikhani, S.; Nummi, P.; Ojala, A. Urban Wetlands: A Review on Ecological and Cultural Values. Water 2021, 13, 3301. [Google Scholar] [CrossRef]
  170. Krivtsov, V.; Forbes, H.; Birkinshaw, S.; Olive, V.; Chamberlain, D.; Buckman, J.; Yahr, R.; Arthur, S.; Christie, D.; Monteiro, Y.; et al. Ecosystem services provided by urban ponds and green spaces: A detailed study of a semi-natural site with global importance for research. Blue-Green Syst. 2022, 4, 1–23. [Google Scholar] [CrossRef]
  171. Theodoridou, I.; Papadopoulos, A.M.; Hegger, M. A typological classification of the Greek residential building stock. Energy Build. 2011, 43, 2779–2787. [Google Scholar] [CrossRef]
  172. Perez, J.; Fusco, G.; Araldi, A.; Fuse, T. Building Typologies for Urban Fabric Classification: Osaka and Marseille Case Studies. In Proceedings of the International Conference on Spatial Analysis and Modeling (SAM), hal-02176599, Tokyo, Japan, 18 September 2018. [Google Scholar]
  173. Ibrahim, H.S.S.; Khan, A.Z.; Attia, S.; Serag, Y. Classification of Heritage Residential Building Stock and Defining Sustainable Retrofitting Scenarios in Khedivial Cairo. Sustainability 2021, 13, 880. [Google Scholar] [CrossRef]
  174. Jackson, H.M. Habitat Management Methods Literature Review and Evaluation November 2007; Snohomish County PUD: Everett, WA, USA, 2007. [Google Scholar]
  175. Canepa, M.; Mosca, F.; Barath, S.; Changenet, A.; Hauck, T.E.; Ludwig, F.; Pianta, M.; Roccotiello, E.; Selvan, S.U.; Vogler, V.; et al. ECOLOPES, Beyond Greening: A multi-species approach for urban design. AGATHÓN—Int. J. Archit. Art Des. 2022, 11, 238–245. [Google Scholar]
  176. Bocedi, G.; Palmer, S.C.F.; Pe’er, G.; Heikkinen, R.K.; Matsinos, Y.G.; Watts, K.; Travis, J.M.J. RangeShifter: A platform for modelling spatial eco-evolutionary dynamics and species’ responses to environmental changes. Methods Ecol. Evol. 2014, 5, 388–396. [Google Scholar] [CrossRef]
  177. Boulangeat, I.; Damien, G.; Wilfried, T. FATE-HD: A spatially and temporally explicit integrated model for predicting vegetation structure and diversity at regional scale. Glob. Chang. Biol. 2014, 20, 2368–2378. [Google Scholar] [CrossRef]
  178. An, L. Modeling human decisions in coupled human and natural systems: Review of agent-based models. Ecol. Modell. 2012, 229, 25–36. [Google Scholar] [CrossRef]
  179. Macy, M.W.; Willer, R. From Factors to Actors: Computational Sociology and Agent-Based Modeling. Annu. Rev. Sociol. 2002, 28, 143–166. [Google Scholar] [CrossRef]
  180. Berger, T.; Schreinemachers, P.; Woelcke, J. Multi-agent simulation for the targeting of development policies in less-favored areas. Agric. Syst. 2006, 88, 28–43. [Google Scholar] [CrossRef]
  181. Hérault, B.; Honnay, O. Using life-history traits to achieve a functional classification of habitats. Appl. Veg. Sci. 2007, 10, 73–80. [Google Scholar] [CrossRef]
  182. ENVI-met GmbH. High-Resolution 3D Modeling of Urban Microclimate with Envi-Met Software; ENVI-met GmbH: Essen, Germany, 2023. [Google Scholar]
  183. Roudsari, M.S.; Pak, M. Ladybug: A parametric environmental plugin for grasshopper to help designers create an environmentally-conscious design. In Proceedings of the BS 2013: 13th Conference of the International Building Performance Simulation Association, Chambéry, France, 25–28 August 2013; pp. 3128–3135. [Google Scholar]
  184. Arp, R.; Smith, B.; Spear, A.D. Building Ontologies with Basic Formal Ontology; MIT Press: Cambridge, MA, USA, 2015; ISBN 9780262527811. [Google Scholar]
  185. Deutschewitz, K.; Lausch, A.; Kühn, I.; Klotz, S. Native and alien plant species richness in relation to spatial heterogeneity on a regional scale in Germany. Glob. Ecol. Biogeogr. 2003, 12, 299–311. [Google Scholar] [CrossRef]
  186. Schmidt, K.J.; Poppendieck, H.H.; Jensen, K. Effects of urban structure on plant species richness in a large European city. Urban Ecosyst. 2014, 17, 427–444. [Google Scholar] [CrossRef]
  187. Kent, M.; Stevens, R.A.; Zhang, L. Urban plant ecology patterns and processes: A case study of the flora of the City of Plymouth, Devon, U.K.J. Biogeography 1999, 26, 1281–1298. [Google Scholar] [CrossRef]
  188. McKinney, M.L. Effects of urbanization on species richness: A review of plants and animals. Urban Ecosyst. 2008, 11, 161–176. [Google Scholar] [CrossRef]
Figure 1. Proposed relationships between human and non-human design objectives towards the realization of multi-species building design.
Buildings 14 00250 g001
Figure 2. Diagram of the four stakeholders and the common ground of KPIs between them through the multi-species design. The common ground defines the synergies and trade-offs between them.
Buildings 14 00250 g002
Figure 3. Thresholds that define specific KPI relevant for each stakeholder and the ‘common ground’ between proposed anthropocentric-ecocentric relationships within the urban environment.
Buildings 14 00250 g003
Figure 4. View of a ‘nested hierarchy’ trade-off example (top) and a ‘nested hierarchy’ synergy example (bottom). The top figure has already been published in (Selvan et al. 2023) [69].
Buildings 14 00250 g004
Figure 5. A schematic example of the architectural geometry of the building envelopes in relation to floor height and surface openings (windows—blue colour), as well as the soil volume (brown colour) and FG abundance (green colour).
Buildings 14 00250 g005
Figure 6. Comparison between the highest- and lowest-performing optimized design alternatives. Solar radiation values are depicted from the lowest (blue) to the highest (red) values. The figures were previously published in (Selvan et al. 2023) [69].
Buildings 14 00250 g006
Table 1. Proposed examples of the relationships formed between the proposed envelope design and the four stakeholders. The greyed-out selections refer to the specific stakeholders that the KPI conditions describe. The direction that the KPI refers to is relative and may differ according to the properties of the stakeholders.
ObjectivesKPI ThemesKPI Measures
Abiotic Conditions
Achieve min. heating—cooling loads (humans)
Improve thermal comfort (humans)
TemperatureOutdoor Air (°C)
Façade inclination (degrees)
Improve water and soil management (all stakeholders)
Maximize suitable area for plant colonization (animals, plants)
Upgrade green infrastructure (all stakeholders)
Provide grey water technologies (humans)
HumidityRelative/Absolute (%)
Precipitation and RainfallWater quantity on the façade (cm)
Water
Retention
Water quantity (cm)
Façade inclination (degrees)
Enhance thermal comfort (humans)
Achieve max-min solar radiation (winter/summer) (humans)
Enhance plant growth (all stakeholders)
Solar
Radiation
Shading %
Direct solar radiation (W/m2)
Façade inclination (degrees)
Provide wind comfort (all stakeholders)
Complement natural ventilation (humans)
Wind SpeedAir Velocity (m/s)
Wind direction (orientation)
Enhance natural daylighting (all stakeholders)
Enhance visual comfort (humans)
Lighting and GlareDaylighting/Shading (%)
Enhance thermal comfort (humans)
Enhance acoustic comfort (animals, humans)
Maximize area for plant colonization (animals, plants)
Soil VolumeVolume (cubic meters
or liters)
Noise Levels
Provide acoustic comfort—noise reduction (animals, humans)Noise LevelsNoise levels (dB)
Air Quality
Improve air quality through vegetation (animals, humans)
Upgrade air pollution mitigation strategies (animals, humans)
Upgrade green infrastructure against air-pollution (all stakeholders)
Air Quality Particulate matter (PM2.5)
Psychology and Well-being
Strengthen experiences with natural environments (humans)Proximity to
nature
Green % on building
Building Design & Construction
Improve species connectivity (animals, plants, microbiota)
Enhance plant colonization (animals, plants, microbiota)
Provide Self-sustaining structure (humans)
Blur natural/artificial boundaries (all stakeholders)
Material
Properties
Green % on building
Building height
Disclaimer/Publisher’s Note: The statements, opinions and data contained in all publications are solely those of the individual author(s) and contributor(s) and not of MDPI and/or the editor(s). MDPI and/or the editor(s) disclaim responsibility for any injury to people or property resulting from any ideas, methods, instructions or products referred to in the content.

