Article

Structural Behavior of a Fixed-End Arched Cellular Steel Beam without Lateral Support

1
School of Civil Engineering and Architecture, Henan University of Science and Technology, Luoyang 471023, China
2
School of Civil Engineering, Xi’an University of Architecture & Technology, Xi’an 710055, China
3
School of Architectural Engineering, Xi’an Technological University, Xi’an 710021, China
*
Author to whom correspondence should be addressed.
These authors are the co-first authors of this paper.
Buildings 2024, 14(1), 229; https://doi.org/10.3390/buildings14010229
Submission received: 15 December 2023 / Revised: 2 January 2024 / Accepted: 4 January 2024 / Published: 15 January 2024
(This article belongs to the Section Building Structures)

Abstract

:
The arched cellular beam has the advantages of both the solid-web arch and the straight beam with web opening, and has become increasingly admired by architects in recent years. In this paper, four arched cellular beam specimens are designed using an orthogonal test method (OTM) with a three-factor and two-level approach. Firstly, the static loading test is carried out to analyze the mechanical response of the arched cellular beam under concentrated load. Then, a numerical analysis based on ABAQUS finite element (FE) software is carried out. The results show that the simulation results agree well with the test results, which indicates the accuracy of the simulation analysis method. Finally, the buckling load of the arched cellular beam under three different loads is calculated using the variable parameter FE analysis. Combined with the range analysis in the OTM, the influence of the target factor on the buckling load of the arched cellular beam is determined. The results show that the order of the factors affecting the out-of-plane elastic buckling is rise–span ratio > web height–thickness ratio > diameter–depth ratio.

1. Introduction

Horizontal thrust force is generated at the foot of an arch under external loads. Horizontal thrust force converts the moment generated under external loads into axial pressure along the arch axial direction, resulting in less moment and shear force in the arch cross-section. Therefore, the steel arch structure can fully exert the tensile properties of steel and meet the requirements of a high bearing capacity and long-span spatial structure [1,2,3,4]. Compared with a solid-web beam, the increase in sectional height of a cellular beam greatly increases the moment of inertia and improves the flexural bearing capacity and stiffness significantly. Meanwhile, a cellular steel beam is lightweight and aesthetic, and the holes in its web plate make it easy to lay pipes and wires, thus improving the usage space of a building [5,6,7,8,9]. An arched cellular beam has the advantages of both a cellular straight beam and a solid-web arch, and can not only realize the stable bearing system of a long-span structure, but also save steel [10,11,12].
Regarding the stability of an arch, domestic and foreign scholars studying the in-plane elastic buckling load are mainly focused on theoretical research. In 1910, the elastic buckling load formula of a circular two-hinged arch under uniform compression was derived using the equilibrium method, which laid a theoretical foundation for the development of the steel arch [13]. In the study of Timoshenko, the stability of a circular arch with fixed ends is studied via the changing of the boundary conditions of the arch foot, and the critical load formula of the circular arch is deduced [14]. Based on theoretical research, scholars began to carry out experimental research on circular arches under concentrated load at the mid-span position. Stissi, Austin, and other scholars conducted experimental research on the in-plane buckling of a parabolic arch under non-uniform compression [15]. Pi and Bradford studied the lateral torsional buckling of thin-walled steel arches with lateral support under concentrated load in the mid-span [16]. With the development and popularization of computer technology, scholars began to use the FE method to simulate the mechanical properties of an arch under various specific conditions. The effects of coupled expansion, bending, torsion, non-uniform deformation, and shear deformation on an arch were analyzed using the FE method [17,18,19]. The results showed that the analog equation method (AEM) model had a higher accuracy than the ordinary shell element model [20]. Guo et al. [21] and Dou et al. [22] analyzed the inelastic flexural–torsional buckling response of steel arches under symmetric and asymmetric loading based on experiments and finite element analyses.
Since the application of the cellular beam in engineering, scholars have carried out many studies on its performance. The main factors studied include the support boundary conditions of the cellular beam, the form of the hole, the form of support, the load type, residual stress, and web shear deformation [23,24,25,26,27]. The buckling modes, such as global lateral torsional buckling, distortional buckling, and web local buckling, are studied in detail [28]. For example, Gholizadeh et al. studied the local buckling on the web of a simply supported cellular beam, and simulated the ultimate bearing capacity and failure mode of the simply supported cellular beam with a nonlinear finite element (FE) model [29]. Daryan and other scholars studied the performance of lateral torsional buckling and web local buckling of simply supported cellular beams through experiments and the FE method [30]. Martin et al. studied the bearing capacity of cellular beams with sinusoidal wave holes [31]. In addition, some scholars have studied the fire resistance of cellular steel beams in detail [32,33].
In conclusion, the existing research on the out-of-plane stability of steel arches mostly focuses on the elastic buckling of solid arches under uniform compression and uniform bending. There are few analyses under other load conditions, and most of them study two-hinged arches. In practical engineering, the application of arched beams with fixed ends still exists. The research results of out-of-plane elastic–plastic behavior of a solid-web steel arch and a steel arch with a web opening are different, and they are only applicable to the case where there is enough effective support outside the arch. In addition, most scholars use finite element simulation to study the overall stability of a cellular beam, but most of their numerical simulations are in the elastic stage, and simulations of the elastic–plastic stage are few.
In this paper, the orthogonal test method with a three-factor and two-level approach is used to design four cellular arch specimens for a static loading test, and the mechanical response of a fixed-end arched cellular beam under a concentrated load of an arch roof is analyzed. The variable parameter analysis of the cellular arch is carried out using the FE method, and the buckling load of the cellular beam under three different loads is calculated. Combined with the range analysis of the orthogonal test method (OTM), the influence of the target factors on the buckling load of the arch cellular beam is determined, and the optimal combination of the factors is obtained. In short, this paper is a useful supplement to the research content of an arched cellular beam, and it is also of great significance to promote the development and application of an arched cellular beam in practical engineering.

2. Experimental Program

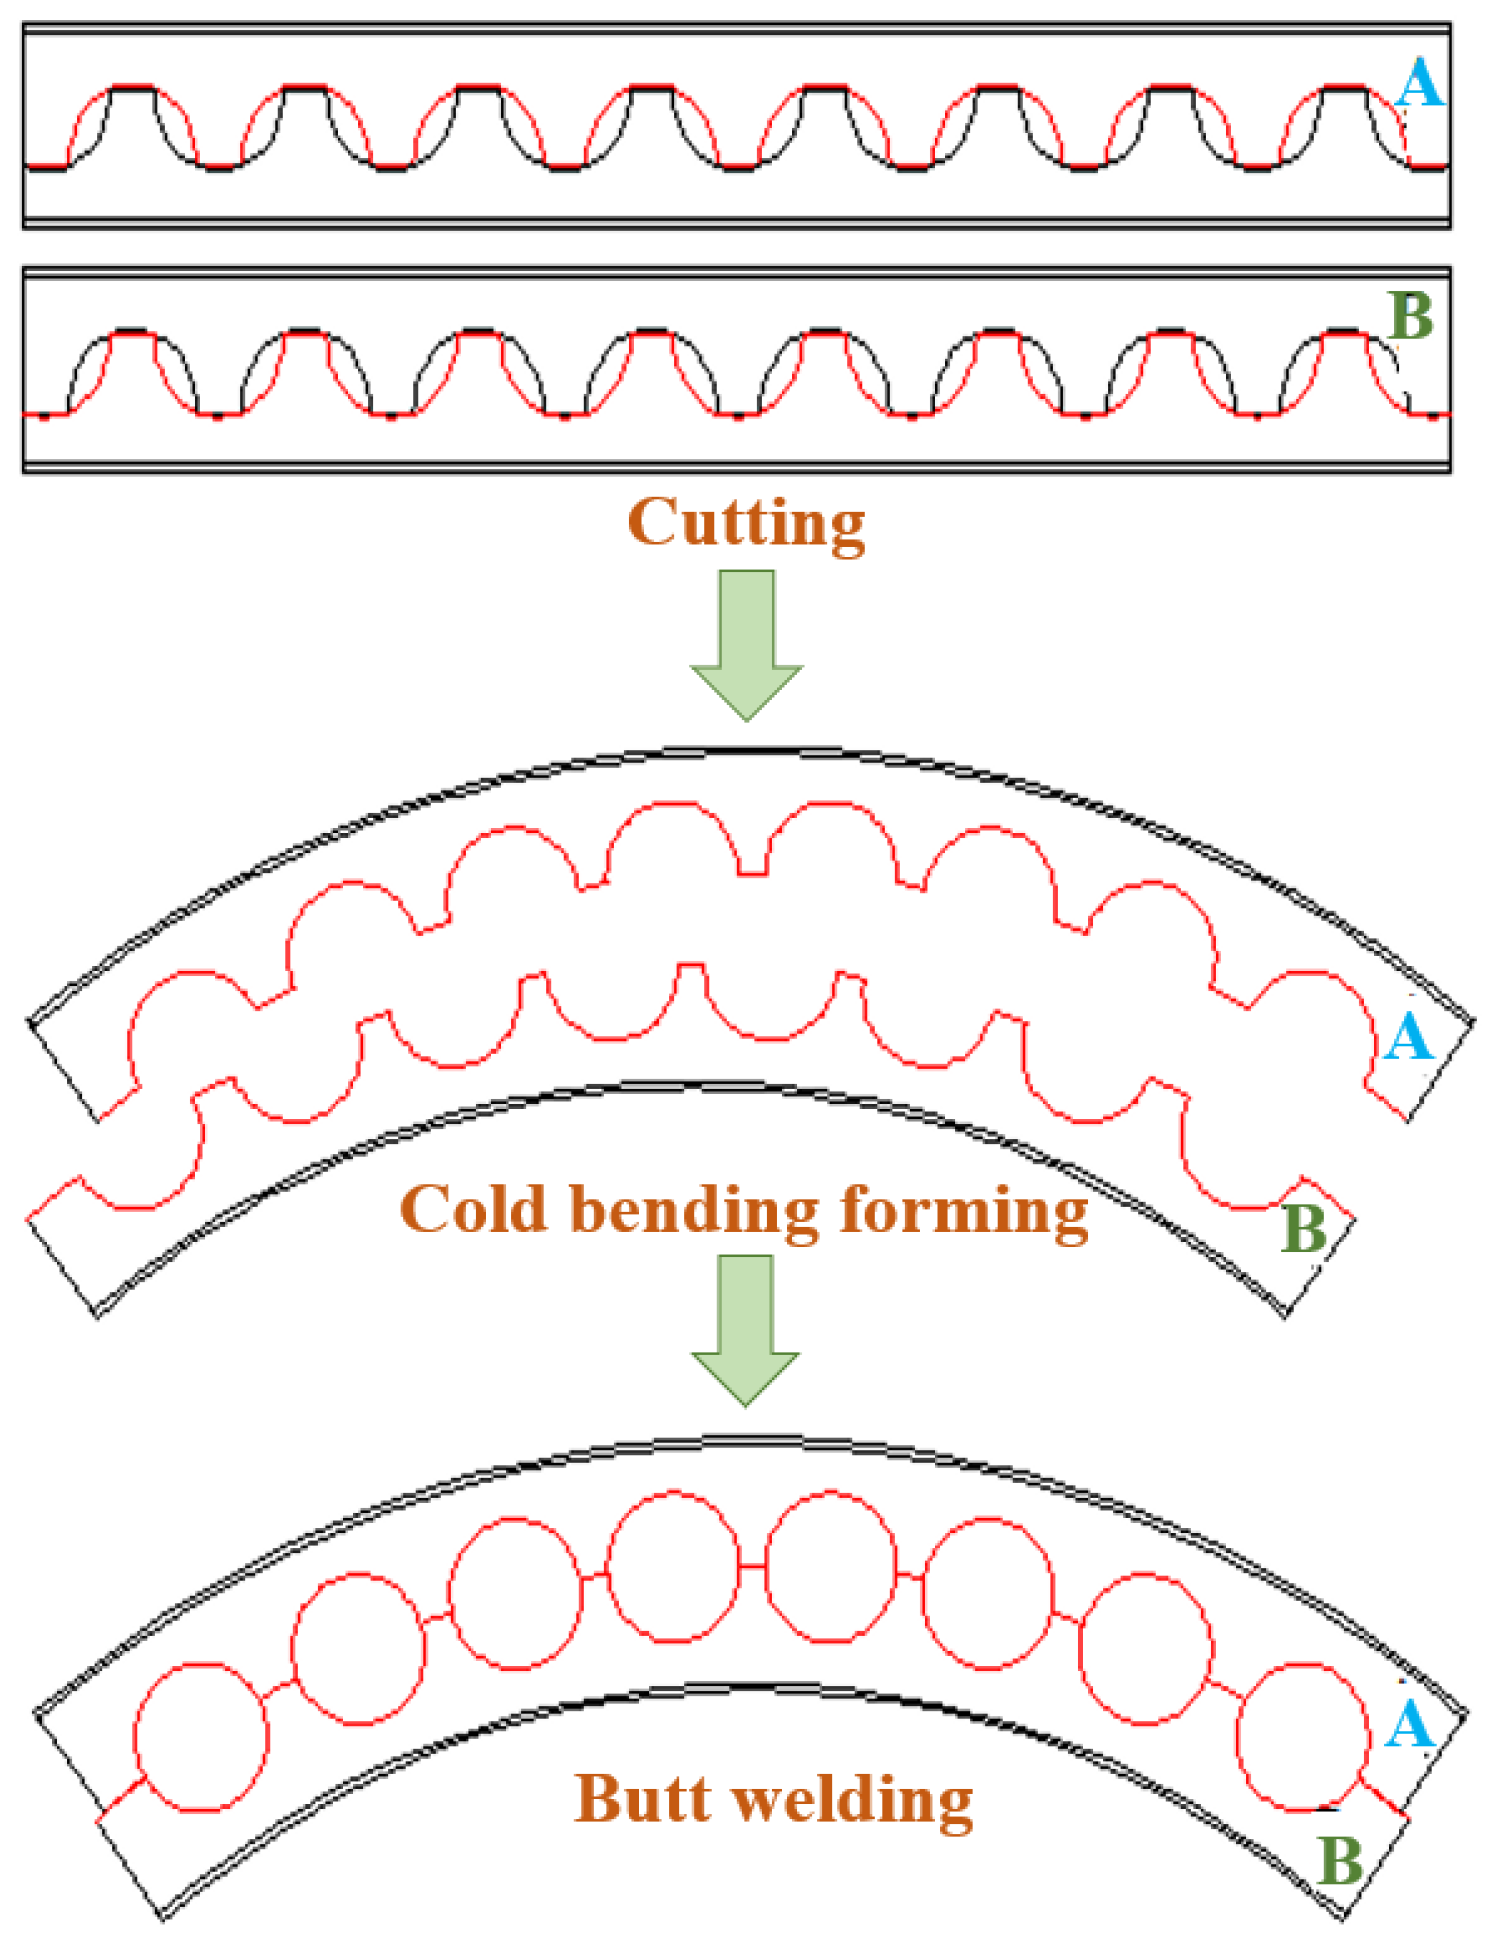
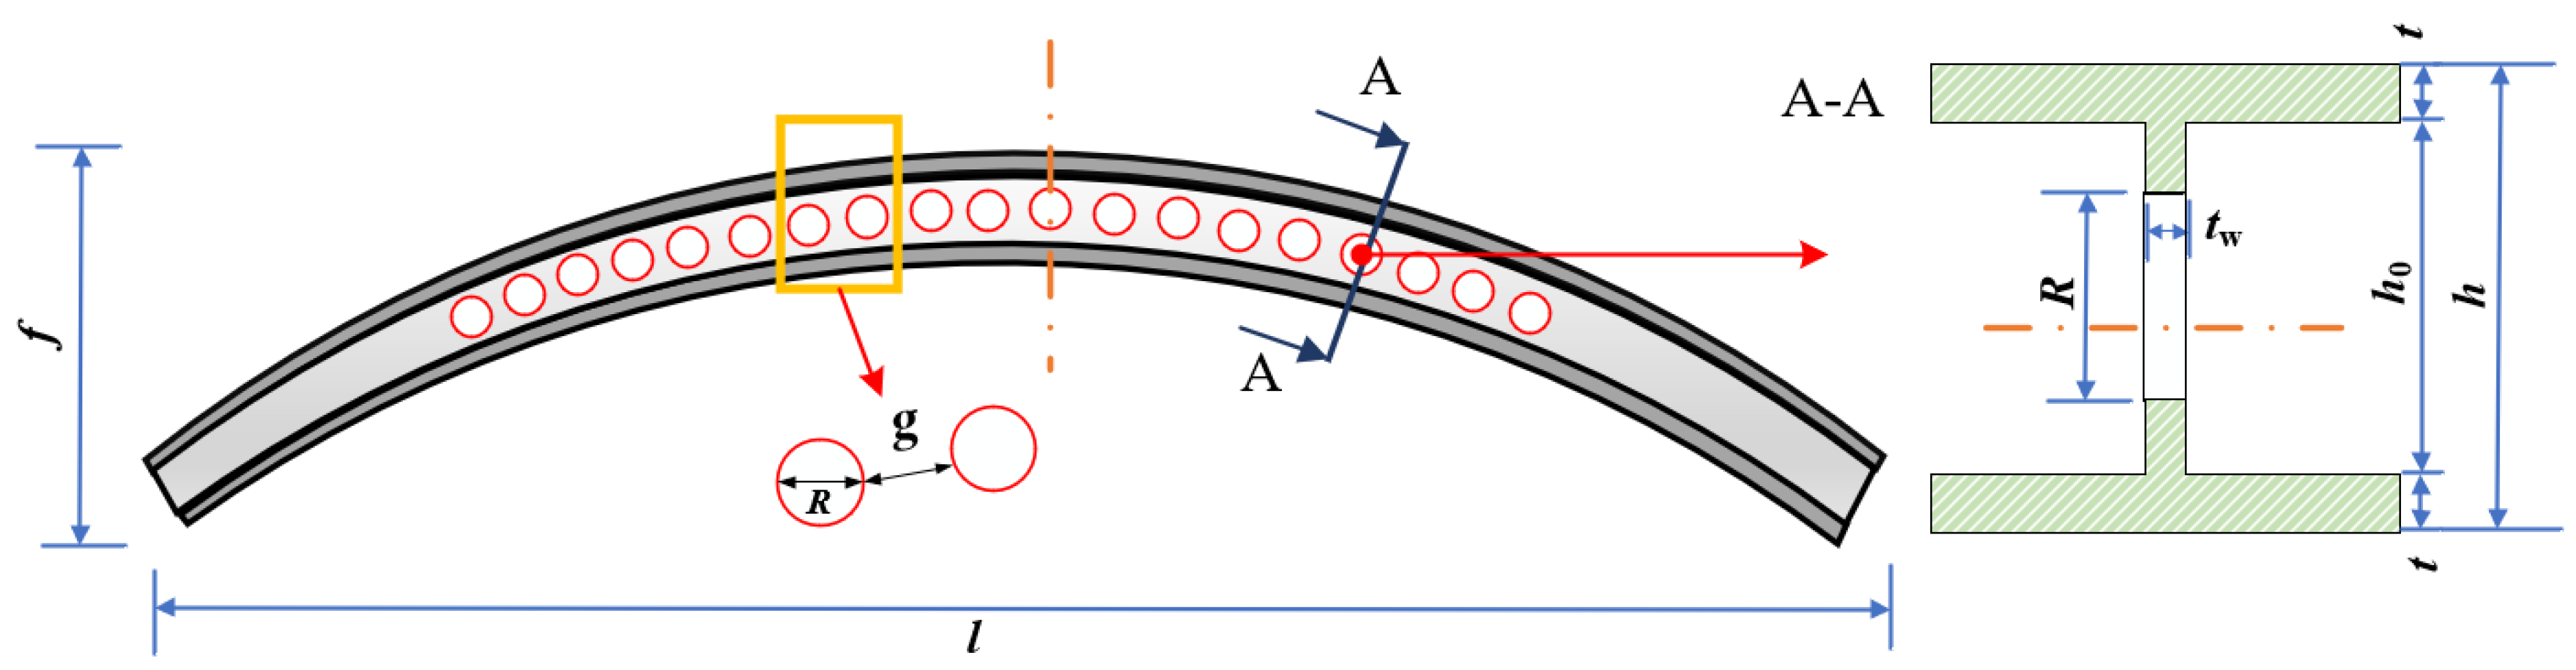
2.1. Fabrication of Arched Cellular Beam

The processing methods of a web opening structure include the direct hole-forming method and the dislocation welding method. The direct hole-forming method is formed by stamping or cutting directly on the web of the component. The advantage of this method is that the process is simple and fast, avoiding the residual stress generated during welding, and the hole size is more accurate and regular. However, this method causes a waste of steel and is not economical. The dislocation hole-forming method means to cut along the pre-designed path on the web first, and then to carry out dislocation welding [34,35,36]. Compared with the direct drilling method, this method saves a significant amount of material. The circular hole avoids the problem of angular stress concentration of the regular polygon hole. It is more in line with the requirements of convenient circular pipe laying, and the spatial effect is more beautiful. Therefore, in this paper, the circular hole arch cellular beam was processed using the dislocation welding method. Firstly, according to the calculated curve, the upper and lower parts of A and B were cut out, and then the two parts were cold-formed, misaligned to form a circular hole, and then welded. The production process is shown in Figure 1.

2.2. Specimen Description

OTM is a design method for studying in a multi-factor and multi-level fashion. It selects some representative points from the comprehensive test according to the orthogonality. These representative points have the characteristics of uniform dispersion and neat comparability. The OTM is an efficient, fast, and economical experimental design method that replaces the comprehensive test with partial tests. The level combination selected by the orthogonal test is listed in tables called orthogonal tables. The three variation factors of this test are web thickness, tw; hole diameter, R; and arch rise–span ratio, f/l, and the orthogonal parameters of the experiment are shown in Table 1. According to the "Technical Specification for Arched Steel Structures" (JGJ/T 249-2011) [37], the local stability of steel arch members with openings in the web should meet the following criteria: the radius of the circular hole should be 0.5 < 2r/h0 < 0.7, and the hole spacing g should not be less than h0/3. The four specimens are made of Q345 I-shaped steel with apertures in the web. The geometric details of the test specimens are presented in Table 2 and Figure 2. In the table and figure, h, h0, b, tw, t, R, g, l, and f represent the beam height, web height, flange width, web thickness, flange thickness, hole diameter, hole spacing, arch span, and height, respectively.

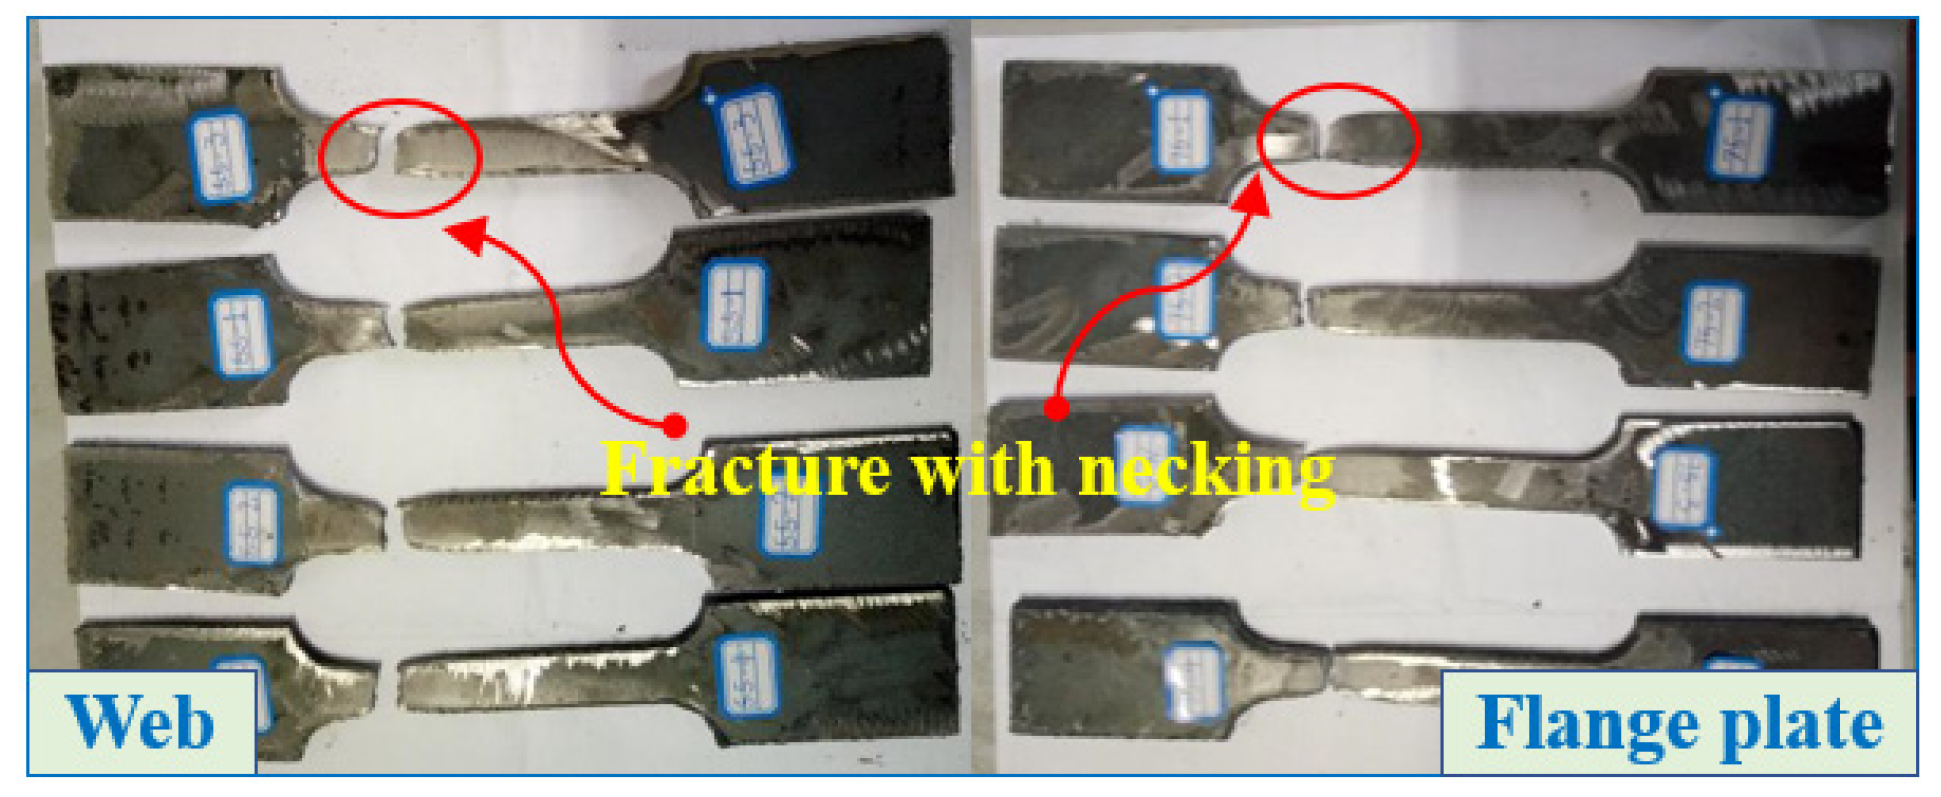
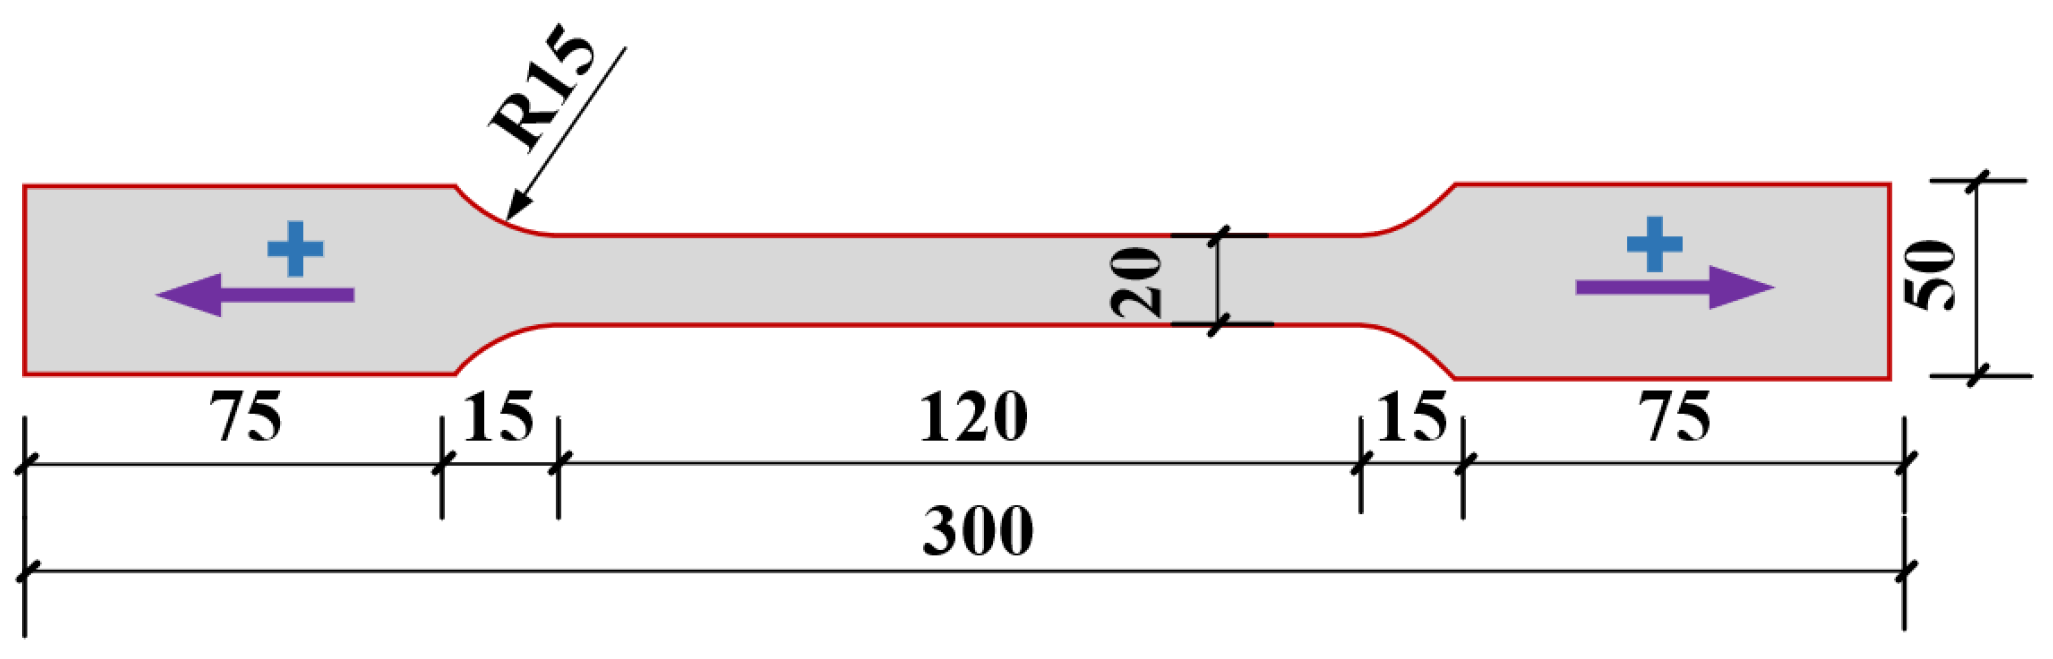
2.3. Material Properties

In order to determine the material properties of the steel plates used in the test specimens, four tensile coupons were cut from the 5.5-mm- and 7.5-mm-thick web and flange plates, respectively. The sample preparation complies with the relevant regulations in "Metallic materials tensile test-room temperature test method” (GB/T228.1-2010) [38]. The processing parameters of the coupons are shown in Figure 3. A servo-controlled hydraulic test machine was used to conduct the experiments. The load was measured using a force transducer, and the test setup is shown in Figure 4. The fracture surfaces of four broken specimens are shown in Figure 5, and the test results are presented in Table 3. The test results indicate that the strength of the steel meets the test requirements, and the results can be utilized in the FE model.

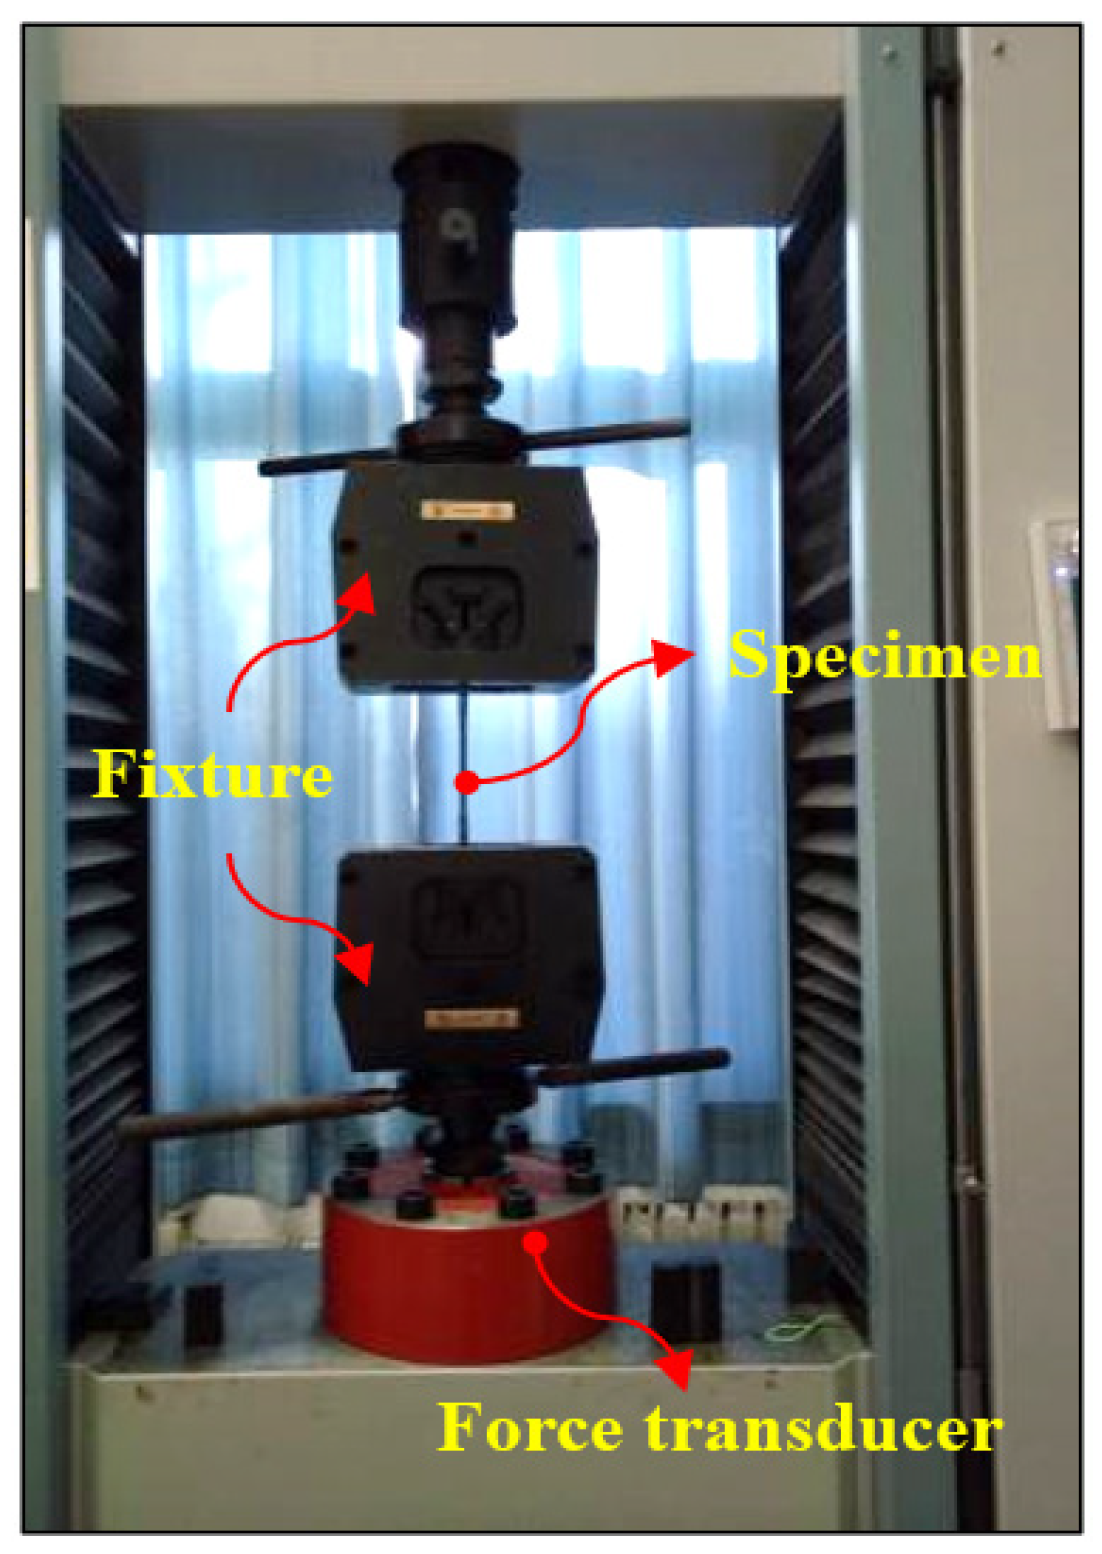
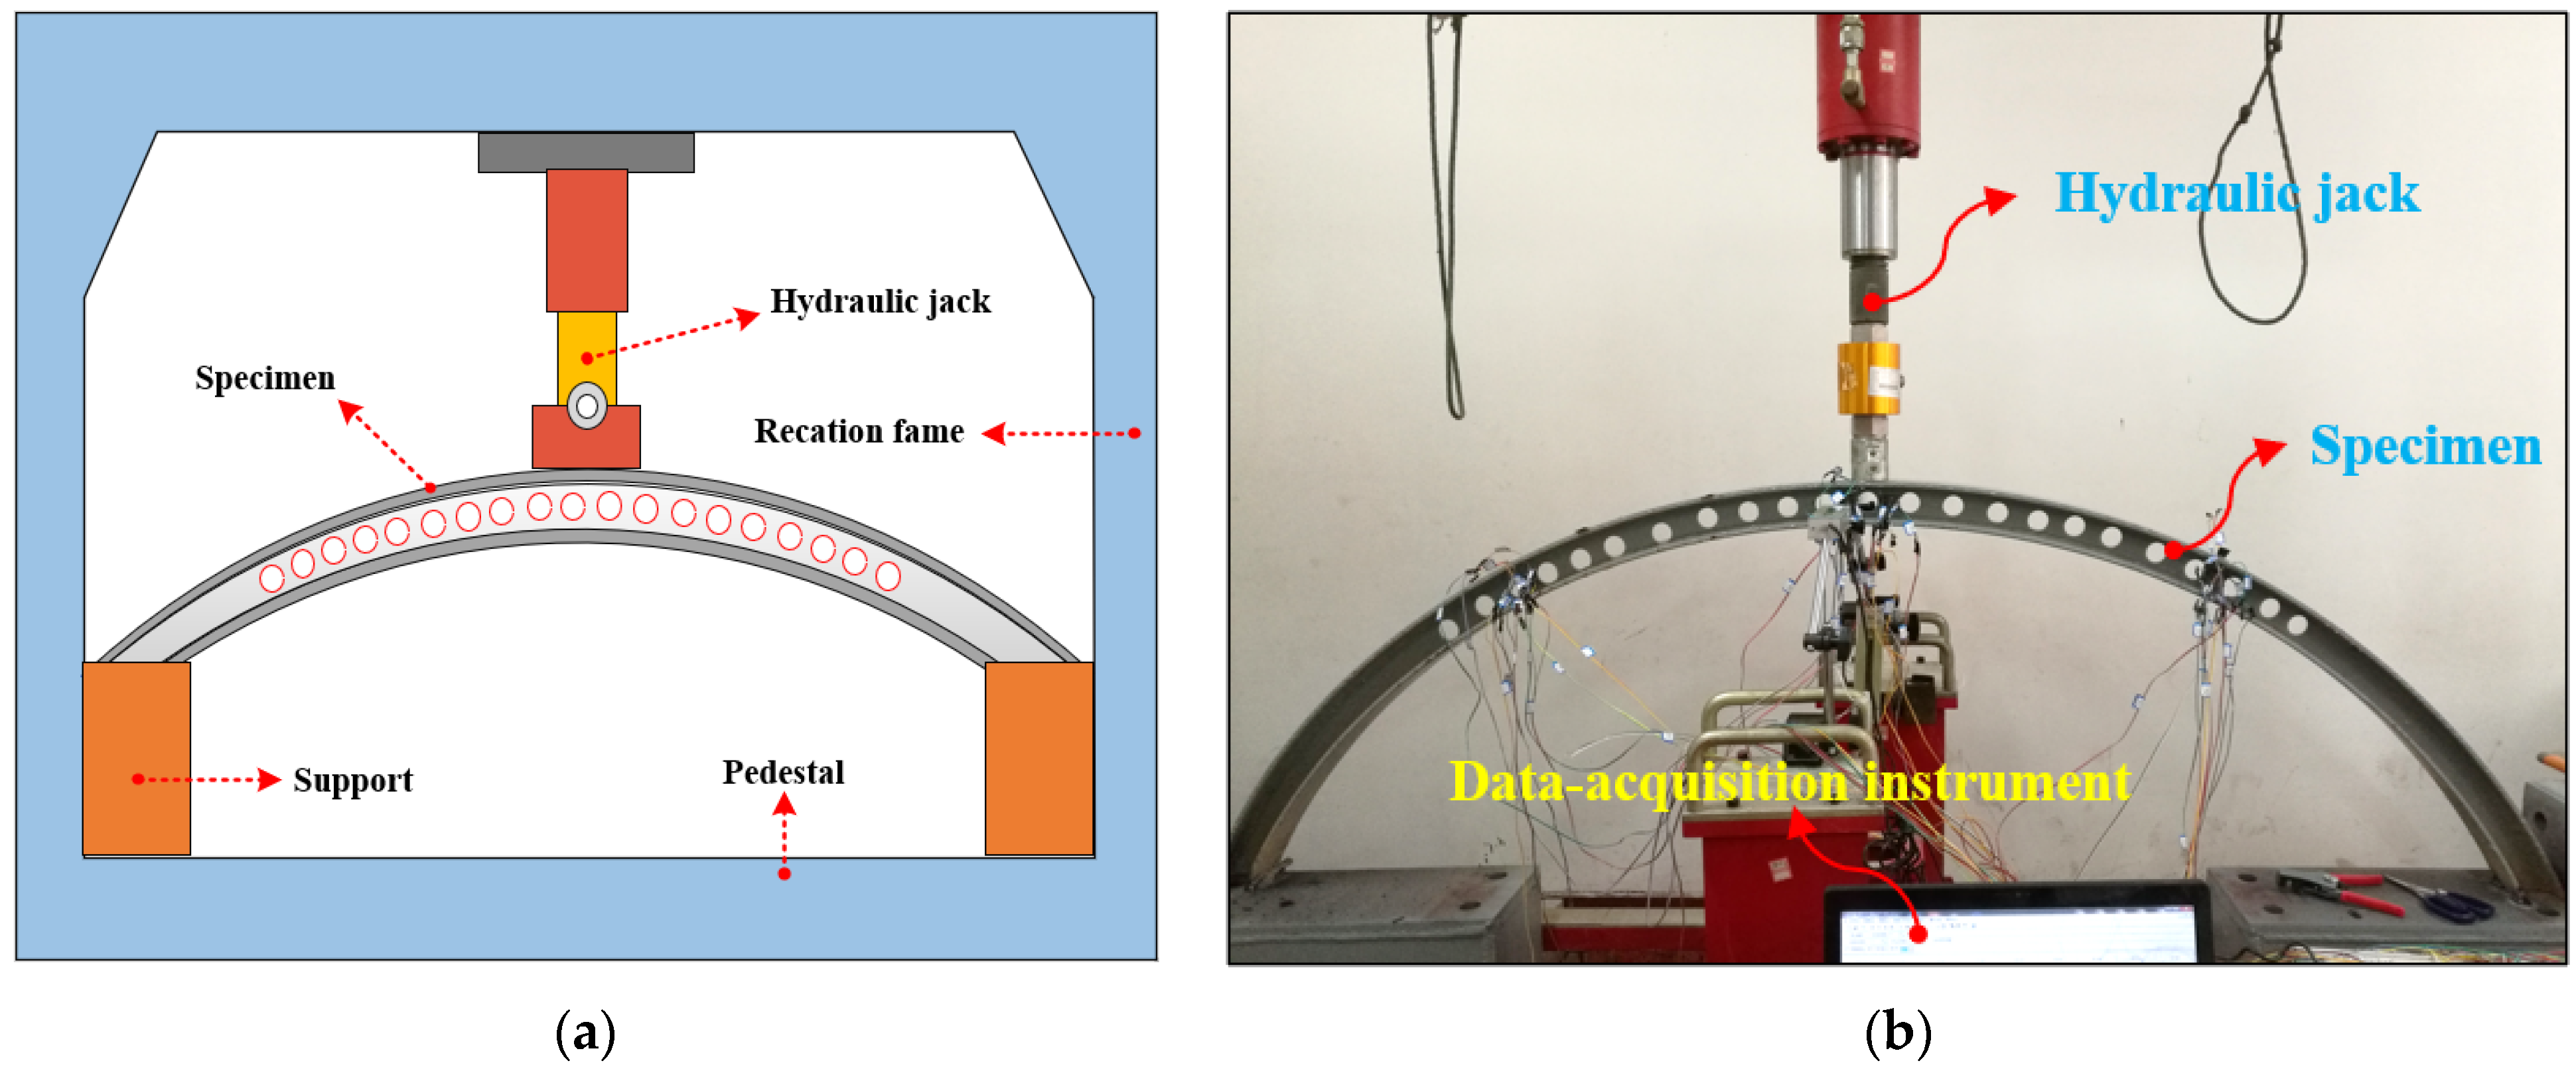
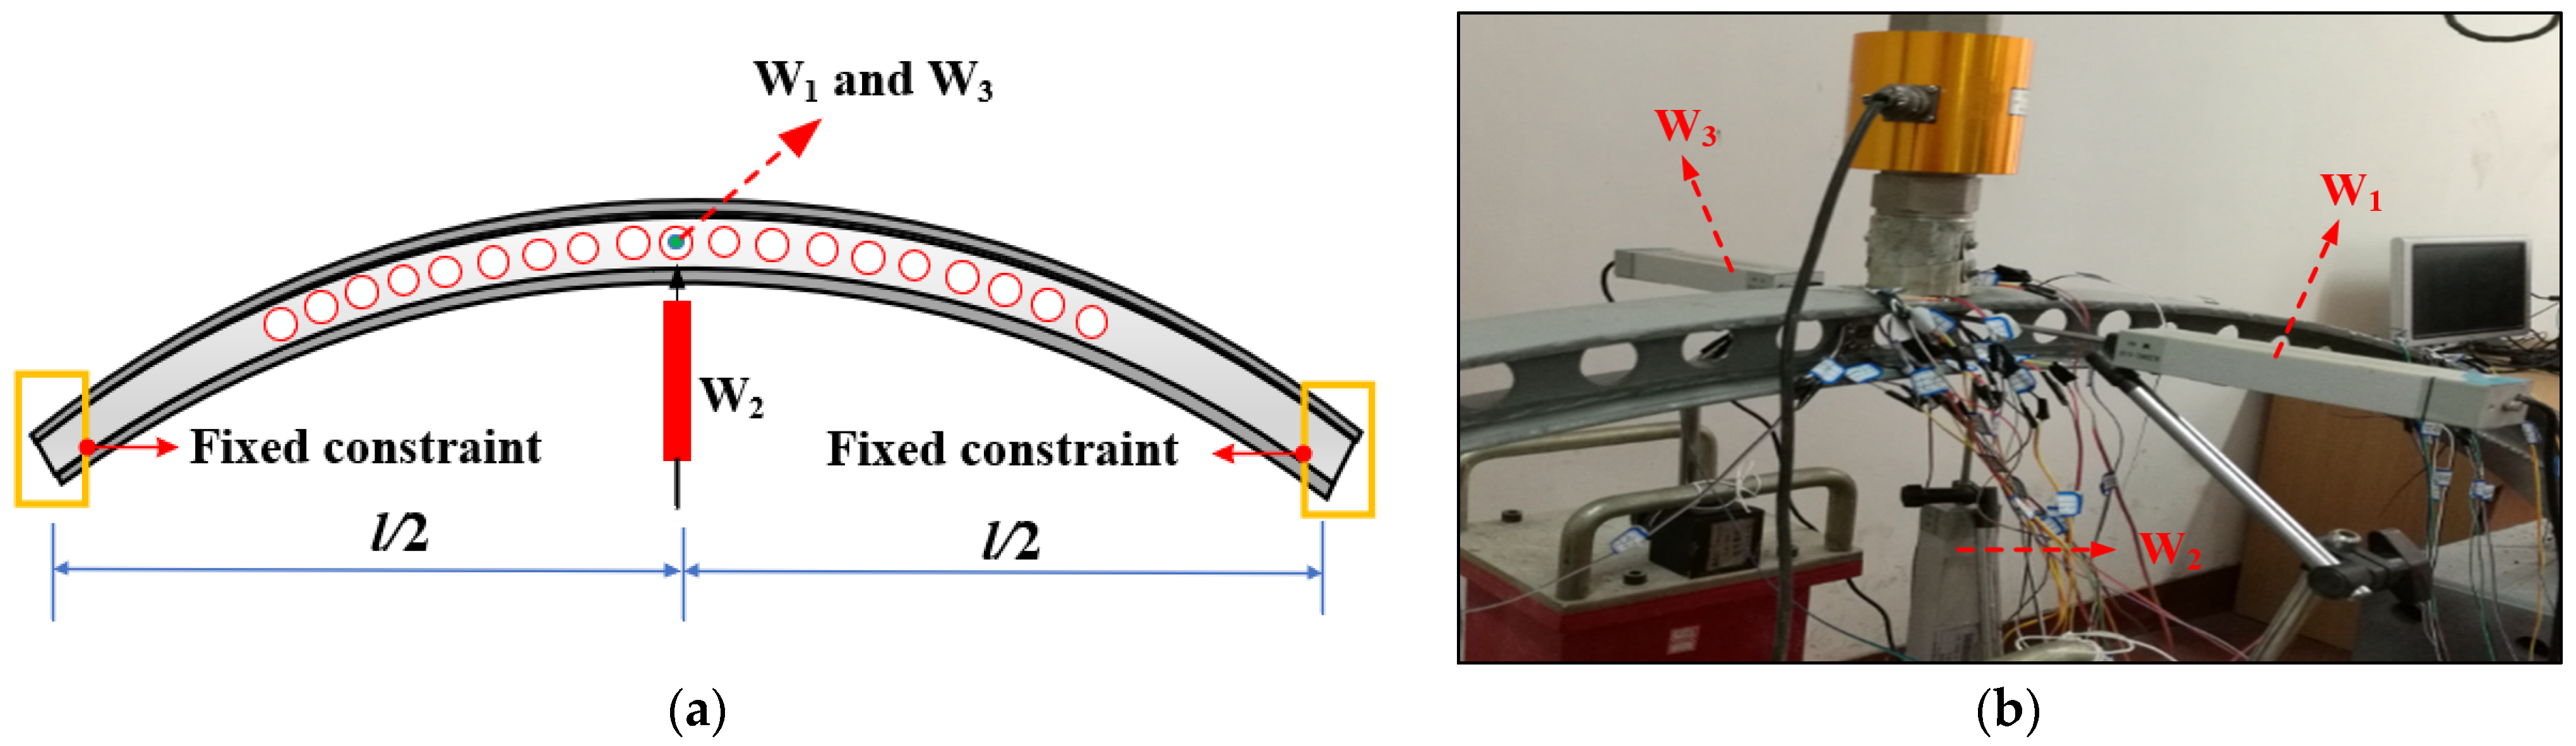
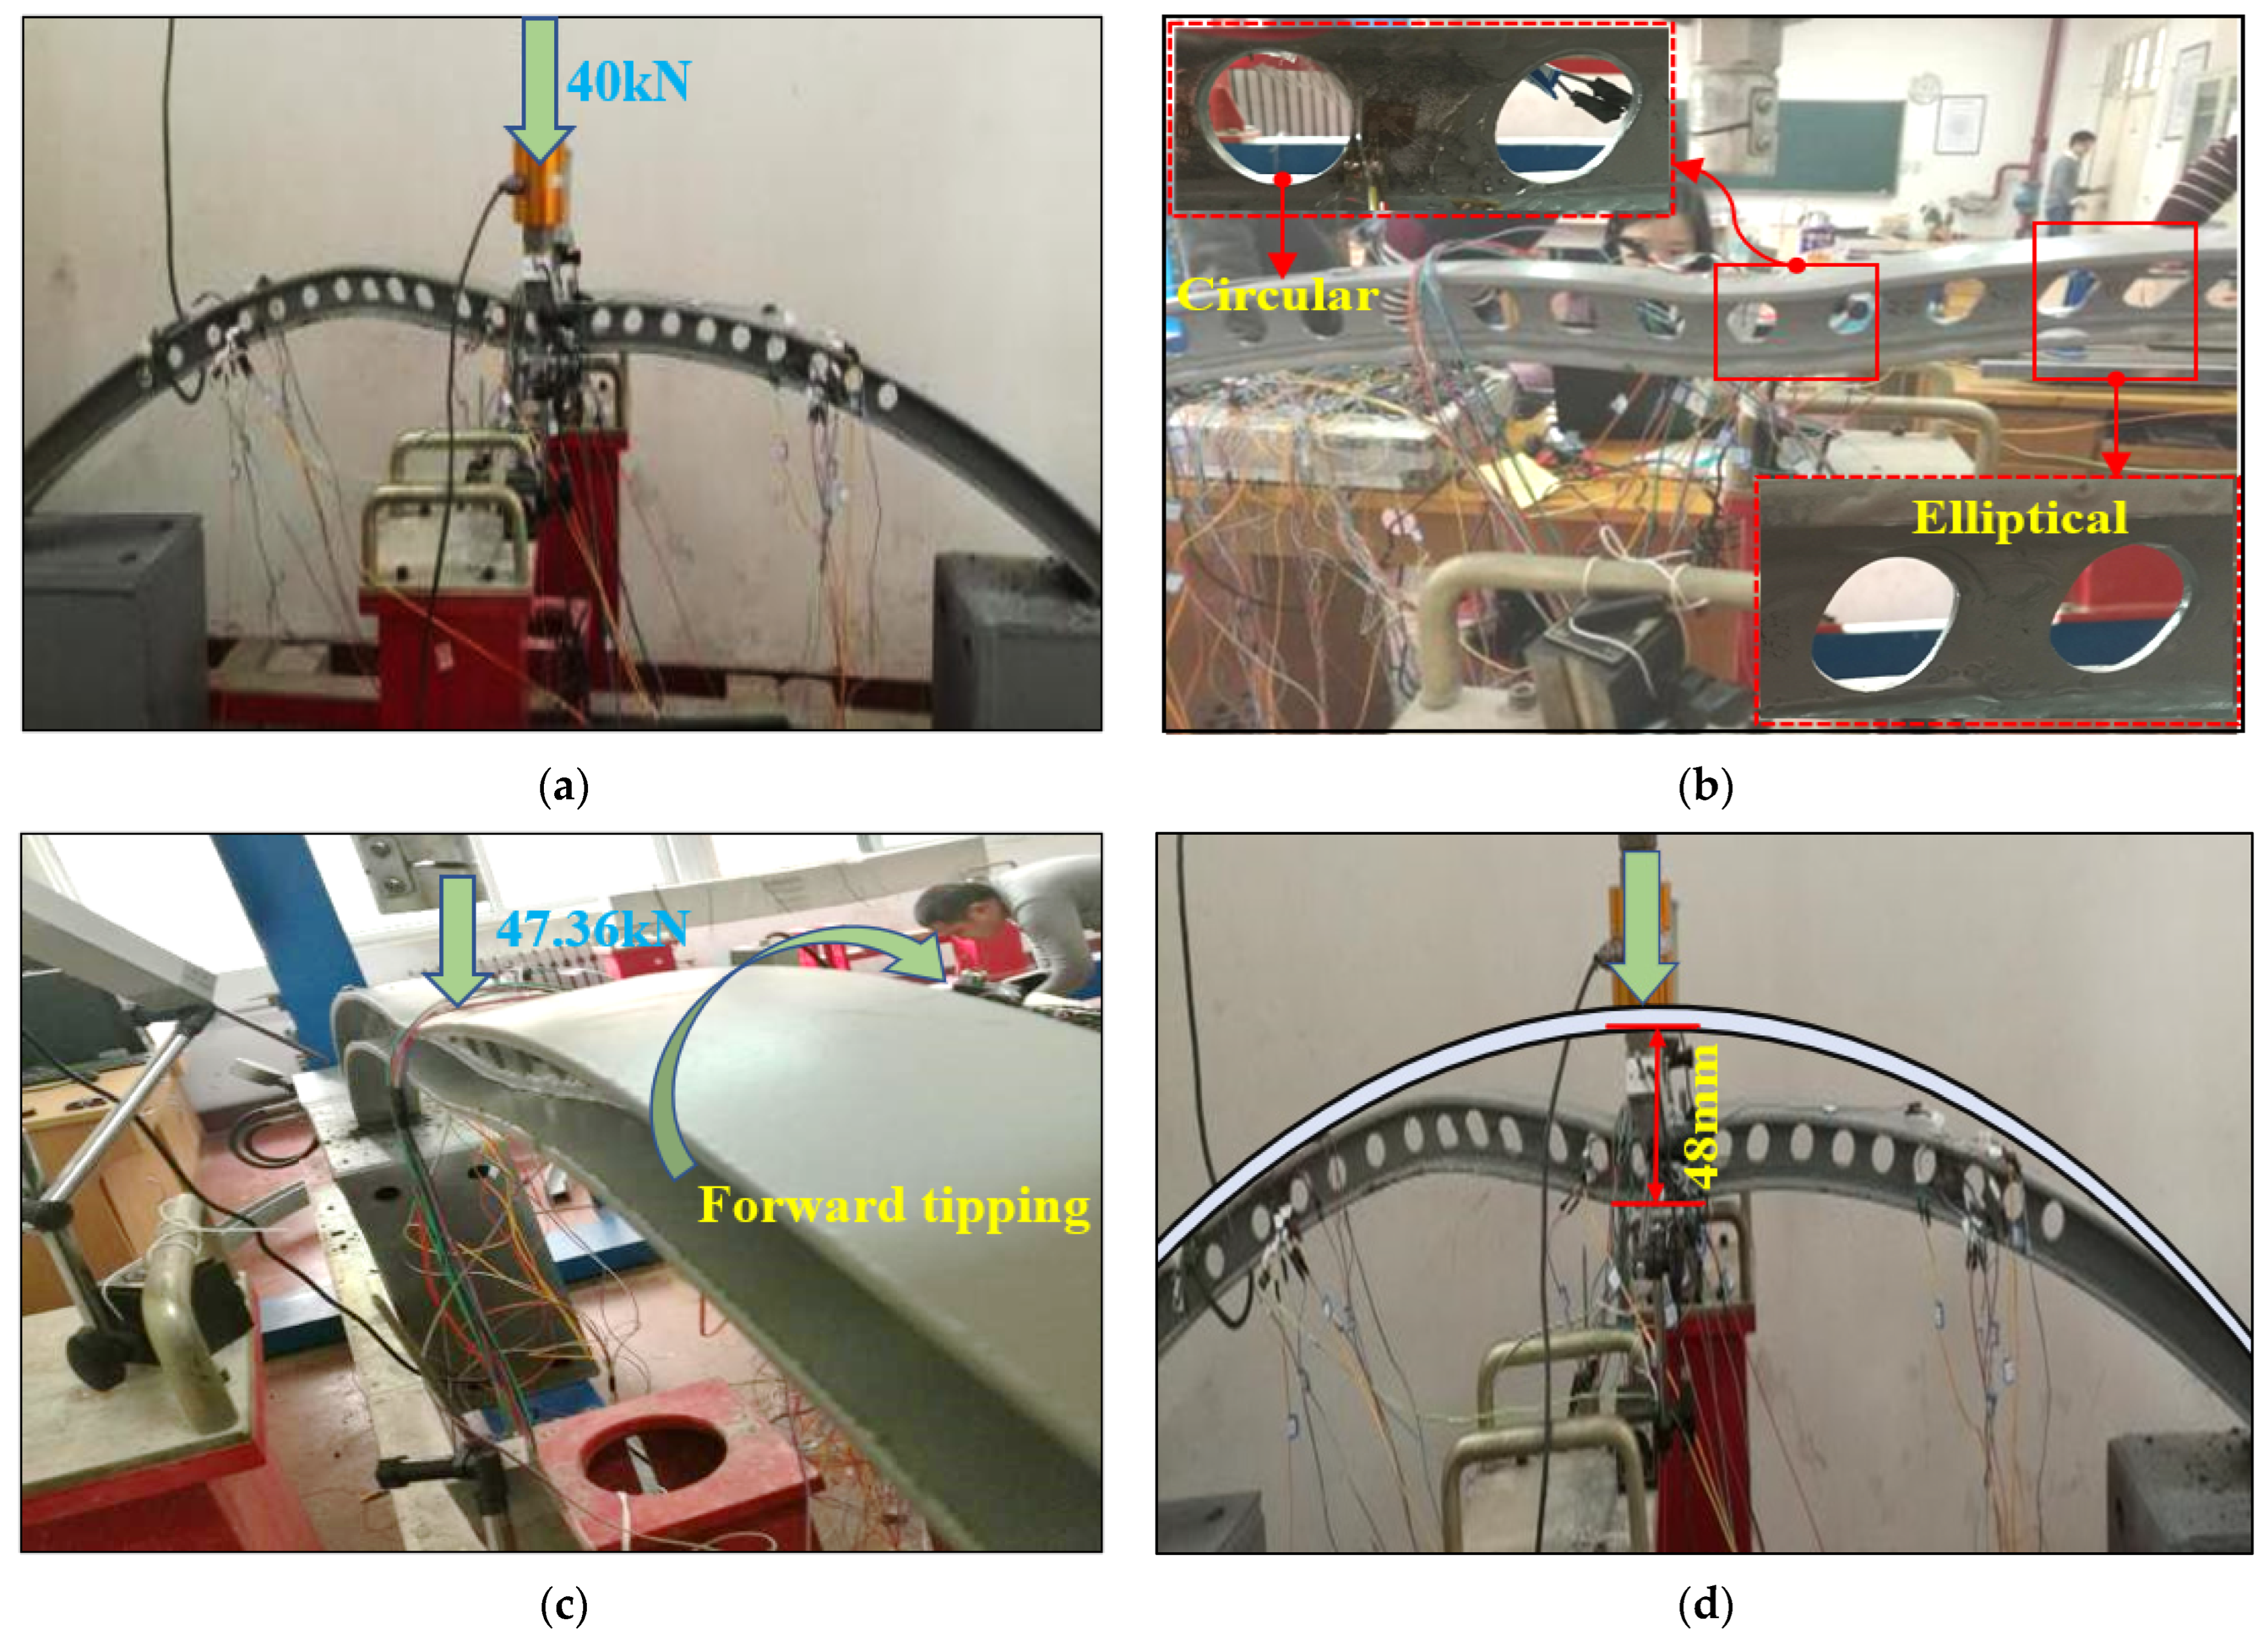
2.4. Test Setup and Loading Scheme

The boundary condition for the test is that the two ends of the arch foot are fixedly connected, achieved through welding the specimen to the support. The support and the pedestal are connected by bolts to meet the requirement of a hinged arch foot. The pedestal and the reaction frame are integrated. The hydraulic jack provides the load, and the reaction frame bears the weight of the hydraulic jack. A vertical load was applied at the mid-span on the top flange of the arch using a hydraulic jack of a 100 kN capacity, as shown in Figure 6.
The test loading system refers to the relationship between the control load and the loading time during structural testing. This encompasses the loading speed, the duration of the loading time interval, and the magnitude of the graded load value. The bearing capacity and deformation of components are influenced by the time characteristics of the load. To comprehensively study the stability of the arched cellular beam, the test loading is divided into preloading and formal loading. The preloading is carried out in three stages, with each stage bearing 20% of the standard load, followed by offloading through 2 to 3 stages. During the initial loading phase, each level’s loading value is 20% of the standard load until the standard load is reached. When the load reaches 90% of the local buckling load, the load at each level is considered to be 10% of the standard load until the arched cellular beam experiences local buckling failure. After each level of load is applied, the specimen is allowed to stabilize for 10 min. The value is then recorded, and the deformation is observed before proceeding to the next level of loading. The load on the beam was gradually applied in approximately 3 kN increments, and it was monotonically increased until the end of the test. The vertical loading scheme for all four test specimens is shown in Table 4.

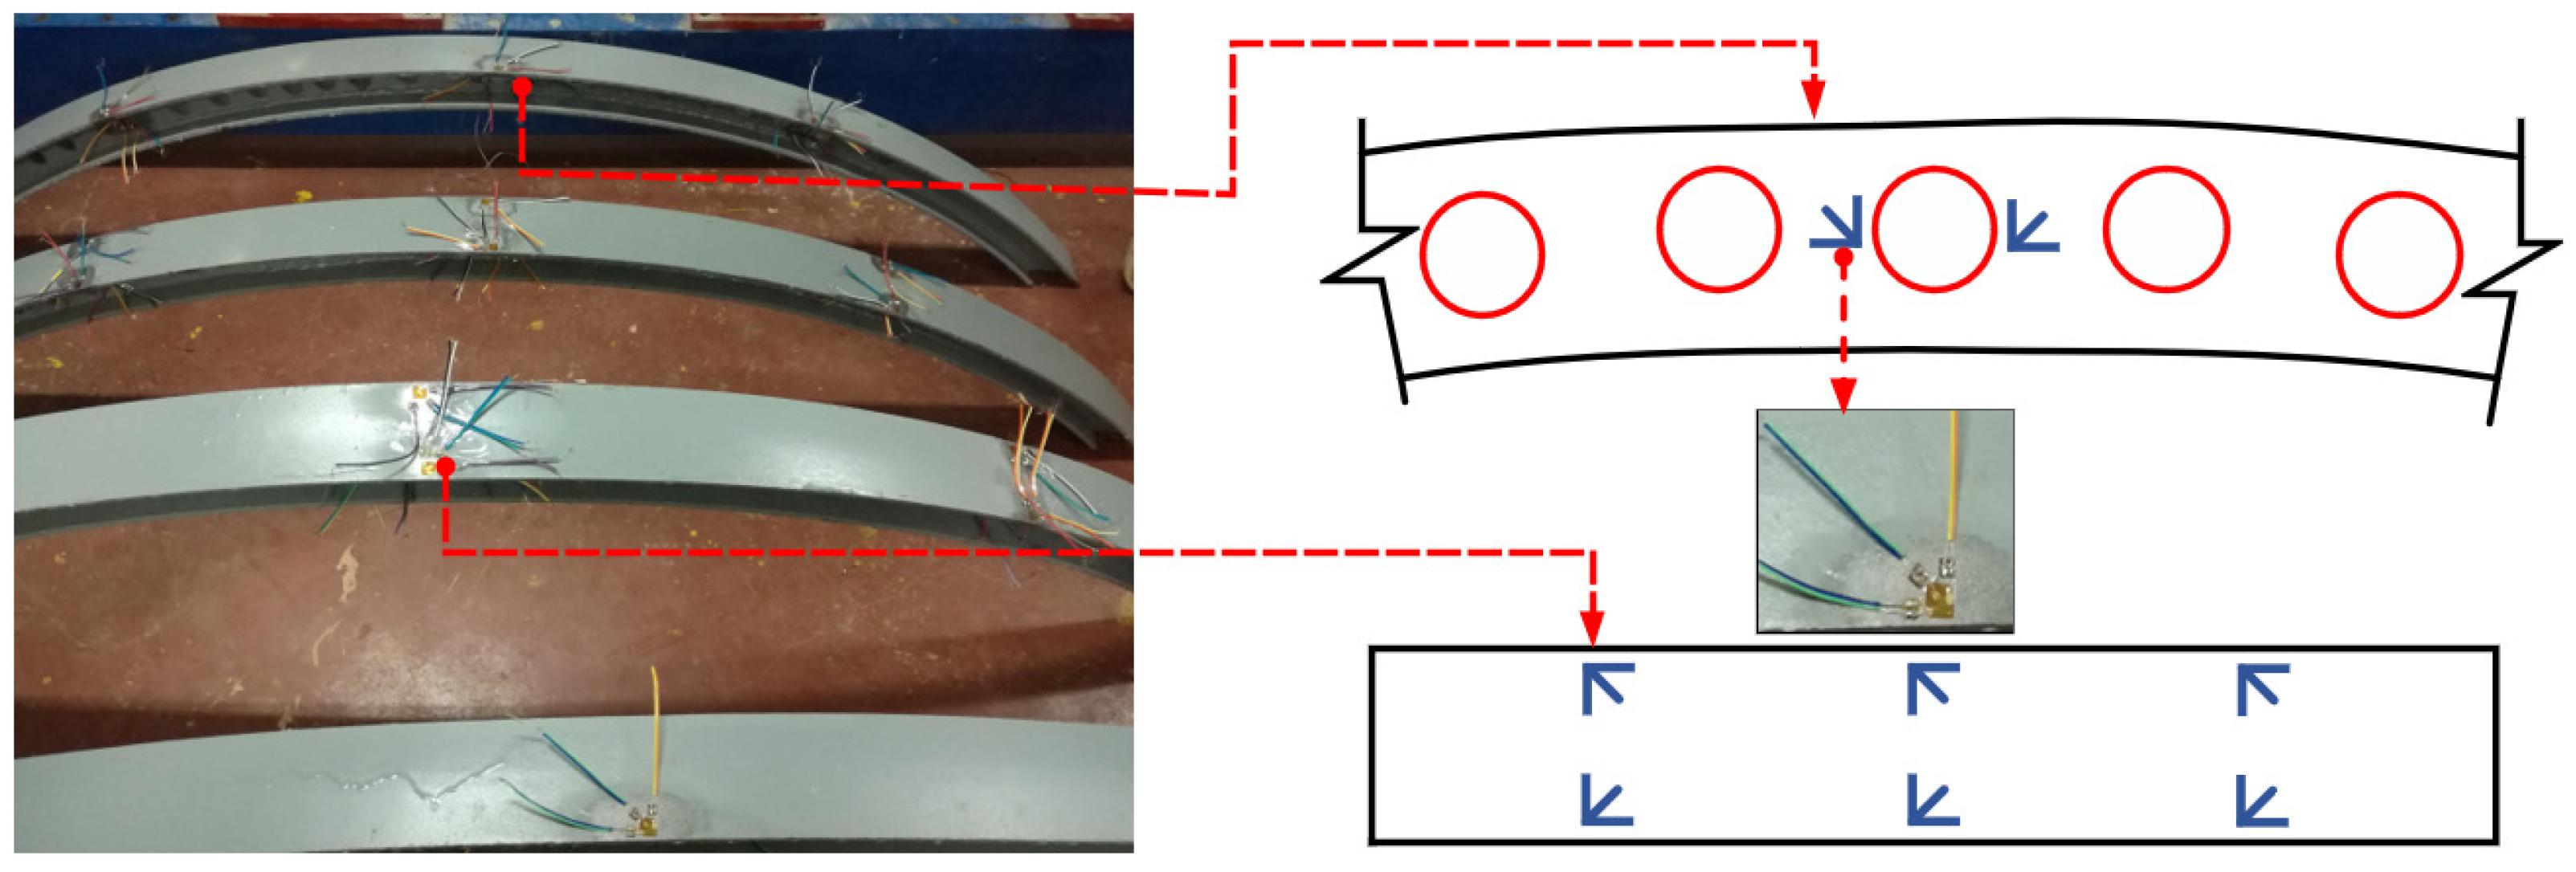
2.5. Instrumentation

Displacement gauges and strain gauges were installed to measure the global and local responses of the specimen, as well as the strains on key points of the web and flange. One displacement gauge (W2) was installed to measure the mid-span vertical displacement on the middle span of the specimen, and two displacement gauges (W1 and W3) were used to measure the lateral displacements on the front and back of the mid-span web position, as illustrated in Figure 7. In the arch structure, the control points of 1/4, 1/2, and 3/4 spans are crucial, and a strain rosette is positioned on the left and right sides of the hole in the middle span of the web, respectively. One strain rosette is arranged at the center and axis of the web at the 1/4 span and 3/4 span, respectively. Meanwhile, in order to determine the critical stress of the upper flange, strain gauges are arranged on the upper and lower surfaces at the 1/4, 1/2, and 3/4 spans of the upper flange, as illustrated in Figure 8.

3. Results and Analysis

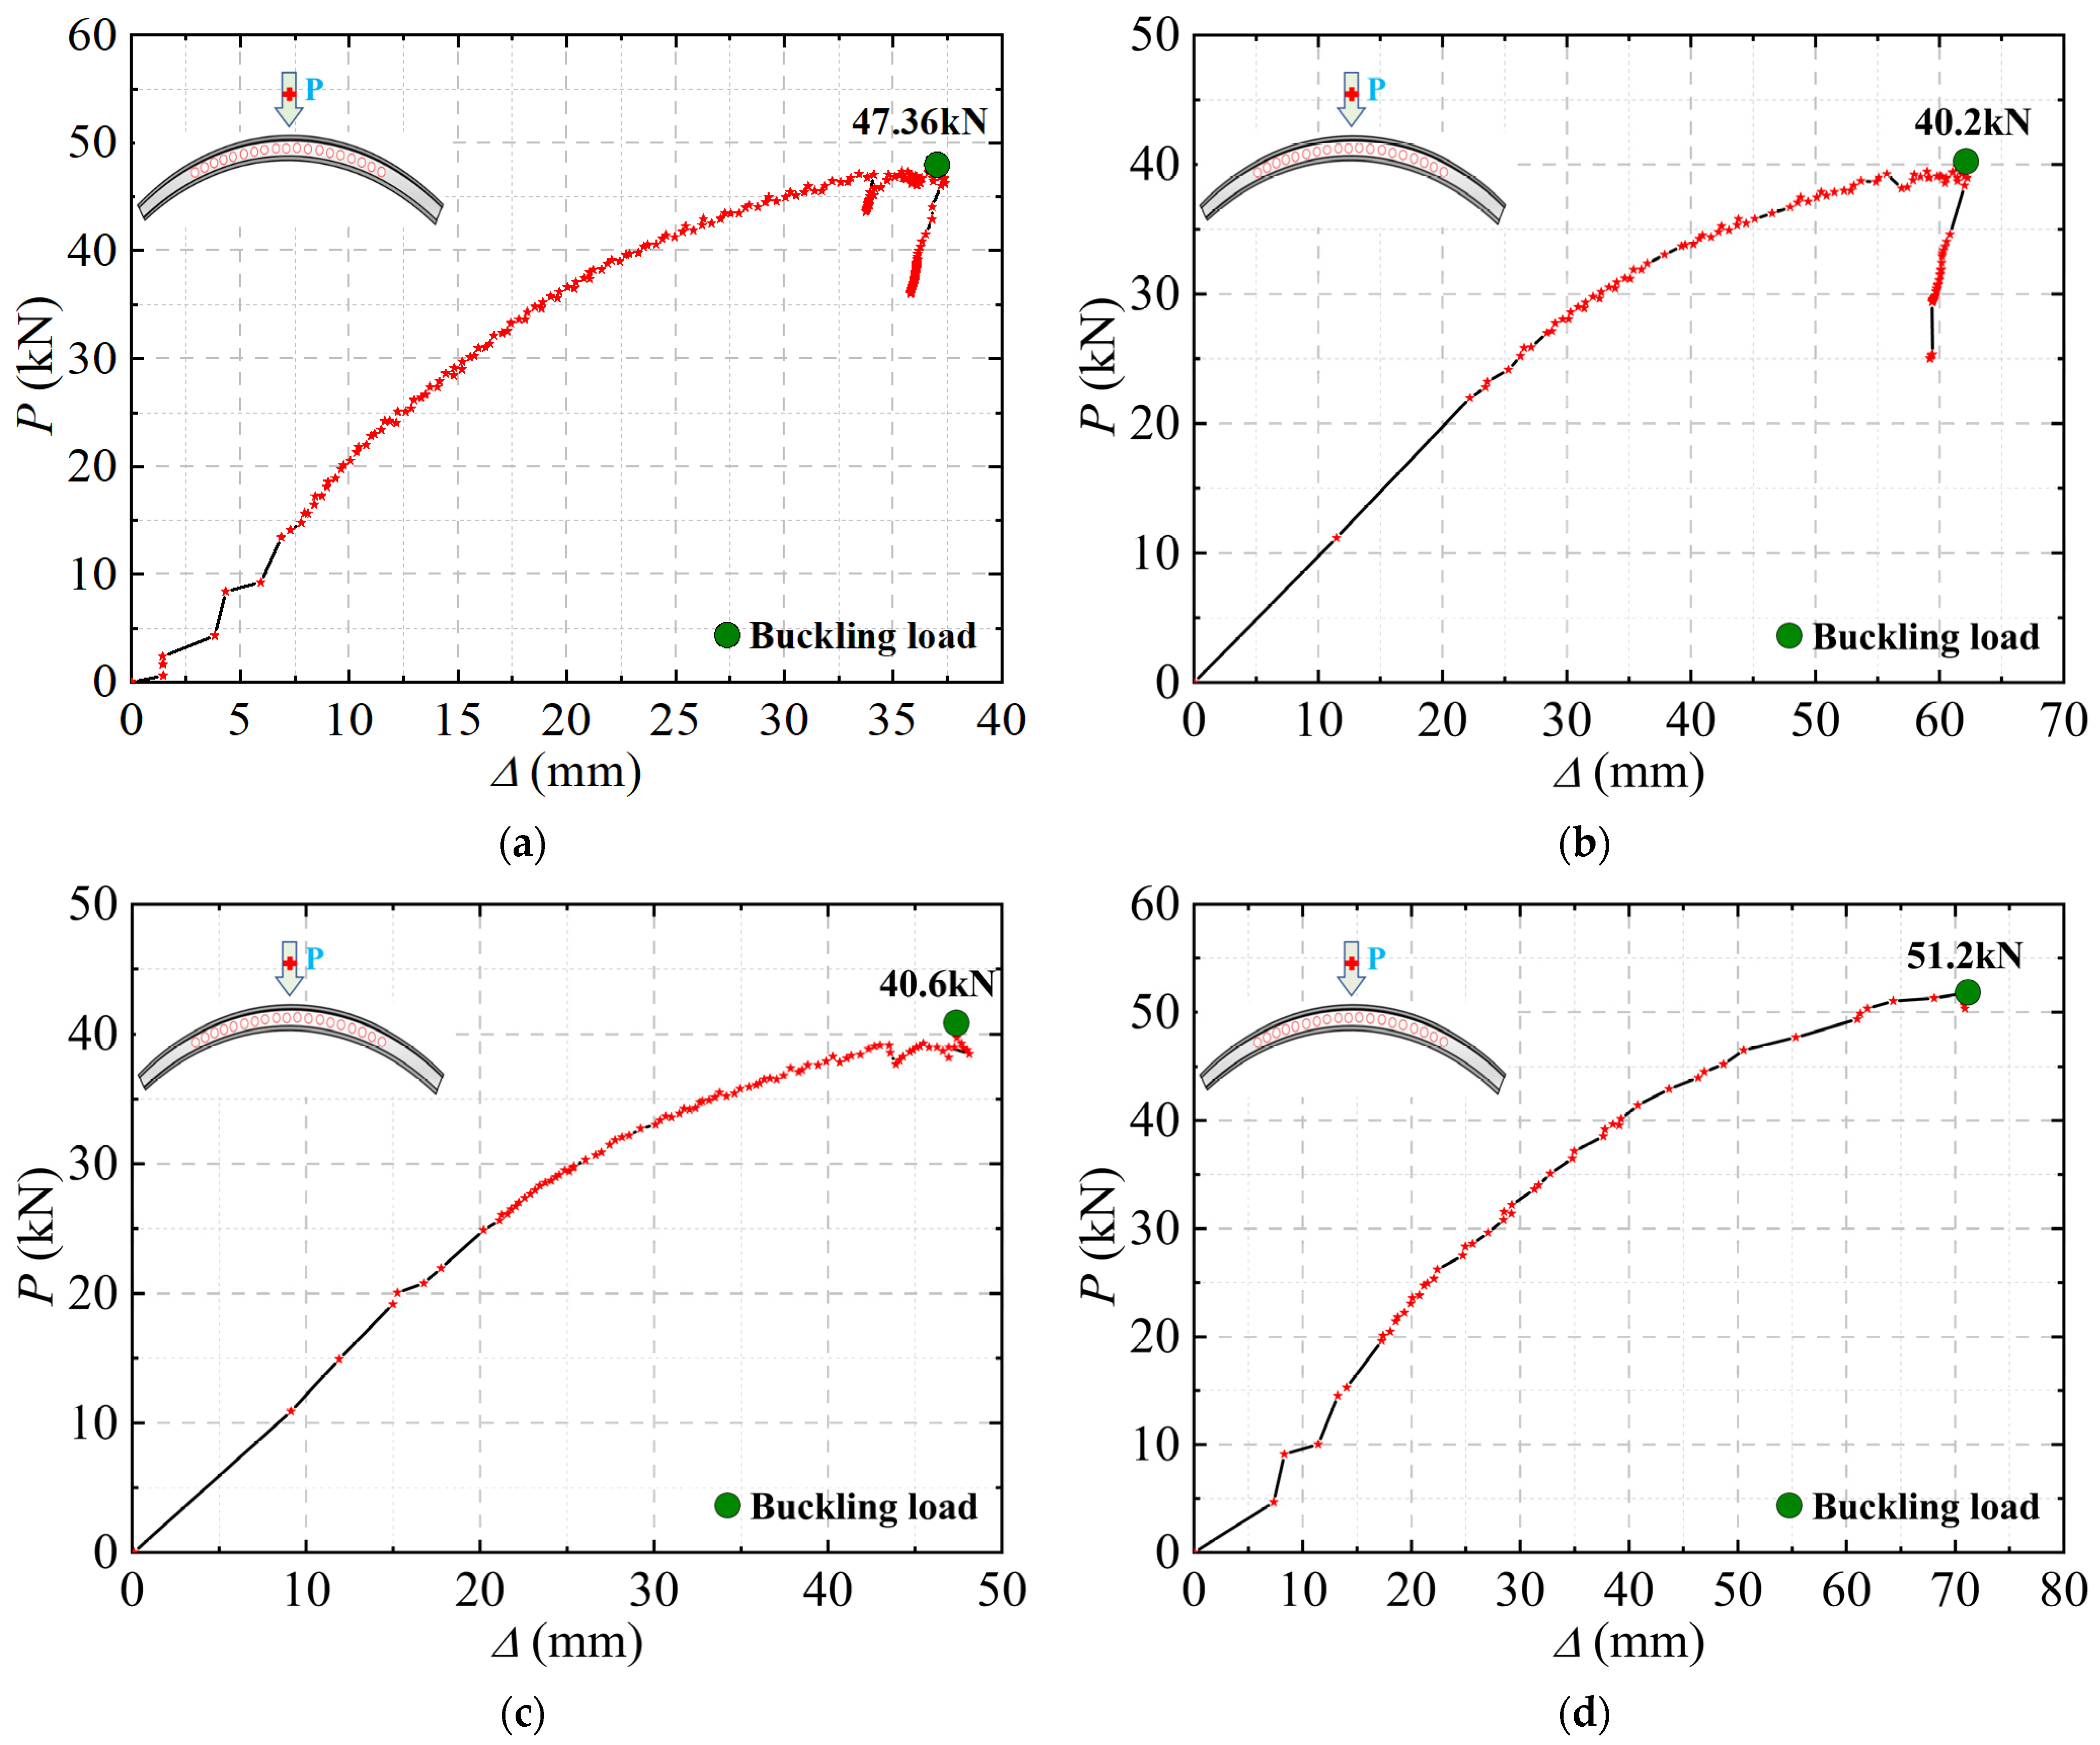
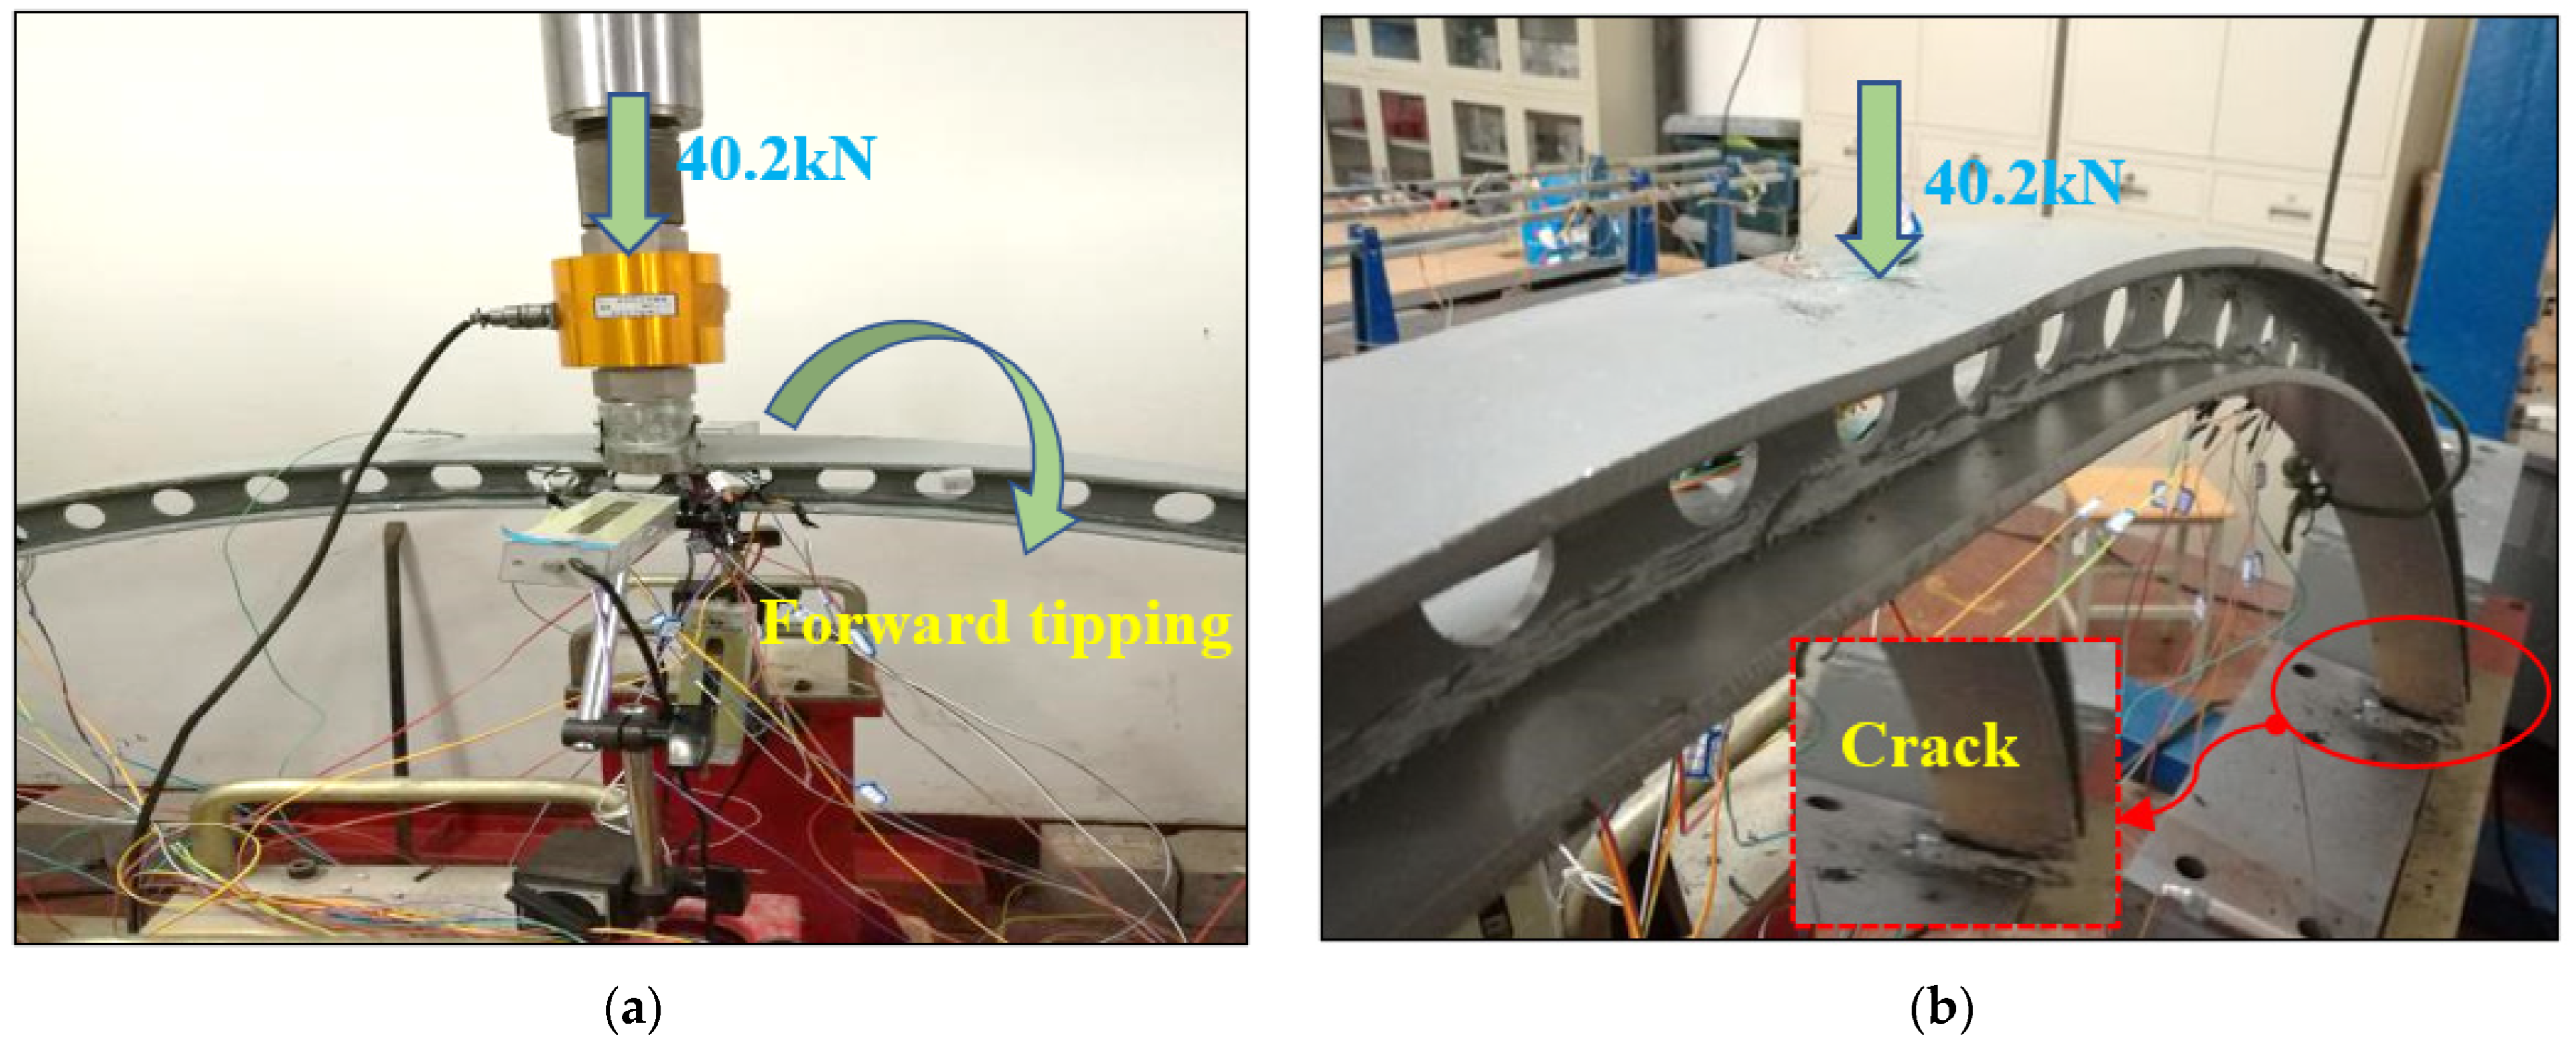
3.1. Experimental Observations and Displacement–Load Curves

During the loading process, the arched cellular beams will gradually bend in the plane as the load increases. At this stage, the mid-span vertical displacement gradually increases and plays a major controlling role. When the load has not reached the in-plane buckling load, the out-of-plane buckling failure occurs suddenly at a certain moment, and the load at this time is the out-of-plane buckling load. All four specimens in this test failed due to out-of-plane instability. The mid-span vertical displacement–load curves of the four specimens are shown in Figure 9.
The rise–span ratio of both SJ1 and SJ4 is 0.2, and the experimental phenomena of the specimens are similar. The testing process is illustrated using SJ1 as an example, and the loading process is shown in Figure 10. During the initial stage of loading, the specimen did not undergo significant changes, and the mid-span displacement increased gradually. When the load reaches 22.44 kN, the mid-span loading point continues to sink, while the positions at 1/4 and 3/4 of the arch span gradually rise. Meanwhile, the mid-span vertical displacement continues to increase, reaching 15.45 mm, while the lateral displacement remains very small. When the load reaches 40 kN, the specimen exhibits a change in the shape resembling the letter “M” (Figure 10a). At present, the mid-span vertical displacement continues to increase, while the shape of the mid-span hole remains essentially circular, and the holes on both sides are elliptical, both inclined toward the mid-span direction (see Figure 10b). When loaded to 47.36 kN, the specimen suddenly tilts to the front side (see Figure 10c), and the vertical displacement of the final mid-span position is 48 mm (see Figure 10d). The load cell is disconnected from the loading point, and the loading process is completed.
The rise–span ratio of both SJ2 and SJ3 is 0.3, and the experimental behaviors of the specimens are similar. The testing process is illustrated using SJ2 as an example, and the loading process is shown in Figure 11. During the initial stage of loading, there was no apparent change in the specimen, and the mid-span displacement increased gradually. As the load continues to increase, the arch begins to exhibit more noticeable deformation. The mid-span loading point continues to sink, while the positions of the arch span at 1/4 and 3/4 gradually rise. Meanwhile, the vertical displacement of the mid-span continues to increase, reaching 25.62 mm, while the lateral displacement changes minimally. As the load continues to increase, the specimen’s deformation becomes increasingly apparent, the vertical displacement of the mid-span continues to rise, and the web’s holes also undergo significant changes. When the load reaches 40.20 kN, the specimen suddenly tilts forward (see Figure 11a), and the weld at the constrained end of the arch cracks (see Figure 11b), signaling the end of the loading process.
Compared to SJ1 and SJ4, the lateral displacement of SJ2 and SJ3 is greater, but the vertical displacement at the mid-span is smaller. As the rise–span ratio of the arched cellular beam increases, the arch axial force also increases, leading to a reduction in out-of-plane stiffness. This makes the arched cellular beam more susceptible to out-of-plane instability. Therefore, in actual engineering design, it is necessary to control the rise–span ratio within a certain range. This conclusion is also supported by references [39,40].

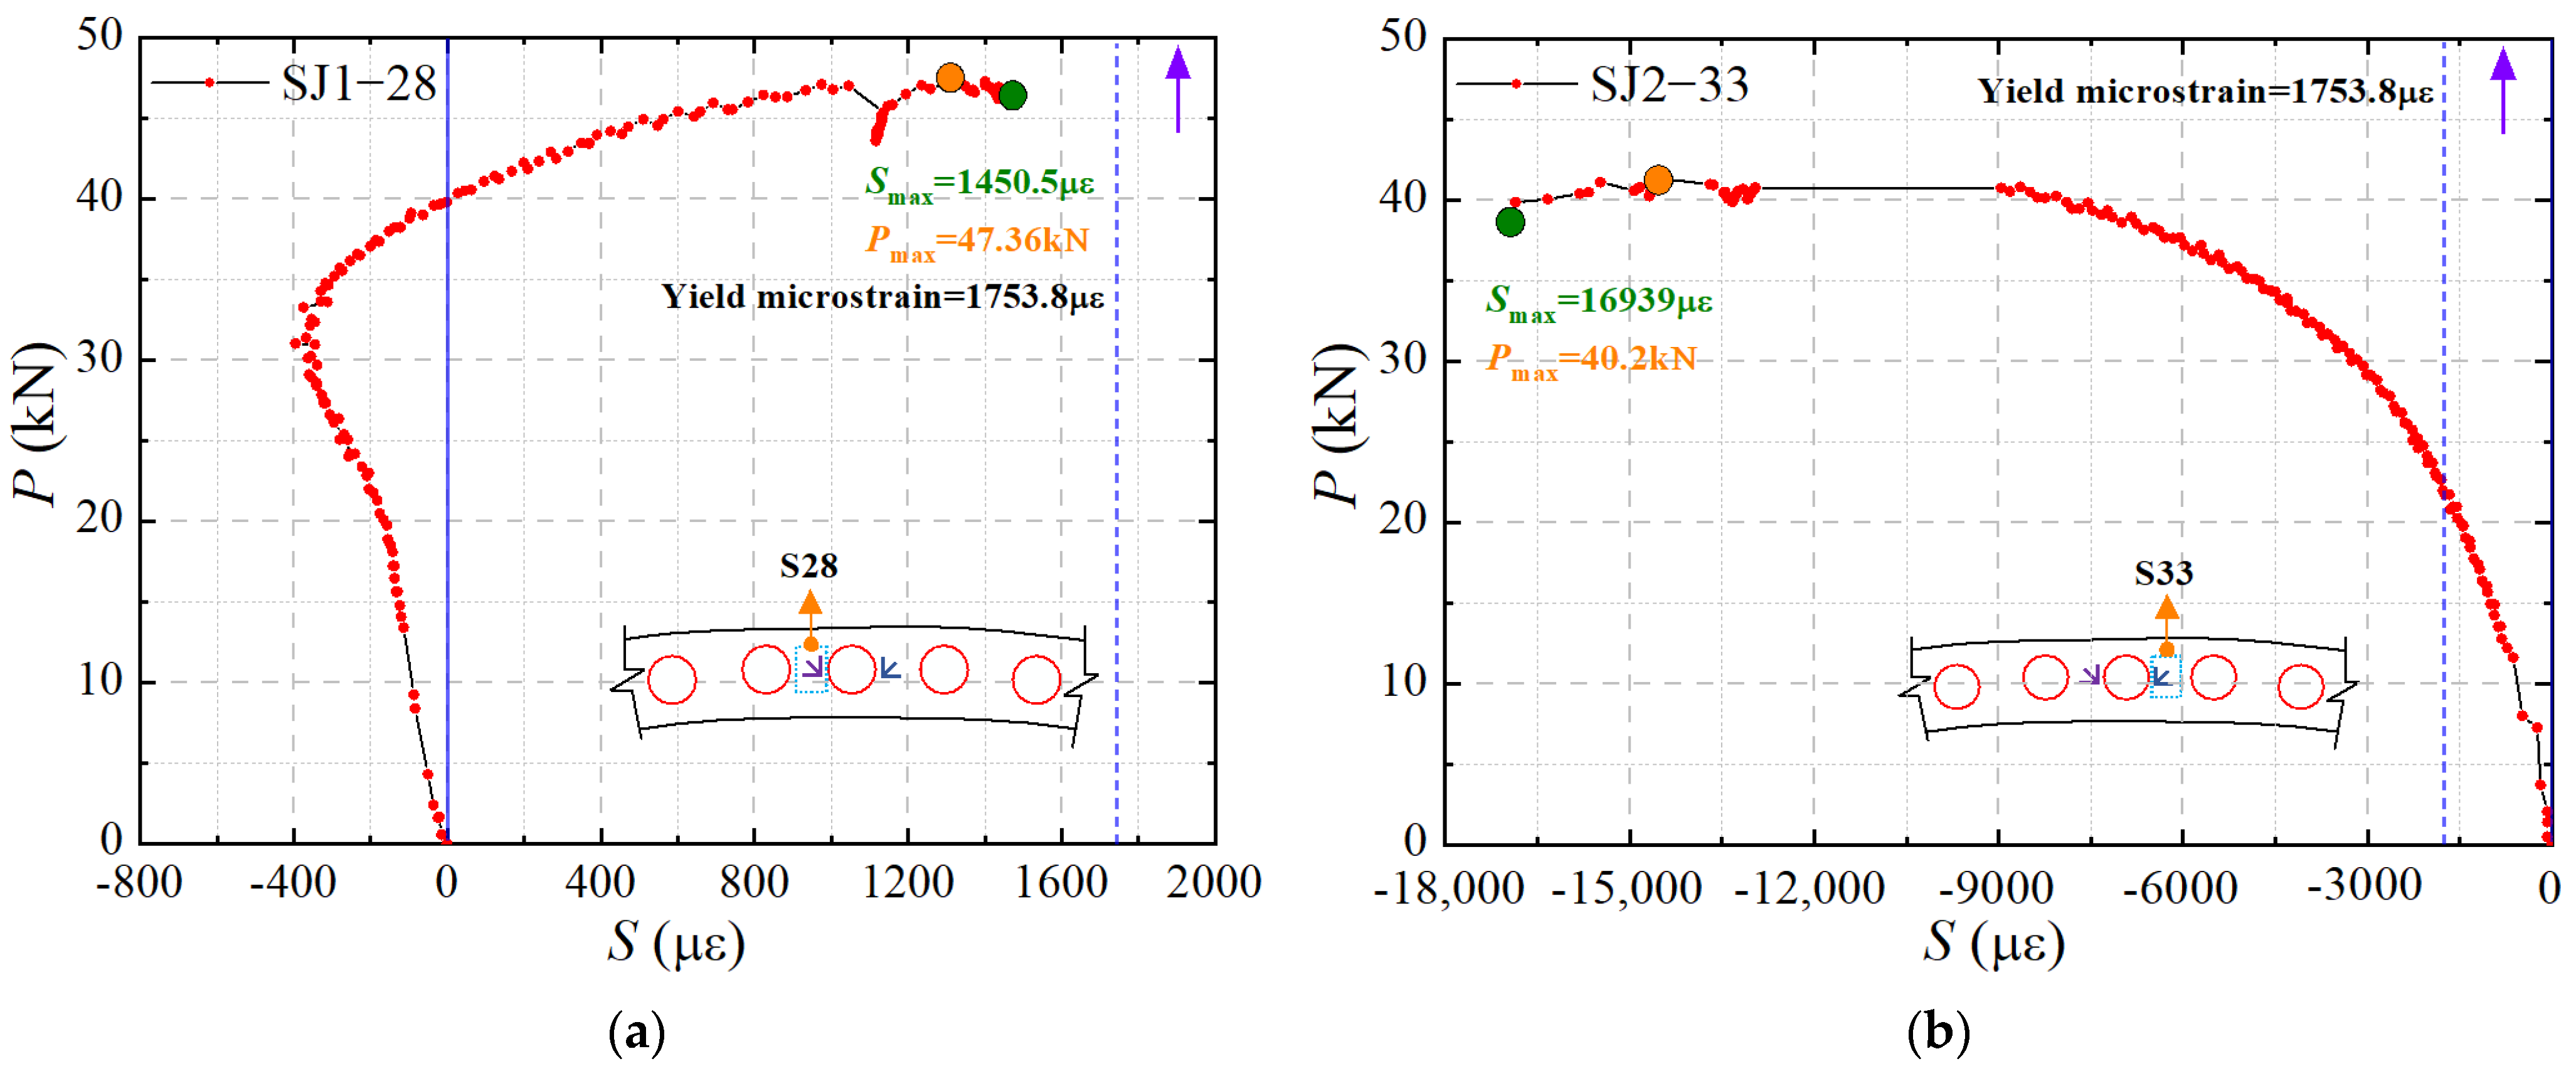
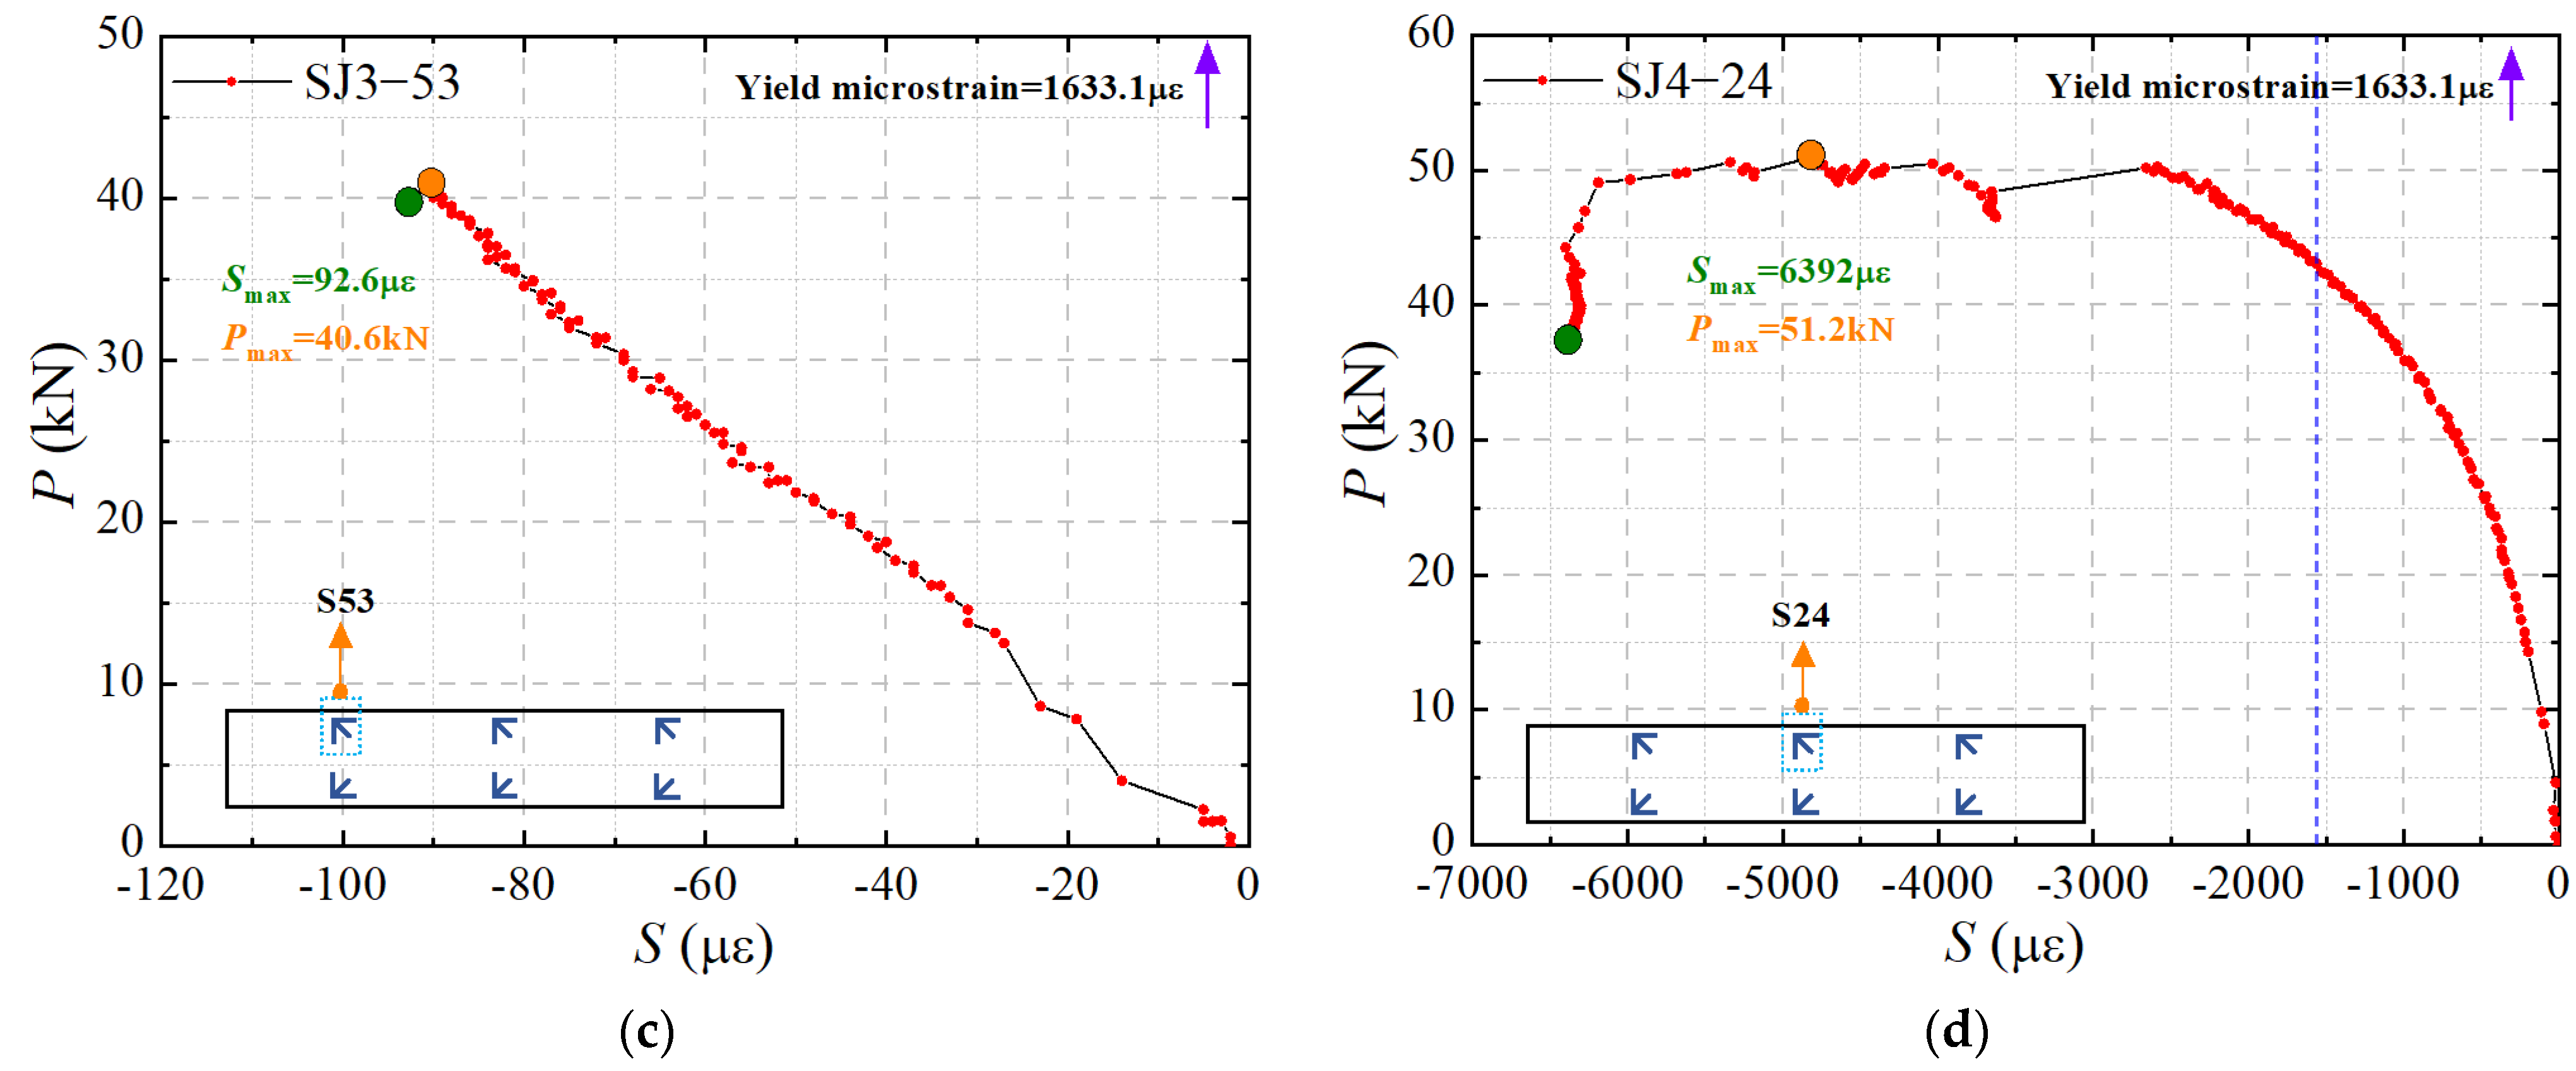
3.2. Strain Gauge Readings

The component has initial geometric defects and residual stress generated during processing. It is inevitable that there will be load misalignment during actual loading, leading to the second type of instability, known as extreme point instability. The buckling load of the arched cellular beam can be determined from the strain–load curve. Typical strain gauge readings for the key position of the arched cellular beams are shown in Figure 12.
As shown in Figure 12a, the strain of SJ1-28 increases linearly with the increase in load at the initial stage of loading, and the direction is negative. When loaded to about 30 kN, the strain gradually decreases. When loaded to about 40 kN, the strain changes from negative to positive, indicating that the part around the hole in the middle of the web shifts from compression to tension. When the load reached 45.63 kN, the specimen suddenly experienced out-of-plane instability, preventing further application of the load, and thus concluding the loading process. The maximum strain of SJ1-28 was 1450.5 με, which is less than the yield strain of the steel. The curves of SJ1-28 and SJ3-53 are similar and no longer repetitive. Strain SJ2-33 is located to the right of the mid-span hole in the web at the L/2 span. When loaded to 20 kN, the strain started to increase rapidly. When the load reaches approximately 41.20 kN, it cannot continue to increase due to out-of-plane instability of the specimen (see Figure 12b). The maximum strain of SJ2-33 was −16,939 με, which exceeded the yield value of the steel (1753.8 με according to the results of the material test), indicating that SJ2-33 yielded during the test. Similarly, the curves of SJ1-28 and SJ3-53 are alike and not repeated.

4. Numerical Analysis

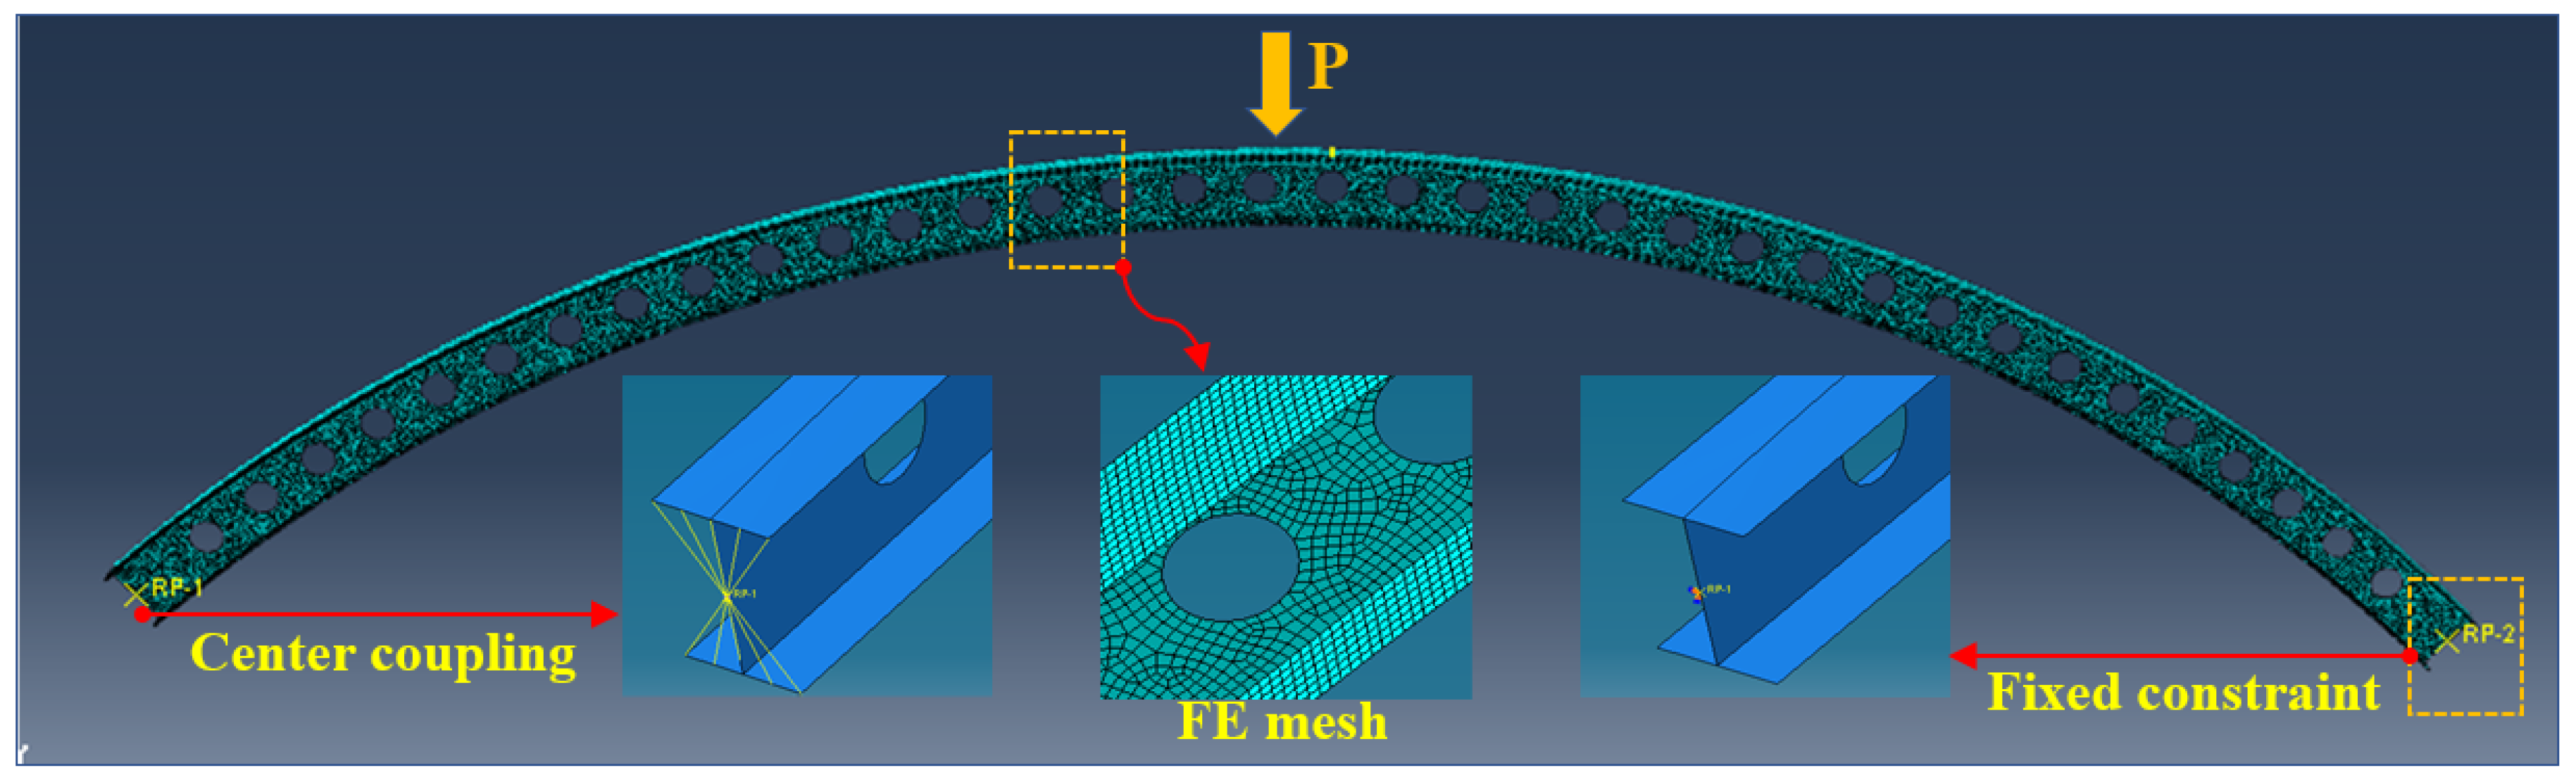
4.1. Numerical Model

Numerical simulations were conducted to investigate the out-of-plane elastic buckling of arched cellular beams. The numerical analysis was conducted using the finite element (FE) software ABAQUS 2020 [41]. The ABAQUS FE analysis software can solve the linear elastic buckling problem of the structure. This paper examines the elastic stage, which is part of the small deflection stage. Under the influence of an external force, transitioning from one equilibrium state to another is the process of solving eigenvalues in mathematics. Using the FE method to obtain the eigenvalue, which represents the load coefficient multiplied by the loading force, gives us the buckling load of the structure. The fundamental principle of the FE eigenvalue buckling method is as follows:
K + λ S ψ = 0
where [K] is the stiffness matrix; [S] is the stress stiffness matrix; {ψ} is the displacement characteristic vector; and λ is the eigenvalue.
It is assumed that each point on the specimen section has the same torsion angle when twisted. Therefore, the coupling command is used in the model to ensure that all points on a certain section have the same twist. The material is linearly elastic and isotropic, and the modulus of elasticity and yield strength were determined from tensile coupon tests. The modulus of elasticity of Q345 steel is 2.06 × 10¹¹ N/m2 and Poisson’s ratio is 0.3. The yield strength of the 5.5-mm-thick web is 3.86 × 10⁸ N/m2, and the yield strength of the 7.5-mm-thick web is 3.59 × 10⁸ N/m2. The height and width dimensions of the steel beam are much smaller than its length, so a shell element is chosen to simulate the structure. The S4R shell element (four nodes, reduced integration) in ABAQUS/Standard is chosen, with six degrees of freedom (three translational and three rotational) at each node. Furthermore, the cross-section of the cellular beam is determined by specifying the thickness of the shell. The boundary condition adopts the center point of the cross-section for full-section coupling and restricts its horizontal displacement and rotation in three directions. The model in this paper uses a free mesh division approach with a mesh seed number of 0.03, equivalent to 30 mm, and quadrilateral element shapes. The boundary conditions and the FE mesh are shown in Figure 13.

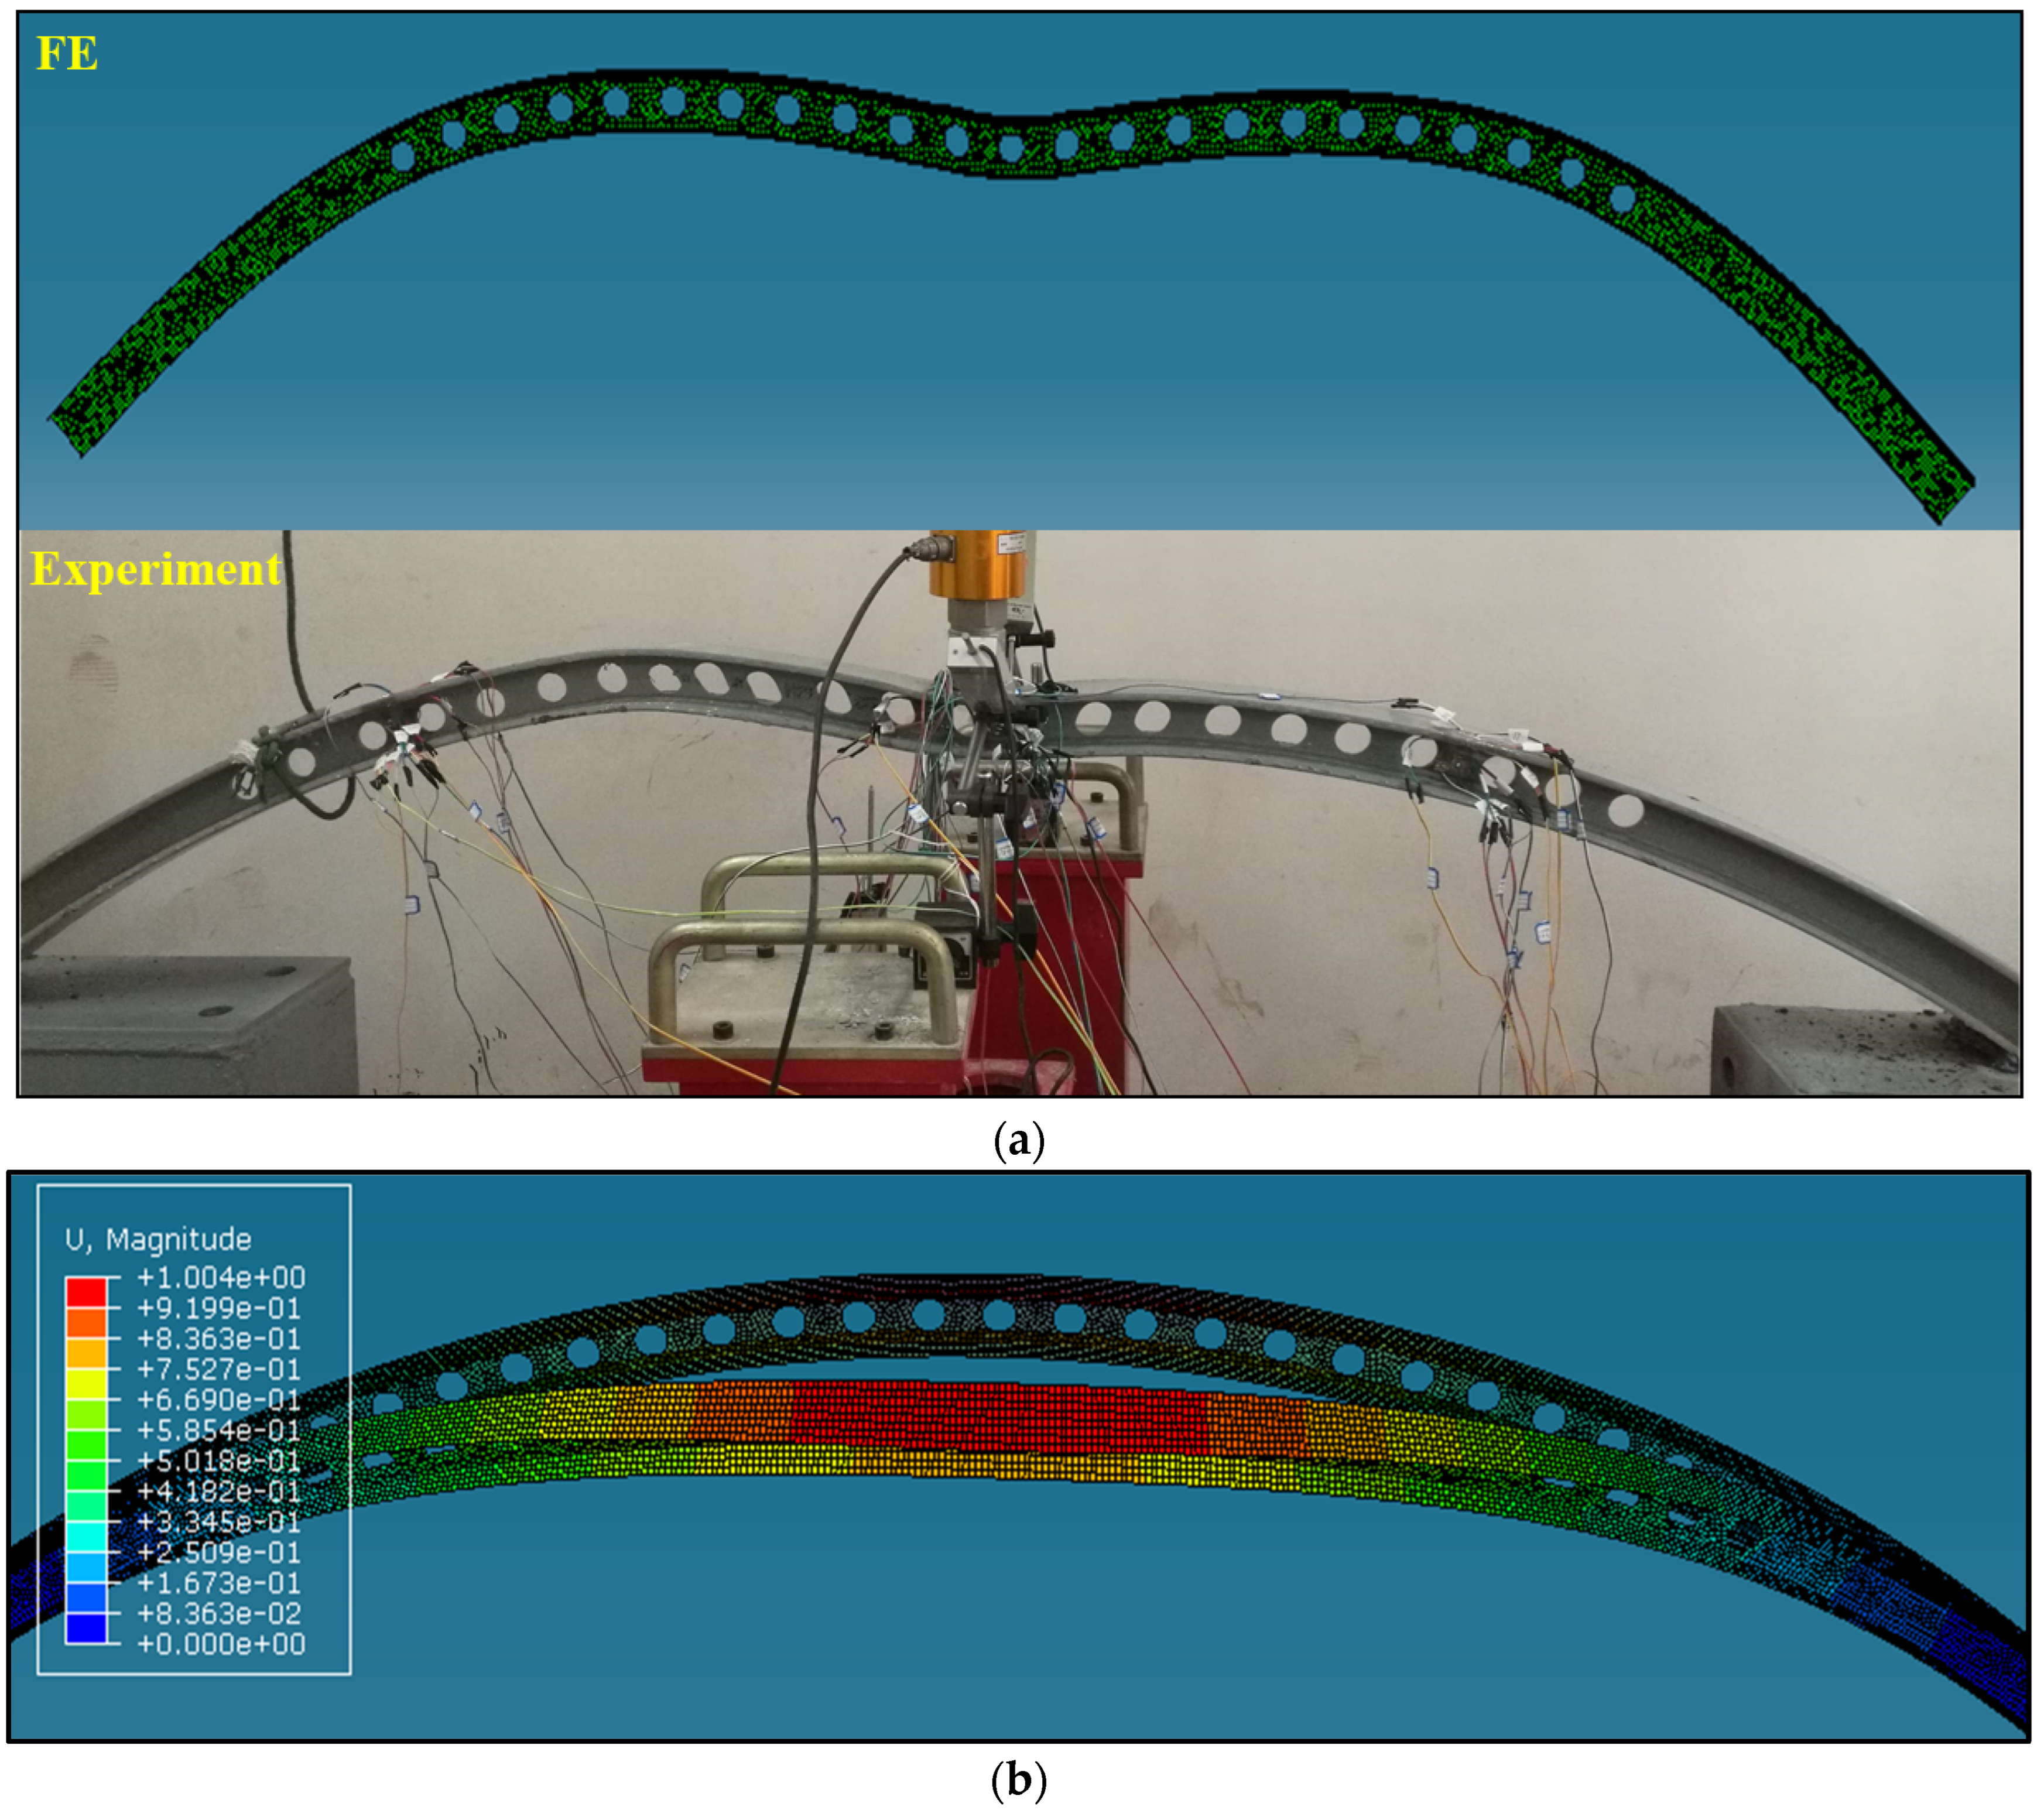
4.2. Verification of FE Model

Numerical models were validated using experimental results. Taking SJ-1 as an example, Figure 13 shows the experimental and FE deformation of the arched cellular beam. Under the concentrated load of the vault, the FE failure mode of the arched cellular beam aligns with the experimental results. Specifically, the mid-span loading point sinks, and the points at L/4 and 3L/4 are uplifted, forming a letter-‘M’ shape. Except for the one hole in the mid-span that remains circular, the circular holes at both ends become elliptical and tilt in the direction of the mid-span (Figure 14a). Furthermore, the diagram illustrates the arched cellular beam’s clear lateral instability before and after deformation (Figure 14b).
The FE and experimental comparison results of the mid-span vertical displacement and yield load of the four specimens are presented in Table 5. All results are compared, and the predictive errors with the numerical model are all within 15%, indicating the validity of the FE model and parameter analysis. It is important to note that the numerical analysis values are greater than those obtained from the experiment. The disparity between the experimental and the FE result may stem from the simplification of the numerical model. For example, the simplified stress–strain curve is bilinear, and it does not account for residual stress. In general, the FE model simulates the behavior of an arched cellular beam with good agreement. Therefore, the FE method can be utilized to conduct multi-factor research on the out-of-plane stability of an arched cellular beam.

5. Parametric Studies

5.1. General

Following the validation study, a subsequent numerical analysis was conducted to examine the effects of certain key parameters that were not addressed in the initial test program. These parameters may affect the out-of-plane elastic buckling load of the arched cellular beam. The FE eigenvalue buckling method is used to analyze the out-of-plane elastic buckling of the arched cellular beam. The FE model of the arched cellular beam is created using the designed orthogonal table. This study investigates the effects of horizontal uniform vertical load, vertical load along the arch axis, and concentrated load on a fixed arch without lateral support. The loading mode and the critical load calculation formulae of arched cellular beams are illustrated in Figure 15. In the formulae, l represents the span of the arch, s represents the length of the arch axis, and q and F represent the eigenvalues of the first-order mode multiplied by the applied load. The cross-section of the beam in the model is h × b × tw × t = 630 × 400 × 16 × 22 (mm), and the hole spacing is 300 mm. The experiment is designed with three independent variables, and each variable has four levels, resulting in a 16-run fractional factorial design (L16(43)). Since the web height and total height of the test piece have not changed, in order to determine the influencing factors more accurately, the web thickness (tw) and hole diameter (R) are converted into the web height-to-thickness ratio (h0/tw) and diameter–depth ratio (R/h), respectively. This conversion allows for a more precise assessment of the influencing factors. The three factors affecting the specimen are as follows: f/l (0.2, 0.3, 0.4, 0.5), h0/tw (36.625, 34.471, 32.556, 30.842), and R/h (0.476, 0.540, 0.571, 0.635). The orthogonal parameters of the specimens are shown in Table 6. Finally, the orthogonal table is used to analyze the range of the calculation results from the FE, in order to determine the primary and secondary order of the factors influencing the out-of-plane elastic buckling load of the arched cellular beam, and to identify the optimal combination under various conditions.

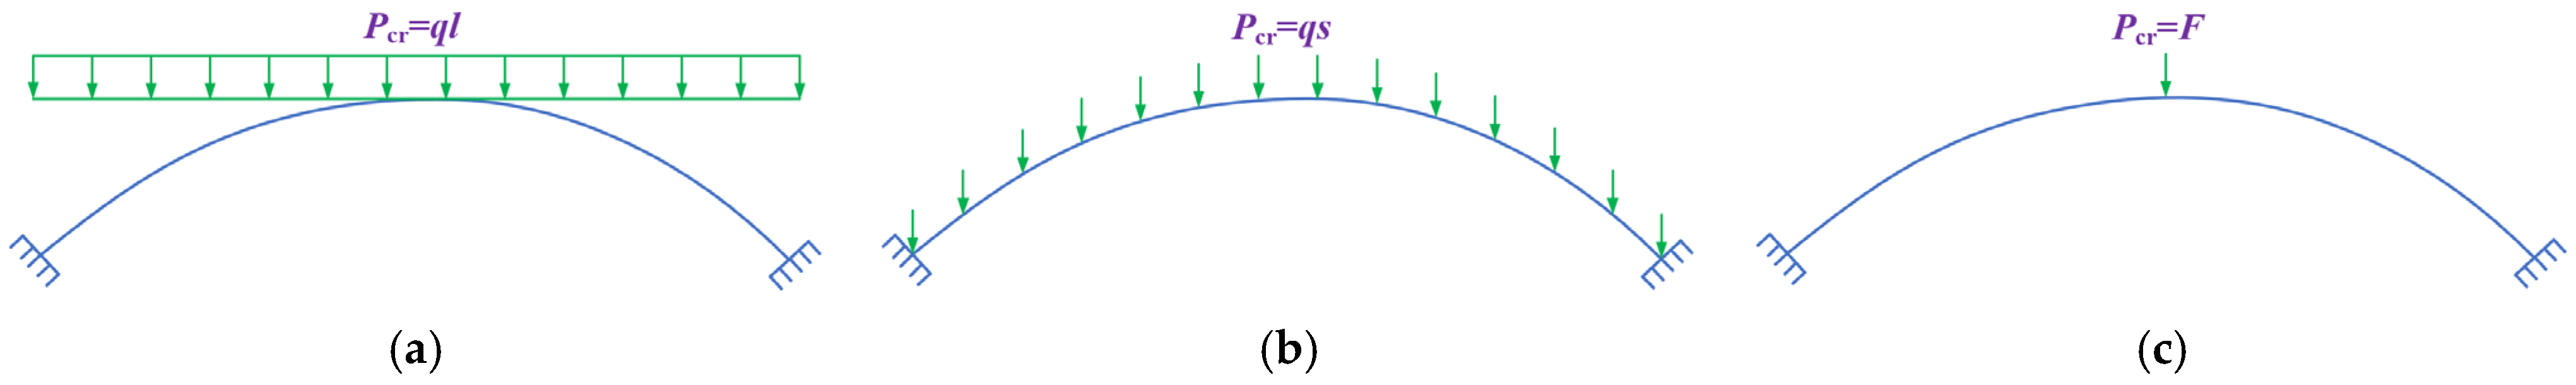
5.2. Elastic Buckling Analysis under Concentrated Load

The in-plane instability of the arch is due to bending instability, and the deformation of the member exhibits two half-waves. The out-of-plane instability of the arch is characterized by bending–torsional instability, and the deformation of the member exhibits one half-wave. Taking MSJ-1 as an example, when subjected to a concentrated load, the in-plane and out-of-plane instability mode diagram of the arched cellular beam is shown in Figure 16.
The buckling eigenvalues of MSJ1~16 (the initial load input of 345 kN) and the calculated out-of-plane critical load are shown in Table 7. The buckling load (Pcr) is equal to the initial applied load multiplied by the eigenvalue (λ).
According to the out-of-plane elastic buckling load value, the order of factors affecting the out-of-plane stability performance is determined using the range analysis method of the orthogonal test [42]. The range value of each factor is as follows:
R = max k i min k i
where R represents the range value, and ki represents the sum of the responses of each factor at the same level, i.e., the sum of the buckling loads of each factor at the same level. Due to the equal probability of occurrence for each factor, it can be considered that each factor has an equal influence on the overall results of the finite element analysis. The larger the range (R), the greater the influence of the factor’s level change on the specimen’s result. The calculated range (R) of each factor under concentrated load is presented in Table 8.
According to the calculations in Table 7, the optimal levels are the first level for the first factor, the fourth level for the second factor, and the third level for the third factor. When considering these factors separately, the optimal combination is determined to be a rise–span ratio of 0.2, a web height–thickness ratio of 30.842, and a diameter–depth ratio of 0.571, i.e., (f/l)1(h0/tw)4(R/h)3. According to the R-values calculated in Table 8, it is evident that the rise–span ratio has the highest value, followed by the web height–thickness ratio, and the diameter–depth ratio has the lowest value. The primary and secondary order of influence of these three factors on the out-of-plane buckling load of the fixed arch with a web opening under concentrated load is determined as follows: rise–span ratio (f/l) > web height–thickness ratio (h0/tw) > diameter–depth ratio (R/h). The buckling load trend for each factor change is shown in Figure 17.
According to Figure 17, the buckling load decreases as the rise–span ratio increases. When the rise–span ratio is between 0.4 and 0.5, the rate of decrease becomes slower. The higher the rise–span ratio of the fixed arched cellular beam, the more susceptible the structure is to out-of-plane instability. The decrease in bending load with an increase in web thickness is not significant, as the four horizontal levels of the web height-to-thickness ratio are fairly similar. The buckling load decreases as the diameter–depth ratio increases, but when the ratio is between 0.54 and 0.57, the load shows an upward trend. This indicates that for a fixed arch under the concentrated load of the vault, a smaller radius of the hole is not necessarily better.

5.3. Elastic Buckling Analysis under Vertical Load along the Arch Axis

Under a vertical load along the arch axis, the FE buckling eigenvalues of MSJ1~16 (the initial load input of 1000 N/m2) and the calculated out-of-plane critical load are shown in Table 9. According to Formula (2), the calculated range R of each factor under concentrated load is presented in Table 10.
According to the calculation results in Table 9, the optimal levels are the first level of the first factor, the fourth level of the second factor, and the first level of the third factor. When considering these factors separately, the optimal combination is determined to be a rise–span ratio of 0.2, a web height–thickness ratio of 30.842, and a diameter–depth ratio of 0.467, i.e., (f/l)1(h0/tw)4(R/h)1. According to the R-value calculated in Table 10, the primary and secondary order of influence of these three factors on the out-of-plane buckling load of the fixed arch with a web opening under vertical load along the arch axis is determined as follows: rise–span ratio (f/l) > web height–thickness ratio (h0/tw) > diameter–depth ratio (R/h). The buckling load trend for each factor change is depicted in Figure 18.
According to Figure 18, the buckling load decreases as the rise–span ratio increases, and the decrease is more pronounced than that of the fixed arch under the concentrated load. For the arched cellular beam under this load, greater emphasis should be placed on the lateral support. The trend of the buckling load decreasing with an increase in web thickness is significantly more pronounced than that under the concentrated load. Hence, when analyzing the arched cellular beam under a vertical uniform load along the arch axis, it is important to fully consider the influence of the web height-to-thickness ratio. The buckling load decreases as the diameter–depth ratio increases, but when the diameter–depth ratio is between 0.54 and 0.571, the load exhibits an upward trend.

5.4. Elastic Buckling Analysis under Horizontal Uniform Vertical Load

Under a horizontal uniform vertical load, the FE buckling eigenvalues of MSJ1~16 (the initial load input of 1000 N/m2) and the calculated out-of-plane critical load are shown in Table 11. According to Formula (2), the calculated range R of each factor under concentrated load is presented in Table 12.
According to the calculation results in Table 11, the optimal levels are the first level of the first factor, the third level of the second factor, and the first level of the third factor. When considering these factors separately, the optimal combination is determined to be a rise–span ratio of 0.2, a web height–thickness ratio of 32.556, and a diameter–depth ratio of 0.467, i.e., (f/l)1(h0/tw)3(R/h)1. According to the R-value calculated in Table 12, the primary and secondary order of influence of these three factors on the out-of-plane buckling load of the fixed arch with a web opening under vertical load along the arch axis is determined as follows: rise–span ratio (f/l) > web height–thickness ratio (h0/tw) > diameter–depth ratio (R/h). The buckling load trend for each factor change is depicted in Figure 19.
According to Figure 19, the buckling load decreases as the rise–span ratio increases, and the decrease is relatively significant. For each increase in the rise–span ratio level, the buckling load decreases by an average of more than 600 kN. Therefore, in the absence of lateral support, it is important to consider the impact of the rise–span ratio on stability. At the initial stage, the buckling load does not decrease significantly as the height–thickness ratio of the web increases. When the height-to-thickness ratio of the web is between 32.556 and 30.842, the decrease in amplitude suddenly increases and decreases by nearly 1000 kN. The buckling load is maximized when the diameter–depth ratio is 0.571, suggesting that a smaller hole does not necessarily guarantee safety.

6. Conclusions

In this study, the behavior of arched cellular beams under static concentrated loads was investigated experimentally. A variable parameter analysis was conducted using the FE software ABAQUS to determine the influence of target factors on the buckling load of the arched cellular beams. The main conclusions of this study are summarized as follows:
(1)
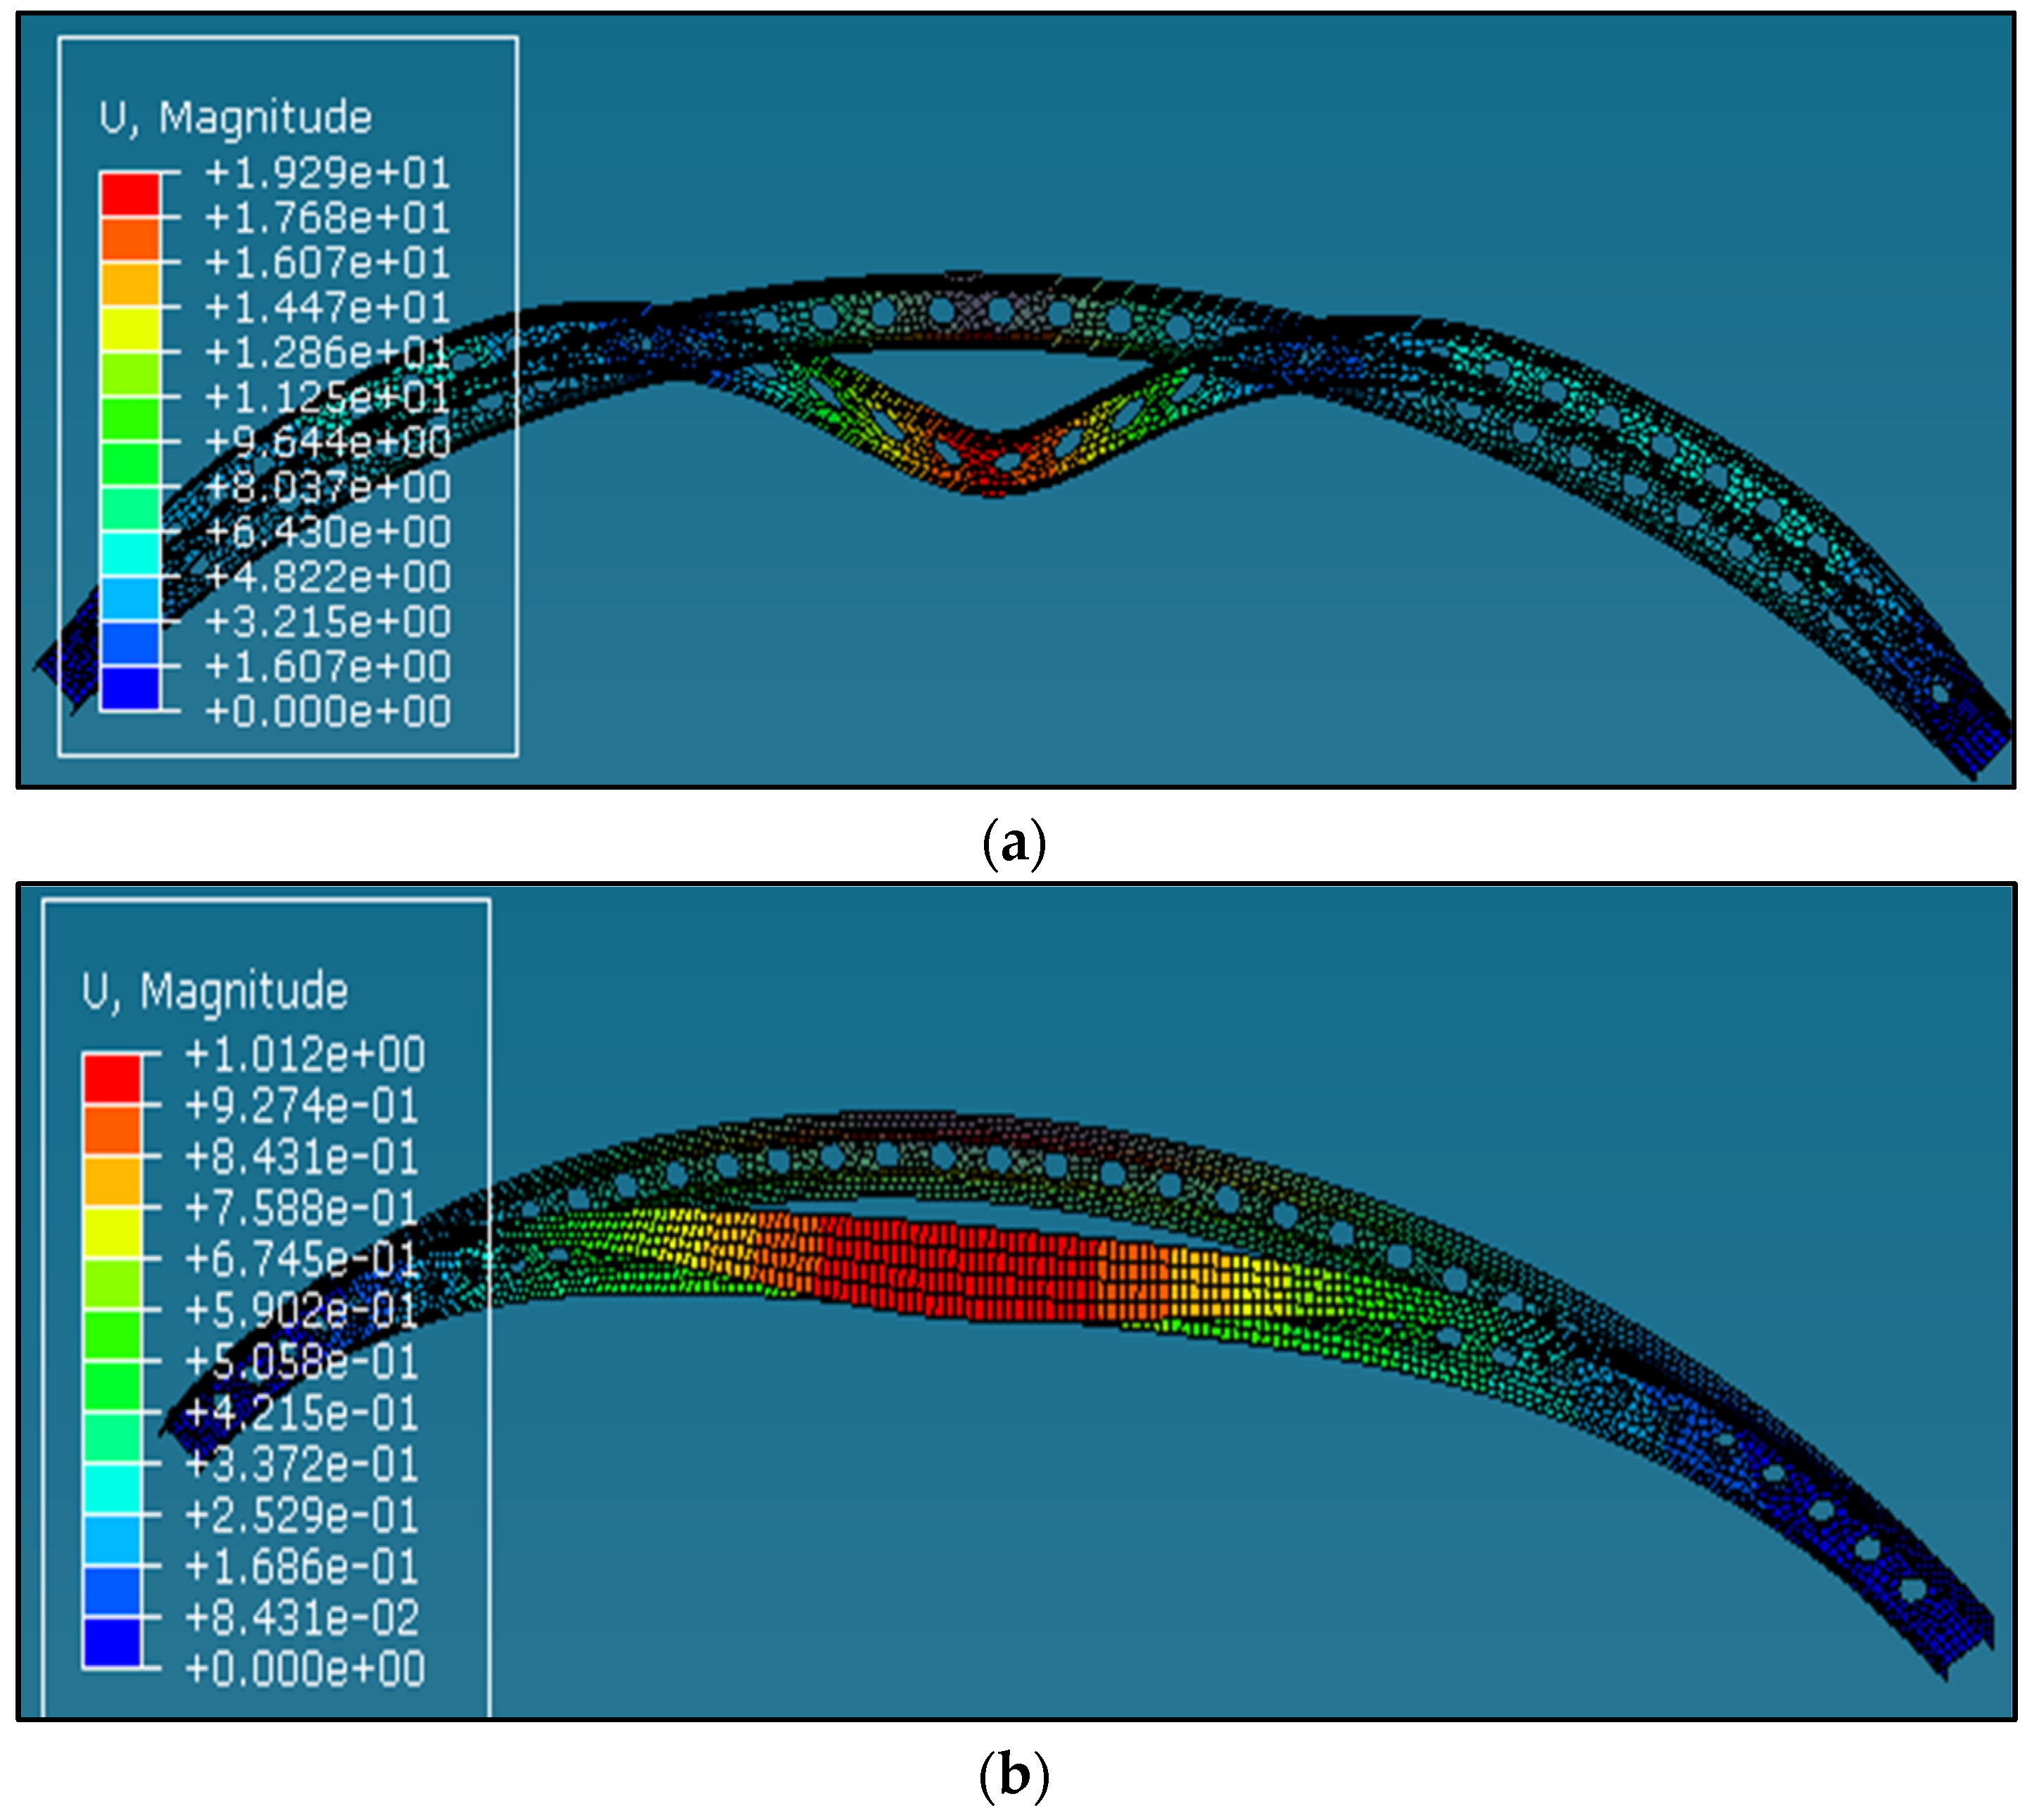
The primary failure modes of arched cellular beams are sinking at the mid-span loading point and bulging upward at L/4 and 3L/4, forming a letter-"M" shape. Furthermore, the arched cellular beam exhibits clear lateral instability.
(2)
The experimental and FE model results, including buckling load and ultimate displacement, were in good agreement, as were the failure modes. Therefore, the FE method can be utilized to conduct multi-factor research on the out-of-plane stability of the arched cellular beam.
(3)
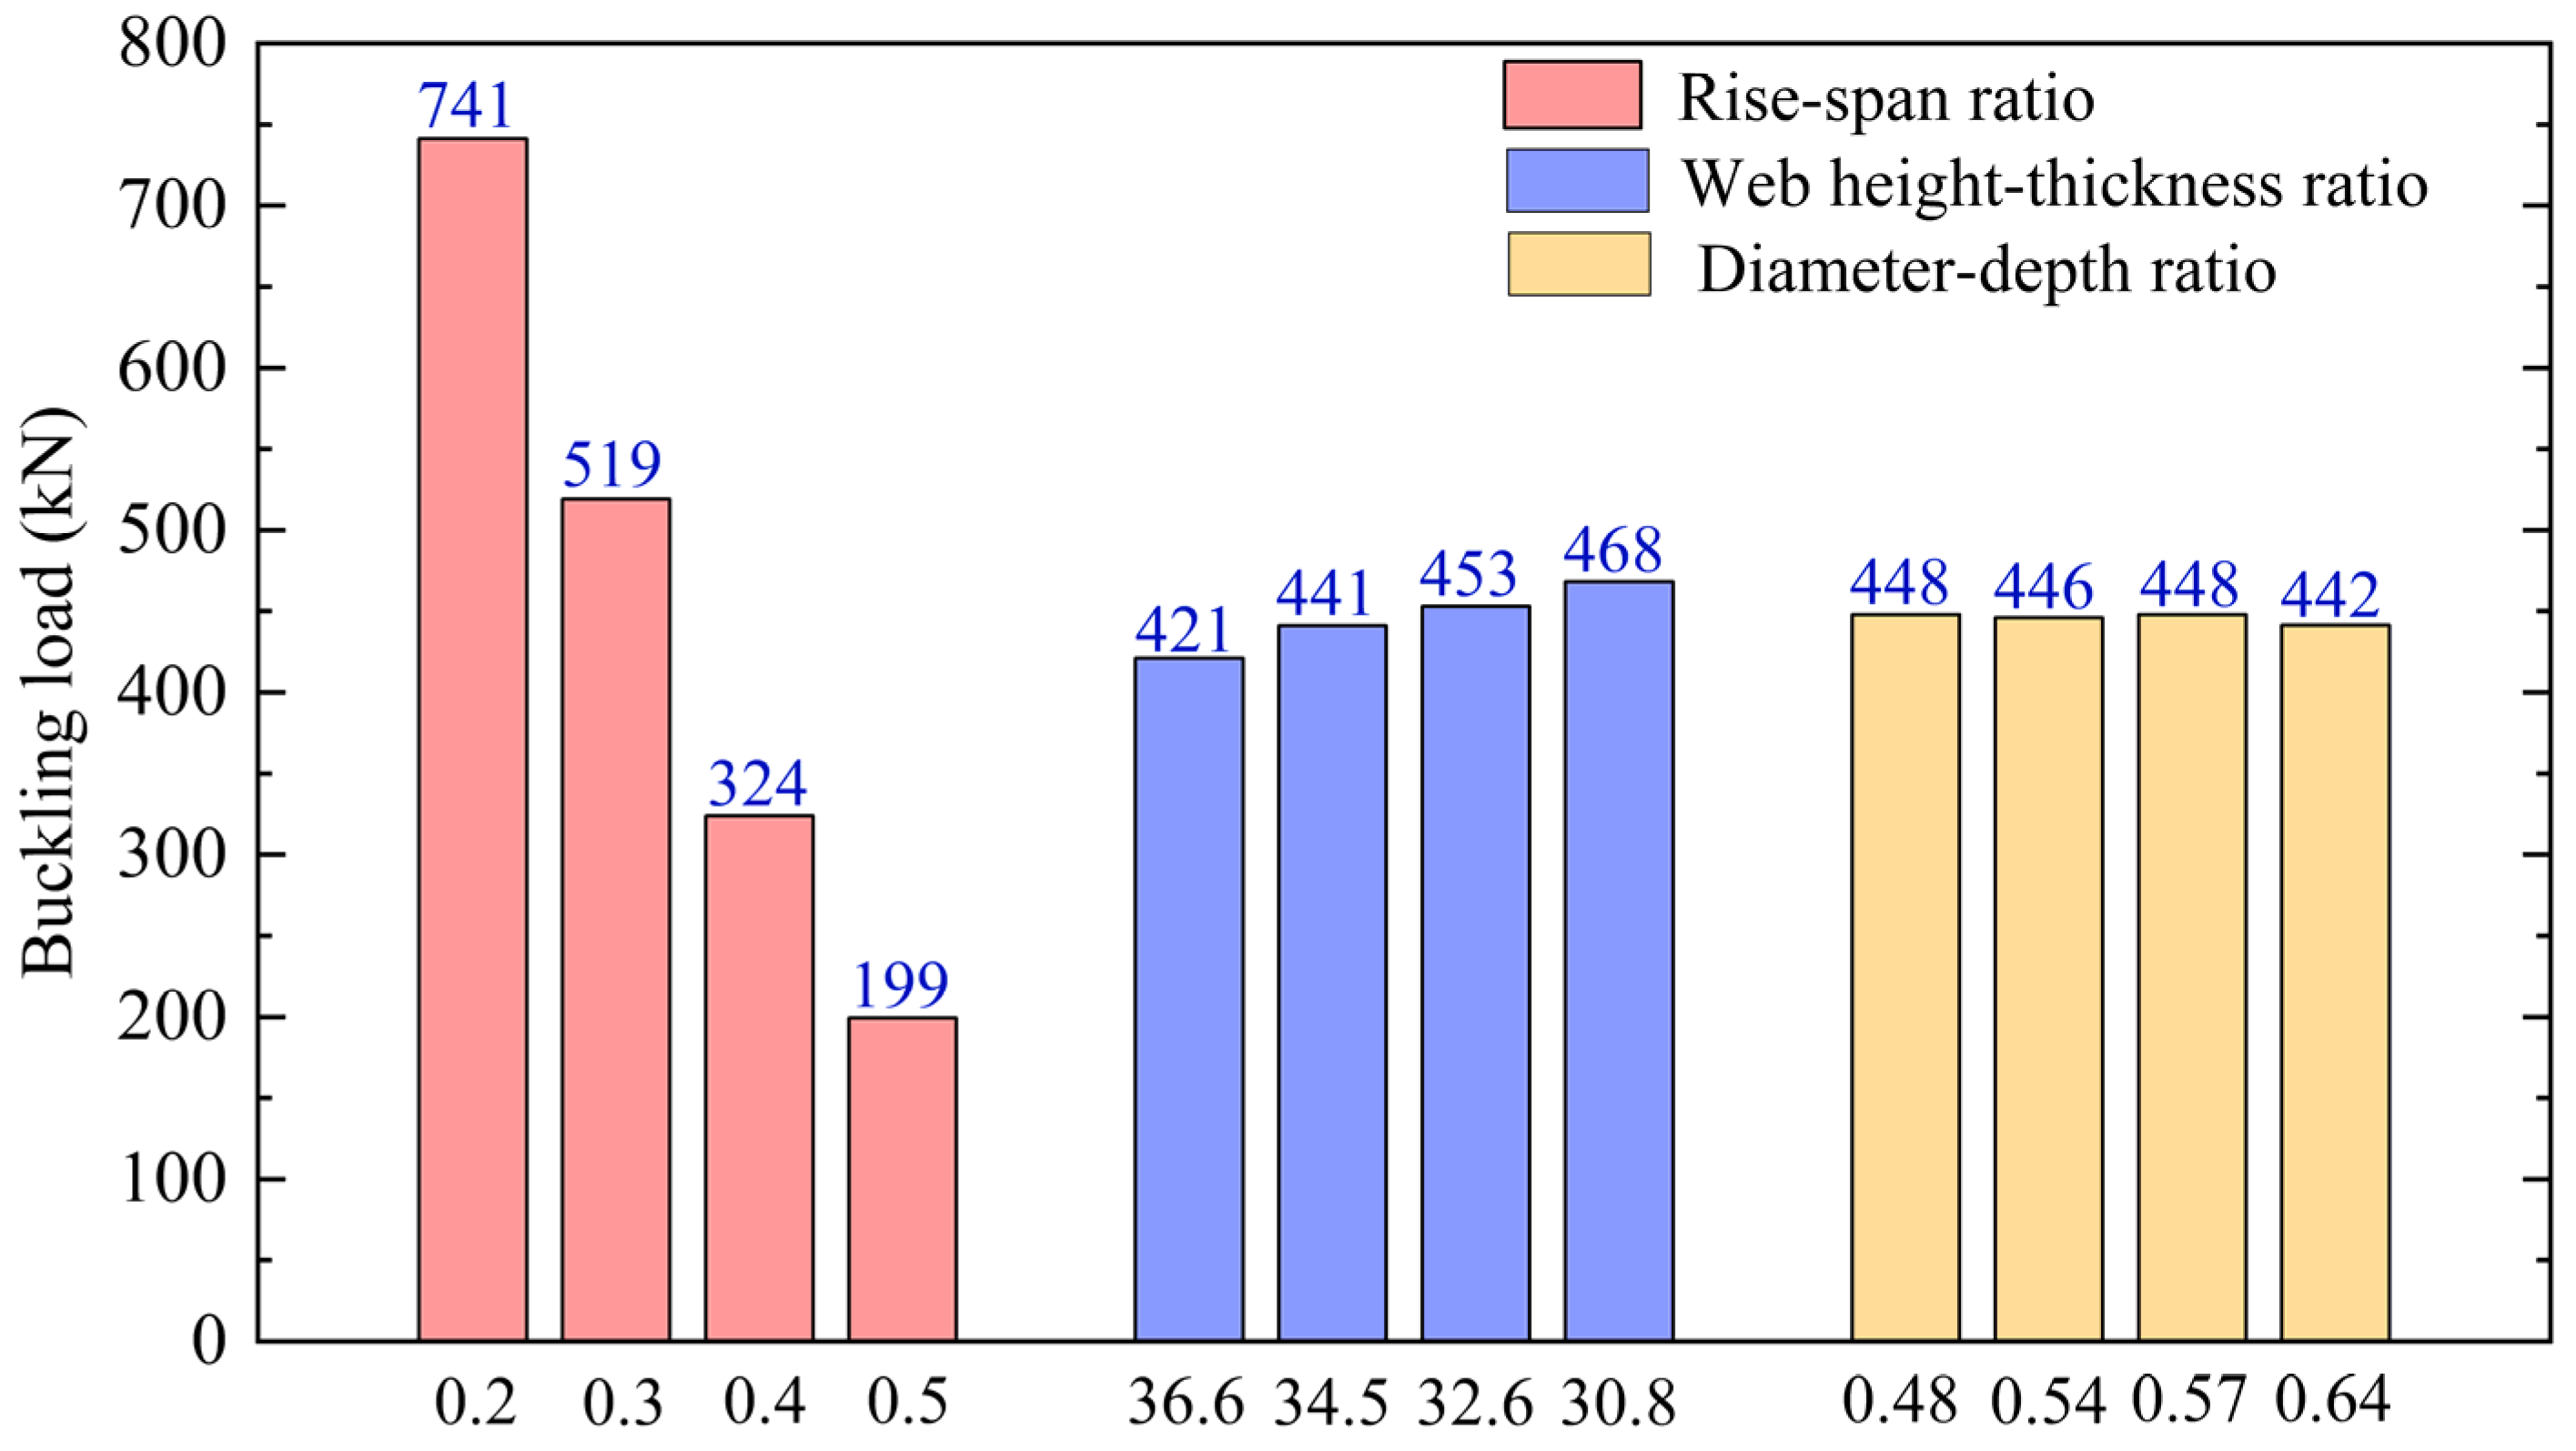
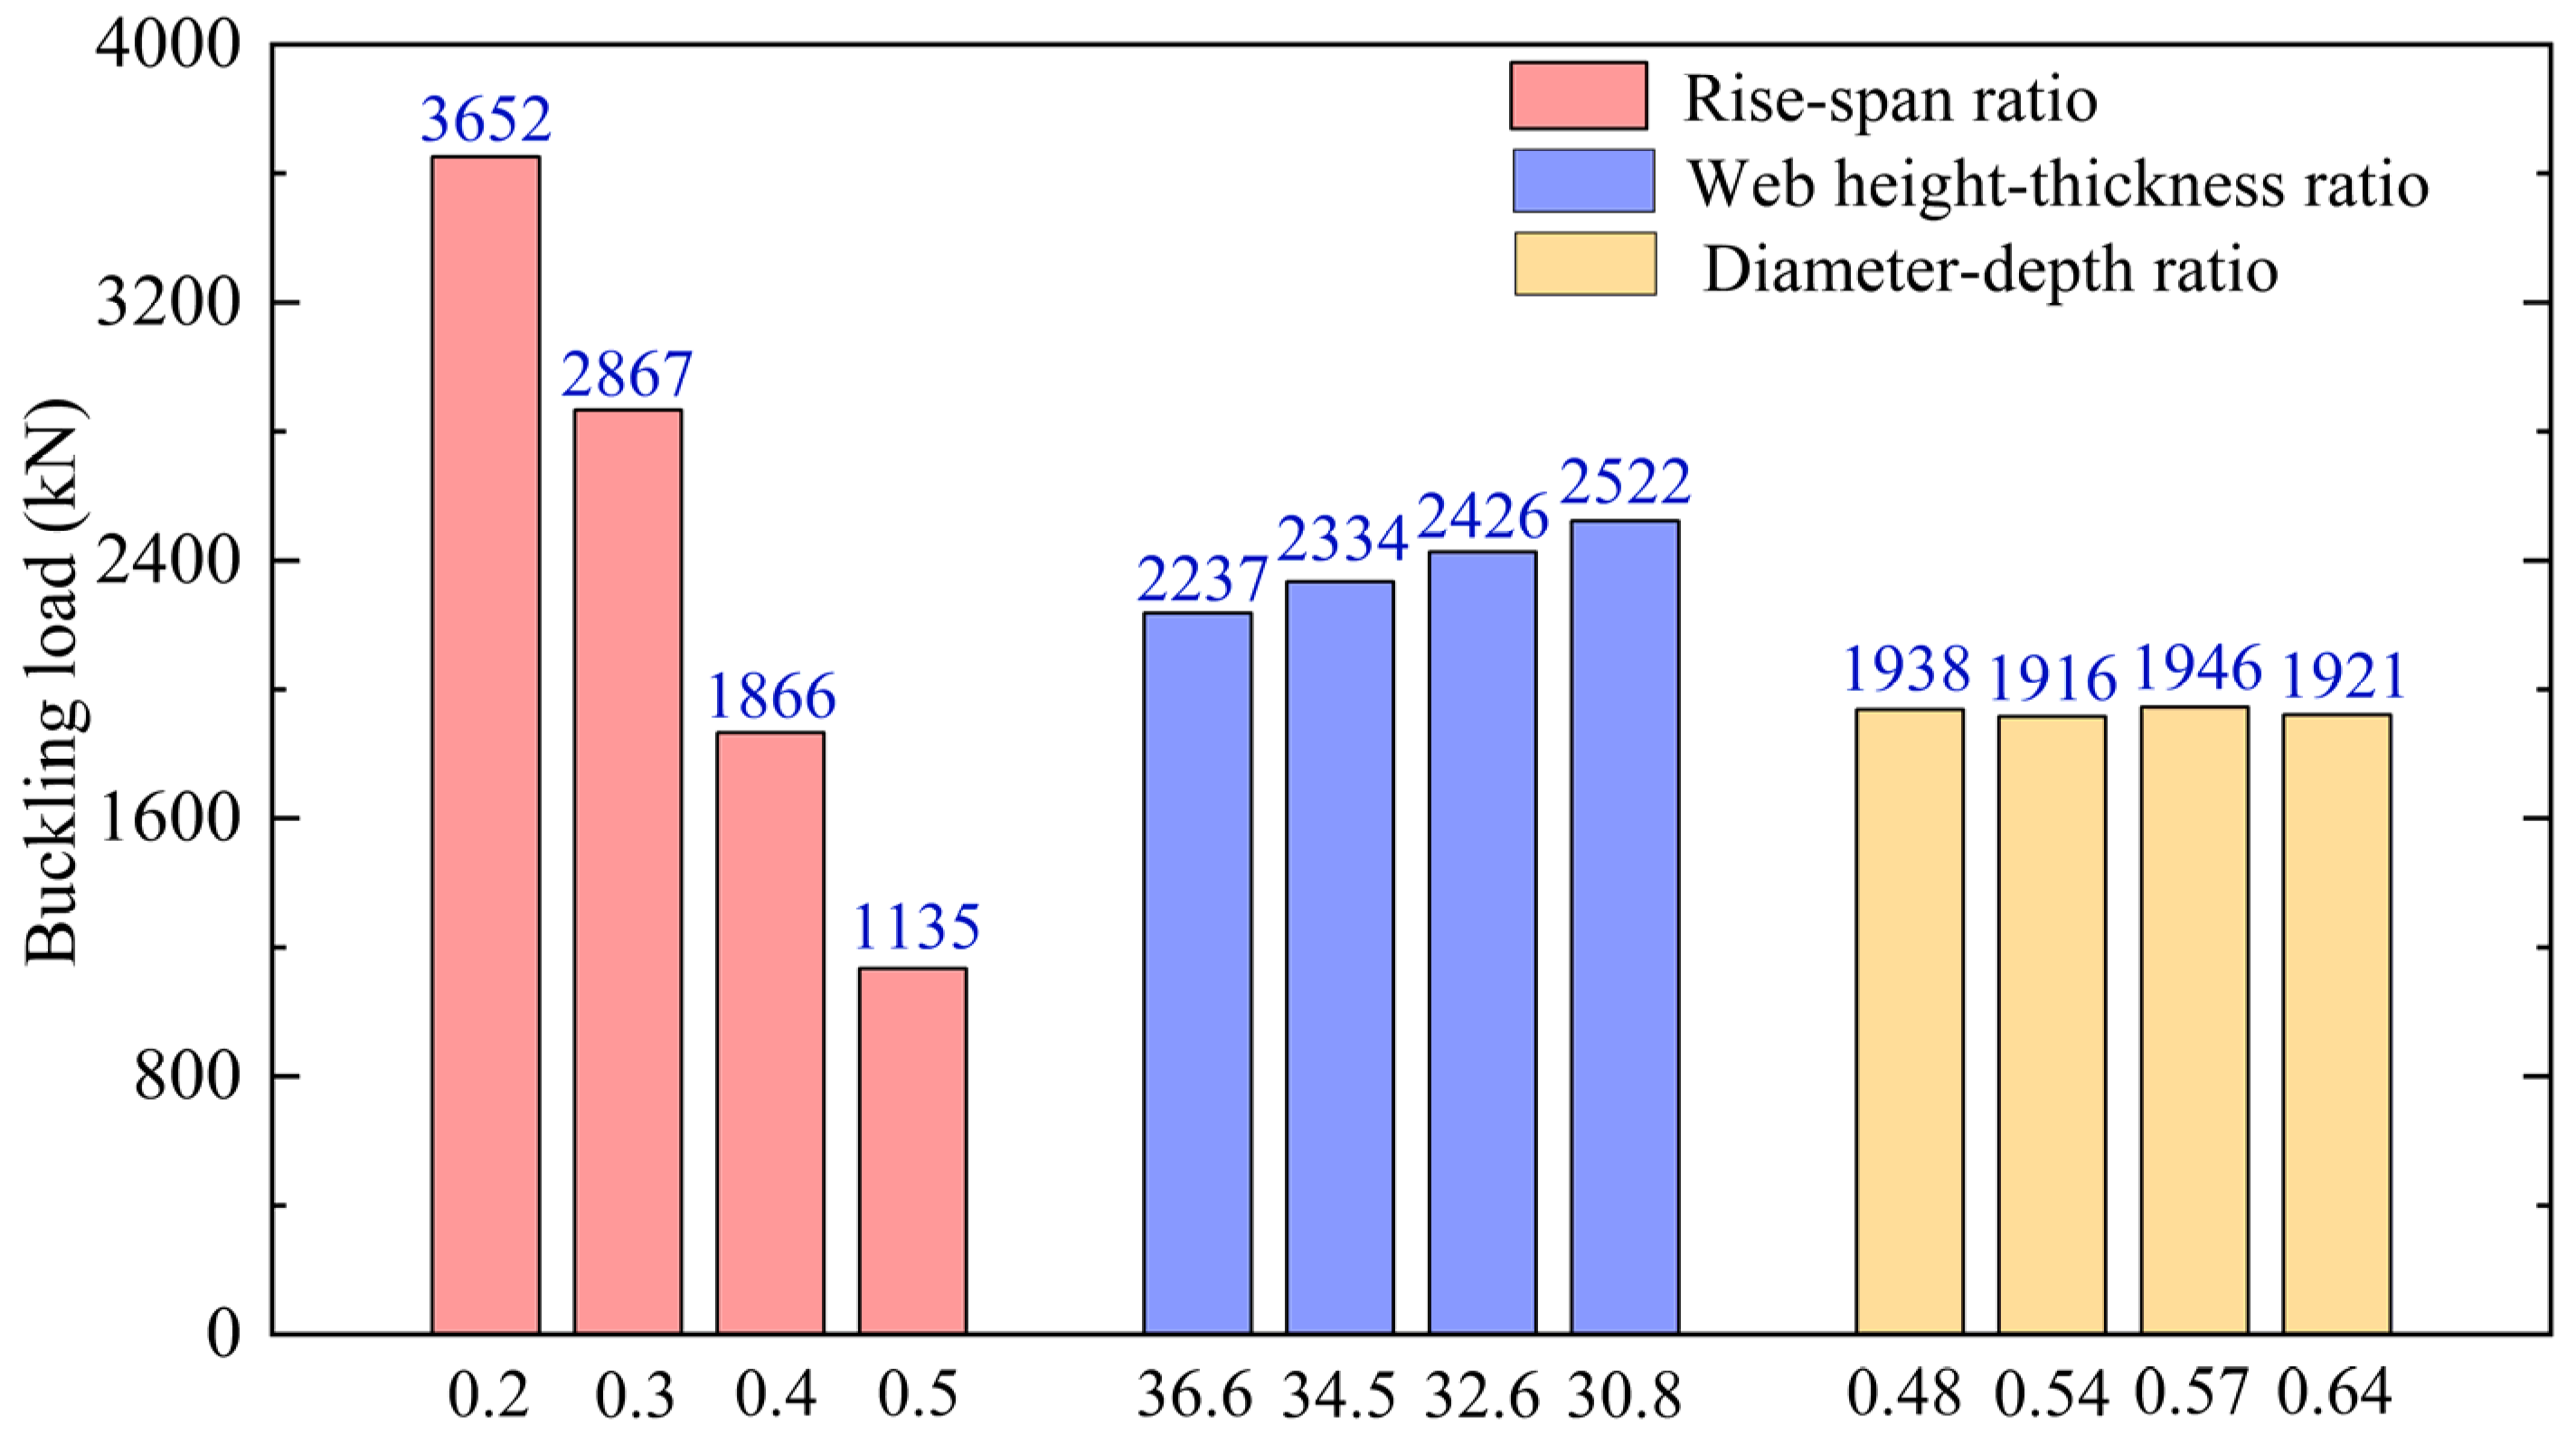
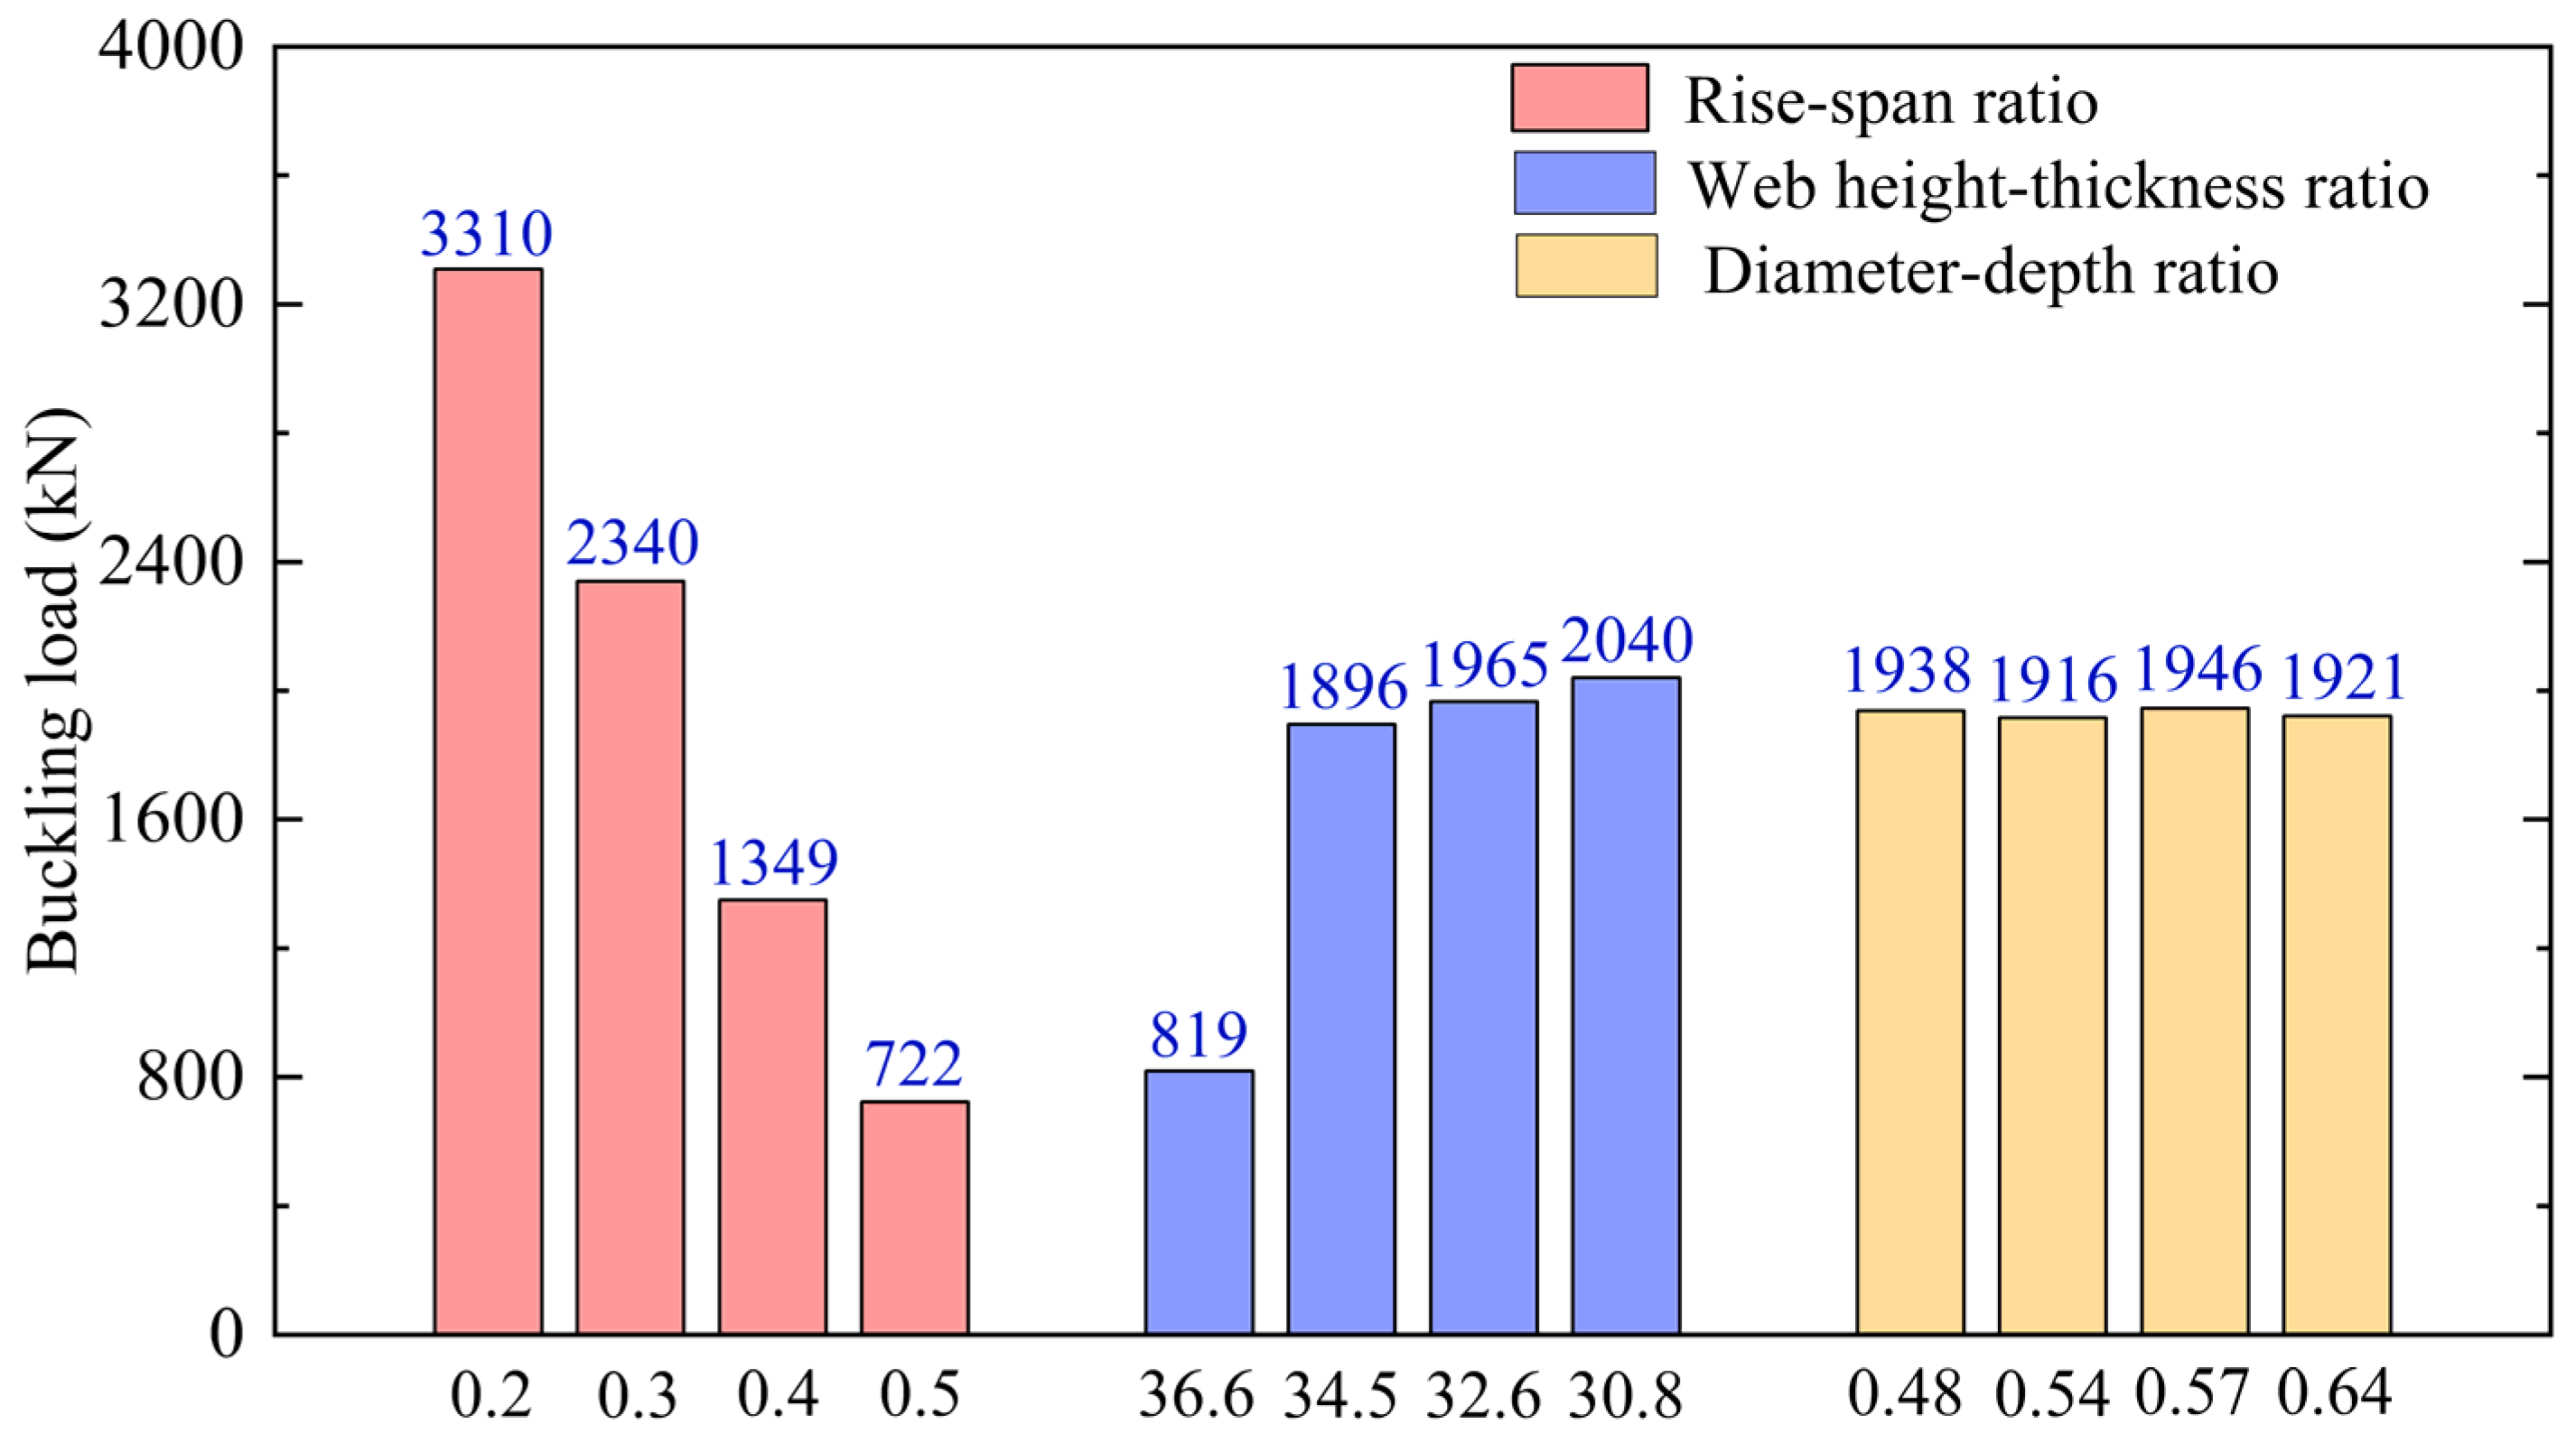
The order of factors affecting the out-of-plane elastic buckling of arched cellular beams under three loads without lateral support is as follows: rise–span ratio > web height–thickness ratio > diameter–depth ratio. This is primarily due to the increase in the arch axial force with the rise–span ratio of the arched cellular beam, leading to a reduction in out-of-plane stiffness and making the specimen more susceptible to out-of-plane instability.
(4)
The optimal combination of factors for the fixed-end arched cellular beam under concentrated load, vertical load along the arch axis, and horizontal uniform vertical load is (f/l)1(h0/tw)4(R/h)3, (f/l)1(h0/tw)4(R/h)1, and (f/l)1(h0/tw)3(R/h)1, respectively.

Author Contributions

Conceptualization, Q.N., S.L. and X.L.; methodology, Q.N. and J.L.; software, J.L. and S.L.; validation, S.L., J.L. and X.L.; formal analysis, Q.N.; investigation, Q.N. and J.L.; resources, X.L.; data curation, Q.N. and S.L.; writing—original draft preparation, Q.N. and J.L.; writing—review and editing, Q.N.; visualization, Q.N. and X.L.; supervision, J.L. and X.L.; project administration, X.L.; funding acquisition, J.L. All authors have read and agreed to the published version of the manuscript.

Funding

This study was supported by the project of Shaanxi Province Key Research and Development Program (grant number: 2022SF-121).

Data Availability Statement

The data used to support the findings of this study are available from the corresponding author upon request. The data are not publicly available due to privacy.

Conflicts of Interest

The authors declare that they have no conflicts of interest.

References

  1. La Poutré, D.B.; Spoorenberg, R.C.; Snijder, H.H.; Hoenderkamp, J.C.D. Out-of-plane stability of roller bent steel arches—An experimental investigation. J. Constr. Steel Res. 2013, 81, 20–34. [Google Scholar] [CrossRef]
  2. Zewudie, B.B.; Buratti, N. Nonlinear Finite Element Analysis and Comparison of In-Plane Strength of Circular and Parabolic Arched I-Section Cellular Steel Beam. Adv. Civ. Eng. 2022, 2022, 4879164. [Google Scholar] [CrossRef]
  3. Zaher, O.F.; Yossef, N.M.; El-Boghdadi, M.H.; Dabaon, M.A. Structural behaviour of arched steel beams with cellular openings. J. Constr. Steel Res. 2018, 148, 756–767. [Google Scholar] [CrossRef]
  4. Rakici, S.C.; Menkulasi, F. Out-of-plane buckling strength of free standing singly symmetric hollow pinned circular arches. J. Constr. Steel Res. 2021, 186, 106914. [Google Scholar] [CrossRef]
  5. Wang, P.; Ma, Q.; Wang, X. Investigation on Vierendeel mechanism failure of castellated steel beams with fillet corner web openings. Eng. Struct. 2014, 74, 44–51. [Google Scholar] [CrossRef]
  6. Morkhade, S.G.; Jagtap, K.R.; Ghorpade, P.S.; Ahiwale, D.D.; Najm, H.M. Buckling performance evaluation of steel cellular beams strengthened with flange cover plate. Asian J. Civ. Eng. 2022, 23, 1277–1290. [Google Scholar] [CrossRef]
  7. Wang, P.; Guo, K.; Liu, M.; Zhang, L. Shear buckling strengths of web-posts in a castellated steel beam with hexagonal web openings. J. Constr. Steel Res. 2016, 121, 173–184. [Google Scholar] [CrossRef]
  8. Panedpojaman, P.; Thepchatri, T.; Limkatanyu, S. Novel design equations for shear strength of local web-post buckling in cellular beams. Thin-Walled Struct. 2014, 76, 92–104. [Google Scholar] [CrossRef]
  9. Nicolas, B.; Joanna, N.; Hugues, S. Experimental and numerical investigations towards the lateral torsional buckling of cellular steel beams. Thin-Walled Struct. 2024, 195, 111388. [Google Scholar]
  10. Fares, S.S.; Coulson, J.; Dinehart, D.W. Castellated and Cellular Beam Design; Steel Design Guide 31; American Institute of Steel Construction: Washington, DC, USA, 2016. [Google Scholar]
  11. Liu, A.; Lu, H.; Fu, J.; Pi, Y.L. Lateral-torsional buckling of fixed circular arches having a thin-walled section under a central concentrated load. Thin-Walled Struct. 2017, 118, 46–55. [Google Scholar] [CrossRef]
  12. Zewudie, B.B.; Jorga, K.Z.; Agon, E.C. Numerical Investigation of Elastic-Plastic Buckling Performance of Circular Arched Cellular Steel Beam; Social Science Electronic Publishing: Rochester, NY, USA, 2023. [Google Scholar]
  13. Timoshenko, S.P. Theory of Elastic Stability; McGraw-Hill: New York, NY, USA, 1936. [Google Scholar]
  14. Schreyer, H.L.; Masur, E.F. Buckling of shallow arches. J. Eng. Mech. Div. ASCE 1966, 92, 1–17. [Google Scholar] [CrossRef]
  15. Austin, W.J.; Ross, T.J. Elastic buckling of arches under symmetrical loading. J. Struct. Div. 1976, 102, 1086–1095. [Google Scholar] [CrossRef]
  16. Bradford, M.A.; Pi, Y.L. A new analytical solution for lateral-torsional buckling of arches under axial uniform compression—ScienceDirect. Eng. Struct. 2012, 41, 14–23. [Google Scholar] [CrossRef]
  17. Hu, C.F.; Pi, Y.L.; Gao, W.; Li, L. In-plane non-linear elastic stability of parabolic arches with different rise-to-span ratios. Thin-Walled Struct. 2018, 129, 74–84. [Google Scholar] [CrossRef]
  18. Han, Q.; Cheng, Y.; Lu, Y.; Li, T.; Lu, P. Nonlinear buckling analysis of shallow arches with elastic horizontal supports. Thin-Walled Struct. 2016, 109, 88–102. [Google Scholar] [CrossRef]
  19. Pi, Y.L.; Bradford, M.A.; Liu, A. Nonlinear Equilibrium and Buckling of Fixed Shallow Arches Subjected to an Arbitrary Radial Concentrated Load. Int. J. Struct. Stab. Dyn. 2017, 17, 1750082. [Google Scholar] [CrossRef]
  20. Sapountzakis, E.J.; Tsiptsis, I.N. Generalized warping analysis of curved beams by BEM. Eng. Struct. 2015, 100, 535–549. [Google Scholar] [CrossRef]
  21. Guo, Y.L.; Zhao, S.Y.; Pi, Y.L.; Bradford, M.A.; Dou, C. An experimental study on out-of-plane inelastic buckling strength of fixed steel arches. Eng. Struct. 2015, 98, 118–127. [Google Scholar] [CrossRef]
  22. Dou, C.; Guo, Y.L.; Pi, Y.L.; Zhao, S.Y.; Bradford, M.A. Effects of shape functions on flexural–torsional buckling of fixed circular arches. Eng. Struct. 2014, 59, 238–247. [Google Scholar] [CrossRef]
  23. Gandomi, A.H.; Tabatabaei, S.M.; Moradian, M.H.; Radfar, A.; Alavi, A.H. A new prediction model for the load capacity of castellated steel beams. J. Constr. Steel Res. 2011, 67, 1096–1105. [Google Scholar] [CrossRef]
  24. Kang, L.; Hong, S.; Liu, X. Shear behaviour and strength design of cellular beams with circular or elongated openings. Thin-Walled Struct. 2021, 160, 107353. [Google Scholar] [CrossRef]
  25. Luo, C.; Wang, F.; Chen, H.; Chen, L.; Fu, C.; Chen, Y.; Liao, Q. Castellated steel beams under impact load. J. Constr. Steel Res. 2022, 196, 107394. [Google Scholar] [CrossRef]
  26. Morkhade, S.; Gupta, L.M. Behavior of Castellated Steel Beams State of the Art Review. Electron. J. Struct. Eng. 2020, 19, 39–48. [Google Scholar] [CrossRef]
  27. Hosseinpour, M.; Sharifi, Y.; Sharifi, H. Neural network application for distortional buckling capacity assessment of castellated steel beams. Structures 2020, 27, 1174–1183. [Google Scholar] [CrossRef]
  28. Dou, C.; Guo, Y.L.; Zhao, S.Y.; Pi, Y.L. Experimental Investigation into Flexural-Torsional Ultimate Resistance of Steel Circular Arches. J. Struct. Eng. 2015, 141, 04015006. [Google Scholar] [CrossRef]
  29. Gholizadeh, S.; Pirmoz, A.; Attarnejad, R. Assessment of load carrying capacity of castellated steel beams by neural networks. J. Constr. Steel Res. 2011, 67, 770–779. [Google Scholar] [CrossRef]
  30. Daryan, A.S.; Sadri, M.; Saberi, H.; Saberi, V.; Moghadas, A.B.; Karimlu, M. Rotational capacity of castellated steel beams. Struct. Des. Tall Spec. Build. 2013, 22, 941–953. [Google Scholar] [CrossRef]
  31. Martin, P.O.; Couchaux, M.; Vassart, O.; Bureau, A. An analytical method for the resistance of cellular beams with sinusoidal openings. Eng. Struct. 2017, 143, 113–126. [Google Scholar] [CrossRef]
  32. Sagali, M.M.; Maximino, G.B.H.; Yinghua, Y. Investigation on the Fire Resistance of Cellular Steel Beam with Sinusoidal Openings. Open J. Civ. Eng. 2023, 13, 637–663. [Google Scholar]
  33. Miranda, L.G.J.; Ribeiro, J.C.L.; de Souza Veríssimo, G.; Paes, J.L.R.; Caldas, R.B. Comparative analysis of fire-adapted models for the shear buckling strength of web-posts in castellated steel beams. Fire Saf. J. 2023, 138, 103796. [Google Scholar] [CrossRef]
  34. Yossef, N.M.; Taher, S. Cost Optimization of Composite Floor Systems with Castellated Steel Beams. Pract. Period. Struct. Des. Constr. 2018, 24, 04018035. [Google Scholar] [CrossRef]
  35. Ellobody, E. Interaction of buckling modes in castellated steel beams. Steel Constr. 2011, 67, 814–825. [Google Scholar] [CrossRef]
  36. Hadeed, S.M.; Alshimmeri, A.J.H. Comparative Study of Structural Behaviour for Rolled and Castellated Steel Beams with Different Strengthening Techniques. Civ. Eng. J. 2019, 5, 1384–1394. [Google Scholar] [CrossRef]
  37. JGJ/T 249-2011; Technical Specification for Arched Steel Structure. Building Industry Press: Beijing, China, 2011. (In Chinese)
  38. GB/T228.1-2010; Metallic Materials Tensile Test-Room Temperature Test Method. China Standard Press: Beijing, China, 2010. (In Chinese)
  39. Vidhatha, K.; Ram, G. Study of Effect of Rise-Span Ratio and Study of Different Hanger Configuration in the Analysis of Bowstring Arch Bridge. Int. J. Eng. Res. Technol. 2019, 8, 41–53. [Google Scholar]
  40. Tian, L.M.; Li, Q.B.; Zhong, W.H.; Wei, J.P. Effects of the rise-to-span ratio on the progressive collapse resistance of Kiewitt-6 single-layer latticed domes. Eng. Fail. Anal. 2019, 106, 104158. [Google Scholar] [CrossRef]
  41. Abaqus Analysis User’s Manual; Abaqus Standard, Version 2020; SIMULIA: Providence, RI, USA, 2020.
  42. Yang, X.; Dong, J.; Yang, J.; Han, X. Similar Material Proportioning Tests and Mechanical Properties Based on Orthogonal Design. Materials 2023, 16, 6439. [Google Scholar] [CrossRef]
Figure 1. The fabrication process of the circular-hole arched cellular beam.
Buildings 14 00229 g001
Figure 2. Details of the test specimen.
Buildings 14 00229 g002
Figure 3. Specimen dimension (unit: mm).
Buildings 14 00229 g003
Figure 4. Experimental setup for tension tests.
Buildings 14 00229 g004
Figure 5. Specimens after tension.
Buildings 14 00229 g005
Figure 6. Test setups of the arched cellular beam specimen. (a) Schematic diagram. (b) Test setup.
Buildings 14 00229 g006
Figure 7. Setups of the displacement gauges. (a) Schematic diagram. (b) Test setup.
Buildings 14 00229 g007
Figure 8. Setups of the strain gauges.
Buildings 14 00229 g008
Figure 9. Mid-span vertical displacement–load curves of the specimens. (a) SJ1. (b) SJ2. (c) SJ3. (d) SJ4.
Buildings 14 00229 g009
Figure 10. Test observations of SJ1. (a) Deformation of “M” shape. (b) Deformation of web hole. (c) Out-of-plane deformation. (d) Deformation of final failure.
Buildings 14 00229 g010
Figure 11. Test observations of SJ2. (a) Out-of-plane deformation. (b) Deformation of final failure.
Buildings 14 00229 g011
Figure 12. Typical strain readings for specimens. (a) SJ1-28. (b) SJ2-33. (c) SJ3-53. (d) SJ4-24.
Buildings 14 00229 g012aBuildings 14 00229 g012b
Figure 13. Mesh subdivision and boundary conditions of FE model.
Buildings 14 00229 g013
Figure 14. Comparison between experimental and FE failure mode of arched cellular beam. (a) Deformation of “M” shape. (b) Out-of-plane deformation.
Buildings 14 00229 g014
Figure 15. Loading mode of arched cellular beam. (a) Horizontal uniform vertical load. (b) Vertical load along the arch axis. (c) Concentrated load.
Buildings 14 00229 g015
Figure 16. In-plane and out-of-plane deformation of arched cellular beam. (a) In-plane deformation. (b) Out-of-plane deformation.
Buildings 14 00229 g016
Figure 17. Buckling load under various factors of arched cellular beam.
Buildings 14 00229 g017
Figure 18. Buckling load under various factors of arched cellular beam.
Buildings 14 00229 g018
Figure 19. Buckling load under various factors of arched cellular beam.
Buildings 14 00229 g019
Table 1. Orthogonal parameters of test specimens.
SpecimensWeb Thickness, tw (mm)Hole Diameter, R (mm)Rise–Span Ratio, f/l
SJ-15.5300.2
SJ-25.5340.3
SJ-37.5300.3
SJ-47.5340.2
Table 2. Geometric dimensions of test specimens.
Specimensh
(mm)
h0
(mm)
b
(mm)
tw
(mm)
t
(mm)
R
(mm)
g
(mm)
l
(mm)
f
(mm)
Number of Holes
SJ-16651805.57.53030200040023
SJ-26651805.57.53430200060023
SJ-36651807.57.53030200060023
SJ-46651807.57.53430200040023
Table 3. Test results of material properties.
Specimensd (Width)
(mm)
b (Thickness)
(mm)
A (Area)
(mm2)
σs (Yield Strength)
(MPa)
σb (Tensile Strength)
(MPa)
δ (Elongation)
(%)
Web-5.5-118.305.50100.65397.42510.0020.43
Web-5.5-218.605.60104.16384.02505.0023.79
Web-5.5-318.645.70106.25385.88485.0021.46
Web-5.5-418.665.70106.36376.08470.0019.20
Average value18.555.63104.36385.85492.5021.22
Flange plate-7.5-119.007.46141.74409.20475.0023.79
Flange plate-7.5-218.567.50139.20366.38490.0021.24
Flange plate-7.5-319.008.00152.00335.26445.0023.79
Flange plate-7.5-418.638.06150.16326.32440.0024.24
Average value18.807.76145.89359.29462.5023.27
Table 4. Loading protocol of vertical force.
SpecimensLoad (kN)Loading Stage
PreloadingFormal Loading
SJ-147.4993-stepLoad per level (kN)1~4-stepLoad per level (kN)5~6-stepLoad per level (kN)
9.5009.5004.750
SJ-241.1163-stepLoad per level (kN)1~4-stepLoad per level (kN)5~6-stepLoad per level (kN)
8.2238.2234.112
SJ-344.4843-stepLoad per level (kN)1~4-stepLoad per level (kN)5~6-stepLoad per level (kN)
8.8978.8974.448
SJ-450.7053-stepLoad per level (kN)1~4-stepLoad per level (kN)5~6-stepLoad per level (kN)
10.14110.1415.071
Table 5. Comparison between experiment and simulation results.
SpecimensVertical Displacement, U2 (mm)Buckling Load, Pu (kN)
ExperimentFEDeviation (%)ExperimentFEDeviation (%)
SJ-148528.3347.3647.4990.29
SJ-2546112.9640.2041.1162.20
SJ-346496.5240.6044.4848.73
SJ-480765.0051.2050.7050.97
Table 6. Orthogonal parameters of specimens.
SpecimensWeb Thickness, tw (mm)h0/twHole Diameter, R (mm)R/hRise–Span Ratio, f/l
MSJ-11636.6253000.4760.2
MSJ-21734.4713400.5400.2
MSJ-31832.5563600.5710.2
MSJ-41930.8424000.6350.2
MSJ-51636.6253400.5400.3
MSJ-61734.4713000.4760.3
MSJ-71832.5564000.6350.3
MSJ-81930.8423600.5710.3
MSJ-91636.6253600.5710.4
MSJ-101734.4714000.6350.4
MSJ-111832.5563000.4760.4
MSJ-121930.8423400.5400.4
MSJ-131636.6254000.6350.5
MSJ-141734.4713600.5710.5
MSJ-151832.5563400.5400.5
MSJ-161930.8423000.4760.5
Table 7. FE eigenvalue and critical load Pcr.
SpecimensEigenvalue, λ (mm)Critical Load, Pcr (kN)SpecimensEigenvalue, λCritical Load, Pcr (kN)
MSJ-12.0672713.1840MSJ-90.8700300.1500
MSJ-22.1491741.4395MSJ-100.8943308.5335
MSJ-32.1738749.9610MSJ-110.9852339.8940
MSJ-42.2027759.9315MSJ-121.0067347.3115
MSJ-51.4228490.8660MSJ-130.5220180.0900
MSJ-61.5083520.3635MSJ-140.5617193.7865
MSJ-71.5006517.7070MSJ-150.5940204.9300
MSJ-81.5887548.1015MSJ-160.6323218.1435
Table 8. The range of various factors under concentrated load.
FactorRise–Span Ratio, f/l
(mm)
Web Height-to-Thickness Ratio
(h0/tw)
Diameter–Depth Ratio
(R/h)
R541.89147.2996.434
Table 9. FE eigenvalue and critical load Pcr.
SpecimensEigenvalue, λ (mm)Critical Load, Pcr (kN)SpecimensEigenvalue, λCritical Load, Pcr (kN)
MSJ-13.98771 × 1053520.35MSJ-91.55059 × 1051715.57
MSJ-24.07760 × 1053599.71MSJ-101.60003 × 1051770.27
MSJ-34.20263 × 1053710.08MSJ-111.77643 × 1051965.44
MSJ-44.28240 × 1053780.08MSJ-121.82073 × 1052014.46
MSJ-52.75281 × 1052697.75MSJ-130.80758 × 1051014.97
MSJ-62.92838 × 1052869.81MSJ-140.87531 × 1051100.09
MSJ-72.91796 × 1052859.60MSJ-150.93225 × 1051171.65
MSJ-83.10337 × 1053041.30MSJ-160.99802 × 1051254.31
Table 10. The range of various factors under vertical load along the arch axis.
FactorRise–Span Ratio, f/l
(mm)
Web Height-to-Thickness Ratio
(h0/tw)
Diameter–Depth Ratio
(R/h)
R2517.3285.3846.25
Table 11. FE eigenvalue and critical load Pcr.
SpecimensEigenvalue, λ (mm)Critical Load, Pcr (kN)SpecimensEigenvalue, λCritical Load, Pcr (kN)
MSJ-13.98771 × 1053190.17MSJ-91.55059 × 1051240.47
MSJ-24.07760 × 1053262.08MSJ-101.60003 × 1051280.02
MSJ-34.20263 × 1053362.10MSJ-111.77643 × 1051421.14
MSJ-44.28240 × 1053425.92MSJ-121.82073 × 1051456.59
MSJ-52.75281 × 1052202.24MSJ-130.80758 × 105646.07
MSJ-62.92838 × 1052342.70MSJ-140.87531 × 105700.25
MSJ-72.91796 × 1052334.37MSJ-150.93225 × 105745.80
MSJ-83.10337 × 1052482.69MSJ-160.99802 × 105798.42
Table 12. The range of various factors under horizontal uniform vertical load.
FactorRise–Span Ratio, f/l
(mm)
Web Height-to-Thickness Ratio
(h0/tw)
Diameter–Depth Ratio
(R/h)
R2587.43152.1229.70
Disclaimer/Publisher’s Note: The statements, opinions and data contained in all publications are solely those of the individual author(s) and contributor(s) and not of MDPI and/or the editor(s). MDPI and/or the editor(s) disclaim responsibility for any injury to people or property resulting from any ideas, methods, instructions or products referred to in the content.

