1. Introduction
In urban planning and infrastructure development, optimizing the spatial allocation of resources is a critical challenge [
1]. The image shown in
Figure 1 showcases a complex urban layout with white dots as street corners forming the primary structure, and the red corners are the selected connection points. White dots mark special junctions or interest points, adding to the complexity. Red roofs and blue house-shaped symbols represent standard and key residential buildings, respectively. The connectivity is depicted by gray lines, mainly linking street corners, suggesting a hierarchical road network. The absence of green lines and the presence of two shades of grey possibly differentiates primary and secondary roads. Notably, three structures with blue roofs and unconnected black circles indicate significant buildings and isolated areas. This representation provides a nuanced view of urban planning, emphasizing diverse elements and their roles.
This paper introduces a novel eight-step iterative algorithm that addresses this challenge by efficiently allocating houses to strategically identified points of interest within a neighborhood [
2]. Utilizing a Mixed Integer Linear Programming (MILP) framework combined with a heuristic approach, the algorithm uniquely integrates the facility location problem with network design principles [
3]. The methodology minimizes the distance between houses and points of interest and optimizes the overall network length through a Minimum Spanning Tree (MST) calculation [
4]. This approach, conceptualized in foundational work [
5], integrates advanced combinatorial optimization techniques to address the complexities of urban planning.
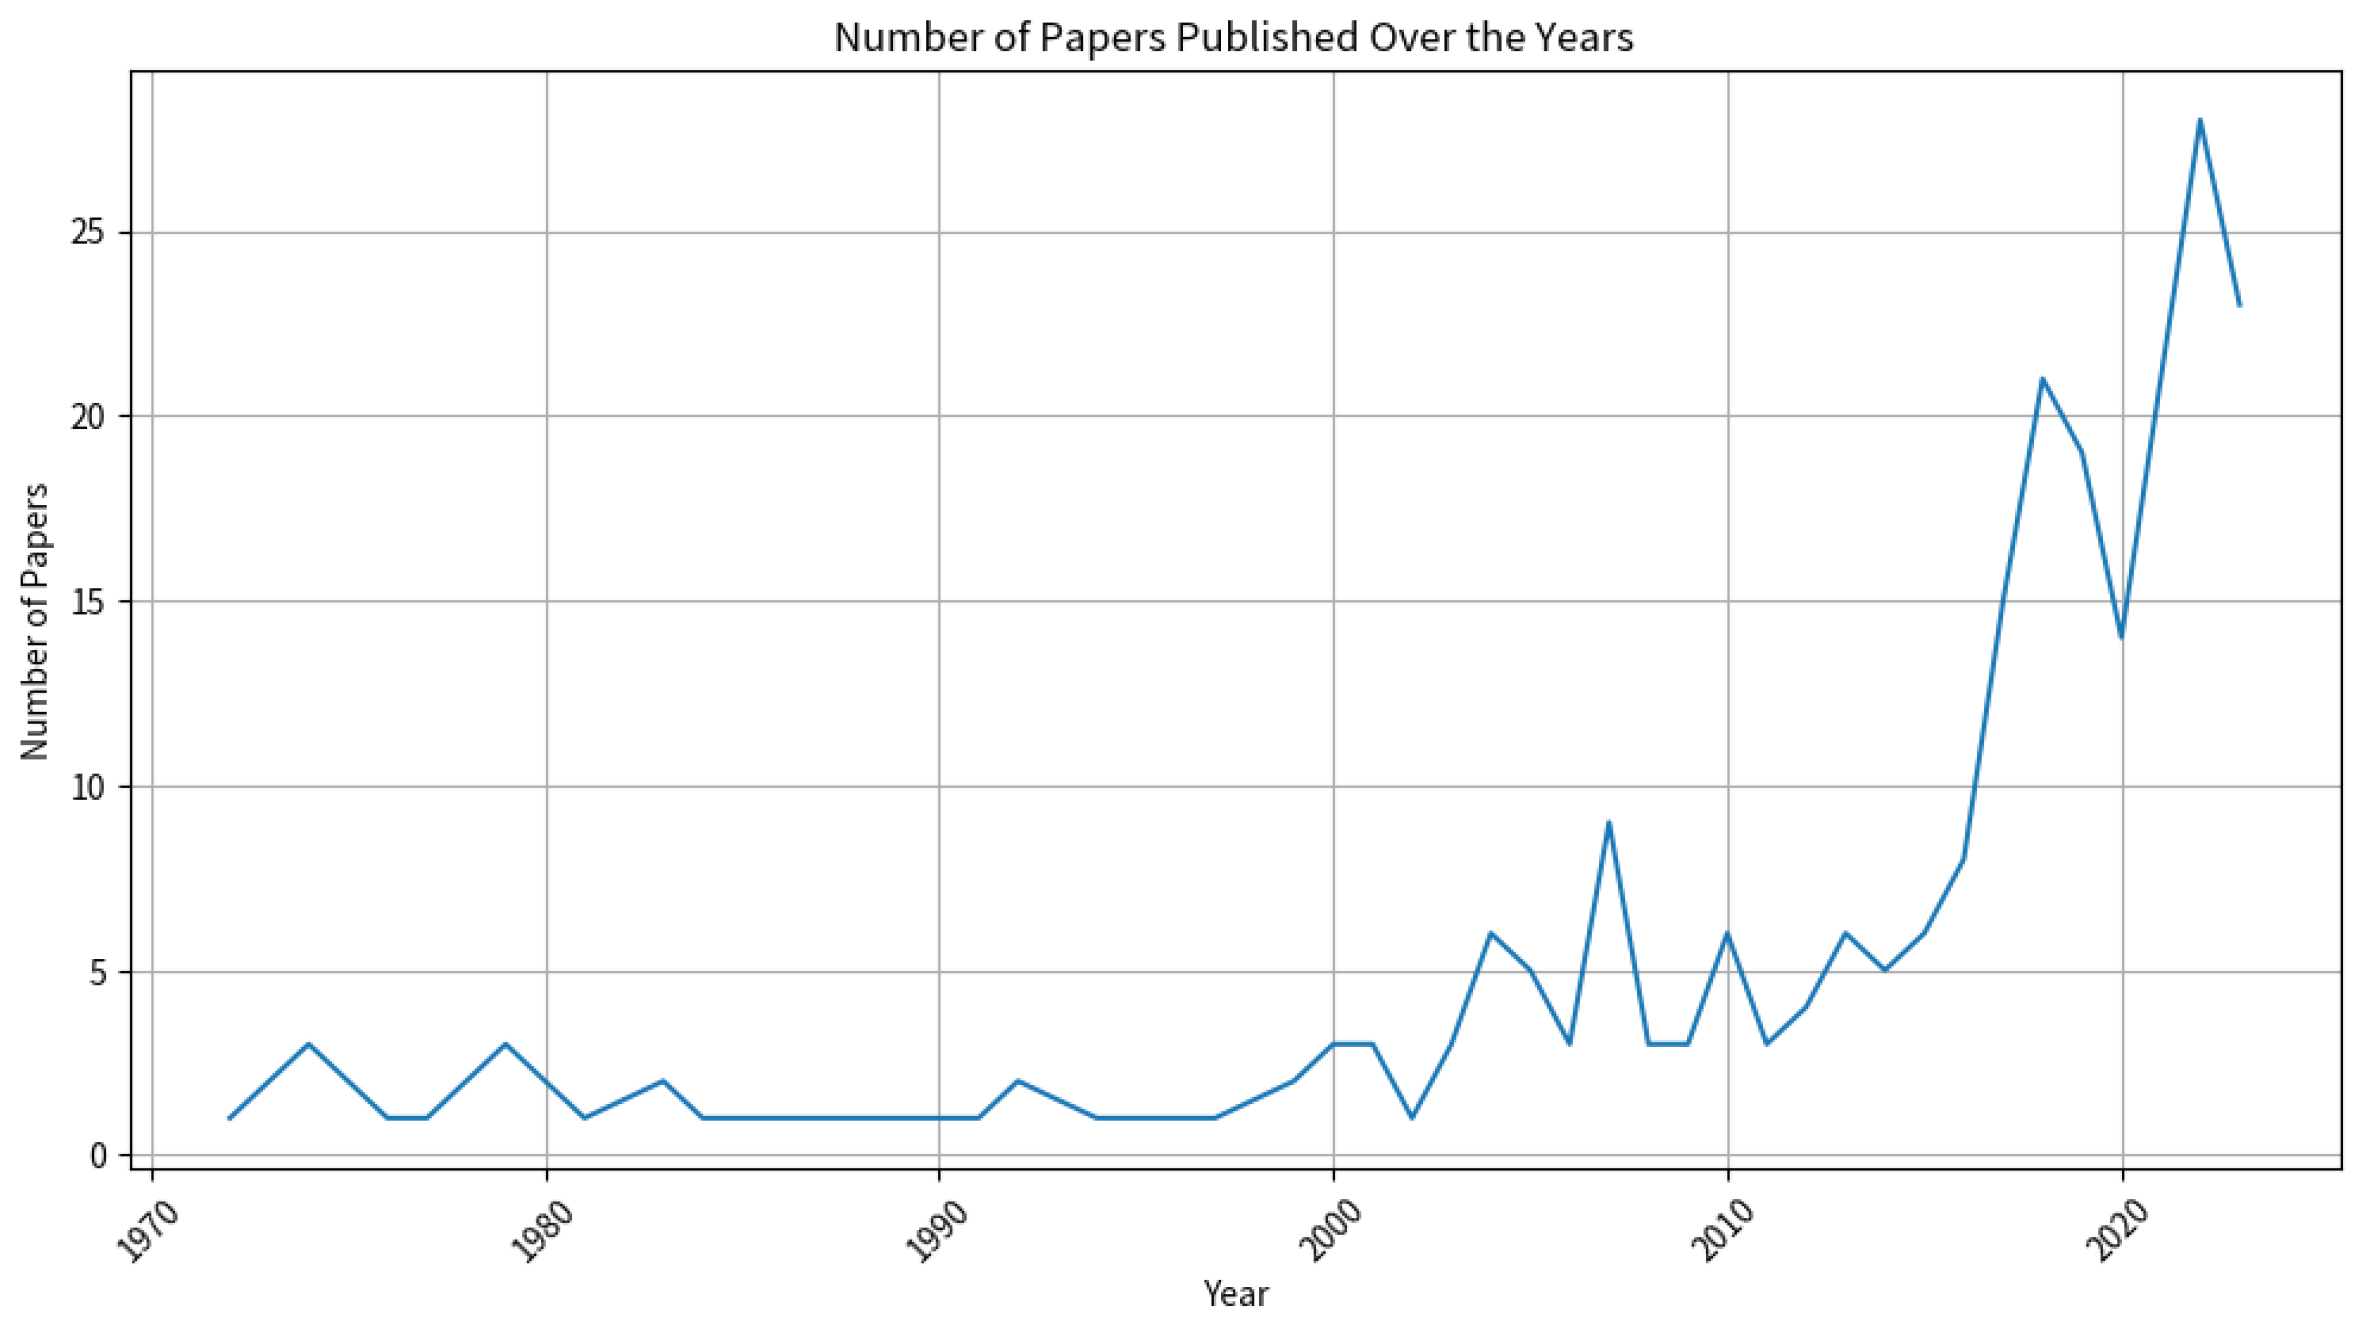
Figure 2 represents an unequivocal escalation in the volume of scholarly publications in this discipline, indicative of escalated scholarly and commercial engagement. Periods of intensified publication frequency are concurrent with critical developments in the field of heuristic algorithms, particularly regarding their application in non-anchored electrical distribution networks and microgrid integration [
6].
The examination graph, depicted in
Figure 3, reveals insightful patterns regarding the contributions of the leading authors in the field of heuristic optimization. Zhang Y. and Li X. led the cohort with seven publications each. Zhang Y.’s main paper focused on efficient and optimal planning [
7], garnering 24 citations [
8], indicating a notable impact within the field. Similarly, Li X. has the research works [
9,
10], on intelligent GIS for high-dimensional spatial problems, and the first has 54 citations, reflecting its significance in the domain.
Maréchal F. and Schüler N., each with six papers, follow closely. Maréchal F.’s research on spatial clustering for district heating was cited 71 times [
11], showcasing its pivotal role in the area. Schüler N., on the other hand, delved into interactive optimization, a paper that was cited 14 times [
12]. Cajot S. is his colleague in the same paper, and Cajot S. also has five publications in the analysis, pointing to a focused but influential readership. Torres M.N. also has five papers, presumably contributing significantly to the discourse in heuristic optimization [
13].
Rodríguez J.P.’s discussions [
13,
14] and Zhu Z.’s findings collectively enriched the field [
15]. The varying citation counts across these authors highlight the breadth of research interests and the diverse impact of their scholarly work. The bar graph’s visual representation stresses the quantitative aspects of research productivity and the qualitative impact, as inferred from citation counts. This analysis points to a rich tapestry of academic engagement within the field, with each author contributing their thread to the ever-evolving knowledge network in heuristic optimization.
Examination of
Table 1 reveals a concentrated interest in applying heuristic algorithms to urban planning and infrastructure development [
16]. The prominence of citations for the listed works indicates a robust academic engagement with topics such as intelligent cities, transit network design, and sustainable supply chain networks [
17]. This focus underscores the relevance of optimization techniques and MILP in addressing complex spatial allocation challenges within the urban development context [
18].
The article is organized as follows:
Section 2 introduces problem formulation.
Section 3 presents the simulation results obtained. Lastly,
Section 4 concludes the article by offering recommendations and suggestions for future research.
2. Methodology
The optimization problem, as delineated by the objective function in Equation (
1), represents a sophisticated variant of MILP. This complexity arises from its amalgamation of facility location dynamics and network design principles, particularly accentuated by incorporating the MST [
26]. The MST’s inclusion heightens the problem’s complexity and introduces intricate constraints critical for forming a valid spanning tree [
27]. These additional constraints significantly amplify the challenge of finding an optimal solution.
This formulation is particularly pertinent in scenarios where the network’s total length, including the interconnections between corners, is of paramount importance [
28]. Such scenarios are commonly encountered in large-scale urban planning and infrastructure development projects. The complexity of this problem necessitates the use of advanced optimization techniques and, in some cases, the development of custom algorithms [
29]. These tools are essential to efficiently navigate the intricate solution space defined by the objective function and constraints, ensuring optimal and practical solutions in real-world applications are realized [
30].
In this optimization problem, the primary objective is to allocate houses to street corners efficiently, minimizing the total distance between them while considering the MST connecting these corners [
31]. The cost function, as defined in Equation (
1), seeks to minimize the sum of two components: the cumulative distances between each house and its assigned corner and the total length of the MST across all corners. This dual focus ensures a balanced approach, optimizing individual house-to-corner connections and the overall network structure. The parameters are explained in
Table 2.
The problem is constrained by several vital conditions to ensure feasibility and practicality. In Constraint 1 (Equation (
2)), variable
is defined such that
if house
i is assigned to corner
j, and
otherwise. This binary delineation ensures that each house is uniquely associated with a single corner, facilitating a distinct and unambiguous allocation within the network. Constraint 2 (Equation (
3)) addresses capacity issues, limiting the number of houses that can be assigned to a single corner. This capacity constraint reflects limited resources such as water, electricity, or gas, ensuring that no corner exceeds its ability to sustainably service the assigned houses. The binary nature of the assignment and MST inclusion variables, as detailed in Constraints 3.1 and 3.2 (Equations (
4) and (
5)), it is ensured that the solution space is discrete and manageable. Finally, Constraint 4, depicted in Equation (
6), ensures that connections between corners form a Minimum Spanning Tree (MST), integral for creating an efficient and cost-effective network. This approach focuses on maximizing the utility of existing infrastructure and enhancing service distribution without the need for introducing new nodes or altering the current urban layout. Optimization is centered around leveraging the full potential of each corner’s capacity within the network, thereby streamlining the existing framework to serve urban requirements better. This comprehensive set of constraints shapes the solution space, guiding the optimization towards practical and efficient network configurations.
Cost Function. The cost function is defined as
Constraints. The problem is subject to the following constraints:
Constraint 1: assignment constraint. Each house must be assigned to exactly one corner.
Constraint 2: capacity constraint. Each corner can be assigned a maximum number of houses.
Constraint 3.1: Binary Variable constraint house to corner.
Constraint 3.2: Binary Variable constraint corner to corner.
Constraint 4: Computation of MST among corners.
The algorithm presented in Pseudocode 1 offers a detailed framework for optimizing the distribution of houses to strategic locations, or corners, within a given urban area. In the initial stages (Steps 1 and 2), the algorithm focuses on accurately representing the urban landscape by acquiring geographic coordinates for houses and identifying crucial intersections or corners. Houses are allocated to corners as they represent the most accessible points within an urban grid, typically found at the intersection of two streets. These strategic points are often utilized as service checkpoints for utilities, making them critical nodes for resource distribution and infrastructure planning. The allocation strategy takes into account not just proximity, but also the capacity constraints, ensuring a balanced and realistic approach to service delivery.
Step 3 introduces a critical component of Algorithm 1, calculation of a distance matrix. This matrix is not just a collection of distances; it embodies the potential connections between each house and corner, serving as a pivotal element in determining the feasibility and efficiency of different house-to-corner assignments. As the algorithm progresses to Step 4, it imposes a practical constraint on the system—the maximum number of houses that each corner can accommodate. This constraint is reflective of real-world limitations, such as infrastructure capacity or regulatory guidelines. The Greedy algorithm applied in Step 5 is then tasked with navigating these constraints to find an optimal assignment of houses to corners. This step is crucial as it balances the need for proximity with the limitations of corner capacities, ensuring a fair and efficient distribution.
| Algorithm 1 Optimization of House-to-Corner Assignments and MST |
- 1:
Step 1: Define House Geographic Scenario - 2:
Get the geographic coordinates for houses - 3:
Let N be the number of houses - 4:
Each house i where - 5:
Step 2: Identify Scenario Corners - 6:
Define corners as intersections or union points of streets - 7:
Let M be the number of corners - 8:
Each corner j where - 9:
Step 3: Calculate Distance Matrix - 10:
Calculate distances between each house i and corner j - 11:
Initialize objective function value to a large number - 12:
while Objective function value not minimized do - 13:
Step 4: Define Restrictions (Constraint 2) - 14:
Set maximum connections C per corner - 15:
Constraint: - 16:
Step 5: Apply Greedy Algorithm (Constraint 1 and 3.1) - 17:
Assign houses to nearest corners respecting C - 18:
Constraint: - 19:
- 20:
Step 6: Calculate MST (Constraint 3.2 and 4) - 21:
Compute MST among corners - 22:
for edges in MST - 23:
Step 7: Calculate Cost Function and Verify Results - 24:
Minimize - 25:
Update objective function value - 26:
Step 8: Iterative Adjustment and Improvement - 27:
Adjust C if necessary and repeat
|
The incorporation of the MST in Step 6 is a strategic move that extends the algorithm’s scope from individual assignments to the broader network design. By computing the MST among the corners, the algorithm ensures that the overall connectivity of the system is as efficient as possible, reducing infrastructure costs and improving accessibility. Steps 7 and 8 are where the algorithm’s iterative nature comes to the forefront. The algorithm continuously refines the objective function, which is a harmonious blend of individual assignments and network efficiency. The algorithm iteratively adjusts the maximum connections and reassesses the assignments, striving for an optimal balance between the proximity of houses to corners and the overall network layout. This iterative process is a testament to the algorithm’s adaptability and its ability to fine-tune the urban layout to meet specific needs and constraints.
The algorithm’s utility extends beyond mere theoretical constructs, providing a tangible tool for both the planning and evaluation of urban service distributions such as electricity, gas, and internet infrastructures [
32]. It offers planners a proactive means to design future urban layouts with an optimized network of services, addressing the ’last mile’ connectivity that is often the most challenging aspect of urban planning. Concurrently, it serves as an analytical instrument to assess existing networks, identifying areas of inefficiency and potential enhancements [
33,
34]. This dual functionality allows for a comprehensive approach to urban development, where the algorithm can assist in creating resilient and robust infrastructures that cater to the dynamic needs of urban populations. Such a method is crucial for evolving cities, promoting sustainability, and ensuring that the growing demand for utility services is met with intelligent design and foresight [
35,
36].
3. Result Analysis and Discussion
In the initial phase of the analysis, as depicted in
Figure 4, a scatter plot was generated to visualize the spatial distribution of randomly generated house locations. This plot, the Step 1 output in Algorithm 1, is a foundational element for further exploration. The latitude and longitude coordinates, represented on the x-axis and y-axis, respectively, reveal a concentrated clustering of points within the defined limits. These limits, set between
for latitude and
for longitude, encapsulate a specific geographic area. The density and spread of the points within this range offer insights into the potential variability and uniformity of data distribution. This initial visualization sets the stage for a more detailed examination of spatial patterns and their implications in subsequent stages of analysis.
The analysis of the generated graphs, as depicted in
Figure 5 and
Figure 6, reveals insightful aspects of the applied algorithms and their implications on the dataset representing end-user locations.
Figure 5 illustrates the outcome of Prim’s algorithm, a classic approach in graph theory for finding an MST in a weighted undirected graph. The algorithm’s deterministic nature ensures that, given a specific set of input data, the resulting MST remains consistent across multiple executions. In this context, the MST effectively links all nodes (houses) while minimizing the total edge weight corresponding to the aggregate distance between houses. This optimization is crucial in scenarios where the overall connectivity cost or distance must be minimized, such as network design or urban planning.
On the other hand,
Figure 6 showcases the application of Dijkstra’s algorithm on the MST obtained from Prim’s algorithm. Dijkstra’s algorithm, renowned for its efficiency in finding the shortest path between nodes in a graph, traverses the MST from a predefined starting node to an ending node. The path highlighted in
Figure 6 represents the shortest route to connect the 1st and the 150th node, traversing through the MST. This path is particularly significant as it demonstrates the algorithm’s capability to navigate through a pre-structured network (the MST) while ensuring the shortest route between two points. In
Figure 6, the corner markers are intentionally subdued to emphasize Dijkstra’s algorithm path, showcasing the most efficient route between the first and last nodes and ensuring the clarity of the algorithm’s outcome. Combining these algorithms is a powerful tool in spatial analysis, providing a methodical approach to solving complex routing and network design problems. The nature of these algorithms, rooted in their deterministic and optimization-focused design, offers a reliable framework for addressing various logistical and spatial challenges.
As depicted in
Figure 7, the generated graph presents a comprehensive scenario that includes house locations and grid corners. This visual representation is instrumental in analyzing the spatial distribution of randomly placed houses against a systematically structured grid. The grid corners, delineated by red dots, form a
matrix that spans approximately
of the total area under consideration. These corners are aligned along horizontal and vertical axes, creating a structured network of lines that intersect regularly. In contrast, the blue dots, representing houses, are randomly scattered, offering a stark juxtaposition to the orderly grid layout. This contrast highlights the randomness inherent in the house locations as opposed to deliberate structuring of the grid.
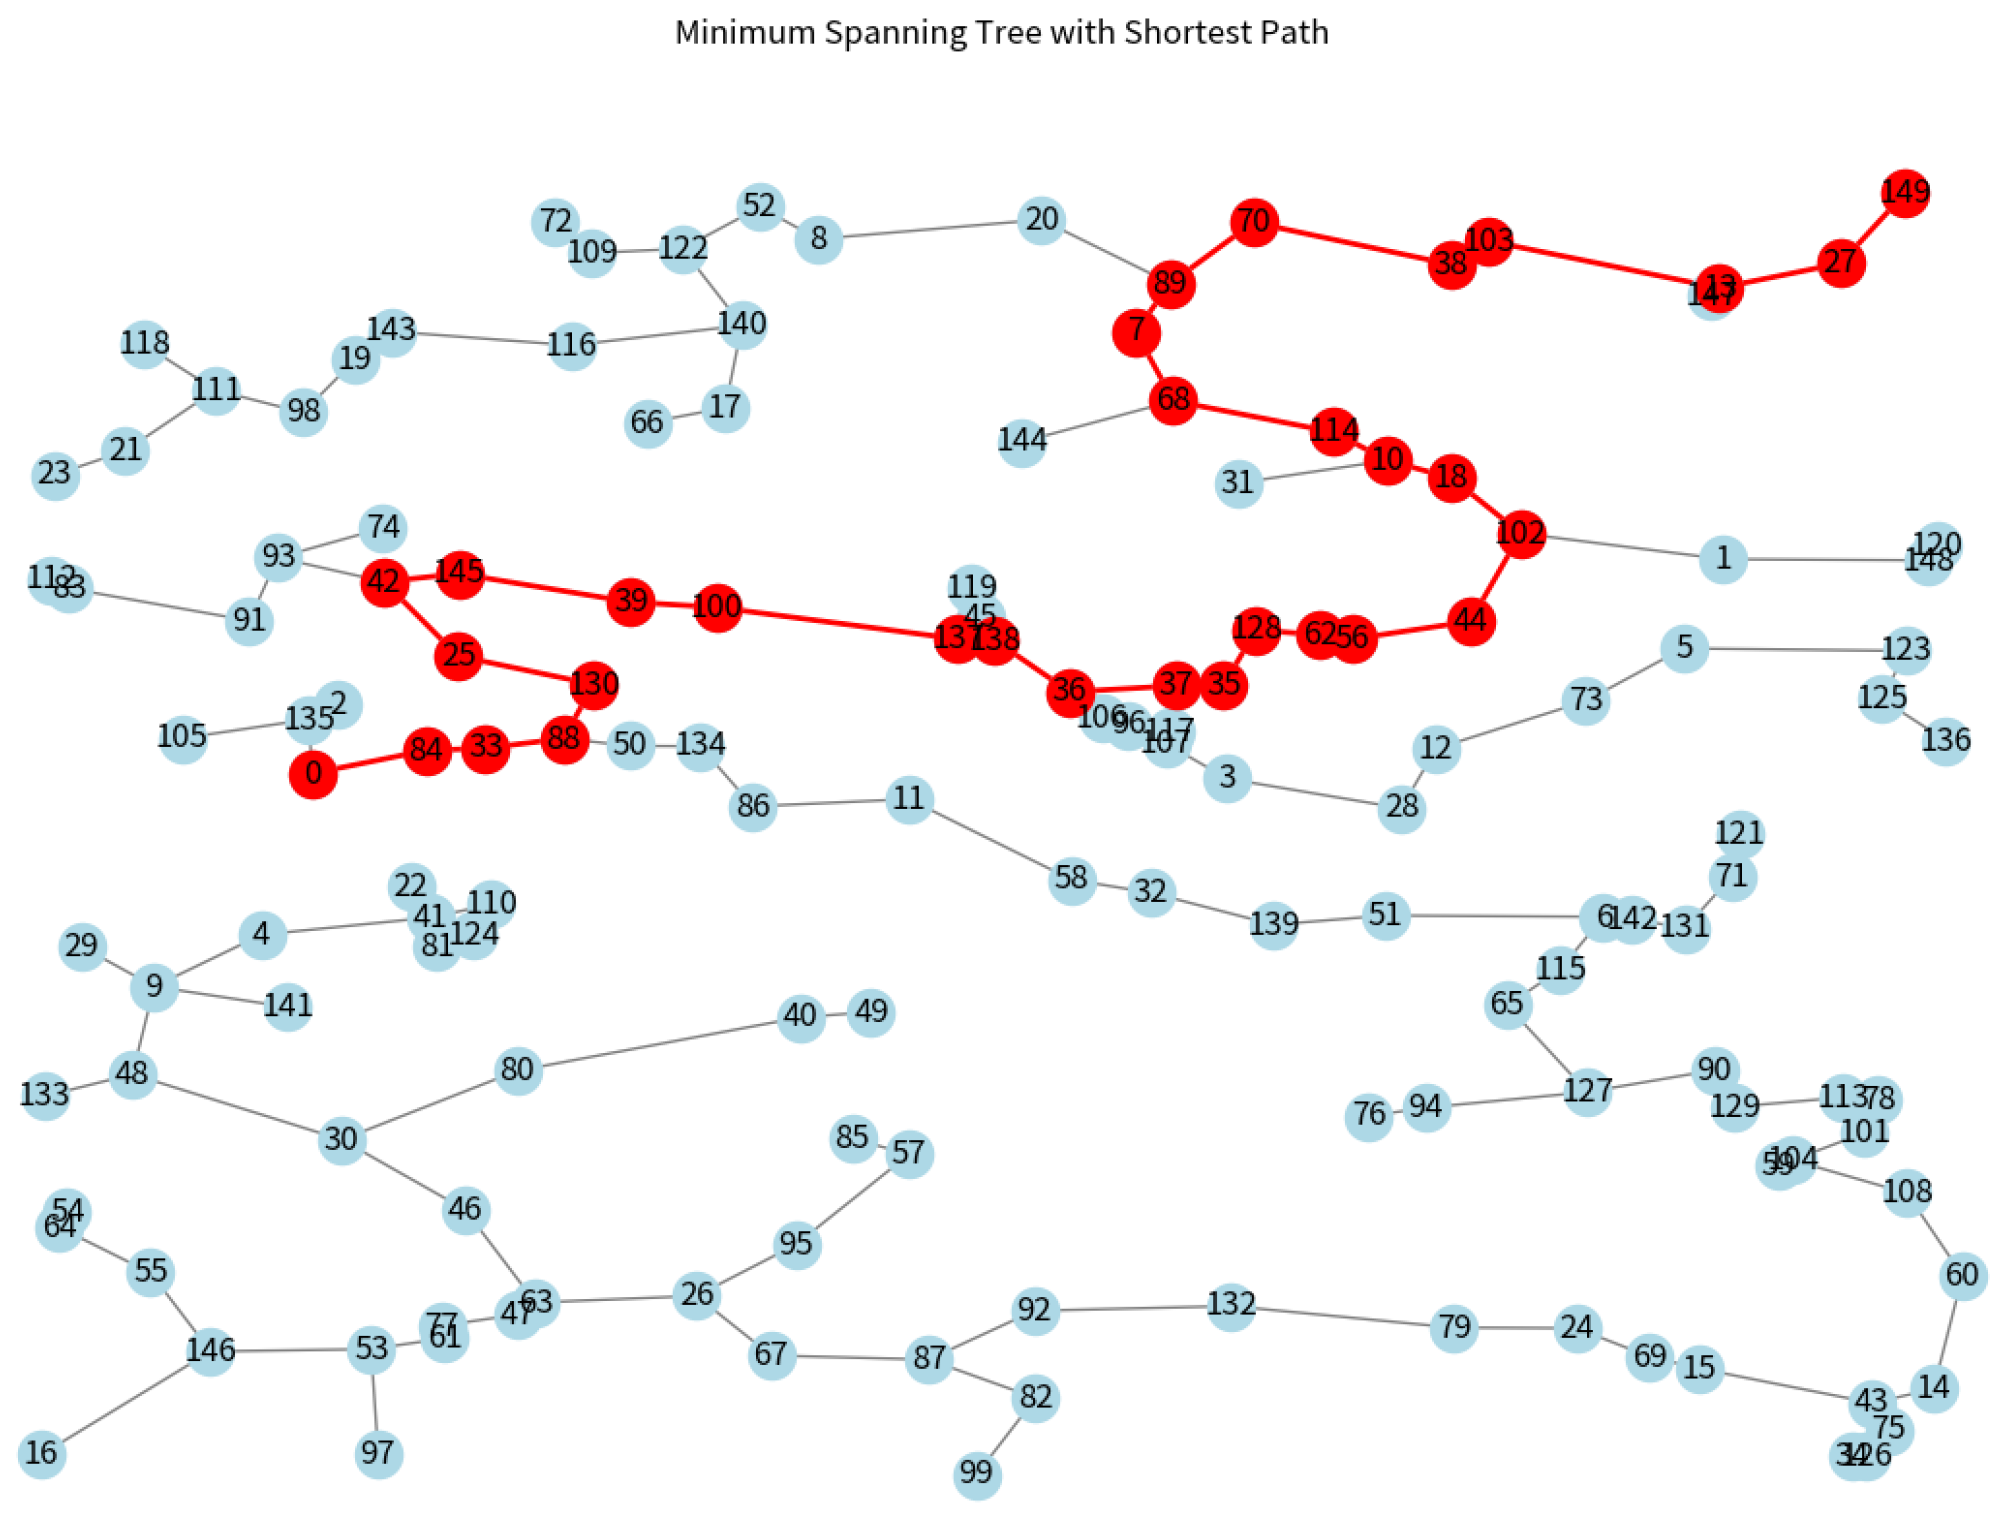
The generated graph in
Figure 8 illustrates an MST with an integrated shortest path, encompassing both corner and house locations. This network topology, derived from a heuristic amalgamation of Prim’s and Dijkstra’s algorithms, reveals an intricate web of connections that optimize for the shortest total path length. The layout underscores the potential for efficient communication networks, where such a configuration could facilitate rapid and direct information transfer. However, it is noteworthy that electrical networks typically require different considerations such as load balancing and redundancy, which are not addressed by this method. While effective in this context, the mixed-method approach highlights the nuanced requirements of different network types and the necessity for tailored solutions.
The distance matrix calculation, as outlined in Step 5 of Algorithm 1, forms the foundation for applying the Greedy algorithm to assign houses to the nearest corners. This matrix, a pivotal algorithm component, quantifies the Euclidean distances between each house and corner, enabling the algorithm to make informed decisions about assignments. A notable distribution of houses to corners is observed upon applying the Greedy algorithm with a constraint of five maximum connections per corner, as depicted in
Figure 9. However, increasing this constraint to seven, shown in
Figure 10, alters the distribution pattern. In
Figure 9, specific houses, particularly one in the top right corner of the graph, are connected to relatively far corners. This outcome highlights a limitation of the Greedy approach, where the nearest available corner may not always be the closest in absolute terms. While adhering to the constraints, the assigned links reveal the algorithm’s tendency to prioritize immediate availability over proximity, leading to some houses being connected to less optimal corners.
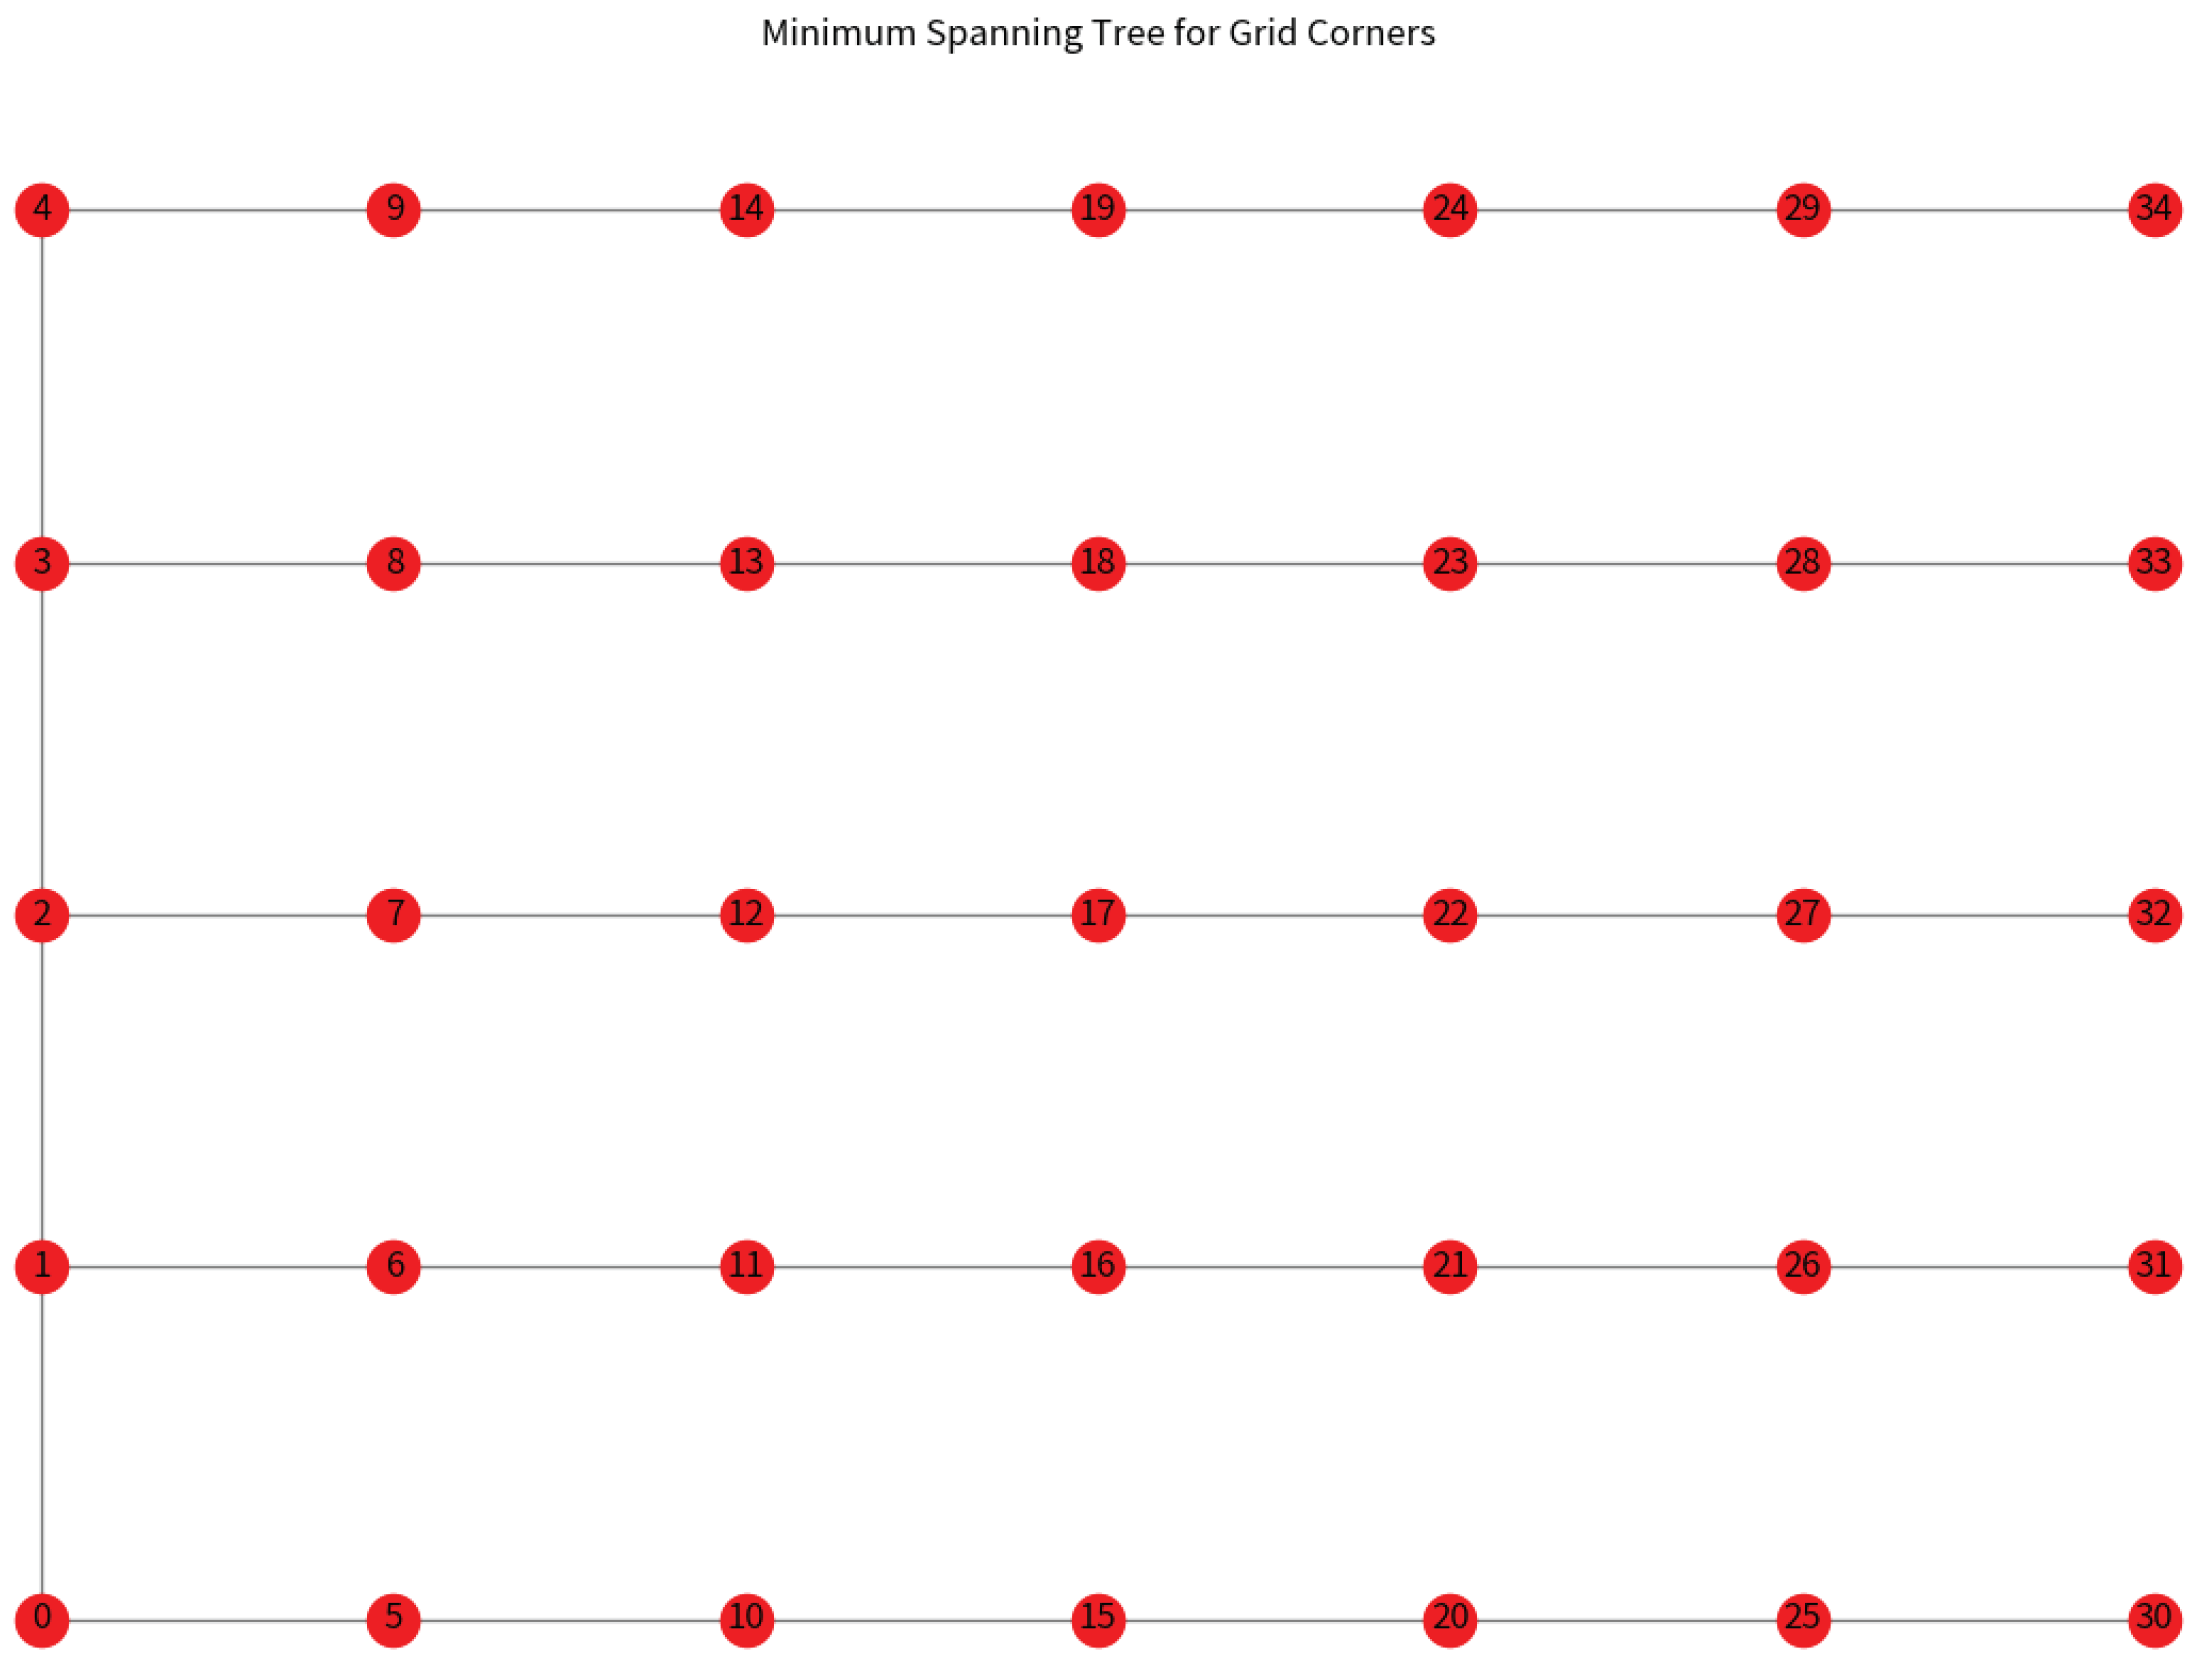
In the context of the MST among corners, as depicted in
Figure 11, the application of Prim’s algorithm (Step 6 of Algorithm 1) reveals insightful patterns in spatial connectivity. This algorithm, renowned for efficiently constructing an MST, iteratively adds the shortest edge connecting a new vertex to the tree. The resulting graph underscores the inherent spatial hierarchy among the corners, highlighting the most cost-effective pathways to interconnect these nodes. As generated by Prim’s algorithm, the distribution of edges in the MST reflects a balance between proximity and coverage, ensuring that each corner is connected with minimal total edge length. The spatial configuration of the corners, coupled with the algorithm’s preference for shorter connections, leads to a tree structure that is both compact and comprehensive, providing a fundamental understanding of the underlying network structure within the given spatial constraints.
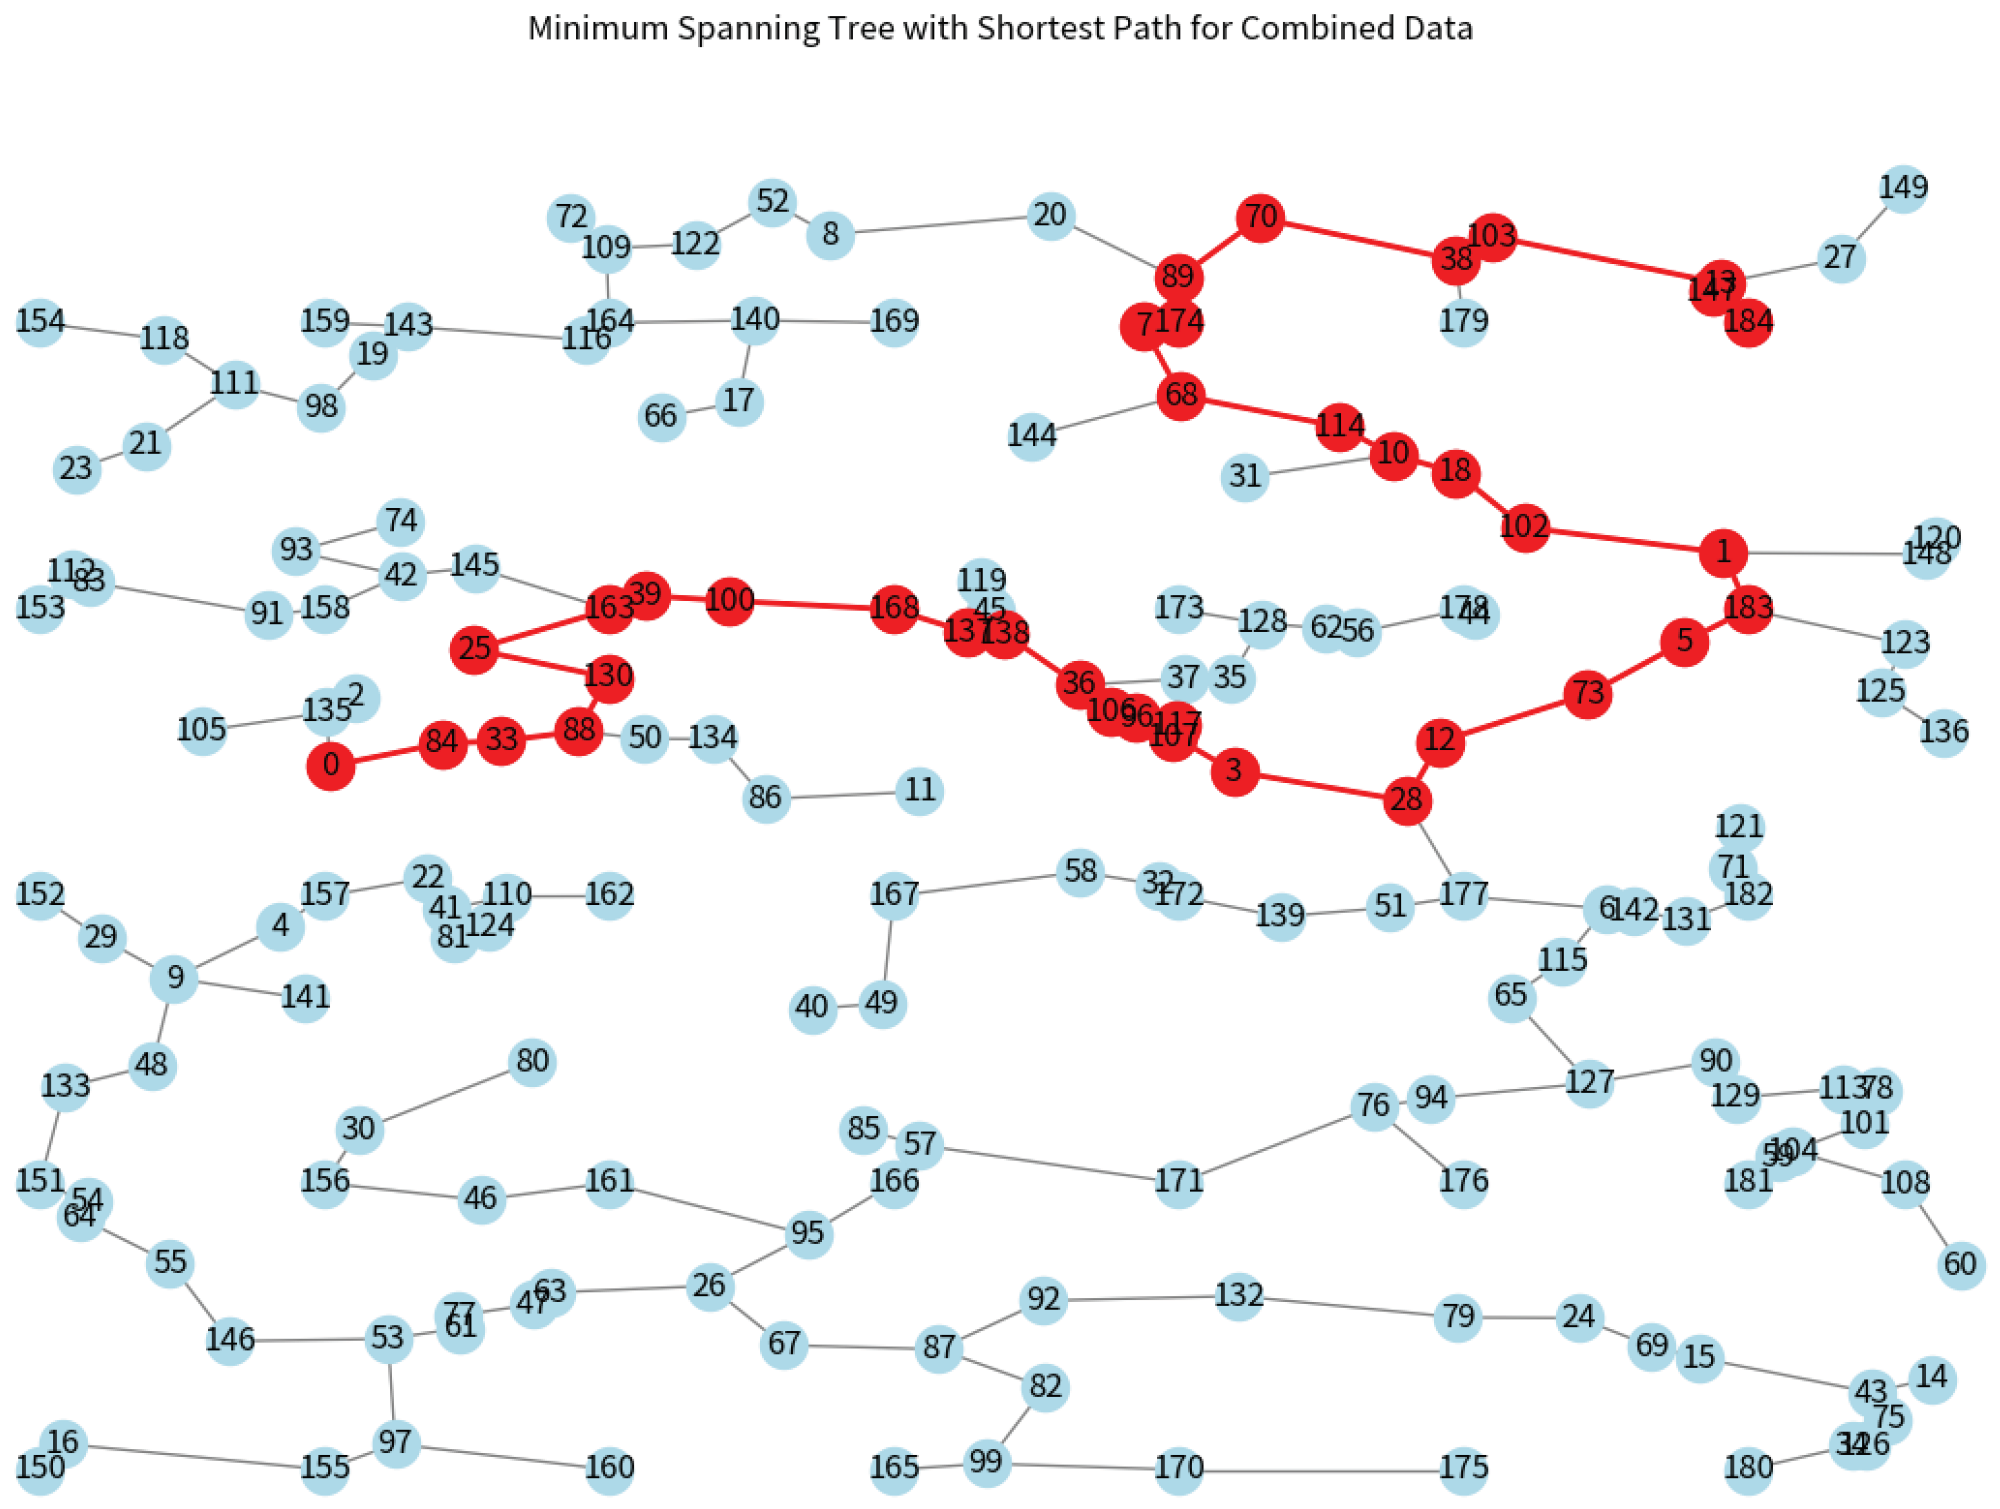
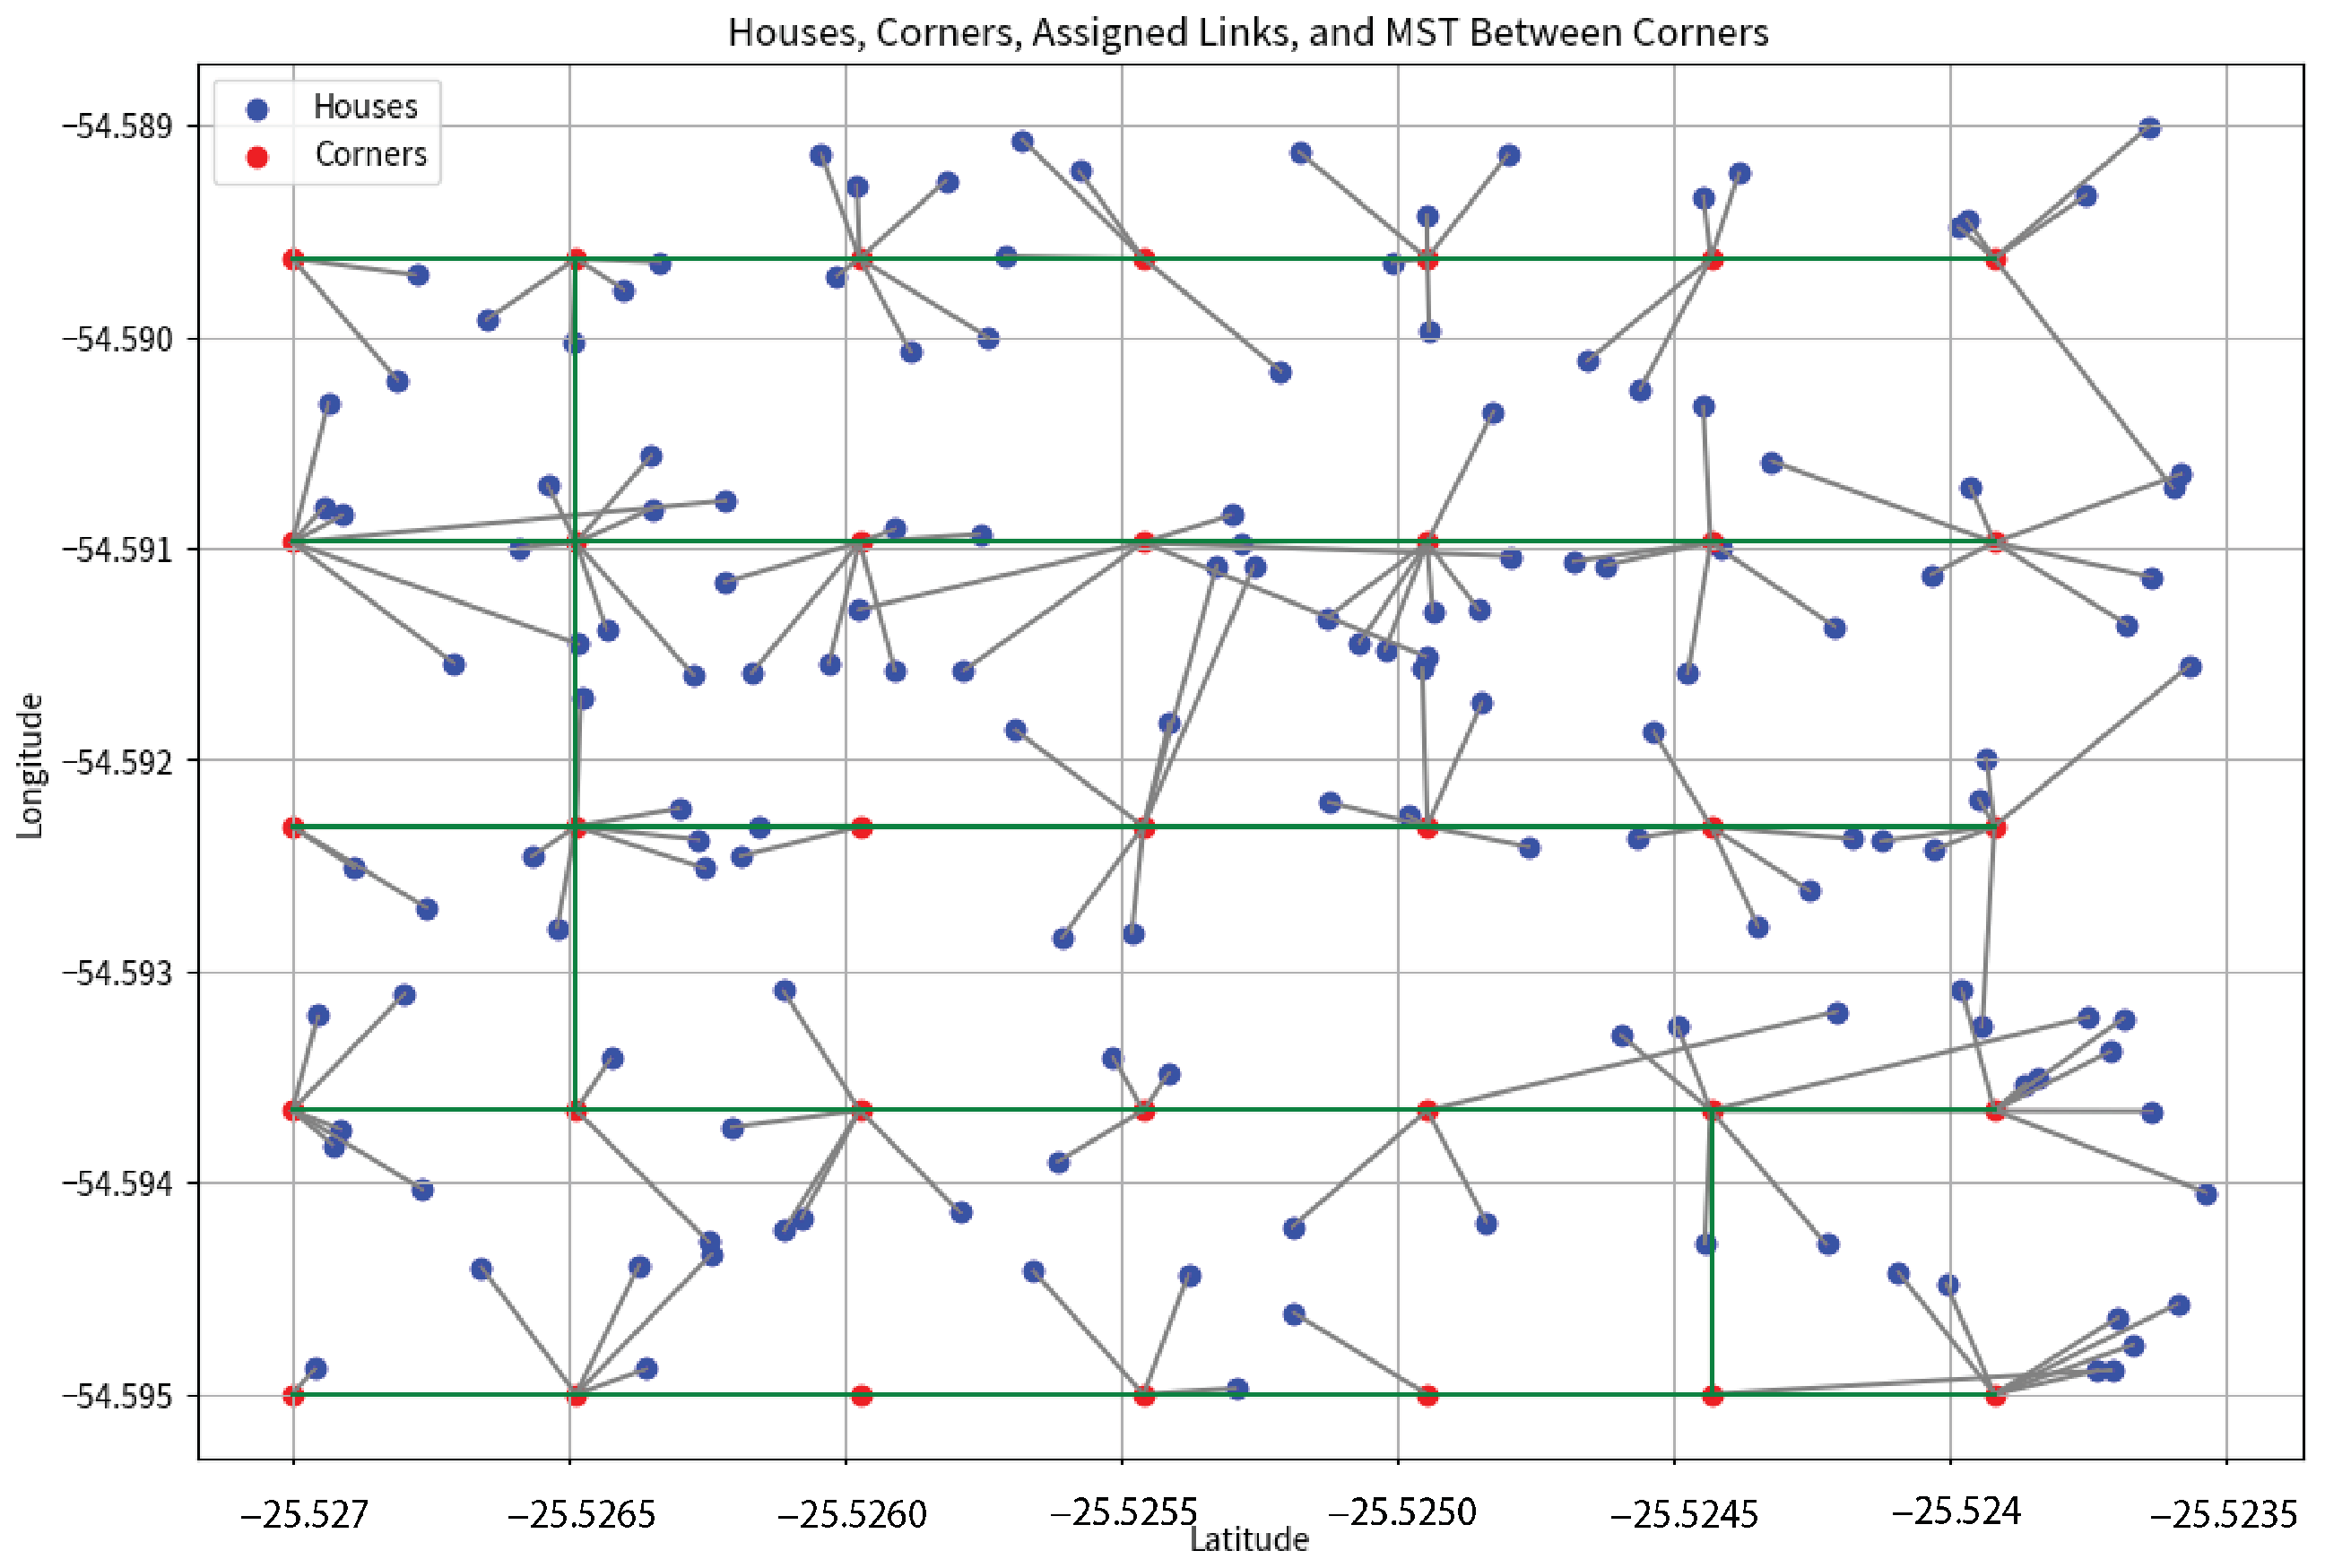
Figure 12 shows how combining the Greedy algorithm’s specific house-to-corner assignments with the solid structure of the MST offers us a complete picture of how the algorithm works, and it is the final result of Algorithm 1. It brings together the detailed planning from the Greedy algorithm with the strong base network of the MST. This figure captures how every house is connected to the network, highlighting how individual choices fit within the more significant, sturdy structure. The image helps us see the careful balance the algorithm achieves between assigning houses to corners and maintaining a solid overall network.
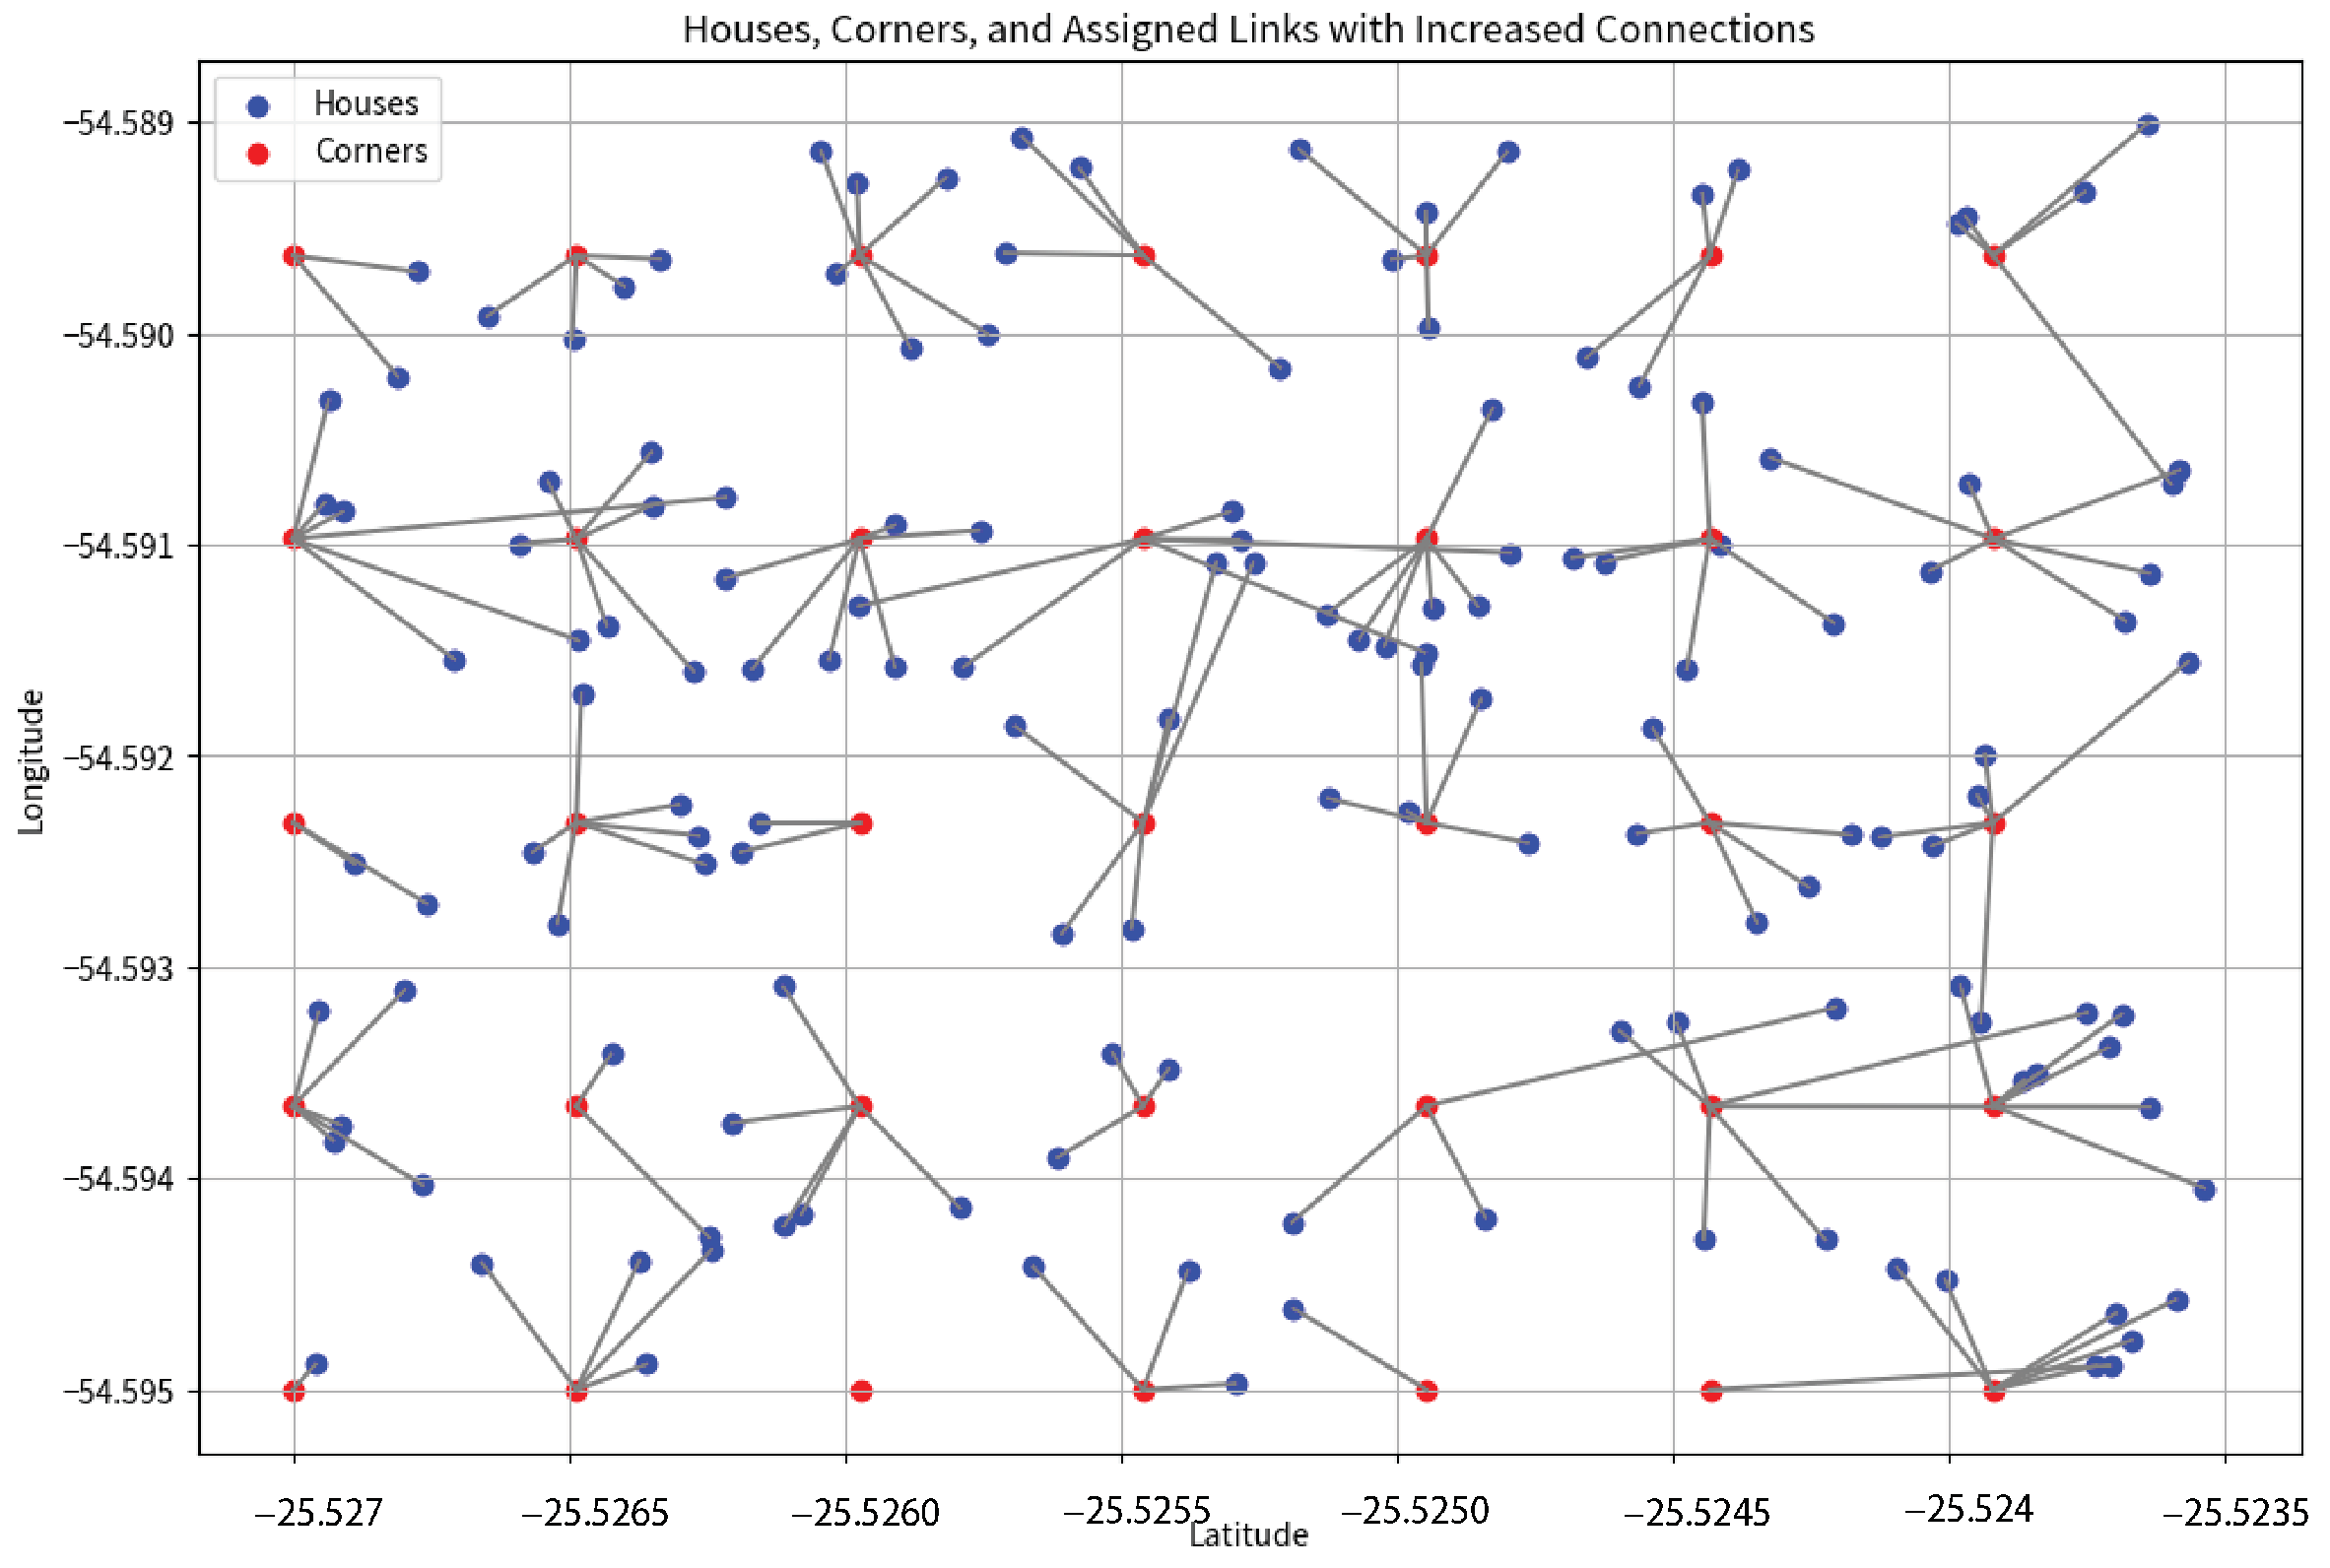
The culmination of Algorithm 1 is represented in
Figure 13, where the proposed algorithm integrates an MST for connecting corners and a Greedy algorithm for linking houses to corners, with an increased constraint of eight maximum connections per corner. This comprehensive approach ensures that all houses are assigned to a corner, fulfilling the primary objective of the algorithm. However, an intriguing aspect of the results is the presence of corners without any assigned houses. This phenomenon underscores the spatial distribution challenges inherent in such algorithms, where certain corners, despite being available, are not the nearest option for any house. The algorithm effectively balances the constraints and reveals the complexity of achieving an optimal distribution where all corners are utilized.
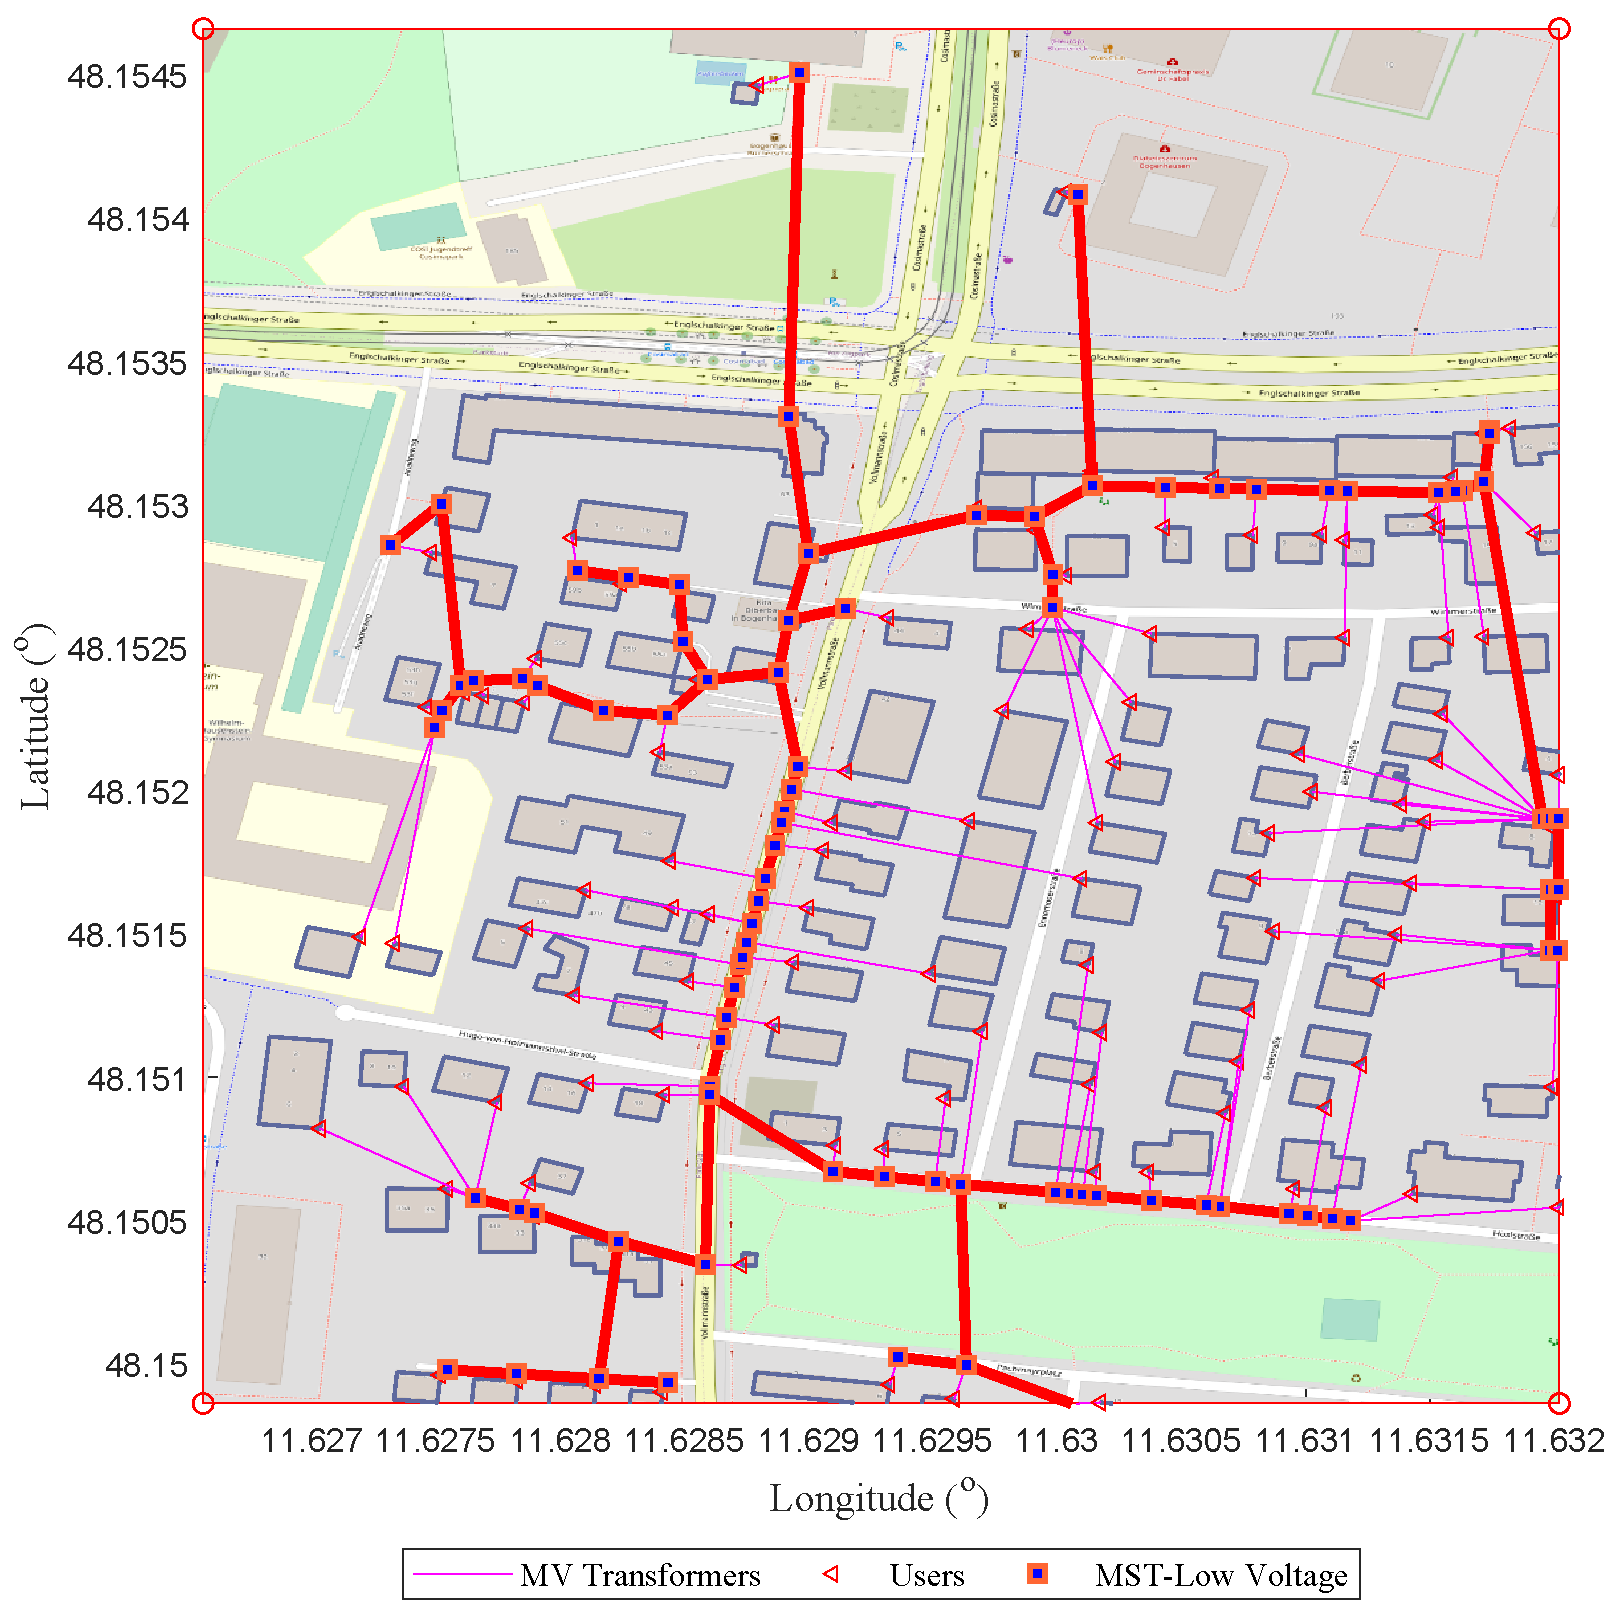
Figure 14 showcases the practical application of Algorithm 1 within a German urban framework, illustrating how residential houses, marked by triangles, are connected to the electrical grid. The map confirms the algorithm’s capability to handle intricate urban structures, streamlining the layout of electrical infrastructure. Transformers are represented as squares, and the service cables connecting them to the houses are depicted in red, outlining the algorithm’s strategy for optimal placement and connection. The Minimum Spanning Tree (MST), highlighted in purple, denotes the most efficient distribution routes between transformers, aimed at enhancing the network’s connectivity. Accurate geographical coordinates anchor the scenario in a realistic context, underlining the algorithm’s real-world applicability. The color coding is instrumental for clarity: purple for the MST which interlinks high-level infrastructure, and red for the service cables linking houses to the grid. This visualization affirms the effectiveness of the algorithm in organizing and planning future urban infrastructure development.
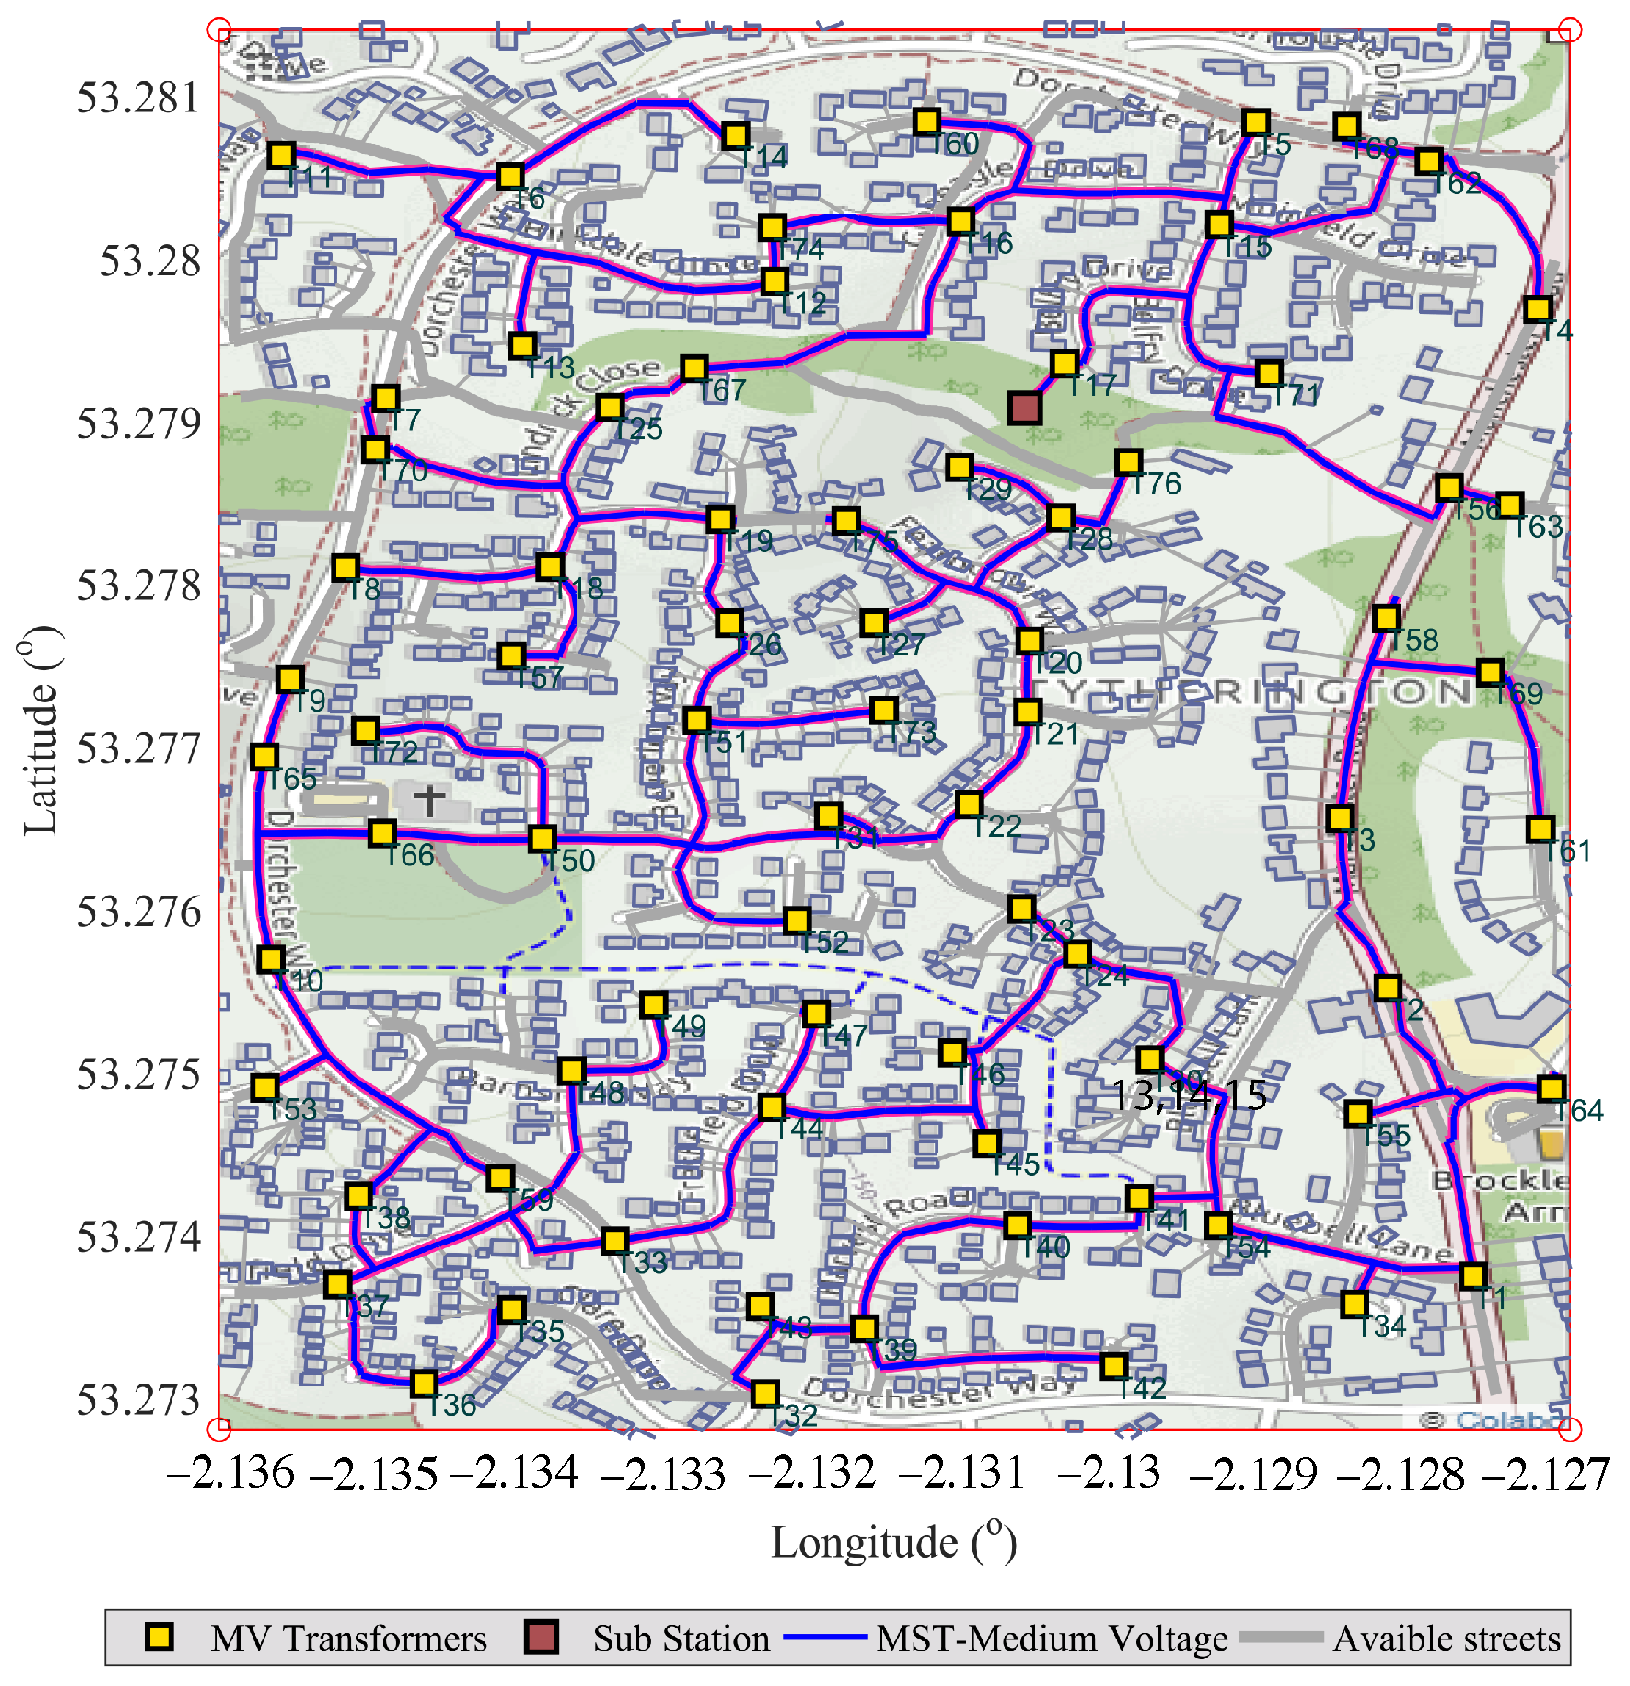
Figure 15 portrays the application of our algorithm within a UK urban setting, fine-tuning the electrical grid for optimal performance. The network is presented with Medium Voltage (MV) transformers, identified by yellow squares, which are interconnected by a Minimum Spanning Tree (MST) shown in purple, a configuration that promises optimal power distribution and enhanced resilience of the infrastructure. The power lines, which extend from these transformers to the residences, are not depicted in blue as previously mentioned but are instead color-coordinated with the legend for clarity. Dashed lines indicate the streets that are available for future network extensions, hinting at the growth potential within the urban electrical grid. This figure transcends simple graphical representation, embodying a real-world example of the algorithm’s potential to harmonize with the complex geography and infrastructure of urban systems. The legend provides clear explanations for the color changes and marker symbols, ensuring the figure’s legibility and its role as a testament to the algorithm’s functionality and cost effectiveness in urban planning.
4. Conclusions and Future Works
The proposed methodology integrates a practical approach with a robust mathematical formulation to optimize the layout of a neighborhood. It begins by generating a realistic scenario of houses and potential street corners, followed by calculating a distance matrix to quantify the proximity of each house to these corners. The methodology’s core lies in applying the Greedy algorithm, guided by constraints on the maximum number of houses per corner, to efficiently assign houses to the nearest corners. Concurrently, a Minimum Spanning Tree (MST) is computed among the corners to ensure an efficient infrastructure layout. The optimization’s objective is to minimize the total distance between houses and their assigned corners, augmented by the total length of the MST. This dual-objective function, coupled with capacity and binary variable constraints, forms an MILP problem. The iterative nature of the process allows for continuous refinement, ensuring an optimal balance between practicality and efficiency in urban planning and resource allocation.
Algorithm 1 exemplifies a formidable solution to spatial distribution challenges, as evidenced by its successful application in diverse urban landscapes such as Germany and the UK. The methodology not only efficiently connects houses to the electrical grid, but also does so by navigating through intricate constraints. The integration of MST and Greedy algorithms is instrumental in optimizing the spatial layout, ensuring that the vast majority of connections are both economical and practical. The case studies reveal the algorithm’s adeptness in accommodating varying urban geometries, demonstrating its efficacy in maximizing the use of existing infrastructure. While there is a trade-off with some underutilized corners, this is overshadowed by the significant benefits of enhanced network efficiency and adaptability. The tangible outcomes in the German and UK scenarios attest to the algorithm’s potential to revolutionize urban network systems worldwide.
In conclusion, as detailed in the preceding discussions, the analyses conducted through various algorithmic implementations offer insightful revelations about spatial distribution and assignment challenges. Integrating MST and Greedy algorithms, the core methodology demonstrates a strategic approach to connecting a network of houses to designated corners. The results, depicted in the graphs, reveal the algorithms’ effectiveness in adhering to constraints like maximum connections per corner while also highlighting inherent limitations. As seen in the different scenarios, increasing the maximum connections per corner leads to a more inclusive but uneven distribution, with some corners needing more utilization. This outcome underscores the trade-offs between maximizing connections and achieving equitable distribution. The analyses also highlight the Greedy algorithm’s tendency to prioritize immediate availability over proximity, resulting in some houses being connected to farther corners. Overall, these studies provide a comprehensive understanding of the complexities involved in spatial assignment problems and the effectiveness of hybrid algorithmic approaches in addressing them.


