Article

Phonon Transport Characteristics of Nano-Silicon Thin Films Irradiated by Ultrafast Laser under Dispersion Relation

1
School of Thermal Engineering, Shandong Jianzhu University, Jinan 250101, China
2
Department of Built Environment, Oslo Metropolitan University, N-0130 Oslo, Norway
*
Author to whom correspondence should be addressed.
Buildings 2024, 14(1), 210; https://doi.org/10.3390/buildings14010210
Submission received: 9 November 2023 / Revised: 5 January 2024 / Accepted: 11 January 2024 / Published: 13 January 2024
(This article belongs to the Special Issue Thermal Fluid Flow and Heat Transfer in Buildings)

Abstract

:
The gray model simplifies calculations by ignoring phonon polarization, but sacrifices a certain level of computational accuracy. In effect, the frequency and wavevector of phonons form complex polarization patterns, which means their propagation modes and vibrational directions have different influences. Therefore, based on the phonon dispersion relations in silicon, the lattice Boltzmann method is used to analyze the phonon transport characteristics in nano-silicon films under ultrafast laser excitation. The results show that the total energy density distribution obtained by superimposing acoustic and optical branches exhibits multiple wave-like behaviors. Among them, the acoustic branch has excellent transfer capability, dominating the rate at which the total energy density reaches a steady state distribution, while the optical branch has stronger heat capacity characteristics, with a greater impact on the peak value of the total energy density. When the heat transfer approaches a steady state, the longitudinal optical branch surprisingly contributes up to 52.73%. This indicates that the often-neglected optical phonons should also receive sufficient attention. Additionally, compared to the results of the gray model, it is found that the dispersion model is preferred when more attention is paid to the propagation characteristics during phonon transport.

1. Introduction

In the built environment, the door and window systems affect the health and well-being of occupants [1]. Functional films offer innovative possibilities for advanced glass manufacturing [2]. Semiconductor silicon, a commonly used material for thin films, has tremendous potential applications in areas such as chip manufacturing [3,4], solar power [5], and energy-efficient glazing [6]. Ultrafast laser technology, with its high peak power density and precise processing capabilities, plays a significant role in the thermal treatment of nano-silicon films [7]. Therefore, the non-equilibrium heat conduction behavior at the nano-scale can be explored by heating nano-silicon thin films with ultrafast lasers [8], which provides theoretical guidance for the fabrication of functional films that can be used for building energy conservation.
During the ultrafast laser irradiation of nanomaterials, a substantial amount of energy is released in an extremely short time and limited space, causing the material to enter a non-equilibrium thermal state and exciting abundant non-equilibrium thermal carriers. The propagation mode of these non-equilibrium thermal carriers determines the heat conduction mechanisms in the material [9,10]. In semiconductor materials, phonons, as the primary thermal carriers, usually propagate in a wave-like pattern [11]. These waves are named lattice waves, which possess specific frequencies (ω) and wave vectors (K) [12]. When the polarization effect of phonons is considered, the frequency and wave vector constitute the phonon dispersion relation ωp(K), where p represents different phonon branches. According to the motion pattern of the primitive cell, phonon branches can be classified into acoustic branches and optical branches [13]. Generally, the number of phonon branches is equal to 3N, where N is the number of atoms in one primitive cell. Among them, there are three acoustic branches and 3 × (N − 1) optical branches. For the primitive cell of silicon with two atoms, there are three acoustic branches and three optical branches.
In most previous research, simplified models, such as the Einstein, Debye, and semi-gray models [14,15,16], were commonly used, which involved simplified treatments or direct neglect of dispersion relations. The reason for this is that considering the dispersion relation will result in a complex set of equations describing phonon propagation, which greatly increases the computational workload. For the dispersion model, all phonon polarizations and modes are taken into account, with no restrictions on the contribution of any phonon mode [17]. Moreover, the phonon propagation velocity, mean free path, and other parameters are inherently frequency-dependent [18]. The propagation behavior of different phonon modes in materials can be revealed by analyzing the phonon dispersion relation. Therefore, in order to accurately predict the phonon transport behavior in semiconductors, it is necessary to consider the dispersion relation of anisotropic phonon branches and establish a dispersion model for multiple phonon branches [19,20].
The Lattice Boltzmann Method (LBM), first proposed by McNamara and Zanetti in 1988 [21], is a simulation method that predicts the distribution of virtual fluid particles to simulate fluid flow. It overcomes the limitations of traditional lattice gas kinetic methods. In recent years, the LBM has been widely used in simulating the transport processes of electrons and phonons [22,23,24]. Compared to the classical Fourier’s law and molecular dynamics methods [25,26], the LBM has advantages in terms of high computational efficiency and convenient handling of boundary conditions [27].
Based on Boltzmann transport theory, Kumar et al. [28] proved that the thermal conductivity of micro nano-silicon thin films was lower than that of bulk silicon. This stems from the fact that the internal phonon spectrum changed in the thin films, leading to the size-dependent thermal conductivity of the films. Subsequent studies supported this viewpoint [29,30], implying that size effects must be considered for micro nano thin film heat transfer. On the other hand, when the characteristic size of the system approaches the phonon mean free path, phonon boundary scattering becomes stronger than intrinsic scattering. Han and Liu [31] used LBM to study the phonon heat transfer in different sections of silicon films. The results showed that the temperature distribution is highly correlated with the characteristic size, with stronger phonon boundary scattering observed as the size decreases.
In summary, to address the limitations of traditional simplified phonon models [15,16,17], a phonon transport model for nano-silicon thin films is established based on the dispersion relation [32], utilizing an ultrafast laser as the heat source. The analysis focuses on the phonon transport characteristics during heat transfer, and the effect of film size. Furthermore, a comparison is made between the dispersion model and the gray model to assess their influence on the calculation results.

2. Methods and Models

2.1. Physical Model

Typically, the laser beam emitted by ultrafast lasers has a conical shape and occupies a three-dimensional space. However, under the premise of considering the dispersion relations, using a three-dimensional model for calculations would significantly increase computational complexity. Therefore, for research purposes, a simplified two-dimensional model is adopted as shown in Figure 1. The geometric shape of the laser beam in the third direction is symmetrical, and this simplified model does not affect the analysis of the heat transfer law.
As shown in Figure 1, the ultrafast laser irradiates vertically at the center position on the left side of the two-dimensional nano-silicon film. The laser penetration depth is δ and the influence radius is r0. The tangential and longitudinal sizes of the thin film are L and M, respectively.
Since the energy propagation inside the thin film is primarily concentrated in the tangential direction, expanding the boundaries will not affect the results as long as the longitudinal energy propagation does not reach the longitudinal boundary. Therefore, for computational and analytical convenience, the longitudinal size M is set to ten times of the tangential size L. Additionally, the contact surfaces between the nanofilm and the outside are set to be adiabatic boundaries.

2.2. Lattice Models

In the LBM, DnQm is the generic term, where n represents the dimension of the problem and m represents the number of lattice chains in the velocity model. The D2Q5 and D2Q9 lattice are commonly used 2D models [33]. As shown in Figure 2, The D2Q9 lattice has eight adjacent nodes per node, more than the four nodes of the D2Q5 lattice, which means that D2Q9 has more propagation paths available.
For the D2Q5 lattice, the weighting factors ωi and discrete velocities ci can be expressed as the following:
ω i = 1 / 3 i = 0 1 / 6 i = 1 , 2 , 3 , 4 c i = 0 1 1 0 0 0 0 0 1 1
For the D2Q9 lattice:
ω i = 4 / 9 i = 0 1 / 9 i = 1 , 2 , 3 , 4 1 / 36 i = 5 , 6 , 7 , 8 c i = 0 1 1 0 0 1 1 1 1 0 0 0 1 1 1 1 1 1
where the weighting factors ωi are employed to compute the distribution function during the collision and transport steps. The discrete velocities ci are a set of specific velocities used to discretize the velocity space. The subscript i represents the discrete velocity index.

2.3. Mathematical Method

Without external force, the Boltzmann transport equation can be expressed as [16]:
f t + v · f = f e q f τ ,
where f is the distribution function of the hot carrier, feq is the equilibrium distribution function, ν is the group velocity of the hot carrier, t is the time, and τ is the relaxation time.
According to the relatively complex D2Q9 lattice, the Boltzmann transport equation expressed by phonon energy density can be obtained using the following equation:
U i t + v i ( U i x + U i y ) = U i 0 U i τ ,
where U is the phonon energy density, U0 is the phonon equilibrium energy density, and x and y are the positional parameters. The value of i ranges from 0 to 8, which represents the discrete velocity index in D2Q9 lattice.
The absorption rate of laser energy is I(x, y, t), which can be expressed as [34]:
I ( x , y , t ) = 0.94 J 1 R t p · δ exp ( x δ y 2 r 0 2 1.992 t t p ) .
where J is the laser energy density, R is surface reflectance, tp is the duration of the laser pulse, and r0 and δ are described in Section 2.1.
To facilitate the calculation, the following dimensionless transformations are performed:
x * = x / L , y * = y / M , t * = t / τ ,
where x* and y* are dimensionless position parameters, t* is dimensionless time.

2.4. Phonon Dispersion Relationship in Silicon Thin Films

Silicon belongs to a diatomic crystal structure and has six phonon branches: one longitudinal acoustic branch (LA), two degenerate transverse acoustic branches (TA), one longitudinal optical branch (LO), and two degenerate transverse optical branches (TO). As shown in Figure 3a, the phonon dispersion relationship in the direction of silicon (100) is obtained [32].
As depicted in Figure 3b, in the acoustic branches, the atoms in the primitive cell move around the center of the mass, while in the optical branches, the atoms in a primitive cell move relative to each other. In addition, according to the vibration direction of a single atom, it can be divided into transverse vibration and longitudinal vibration. When these vibration modes are combined with the motion states of the primitive cell, phonon branches with different velocities and moduli are generated.
The frequency-dependent propagation velocity, phonon density of states, and energy density of phonons are all calculated based on the dispersion relation. The propagation velocity of phonons can be obtained as:
v = d ω d k ,
The total energy density of phonons can be calculated as the sum of contributions from all phonon branches:
U A L L * = p U p * = 2 U T A * + U L A * + 2 U T O * + U L O * .

3. Results and Discussions

3.1. Verification

A comparison with Ref. [17] is carried out to verify the effectiveness of the dispersion model employed in this paper. In Ref. [17], the lattice Boltzmann method for phonon transport is used to numerically simulate the time-dependent thermal energy transport in one-dimensional silicon films, and the nonlinear dispersion relationship of phonons is considered. The initial temperature T1 of the thin film is set at 300 K, with the temperature of the right cold side maintained at T1, and the hot boundary temperature T2 on the left side is kept at 301 K. The dimensionless temperature T* is defined as (TT1)/(T2T1).
Figure 4 displays the comparison of the instantaneous temperature distributions in the thin film with a size of 30 nm. The results indicate that the calculation results of the present work are in good agreement with those in Ref. [17]. In a shorter amount of time (t < 3.47 ps), the phonon propagation in the thin film exhibits wave refraction. This is because after considering dispersion relation, the temperature distribution is the result of the superposition of multiple phonon energy waves, rather than the single propagation wave in the gray model. At t = 200 ps, the temperature distribution tends to reach a steady state, showing characteristics of boundary slip and linear decay within the interior. In conclusion, there is a high level of consistency between the two results, which validates the effectiveness of the dispersion model proposed in this paper.

3.2. Analysis of Phonon Transport Characteristics Inside the 2D Film

As shown in Table 1, the laser pulse duration tp is 0.65 ps. According to Equation (7), it can be resolved that the laser pulse launching time corresponds to the dimensionless time t* = 0, and the end time corresponds to t* = 0.1.
The specular reflection adiabatic boundary condition [15] is set for the 2D nano-silicon thin film in the following results. The initial conditions can be expressed as U(T0) = CvT0. For the 2D silicon thin film, the energy density distributions along the tangential and longitudinal directions of the film are given separately. To show this, the figure below is presented, with TA and TO representing the total energy density after adding the two degenerate branches.

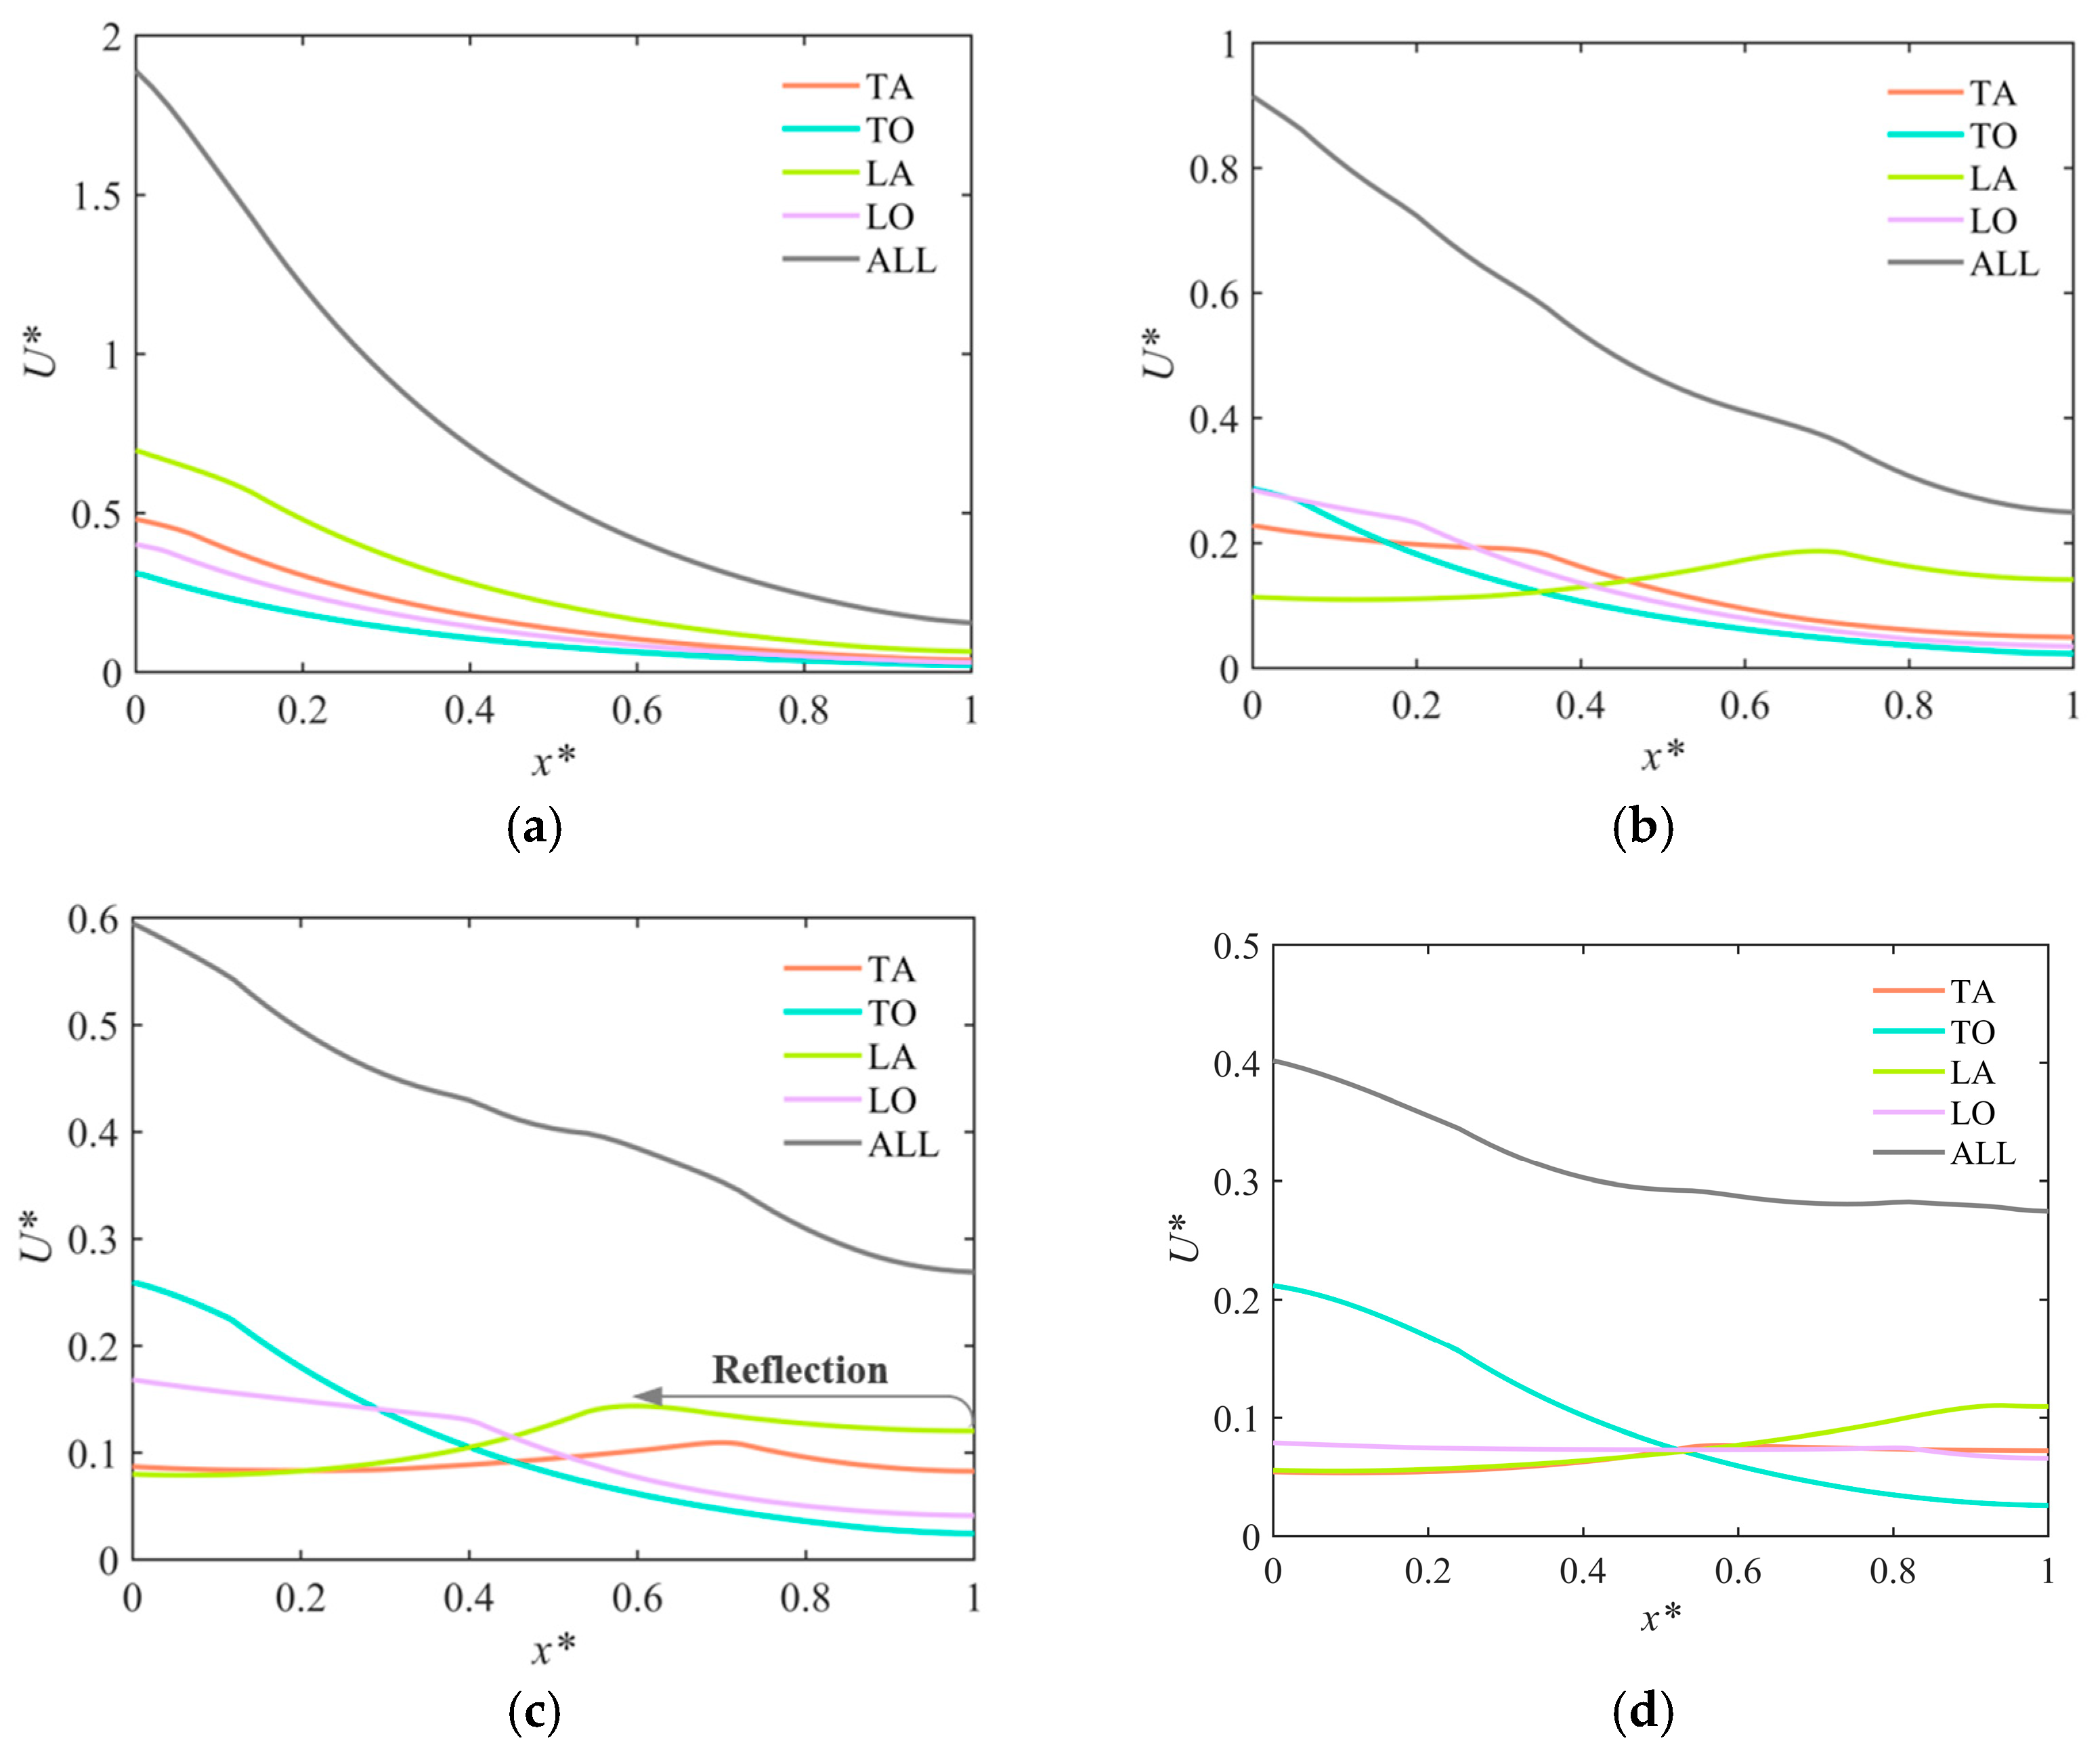
3.2.1. Along the Tangential Direction of the Film

After the laser pulse irradiates the silicon film, it excites lattice vibrations inside the film with the generation of phonons, resulting in a rapid increase in energy density on the left side. In Figure 5a, it can be observed that the laser pulse terminates at t* = 0.1, with the total energy density reaching its peak on the left side. On the right side, the energy density is relatively lower. At this point, each phonon branch also exhibits a peak on the left side. Among them, the acoustic branches have higher peaks compared to the optical branches, with the highest peak observed in the LA branch. This can be attributed to the fact that the vibration direction of the LA branch aligns with the propagation direction of the lattice wave, enabling efficient energy and momentum transfer with faster propagation speeds. However, the vibration directions of the other branches do not align with the lattice wave propagation direction, resulting in slower propagation and relatively lower energy transfer.
Additionally, it can also be observed in Figure 5a that for the same type of phonon branches, the mode of longitudinal vibration carries higher energy than the transverse vibration. This is attributed to the elastic properties of the silicon lattice, where the longitudinal vibration direction is consistent with the propagation direction of the lattice wave, while the transverse vibration is more heavily constrained by the lattice, making it difficult to transfer energy; thus, it carries lower energy and usually propagates slower.
As time goes by, the energy gradually transfers to the right side of the thin film, causing the energy density on the left side to decrease gradually. Figure 5b shows that different phonon branches exhibit energy wave propagation. Due to their different propagation speeds, the total energy exhibits multiple wave-like behaviors. Among them, the LA has the fastest moving speed, leading to a quicker decrease of energy density on the left side of the thin film, and a rapid increase on the right side. The propagation speeds of LO and TO are slower, making the energy density on the left side gradually higher than the acoustic branches.
Affected by the specular reflection adiabatic boundary condition, once the phonons collide with the boundary of the film, they will be reflected back into the domain in the next moment. As shown in Figure 5c, after colliding with the boundary, the LA continues to move towards the left side of the thin film. At this point, the thermal wave of TA has not yet reached the right boundary of the thin film. Due to the poor propagation performance of TO, the change in energy density distribution is minimal compared to the previous time step.
When t* = 2.0, the total energy density on the left side is 0.402, and the energy density of TO is 0.212, contributing to more than 50%. This means that when the phonon transport time is longer, the total energy density in the thin film is greatly affected by the TO branches. Therefore, during the phonon transport process, both the acoustic and optical branches play important roles. The acoustic branches have faster propagation speeds, influencing the equilibrium distribution of total energy density, while the optical branches determine the peak value of total energy density due to their stronger heat capacity characteristics.

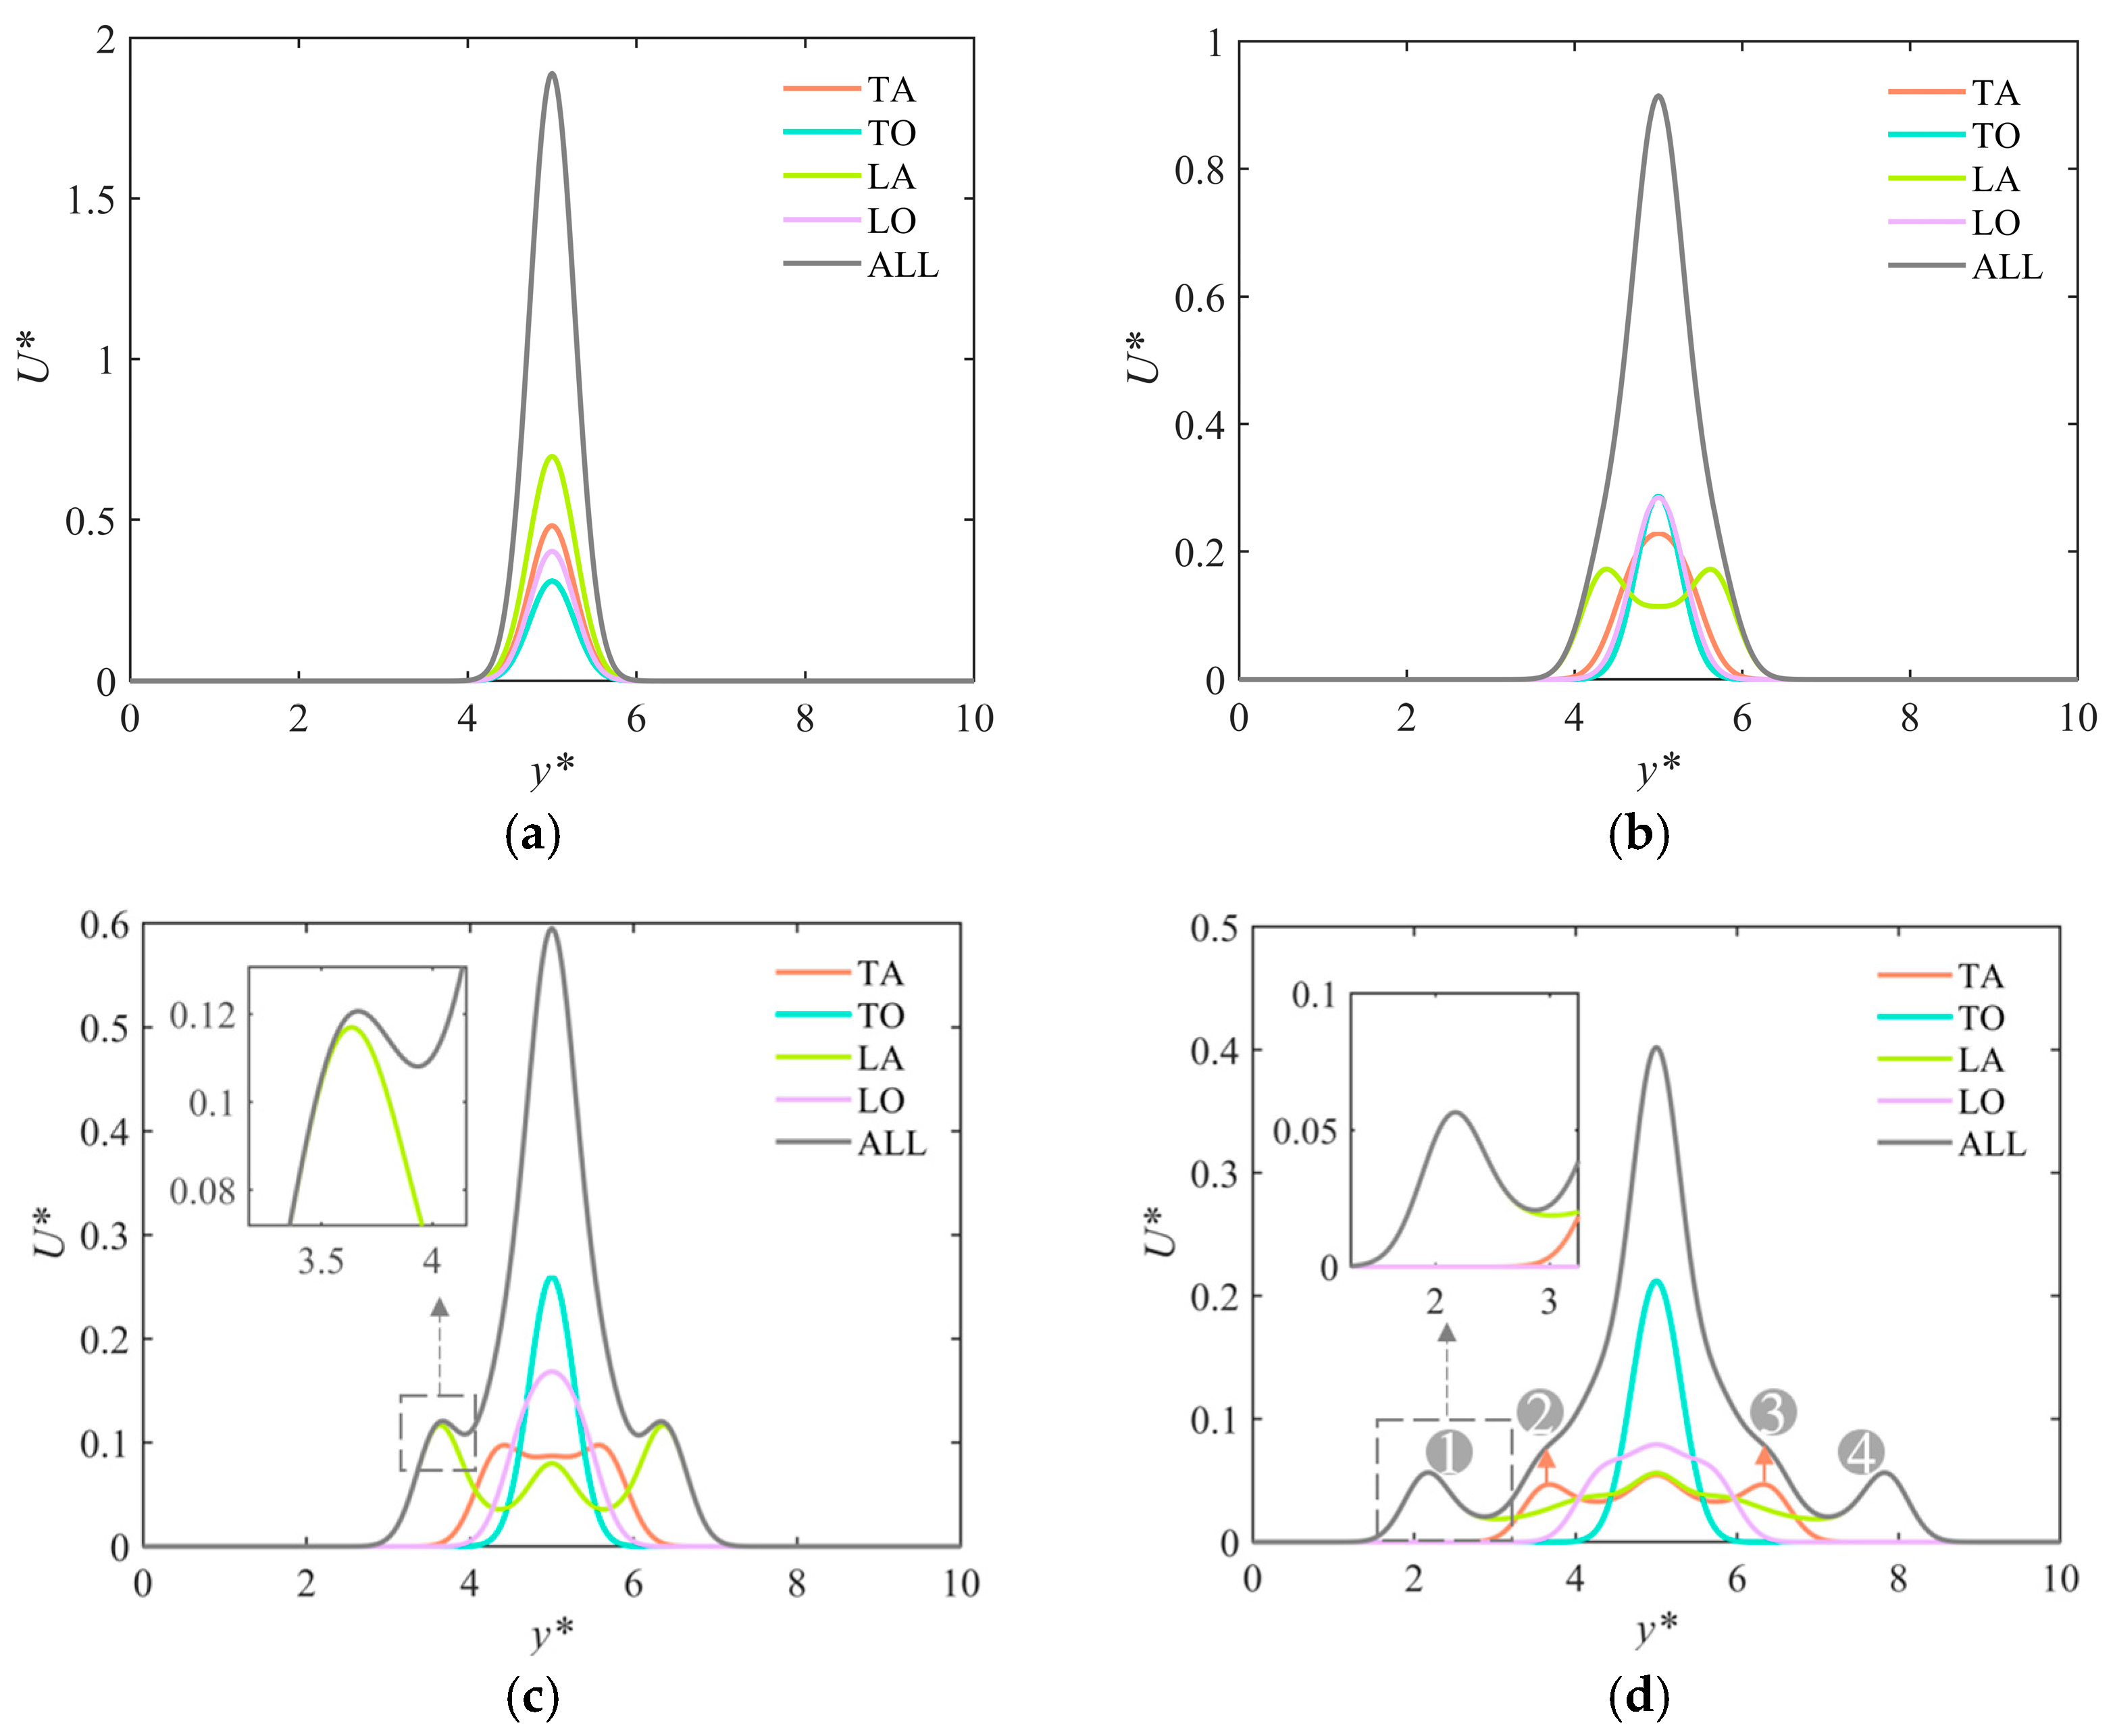
3.2.2. Along the Longitudinal Direction of the Film

Figure 6a shows that after the laser pulse ends, the energy density of the film in the longitudinal direction exhibits a Gaussian distribution, and the peak value is consistent with the tangential direction, corresponding to the value on the left side of Figure 5a. At this time, the energy transfer time is short, and no wave-like propagation has occurred inside the film.
At t* = 0.5, the fastest LA phonon branch is the first to exhibit wave-like behavior, where the energy at the middle position decreases and is transferred to larger areas through two thermal waves. Specifically, the positions of the two thermal waves are 4.3 and 5.7, respectively. Comparing this to Figure 5b, it can be found that the propagation speeds of phonons in the longitudinal and tangential directions are the same. However, in contrast to the tangential direction, the TA and LO phonon branches have not exhibited wave-like phenomena in the longitudinal direction. As Equation (6) illustrates, the distribution of laser energy density in the longitudinal direction is lower than in the tangential direction, resulting in a lower average energy density in the longitudinal direction. Therefore, the existence of wave-like behavior not only depends on the phonon’s mode, but also on the energy carried by the phonons.
As exhibited in Figure 6c, the TA phonon branch subsequently exhibits wave-like behavior, while the TO and LO phonon branches propagate too slowly and have no wave-like behavior. The energy density also decreases slowly, and the affected range is smaller. At this point, the fluctuation of the total energy density is mainly influenced by the LA phonon branch, and the contribution rate of LA is 96.7%. As the energy spreads further, Figure 6d shows that the total energy density distribution exhibits four thermal waves, mainly influenced by the acoustic phonon branches. Due to the TO phonon branch having the worst propagation performance, there is insufficient energy accumulation to form a significant thermal wave phenomenon.

3.3. Effect of Film Characteristic Size on Phonon Transport

To investigate the influence of thin film size on phonon transport, the tangential size of the thin film selected in this section are 82 nm, 41 nm, and 20.5 nm, respectively. In order to show the size effect more clearly, the horizontal coordinate is represented by its actual size in this section.

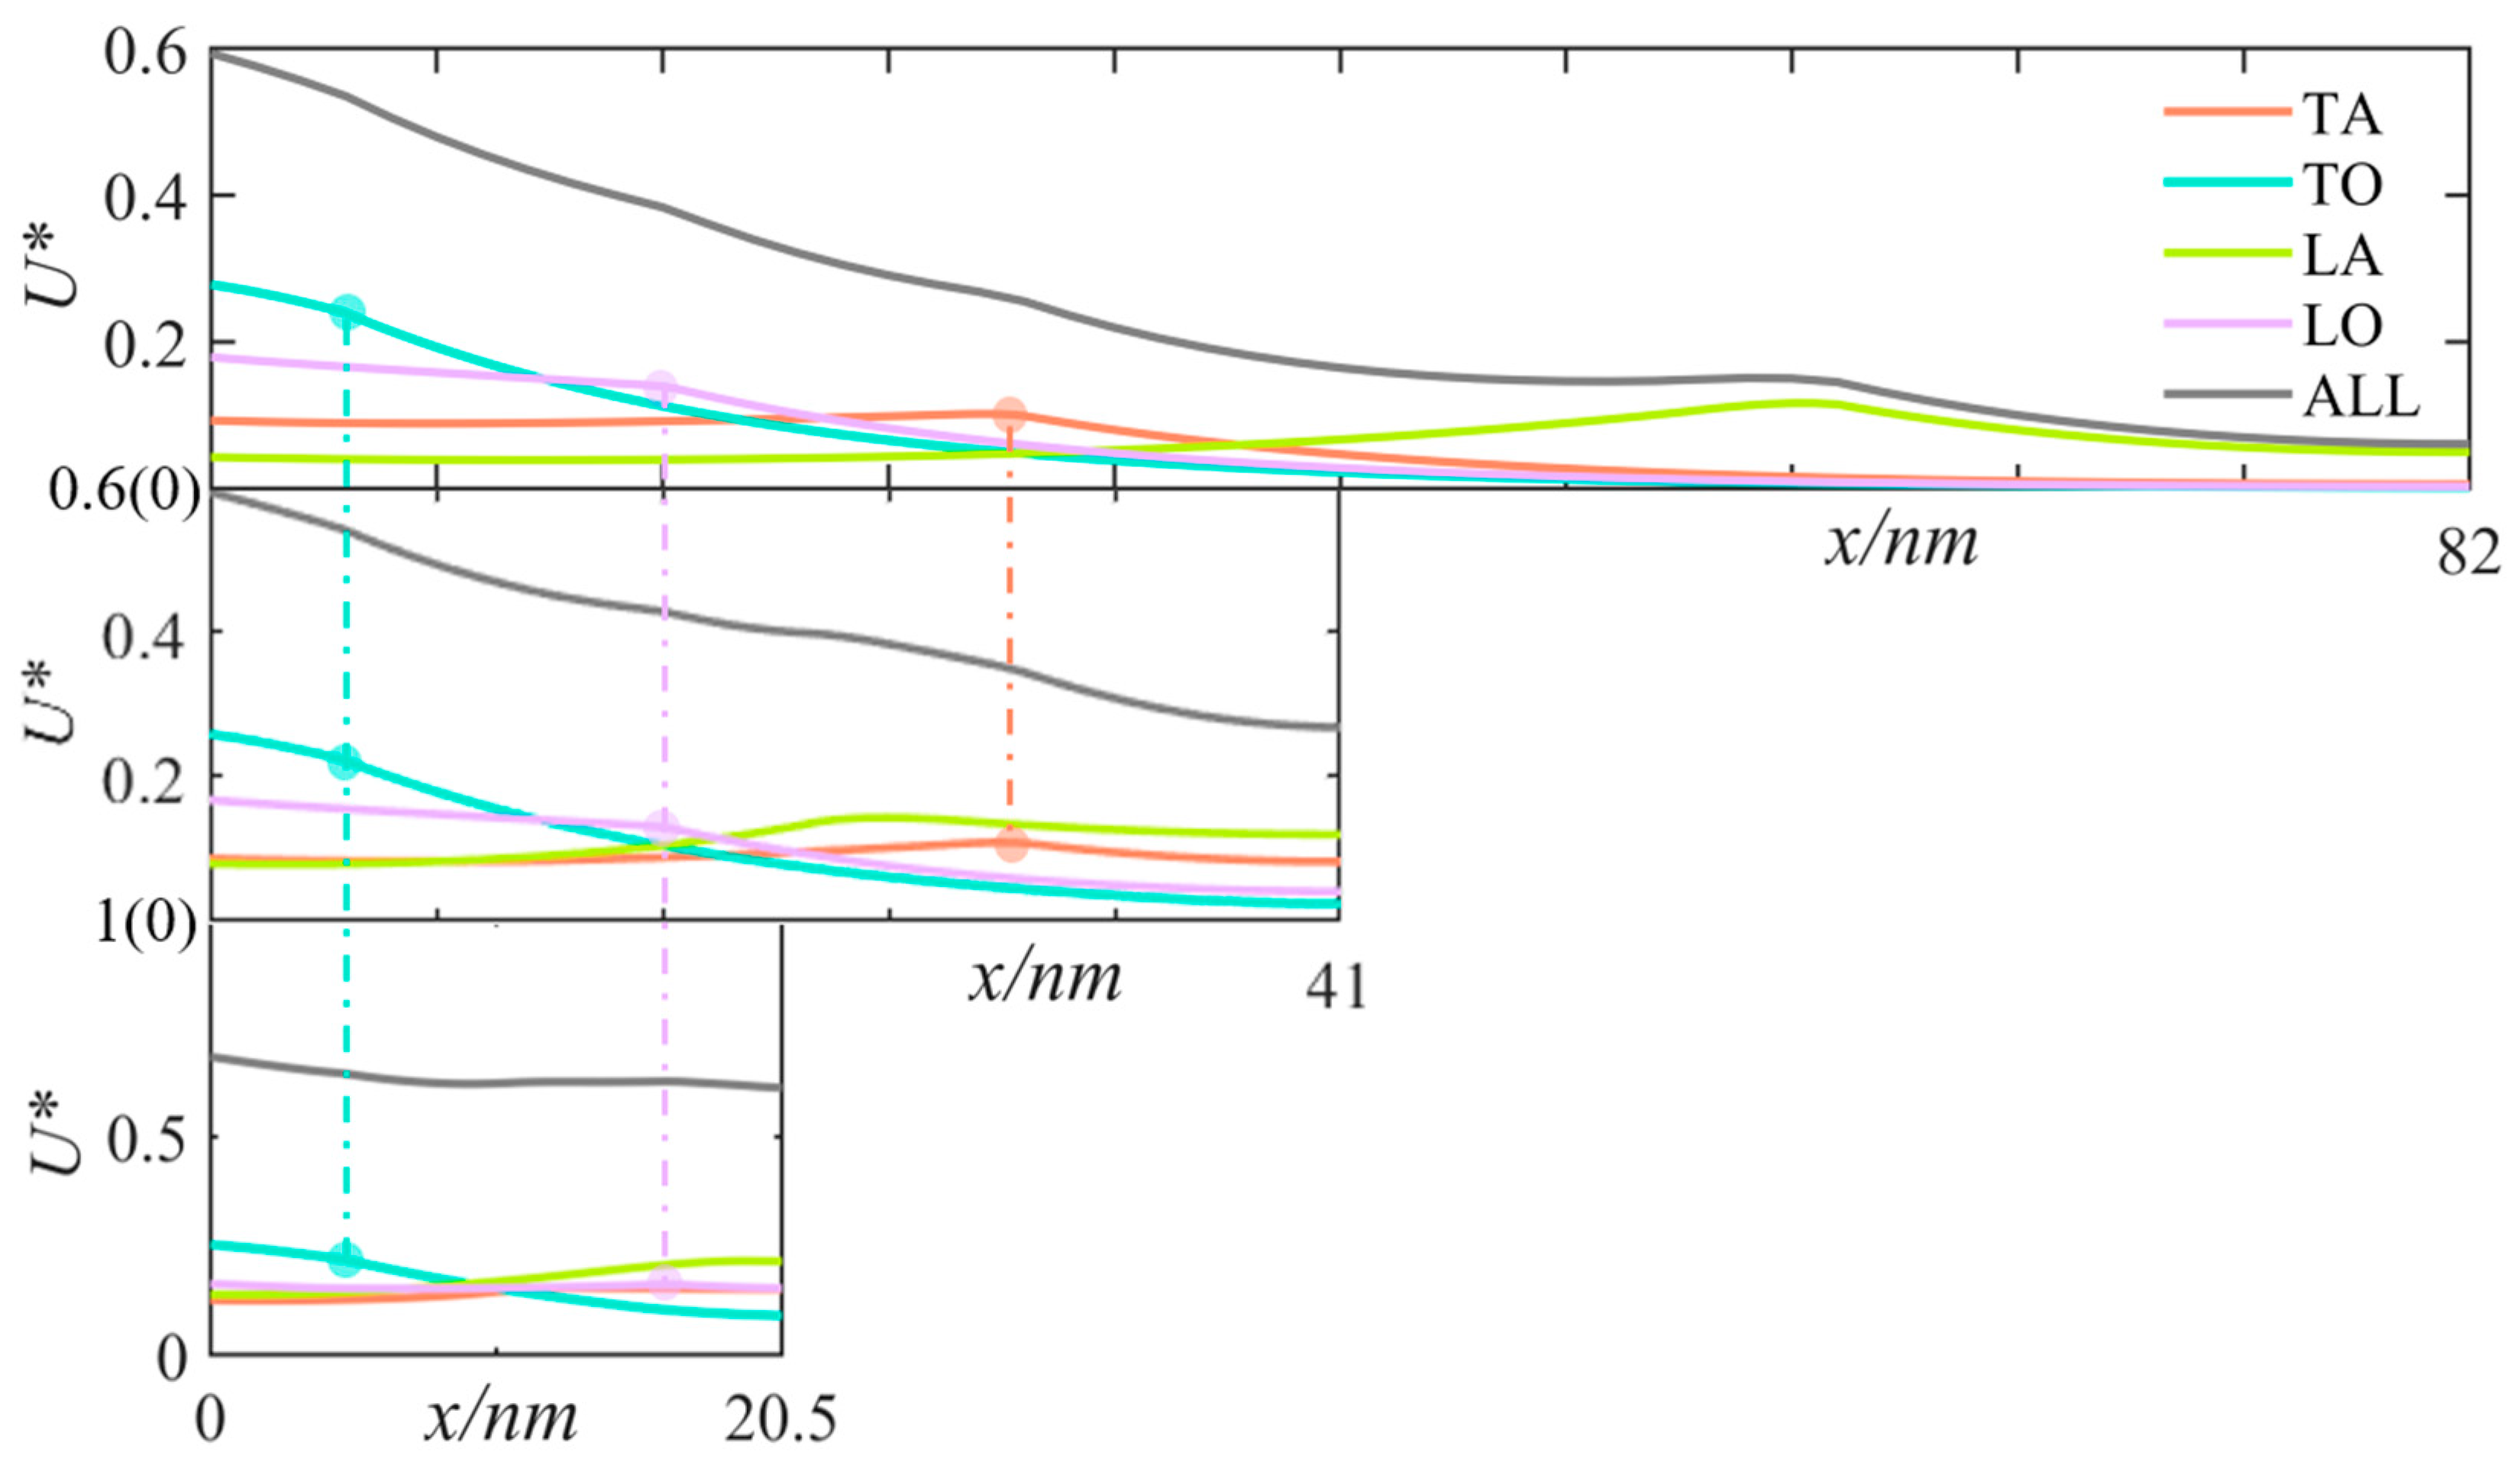
3.3.1. Along the Tangential Direction of the Film

In Figure 7, it is evident that the LA branch exhibits the fastest propagation velocity and remains unimpeded within the 82 nm film. However, in the other two smaller film sizes, it reaches the right boundary and propagates in the opposite direction. On the other hand, the two optical branch has a slower propagation velocity and is not hindered by the boundary, even when the film thickness is 20.5 nm.
When phonons collide with the boundary, the energy they carry returns and accumulates within the region. As the film size decreases, the same amount of energy is distributed in a smaller space, resulting in an increase in energy density per unit volume within the film. Moreover, phonons can penetrate through smaller films in a shorter time, leading to faster equilibrium in energy distribution.
Furthermore, Figure 7 reveals that the actual propagation distance of the same phonon branch remains consistent even at different film sizes. This suggests that changes in film size do not impact the propagation velocity of the phonon branch, but only affect the distribution of phonon energy density within the film. This inference aligns with Equation (7), where the phonon propagation velocity only depends on frequency and wavevector.

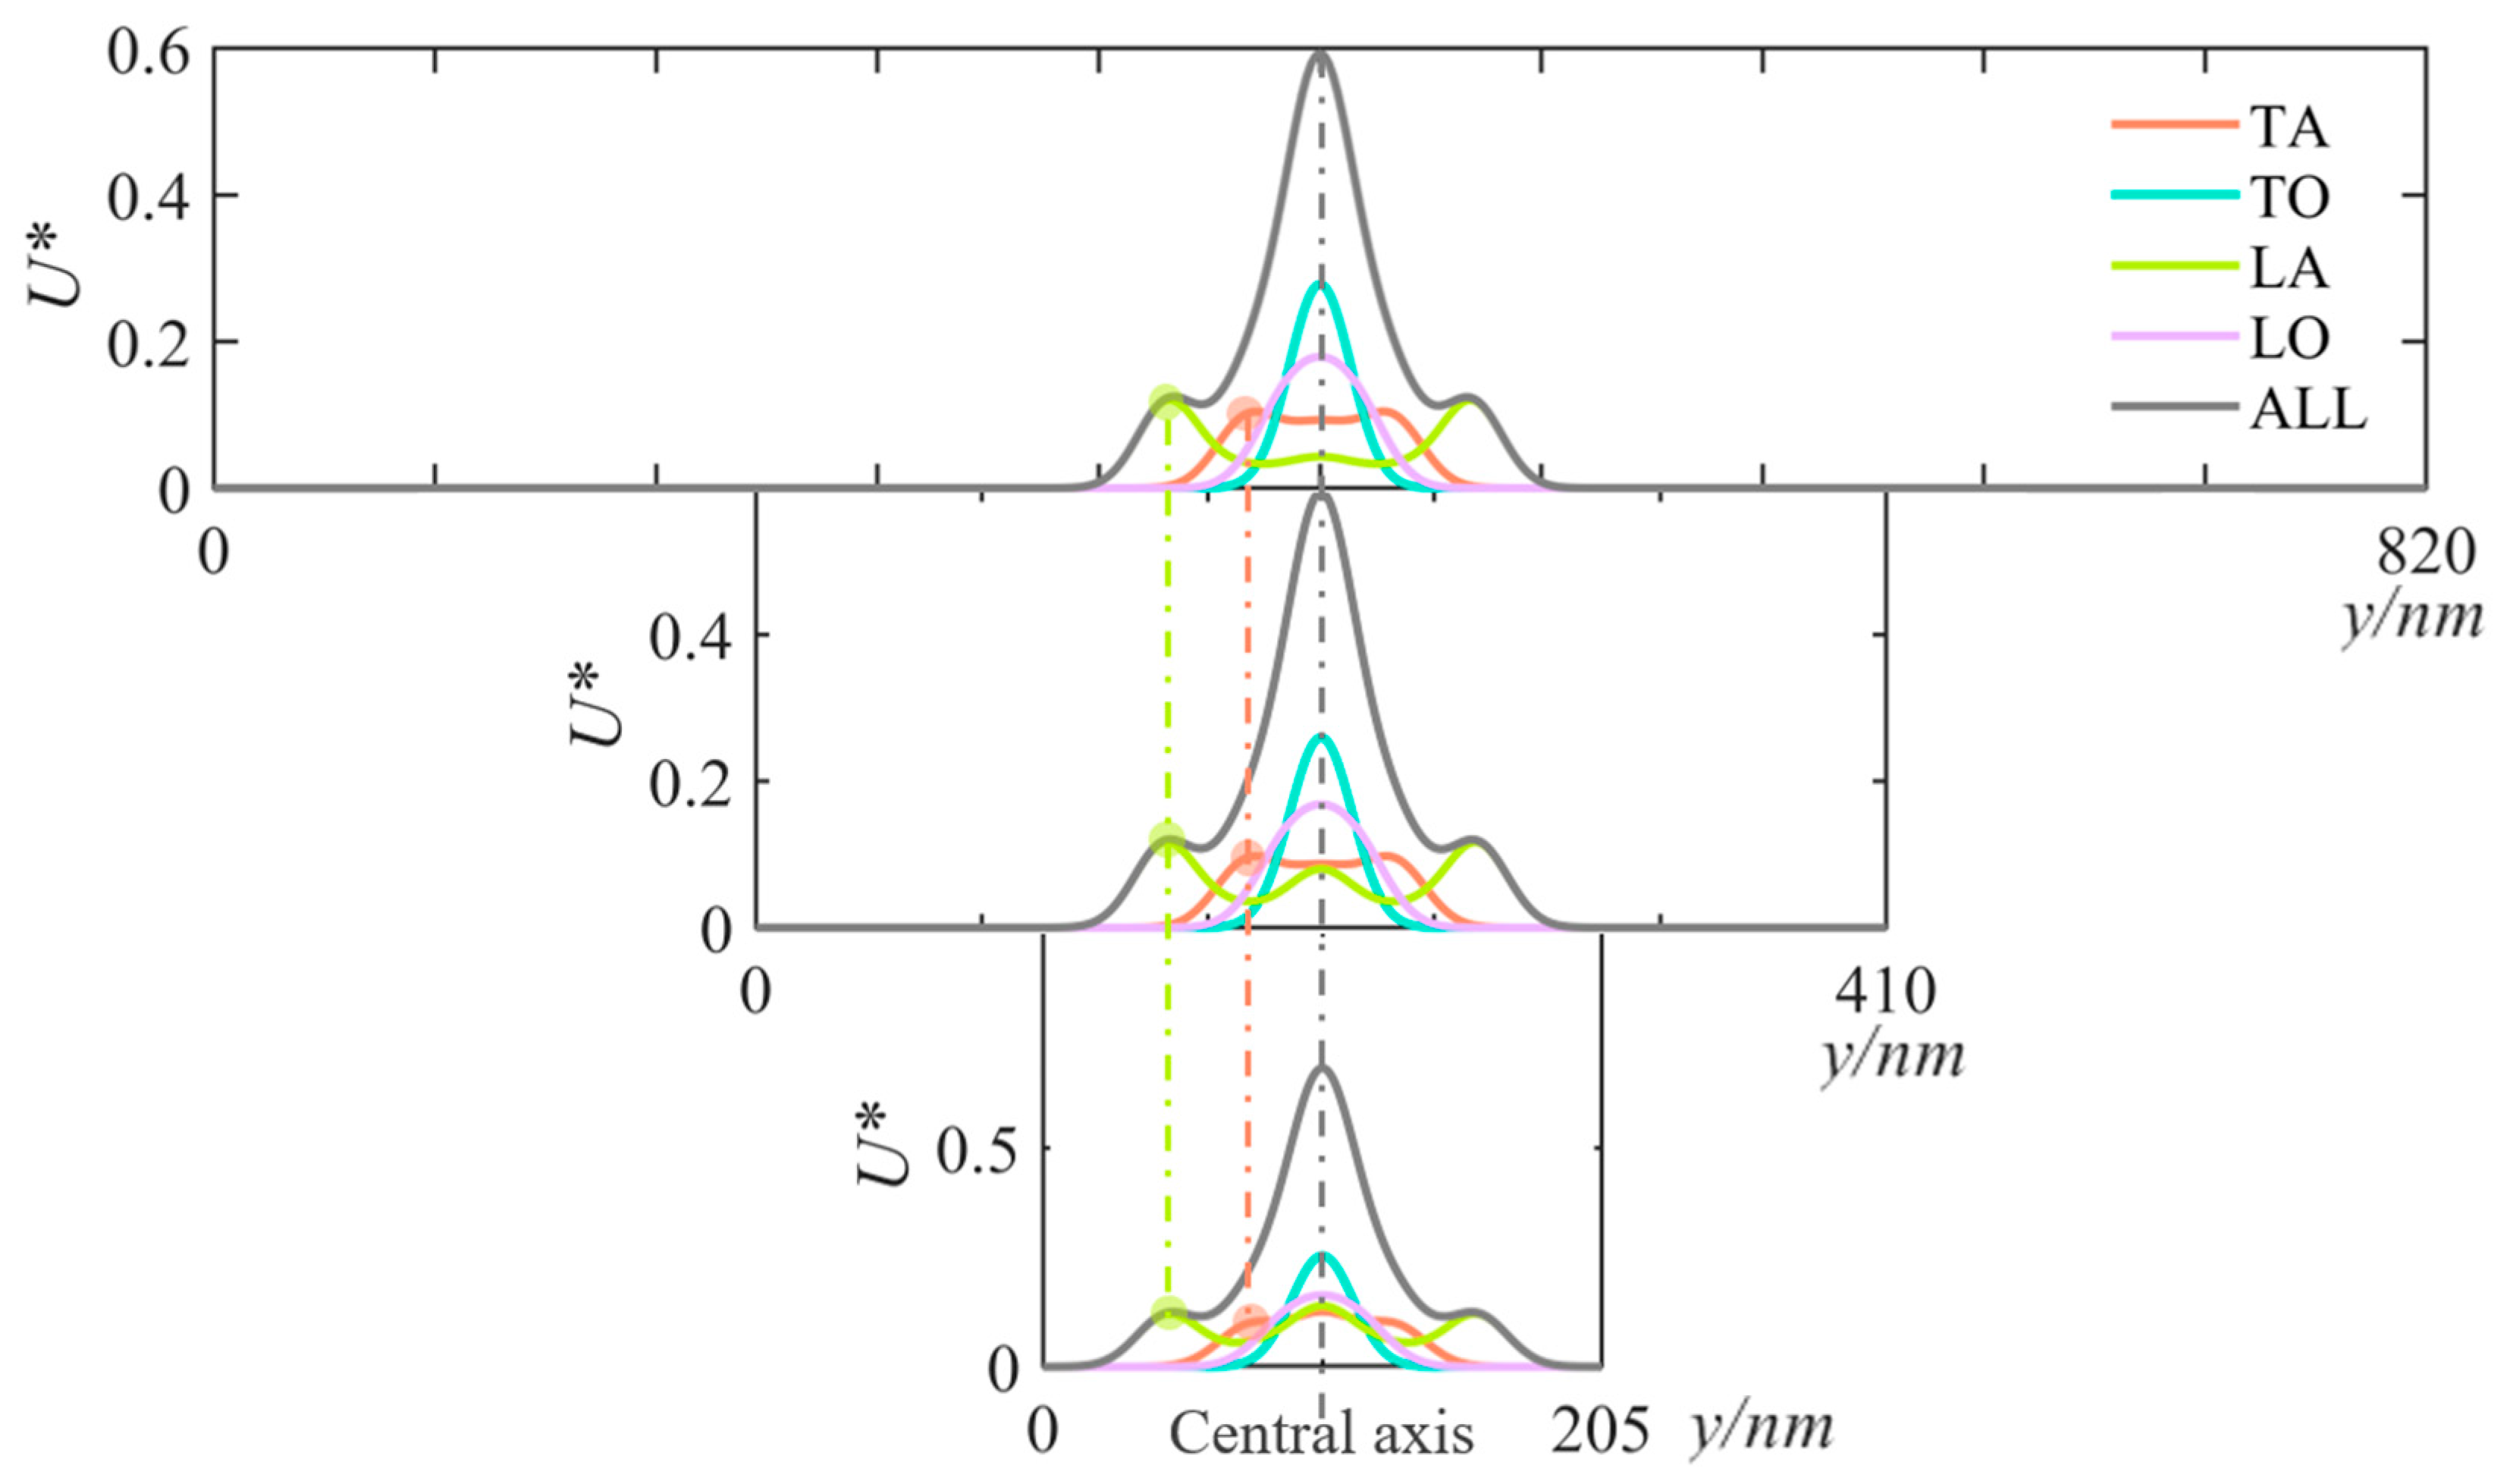
3.3.2. Along the Longitudinal Direction of the Film

The longitudinal size of the thin film is ten times larger than the tangential size, resulting in longitudinal size of 820 nm, 410 nm, and 205 nm, respectively. As depicted in Figure 8, it is evident that changes in the longitudinal dimension have a smaller impact on the distribution of phonon energy compared to the tangential dimension. This can be attributed to the fact that a larger longitudinal dimension reduces the size dependence of phonons, leading to a lower degree of phonon boundary scattering. In other words, increasing the longitudinal size does not significantly affect the distribution of phonon energy density before the phonons reach the longitudinal boundary.

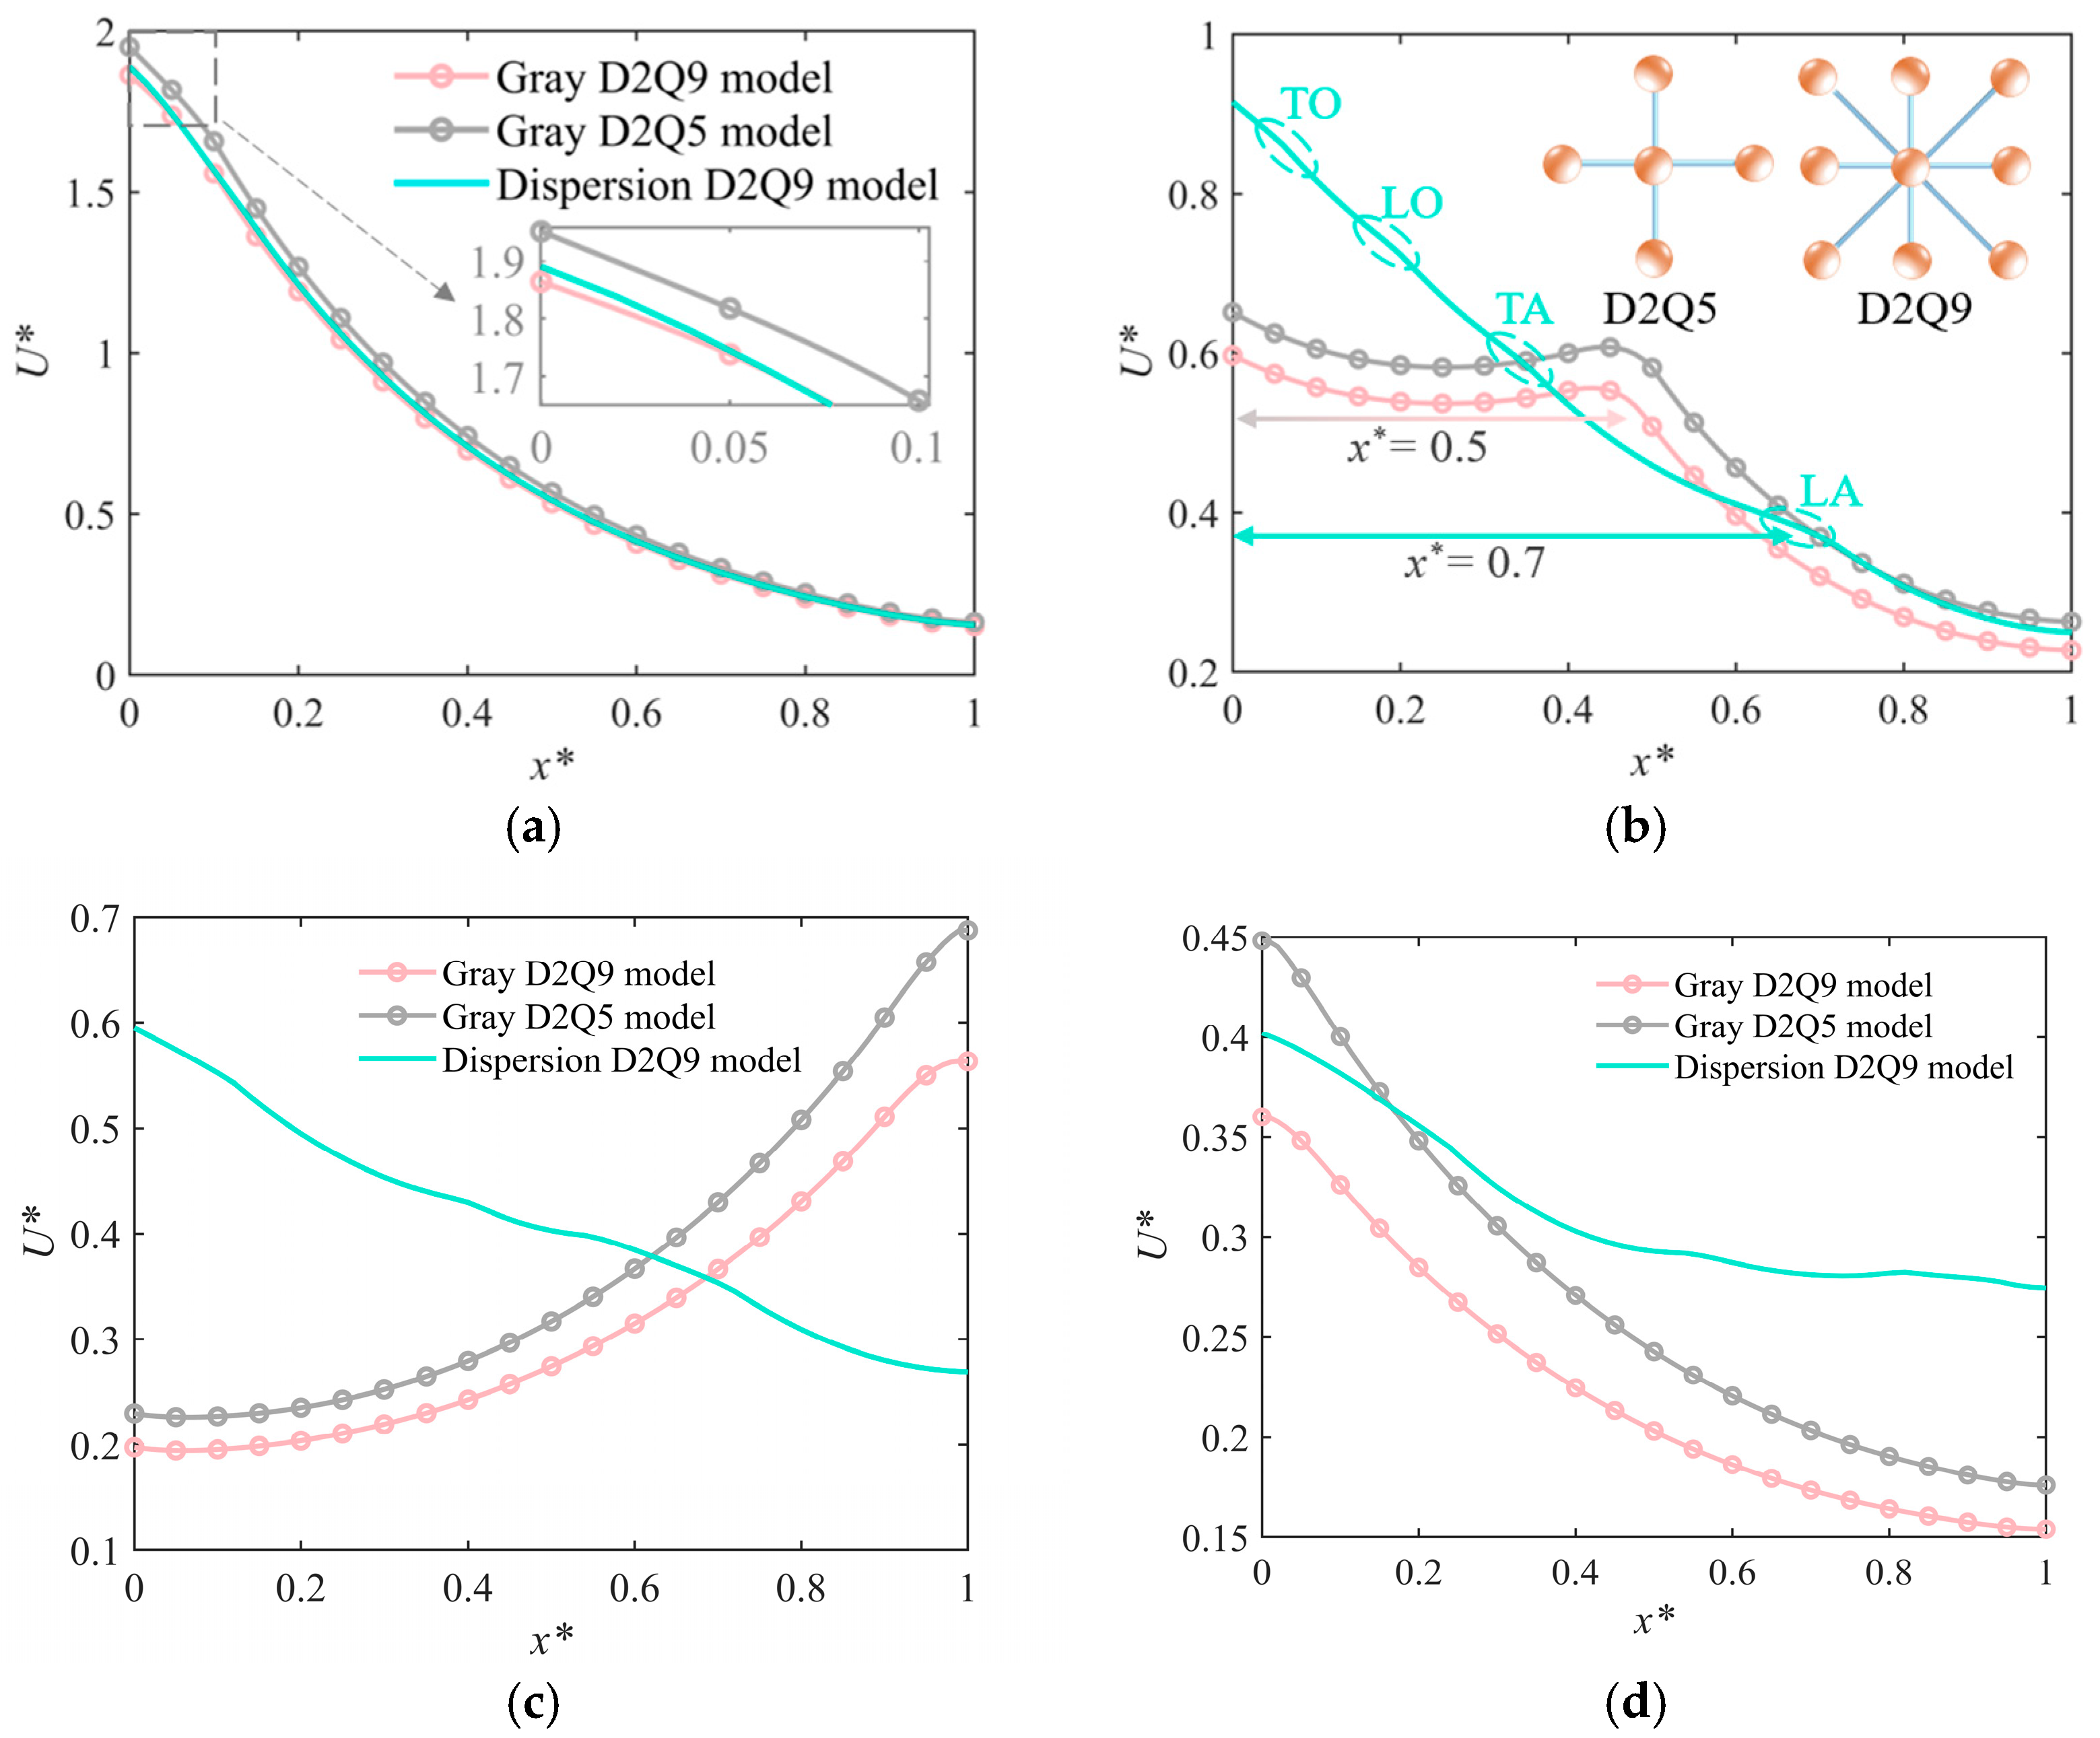
3.4. Comparison of Dispersion and Gray Model

Under the film with tangential size of 41 nm, the simulation results obtained from the dispersive model and gray model with D2Q9 lattice are compared to investigate the differences after considering the phonon polarization effect. Additionally, in order to investigate the influence of lattice structure on the simulation results, the D2Q5 lattice with gray model is also compared.

3.4.1. Along the Tangential Direction of the Film

As shown in Figure 9a, when t* = 0.1, the results from different models are similar in a short time. This implies that the most convenient gray model with D2Q5 lattice can be chosen during the pulse duration phase. However, significant differences are observed between the gray model and the dispersion model when t* = 0.5. For the dispersive model, multiple thermal waves superimpose to form complex phonons transport behaviors, while for the gray model, there is only one obvious wave-like energy transport. This is due to the fact that the gray model simplifies the influence of phonon polarization, with all phonons propagating at a fixed speed. In the gray model, the phonon mean free path is uniquely 41 nm, and the phonon group velocity is fixed at 6300 m/s [35]. Through equations derivation, the dimensionless path of thermal wave propagation can be obtained as Knt*. Therefore, when t* = 0.5, the thermal wave arrives at a dimensionless position of 0.5 in both the gray models. It implies that changing the lattice model only affects the energy distribution, but does not affect the propagation speed of phonons.
However, the D2Q9 lattice has more discrete directions than the D2Q5 lattice, which provides more pathways for phonon propagation, thereby improving the transmission efficiency. Therefore, the energy density decreases more rapidly in the D2Q9 lattice than in the D2Q5 lattice, with the peak values of the two thermal waves being 0.61 and 0.55 in Figure 9b.
In addition, compared to the dispersive model, the gray model has a faster decrease of energy density on the left side. The cause behind this is that the dispersive model has the faster LA branch, but the slower optical branches lead to lower energy transmission efficiency. As shown in Figure 9b, the thermal wave of the fastest LA branch is located at 0.7, while the propagation speeds of other phonon branches are slower than the single propagation speed in the gray model.
As time goes by, Figure 9c shows that the thermal wave in the gray model reaches the right boundary of the thin film. Under the influence of the specular reflection boundary condition, when t* = 2.0, the thermal wave returns to the left boundary. In this process, the average energy density decreases continuously until reaching the equilibrium state. Compared to the gray model, the energy peak of the dispersive model always stays on the left side of the thin film, and the energy density decreases at a slower rate, eventually reaching the equilibrium state.

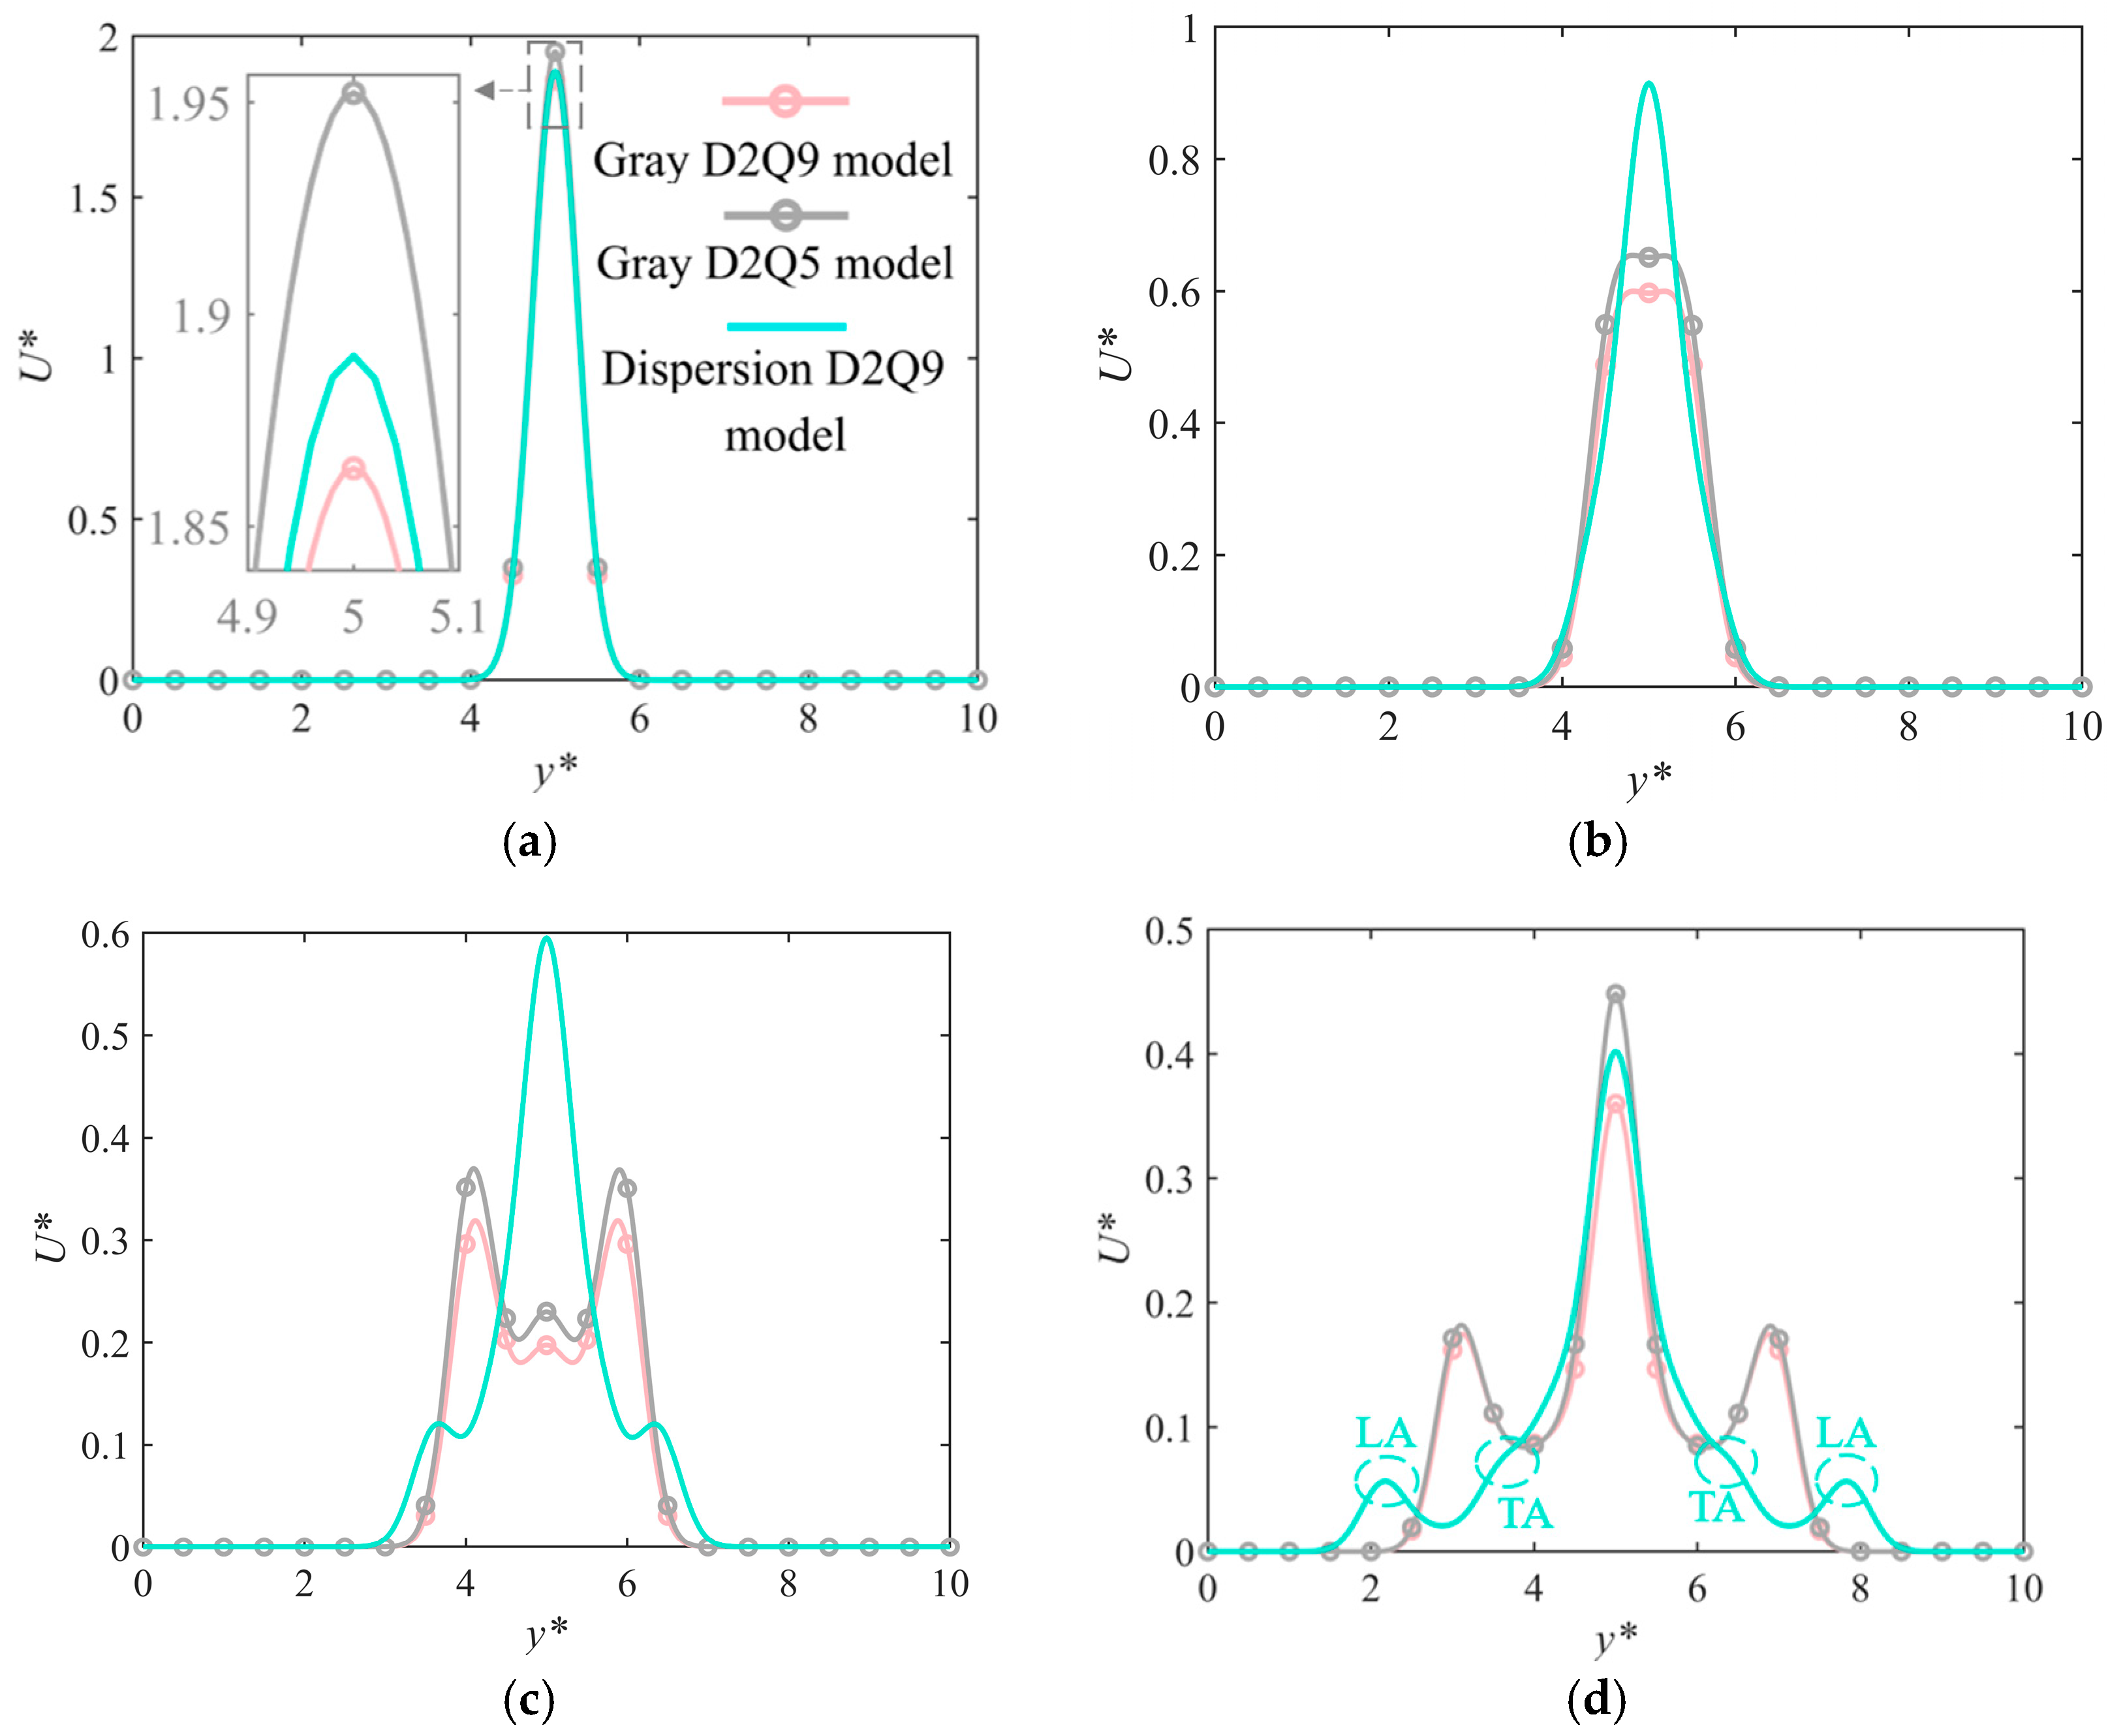
3.4.2. Along the Longitudinal Direction of the Film

As it can be seen in Figure 10, the gray model with D2Q9 lattice is always lower than the D2Q5 lattice, indicating that the propagation patterns of phonons in the longitudinal and tangential directions of the thin film are the same. In Figure 10b,c, the peak values of energy density of the dispersive model consistently remain higher, at 0.92 and 0.59, respectively. In contrast to this, the gray model has higher energy transmission efficiency than both sides, and thus the energy density at the center position decreases faster.
When t* = 2.0, the tangential thermal wave returns to the left side of the thin film as seen in Figure 9d, causing a sharp increase in the energy density at the left center position, which further affects the longitudinal energy distribution. This is shown in the gray model in Figure 10d, where the energy density at the central position increases, narrowing the difference between it and the dispersion model. In addition, the LA branch has a faster propagation speed, resulting in a wider propagation range of energy. At this point, the peak heat wave of the dispersive model influenced by LA is 0.056, reaching positions at 2.16 and 7.84. In comparison, the peak value of the thermal wave in the gray model is close to 0.18, reaching positions at 3.1 and 6.9. This means that although LA has a faster propagation speed, it carries less energy.
In summary, the results obtained from the three models are relatively consistent during the laser pulse duration. Therefore, considering minimum computational cost, the gray D2Q5 model can be selected. After the pulse ends, the dispersive model can describe the propagation of phonons more accurately by taking into account the relationship between phonon frequency and wave vector. However, the gray model may neglect some complex behaviors in the energy transfer process.

4. Conclusions

Based on the dispersion relationship of silicon, the energy transfer in nano-silicon thin films under laser irradiation is simulated using LBM, and the phonon transport characteristics are analyzed. The effects of film size and boundary conditions on energy transfer are considered. Additionally, a comparison between the dispersion model and the gray model is made to investigate the effect of phonon polarization on energy transfer. The main conclusions are as follows:
(1)
The propagation speed and transfer performance of different phonon branches determine the distribution and fluctuation characteristics of energy. The LA and TA phonon branches have the faster propagation speed and high energy transfer efficiency, while the TO and LO phonon branches have the slower propagation speed and poorer transfer performance, resulting in less energy accumulation in the longitudinal direction and difficulty in forming significant thermal wave phenomena.
(2)
As the thin film size decreases, the energy density inside the thin film gradually increases. When the film tangential size is 82 nm, the total phonon energy density is dominated by acoustic modes. When the thin film thickness is 20.5 nm, the total energy density is significantly influenced by optical modes. This means that as the film size decreases, the influence of the optical phonon branch gradually increases.
(3)
The dispersion model can more accurately describe the propagation behavior of waves as it takes into account the relationship between frequency and wave vector, with different phonon branches having different propagation speeds. In contrast, the gray model simplifies the effect of phonon polarization, assuming all phonons propagate at a fixed speed, which may result in slightly lower accuracy.
(4)
When more attention is paid to the characteristics of energy in the transmission process, the dispersive model is preferred. If only the initial and equilibrium states of energy transfer are taken into account, the gray model is also a good choice. Compared to the D2Q5 lattice, the increase in computational cost of the D2Q9 lattice is small, but faster transmission efficiency can be achieved. Consequently, the D2Q9 lattice is a superior choice.
The research of phonon polarization and energy transfer contributes to a deeper understanding of phonon transport characteristics in nanomaterials. According to the concerned energy distribution stage, it provides a reference for the model selection of micro nano heat transfer research.

Author Contributions

Conceptualization, Y.M., M.K.K. and K.Y.; Methodology, Y.M., J.L., M.Y. and K.Y.; Software, Y.M.; Validation, Y.M. and X.L.; Investigation, S.L., J.L., M.K.K., M.Y. and X.L.; Writing—original draft, Y.M., S.L. and K.Y.; Writing—review and editing, Y.M., J.L., M.K.K., M.Y. and K.Y.; Supervision, J.L., M.Y. and K.Y.; Project administration, Y.M.; Funding acquisition, K.Y. All authors have read and agreed to the published version of the manuscript.

Funding

This research is funded by the Natural Science Foundation of Shandong Province (No. ZR2017BEE052), a sub-project of the National Key R&D Program (No. 2016YFC0700803-01). This work was also supported by the Plan of Introduction and Cultivation for Young Innovative Talents in Colleges and Universities of Shandong Province, and the scientific and technological project of Suzhou City in 2021.

Data Availability Statement

Data are contained within the article.

Conflicts of Interest

The authors declare no conflict of interest.

References

  1. Onatayo, D.A.; Srinivasan, R.S.; Shah, B. Ultraviolet Radiation Transmission in Buildings’ Fenestration: Part I, Detection Methods and Approaches Using Spectrophotometer and Radiometer. Buildings 2023, 13, 1670. [Google Scholar] [CrossRef]
  2. Anderson, A.L.; Chen, S.; Romero, L.; Top, I.; Binions, R. Thin Films for Advanced Glazing Applications. Buildings 2016, 6, 37. [Google Scholar] [CrossRef]
  3. Xue, X.; Patra, B.; van Dijk, J.P.G.; Samkharadze, N.; Subramanian, S. CMOS-based cryogenic control of silicon quantum circuits. Nature 2021, 593, 205–210. [Google Scholar] [CrossRef]
  4. Margalit, N.; Xiang, C.; Bowers, S.M. Perspective on the future of silicon photonics and electronics. Appl. Phys. Lett. 2021, 118, 220501. [Google Scholar] [CrossRef]
  5. Luo, X.; Luo, H.W.; Li, H.J.; Xia, R.; Zheng, X.T. Efficient Perovskite/Silicon Tandem Solar Cells on Industrially Compatible Textured Silicon. Adv. Mater. 2023, 35, 2207883. [Google Scholar] [CrossRef] [PubMed]
  6. Kuang, W.Y.; Illankoon, C.; Vithanage, S.C. Grid-Connected Solar Photovoltaic (PV) System for Covered Linkways. Buildings 2022, 12, 2131. [Google Scholar] [CrossRef]
  7. Caballero-Lucas, F.; Obata, K.; Sugioka, K. Enhanced ablation efficiency for silicon by femtosecond laser microprocessing with GHz bursts in MHz bursts (BiBurst). Int. J. Extreme Manuf. 2022, 4, 015103. [Google Scholar] [CrossRef]
  8. Podder, C.; Gong, X.T.; Pan, H. Ultrafast, Non-Equilibrium and Transient Heating and Sintering of Nanocrystals for Nanoscale Metal Printing. Small 2021, 17, 2103436. [Google Scholar] [CrossRef]
  9. Polyakov, D.S.; Shandybina, G.D.; Shamova, A.A. Ultrafast changes of optical properties of semiconductors at wavelength near the edge of interband absorption after excitation by femtosecond laser pulse. Optika 2022, 256, 168751. [Google Scholar] [CrossRef]
  10. Du, G.Q.; Yu, F.R.; Lu, Y.; Kai, L.; Yang, Q. Ultrafast thermalization dynamics in Au/Ni film excited by femtosecond laser double-pulse vortex beam. Int. J. Therm. Sci. 2023, 187, 108208. [Google Scholar] [CrossRef]
  11. Zhang, C.; Guo, Z.L. A transient heat conduction phenomenon to distinguish the hydrodynamic and (quasi) ballistic phonon transport. Int. J. Heat Mass Transf. 2021, 181, 121847. [Google Scholar] [CrossRef]
  12. Ramirez, R.; Herrero, C.P. Phonon dispersion in two-dimensional solids from atomic probability distributions. J. Chem. Phys. 2020, 151, 224107. [Google Scholar] [CrossRef]
  13. Bin Mansoor, S.; Yilbas, B.S. Phonon Transport Characteristics in a Thin Silicon Film. J. Comput. Omput. Theor. Trans. 2015, 44, 154–174. [Google Scholar] [CrossRef]
  14. Guo, Y.Y.; Wang, M.R. Lattice Boltzmann modeling of phonon transport. J. Comput. Phys. 2016, 315, 1–15. [Google Scholar] [CrossRef]
  15. Nabovati, A.; Sellan, D.P.; Amon, C.H. On the lattice Boltzmann method for phonon transport. J. Comput. Phys. 2011, 15, 5864–5876. [Google Scholar] [CrossRef]
  16. Li, H.L.; Shiomi, J.; Cao, B.Y. Ballistic-Diffusive Heat Conduction in Thin Films by Phonon Monte Carlo Method: Gray Medium Approximation Versus Phonon Dispersion. J. Heat Transf.-ASME 2020, 142, 112502. [Google Scholar] [CrossRef]
  17. Escobar, R.A.; Amon, C.H. Thin Film Phonon Heat Conduction by the Dispersion Lattice Boltzmann Method. J. Heat Transf.-ASME 2008, 139, 092402. [Google Scholar] [CrossRef]
  18. Zhang, C.; Guo, Z.L.; Chen, S.Z. An implicit kinetic scheme for multiscale heat transfer problem accounting for phonon dispersion and polarization. Int. J. Heat Mass Transf. 2019, 130, 1366–1376. [Google Scholar] [CrossRef]
  19. Luo, X.P.; Yi, H.L. A discrete unified gas kinetic scheme for phonon Boltzmann transport equation accounting for phonon dispersion and polarization. Int. J. Heat Mass Transf. 2017, 114, 970–980. [Google Scholar] [CrossRef]
  20. Kumar, N.; Barry, M.C.; Kumar, S. Thermal transport in beta-gallium oxide thin-films using non-gray Boltzmann transport equation. J. Phys.-Condens. Matter 2022, 34, 105603. [Google Scholar] [CrossRef]
  21. McNamara, G.R.; Zanetti, G. Use of the Boltzmann equation to simulate lattice-gas automata. Phys. Rev. Lett. 1988, 20, 2332–2335. [Google Scholar] [CrossRef] [PubMed]
  22. Bin Mansoor, S.; Yilbas, B.S. Phonon Transport in Silicon Thin Film: Effect of Temperature Oscillation on Effective Thermal Conductivity. Transp. Theory Stat. Phys. 2014, 42, 179–201. [Google Scholar] [CrossRef]
  23. Liu, J.; Zhang, C.; Yuan, H.Z.; Su, W.; Wu, L. A fast-converging scheme for the phonon Boltzmann equation with dual relaxation times. J. Comput. Phys. 2022, 467, 111436. [Google Scholar] [CrossRef]
  24. Li, R.Y.; Lee, E.; Luo, T.F. Physics-Informed Deep Learning for Solving Coupled Electron and Phonon Boltzmann Transport Equations. Phys. Rev. Appl. 2023, 19, 064049. [Google Scholar] [CrossRef]
  25. Joseph, A.M.; Cao, B.Y. Electron Heat Source Driven Heat Transport in GaN at Nanoscale: Electron-Phonon Monte Carlo Simulations and a Two Temperature Model. Materials 2022, 15, 1651. [Google Scholar] [CrossRef] [PubMed]
  26. Zhang, J.; Zhang, H.C.; Wang, Q.; Sun, W.B.; Zhang, D. Study on Phonon Localization in Silicon Film by Molecular Dynamics. Coatings 2022, 12, 422. [Google Scholar] [CrossRef]
  27. Namvar, M.; Leclaire, S. LaBCof: Lattice Boltzmann boundary condition framework. Comput. Phys. Commun. 2023, 285, 108647. [Google Scholar] [CrossRef]
  28. Kumar, S.; Vradis, G.C. Thermal-Conductivity of Thin Metallic-Films. J. Heat Transf.-ASME 1994, 1, 28–34. [Google Scholar] [CrossRef]
  29. Li, Y.F.; Zhang, T.; Zhang, Y.; Zhao, C.G. A comprehensive experimental study regarding size dependence on thermal conductivity of graphene oxide nanosheet. Int. Commun. Heat Mass 2022, 130, 105764. [Google Scholar] [CrossRef]
  30. Ren, X.; Shi, S.H. A Buckling Analysis of Thermoelastic Micro/Nano-Beams Considering the Size-Dependent Effect and Non-Uniform Temperature Distribution. Materials 2023, 16, 6390. [Google Scholar] [CrossRef]
  31. Han, Y.F.; Liu, H.D. An investigation of Phonon Heat Transport: Influence of Size and Geometric Configuration. J. Comput. Theor. Nanosci. 2015, 12, 1478–1782. [Google Scholar] [CrossRef]
  32. Huang, M.J.; Weng, C.C.; Chang, T.M. An investigation of the phonon properties of silicon nanowires. Int. J. Therm. Sci. 2010, 49, 1095–1102. [Google Scholar] [CrossRef]
  33. Li, L.K.; Mei, R.W.; Klausner, J.F. Lattice Boltzmann models for the convection-diffusion equation: D2Q5 vs. D2Q9. Int. J. Heat Mass Transf. 2017, 108, 41–62. [Google Scholar] [CrossRef]
  34. Mao, Y.D.; Xu, M.T. Lattice Boltzmann numerical analysis of heat transfer in nano-scale silicon films induced by ultra-fast laser heating. Int. J. Therm. Sci. 2015, 89, 210–221. [Google Scholar] [CrossRef]
  35. Chattopadhyay, A.; Pattamatta, A. A Comparative Study of Submicron Phonon Transport Using the Boltzmann Transport Equation and the Lattice Boltzmann Method. Numer. Heat Transf. Part B Fundam. 2014, 66, 360–379. [Google Scholar] [CrossRef]
Figure 1. Schematic diagram of ultrafast laser irradiation of the two-dimensional nano-silicon film.
Buildings 14 00210 g001
Figure 2. (a) D2Q5 lattice; (b) D2Q9 lattice.
Buildings 14 00210 g002
Figure 3. (a) Phonon dispersion relationship in silicon thin films. (b) Phonon vibration modes in silicon thin films.
Buildings 14 00210 g003
Figure 4. Validation of present work with published work [17].
Buildings 14 00210 g004
Figure 5. Instantaneous dimensionless energy density distribution at the hot spot along the tangential direction inside the film with L = 41 nm. LA stands for longitudinal acoustic branch, TA stands for transverse acoustic branches, LO stands for longitudinal optical branch, TO stands for transverse optical branches, ALL stands for total phonon branches. (a) t* = 0.1; (b) t* = 0.5; (c) t* = 1; (d) t* = 2.
Buildings 14 00210 g005
Figure 6. Instantaneous dimensionless energy density distribution at the hot spot along the longitudinal direction inside the film with M = 410 nm. LA stands for longitudinal acoustic branch, TA stands for transverse acoustic branches, LO stands for longitudinal optical branch, TO stands for transverse optical branches, ALL stands for total phonon branches. (a) t* = 0.1; (b) t* = 0.5; (c) t* = 1; (d) t* = 2.
Buildings 14 00210 g006
Figure 7. Instantaneous energy density distribution along the tangential direction under size-dependent at t* = 1.
Buildings 14 00210 g007
Figure 8. Instantaneous energy density distribution along the longitudinal direction under size-dependent at t* = 1.
Buildings 14 00210 g008
Figure 9. Instantaneous energy density distribution along the tangential direction under different models. (a) t* = 0.1; (b) t* = 0.5; (c) t* = 1; (d) t* = 2.
Buildings 14 00210 g009
Figure 10. Instantaneous energy density distribution along the longitudinal direction under different models. (a) t* = 0.1; (b) t* = 0.5; (c) t* = 1; (d) t* = 2.
Buildings 14 00210 g010
Table 1. Physical parameters of the ultrafast laser and nano-silicon film [34].
Parameters and SymbolsNumerical ValueUnits
Initial temperature T0300K
Silicon volumetric heat capacity Cv2.3 × 106J/(m3·K)
Phonon relaxation time τ6.5ps
Laser pulse duration tp0.65ps
Laser energy density J732J/m2
Laser penetration depth δ15.3nm
Laser influence radius r015.3nm
Surface reflectance R0.93-
Disclaimer/Publisher’s Note: The statements, opinions and data contained in all publications are solely those of the individual author(s) and contributor(s) and not of MDPI and/or the editor(s). MDPI and/or the editor(s) disclaim responsibility for any injury to people or property resulting from any ideas, methods, instructions or products referred to in the content.

