Article

Identifying Urban Built-Up Areas Based on Spatial Coupling between Nighttime Light Data and POI: A Case Study of Changchun

1
Faculty of Environmental Engineering, The University of Kitakyushu, Kitakyushu 808-0135, Japan
2
School of Municipal and Environmental Engineering, Jilin Jianzhu University, Changchun 130119, China
*
Author to whom correspondence should be addressed.
Buildings 2024, 14(1), 19; https://doi.org/10.3390/buildings14010019
Submission received: 23 October 2023 / Revised: 25 November 2023 / Accepted: 27 November 2023 / Published: 20 December 2023
(This article belongs to the Section Architectural Design, Urban Science, and Real Estate)

Abstract

:
Nighttime light (NTL) data and points of interest (POI) data offer precise visual indications of the distributional characteristics of urban spatial structures. This study employed nighttime light data and point of interest data to investigate spatial distribution patterns in Changchun, a selected study area. The built-up area was extracted from the nighttime light data, while kernel density analysis was utilized to examine the distribution of point of interest data. The processing outcomes of both datasets were gridded with spatially resolved resolution. Afterward, the fishnet tool was employed to conduct two-factor integrated mapping and visual analysis, which helped identify shared or divergent spatial coupling relationships. The results indicated a high degree of consistency in the distribution of both NTL and POI across Changchun, with 84.58% of the coupling demonstrating a concordant pattern. The spatial analysis conducted in this study showed that the heterogeneities of the coupling relationship within each administrative borough expanded outward from the center of the borough. POI provided a more accurate depiction of the spatial distribution of urban built-up areas compared to NTL, leading to a more precise representation of spatial patterns of human activity intensity. Changchun has undergone zoning adjustments, resulting in the emergence of multiple urban centers in both the central city and the surrounding administrative districts. These urban centers are gradually merging into each other. The study found that the level of spatial coupling was much higher in the central area compared to the surrounding administrative districts. This has contributed to the formation of multiple urban centers and the gradual expansion of the urban built-up area beyond the main city, indicating a trend towards regional integration and development. This study provides a more detailed and accurate description of the current distribution of urbanization and spatial structural characteristics of Changchun by investigating the spatial coupling between POI and NTL. The findings contribute to a better understanding of the urban development patterns in the region and provide insights for future urban planning and management.

1. Introduction

Cities emerge as a result of the gradual development of human society. Urbanization refers to the process by which rural populations are transformed into urban populations and the surrounding countryside is transformed into urban areas [1]. Since the start of the 21st century, China, as the world’s largest developing country, has entered a period of rapid urbanization [2]. In recent decades, urbanization has been a focal point, widely perceived as an inexorable trend in the progression of modern society. It transcends being solely an economic and social phenomenon, evolving into an intricate ecological and environmental quandary. Throughout the urbanization process, due consideration must be given to the sustainable development of cities and the symbiotic relationship between urban areas and the natural environment. The persistent growth of urban populations, the continual expansion of urban spaces, and the intelligent and eco-friendly evolution of urban transportation not only impose heightened demands on urban planning and management but also present an array of opportunities and challenges. These trends, including the perpetual increase in urban populations, the ongoing enlargement of urban spaces, and the judicious, environmentally conscious transformation of urban transportation, not only necessitate elevated standards in urban planning and management but also afford us a multitude of opportunities and challenges. Urbanization, in addition to its challenges, holds the potential to propel social advancement and civilizational development, providing diverse possibilities for the future progression of human society [3]. Currently, China is experiencing a rapid phase of economic growth, which has led to accelerated urbanization and the gradual formation of urban built-up areas, resulting in the rapid expansion of urban scale [4]. The term “built-up area” generally refers to the urbanized area within the administrative boundaries of a city that has undergone significant development and construction, with the basic infrastructure and public facilities in place [5]. The built-up area of a city can consist of either a closed and complete area or several closed areas [6]. Efficient and accurate acquisition of the morphology of urban built-up areas has been a hot research topic in remote sensing technology [7].
Remote sensing technology was developed in the 1960s. It is a technology that enables the collection of electromagnetic radiation information from artificial satellites about the Earth’s surface and environment, allowing for the determination of the distribution of natural resources and the environment. The Defense Meteorological Satellite Program (DMSP) carries Operation Line Scan (OLS) sensors that can provide a significant amount of data for supporting Earth observation studies. The DMSP/OLS data has a spatial resolution of 1 km. The Suomi National Polar-orbiting Partnership (NPP) satellite was successfully launched on 28 October 2011. The Visible Infrared Imaging Radiometer Suite (VIIRS) is a crucial instrument on board the spacecraft, which provides NPP/VIIRS data with a resolution of 500 m [8]. Many studies on built-up area extraction rely on remote sensing data, and nighttime light data (NTL) has provided significant support for such research. Extracting urban built-up areas using NTL data can largely avoid the spectral confusion that occurs with traditional multispectral remote sensing methods [9]. Compared to DMSP/OLS data with a resolution of 1 km, NPP/VIIRS data has a higher resolution of 500 m. This improvement helps to overcome the issue of light saturation and is more suitable for high-precision research [10].
Significant progress has been achieved globally in the fields of urban and regional development, environmental monitoring, industrial efficiency, early warning and disaster prevention, natural resource management, agriculture, and food systems through the utilization of big data and artificial intelligence technologies [11]. The effective management of smart city development relies on data derived from diverse sources. During urban governance, big data proves invaluable for processing the amassed information and analyzing its efficacy. This analytical process enables the government to formulate necessary measures based on the findings, facilitating a deeper understanding of societal needs. Furthermore, leveraging big data for monitoring and analyzing public opinion can significantly enhance scientific decision-making and foster democratic urban governance [12]. In recent years, the integration of big data with nighttime light data has become increasingly prevalent in the analysis of urban spatial structures. In such studies, point of interest (POI) data is most frequently employed and commonly utilized for delineating the precise boundaries of urban built-up areas. Utilizing nighttime light data for built-up area extraction can significantly mitigate spectral confusion encountered in traditional multispectral remote sensing. However, due to the lower resolution of the data, extracting fine boundaries of urban-scale built-up areas becomes challenging. POI contains precise location information and rich attribute details. The method for extracting built-up areas based on POI primarily involves setting a threshold for kernel density to extract urban built-up areas. However, due to the need for selecting larger bandwidth and grid sizes when calculating kernel density, the results may become excessively smooth, failing to accurately reflect the boundary details of built-up areas. In recent years, the use of POI to identify urban built-up areas has become increasingly popular. Therefore, in this paper, NPP/VIIRS nighttime lighting data is selected to extract the urban built-up area. POI (point of interest) data is utilized as it contains precise location information and each point has attributes such as name, category, coordinates, and classification [13]. POI data is characterized by a large volume of data, rich in content, quick update speed, high accuracy, and high practicality [14].
Most existing studies focus on using either nighttime lighting data or POI alone to identify urban spatial structures. However, there have been relatively few studies that combine both data sources to extract urban built-up areas. This paper utilizes NPP/VIIRS nighttime lighting data and POI to investigate the distribution pattern of built-up areas from the perspective of spatial coupling relationships.
This paper conducts a spatially coupled analysis of urban development trends at the city level using data that built-up area extracted from nighttime light data and POI. Data gridding, kernel density analysis, and two-factor mapping methods were used to analyze the spatial coupling relationship between the two types of data. Regions with similar and dissimilar couplings were analyzed to derive spatial structural characteristics in different coupling patterns. The aim is to provide theoretical guidance for urban spatial restructuring and city planning in Changchun. Additionally, it serves as a scientific basis and improvement reference for enhancing and adjusting the spatial structure within other cities.

2. Literature Review

2.1. Application of Nighttime Light Data in Research

Due to the continuous improvement of remote sensing technology, nighttime lighting data (NTL) has been extensively utilized in urban studies [15]. Investigating the structure of polycentric cities is crucial in comprehending the mechanisms driving urban development, thereby facilitating the advancement of urban planning and management [16]. Suburban regions serve as a vital transitional zone between urban built-up areas and rural territories. Thus, accurate identification of these areas is essential for investigating economic development and ecological changes associated with urbanization. Nighttime light data are commonly utilized in identifying suburban areas through the K-means algorithm. Liu employed NPP/VIIRS nighttime light data to identify urban suburbs, which exhibited greater accuracy and efficiency compared to conventional change detection techniques [17]. Feng utilized DMSP/OLS nighttime light data to delineate regions characterized by a blend of urban and rural settings, thereby offering a more nuanced portrayal of suburban distribution patterns [18]. Hu utilized DMSP/OLS nighttime lighting data to demarcate the boundaries of urban areas in a city mapping study [19].
Yang developed a novel approach utilizing calibrated DMSP/OLS and NPP/VIIRS nighttime light data to quantify the spatiotemporal dynamics of shrinking cities in China between 1992 and 2019 [20]. Zhou constructed a framework for identifying shrinking cities at the county level in China by utilizing NPP/VIIRS nighttime lighting data and further examined the impact of three fundamental factors, namely city size, urban function, and traffic conditions, on urban shrinkage [15]. Yang analyzed the spatiotemporal distribution of carbon emissions in shrinking cities in China using the NPP/VIIRS nighttime light index and identified the underlying driving factors [21].
In this study, Liu utilized nighttime stable lighting data provided by DMSP/OLS to identify sprawling cities in China between 1992 and 2008. By effectively reducing anomalous differences, Liu was able to accurately extract sprawling cities based on nighttime light data [22]. Huang proposes an improved dynamic luminescence-based approach to simulate city limits, which aims to elucidate the spatio-temporal dynamics and drivers of urban expansion. The results demonstrate that GDP exerts a greater influence on urban expansion than population [23]. Zhen has successfully quantified urban sprawl using nighttime lighting data and has analyzed the impact of such sprawl on CO2 emissions [24]. Using DMSP-OLS and NPP-VIIRS nighttime light data, Lei extracted urban areas and constructed an evaluation system for urban vitality in WTSUA. This analysis involved combining an urban sprawl rate index with a standard deviation ellipse model. The coupling relationship was explored by employing a coupling coordination degree model [25]. Different from LEI, this study combines remote sensing data with big data to explore the structural characteristics of urban development.

2.2. Study of Nighttime Light Data Combined with POI

POI, which stands for Points of Interest, is a form of social perception data that is generated by human activities. It contains rich location and attribute information [26]. The density of urban areas exhibits abrupt variations across the boundaries of the city and its surrounding suburban and rural regions, thereby facilitating the extraction of the urban built-up area [27]. The urban built-up area can be extracted with high accuracy using the NTL Urban Index (PLANUI), which is generated by combining POI and LST [28]. Night-light remote sensing data and POI are both important sources of information for research on the spatial structure of urban areas. The study area selected by YU was the city of Sanya, which is a typical representative of port cities in the South China Sea [29]. The study focused on analyzing the relationship between regions characterized by different spatial coupling relationships and the urban spatial structure. The integration of these two types of data is utilized for identifying the spatial distribution of poverty areas. A poverty index (CPI) is proposed by integrating DEM and NDVI, and the significant factors that affect poverty are analyzed [30]. In the domain of quantifying carbon emissions, night-light data and POI data are frequently utilized as data sources. Wang established a carbon emission estimation model based on 2018 night-light data and POI. The model was used to calculate carbon emissions in Beijing and to simulate their spatial distribution [31]. In the investigation of population distribution estimation, Ma constructed an optimal population model using land cover data, nighttime light data, and nighttime LBS data. The results revealed that NTL data plays a significant role in densely populated areas [32]. Zhan used a composite index integrating POI and NPP data, formulated using a mathematical mean approach. This composite index is utilized to determine both the composite value and the count of urban centers [33]. Zhan delves into the analysis of the intensity and direction of gravitational forces among urban entities within the Guangzhou–Foshan metropolitan area. However, this study focuses on exploring the distribution characteristics of urban built-up areas. To tackle the challenge of significantly enhancing the accuracy of single satellite data in urban built-up area extraction, Zhang proposes a novel approach that integrates POI data and Luojia-1 data to improve the accuracy of urban built-up area extraction [34]. In order to achieve a more precise evaluation of urban built-up areas, he employs wavelet transforms to fuse NTL and POI for urban built-up area extraction. Zhi combines NTL and POI data to analyze spatial autocorrelation and employs geographically weighted regression to identify the multi-center distribution of the GBA urban agglomeration. Additionally, he analyzes its spatial structural characteristics from various perspectives, including functional structure identification, spatial correlation measurement, and the primary center’s service range [35]. The combination of NTL and POI can effectively address the shortcomings of urban spatial structure extracted by NTL data alone, thus producing more objective and accurate results [36].

2.3. Summary

Nighttime light (NTL) data, recorded by satellite sensors capturing light emissions, boasts advantages such as rich data volume, continuous spatiotemporal coverage, and wide geographical scope. Extracting urban built-up areas using NTL can significantly mitigate the spectral confusion associated with traditional multispectral remote sensing, leading to its widespread application in research. However, commonly used nighttime light data often suffer from low resolution and light spillage issues. Relying solely on NTL makes it challenging to extract finely detailed urban built-up area boundaries at the city scale.
Point of interest (POI) data, on the other hand, contains abundant attribute information and precise location details. This data type offers the advantages of rapid updates and low acquisition costs and has found applications in urban built-up area extraction and urban functional zone identification. To obtain more regular extraction results, when employing kernel density calculation methods for processing POI data, choosing a larger bandwidth can result in excessively smooth calculations that fail to capture built-up area details. Therefore, opting for a smaller bandwidth helps characterize the details of built-up area boundaries.
A successful and efficient method for rapidly and accurately extracting built-up areas involves connecting and merging the results from POI-based extraction with those from NTL-based extraction. This approach maximizes the use of NTL brightness information and POI-accurate location details. By employing mathematical morphology methods to integrate the results of both approaches, a more accurate delineation of urban built-up area boundaries is achieved.
Undoubtedly, NTL plays a significant role in analyzing urban development processes. However, it is essential to acknowledge the limitations of relying solely on a single data source. Based on the above discussion, it is evident that there is insufficient research on combining NTL and POI to describe the spatial coupling of cities. This paper aims to investigate the distribution pattern of built-up areas based on either the same or different spatial coupling of the two aforementioned data sources to bridge the existing research gap.

3. Methodology

3.1. Study Area Overview and Data Sources

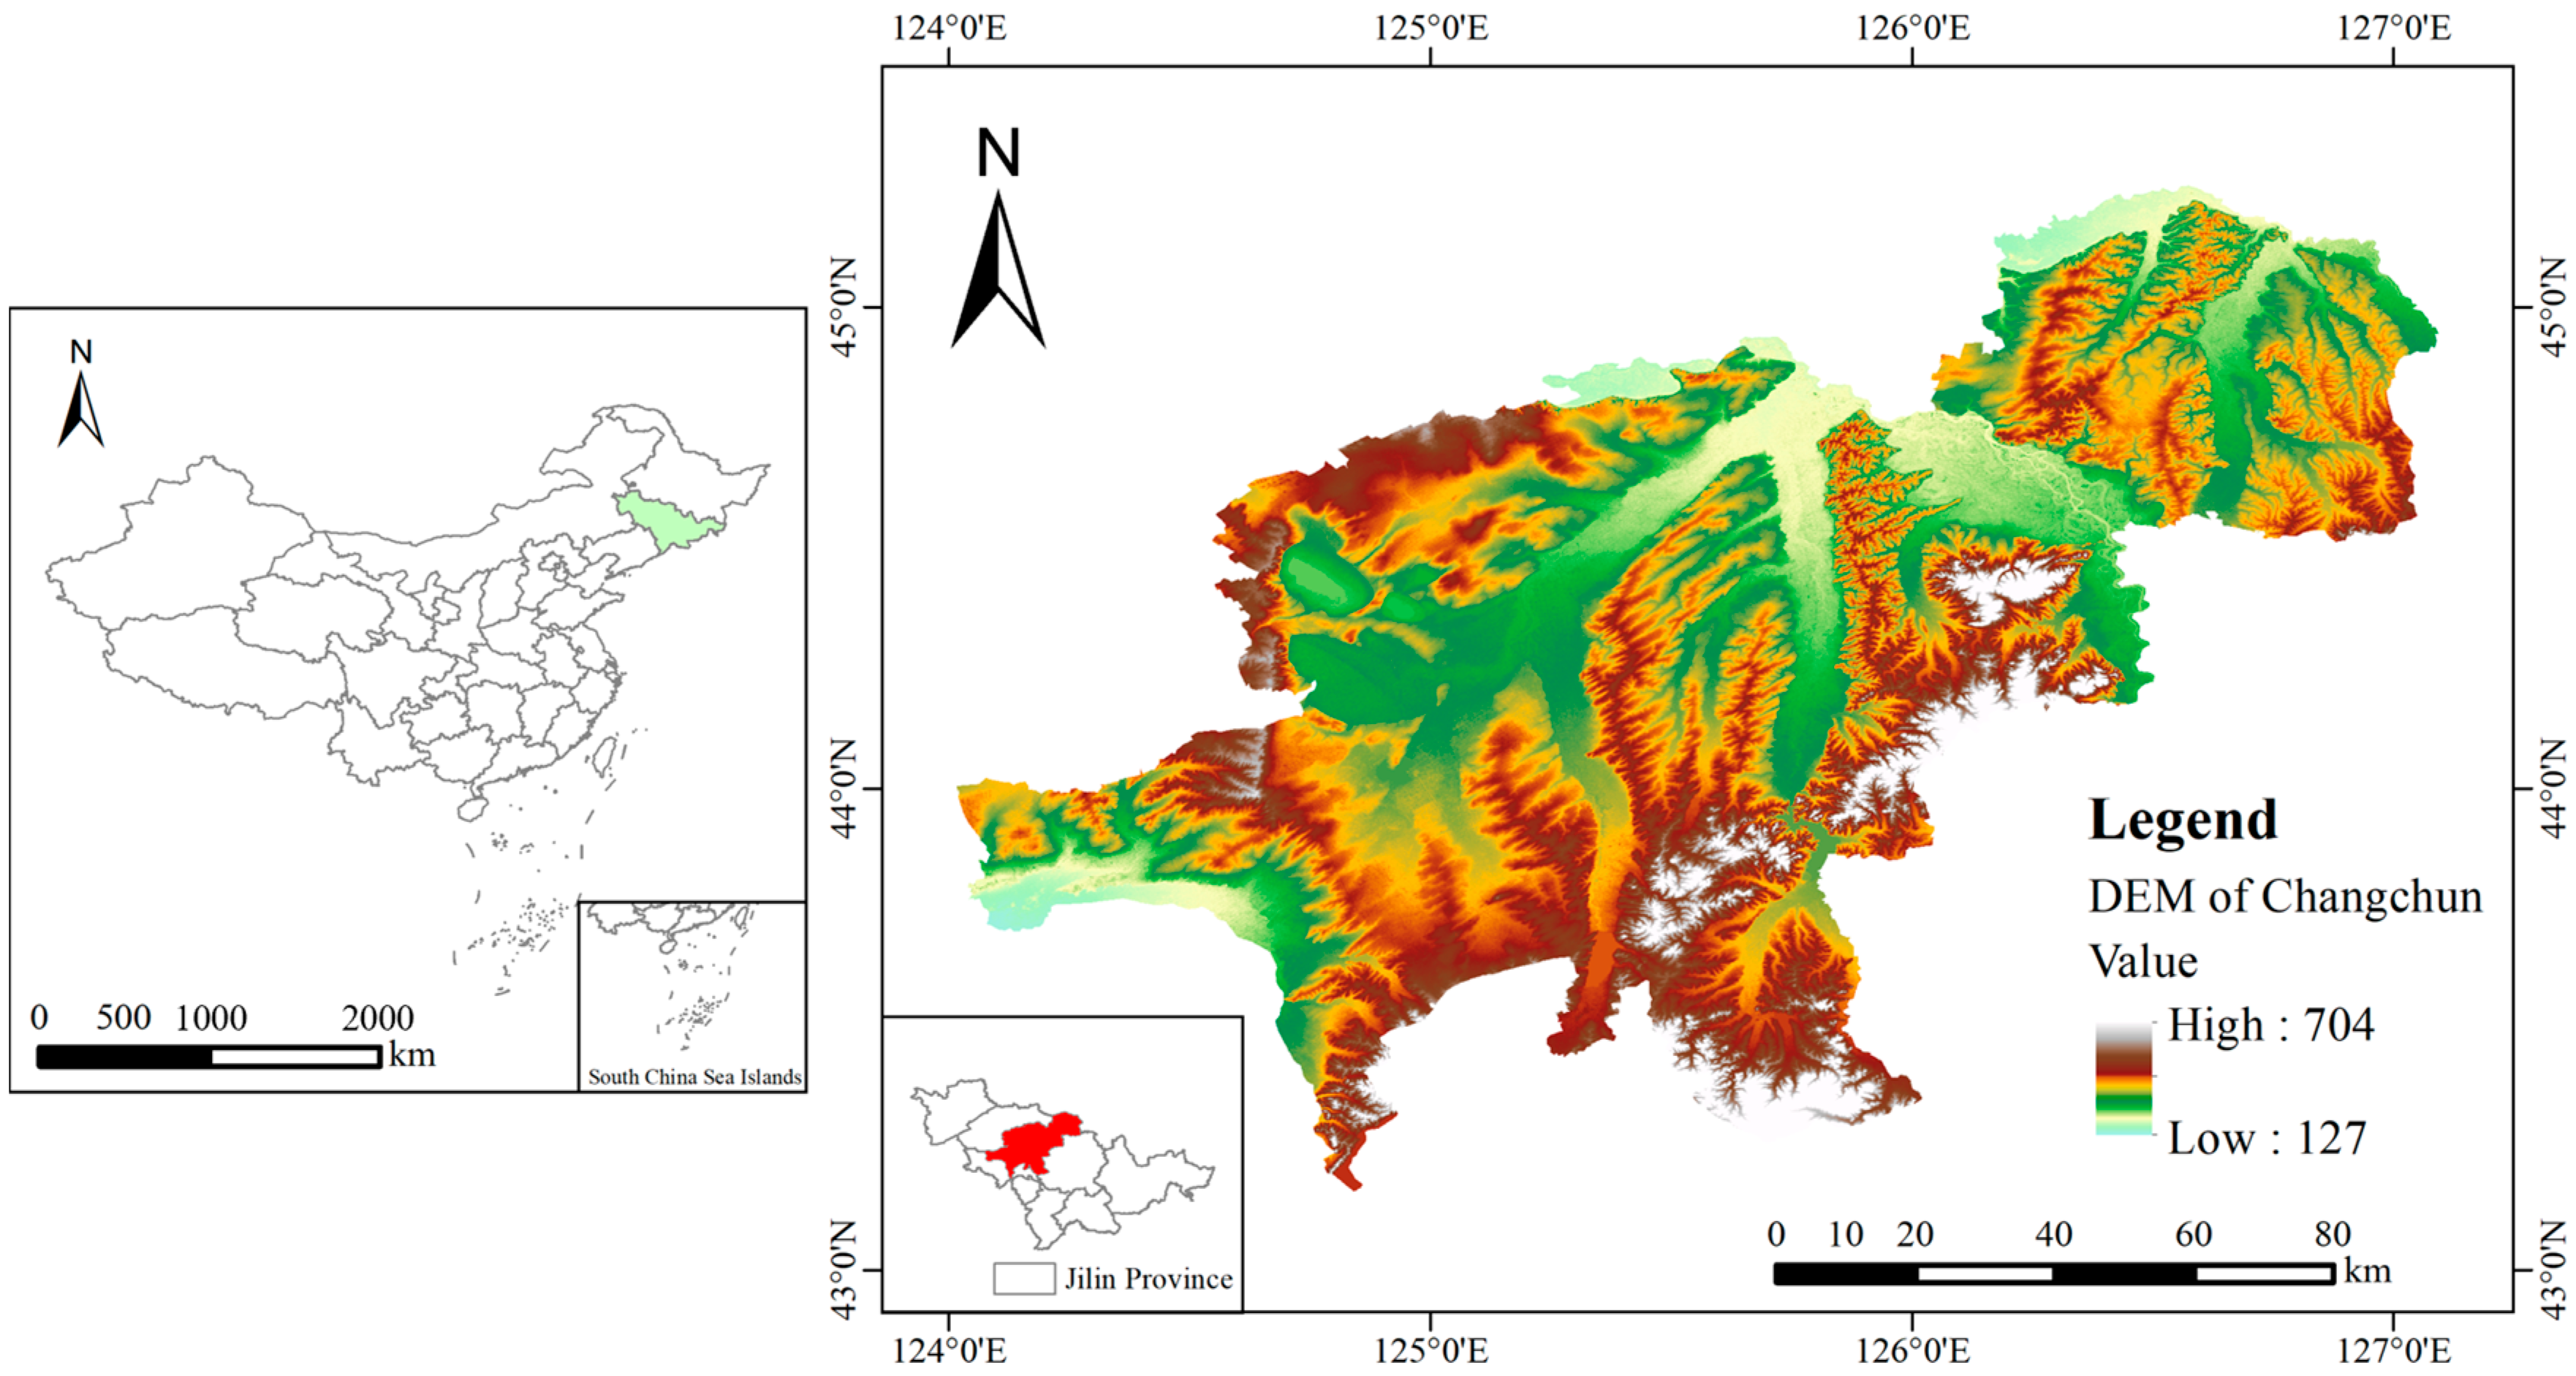
3.1.1. Study Area Overview

Changchun is situated at a latitude of 43°05′–45°15′ N and a longitude of 124°18′–127°05′ E (Figure 1). Changchun, the capital city of Jilin Province, is located adjacent to Songyuan City in the northwest, connected to Siping City in the southwest, and Jilin City in the southeast. Based on the 2021 Statistical Yearbook, the total population of Changchun is 8,534,000 and the city covers an area of 24,592 km2. Changchun administers 7 administrative districts and 4 counties (cities). As the capital city of the province, Changchun recorded an annual GDP of 663.803 billion yuan, indicating a year-on-year increase of 3.6%.

3.1.2. Data Resource

The data employed in this study encompass fundamental geographic data, digital elevation model (DEM) data, NPP/VIIRS night-light remote sensing image data, and point of interest (POI) data. The fundamental geographic data is obtained from the National Basic Geographic Information Center, while the digital elevation model (DEM) data is downloaded from the National Geographic Information Resource Catalog Service System. These data sources are utilized to generate the administrative planning map for China and the administrative planning map for Changchun City. The nighttime light data from NPP/VIIRS was acquired from the official website of the University of Colorado. Additionally, a total of five versions of the monthly cloud-free DNB data, spanning from January to May 2022, were obtained. The elimination of the possibility of stray light interference ensures the high quality of the obtained data, rendering it appropriate for further investigations. Data sources are reflected in Table 1.
The point of interest (POI) data were obtained in March 2022 through the application programming interface (API) of the Gaode Map. The Gaode Map categorizes POI into 23 different categories (https://lbs.amap.com/api/webservice/download, accessed on 15 Febrary 2023). The present investigation obtained the point of interest (POI) data in Changchun using a specified interface, and subsequently classified the obtained data into 14 major categories [37]; Table 2 presents a detailed breakdown of these categories. Following the data cleaning process, duplicated records and incomplete entries were removed. Additionally, categories such as tourist attractions, government agencies, and administrative landmarks that had limited relevance to this study were excluded. A total of 182,129 records were retained for analysis.

3.1.3. Data Preprocessing

Compared to DMSP/OLS data, NPP/VIIRS data exhibits a higher spatial resolution and provides abundant data with easy accessibility and high imaging quality [15]. Due to the presence of anomalous light sources in the NPP/VIIRS nighttime lighting data, which can potentially affect experimental results, it is imperative to mitigate the impact of background noise. Therefore, the removal of this interference is necessary prior to any analysis. The raster calculator was utilized to eliminate overly bright abnormal light sources and to decrease image data errors by setting areas with reflectance values less than 0 to 0. Following this step, the NPP/VIIRS nighttime lighting (NTL) data from January to May 2022 were processed and projected onto a Lambert equal-area projection coordinate system. The spatial resolution was resampled to 500 m. The NTL for a five-month period was masked based on the administrative boundaries of Changchun. Subsequently, the monthly data were superimposed to compute the average value using the raster calculator [37]. The calculation formula used is as follows:
N = 1 n i = 1 5 R i
where N is the nighttime light intensity value of the study area in March 2022 and R i is the nighttime light intensity value of the i th month. After processing, the corrected nighttime light data map for March 2022 was obtained (Figure 2).
The purpose of this paper is to analyze the structural characteristics of the inner city of Changchun by examining the coupling relationship between POI and NPP/VIIRS NTL data. The research methods employed in this study comprise built-up area extraction, kernel density analysis, variable normalization processing, data gridding, and a two-factor combination mapping approach.
In order to account for the spatial interdependence between POI and NTL, a pre-processing step was applied to the NPP/VIIRS NTL data. Subsequently, a statistical comparison method was employed to extract the built-up areas of the city. The excessive POI were subjected to a rigorous data cleaning process, followed by kernel density analysis, resampling to 500 m, and normalization. The two datasets were then linked in space and assigned to a grid using the fishing net tool in ArcGIS. The two-factor combination mapping method was employed to overlay the two data operations, resulting in a coupled output that was further utilized for visualization and analysis. Based on these results, the inherent spatial structural characteristics of Changchun City were analyzed and discussed. The research roadmap is illustrated in Figure 3.

3.2. Extraction of Built-Up Areas

Numerous studies have previously investigated the extraction of built-up areas from NPP/VIIRS NTL data, and four commonly used methods include the empirical threshold method, mutation detection method, statistical data comparison method, and higher resolution image data spatial comparison method [38]. The higher the light intensity (i.e., brightness value of remote sensing image elements) observed in nighttime light data, the greater the likelihood that the corresponding area is urban land. This implies that the extent of urban built-up areas can be delineated by setting a DN value threshold [39]. In this study, the statistical data comparison method was utilized to define the extent of urban built-up areas [40,41]. The extracted built-up area boundaries are depicted in Figure 4. The calculation formula used is as follows:
(i)
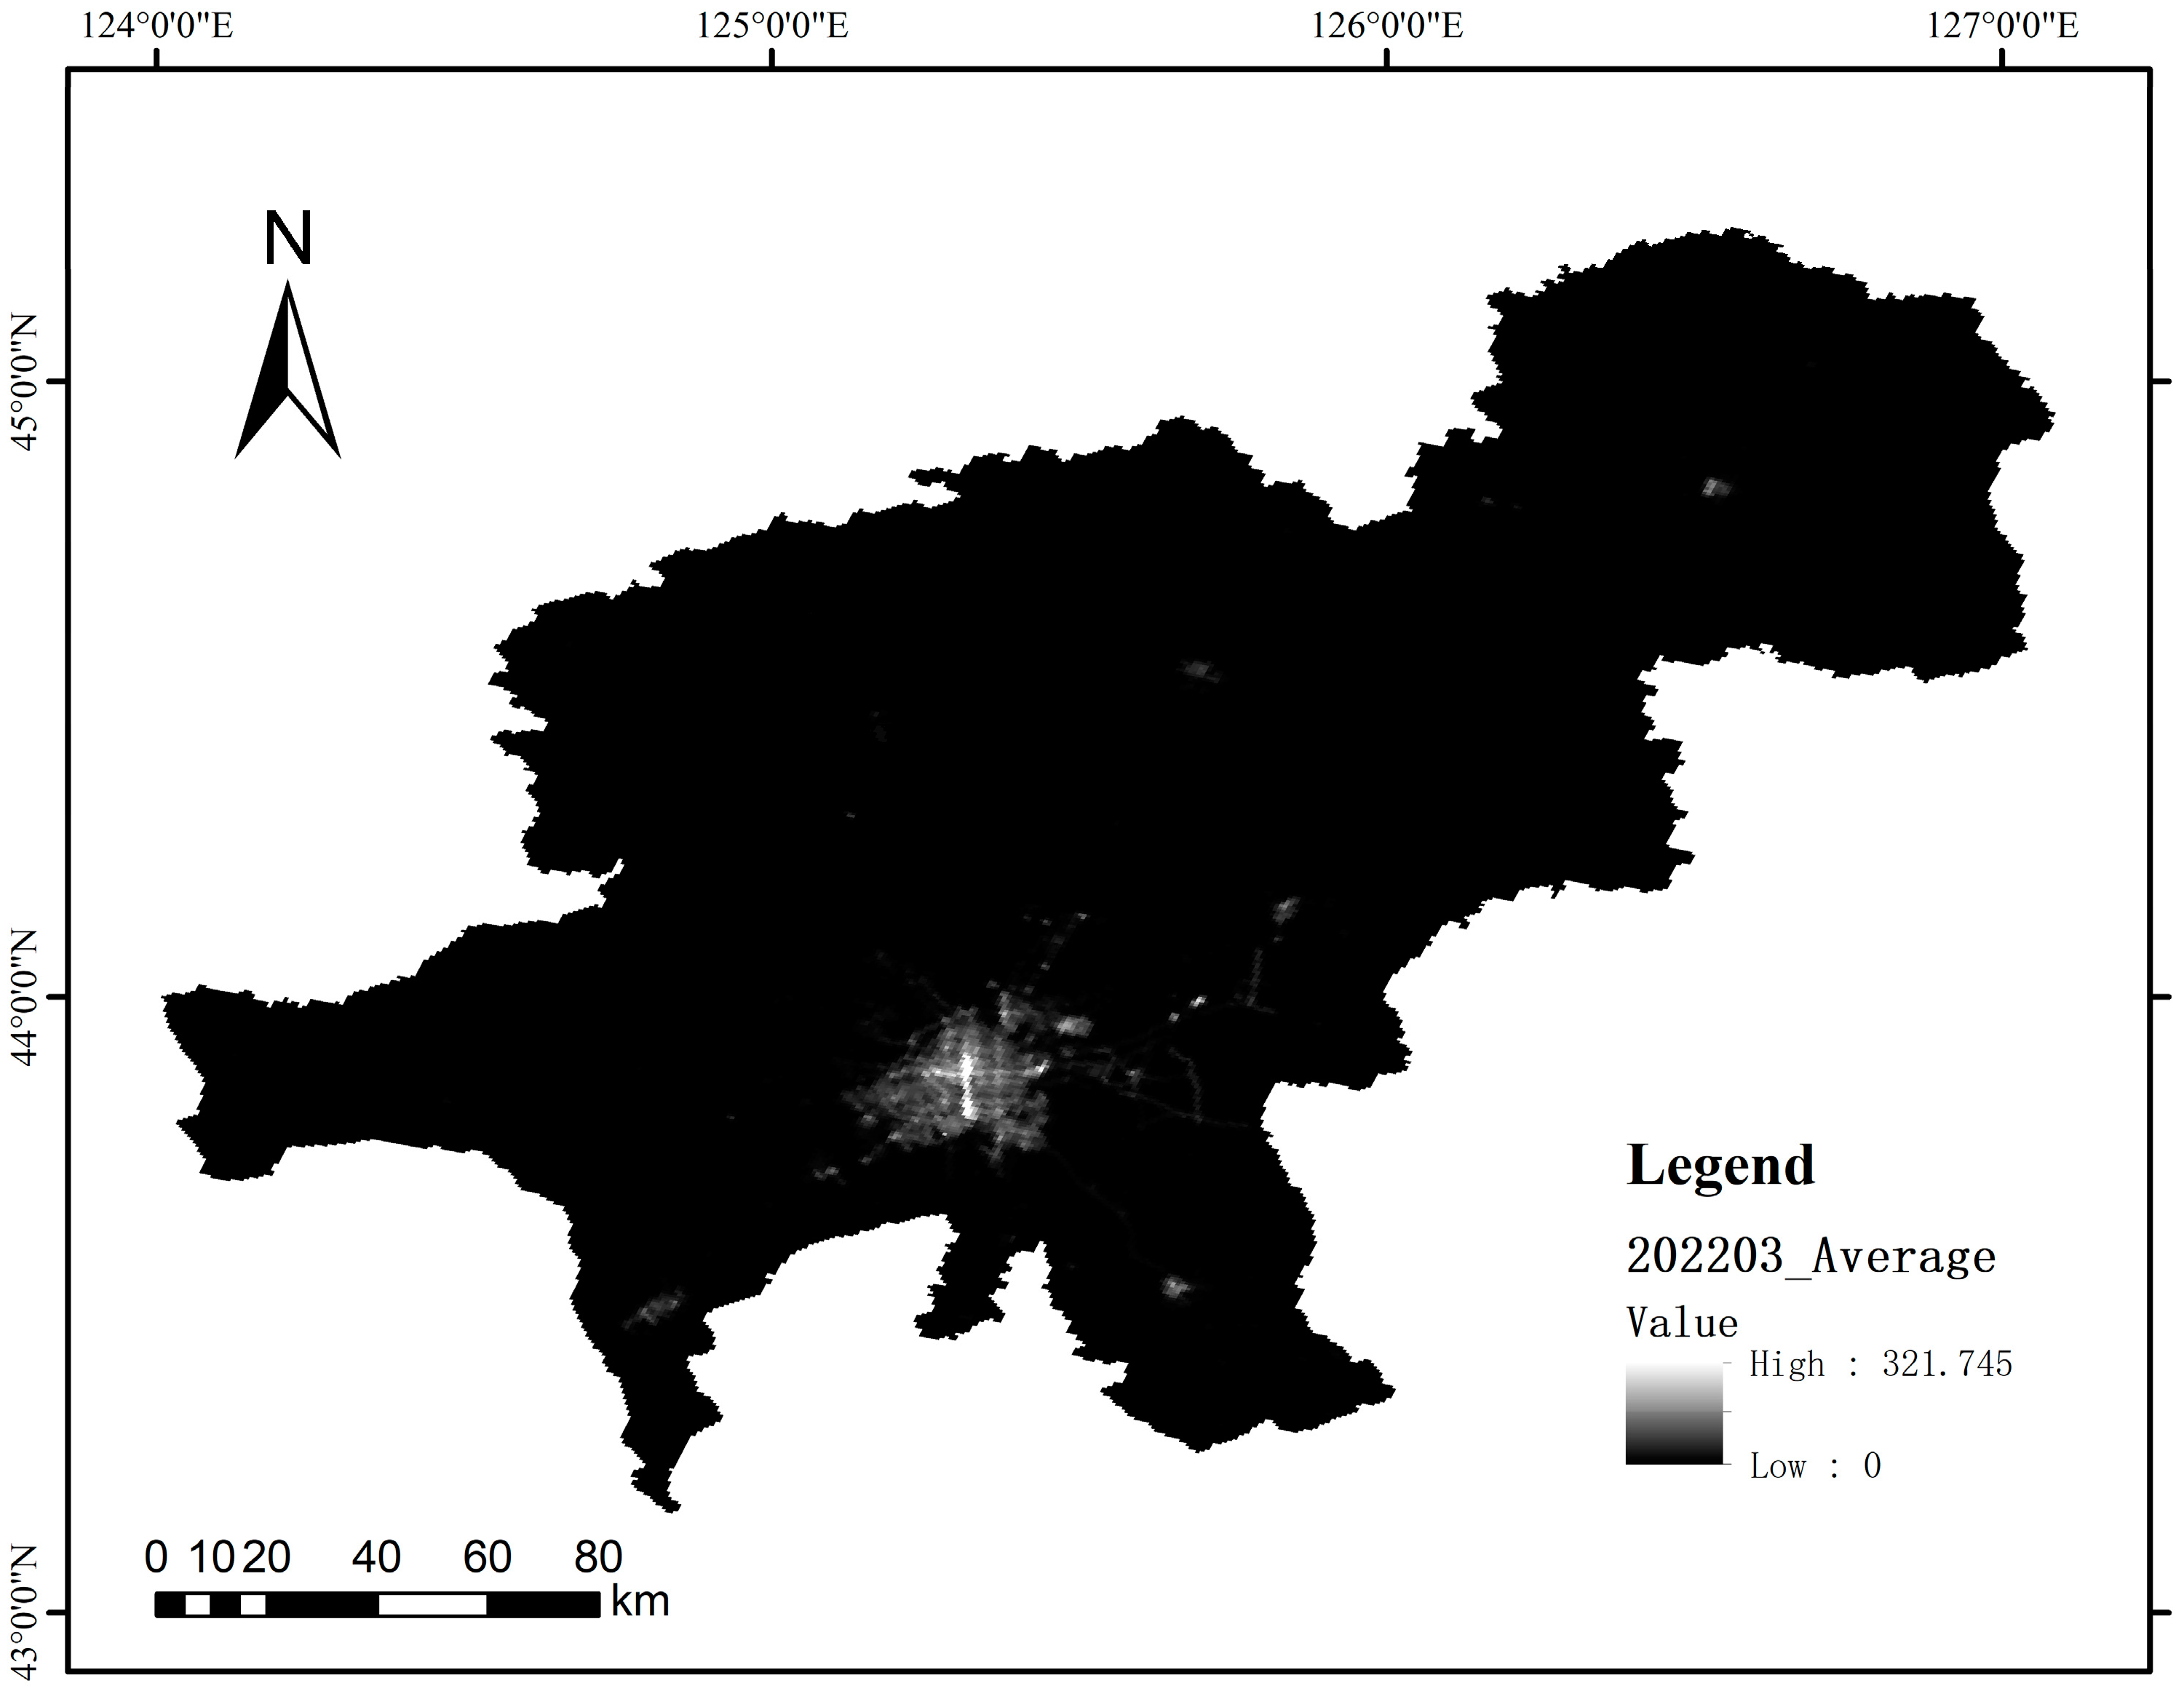
The data underwent pre-processing and nighttime lighting data for March 2022 were extracted using ArcGIS.
(ii)
The potential threshold value was set and the area of built-up area under this threshold value was calculated as follows: Let the maximum gray value be D N m a x and the minimum gray value be 0. D N m i n is the nighttime light data image of Changchun City in March. Let the area of the built-up area of Changchun based on statistics for the same period be U b . Then, the potential threshold D N T of the nighttime light data image of Changchun City is calculated as:
D N T = int D N m a x D N m i n / 2
The area of built-up area V I I R S a r e a extracted under the threshold D N T is,
V I I R S a r e a = D N i = D N T D N m a x f D N i
where D N i denotes a certain grayscale value between D N T and D N m a x and f D N i denotes the total area of the built-up area of Changchun City when the grayscale is D N i .
(iii)
The difference between the built-up area V I I R S a r e a under the potential threshold and the built-up area U b of Changchun based on the statistics were compared and the new threshold was reset until V I I R S a r e a and U b are sufficiently close. At this point, the difference E r r o r ( D N T ) between V I I R S a r e a and U b under D N T is,
E r r o r D N T = V I I R S a r e a U b
When E r r o r D N T > 0 , D N m i n = D N T . When E r r o r D N T < 0 , D N m a x = D N T .
Next, the new threshold value is determined based on the formula in step (i) and the comparison calculation is repeated following steps (ii) and (iii) until the criterion below is met. At this stage, the threshold value D N T represents the optimal threshold for extracting built-up areas in Changchun City, as it yields extracted built-up areas that closely align with the corresponding statistical data for the same period.
E r r o r D N T 1 E r r o r D N T E r r o r D N T + 1
where E r r o r D N T , E r r o r D N T 1 , E r r o r D N T + 1 denote the difference between V I I R S a r e a and U b obtained by calculating based on the equations in steps (ii) and (iii) under the condition of threshold D N T and its neighborhood (taking one unit step), respectively. In this paper, the optimal threshold D N T = 20 . The area of the built-up area extracted under this threshold is 602.75 k m 2 .

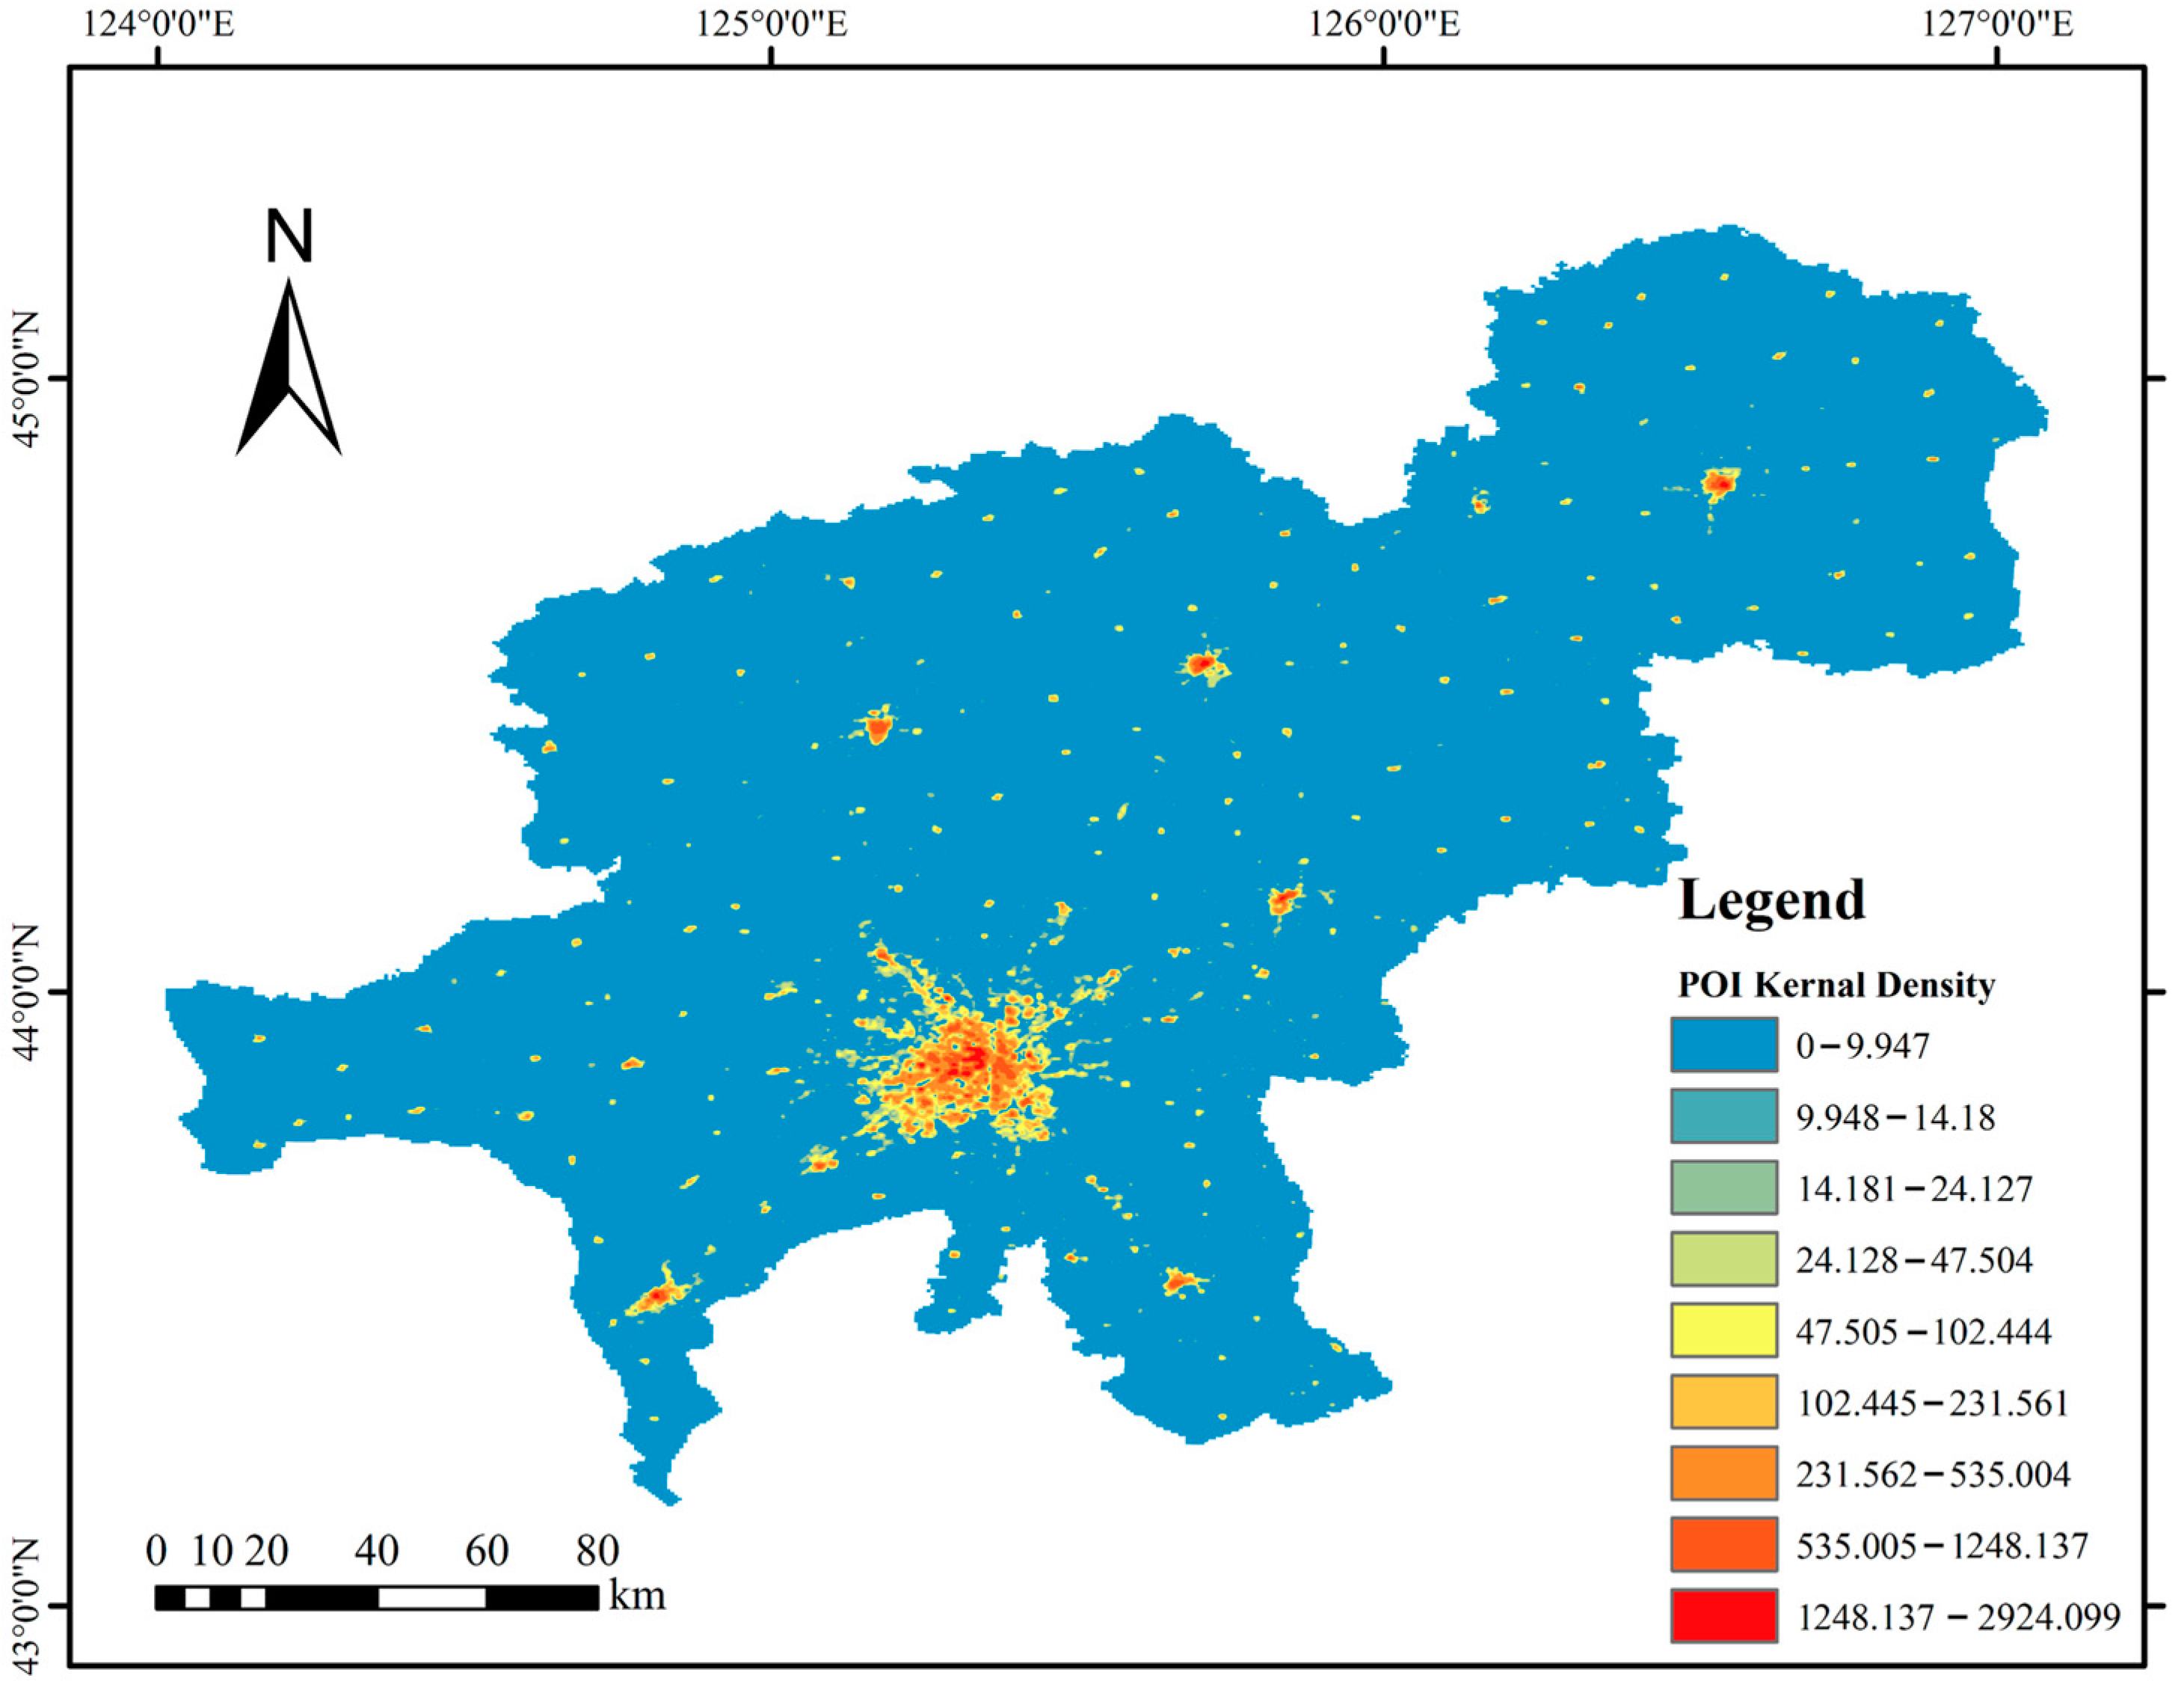
3.3. Kernel Density Analysis

Kernel density analysis was employed to compute the element density in its local vicinity. This tool is capable of computing both point and line element densities [41]. As the POI consists of spatially distributed points, the kernel density analysis method for points was employed in this study. The spatial density of geographic information refers to the process of computing high-quality density estimates using vector data containing point element datasets, which provides insights into the clustering patterns of point elements in each region. Kernel density analysis of points is a geospatial clustering analysis method that has been widely applied in studying the urban spatial structure, and its calculation process is independent of raster size and location. The kernel density values are depicted in Figure 5. The calculation formula used is as follows:
f S = i = 1 n h 2 k s c i h
where f S is the kernel density calculation function at location s in space, h is the distance decay threshold between two points, also called the bandwidth, k denotes the weight function in space, and s c i denotes the distance from location s to another location c i . The geometric meaning of this formula is that the density value is maximum at each core element c i and decreases as it moves away from c i until the distance from c i reaches a threshold value h when the kernel density value drops to 0. The larger h reflects the change in POI data at larger spatial scales. However, it only reflects the smaller spatial scale variation.
In this paper, considering the distribution characteristics of POI data in the study area and the spatial resolution of NPP/VIIRS data, the bandwidth of POI kernel density is set to 500 m, the spatial raster image element size is set to 200 m, and the final results of kernel density analysis of Changchun are obtained.

3.4. Variable Normalization

Normalizing variables is a method for simplifying computations by converting a dimensional expression to a dimensionless expression, resulting in a scalar quantity. Normalization refers to the procedure of scaling data with distinct ranges to a comparable range, facilitating data comparison. This study employs minimum-maximum normalization, also known as deviation normalization, to linearly transform raw data into a range of [0, 1] [30]. The calculation formula used is as follows:
x * = x x m i n x m a x x m i n
where x * denotes the result of the normalization of remote sensing data or POI kernel density, x is the value of the remote sensing data or POI kernel density data to be normalized, and x m a x and x m i n denote the maximum and minimum values of remote sensing data or POI kernel density data.

3.5. Data Gridding

Data gridding involves the partitioning and storage of irregularly distributed point data by transforming them into gridded data through spatial topological relationships inspired by grid maps of varying scales. The spatial topological relationships between points and surfaces comprise three types: adjacency, association, and inclusion relationships, enabling the determination of the spatial orientation of one entity relative to another without the need for coordinates or distances. Topological relationships can accurately depict the logical structural connections between entities and are more stable than geometric data, as they remain invariant across different map projections. Data gridding enables the association of data attribute values with different types and resolutions into a consolidated gridded format, which reduces the redundancy of spatial data, enhances analytical efficiency, facilitates visualization, and enables comparison analysis of different types of raster data. Moreover, data gridding facilitates the clear portrayal of the spatial interdependence among multiple data.
The grid utilized for data meshing encompasses diverse shapes, including squares, triangles, square hexagons, and more. Given that the data utilized in this study has been resampled to a resolution of 500 m, we have employed a square grid for data meshing. In particular, the grid size has been set to 500 m × 500 m.
In this paper, 100,624 square grids with an area of 0.25 k m 2 were established within the administrative district of Changchun. The extracted results for built-up areas and nuclear density analysis, derived from nighttime lighting data, have been separately gridded as per standard protocols. Eventually, these two sets of standard gridded data have been linked to a common regular grid for conducting spatial coupling analysis.

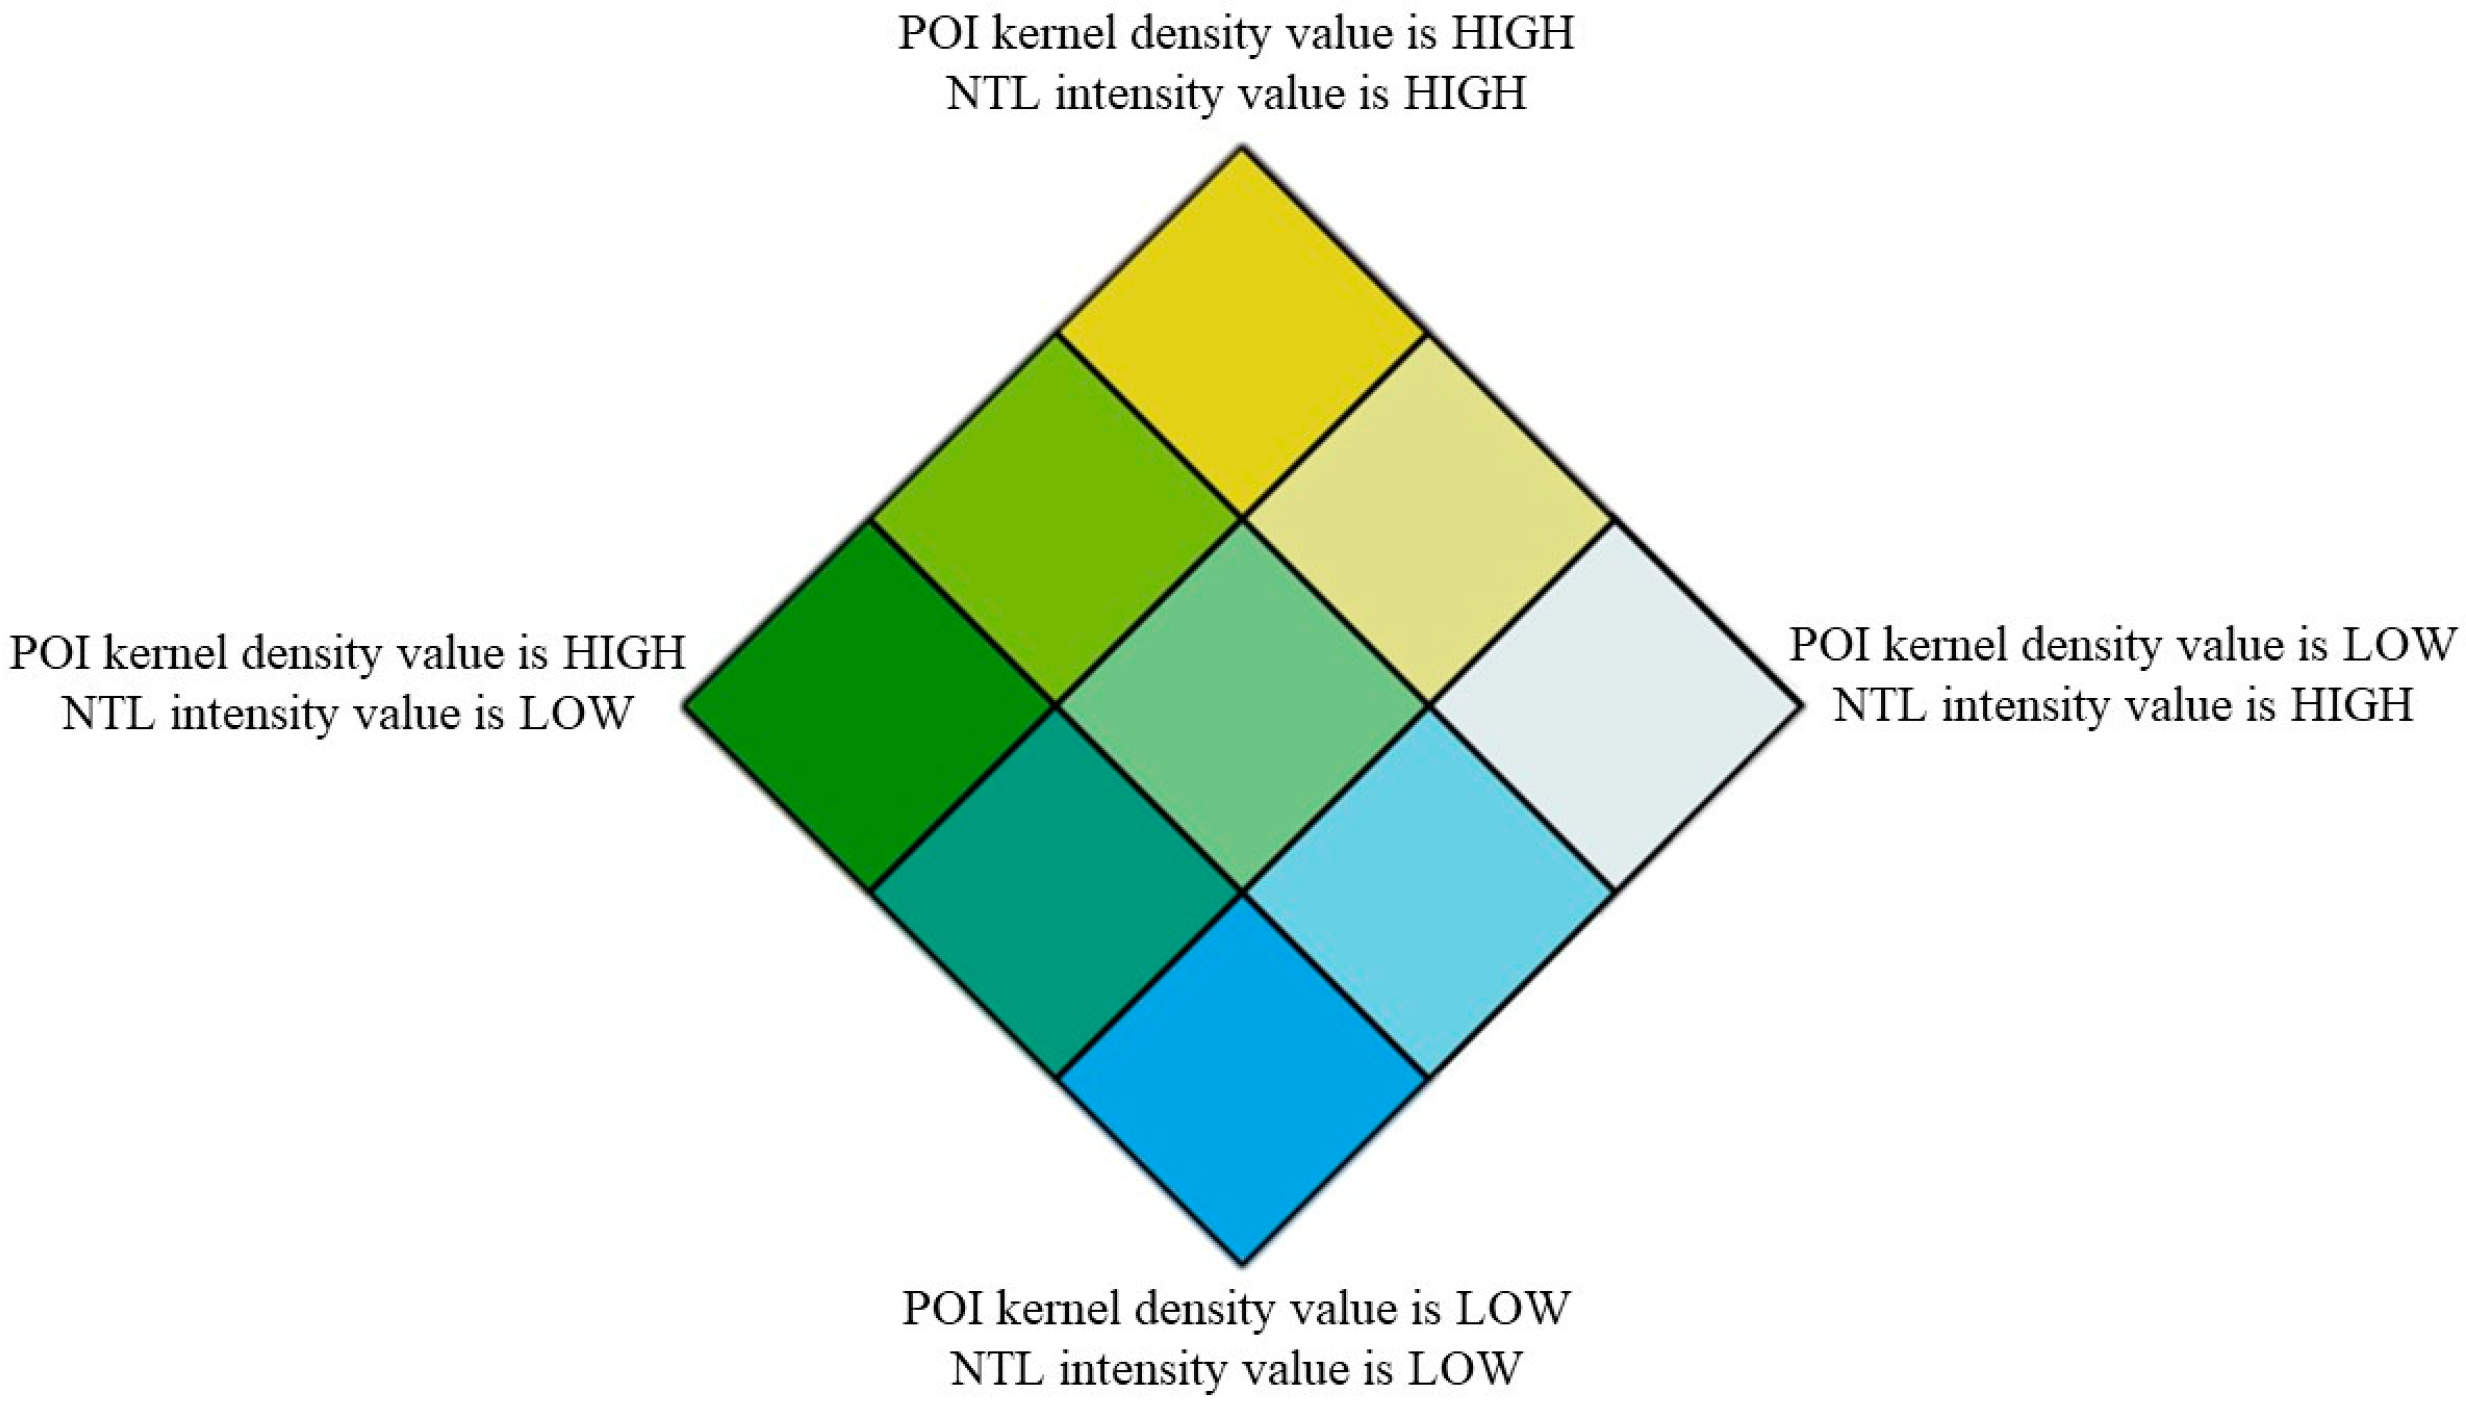
3.6. Two-Factor Combination Mapping

The two-factor combination mapping is a visualization technique that employs combinations of distinctive colors to illustrate the spatially linked relationships between various influencing factors. For two different influential factors, four combinations are created by merging them based on their respective magnitudes, and further transitions are established between these combinations to obtain multiple combinations. The two-factor combination mapping is grounded on the coupling coordination model [42]. The legend of two-factor combination mapping is showed as Figure 6. The calculation formula used is as follows:
C = U 1 U 2 U 1 + U 2 2 2 = 2 U 1 U 2 U 1 + U 2
T = i = 1 n α i × U i , i = 1 n α i = 1
D = C × T
where C is the coupling degree, which is the core part of the coupling coordination model. The result of the coupling degree should be between [0, 1] to indicate the strength of the coupling relationship between the systems. U 1 , U 2 are the pixel values of NTL data and POI data, T is the overall evaluation index, and α i is the weight of the two data. In this study, both data are equally important, so α 1 and α 2 are taken to be 0.5. D is the coupling coordination degree for ArcGIS mapping.
This paper spatially visualizes the built-up area and POI kernel density data extracted from NTL data by employing the two-factor combination mapping method, where unique colors are utilized to illustrate the coupling disparities between the two factors. In this study, the two types of data are classified into high, medium, and low levels based on their values. In this study, a 3 × 3 grading method is employed to combine the different levels of the two factors, resulting in nine distinct combinations that are represented by different colors. The spatial coupling between the built-up areas and POI kernel density results is explored based on their spatial distribution patterns, and the spatial structure distribution characteristics of Changchun are analyzed in this paper.

4. Results and Analysis

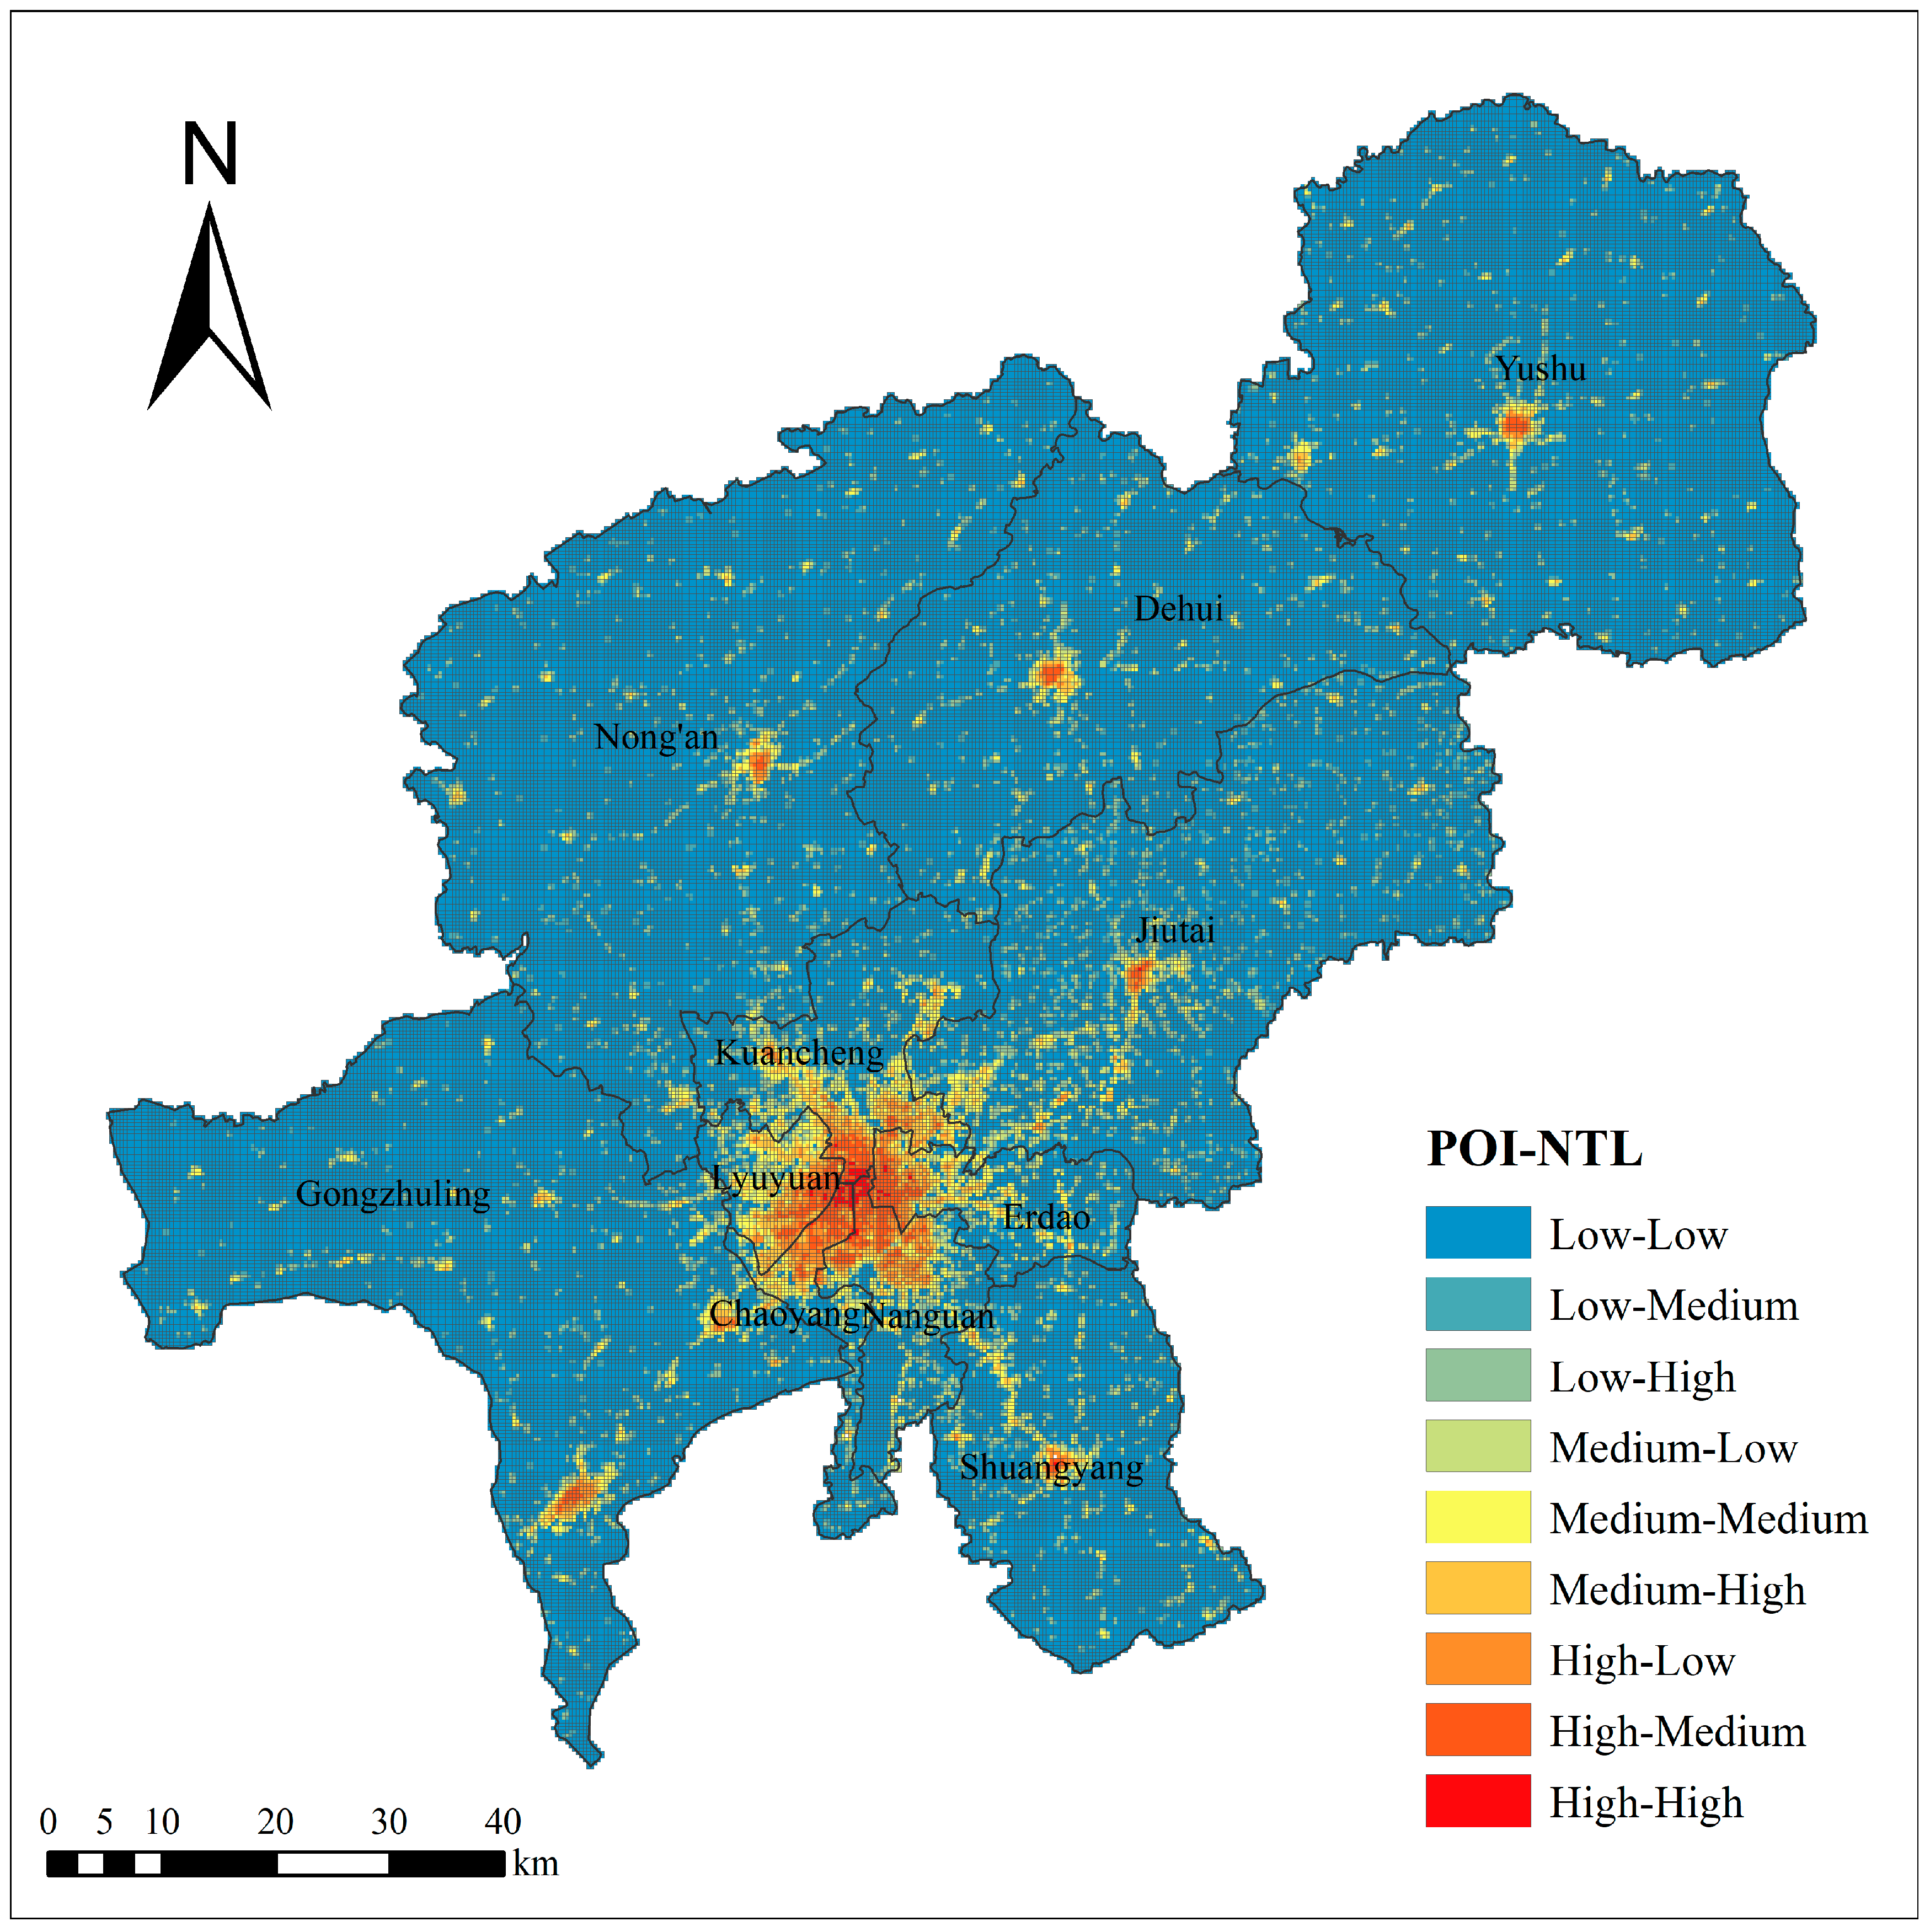
4.1. Overall Distribution

The urban areas were extracted from the kernel density values of POI and NTL of Changchun City in March 2022 and subsequently normalized and classified into low, medium, and high levels using the natural intermittent classification method. The spatial coupling relationship between the two datasets was visualized using the two-factor combination mapping method, creating a comprehensive map of urban areas in Changchun for March 2022. The spatial coupling relationship between POI and NTL in Changchun is illustrated in Figure 7. In 2014, Changchun expanded its administrative division by incorporating the districts of Nong’an, Dehui, Yushu, Jiutai, and Shuangyang. In 2020, Changchun absorbed Gongzhuling into its administrative jurisdiction, resulting in a total of eleven districts under Changchun. The spatial distribution of administrative divisions is consistent with the rules of administrative division changes. As the capital city of Changchun, the original five districts exhibit a central-gathering ring-diffusion pattern, while the six newly incorporated districts have a similar spatial structure to Changchun.

4.2. Comparison of Spatial Coupling Relationships

4.2.1. POI and NTL Coupling Relationship Is the Same

Regions exhibiting similar coupling relationships reflect the presence of comparable spatial structure characteristics within the city, which holds significant implications for elucidating the distribution of urban spatial structures. Figure 8 and Table 3 demonstrate that the region displaying equivalent coupling relationships between POI and NTL (High–High, Medium–Medium, Low–Low) encompasses a total of 85,106 pixels, constituting 84.58% of the total number of pixels. This result indicates a strong coupling between POI and NTL within Changchun, with a high degree of consistency in their spatial distribution. The regions exhibiting equivalent coupling relationships demonstrate a trend of outward spread from the city center, with a gradual decrease in intensity. Notably, the areas with High–High coupling are primarily concentrated in the central areas of the city, particularly in Chaoyang District and Nanguan District. Table 4 corroborates these findings, highlighting Chaoyang and Nanguan Districts as the two most prosperous areas within Changchun, owing to their early development, outstanding educational and commercial resources, and robust economic growth. Medium–Medium coupling areas are distributed in a ring-like structure surrounding the High–High coupling areas within each administrative district, with a concentration in Lyuyuan, Kuancheng, and Erdao Districts. The development level of these districts is relatively lower than that of the High–High coupling areas, indicating a circular spread from the city center towards the periphery, with a gradual decrease in development level. The Low–Low coupling areas are mainly distributed along the outer edges of each administrative district.

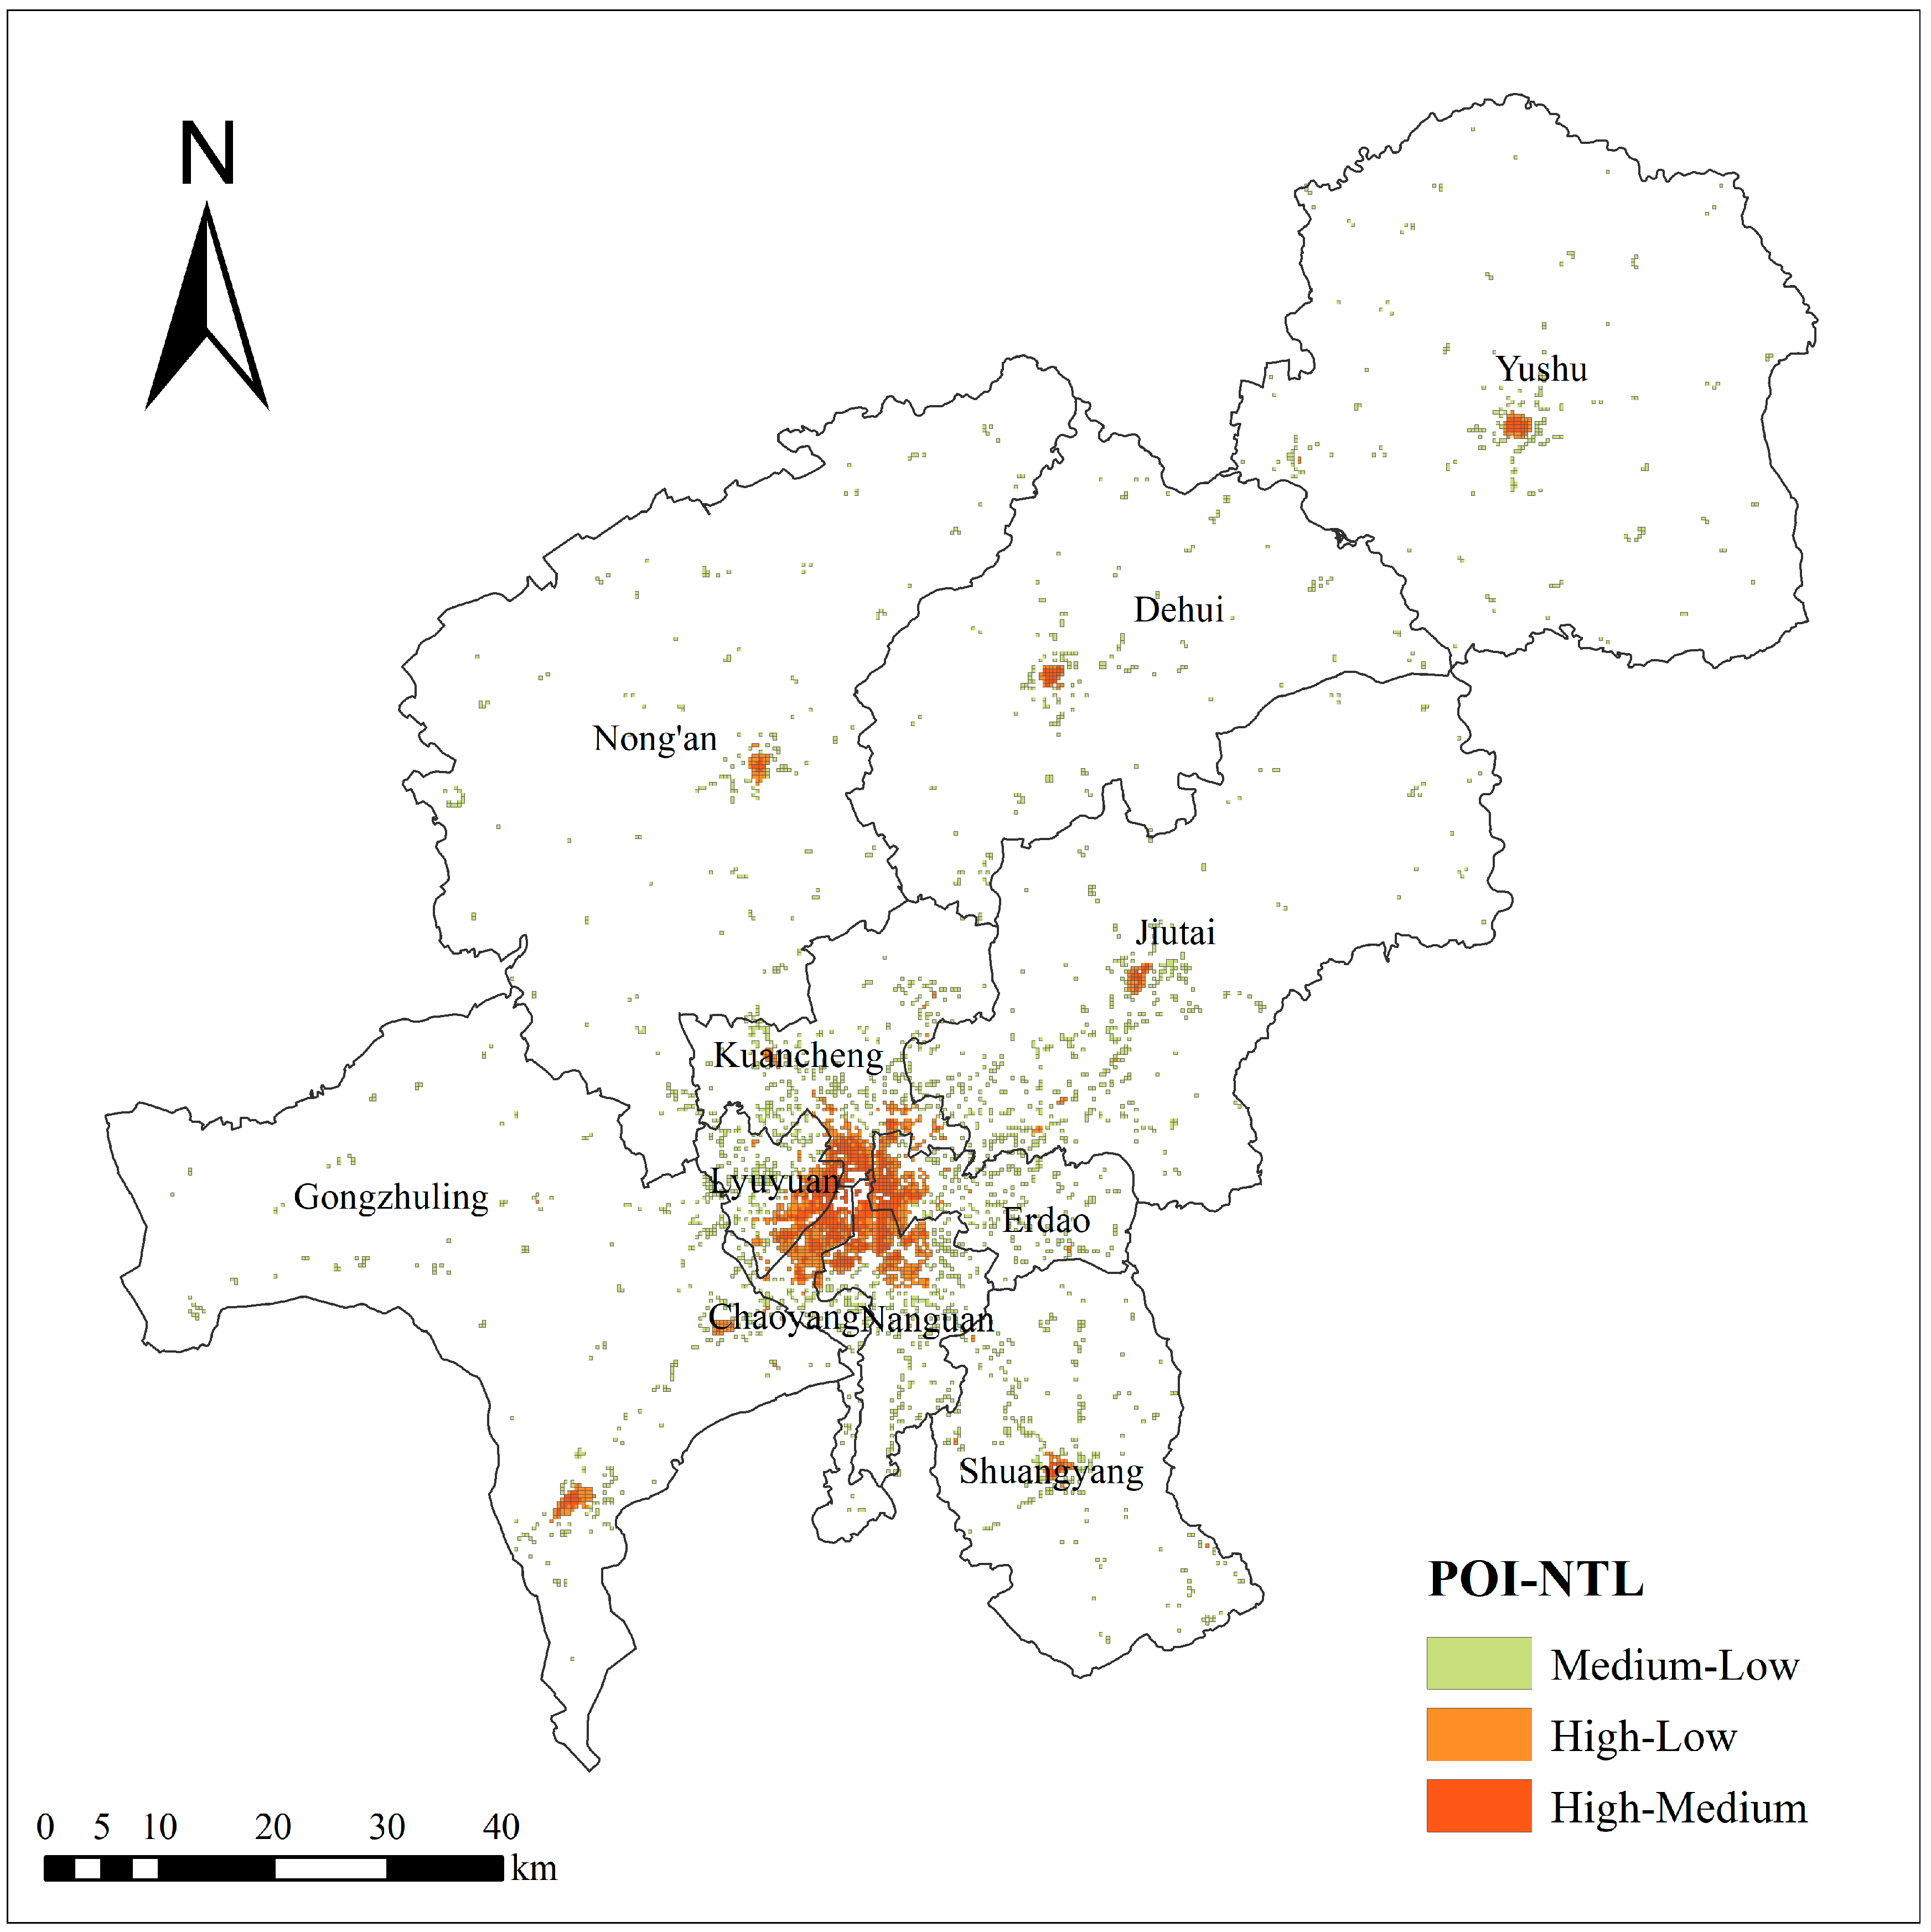
4.2.2. POI Is Higher Than NTL

Figure 9 reveals that the Medium–Low coupling relationship is predominantly sporadically distributed within each administrative district, with the highest density areas located in Chaoyang District, Kuancheng District, Nanguan District, and Erdao District. The regions with High–Low and High–Medium coupling relationships are mainly concentrated in the built-up areas of each administrative district. The main regions with a Medium–Low coupling relationship are distributed in the central south area of Changchun City, while the regions with High–Low and High–Medium coupling relationships are distributed in a belt or ring shape that spreads outward.
The observation that the POI kernel density values are higher than the NTL built-up area in certain regions suggests a lower level of urbanization in these areas when compared to the High–High coupling relationship areas. However, these areas exhibit a higher concentration of commercial, industrial, service, and entertainment industries. Each administrative district has its own urban center, and a high POI kernel density value indicates that the areas near the urban center are well-equipped with infrastructure, densely populated, and highly trafficked, with relatively developed industrial and commercial activities. Nighttime light data, being raster data, has a limitation in that it does not increase in brightness beyond a certain threshold, and it cannot accurately represent the characteristics of the areas near the city center after reaching spatial saturation. In contrast, POI, being point data, can better demonstrate the intensity of human activities in the region and more accurately describe the spatial distribution characteristics of the region. By combining POI and NTL data, the spatial structure of surrounding administrative areas can be described in greater detail.

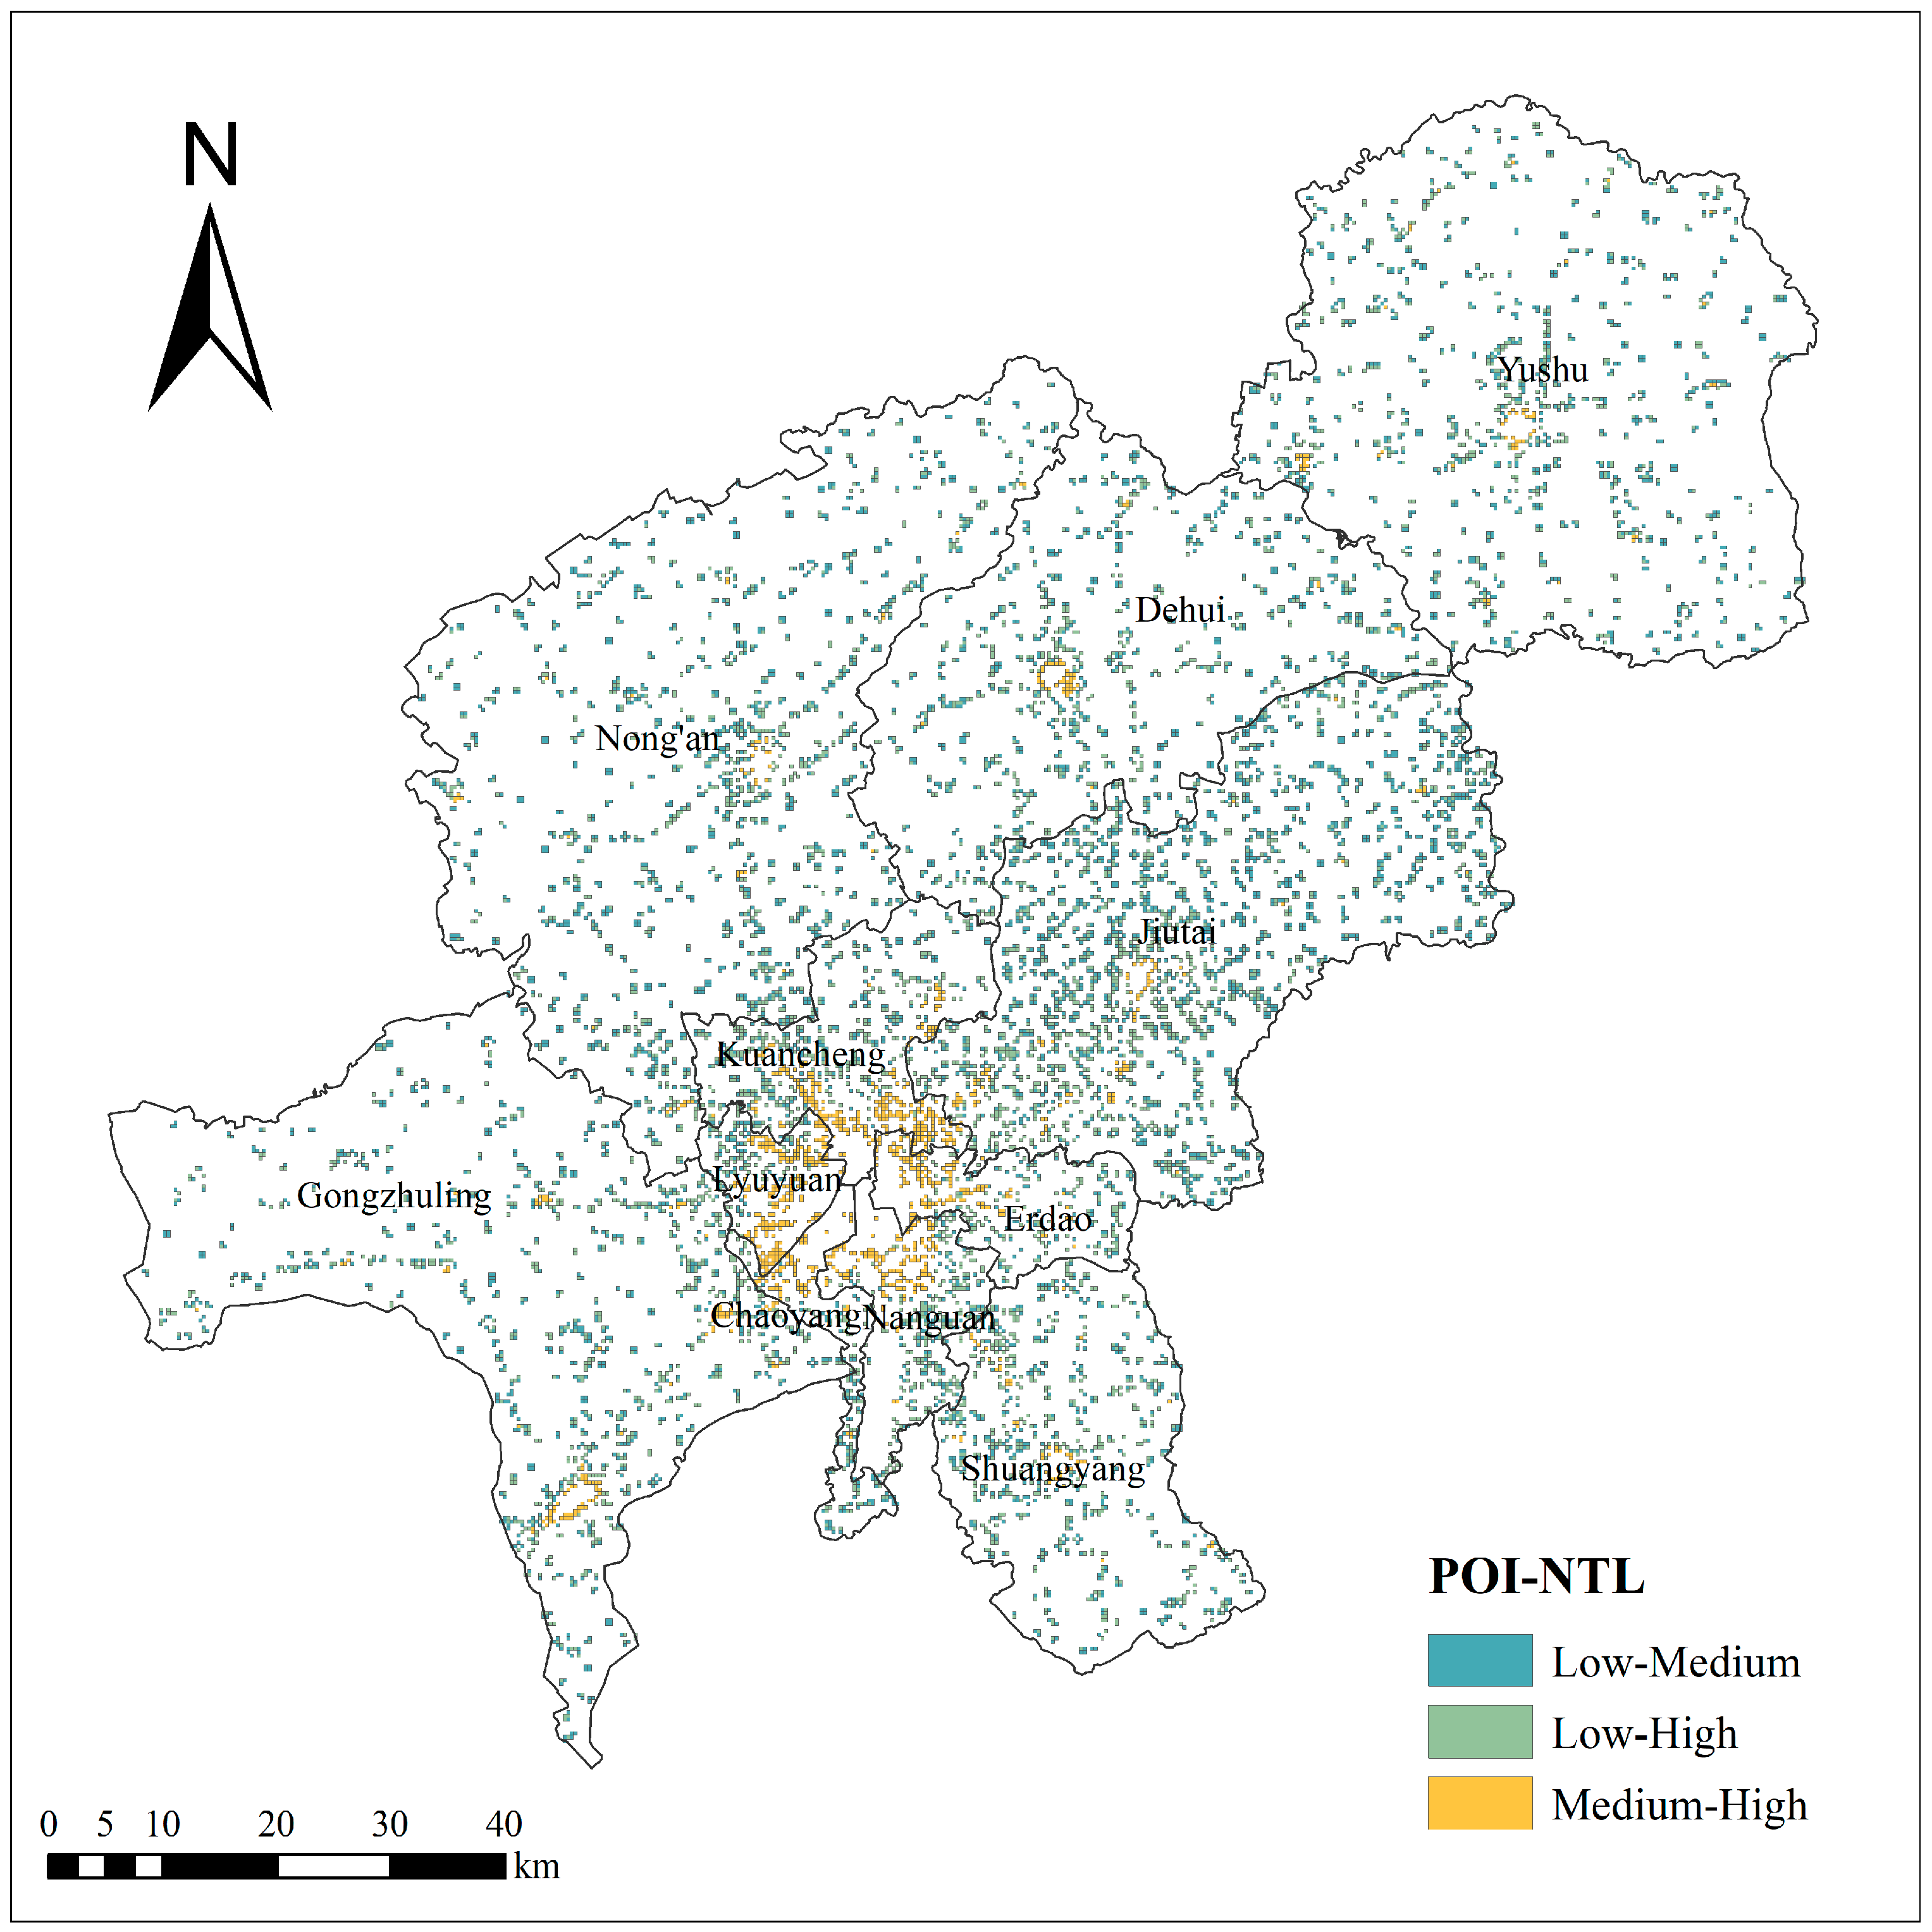
4.2.3. POI Is Lower Than NTL

As shown in Figure 10, the largest proportion is represented by the Low–Medium coupling relationship, which accounts for 5476 image elements. Based on Figure 10, the largest proportion is the Low–Medium coupling relationship, with 5476 image elements. The Low–High coupling relationship has 4821 image elements, while the Medium–High coupling relationship has the lowest proportion, with only 1218 image elements. In Nong’an, Dehui, Yushu, Jiutai, Gongzhuling, and Shuangyang, the Medium–High coupling area forms a relatively concentrated ring, while the Low–Medium coupling and Low–High coupling areas spread outward and are relatively evenly distributed in each administrative region. Kuancheng, Nanguan, Erdao, Lyuyuan, and Chaoyang can be approximated as a whole, with Medium–High coupling forming the central ring of the whole area. Low–Medium coupling and Low–High coupling are distributed around the ring, and the proportion of Medium–High coupling is equal to that of each administrative region. The Low–Medium coupling and Low–High coupling have close distribution patterns in Figure 10, indicating that although NTL describes the distribution patterns more accurately, NTL has a certain light spillover effect on a large scale, and the intensity of human activities detected by nighttime light data is often greater than the actual situation. The close distribution pattern also indicates that the POI data cannot describe the human activity intensity in the area very accurately, resulting in a better performance of NTL and a lower density of POI.

5. Conclusions

In this paper, the nighttime light data and POI data for Changchun City in March 2022 are selected and the two datasets are coupled based on kernel density analysis and data gridding methods. The following conclusions are drawn from the spatial perspective of the urban spatial structure of Changchun based on similar or dissimilar coupling results.
(1)
Spatial analysis in this study reveals significant spatial coupling between POI and NTL in Changchun in March 2022. Specifically, 84.58% of areas exhibit consistent coupling relationships (High–High, Medium–Medium, Low–Low), indicating a high spatial similarity between the datasets. The distribution, observed as a circular pattern around administrative district built-up areas, suggests a strong link between urban development and human activity patterns. Overall, these findings underscore the high complementarity of POI and NTL in analyzing urban spatial structure distribution.
(2)
Further analysis demonstrates that areas with diverse coupling relationships between POI and NTL offer a detailed characterization of urban structure spatial distribution. Clear identification of multiple central gathering areas is possible, with NTL indicating activity intensity but lacking specificity in function. Conversely, POI, concentrated in administrative district centers, better reflects commerce, industry, services, and entertainment. Thus, POI exhibits distinct spatial coupling characteristics compared to NTL.
(3)
After two zoning adjustments, Changchun’s spatial structure displays a polycentric nature. As the capital of Jilin Province, the main city encompasses most highly coupled areas, with each surrounding administrative district hosting a highly coupled urban center. However, peripheral areas, compared to the original administrative area, exhibit lower development levels, signaling a need for further development and planning.
(4)
Integrating POI and nighttime light data for built-up area extraction facilitates effective mapping of urban spatial structure and reveals development trends. Changchun’s development pattern, as a provincial capital, offers insights applicable to land planning in other Northeastern provincial capitals, highlighting the study’s generalizability.
This paper qualitatively analyzes the coupling relationship between nighttime lighting data and POI in Changchun. Future studies could benefit from incorporating diverse data sources such as Landsat, microblog check-ins, and population data for a more comprehensive depiction of urban structure spatial distribution. Quantitative analysis of the coupling relationship among these data sources remains a crucial avenue for further research and exploration.

Author Contributions

Conceptualization, W.G.; Methodology, Z.W.; Software, Z.W. and X.H.; Formal analysis, X.W.; Resources, Z.W.; Writing—original draft, Z.W.; Supervision, X.W. and W.G. All authors have read and agreed to the published version of the manuscript.

Funding

This research received no external funding.

Data Availability Statement

Data are contained within the article.

Conflicts of Interest

The authors declare no conflict of interest.

References

  1. Qu, Y.; Zhan, L.; Jiang, G.; Ma, W.; Dong, X. How to Address Population Decline and Land Expansion (PDLE) of rural residential areas in the process of Urbanization: A comparative regional analysis of human-land interaction in Shandong Province. Habitat Int. 2021, 117, 102441. [Google Scholar] [CrossRef]
  2. Yin, C.; Meng, F.; Yang, X.; Yang, F.; Fu, P.; Yao, G.; Chen, R. Spatio-temporal evolution of urban built-up areas and analysis of driving factors—A comparison of typical cities in north and south China. Land Use Policy 2022, 117, 106114. [Google Scholar] [CrossRef]
  3. Hugo, G.; Champion, T. New Forms of Urbanization: Beyond the Urban-Rural Dichotomy; Taylor & Francis: Abingdon, UK, 2003. [Google Scholar]
  4. Zhou, Y.; Tu, M.; Wang, S.; Liu, W. A Novel Approach for Identifying Urban Built-Up Area Boundaries Using High-Resolution Remote-Sensing Data Based on the Scale Effect. Int. J. Geo-Inf. 2018, 7, 135. [Google Scholar] [CrossRef]
  5. Meng, Q.; Zhang, L.; Sun, Z.; Meng, F.; Wang, L.; Sun, Y. Characterizing spatial and temporal trends of surface urban heat island effect in an urban main built-up area: A 12-year case study in Beijing, China. Remote Sens. Environ. 2017, 204, 826–837. [Google Scholar] [CrossRef]
  6. Hou, Q. Spatio-temporal relationships between urban growth and economic development: A case study of the Pearl River Delta of China. Asian Geogr. 2012, 29, 57–69. [Google Scholar] [CrossRef]
  7. Wang, H.; Gong, X.; Wang, B.; Deng, C.; Cao, Q. Urban development analysis using built-up area maps based on multiple high-resolution satellite data. Int. J. Appl. Earth Obs. Geoinf. 2021, 103, 102500. [Google Scholar] [CrossRef]
  8. Zheng, Y.; Tang, L.; Wang, H. An improved approach for monitoring urban built-up areas by combining NPP-VIIRS nighttime light, NDVI, NDWI, and NDBI. J. Clean. Prod. 2021, 328, 129488. [Google Scholar] [CrossRef]
  9. Xie, Y.; Weng, Q. Updating urban extents with nighttime light imagery by using an object-based thresholding method. Remote Sens. Environ. 2016, 187, 1–13. [Google Scholar] [CrossRef]
  10. Ou, J.; Liu, X.; Li, X.; Li, M.; Li, W. Evaluation of NPP-VIIRS Nighttime Light Data for Mapping Global Fossil Fuel Combustion CO2 Emissions: A Comparison with DMSP-OLS Nighttime Light Data. PLoS ONE 2015, 10, e0138310. [Google Scholar] [CrossRef]
  11. Arfanuzzaman, M. Harnessing artificial intelligence and big data for SDGs and prosperous urban future in South Asia. Environ. Sustain. Indic. 2021, 11, 100127. [Google Scholar] [CrossRef]
  12. Zhang, Z.; Lin, X.; Shan, S. Big data-assisted urban governance: An intelligent real-time monitoring and early warning system for public opinion in government hotline. Futur. Gener. Comput. Syst. 2023, 144, 90–104. [Google Scholar] [CrossRef]
  13. Gao, X.Y. Study on Fusion of Multi-Source POI Based on the Spatial Location Information. Master’s Thesis, Ocean University of China, Qingdao, China, 2013. [Google Scholar]
  14. Wu, Y. Preprocessing of LBS based POI Data Updating. Comput. Digit. Eng. 2012, 40, 87–89. [Google Scholar]
  15. Zhou, Y.; Li, C.; Zheng, W.; Rong, Y.; Liu, W. Identification of urban shrinkage using NPP-VIIRS nighttime light data at the county level in China. Cities 2021, 118, 103373. [Google Scholar] [CrossRef]
  16. Yang, Z.; Chen, Y.; Guo, G.; Zheng, Z.; Wu, Z. Using nighttime light data to identify the structure of polycentric cities and evaluate urban centers. Sci. Total Environ. 2021, 780, 146586. [Google Scholar] [CrossRef] [PubMed]
  17. Liu, S.; Shi, K.; Wu, Y. Identifying and evaluating suburbs in China from 2012 to 2020 based on SNPP–VIIRS nighttime light remotely sensed data. Int. J. Appl. Earth Obs. Geoinf. 2022, 114, 103041. [Google Scholar] [CrossRef]
  18. Feng, Z.; Peng, J.; Wu, J. Using DMSP/OLS nighttime light data and K–means method to identify urban–rural fringe of megacities. Habitat Int. 2020, 103, 102227. [Google Scholar] [CrossRef]
  19. Hu, X.; Qian, Y.; Pickett, S.T.A.; Zhou, W. Urban mapping needs up-to-date approaches to provide diverse perspectives of current urbanization: A novel attempt to map urban areas with nighttime light data. Landsc. Urban Plan. 2020, 195, 103709. [Google Scholar] [CrossRef]
  20. Yang, Y.; Wu, J.; Wang, Y.; Huang, Q.; He, C. Quantifying spatiotemporal patterns of shrinking cities in urbanizing China: A novel approach based on time-series nighttime light data. Cities 2021, 118, 103346. [Google Scholar] [CrossRef]
  21. Yang, S.; Yang, X.; Gao, X.; Zhang, J. Spatial and temporal distribution characteristics of carbon emissions and their drivers in shrinking cities in China: Empirical evidence based on the NPP/VIIRS nighttime lighting index. J. Environ. Manag. 2022, 322, 116082. [Google Scholar] [CrossRef]
  22. Liu, Z.; He, C.; Zhang, Q.; Huang, Q.; Yang, Y. Extracting the dynamics of urban expansion in China using DMSP-OLS nighttime light data from 1992 to 2008. Landsc. Urban Plan. 2012, 106, 62–72. [Google Scholar] [CrossRef]
  23. Huang, C.; Zhuang, Q.; Meng, X.; Guo, H.; Han, J. An improved nightlight threshold method for revealing the spatiotemporal dynamics and driving forces of urban expansion in China. J. Environ. Manag. 2021, 289, 112574. [Google Scholar] [CrossRef] [PubMed]
  24. Wu, Y.; Li, C.; Shi, K.; Liu, S.; Chang, Z. Exploring the effect of urban sprawl on carbon dioxide emissions: An urban sprawl model analysis from remotely sensed nighttime light data. Environ. Impact Assess. Rev. 2022, 93, 106731. [Google Scholar] [CrossRef]
  25. Lei, Y.-F.; Su, Y.; Huang, Y.-F. Research on the Coupling Relationship between Urban Vitality and Urban Sprawl Based on the Multi-Source Nighttime Light Data—A Case Study of the West Taiwan Strait Urban Agglomeration. Hum. Geogr. 2022, 37, 119–131. [Google Scholar]
  26. Zhao, W.; Li, Q.; Li, B. Extracting hierarchical landmarks from urban POI data. J. Remote Sens. 2011, 15, 973–988. [Google Scholar]
  27. Xu, Z.; Gao, X. A novel method for identifying the boundary of urban built-up areas with POI data. Acta Geogr. Sin. 2016, 71, 928–939. [Google Scholar]
  28. Li, F.; Yan, Q.; Bian, Z.; Liu, B.; Wu, Z. A POI and LST Adjusted NTL Urban Index for Urban Built-Up Area Extraction. Sensors 2020, 20, 2918. [Google Scholar] [CrossRef]
  29. Yu, B.C.; Liu, Y.X.; Chen, G. Urban spatial structure of port city in south china sea based on spatial coupling between nighttime light data and POI. J. Geo-Inf. Sci. 2018, 20, 854–861. [Google Scholar]
  30. Shi, K.; Chang, Z.; Chen, Z.; Wu, J.; Yu, B. Identifying and evaluating poverty using multisource remote sensing and point of interest (POI) data: A case study of Chongqing, China-ScienceDirect. J. Clean. Prod. 2020, 255, 120245. [Google Scholar] [CrossRef]
  31. Wang, X.; Cai, Y.; Liu, G.; Zhang, M.; Bai, Y.; Zhang, F. Carbon emission accounting and spatial distribution of industrial entities in Beijing—Combining nighttime light data and urban functional areas. Ecol. Inform. 2022, 70, 101759. [Google Scholar] [CrossRef]
  32. Ma, X.; Yang, Z.; Wang, J.; Han, F. Mapping population on Tibetan Plateau by fusing VIIRS data and nighttime Tencent location-based services data. Ecol. Indic. 2022, 139, 108893. [Google Scholar] [CrossRef]
  33. Wei, Z.; Wu, S.; Ban, P.F. Characteristics of the Urban Gravity Structure in the Guangzhou-Foshan Metropolitan Area Based on Multi-Source Data. Trop. Geogr. 2021. [Google Scholar] [CrossRef]
  34. Zhang, J.; Yuan, X.-D.; Lin, H. The Extraction of Urban Built-up Areas by Integrating Night-time Light and POI Data—A Case Study of Kunming, China. IEEE Access 2021, 9, 22417–22429. [Google Scholar]
  35. Zhi, Q.; Chen, J.; Fu, Y.; Guo, B. The Multi-Center Spatial Structure in the Guangdong-Hong Kong-Macao Greater Bay Area Urban Agglomeration Based on Luojia1-01 Nighttime Light Data and POI Data. Trop. Geogr. 2022, 42, 444–456. [Google Scholar]
  36. He, X.; Zhou, C.; Zhang, J.; Yuan, X. Using Wavelet Transforms to Fuse Nighttime Light Data and POI Big Data to Extract Urban Built-Up Areas. Remote Sens. 2020, 12, 3887. [Google Scholar] [CrossRef]
  37. Chen, B.; Xu, S.Z.; Zhang, Y.Y.; Xu, F.L.; Wang, H.Z. Analysis of urban spatial structure based on spatial coupling between POI and nighttime data: A case study of main urban region in Wuhan. Bull. Surv. Mapp. 2020, 7, 70–75. [Google Scholar]
  38. Cao, W.C.; Lu, X.Y.; Ma, Y.W.; Wen, X.H.; Wang, L.; Chen, Y. A study of extracting urban built-up area by using multitemporal night-time light data—Taking Southwest China as An Example. Eng. Surv. Mapp. 2014, 12, 4. [Google Scholar]
  39. Gao, Y.H.; Gu, Y.Y.; Qiao, X.N.; Song, X.H.; Ye, R.W.; Sun, X. Study on extracting urban area in Nanjing based on DMSP/OLS nighttime light data. Sci. Surv. Mapp. 2017, 42, 93–98. [Google Scholar]
  40. He, C.; Shi, P.; Li, J.; Chen, J.; Pan, Y.; Li, J.; Zhuo, L.; Ichinose, T. Spatial Reconstruction of Urbanization Processes in Mainland China in the 1990s Based on DMSP/OLS Nighttime Lighting Data and Statistics. Chin. Sci. Bull. 2006, 7, 856–861. [Google Scholar]
  41. Zhao, H.B.; Yu, D.F.; Miao, C.H.; Li, G.; Feng, Y.; Bie, Q. The Location Distribution Characteristics and Influencing Factors of Cultural Facilities in Zhengzhou Based on POI Data. Sci. Geogr. Sin. 2018, 38, 1525–1534. [Google Scholar]
  42. Wang, S.J.; Kong, W.; Ren, L.; Zhi, D.D.; Dai, B.T. Research on misuses and modification of coupling coordination degree model in China. J. Nat. Resour. 2021, 36, 793. [Google Scholar] [CrossRef]
Figure 1. Map of Changchun city administrative division.
Buildings 14 00019 g001
Figure 2. Synthetic nighttime light intensity values for March 2022.
Buildings 14 00019 g002
Figure 3. Research roadmap.
Buildings 14 00019 g003
Figure 4. Result of extraction for the built-up area of Changchun City in March 2022.
Buildings 14 00019 g004
Figure 5. Kernel density values in March 2022.
Buildings 14 00019 g005
Figure 6. Legend of Two-factor combination mapping.
Buildings 14 00019 g006
Figure 7. Spatial coupling relationship between POI and NTL in Changchun in March 2022.
Buildings 14 00019 g007
Figure 8. Regional distribution of POI and NTL equivalence.
Buildings 14 00019 g008
Figure 9. Regional distribution map showing where POI values are higher than NTL values.
Buildings 14 00019 g009
Figure 10. Regional distribution map showing where POI values are lower than NTL values.
Buildings 14 00019 g010
Table 1. Data resource.
Data NameResource
Basic geographic dataNational Geomatics Center of China
(http://www.ngcc.cn/ngcc/, accessed on 21 January 2023)
NPP/VIIRS NTL dataThe official website of the University of Colorado
(https://eogdata.mines.edu/, accessed on 18 November 2022)
POIGaode Open Platform
(https://lbs.amap.com/tools/picker, accessed on 15 Febrary 2023)
DEMNational Catalogue Service for Geographic Information
(http://www.webmap.cn, accessed on 18 November 2022)
Table 2. POI data classification.
Major CategoriesQuantityPercentage/%
Spending on Shopping62,20026.88%
Dining and Gourmet42,05018.17%
Life Services28,69712.40%
Company Enterprise17,8067.69%
Transportation Facilities16,8027.26%
Healthcare15,4686.68%
Automotive-Related14,4786.26%
Science, Education, and Culture12,5685.43%
Business Residence61632.66%
Hotel Accommodation52722.28%
Financial institutions40151.74%
Recreation24611.06%
Sports and Fitness22580.98%
Tourist Attractions11670.50%
Table 3. Number and percentage of pixels per coupling relationship.
Coupling RelationshipNumber of PixelsPercentage
High–High880.09%
Medium–Medium18231.81%
Low–Low83,19582.68%
High–Medium6760.67%
High–Low8900.88%
Medium–Low24332.42%
Medium–high12181.21%
Low–High48214.79%
Low–Medium54765.44%
Total100,620100.00%
Table 4. Statistical data for administrative regions of Changchun in 2021.
Administrative RegionGross Regional Product
(Billion Yuan)
Population
(10,000 People)
Fiscal Revenue
(Billion Yuan)
Nanguan445.348.860.2
Chaoyang727.559.264.8
Kuancheng306.238.837.5
Erdao213.333.032.4
Lyuyuan285.642.749.6
Shuangyang155.836.116.1
Jiutai236.572.020.8
Nong’an292.3111.721.2
Yushu269.4120.512.2
Dehui249.387.016.4
Gongzhuling336.3101.429.4
Disclaimer/Publisher’s Note: The statements, opinions and data contained in all publications are solely those of the individual author(s) and contributor(s) and not of MDPI and/or the editor(s). MDPI and/or the editor(s) disclaim responsibility for any injury to people or property resulting from any ideas, methods, instructions or products referred to in the content.

