Article

Analysis and Experiment on the Welding Temperature Field of Multi-Layer and Multi-Pass for RHS–RHS Y-Connections

1
School of Mechanics and Civil Engineering, China University of Mining and Technology-Beijing, Beijing 100083, China
2
Organization Department of Daozhen Autonomous County Committee, Zunyi 563500, China
3
College of Water Resources and Civil Engineering, China Agricultural University, Beijing 100083, China
*
Author to whom correspondence should be addressed.
Buildings 2024, 14(1), 157; https://doi.org/10.3390/buildings14010157
Submission received: 7 November 2023 / Revised: 7 December 2023 / Accepted: 2 January 2024 / Published: 8 January 2024
(This article belongs to the Special Issue Advancements in Large-Span Steel Structures and Architectural Design)

Abstract

:
The temperature measuring instrument was utilized to monitor the welding temperature field at designated points along steel rectangular hollow sections (RHSs) during welding. A total of 32 temperature monitoring points were established on the four surfaces of the RHS branch. Additionally, the welding process was simulated using finite element software to calculate the temperature distribution. The calculated temperature results were then compared with the experimental results obtained from the temperature measuring instrument. The relative errors between the numerical simulation and the experimental temperature results remained within 10%, indicating a reasonable agreement between the two. Once the temperature field was determined, it was used as an input load to calculate the welding residual stress. The longitudinal and transverse residual stresses were analyzed for two paths on the four surfaces of the RHS-to-RHS Y-shaped connection branch. By analyzing the residual stresses, it is possible to evaluate the structural integrity and performance of the welded RHS connection. The analysis process in this paper is crucial for ensuring the safety and reliability of tubular steel structure projects.

1. Introduction

Hollow section structures (HSSs) have several advantages, including low weight, favorable aerodynamic shape, aesthetic appearance, and excellent strength properties [1,2]. As a result, HSSs are increasingly important in railway, transportation, architecture, and other fields. The welding design of HSS components, such as the welding between support members and chords, typically involves groove welds or fillet welds. However, due to the non-uniformity and locality of heat input during welding, residual stress will inevitably occur [3]. The presence of welding residual stress not only reduces the bearing capacity of steel structures but also deteriorates the fatigue strength of components and increases the risk of brittle fractures of steel structures [4,5]. Welding deformation not only affects the appearance quality of products but also reduces the manufacturing accuracy of steel structures [6]. Therefore, predicting and controlling welding residual stress and deformation is of great significance for the safety assessment of steel structures.
In recent years, there has been increasing attention on research for material models of low-alloy steel due to advancements in measurement methods for residual stresses and deformation, as well as the availability of more comprehensive material parameters. These models are valuable in predicting and explaining the residual stresses and deformation that occurs during the welding process of low-alloy steel. By optimizing welding processes and enhancing the performance of steel structures, these material models contribute significantly. Material factors encompass the high temperature thermophysical and mechanical properties of both the base material and the welding material, as well as the characteristic changes in the mechanical properties of the material during the welding process [7]. In the finite element modeling process, it is crucial to establish high-precision material models while accurately considering design and manufacturing factors.
The numerical simulation of the welding process has always been a challenging problem. However, with the advancement of computer technology and the accumulation of research work, computational welding mechanics has made significant progress in terms of data accuracy and computational efficiency [8]. Ueda and Yamakawa [9] were the first to propose a welding residual stress analysis method based on finite element modeling (FEM), which takes into account the influence of temperature on mechanical performance. Subsequently, thermal–mechanical analysis has been further developed and applied to comprehensively address transient heat transfer problems, considering material nonlinearity and geometric changes as well. Cao et al. [10] and Gao et al. [11] employed the “birth-death element” technique in ANSYS to simulate the influence of welding residual stresses on CHS Y-joints and K-joints. When considering the impact of welding residual stresses, the Y-joint’s ultimate bearing capacity was reduced by approximately 4%, while the K-joint’s ultimate bearing capacity increased by up to 10%. Wang et al. [12] established a thermal elastoplastic (TEP) finite element analysis of fillet welded T-joints. The results indicate that welding residual stress causes in-plane cooling shrinkage and plate buckling deformation, and also significantly affects the behavior of mixed mode stress intensity factors (MM-SIFs) in the joint. Garifullin et al. [13,14] developed a numerical model using the finite element software Abaqus 2020 to determine the welding residual stress of the S420 RHS T-joints through sequential coupled thermal stress analysis. Gadallah et al. [15] conducted a TEP finite element analysis of CHS tubular T-joints with surface cracks and modeled the three-dimensional solid multi-pass circular weld toe under actual welding conditions to evaluate the effect of welding residual stress. Dengyiding et al. [16] evaluated the detailed welding effects on the strength and stiffness of concrete-filled steel tubular (CFST) Y- and K-joints using the Abaqus Welding Interface. Research has indicated that the ratio of branch to chord pipe thickness is a critical factor in controlling joint failure. A decrease in the thickness of the weld legs results in a moderate reduction in joint bearing capacity and stiffness, as well as the generation of smaller residual stress areas. Wu Jun et al. [17] investigated the effect of welding residual stress on the fatigue life of orthotropic steel bridge decks with diaphragms through experiments and numerical simulations. Krishna Murthy K.R et al. [18] utilized the finite element software ABAQUS to perform numerical simulation calculations and experiments on welded joints, comparing the numerical simulation models and experimental results of thermal mechanics and thermal metallurgy mechanics. The research demonstrates that the presence of phase transformation inclusions significantly impacts the residual stress of welded components. Hashemzadeh M. et al. [19] developed a three-dimensional finite element analysis method to estimate post-welding deformation and residual stress. They used transient indirect, decoupling, and thermal mechanical analysis methods to estimate the deformation and residual stress of a large stiffener panel in hybrid laser welding. The mentioned literature has examined welding residual stresses in various types of low-alloy high-strength steel joints.
The steel structure welding process In the references mentioned, lacks thorough monitoring of the temperature field, making it challenging to ensure the accuracy of numerical simulation results. Additionally, there is insufficient research on the welding temperature field and residual stress of RHS–RHS Y-joints. Based on the issues mentioned above, this article conducts a more thorough study on the welding simulation of RHS–RHS Y-shaped joints. In Section 2, temperature monitoring equipment was used to measure the temperature changes at various positions of the RHS–RHS Y-shaped joint during the welding process. The data obtained enables the generation of temperature–time history curves for each position, providing more precise and detailed information on the temperature field characteristics for subsequent welding simulation work. In Section 3.1 and Section 3.2, the finite element software Abaqus is used to simulate the welding process of the RHS–RHS Y-shaped joint. The numerical simulation temperature curve is compared with the measured temperature curve, and the relative error of the temperature peak between the two is found to be within 10%. In Section 3.3, based on the accurate temperature field simulation results in Section 3.2, this article further analyzes the welding residual stress of the RHS–RHS Y-shaped joint in Abaqus, and obtains the longitudinal and transverse residual stresses along two paths on the four surfaces of the RHS–RHS Y-shaped joint. This comprehensive approach combines experimental measurements and numerical simulations to better analyze the temperature and stress distribution during the welding process of RHS–RHS Y-joints. The research findings contribute to enhancing the welding process and ensuring the structural reliability of RHS–RHS Y-shaped joints.

2. Field Welding Test

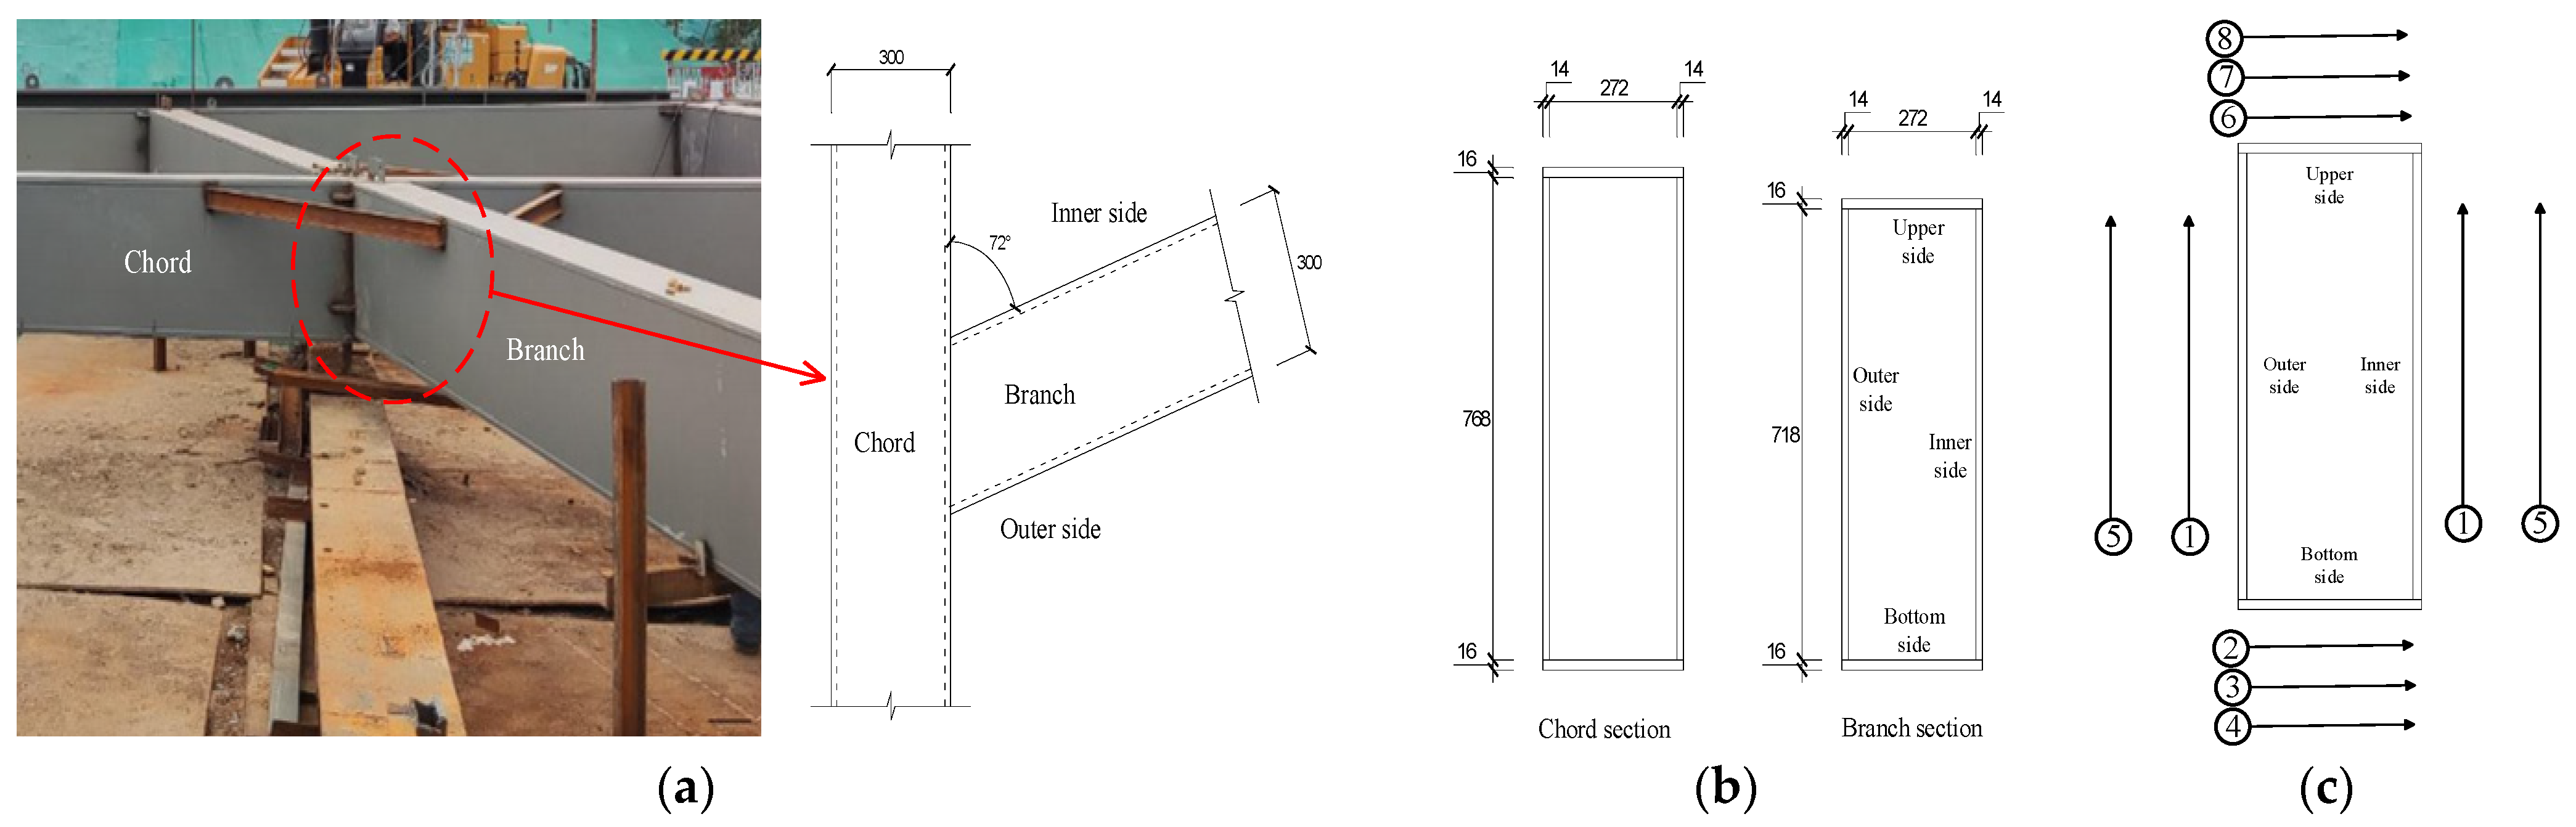
2.1. Dimensions and Material Characteristics of the RHS-to-RHS Y-Shaped Connection

At the construction site, a temperature field monitoring test is conducted for RHS-to-RHS Y-shaped connections. The base metal is Q345 low-alloy high-strength steel, and welding is performed using carbon dioxide inert gas shielded welding. The welding wire is JQ-CE71T-1 carbon dioxide gas shielded flux cored wire with a diameter of 1.2 mm. Table 1 shows the properties of the base metal, and the parameters are sourced from reference [3].
The RHS-to-RHS Y-shaped connection is composed of a chord and a branch. The acute angle between the chord and the branch measures 72°. The inner side has the acute angle, while the outer side has the obtuse angle. The groove is in the shape of a 45° V. The chord has a height of 800 mm, a width of 300 mm, and upper and bottom panels with a thickness of 16 mm. The inner and outer panels of the chord have a thickness of 14 mm. The branch has a height of 760 mm, a width of 300 mm, and upper and bottom panels with a thickness of 16 mm. The inner and outer panels of the branch also have a thickness of 14 mm. The specific dimensions of the chord and branch pipes are shown in Figure 1a,b.

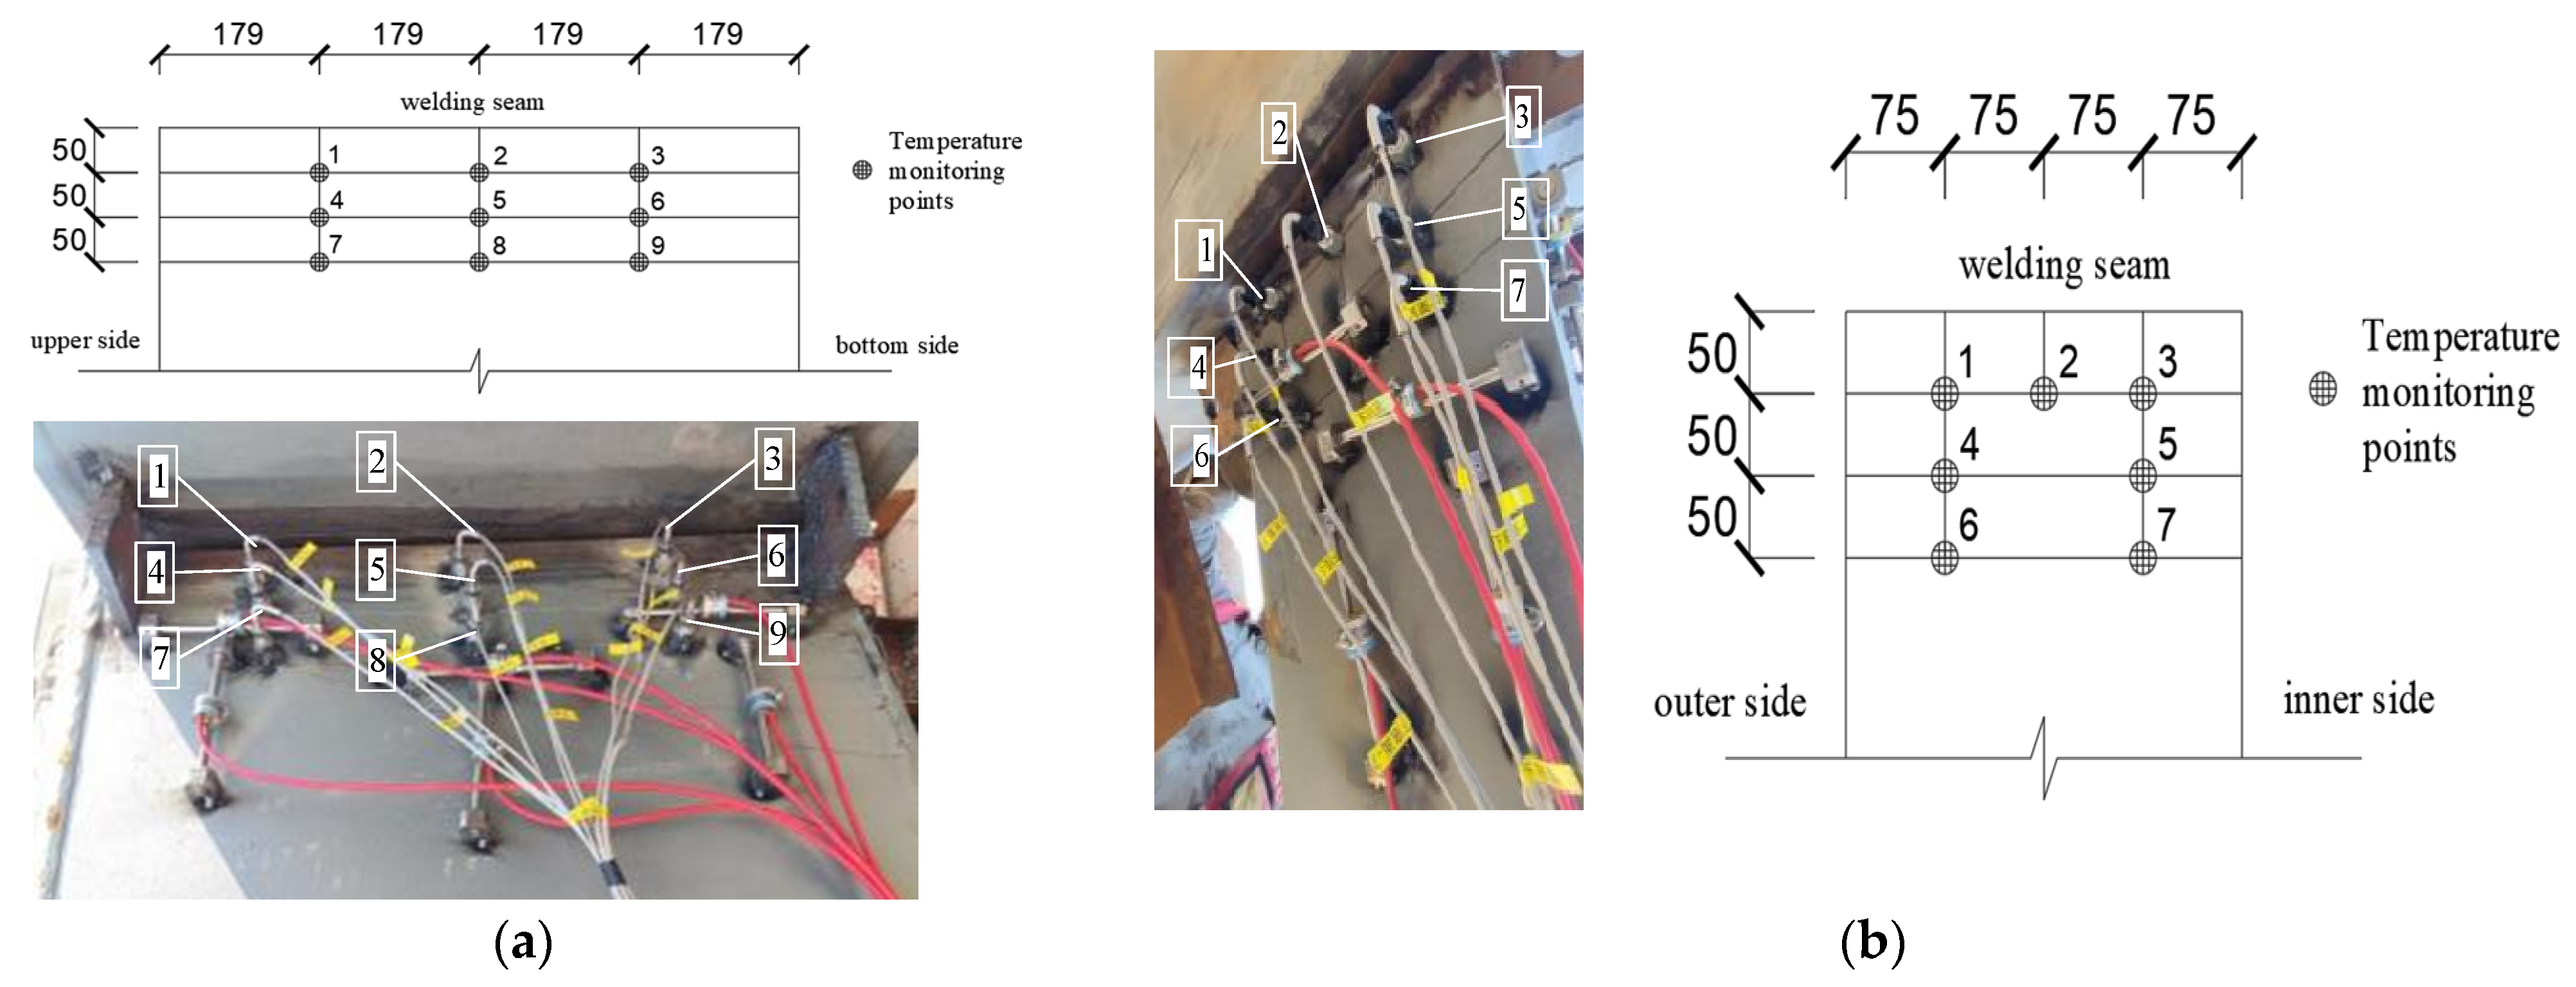
2.2. Field Welding Process and Temperature Monitoring Methods

The welding sequence for the RHS-to-RHS Y-shaped connection, as depicted in Figure 1c, involves several steps. Firstly, the first weld seam on the inner and outer sides is welded. Following this, the three welds on the bottom surface are continuously welded. Subsequently, the second weld seam on the inner and outer sides is welded. Finally, the three welds on the top surface are continuously welded. There is no interruption between neighboring welds, and the welding process is continuous. The welding parameters for the RHS-to-RHS Y-shaped connection during the field welding were recorded, and the welding time, voltage, current, and other relevant data for each weld seam during the welding process of the Y-joint are summarized in Table 2.
During welding, the temperature of seven points on the upper side and bottom surface of the branch would be monitored. At the same time, the temperature of nine points on the inner and outer sides of the branch is also monitored. During welding, the layout of temperature measuring points on each monitoring surface is shown in Figure 2.
When monitoring the temperature change of each measuring point on the branch during the welding process, first mark the position of each measuring point on the branch pipe, and then arrange the temperature sensor on the branch pipe. The temperature measuring points on the upper side and the bottom side are spaced 50 mm in the direction perpendicular to the weld, and 75 mm in the direction parallel to the weld; the space between the temperature measuring points on the inner side and the outer side in the direction perpendicular to the weld is 50 mm, and the space between the measuring points in the direction parallel to the weld is 190 mm. The actual arrangement of the sensors on the upper side and the bottom side is shown in Figure 2a and the actual arrangement of the sensors on the inner surface and the outer surface is shown in Figure 2b. The device utilized for monitoring temperature during the welding procedure is Anbai-AT4732 (Changzhou Anbai Precision Instrument Co., Ltd., Changzhou City, China), a multi-channel temperature tester operated by a high-performance advanced RISC machine (ARM) microprocessor. It has the capability to concurrently gather and document temperature fluctuations at 32 points, with a rapid response time and consistent data stability. The thermocouple of the Anbai-AT4732 has excellent resistance to high temperatures, with a temperature detection range from −200 °C to 1350 °C.

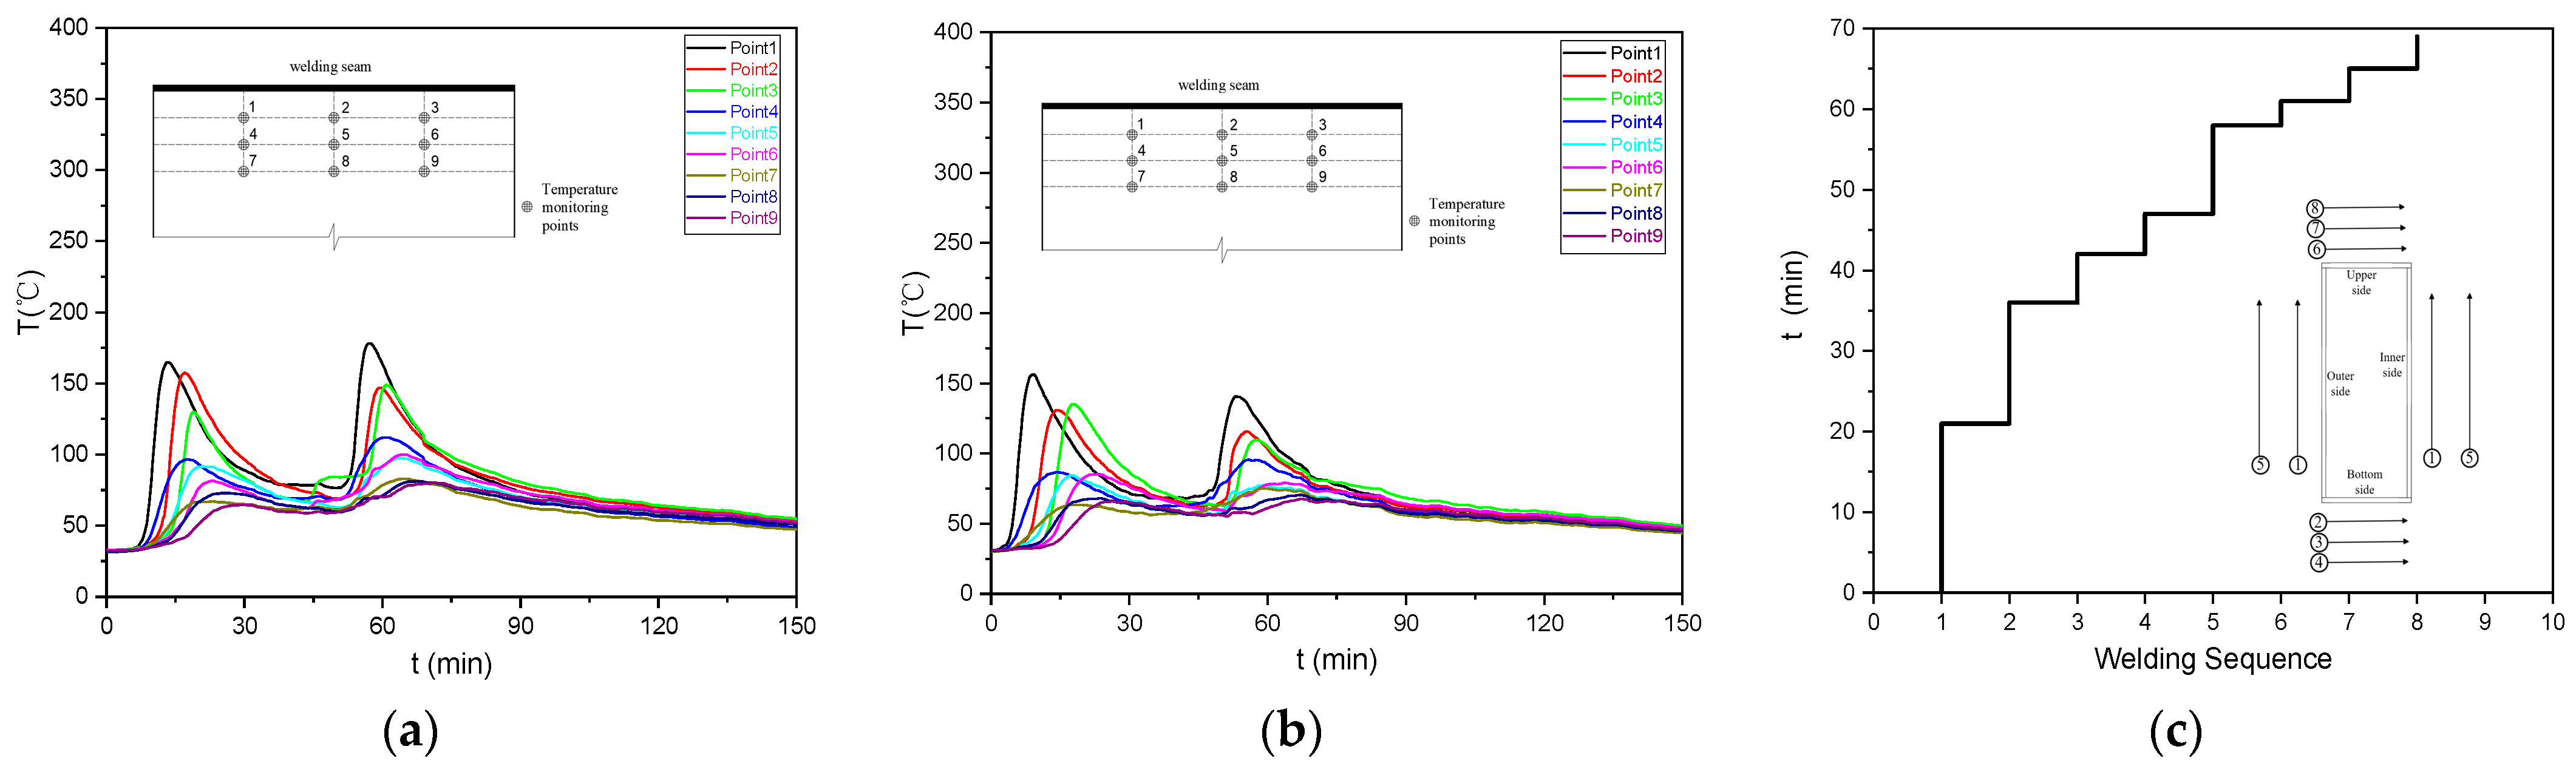
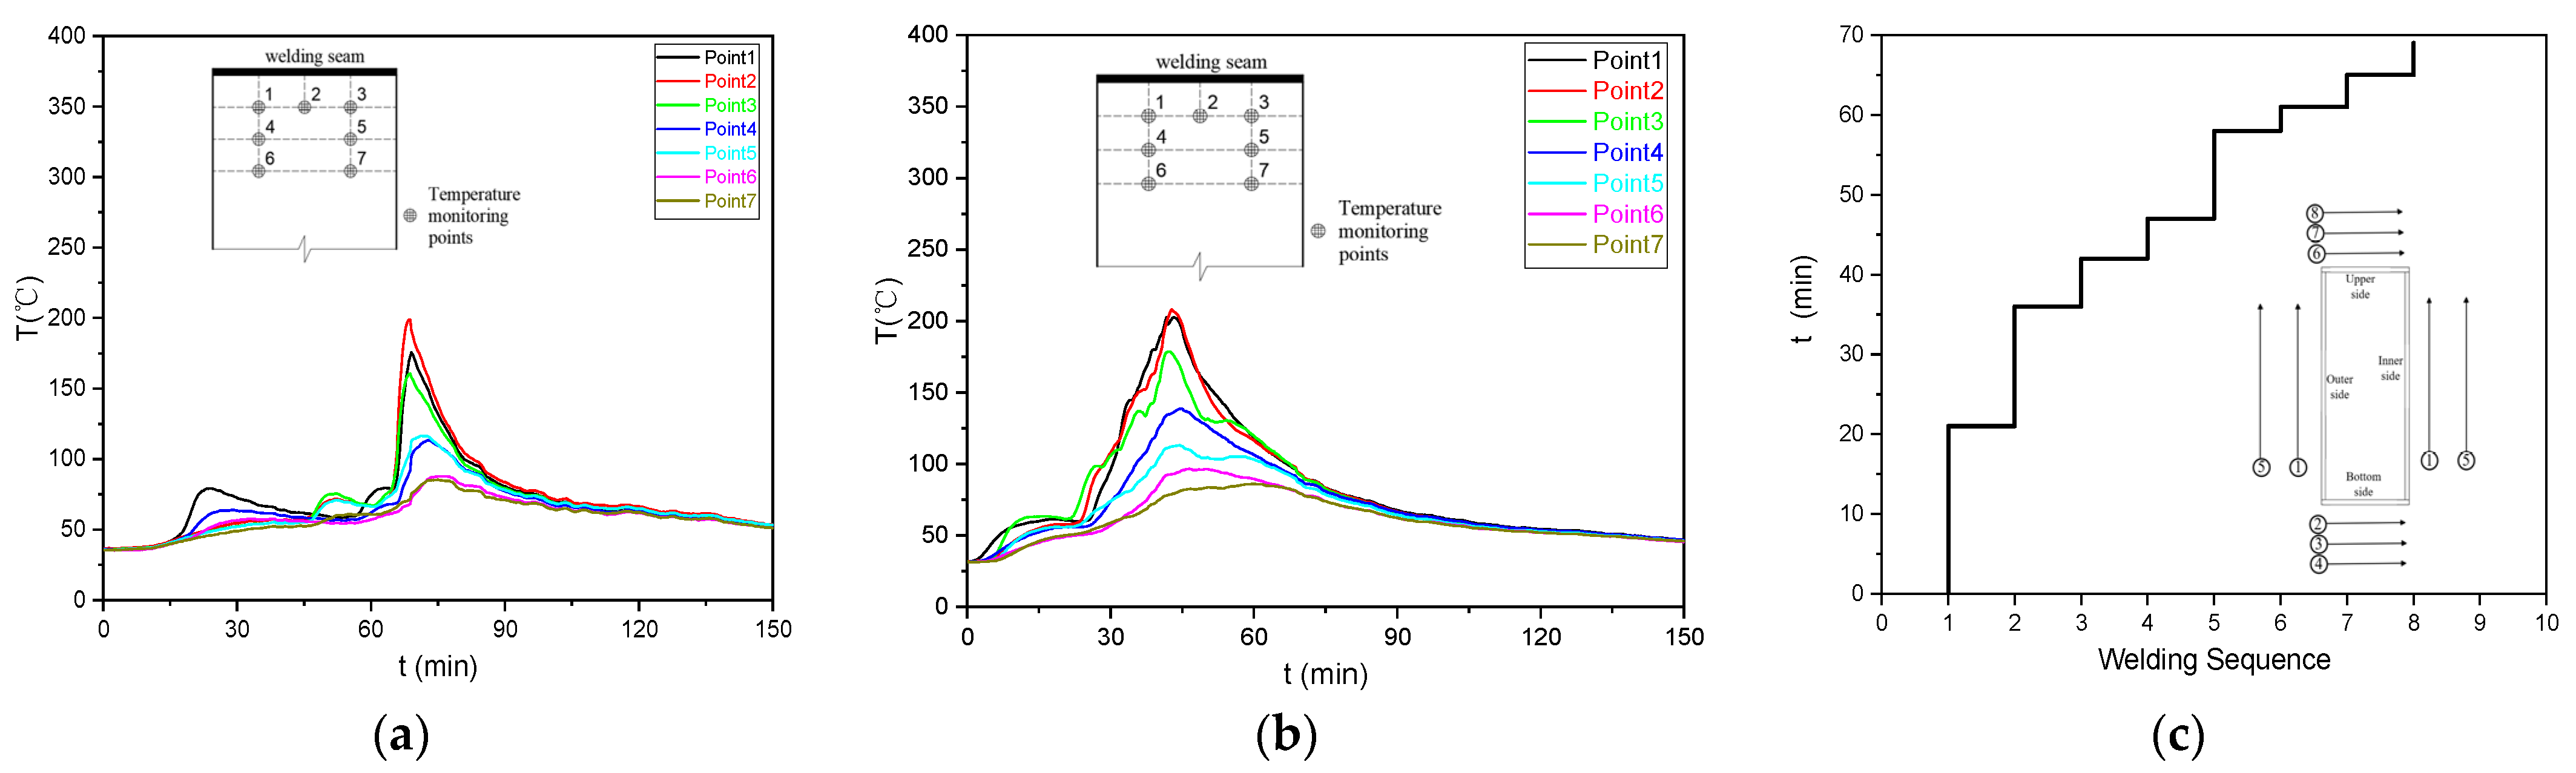
2.3. Results of Temperature Field Monitoring

During the whole welding experiment, the temperature changes monitored on the branch of the RHS-to-RHS Y-shaped connection are shown in Figure 3 and Figure 4. This paper further analyzes the statistics of the maximum temperature at each temperature measurement point after each weld seam is completed during the welding process, as shown in Table 3. According to the monitoring data, the maximum temperature for welding in the inner side is 178.2 °C, the maximum temperature for welding in the outer side is 156.4 °C, the maximum temperature for welding in the bottom side is 208 °C, and the maximum temperature for welding in the upper top is 199 °C.

3. Finite Element Numerical Analysis

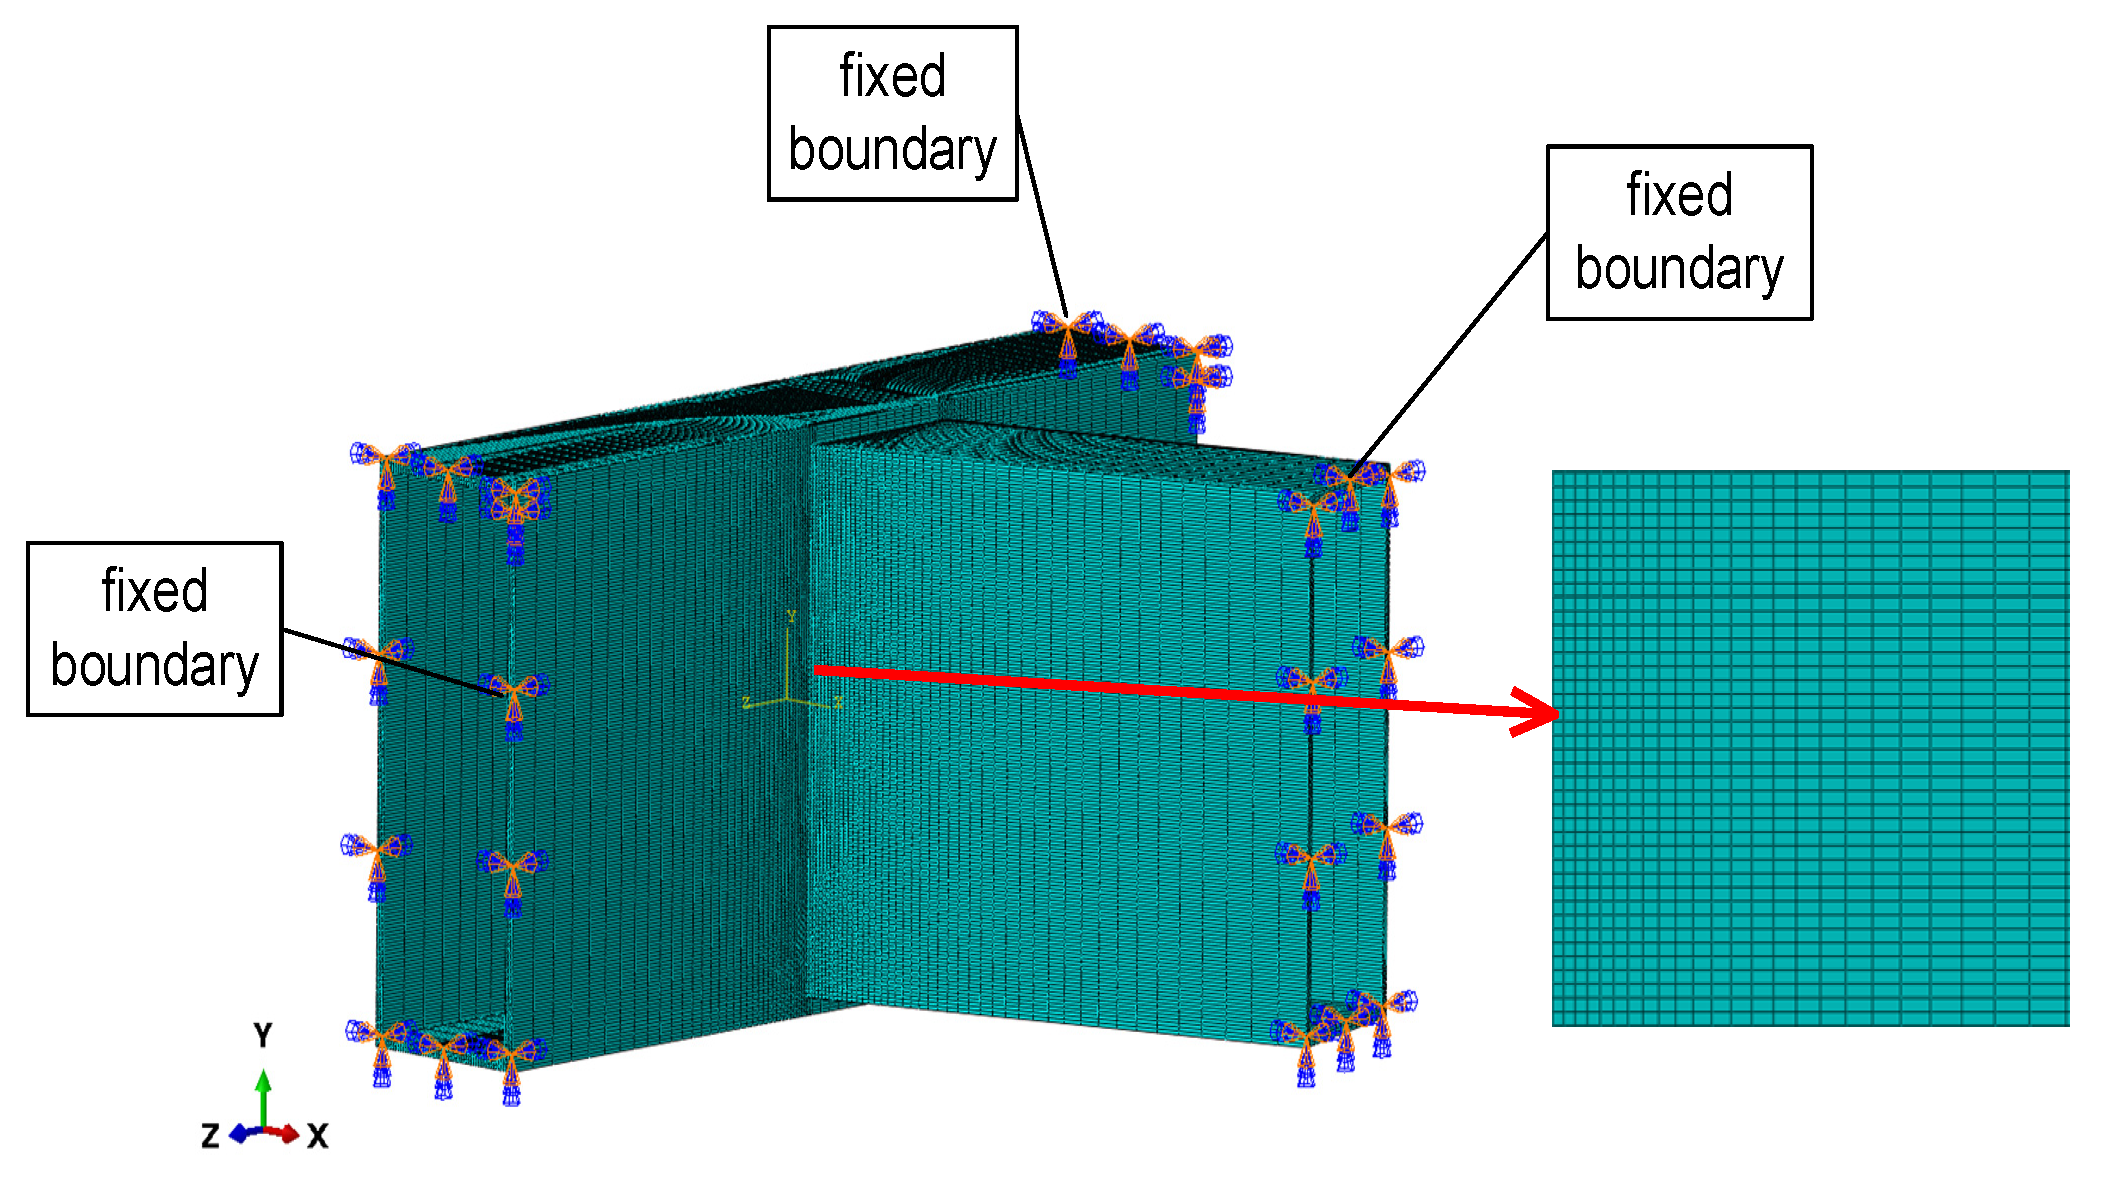
3.1. Finite Element Modeling

Over time, the numerical simulation of welding residual stress using finite element software has gained widespread usage. However, most of these simulations have focused on single plate welding, with limited attention given to the numerical calculation of multi-layer and multi-pass welding of RHS-to-RHS Y-shaped connections.
In this study, the researchers have made advancements by developing a subroutine for the double ellipsoidal moving heat source model using Fortran language. This subroutine is utilized in the Abaqus software to simulate the welding residual stress of the joints. The simulation is achieved through sequential coupling technology. The research approach involves two main steps. Firstly, the temperature field during the welding process is calculated and compared with experimental results to obtain a more accurate representation of the actual weldment’s temperature field. Subsequently, the calibrated temperature field results are utilized to calculate the residual stress field during the welding process. The simulation process is shown in Figure 5. By incorporating these advancements, the researchers aim to provide a more comprehensive understanding of the welding residual stress in RHS-to-RHS Y-shaped connections, particularly in multi-layer and multi-pass welding scenarios.
In the welding numerical simulation, a full-scale solid element model is constructed for the RHS-to-RHS Y-shaped connection in the experiment. The connection between the branch pipe and the chord pipe uses a “Merge” method. The two ends of the chord pipe are designated as fixed boundaries, and the end of the branch pipe away from the weld is also designated as a fixed boundary. During the simulation of the temperature field, the element type used is DC3D8R. For the simulation of welding residual stress, the element type used is C3D8R. To accurately capture the temperature and residual stress near the weld seam, this study employs a denser mesh near the weld seam and a coarser mesh away from the weld seam. The impact of various grid sizes on residual stress in the Q345 steel plate butt welding was investigated in reference [20]. The findings indicate that the residual stress near the weld remains essentially unchanged when the mesh size of the weld area is within 5 mm. As a result, this article sets the weld area element size to 5 mm, and the fixed boundaries area element size to 50 mm, with 143,148 elements and 192,576 nodes in the finite element model. The mesh division and boundary conditions of the finite element calculation model are illustrated in Figure 6. This figure displays the distribution of the mesh as well as the specified boundary conditions for the calculations.

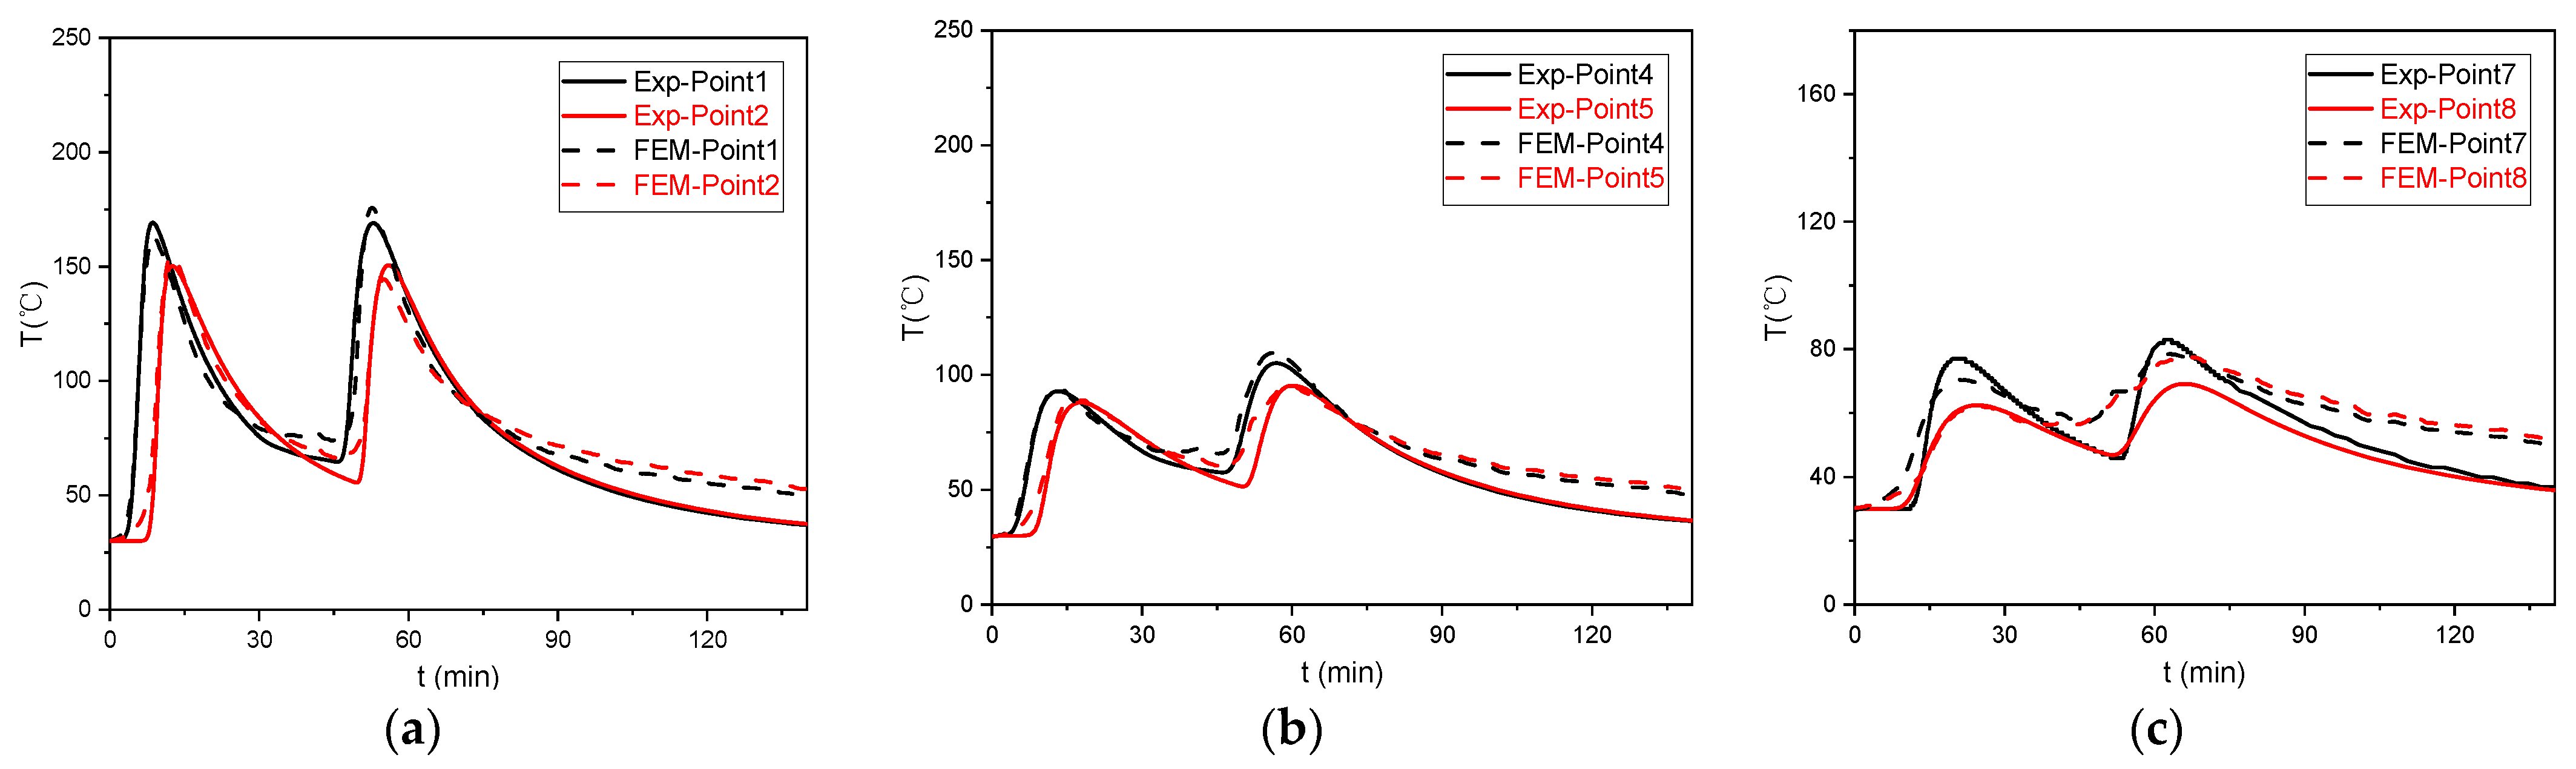
3.2. Temperature Field Simulation

Based on the welding process parameters provided in Table 2 of Section 2.2, the temperature changes at various measuring points during the welding process were simulated using the finite element method. To compare the differences between the numerical simulation and the measured temperature fields, two temperature measurement points were selected on the inner side of the branch, at distances of 50 mm, 100 mm, and 150 mm from the weld seam. The temperature–time history curves of these two measurement points, obtained from both the experiment and numerical simulation, are presented in Figure 7. In Figure 7, the full lines represent the temperature values obtained from the experiment, while the dotted lines represent the temperature values obtained from the numerical simulation. The comparison results indicate a good agreement between the temperature curves obtained from both methods. Furthermore, this study obtained the temperature peak values for each measurement point after each weld seam was completed through numerical simulation (as shown in Table 4). A comparison was made between the temperature peak values obtained from the numerical simulation and the experiment, with the specific results presented in Table 5. These tables provide a comprehensive comparison of the temperature peak values at each measurement point, allowing for a better understanding of the agreement between the numerical simulation and experimental results.
Based on the information provided in Table 5, the errors between the peak temperatures obtained from the experiment and the numerical simulation at different distances from the weld seam are analyzed. At a distance of 50 mm from the weld seam, the maximum error is 7.6% and the minimum error is 0.3%. This implies that the highest temperature calculated by numerical simulation can deviate from the highest temperature measured in the experiment by up to 7.6%, with a minimum deviation of 0.3%. Similarly, at a distance of 100 mm from the weld seam, the maximum error is 5.2% and the minimum error is 0.8%. The highest temperature measured in the experiment can differ from the highest temperature calculated by numerical simulation by up to 5.2%, with a minimum deviation of 0.8%. At a distance of 150 mm from the weld seam, the maximum error is 9.7% and the minimum error is 2.4%. The highest temperature measured on-site can deviate from the highest temperature calculated by numerical simulation by up to 9.7%, with a minimum deviation of 2.4%. Overall, the temperature field of the branch obtained from the numerical simulation shows good agreement with the actual temperature field, with errors controlled within 10%.

3.3. Simulation of the Welding Residual Stress Field

In the previous chapter, the temperature field obtained through calculations was utilized as a temperature load to calculate the welding stress field. This calculation allows for the determination of stress changes in RHS-to-RHS Y-shaped connections during the welding process. To analyze the stress distribution, two stress output paths were defined on the inner side, outer side, upper side, and bottom side of the branch, along the weld direction and the vertical weld direction. These paths are represented as path 1 and path 2, as shown in Figure 8. Path 1 is perpendicular to the weld direction, while path 2 is along the weld direction. The calculated results of longitudinal residual stresses along paths 1 in the four side faces of the branch are presented in Figure 9a, and the calculated results of transverse residual stresses along paths 1 in the four side faces of the branch are presented in Figure 9b. The calculated results of longitudinal residual stresses along paths 2 in the four side faces of the branch are presented in Figure 10a, and the calculated results of transverse residual stresses along paths 2 in the four side faces of the branch are presented in Figure 10b. These figures provide a visual representation of the longitudinal and transverse residual stresses along the defined paths on each face of the branch. By analyzing these stress distribution results, a better understanding of the welding residual stress field in RHS-to-RHS Y-shaped connections can be achieved.
Based on the analysis of Figure 9a, it is evident that along path 1, there is a notable presence of longitudinal residual stress near the weld on each side of the branch pipe. As the distance from the weld increases to 50 mm, the longitudinal residual stress on the inner and outer sides becomes negative. When the distance continues to increase to 350 mm, the longitudinal residual stress on the inner and outer sides transitions to positive values. However, it should be noted that the longitudinal residual stress on the upper and bottom surfaces becomes negative at this point. The maximum value of residual stress is approximately 345 MPa in the upper and bottom sides of the branch pipe, and the maximum residual stress has reached the yield strength value of the base material. However, the residual stress in the inner and outer sides of the branch pipe is lower than the yield strength of the base material.
Based on the information provided and the observation of Figure 9b, it can be noted that under path 1, the transverse residual stress on the inner side and outer side is relatively lower. As the distance from the weld increases to 20 mm, the value of the residual stress approaches zero. On the other hand, the transverse residual stress on the upper side and bottom side is higher, reaching approximately 200 Mpa. As the distance from the weld increases, the value of the transverse residual stress gradually decreases and eventually falls within the range of 50 Mpa. The axial residual stress (transverse residual stress along path 1) trend on the outer surface of the branch in this study is consistent with that of the branch in reference [16], indirectly confirming the reliability of the residual stress results of the joint in this article.
According to the observation of Figure 10a,b, it is evident that the longitudinal residual stress and transverse residual stress under path 2 exhibits a “small at both ends and large in the middle” distribution pattern. Additionally, regardless of whether it is the longitudinal or transverse residual stress, the residual stress values in the upper top surface and lower bottom surface are greater than those in the inner and outer sides. The maximum value of longitudinal residual stress is 345 MPa, which has reached the yield strength value of the base material, and the maximum value of transverse residual stress is approximately 180 MPa.

4. Conclusions

In this study, the welding process of the RHS-to-RHS Y-shaped connection was tested at the construction site, and the welding process was simulated using ABAQUS. The error of the temperature field obtained from the numerical simulation was kept within an acceptable range. Afterwards, the obtained temperature field was applied as a temperature load to the joint, enabling the calculation of the welding residual stress field of the joint. Based on the aforementioned research, the following conclusions can be drawn:
(1)
A multi-channel temperature acquisition instrument was adopted to obtain the actual welding temperature–time history curve of RHS-to-RHS Y-shaped connections during the field welding process.
(2)
A method for analyzing the temperature field of RHS-to-RHS Y-shaped connection welding has been developed. In this method, the welding process of the Y-shaped joint was simulated using a double ellipsoidal moving heat source. The temperature field obtained from numerical simulation was found to be in good agreement with the curve of the measured temperature field, with the error in the temperature peak at the end of each weld bead being within 10%.
(3)
Based on the numerical simulation method proposed in this paper for analyzing the welding temperature field, a comprehensive analysis was carried out on the welding residual stress of the RHS-to-RHS Y-shaped connection. The findings indicate that under the welding process described in this paper, the transverse and longitudinal residual stresses in the short side of the branch pipe are higher compared to those in the long side. Notably, the maximum transverse and longitudinal residual stresses in the middle position of short side of the branch pipe reaches 345 MPa, which is equivalent to the yield strength value of the base material.
(4)
The research methodology discussed in this article can be extended to other welding areas. For instance, it can be used to investigate the impact of TPU content on the welding properties of PP and ABS blends, as well as to examine the fatigue strength of welding lines in injection-molded products under varying tensile conditions.

Author Contributions

Writing—original draft preparation, Z.Y.; writing—review and editing, Z.Y.; software, F.Z.; validation, F.Z.; methodology, J.J.; formal analysis, J.J. All authors have read and agreed to the published version of the manuscript.

Funding

This research received no external funding.

Data Availability Statement

The data presented in this study are available on request from the corresponding author. The data are not publicly available due to privacy.

Conflicts of Interest

The authors declare no conflict of interest.

References

  1. Eekhout, M. Tubular Structures in Architecture, 2nd ed.; Delft University of Technology: Delft, The Netherlands, 2011; 127p. [Google Scholar]
  2. Wardenier, J.; Packer, J.A.; Zhao, X.L.; Van der Vegte, G.J. Hollow Sections in Structural Applications; John Wiley & Sons: Hoboken, NJ, USA, 2010; 232p. [Google Scholar]
  3. Zhang, C.; Wang, X.; Chang, M.; Wang, H.; Ye, Y.; Deng, D. Effects of Yield Strength of Weld Metal and Material Strain Hardening on Prediction Accuracy of Welding Residual Stress and Deformation in a Q345 Steel Joint. J. Mech. Eng. 2021, 57, 160–168. [Google Scholar]
  4. Hensel, J.; Nitschke, P.; Ngoula, T.; Beier, H.-T.; Tchuindjang, D.; Zerbst, U. Welding residual stresses as needed for the prediction of fatigue crack propagation and fatigue strength. Eng. Fract. Mech. 2018, 198, 123–141. [Google Scholar] [CrossRef]
  5. An, G.; Woo, W.; Park, J. Welding residual stress effect in fracture toughness. J. Nanosci. Nanotechnol. 2019, 19, 2323–2328. [Google Scholar] [CrossRef] [PubMed]
  6. Deng, D.; Zhou, Y.; Bi, T.; Liu, X. Experimental and numerical investigations of welding distortion induced by CO2 gas arc welding in thin-plate bead-on joints. Mater. Des. 2013, 52, 720–729. [Google Scholar] [CrossRef]
  7. Lindgren, L.E. Computational Welding Mechanics; Woodhead Publishing: Cambridge, UK, 2007. [Google Scholar]
  8. Seles, K.; Peric, M.; Tonkovic, Z. Numerical simulation of a welding process using a prescribed temperature approach. J. Constr. Steel Res. 2018, 145, 49–57. [Google Scholar] [CrossRef]
  9. Ueda, Y.; Yamakawa, T. Analysis of thermal elastic-plastic stress and strain during welding by finite element method. Trans. J. Jpn. Weld. Soc. 1971, 2, 90–100. [Google Scholar]
  10. Gao, Z.; Guo, Y. Analysis on influence of welding residual stress on ultimate bearing capacity of Y-joints. J. Architect. Civil Eng. 2016, 33, 11. [Google Scholar]
  11. Cao, Y.; Meng, Z.; Zhang, S.; Tian, H. FEM study on the stress concentration factors of K-joints with welding residual stress. Appl. Ocean Res. 2013, 43, 195–205. [Google Scholar] [CrossRef]
  12. Wang, J.; Ma, N.; Murakawa, H. An efficient FE computation for predicting welding induced buckling in production of ship panel structure. Mar. Struct. 2015, 41, 20–52. [Google Scholar] [CrossRef]
  13. Garifullin, M.; Launert, B.; Heinisuo, M.; Pasternak, H.; Mela, K.; Pajunen, S. Effect of welding residual stresses on local behavior of rectangular hollow section joints. Part 1–Development of numerical model. Bauing. Z. Fuer Das Gesamte Bauwes. 2018, 93, 152–159. [Google Scholar]
  14. Garifullin, M.; Launert, B.; Heinisuo, M.; Pasternak, H.; Mela, K.; Pajunen, S. Effect of welding residual stresses on local behavior of rectangular hollow section joints. Part 2–Parametric studies. Bauing. Z. Fuer Das Gesamte Bauwes. 2018, 93, 207–213. [Google Scholar]
  15. Gadallah, R.; Tsutsumi, S.; Tanaka, S.; Osawa, N. Accurate evaluation of fracture parameters for a surface-cracked tubular T-joint taking welding residual stress into account. Mar. Struct. 2020, 71, 102733. [Google Scholar] [CrossRef]
  16. Jin, D.; Hou, C.; Shen, L. Effect of welding residual stress on the performance of CFST tubular joints. J. Constr. Steel Res. 2021, 184, 106827. [Google Scholar] [CrossRef]
  17. Wu, J.; Qiang, B.; Liao, X.; Kang, L.; Yao, C.; Li, Y. Experimental investigation and numerical simulation of welding residual stress in orthotropic steel deck with diaphragm considering solid-state phase transformation. Eng. Struct. 2022, 250, 113415. [Google Scholar] [CrossRef]
  18. Krishna Murthy, K.R.; Akyel, F.; Reisgen, U.; Olschok, S. Simulation of transient heat transfer and phase transformation in laser beam welding for low alloy steel and studying its influences on the welding residual stresses. J. Adv. Join. Process. 2022, 5, 100080. [Google Scholar] [CrossRef]
  19. Hashemzadeh, M.; Garbatov, Y.; Guedes Soares, C. Hybrid-laser welding-induced distortions and residual stresses analysis of large-scale stiffener panel. Ocean Eng. 2022, 245, 110411. [Google Scholar] [CrossRef]
  20. Zhang, H.; Ouyang, Z.; Li, L.; Ma, W.; Liu, Y.; Chen, F. Numerical study on welding residual stress distribution of corrugated steel webs. Metals 2022, 12, 1831. [Google Scholar] [CrossRef]
Figure 1. Dimension diagram of the RHS-to-RHS Y-shaped connection at the construction site (a) and cross section dimensions of the chord and branch pipes (b) and the welding sequence of the RHS-to-RHS Y-shaped connection (c).
Buildings 14 00157 g001
Figure 2. Arrangement of temperature measuring points on the branch: (a) inner side and outer side; (b) upper side and bottom side.
Buildings 14 00157 g002
Figure 3. The temperature of each measuring point on the inner side (a) and outer side (b) and the welding seams along with the time (c).
Buildings 14 00157 g003
Figure 4. The temperature of each measuring point on the upper side (a), the bottom side (b) and the welding seams along with the time (c).
Buildings 14 00157 g004
Figure 5. A flowchart of the simulation process.
Buildings 14 00157 g005
Figure 6. Numerical model and boundary conditions of the RHS-to-RHS Y-shaped connection.
Buildings 14 00157 g006
Figure 7. Temperature changes at two points using two methods: (a) at a distance of 50 mm from the weld seam; (b) at a distance of 100 mm from the weld seam; and (c) at a distance of 150 mm from the weld seam.
Buildings 14 00157 g007
Figure 8. Two stress paths in the four faces of the branch pipe.
Buildings 14 00157 g008
Figure 9. The residual stress in the four faces of the branch along path 1: (a) longitudinal residual stress; (b) transverse residual stress.
Buildings 14 00157 g009
Figure 10. The residual stress in the four faces of the branch along path 2: (a) longitudinal residual stress; (b) transverse residual stress.
Buildings 14 00157 g010
Table 1. Q345 thermal mechanical properties of steel.
Temperature
(°C)
Coefficient of
Thermal Expansion
(105 °C−1)
Yield Stress
(108 Pa)
Modulus of Elasticity
(1011 Pa)
Poisson’s RatioThermal
Conductivity
(10 W·m−1·°C−1)
Specific Heat Capacity
(102 J·kg−1·°C−1)
Quality
(103 Kg·m−3)
301.13.452.050.354.657.85
2501.222.951.870.34.74.87.85
5001.392.51.50.345.37.85
7501.481.60.70.32.76.757.85
10001.341.450.20.33.16.77.85
15001.331.220.190.33.56.67.85
25001.310.10.120.314.28.27.85
Table 2. The results of welding process parameters for the Y-shaped joint.
Weld BeadWelding Time
(s)
Weld Length
(mm)
Welding Voltage
(V)
Welding Current
(A)
No. 1126071826.8120
No. 290031626.8120
No. 336031626.8120
No. 430031626.8120
No. 566071826.8120
No. 618031626.8120
No. 724031626.8120
No. 824031626.8120
Table 3. The temperature peak value after each weld seam was completed during the welding test (°C).
The Side of
the Branch
Weld BeadPoint 1Point 2Point 3Point 4Point 5Point 6Point 7Point 8Point 9
Inner sideNo. 1164.8157.4129.896.491.781.667.17364.6
Inner sideNo. 5178.2147148.911297.499.98381.180.1
Outer sideNo. 1156.4131135.386.784.485.363.56865.9
Outer sideNo. 5140.7115.7109.695.677.779.37570.667.7
Upper sideNo. 4175.5199160.6113.4116.687.885.3//
Bottom sideNo. 8202.8208178.7138.9113.196.786.1//
Table 4. The temperature peak at each measuring point after each weld seam was completed during the welding simulation process (°C).
The Side of
the Branch
Weld BeadPoint 1Point 2Point 3Point 4Point 5Point 6Point 7Point 8Point 9
Inner sideNo. 1169.2150.3136.192.988.080.877.062.259.0
Inner sideNo. 5169.0150.6137.6108.095.395.083.868.873.0
Outer sideNo. 1163.5141.0141.888.686.480.961.362.061.0
Outer sideNo. 5137.4124.2117.094.681.078.771.964.961.2
Upper sideNo. 4172.2185.0161.2108.8112.083.077.0//
Bottom sideNo. 8202.1197.3179.2133.0116.991.684.0//
Table 5. The relative error of the peak temperature at each measurement point at the completion time of each weld bead under two methods.
The Side of
the Branch
Weld BeadPoint 1Point 2Point 3Point 4Point 5Point 6Point 7Point 8Point 9
Inner sideNo. 12.7%4.5%4.9%3.7%4.1%1.0%5.3%1.2%8.7%
Inner sideNo. 55.1%2.4%7.6%3.6%2.2%4.9%4.6%5.3%8.9%
Outer sideNo. 14.5%7.6%4.8%2.2%2.4%5.2%3.5%8.9%7.4%
Outer sideNo. 52.4%7.3%6.8%1.1%4.2%0.8%4.1%8.1%9.6%
Upper sideNo. 41.9%7.0%0.3%4.1%3.9%5.5%9.7%//
Bottom sideNo. 80.3%5.2%0.3%4.2%3.3%5.3%2.4%//
Disclaimer/Publisher’s Note: The statements, opinions and data contained in all publications are solely those of the individual author(s) and contributor(s) and not of MDPI and/or the editor(s). MDPI and/or the editor(s) disclaim responsibility for any injury to people or property resulting from any ideas, methods, instructions or products referred to in the content.

