Article

Evaluating Indoor Air Quality Monitoring Devices for Healthy Homes

Department of Architectural Science, Toronto Metropolitan University, Toronto, ON M5B 2K3, Canada
*
Author to whom correspondence should be addressed.
Buildings 2024, 14(1), 102; https://doi.org/10.3390/buildings14010102
Submission received: 22 November 2023 / Revised: 11 December 2023 / Accepted: 14 December 2023 / Published: 30 December 2023
(This article belongs to the Special Issue Ventilation and Air Quality in Buildings)

Abstract

:
In light of COVID-19, people are increasingly anxious about indoor air quality data in places where they live and work. Access to this data using a consumer-grade air quality monitor has become a way of giving agency to building users so that they can understand the ventilation effectiveness of the spaces where they spend their time. Methods: Fourteen low-cost, air quality devices marketed to consumers were tested (seven types, two of each product): AirBird, Airthings View Plus, Aranet4 Home, Awair Omni, Eve Room, Laser Egg + CO2, and Purple Air PA-1. The study focus was accuracy and useability using three methods: a low-cost laboratory setting to test accuracy for CO2; a comparison to a calibrated, research grade meter for particulate matter (PM2.5), temperature, and relative humidity; and short-term field testing in a residential environment to understand the quality of feedback given to users. Results: Relating to accuracy, all devices were within acceptable ranges for temperature, relative humidity, and CO2, and only one brand’s results met the accuracy threshold with the research grade monitor when testing PM2.5. In terms of usability, a significant variation in response time and data visualization was found on the devices or in the smartphone applications. Conclusions: While accuracy in IAQ data is important, in low-cost air quality devices marketed to consumers it is just as important that the data be presented in a way that can be used to empower people to make decisions and modify their indoor environment. We concluded that response time, user-interface, data sharing, and visualization are important parameters that may be overlooked if a study just focuses on accuracy. The design of the device, including its appearance, size, portability, screen brightness, and sound or light warning, must also be considered. The act of measuring is important, and more studies should focus on how users interpret and react to building performance data.

1. Introduction

Globally, air pollution, both indoor and outdoor, is one of the most significant health risks for human health and well-being. Over the last decades and especially recently due to COVID-19, there has been a significant number of research studies on the impacts of indoor air quality (IAQ) on people and their health and wellbeing at home. Some main relevant factors for IAQ in buildings are temperature, relative humidity, particulate matter, CO2, and TVOCs [1]. Particulate matter is a combination of liquid and solid particles contained in the air [2] along with gasses including carbon monoxide, carbon dioxide, nitrogen dioxide, and volatile organic compounds that are considered the indoor air pollutants that affect human health [3]. The main ways that that air quality impacts human health is related to inhalation of fine particles [4]. According to the World Health Organization, 99% of individuals in the world live in a place where outdoor air pollution exceeds the recommended levels [5]. PM2.5 is a measure of pollutants in the air and refers to the airborne particulate matter (PM) which includes airborne particles that are less than 2.5 μm [6]. There are different health problems such as respiratory, cardiovascular, and neurologic effects that are associated with the exposure to fine particles [7], even when exposure is under the recommended concentration levels [8,9]. There is a need for non-scientist, building users to be able to identify and act upon IAQ data.

IAQ at Home

Recent research on indoor air quality (IAQ) in buildings has been developed with the focus on prevention, detection and protection systems [10]. Non-scientists are increasingly monitoring IAQ, just as people do with many other health related parameters in their lives such as their sleep, diet, and exercise. When building residents can gain access to IAQ data, they can potentially help to reduce their exposure to unhealthy indoor environments. There are a growing number of commercially available, low-cost, IAQ monitors suitable for residential homes on the market and some studies have tested their accuracy and compared the products. These devices have perceived advantages for consumers, for example they are low cost, can be bought online or in hardware stores, they claim to be accurate, and they claim to be easy to use. They also have perceived disadvantages for consumers, for example they can only measure certain IAQ parameters, they are delicate and should not be dropped, and they do not provide specific information about what to do about poor IAQ. The data detection ranges and performance of these devices vary. Temperature, relative humidity, particulate matter, light, manufacturing consistency, and calibration procedures all affect the overall performance of these devices. There are several studies that will be discussed in the next section about low-cost air quality devices. However, there is limited research on both laboratory and field residential environments for many devices. The research problem addressed in this paper is about the accuracy and useability of these devices in addition to comparing several brands to understand their suitability in residential environments.

2. Background

2.1. IAQ and People’s Health and Wellbeing

The EPA defines IAQ as “the air quality within and around buildings and structures, especially as it relates to the health and comfort of building occupants” [11]. In recent years, IAQ including household air pollution has been recognized as a major global public health concern [5]. Indoor air is significantly more polluted than outdoor air, even in the largest and most industrialized cities [12]. In fact, pollutants may be several hundred to several thousand times higher than outside levels [13]. Buildings with Indoor Environmental Quality (IEQ) including poor thermal comfort and unhealthy IAQ can cause occupants a wide range of health issues which are often called Sick Building Syndrome (SBS) [14]. SBS refers to a condition that affects people who live or work in an indoor environment that causes them to experience many health related problems including headaches, exhaustion, low concentration, and skin irritation [15]. Building design and operational systems control the temperature, relative humidity, circulation, and ventilation, which all contribute to the indoor air quality and also thermal comfort [16]. Insufficient ventilation, chemical emissions from the building materials and mold all affect the IAQ indoor air quality. Currently, IAQ monitors designed for consumers in residential settings measure and monitor a limited number of parameters. There have been some recent studies about consumers using low-cost CO2 monitors as a ‘pandemic hack’ [17] because this method has been proven to not be an accurate way to measure virus transmission risk since this would require knowing how many infected people are in a room. Monitoring CO2 levels in a space can however indicate how effective the ventilation system is, so that occupants can respond to the poor IAQ more easily.

2.2. Current Research on Low-Cost IAQ Monitors for Consumers

There are many studies that have evaluated accuracy in consumer-focused low cost IAQ monitors in recent years. A recent review paper by Sa et al. (2022) identified forty-two recent studies. Some studies have used laboratory tests conducted in a controlled chamber and then compared the results with scientific devices [18]. For example, a recent paper tested the accuracy of a uHoo device in a stable platform within a laboratory setting, specifically testing PM2.5, CO2, CO, O3, NO2 and VOCs. The results indicated uHoo is fairly accurate compared to the scientific laboratory equipment [19]. Baldelli’s study utilized a laboratory platform in a controlled environment that detected both particulate matter and different gasses for three types of monitors from uHoo. The paper only focused on one product, did not provide any field measurement data, and no real time data were measured to compare with the calculations that were done in the laboratory test. In addition, there was a comparison between three different monitors from the same manufacturer, but no comparison between uHoo and other brands of monitors. However, the correlations between uHoo monitors and the reference devices in Baldelli’s paper were determined under indoor environment conditions relevant to this study.
Another relevant study was the one conducted by Demanga et al. (2021) that measured and compared eight low-cost IAQ monitors including AirVisual, Awair 2, Clarity, Foobot, Kaiterra, Netatmo_i, Netatmo_o and uHoo [20]. Even though this study is less than two years old, two of the devices were not available for delivery to Canada at the start of the present study, namely Foobot (discontinued), and Netatmo (out of stock). Demanega et al., found that most evaluated devices underreported particulate matter levels by up to 50%, underreported by around 15% for CO2 responses, and all had low quantitative agreement on VOCs [20]. Demanega et al. found that the Awair 2 had better overall performance among these monitors with focuses on CO2, temperature, relative humidity and TVOC concentrations. However, the study found that low-cost monitors did not provide accurate results when testing TVOCs concentrations, so the authors cautioned that consumers should be aware of the inaccuracies of TVOCs. Their study is relevant to this present work, but it would have been more relevant had they tested multiple units of the same model, and compared their accuracy first before comparing across different products. The study also did not evaluate the temperature or relative humidity accuracy of the devices. Overall, the work by Demanega et al., provided a comprehensive evaluation of the performance of the tested monitors in a laboratory setting in two climatic conditions [20]. This study also reinforced the need to provide field measurements on real-time data responsiveness, accessibility, and availability of the data recordings. Relevant work by Li et al., also tested several low-cost PM monitors including AirVisual, Alphasense, APT, Awair, Dylos, Foobot, PurpleAir, Wynd and Xiaomi in a laboratory chamber with controlled temperature and relative humidity [21]. This study is especially relevant to the current project because it was the only one identified that examined the color display and visualization of the monitors to indicate air quality index for different particle sources against U.S AQI. The authors argued that a potential field study would have been beneficial to test the data quality and visualization.
In conclusion, in the forty-two papers reviewed for this paper, the main findings were that: published papers comparing accuracy go out of date very quickly due to the changing availability of the monitors; there seems to be a focus on accuracy even though this is not necessarily the most relevant parameter in a study for consumer products; and there seems to be a lack of field studies testing how the devices work over time. Some studies have looked at how these devices are used in residential environments [22,23]. Only a few published studies compared multiple units of one device, and only a few compared findings to actual indoor environments to gain an understanding of consumer-specific needs such as smartphone data visualization, and availability of data access. Therefore, the present project addresses this gap to include both an accuracy study, focusing on currently available devices that evaluate at least three IAQ parameters, namely, temperature, relative humidity, and either CO2 or PM2.5; and the testing of them in several different residential indoor environments, notably comparing their performance and measured data ranges, wherein lies the novelty of this research.

2.3. IAQ Standards

It is challenging to definitively measure IAQ because there are few consistent metrics and standards to determine the most comfortable IAQ levels as each person reacts to IAQ slightly differently [13]. In addition, the lengths of time during which people are exposed to certain levels are also a challenge to determine and relate to possible risks. For example, Canadian standards for CO2 exposure is based on a 24 h average [24] even though people are likely to spend much shorter lengths of time at work, school or other spaces. There are a number of guidelines and standards for IAQ. For example, ASTM, ASHRAE, US EPA, and European Union (EU) and Health Canada are some of the organizations that have standards to assess the performance of air monitors [25]. WELL (v2) and RESET (v2) are some standards used in industry to meet IAQ certification requirements for healthy buildings. Compared with WELL [26], RESET has stricter requirements for air pollutants excluding CO [27]. RESET Air standard considers factors including the performance of the monitor, the deployment, installation, and calibration specifications, as well as the needs for data reporting and data platforms. The standard also establishes benchmarks for indoor air quality (IAQ) daily performance that can be verified by a third party [27]. Carbon dioxide, particulate matter and TVOCs are covered in the majority of standards as these are the main parameters. The indoor CO2 concentration levels in an interior are normally determined by the following three main factors: the outdoor CO2 concentration; indoor sources of CO2; and the rate of removal or dilution of indoor CO2 with outdoor air by ventilation [1]. Table 1 shows relevant standards and guidelines consulted in this study.

3. Methods

This study compared the accuracy of seven types of commercially available, low-cost air quality devices based on accuracy of readings for CO2, PM2.5, temperature, and humidity; and responsiveness and data visualization of the app for consumer use. The methods used are (1) Accuracy: testing the devices in a laboratory setting, comparing the devices to each other, and comparing the devices to high quality research grade devices; and (2) Responsiveness and Data Visualization: a short field study with three scenarios of the devices in a residential setting to show applicability to consumers in residential settings.

3.1. Devices Selected for Testing

Thirty commercially available low-cost indoor air quality monitors were identified and reviewed for this study (see Table 2). Candidate monitors were identified from multiple resources, including published papers and internet searches. In particular, the review papers by Demanega et al. (2021) [20] and Li et al. (2020) [21] listed many relevant devices. Several devices tested in those studies are no longer available, such as Foobot, Speck, and Air quality Egg 2, which are discontinued. To identify monitors for this project, devices were also identified by searching internet marketplaces with the search terms “home air quality monitors”, “residential air quality monitors”, and “indoor air quality”. Devices were then shortlisted for further analysis, and the basis for inclusion in the study is that they met these criteria: the device must (1) measure at least three air quality parameters; (2) be marketed for indoor residential use by consumers; (3) both display real-time data, and log data for several days using a smartphone device via a mobile app; and (4) be available for retail purchase in Canada at a cost of under $400 CDN exclusive of tax or shipping cost.
From this initial list of thirty devices, some were excluded because they are no longer being produced (such as Foobot [49]), or because they only test 1 or 2 parameters (such as Dylos [46] and M10 [52]). Thirteen were identified as having met the study criteria and from this, a decision was made to focus on the 7 devices that were in stock, and that we were able to be received in time for the study timeline. It was decided that testing and comparing seven different devices, two of each type, was sufficient due the length constraint of the study. Table 3 lists the seven IAQ monitors tested in this study along with some relevant information including which parameters they measure. The device accuracy ranges were specified by the respective manufacturers.

3.2. Methods for Testing Accuracy in the Laboratory Setting

In this study, temperature, relative humidity, CO2 and PM2.5 were the four parameters that were tested in a laboratory setting for accuracy. These are suitable parameters for this study because these are parameters used in most of these devices, and they are relevant in consideration of IAQ in residential settings. Laboratory tests are known to be fundamental to determine response time, limit of detection, and the linearity of response [19] The laboratory tests conducted in this project were focused on accuracy but also evaluated responsiveness, as well as visualization of visual feedback and warnings from the devices. All devices came already calibrated except for the Aranet4 Home and AirBird which need to be calibrated manually. This study tested two of each selected device to enable comparison among the devices.
  • The first phase of accuracy testing was conducted to evaluate and compare temperature and relative humidity in the 14 devices. The data was collected on 7 July 2022 and 21 July at a Canadian university Building Science Lab. The study used Lighthouse Handheld-3016-IAQ, a research grade temperature and humidity monitor, to measure temperature, relative humidity, and PM2.5 in the lab. This was also used to compare the data with the real-time data from devices taken 4 times, then calculated the average results from it. Its temperature accuracy is ±0.12 °C, −0.8% of RH, and it responds to the environment every 1 s [63].
  • The second phase of accuracy testing was conducted in the same building science laboratory to evaluate and compare CO2 accuracy in the devices. Materials used in the lab included a clear plastic bag that was placed at a minimum of 0.9 m above the ground, and CO2 injection with concentration of 5000 ppm, see Figure 1.
Temperature and relative humidity were recorded before the test for all the devices. The devices were placed into a plastic bag, then inside air was pushed out to reach “zero air” inside, then we sealed the bag to ensure an enclosed environment. CO2 was injected into the bag. The average tested temperature for all experiments was 22.8 C (±0.12 °C), and the relative humidity was 43.7% (±0.8%). We recorded the data readings and visualization displayed in all devices at the start, then every 3 min until 20 min, and at 30 min (10 min after the injection was stopped). For each device, data was logged and able to be viewed both through the app and via the computer dashboard. In the background research we found that there are three types of CO2 sensors to measure CO2 including non-dispersive infrared sensors (NDIR), electrochemical sensors, and metal oxide semiconductor sensors (MOS) [64]. To be more specific, NDIR sensors detect the amount of CO2 in the air by utilizing the light wavelengths, and they work well at around 1000 ppm CO2 ranges, but might be affected by humidity and temperature; electrochemical sensors detect electrical current to monitor CO2 in the air, and this method is less sensitive to humidity and temperature, but does not last as long as NDIR; and MOS CO2 sensors employ the resistivity of metal compounds to measure the amount of gas in the air; these are easy to use and detect with high accuracy, but are less commonly used because the CO2 detection level starts at over 2000 ppm [64]. Therefore, the NDIR sensor is the optimal device to choose. According to their respective manufacturers, all the monitors tested in this study used NDIR sensors.
3.
In the third testing phase, the accuracy of PM2.5 was tested by comparing readings to the Lighthouse Handheld-3016-IAQ. This tool also allowed for cumulative and differential particle count data as well as temperature and relative humidity data. This research device was selected for the study due to its high accuracy and reliability. It tests for particle size range of 0.3–10 μm, and the approximate mass concentration is measured in μg/m3. It can indicate 6 particle sizes simultaneously, and has an easily configurable interface with a color touch screen. Handheld-3016-IAQ can measure 10 cycles at a time and each cycle is 1 min [63]. The laboratory test tested for 3 cycles.
This study did not evaluate the accuracy of the monitors in terms of Total Volatile Organic Compounds (TVOCs). TVOCs are often released in the form of gas from specific solids or liquids in the built environment. Paint, adhesives, sprays from cleansers, air fresheners and other building materials, furniture and equipment can release TVOCs [25]. The reason for not including this parameter in the test is because it is complicated to measure compared to other parameters [65]. TVOCs sensors have different sensitivity to various VOC sources, depending on the environment [20]. The current limitations of the technologies in use cannot measure time resolved TVOCs [66]. Professional grade sensors have produced similar results to the laboratory air sampling which had been calibrated, but low-cost monitors have indicated poor relationship under different environmental testing conditions 17]. For these reasons, this present study did not evaluate the accuracy of TVOCs in the devices.

3.3. Testing Devices in a Residential Setting for Responsiveness and Data Visualization

Field Measurement Methods in Residential Building

The field measurements involved the installation of the devices in a residential environment to enable the observation and evaluation of visual feedback and responsiveness. The study site was a house located in Toronto, Canada. The house type is a two-story semi-detached house constructed in 2004. The outdoor pollution levels around the site were relatively low. The tests were carried out for six weeks in July and August 2022. The tests were done with natural ventilation and no air conditioning. Each room tested in the house had exterior sliding windows that were open for 8 h per day. The 14 devices were placed in three different spaces including living space, bedroom and kitchen area across the house. There were 4 occupants in total, and 2 occupants shared one bedroom. All devices were placed at the minimum installation height of 0.9 m and the maximum installation height did not exceed 1.8 m. Three different environment scenarios were tested inside the house based on these sources: (1) closed window and door with no ventilation; (2) closed window but opened door as external ventilation; (3) opened window and door with cross ventilation. The main CO2 emission sources were the occupants in the rooms.
Studies have shown that air quality can be influenced by combustion sources such as oil, gas, kerosene, coal, wood; by building materials; and also by furniture made from wood products, cleaning products, central heating and cooling systems, outdoor air pollution, etc [11]. Some published studies have recreated typical residential behaviors in laboratory settings, testing how fast and accurately IAQ monitors react. For example, Demanega et al. (2021) tested devices for accuracy in several different ‘test scenarios’ such as candle burning, wood lacquer drying, and carpet vacuuming [20]. For this present study, several typical scenarios were considered to test responsiveness and data visualization. The devices recorded data for three activities (with one person in the space: (1) snuffing out a candle in the living room (no windows open); (2) exercising in the bedroom (with a window open but no mechanical ventilation); (3) cooking in the kitchen space (no windows open, no exhaust fan). Rather than focusing solely on accuracy, the data responsiveness and the visualization of each device were also recorded and compared.

4. Results

This section summarizes findings of the study results comparing the 14 IAQ devices for (1) accuracy; (2) responsiveness and data visualization (Table 4). The main findings were that all the monitors tested can be considered accurate in terms of temperature and relative humidity; AirBird and Araent4 Home are not as accurate as other devices when testing CO2; and that only one of the tested devices recorded accurate measurements for PM2.5 when compared to a reference meter. Purple Air-PA-I results were within in its published accuracy range.
A main goal of this research was the comparison of the 14 devices in terms of accuracy. The study showed that all of the monitors tested were accurate for temperature and CO2, because their results were within the accuracy ranges identified in their respective product literature. Specifically for accuracy for CO2, the most accurate devices are listed as follows: Laser Egg + CO2 was the most accurate, then Airthings View Plus, Awair Omni, AirBird, and Aranet4 Home. It is worth noting that the published accuracy threshold ranges varied from product to product. For example, Laser Egg + CO2 had the smallest threshold range, ±30 ppm. When comparing with the same device for each product to see if they are consistent, AirBird and Aranet4 Home had the greatest discrepancy, because on more than four occasions, the results were not within the accuracy threshold. The devices were tested a second time for these two devices after analyzing the initial test results. In these second tests, AirBird and Aranet4 Home still displayed results on more than four occasions that were over the accuracy threshold. In terms of the relative humidity, only Airthings, Eve Room and Purple Air PA-I tested within the accuracy range; AirBird tested once within its range; Aranet4 Home and Laser Egg did not meet their respective accuracy ranges. For PM2.5, most of the devices did not meet the expectations for accuracy. All of the devices did not provide accurate PM2.5 data when compared to the research meter, Lighthouse Handheld-3016-IA. Only Purple Air PA-1 was able to meet its own threshold range.

4.1. Summary of Results for the Selected Devices

In the laboratory testing for CO2, the results at 15–20 min and 20–30 min were the significant time stamps to discuss and compare accuracy both between two of the same branded devices, and among the tested devices. This is due to the fact that the CO2 concentration should be relatively stable at around fifteen minutes. During the testing, the twenty-minute mark was where the injection of CO2 stopped and this was therefore a significant reference time to compare accuracy, as the data between two devices should gradually return to the threshold range. In the results, it was noted that the manufacturer’s accuracy thresholds varied among the devices, for example, Airthings View Plus CO2 is +/− 50 ppm and Laser Egg + CO2 is +/− 30 ppm.
The study compared the two devices for each product and compared the seven products together (Table 5).
The comparison methods use the specific accuracy range for each product as a baseline. Each graph indicates two curved lines for the eight times CO2 data was collected. The reference line indicates when there was no difference between two products, and the bias line shows the difference between each device at different tested times. When compared with other products, different accuracy ranges also varied and need to be discussed further. Note that Eve Room only tested temperature, relative humidity and TVOCs, therefore discussion about CO2 did not include Eve Room. Table 5 presents a statistical analysis from the actual vs fitted graph and the linear graph was generated from the statistical software based on the data from the first and second devices. p-value indicated with ***, represents the statistical significance, which means the two devices are significantly correlated. The closer the coefficient number was to 1, the better the performance of two devices was. The closer R2 (0 <= R2 <= 1) approaches 1, the better the performance of the devices. The lower the constant value, the lower the accuracy difference (bias) between two devices, the better the device performance. Tests at the end were also beneficial and are to be discussed in the next section as the CO2 concentration level should be stable and the accuracy range should be relatively reduced.
The results for PM2.5 are shown in Table 6. The table shows the findings from the lab testing of each of the devices compared to the reference research-grade meter.
The following section will explain the accuracy results for each device. As stated previously, all devices tested CO2 readings within their accuracy threshold (the data is within the range at least for one tested time). However, this section reports on which device was the most accurate for each of the four tested parameters.
AirBird: According to the manufacturer specifications [31], the range of CO2 measured by the device is from 0 to 5000 ppm, and the accuracy is ±30 ppm or ±3% for each reading. For temperature, it is from −20 to +60 °C, with an accuracy of ±0.5 °C. RH measured by the device is from 1 to 99% with a ±3% accuracy. When the AirBird average accuracy performance was compared to other devices, there are four times when data between the two devices aligned with the accuracy range and performance graph (Figure 2). Accuracy ranges varied among the devices, and therefore this needed to be considered. AirBird and Laser Egg + CO2 shared the same range, which was +/−30 ppm and their CO2 performance was the best since it was accurate across the eight tests. Statistical analysis was also conducted (Table 5), and the two devices from AirBird indicated a neutral correlation between each other compared with other devices. The devices had a relatively lower constant number, 21.0552 (according to the formula), compared with the device accuracy difference of 30 ppm. Therefore, results from both the accuracy performance graph (Figure 2) and statistical analysis (Table 5) consistently indicate that the two devices performed a better average accuracy than other devices. However, one of the two devices was not within the accuracy threshold for temperature or relative humidity.
Airthings View Plus: According to the manufacturer specifications [37], the range of CO2 measured by the device is from 400 to 5000 ppm, and the accuracy is ±50 ppm. For temperature, it is from 10 to +35 °C, and the accuracy is ±0.5 °C. RH measured by the device is from 0 to 80% with ±3% accuracy. Based on the device performance graph (Figure 3), Airthings View Plus devices were accurate when testing CO2, temperature, and relative humidity; and comparison with other devices was presented in Table 4. Based on the statistical analysis conducted (Table 5), the two devices from Airthings View Plus indicated a strong correlation between each other compared with other devices. The devices had the lowest constant number, 2.928 (formula), compared with the device accuracy difference of 50 ppm.
Aranet4 Home: According to the manufacturer specifications [40], the range of CO2 measured by the device is 0 to 9999 ppm and the accuracy is ±30 ppm, or ±3% for each reading. For temperature, it is from 0 to 50 °C, with an accuracy of ±0.3 °C of reading. RH measured by the device is from 0 to 85% with a ±3% accuracy. When the Aranet4 Home average accuracy performance was compared to other devices, there were four times when data between the two devices did not meet the accuracy range. By contrast, Airthings Views Plus, Awair Omni and Laser Egg + CO2 met the accuracy across all eight tests. Based on the statistical analysis conducted (Table 5), the two devices from Aranet4 Home indicated a weaker correlation between each other compared with other devices. The devices had the highest constant number, 77.01 (formula), compared with the device accuracy difference of 30 ppm. Therefore, results from both the accuracy performance graph (Figure 4) and statistical analysis (Table 5) consistently indicated that the two devices performed with less average accuracy than other devices. In addition, the two devices were not within the accuracy range either for temperature or relative humidity.
Awair Omni: According to the manufacturer specifications [42], the range of CO2 measured by the device is 400 to 5000 ppm and the accuracy is ±75 ppm or ±10% for each reading. For temperature, it is from −40 to 125 C, with an accuracy of ±0.2 C. RH measured by the device is from 0 to 100% with a ±2% accuracy. Based on the device performance graph (Figure 5), Awair Omni performed accurately when detecting CO2 every time. Based on the statistical analysis conducted (Table 5), the two devices from Awair Omni indicated a strong correlation between each other compared with other devices. The devices had the second lowest constant number, 8.48 (formula), compared with the device accuracy difference of 75 ppm. Therefore, results from both the accuracy performance graph (Figure 5) and statistical analysis (Table 5) consistently indicate that the two devices performed a good accuracy compared to other devices. However, one of the two tested devices was not within the accuracy range for temperature and for PM2.5. In addition, both devices did not meet the accuracy range for relative humidity.
Laser Egg + CO2: According to the manufacturer specifications [51], the range of CO2 measured by this device is from 400 to 5000 ppm (±30 ppm or 3%). For temperature, it is from −20 to 100 °C, with an accuracy of ±1 °C. RH measured by the device is from 0 to 99% with a +/−1% accuracy. PM2.5 range is from 0.3 to 10 µg/m3. Based on the device performance graph (Figure 6), Laser Egg + CO2 devices performed an accurate measurement of CO2 comparison between two devices. One of the two devices was not accurate when detecting temperature. Based on the statistical analysis conducted (Table 5), the two devices from Laser Egg + CO2 indicated a strong correlation between each other compared with other devices. The devices had a low constant number, −24.579 (formula), compared with the device accuracy difference of 30 ppm. Therefore, results from both the accuracy performance graph (Figure 6) and statistical analysis (Table 5) consistently indicate that the two devices perform with high accuracy compared to other devices. However, the two devices did not give results within the accurate range for relative humidity. In addition, the two devices were not within the accuracy range to detect PM2.5.
PurpleAir PA-I: According to the manufacturer specifications [56], the accuracy threshold range of temperature is from −40 to 85 C. RH measured by the device is from 0 to 99% with a +/−3% accuracy. PM2.5 range is from 0.3 to 500 µg/m3. This device does not test for CO2. Based on the test conducted in the lab, PurpleAir PA-I performed relatively accurately for PM2.5 both in terms of the devices’ accuracy range, and also in terms of best correlation with the reference meter. The PM2.5 comparison data was extracted from the four-test average data in the lab environment. In addition, the two devices also tested accurately for temperature and relative humidity.

4.2. Field Studies

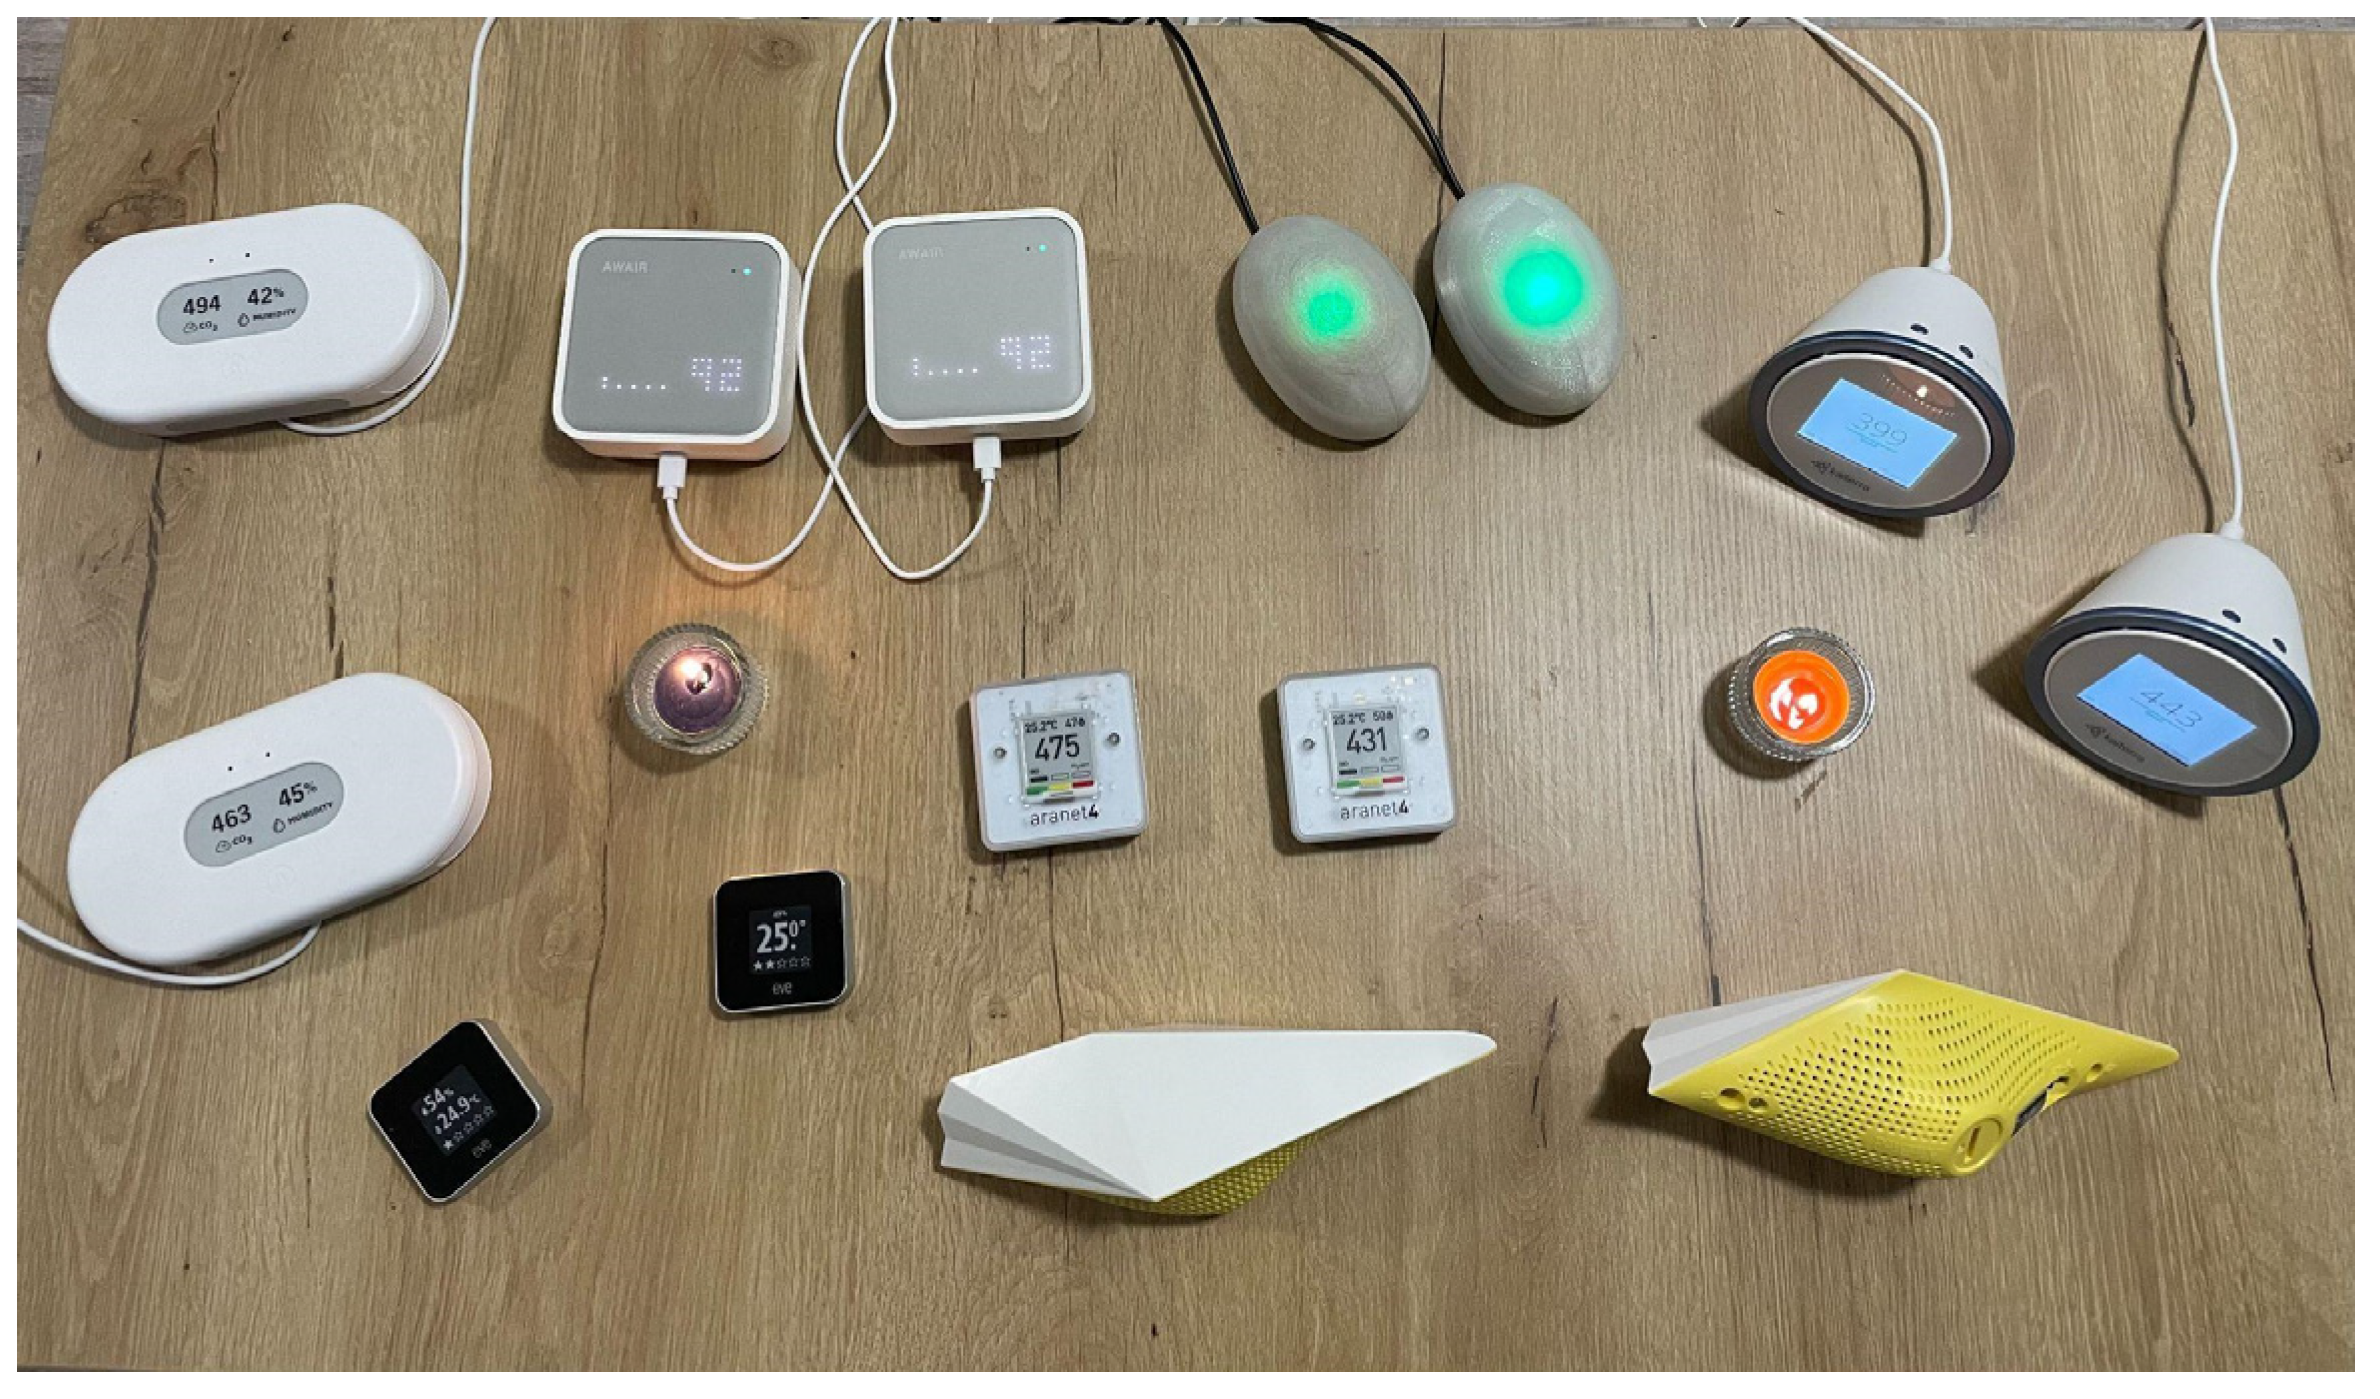
The study included field testing where three scenarios were used to show the devices’ responsiveness, visualization, and ease of use in residential spaces. These studies were not completed in a laboratory, and instead were carried out in a house as indicated in the methods section. The location of the devices inside their rooms was important because the devices must be placed near to where people would be breathing: thus, in the living room, they were placed on a coffee table; in the bedroom, they were on the floor near a yoga mat while a person exercised; and in the kitchen, they were placed on a table.
Scenario 1—Living Room: Snuffing out a candle
In scenario 1, there was one small window opened in the living space for outdoor ventilation without A/C. Two candles were placed in the center of the coffee table among the fourteen devices (see Figure 7).
The findings relating to CO2 showed that the levels did not change significantly after 30 min. The reason might be that the testing time was too short or that the size of the candles was relatively too small to provide enough CO2 in the environment. Results of Scenario 1 are presented in Table 7 and Table 8.
Snuffing out the candles triggered a high concentration of PM2.5. The seven devices provided responses differently, and only Airthings View Plus pushed the notifications to the phone and indicated red warnings on the display. The light was indicated as orange/red on the Awair device, and its App indicated poor IAQ. In addition, Purple Air indicated red warnings on the device (Figure 8), but there was no direct data access available via phone, and data can only be viewed on the airmap.
In the case of Laser Egg + CO2, it did not provide an accurate response as its display continued to indicate good air quality and no change occurred to reflect the higher PM2.5 concentration level.
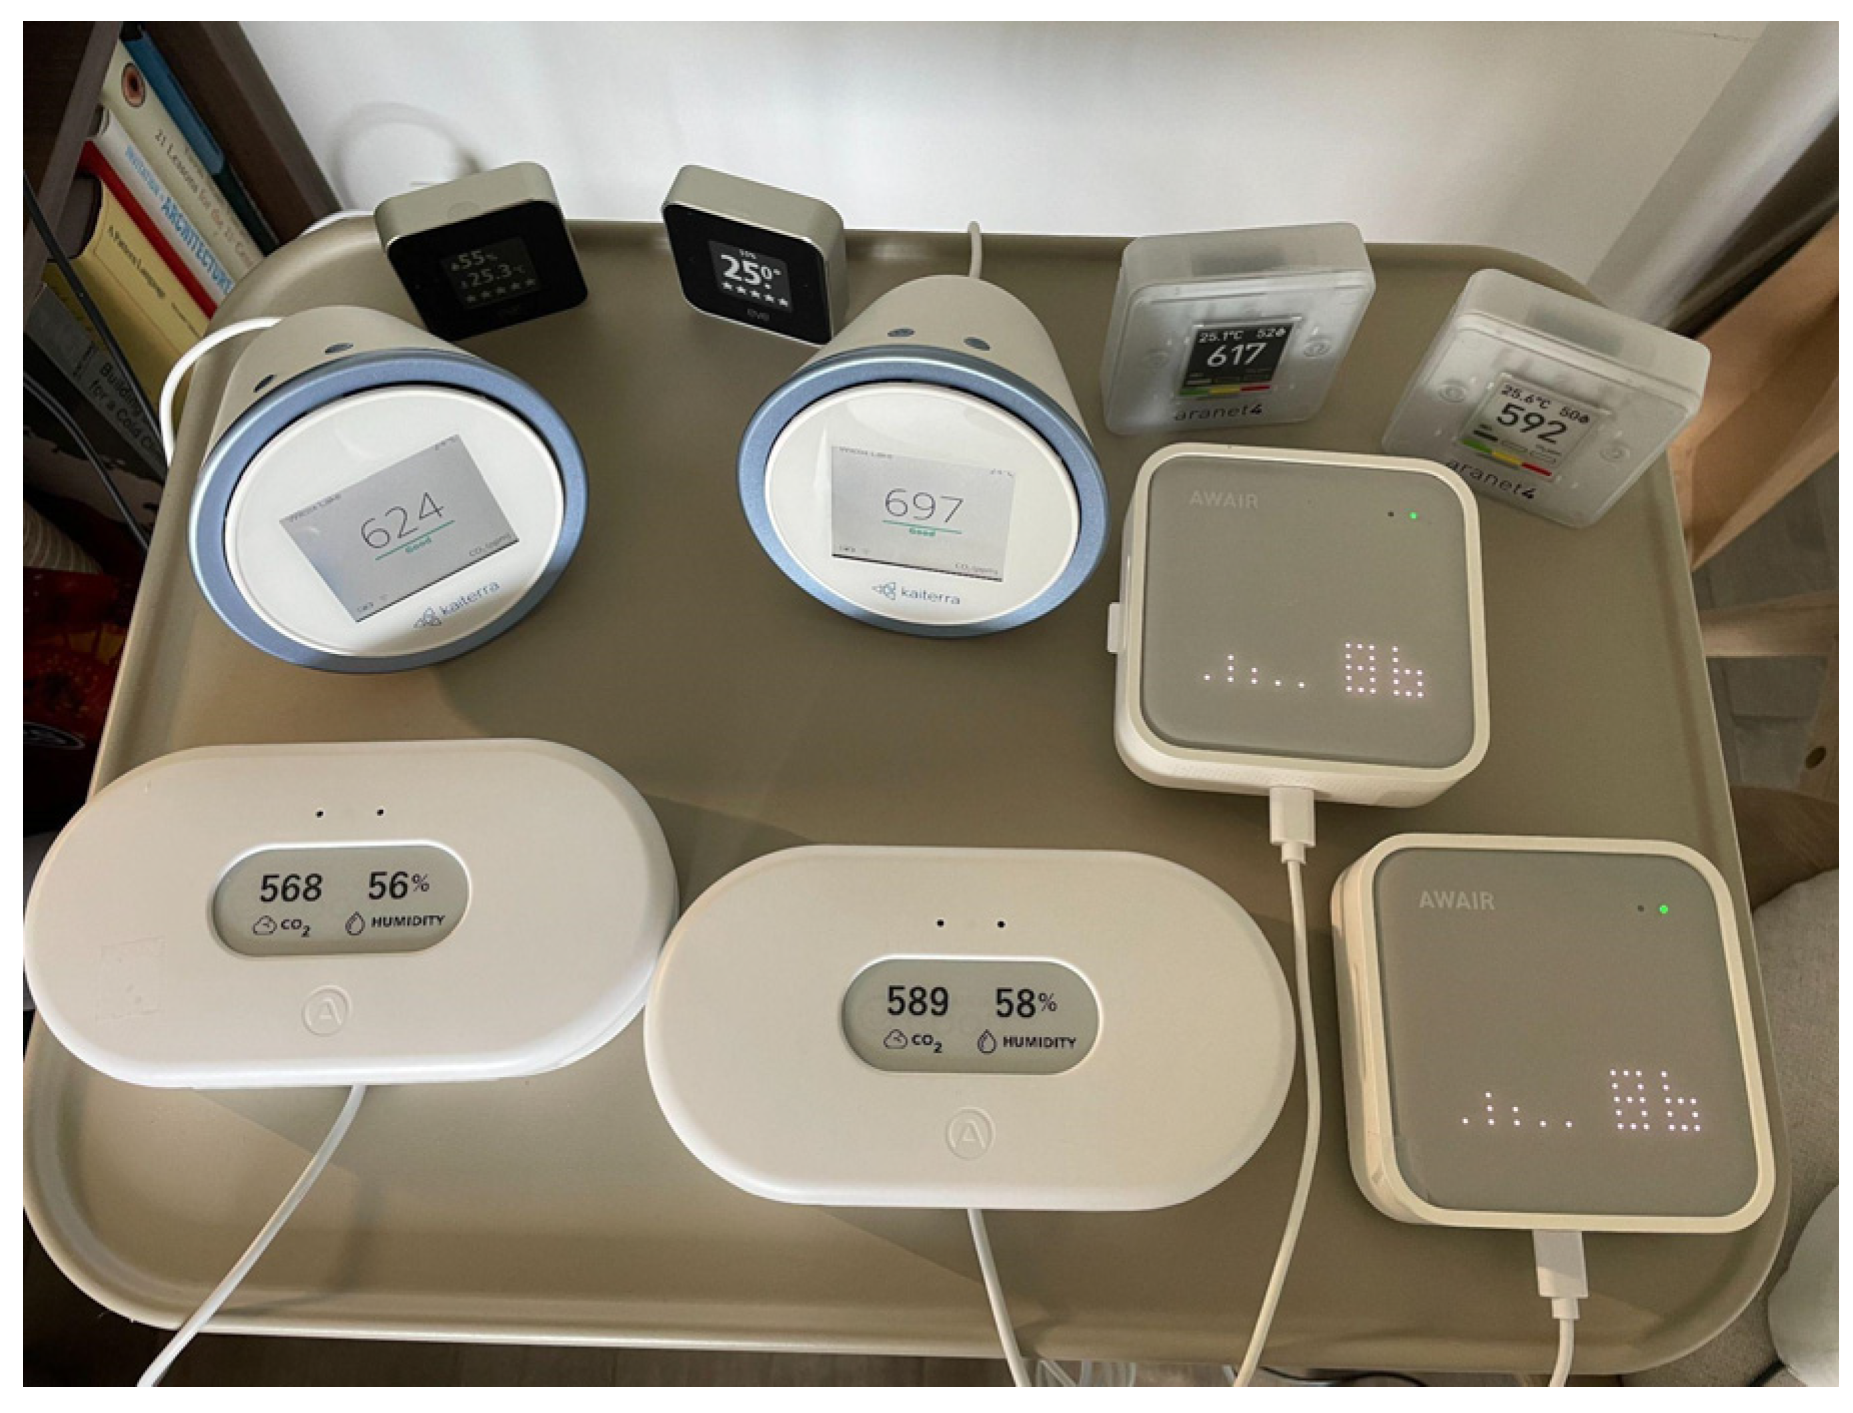
Scenario 2—Bedroom: Exercising indoors for 30 min
Scenario 2 was located in the bedroom on the upper floor with one window open, and the door closed. The devices were placed beside the yoga mat and the initial air quality was measured as good at 440–460 ppm of CO2 (See Figure 9).
One person exercised for thirty minutes in the room. It was observed that at around 20 min, the CO2 concentration in the room started to exceed 1000 ppm. Although the window was open to allow air circulation into the space, the release of CO2 from a person breathing and moving around was relatively high showing that the ventilation system needed improvement. The results of Scenario 2 are presented in Table 9 and Table 10.
In Scenario 2, the Airthings View Plus had the most responsive phone notifications when the temperature and CO2 levels were elevated (Figure 10). The related App also responded with the potential health problems associated with the poor indoor CO2, temperature, relative humidity, and PM2.5. The Awair Omni also had orange/red notifications on the device at around 20 min (Figure 11), and the changing CO2 levels and temperature were shown on opening of the Smartphone Application. Each device communicated IAQ data, for example the Awair Omni App displayed colours to show IAQ data, from green to orange then dark red (1 to 2000 ppm) for CO2 and to illustrate changing temperatures, 18–25 °C was indicated in green with good healthy IAQ and temperatures the ranges 9–18 °C and 25–34 C were indicated as poor IAQ. At the 20 min mark, Aranet4 Home indicated green (CO2 below 1000 ppm) (Figure 12) thus no notification was shown on either device or phones, and no health threshold was indicated in the App. Only one of the tested devices provided both IAQ data and information about the impacts. Awair Omni provided both data ranges and related potential health problems listed in the App to help users understand the impact of poor IAQ. This was a unique function that other devices did not provide.
Scenario 3—Kitchen: Cooking without using an exhaust fan
Based on a published study by Wang et al., this scenario tested three activities that take place in residential environments: frying garlic, steak and also using an air fryer to cook bacon [35]. In scenario 3, a small window above the sink in the kitchen was open halfway to allow outside ventilation, but no exhaust fan or air conditioning was used. IAQ devices were placed on the counter island (at table height) that was across from the stove because there was not enough space to place fourteen devices on the counter beside the stove (Figure 13).
The Scenario 3 observation occurred and data was recorded for (1) the initial setting, (2) during cooking (at 15 min) and (3) after cooking (at 30 min). The initial hypothesis was that there would be a substantial increase in CO2 and PM2.5 levels during cooking. However, the CO2 level did not change very much during the 30 min test. Table 11 and Table 12 summarize the results of Scenario 3.
The use of the air fryer had the highest impact on the PM2.5 levels. Airthings View Plus, Awair, Purple Air all responded quickly to the increasing PM2.5 concentration by changing the color code on the devices. In contrast, Laser Egg + CO2 did not respond, and when the other devices responded to the changing CO2 and PM2.5 levels, it still indicated good air quality inside the space.

5. Discussion

The study sought to answer if the devices are accurate compared to scientific instruments, and overall, the answer is yes for CO2. All of the tested devices were within their stated accuracy thresholds for CO2. However, there are important other factors to consider. Each company published different acceptable accuracy ranges and this was a factor when seeking to compare the relative performance of the monitors. In this regard, AirBird and Laser Egg + CO2 had the strictest accuracy ranges, which were ±30 ppm for CO2. Reliability and consistency in producing accurate results was also a factor. Seven brands, two of each type, were evaluated, and all devices were tested multiple times to see if they produced consistent readings within the brand of monitor. Among the devices tested, Laser Egg + CO2 performed the most reliably as the two devices of this brand tested had high consistency in eight tests. Among the 14 units tested, when comparing the responsiveness and visualization of the devices, all devices provided basic response but a different visualization between device display, Smartphone App and computer dashboards.
In the residential testing scenarios, all of the devices did not record the elevated CO2 levels expected when burning candles in Scenario 1 (Table 7). Some possible reasons for this could be to do with the setup of the experiment, including the small number and sizes of candles. Also, only one day was tested and there could have been high temperature and humidity conditions on the day that could have caused the low responses. When snuffing the candles out, Airthings View Plus, Awair Omni, and Purple Air PA-I had similar sensitivity with different visual reaction responses (Table 7). However, Laser Egg + CO2 did not record PM2.5 accurately in either setting. All devices indicated moderate level of responsiveness for CO2 and PM2.5 during Scenario 2 when cooking occurred (heating oil, frying, and stir-frying). The results of this study show that these devices still have limitations, although it is crucial to recognize that even professional scientific grade devices may have similar challenges in these scenarios.
The following discussion sections consider issues beyond accuracy, and examine possibly consumer-specific concerns such as portability, data visualization and feedback, as these parameters are part of why these devices are marketed to consumers, who may use these devices in their homes.

5.1. Considering Portability and Visualization

Consumer grade air quality monitors for residential environments are normally powered by plugging the device into the wall. Portability is a factor that is not normally considered in similar studies, but for consumers using a product like this in their home, this could be important. Although all the tested devices are lightweight and small, the majority of devices tested need to be plugged in at all times to record the data, and only AirBird, Aranet4 Home and Eve Room did not require being constantly plugged in to a wall. Particularly for scenario 3 in the kitchen area, it was challenging to find an appropriate location to place the devices that need to be plugged in. It required extra space to provide a safe distance from the stove and to not interfere with other activities occurring in the kitchen. AirBird is designed to be mounted on the wall, so it was not convenient to carry this device to different spaces. Battery powered devices without plugs such as Aranet4 Home may have an advantage and may be more appropriate as a consumer option for use in the kitchen area. Another factor observed in the field testing was the design of the monitor. Most of the tested devices have a flat base so the device sits on the counter easily and does not roll around. Stability is a concern because the devices are fragile. The round design of Laser Egg + CO2 was unusual in that it did not have a flat base and it tended to roll around on the counter and it seemed like it could drop or break more easily than other devices with flat bases. Another observation about the devices is that the Purple Air PA-I appears to be more fragile due to the design of a cover with an unfinished base exposing a battery underneath.
Visualization of data may also be an important criterion from a consumer perspective. In this study, it was observed that there are a number of different ways of visualizing the data. For example, a blinking or red warning light on a device is a typical design feature to indicate poor IAQ, and this was used in the AirBird, Airthings View Plus, Awair Omni, and Purple Air PA-I. However, Aranet4 Home, Eve Room and Laser Egg + CO2 do not have a warning light and instead display numbers on their device (Table 7, Table 8 and Table 9). The numbers displayed on a device might not be as compelling as the warning light or “good” and “bad” text. There could also be an issue with how to interpret the colors or text. For example, Purple Air PA-I had no words or numbers and only indicated a color code of just green, yellow and red, and to interpret these colors, the consumer would need to open the Airmap application. AirBird also provided sound warnings for poor IAQ and was the only device that made noise.

5.2. Accuracy, Responsiveness and Feedback

During the lab testing, differences in how the various devices provided feedback were immediately apparent. There were differences in how quickly they reacted, and in the quality of the visual notifications. Based on the field study results, Airthings View Plus indicated poor IAQ relatively faster than the others and their Smartphone App gives descriptions of air quality issue and describes the implications of the unhealthy levels and explains possible solutions (Table 4). Awair Omni indicated poor IAQ with warning lights and additional information about health-related issues due to poor IAQ can be seen in the Smartphone App. Purple Air PA-I only indicated a warning light, and the device does not show any numbers since there is no screen. Additional data can be accessed from the Smartphone App which compares reported IAQ in nearby buildings, with data about the outside air quality at that location. This feature by Purple Air may be helpful if consumers want to compare feedback from IAQ devices with conditions outside. Understanding the CO2 level just with color coded warnings as shown in the PurpleAir device seems simple and effective to provide feedback to consumers so as to respond to an unhealthy indoor environment rapidly. When selecting a consumer-based device, rapid device responsiveness and speed of notifications sent to the Smartphone are also important because consumers can react to the IAQ feedback faster.

5.3. Personal Preferences and Resident Behavior Matter in Consumer Products

Personal preferences are inevitable when selecting the consumer-grade monitors. This study did not evaluate non-performance aspects such as device design, packaging design or advertising campaigns. Considering performance, a main finding of this study is that while accuracy is important, other aspects are also important to consumers, and these became evident during the field studies. These parameters include speed of response time, quality of data visualization, speed of Smartphone app notification and access to a data dashboard (providing long term trends). All the tested consumer-grade monitors performed well (aside from PM2.5), and they all responded to the daily activities tested in the scenarios as air quality changes inside of the residential home. They each provided responses with different ways of alerting building users about the data. AirBird was the only device that provided sound warnings, but the sound seemed too quiet and gentle to refer to poor IAQ. Only Airthings View Plus and Awair Omni described the potential related health problems from the Smartphone App that consumers can consult to help interpret the results. If a consumer would like to compare the IAQ with building performance standards, they can use Awair Omni’s health threshold as it is based on the WELL v2 standard (Table 1). Awair Omni can be used to achieve a variety of green building certifications and credentials such as RESET, WELL, Fitwel and Living Building Challenge. This means that for the Awair Omni, the warning lights and notifications from this device were more often triggered more frequently than the others because WELL v2 standard has lower ranges for IAQ. There are different thresholds that the devices used to determine what is good or poor IAQ. Based on the three scenarios conducted in Section 4, certain devices are suitable if consumers prefer less notifications and responses, but still want to monitor the indoor environment based on ASHRAE standards. For example, Aranet4 Home only changes its color from green to yellow once the CO2 reaches over 1000 ppm, and there are no additional health related notifications or solutions provided for this device. Similar to Laser Egg + CO2, it only indicates good/bad air quality in the display without further color or sound warnings. In addition, for some devices, the method of indoor monitoring was to place the devices in a single place at home, whereas some, such as Aranet4 Home, can be carried around to other different indoor environments. None of the tested devices are marketed to be carried around to public indoor spaces. Overall, in the field studies it was observed that the devices seem fragile and the authors note that there were warnings on all of the boxes that people should take care not to drop them as they might break.

5.4. Consumer Needs and IAQ

This study did not aim to determine standard consumer perspectives for IAQ, but it does seem that faster response times for IAQ data updating to register on the devices are should be the goal. The devices are designed to detect poor IAQ and poor ventilation systems, and to enable building users to react to the situation so this response time is important. In this study, the devices reacted differently to poor IAQ. For example, the AirBird took about 10 min to respond to the changing environment during field testing. Laser Egg + CO2, Awair Omni, and Purple Air PA-I responded to the different scenarios relatively faster (Table 7, Table 8 and Table 9). Immediate notifications and potential health related issues were indicated by Airthings View Plus and Awair Omni, which provided valuable responses to consumers in their Smartphone App, and may provide consumers a better understanding of what to do about their current air quality. In addition, Purple Air PA-I has the function to share the data and access outdoor IAQ from the air map, Since outdoor air pollutants often affect the IAQ, being able to compare indoor PM2.5 vs outdoor also decreases the risk of exposure to poor air quality. It is difficult to know exactly what future consumers might want but this study did provide observations that suggest that future consumer-grade monitors might focus on mobile or portable IAQ monitors. We did not find any wearable technologies to study in this research, and in future perhaps companies will incorporate monitors into Apple watch or Fitbit since some monitors are dedicated for stationary use, and difficult to carry around to certain environments. Wearable monitors may also be helpful in indicating poor air quality for both indoor and outdoor allowing consumers to react to their environment.

5.5. Data Collection and Interval

The quality of the data interface and the number of days of stored data that can be accessed are other factors to be considered when evaluating the performance in terms of relevance to consumers. Airthings View Plus, Awair Omni and Laser Egg + CO2 each provided a computer dashboard interface that was user-friendly and intuitive (although required use of a computer not a smartphone). Purple Air PA-I also provide a link to data from a map where it can access data from the registered devices, so it crowdsources more data than the other devices. However, this Purple Air PA-I interface was hard to use and data cannot be downloaded into excel for further comparison with other devices. AirBird, Aranet4 Home, Eve Room do not provide the dashboard interface and data can be accessed from the Smartphone Apps only.
Historical data trends can help occupants to monitor the relationship between daily activities and IAQ, and thus to help them change behaviors or adopt different approaches to reduce poor IAQ. All devices stored their data for different lengths of time. Airthings View Plus and Awair Omni can store the historical data for free, but Awair Omni required users to pay an additional fee to maintain the length of data storage. Dashboard interface with longer days to store the data could be crucial factors for some consumers as they select the devices. Further evaluation could also include long-term field measurements to for consumers’ feedback on the preferred functionalities of each device, and to test the durability of the devices.

6. Conclusions and Recommendations

Following COVID-19, there has been an increased interest in ventilation effectiveness in buildings, and many building occupants purchase devices to monitor indoor air quality at home. Access to this data using indoor air quality monitors has become a way by which building users are able to understand, visualize, and act upon the conditions in their spaces. This paper identified and evaluated fourteen low-cost air quality devices marketed to consumers for use at home (seven types, two of each product) and reported on the performance both in terms of accuracy when tested in a laboratory setting, but also in relation to consumer needs such as speed of response time and data visualization through field testing in three everyday-use scenarios. A main contribution of this paper is that this is one of the few studies characterizing the performance of seven brands of consumer-grade monitors focused on multiple parameters: accuracy, responsiveness, and visualization from a residential consumer’s perspective. The study compared temperature, relative humidity, CO2 and PM2.5 for accuracy and consistency between devices of the same brand, and also compared these across the seven different brands of devices. As stated in the results section, Airthings View Plus, Awair Omni and Laser Egg + CO2 had better performance during measurement of CO2 with a highly linear response, and R2 value and have lowest bias value. The study findings do not indicate a single brand as the most suitable for residential settings, and discussed the different ways and response times for displaying information, and visualizing and storing data using a Smartphone Application. A limitation and a strength of this field study portion of the evaluation is in its specific focus on the home and typical residential scenarios occurring in ordinary life. The field testing provided findings relating to the device performance specific to responsiveness, data visualization, and some practical considerations for users. A conclusion of this study is that consumer-grade indoor air quality monitors are part of an evolving and demanding industry and accuracy is not the sole relevant parameter. The study showed that the devices are accurate enough for CO2 and temperature and humidity to be relied upon for non-scientific home use, but the products had different response times, and different data visualization which would impact how consumers use them. The findings of this study could also be used by device manufacturers. For example, findings provided in this study about response time and portability could be used by manufacturers to improve aspects of device performance and for consumers to understand the different device functionalities. This paper contributes to a growing literature around the importance of indoor air quality in the home. Future work could explore consumer preferences and conduct field tests to considering how consumers report the ease of use of the devices and their adaptive behaviors.

Author Contributions

Conceptualization, T.P.; Methodology, T.P.; Investigation, C.Z.; Resources, T.P.; Writing—original draft, C.Z.; Writing—review & editing, T.P. All authors have read and agreed to the published version of the manuscript.

Funding

This research received funding from the Careerboost Program at Toronto Metropolitan. University. The paper is based on findings from Chen Zheng’s Master of Building Science Major Research Project in the Department of Architectural Science.

Data Availability Statement

The data presented in this study are available in the article.

Acknowledgments

The authors would like to thank Greg Labbé in the Department of Architectural Science Building Science Laboratory at Toronto Metropolitan University for his assistance in this project.

Conflicts of Interest

The authors declare no conflict of interest.

References

  1. Health Canada. Indoor Air Quality in Office Buildings, A Technical Guide. Available online: https://publications.gc.ca/collections/Collection/H46-2-93-166Erev.pdf (accessed on 21 November 2023).
  2. Davidson, C.I.; Phalen, R.F.; Solomon, P.A. Airborne Particulate Matter and Human Health: A Review. Aerosol Sci. Technol. 2005, 39, 737–749. [Google Scholar] [CrossRef]
  3. Siddika, N.; Rantala, A.K.; Antikainen, H.; Balogun, H.; Amegah, A.K.; Ryti, N.R.I.; Kukkonen, J.; Sofiev, M.; Jaakkola, M.S.; Jaakkola, J.J.K. Synergistic effects of prenatal exposure to fine particulate matter (PM2.5) and ozone (O3) on the risk of preterm birth: A population-based cohort study. Environ. Res. 2019, 176, 108549. [Google Scholar] [CrossRef] [PubMed]
  4. Yang, X.; Feng, L.; Zhang, Y.; Hu, H.; Shi, Y.; Liang, S.; Zhao, T.; Fu, Y.; Duan, J.; Sun, Z. Cytotoxicity induced by fine particulate matter (PM2.5) via mitochondria-mediated apoptosis pathway in human cardiomyocytes. Ecotoxicol. Environ. Saf. 2018, 161, 198–207. [Google Scholar] [CrossRef] [PubMed]
  5. World Health Organization (WHO). Ambient (Outdoor) Air Pollution; WHO: Geneve, Switzerland, 2021. [Google Scholar]
  6. United States Environmental Protection Agency. Particulate Matter Basics. Available online: https://www.epa.gov/pm-pollution/particulate-matter-pm-basics (accessed on 21 November 2023).
  7. Rai, A.C.; Kumar, P.; Pilla, F.; Skouloudis, A.N.; di Sabatino, S.; Ratti, C.; Yasar, A.; Rickerby, D. End-user perspective of low-cost sensors for outdoor air pollution monitoring. Sci. Total Environ. 2017, 607–608, 691–705. [Google Scholar] [CrossRef] [PubMed]
  8. Pascal, M.; Falq, G.; Wagner, V.; Chatignoux, E.; Corso, M.; Blanchard, M.; Host, S.; Pascal, L.; Larrieu, S. Short-term impacts of particulate matter (PM10, PM10–2.5, PM2.5) on mortality in nine French cities. Atmos. Environ. 2014, 95, 175–184. [Google Scholar] [CrossRef]
  9. Schwartz, J.; Bind, M.-A.; Koutrakis, P. Estimating Causal Effects of Local Air Pollution on Daily Deaths: Effect of Low Levels. Environ. Health Perspect. 2017, 125, 23–29. [Google Scholar] [CrossRef] [PubMed]
  10. Lolli, S.; Chen, Y.-C.; Wang, S.-H.; Vivone, G. Impact of meteorological conditions and air pollution on COVID-19 pandemic transmission in Italy. Sci. Rep. 2020, 10, 16213. [Google Scholar] [CrossRef]
  11. United States Environmental Protection Agency. The Inside Story: A Guide to Indoor Air Quality; United States Environmental Protection Agency: Washington, DC, USA, 2021.
  12. Forouzanfar, M.H.; Alexander, L.; Anderson, H.R.; Bachman, V.F.; Biryukov, S.; Brauer, M.; Burnett, R.; Casey, D.; Coates, M.M.; Cohen, A.; et al. Global, regional, and national comparative risk assessment of 79 behavioural, environmental and occupational, and metabolic risks or clusters of risks in 188 countries, 1990–2013: A systematic analysis for the Global Burden of Disease Study 2013. Lancet 2015, 386, 2287–2323. [Google Scholar] [CrossRef]
  13. Steinemann, A.; Wargocki, P.; Rismanchi, B. Ten questions concerning green buildings and indoor air quality. Build. Environ. 2017, 112, 351–358. [Google Scholar] [CrossRef]
  14. United States Air and Radiation (6609J) Research and Development Environmental Protection (MD-56) Agency. Indoor Air Facts No. 4 (revised) Sick Building Syndrome. 1991. Available online: https://www.epa.gov/sites/default/files/2014-08/documents/sick_building_factsheet.pdf (accessed on 21 November 2023).
  15. Gawande, S.; Tiwari, R.; Narayanan, P.; Bhadri, A. Indoor air quality and sick building syndrome: Are green buildings better than conventional buildings? Indian J. Occup. Environ. Med. 2020, 24, 30. [Google Scholar] [CrossRef]
  16. Wang, J.; Norbäck, D. Subjective indoor air quality and thermal comfort among adults in relation to inspected and measured indoor environment factors in single-family houses in Sweden-the BETSI study. Sci. Total Environ. 2022, 802, 149804. [Google Scholar] [CrossRef] [PubMed]
  17. Baraniuk, C. Airborne transmission: Are CO2 monitors a long term solution or “pandemic hack”? BMJ 2022, 376, o736. [Google Scholar] [CrossRef] [PubMed]
  18. Sá, J.P.; Alvim-Ferraz, M.C.M.; Martins, F.G.; Sousa, S.I.V. Application of the low-cost sensing technology for indoor air quality monitoring: A review. Environ. Technol. Innov. 2022, 28, 102551. [Google Scholar] [CrossRef]
  19. Baldelli, A. Evaluation of a low-cost multi-channel monitor for indoor air quality through a novel, low-cost, and reproducible platform. Meas. Sens. 2021, 17, 100059. [Google Scholar] [CrossRef]
  20. Demanega, I.; Mujan, I.; Singer, B.C.; Anđelković, A.S.; Babich, F.; Licina, D. Performance assessment of low-cost environmental monitors and single sensors under variable indoor air quality and thermal conditions. Build. Environ. 2021, 187, 107415. [Google Scholar] [CrossRef]
  21. Li, J.; Mattewal, S.K.; Patel, S.; Biswas, P. Evaluation of Nine Low-cost-sensor-based Particulate Matter Monitors. Aerosol Air Qual. Res. 2020, 20, 254–270. [Google Scholar] [CrossRef]
  22. Gonzalo, F.D.A.; Griffin, M.; Laskosky, J.; Yost, P.; González-lezcano, R.A. Assessment of Indoor Air Quality in Residential Buildings of New England through Actual Data. Sustainability 2022, 14, 739. [Google Scholar] [CrossRef]
  23. Taştan, M. A low-cost air quality monitoring system based on Internet of Things for smart homes. J. Ambient Intell. Smart Environ. 2022, 14, 351–374. [Google Scholar] [CrossRef]
  24. Government of Canada. Consultation: Proposed Residential Indoor Air Quality Guidelines for Carbon Dioxide; Government of Canada: Ottawa, ON, Canada, 2020.
  25. Xu, Q.; Goh, H.C.; Mousavi, E.; Nabizadeh Rafsanjani, H.; Varghese, Z.; Pandit, Y.; Ghahramani, A. Towards Personalization of Indoor Air Quality: Review of Sensing Requirements and Field Deployments. Sensors 2022, 22, 3444. [Google Scholar] [CrossRef]
  26. WELL v2. Available online: https://v2.wellcertified.com/en/wellv2/overview (accessed on 21 November 2023).
  27. RESET Data Standards and Tools. Available online: https://www.reset.build/ (accessed on 21 November 2023).
  28. ASHRAE ANSI/ASHRAE Standard 62.1-2022, Ventilation and Acceptable Indoor Air Quality. Available online: https://www.ashrae.org/technical-resources/bookstore/standards-62-1-62-2 (accessed on 21 November 2023).
  29. Air Mentor. Air Mentor-Air Mentor, Home Health Monitoring. Available online: http://www.buu.com.hk/1057.html (accessed on 21 November 2023).
  30. Airbeam 3. Available online: https://www.habitatmap.org/airbeam/buy-it-now (accessed on 21 November 2023).
  31. AirBird—Your Healthy Home Companion. Available online: https://getairbird.com/?variant=31598742208623 (accessed on 21 November 2023).
  32. Air Quality Egg. The Air Quality Egg Learning System. Available online: https://airqualityegg.com/egg (accessed on 21 November 2023).
  33. Manibusan, S.; Mainelis, G. Performance of Four Consumer-grade Air Pollution Measurement Devices in Different Residences. Aerosol. Air Qual. Res. 2020, 20, 217–230. [Google Scholar] [CrossRef]
  34. Singer, B.C.; Delp, W.W. Response of consumer and research grade indoor air quality monitors to residential sources of fine particles. Indoor Air 2018, 28, 624–639. [Google Scholar] [CrossRef] [PubMed]
  35. Wang, Z.; Delp, W.W.; Singer, B.C. Performance of low-cost indoor air quality monitors for PM2.5 and PM10 from residential sources. Build. Environ. 2020, 171, 106654. [Google Scholar] [CrossRef]
  36. Airthings. Airthings Wave Mini. Available online: https://www.airthings.com/en-ca/wave-mini (accessed on 21 November 2023).
  37. Airthings. Airthings View Plus. Available online: https://www.airthings.com/en-ca/view-plus (accessed on 21 November 2023).
  38. Airthinx. Air Quality Sensor Performance Evaluation Center. Available online: https://www.aqmd.gov/aq-spec/product/airthix-iaq (accessed on 21 November 2023).
  39. AirVisual Pro. AirVisual Pro Indoor Monitor. Available online: https://www.iqair.com/us/air-quality-monitors (accessed on 21 November 2023).
  40. Aranet4 HOME Aranet4 Home. Available online: https://shop.aranet.com/canada/product/aranet4-home (accessed on 21 November 2023).
  41. Atmotube Pro. Atmotube Pro-Wearable and Portable Air Quality Monitor. Available online: https://atmotube.com/atmotube-pro (accessed on 21 November 2023).
  42. Awair. Air Quality Monitor for business: Breathe Easy at Work. Available online: https://www.getawair.com/products/omni (accessed on 21 November 2023).
  43. TSI. Bluesky Air Quality Monitor 8143. Available online: https://tsi.com/products/environmental-air-monitors/bluesky-air-quality-monitor/ (accessed on 21 November 2023).
  44. C02METER. Air Pollution Meter. Available online: https://co2meter.shop/air-pollution-meter (accessed on 21 November 2023).
  45. GPS Central. Davis Airlink Professional Air Quality Sensor. Available online: https://www.gpscentral.ca/product/davis-airlink-professional-air-quality-sensor/?gclid=CjwKCAjw_b6WBhAQEiwAp4HyIF6h_jp182oAaie1HiEmX01DmOcbOxHIEt9xYLtXxMPqeVW3iiDU4RoCN70QAvD_BwE (accessed on 21 November 2023).
  46. Dylos. Dylos DC1100 Professional Air Quality Monitor. Available online: http://www.dylosproducts.com/ornodcproair.html (accessed on 21 November 2023).
  47. Moreno-Rangel, A.; Sharpe, T.; Musau, F.; McGill, G. Field evaluation of a low-cost indoor air quality monitor to quantify exposure to pollutants in residential environments. J. Sens. Sens. Syst. 2018, 7, 373–388. [Google Scholar] [CrossRef]
  48. EVE. Eve Room. Available online: https://www.evehome.com/en/eve-room (accessed on 21 November 2023).
  49. EnergyWise SAS. Air Quality Monitor by Foobot. Available online: https://foobot.io/features/ (accessed on 21 November 2023).
  50. Sousan, S.; Koehler, K.; Hallett, L.; Peters, T.M. Evaluation of consumer monitors to measure particulate matter. J. Aerosol. Sci. 2017, 107, 123–133. [Google Scholar] [CrossRef] [PubMed]
  51. Kaiterra. Laser Egg + CO2. Available online: https://support.kaiterra.com/laser-egg (accessed on 1 August 2022).
  52. Temtop. Temtop M10 Air Quality Tester AQI PM2.5. Available online: https://temtopus.com/products/temtop-m10-air-quality-detector-professional-formaldehyde-tvoc-pm2-5-monitor-air-quality-meter (accessed on 21 November 2023).
  53. Netatmo. Netatmo Smart Indoor Air Quality Monitor. Available online: https://shop.netatmo.com/en-ca/aircare/home-coach/homecoach (accessed on 21 November 2023).
  54. NuWave Sensors. NuWave Smart Air Quality Monitor. Available online: https://nuwave-sensors.myshopify.com/products/smart-air-quality-monitor (accessed on 21 November 2023).
  55. Plume Labs. Flow. Available online: https://plumelabs.com/en/flow/store/ (accessed on 1 August 2022).
  56. South Coast AQMD Purple Air PA-1. Available online: http://www.aqmd.gov/aq-spec/product/purpleair-pa-i-indoor (accessed on 1 August 2022).
  57. Qingping. Qingping Air Monitor Lite. Available online: https://www.qingping.co/temp-rh-monitor-lite/overview (accessed on 1 August 2022).
  58. Kaiterra. Sensedge Mini. Available online: https://www.kaiterra.com/sensedge-mini (accessed on 21 November 2023).
  59. Trusens. Air Purifiers. Available online: https://www.trusens.com/c/air-purifiers/ (accessed on 21 November 2023).
  60. Uhoo. Home Air Quality Sensor: Smart air monitor. Available online: https://getuhoo.com/smart-air-monitor/ (accessed on 9 July 2022).
  61. Wynd Technologies. Wynd Air Quality Tracker. Available online: https://hellowynd.com/products/wynd-air-quality-tracker?variant=44077938082065 (accessed on 21 November 2023).
  62. Xiaomi Mi PM2.5 Detector. Available online: https://www.mi.com/global/search/air%20purifier?tab=product (accessed on 1 August 2022).
  63. Lighthouse Worldwide Solutions. Lighthouse Handheld 3016-IAQ Airborne Particle Counters. Available online: https://www.golighthouse.com/en/airborne-particle-counters/handheld/ (accessed on 30 July 2023).
  64. Smith, D. CO2 Sensors: Which Type Should You Be Looking For? Kaiterra: Crans-Montana, Switzerland, 2019. [Google Scholar]
  65. Goodman, N.B.; Wheeler, A.J.; Paevere, P.J.; Selleck, P.W.; Cheng, M.; Steinemann, A. Indoor volatile organic compounds at an Australian university. Build. Environ. 2018, 135, 344–351. [Google Scholar] [CrossRef]
  66. Nirlo, E.L.; Crain, N.; Corsi, R.L.; Siegel, J.A. Field evaluation of five volatile organic compound measurement techniques: Implications for green building decision making. Sci. Technol. Built Environ. 2015, 21, 67–79. [Google Scholar] [CrossRef]
Figure 1. Test devices in the sealed bag during initial CO2 injection in the lab.
Buildings 14 00102 g001
Figure 2. AirBird accuracy performance graph over 30 min—CO2.
Buildings 14 00102 g002
Figure 3. Airthings View Plus accuracy performance graph in 30 min—CO2.
Buildings 14 00102 g003
Figure 4. Aranet4 Home accuracy performance graph in 30 min—CO2.
Buildings 14 00102 g004
Figure 5. Awair Omni accuracy performance graph in 30 min—CO2.
Buildings 14 00102 g005
Figure 6. Laser Egg + CO2 accuracy performance graph in 30 min—CO2.
Buildings 14 00102 g006
Figure 7. Scenario 1—Lighting up two candles and snuffing them out after 30 min.
Buildings 14 00102 g007
Figure 8. Scenario 1—Purple Air warning lights when snuffing out the candle at 30 min.
Buildings 14 00102 g008
Figure 9. Scenario 2—Initial setting in bedroom.
Buildings 14 00102 g009
Figure 10. Scenario 2—Airthings View Plus device notification at 20 min.
Buildings 14 00102 g010
Figure 11. Scenario 2—Awair Omni color notification at 20 min.
Buildings 14 00102 g011
Figure 12. Scenario 2—Aranet4 Home at 20 min.
Buildings 14 00102 g012
Figure 13. Scenario 3—Kitchen.
Buildings 14 00102 g013
Table 1. Relevant standards and guidelines for maximum thresholds of indoor air pollutants and related potential health problems.
Air PollutantPotential Health ProblemsASHRAE 62.2 [28]US EPA [11]WELL [26]RESET [27]
Carbon Dioxide (CO2)Headache/Fatigue/Nausea/Dizziness 1000 ppm1000 ppm800 ppm600 ppm
Carbon Monoxide (CO)Fatigue/Impaired vision/Reduced brain9 ppm50 ppm1ppmN/A
function/Nausea/Headaches/Dizziness/Flu-
like symptoms/Fatal
OzoneRespiratory illness, such as cardiovascularN/A100 µg/m35ppbN/A
mortality
TVOCsEye, nose and throatN/A500 µg/m3500 µg/m3400 µg/m3
irritation/Nausea/Headaches, loss of
coordination/Damage to liver, kidney, and
central nervous system/Skin irritation Eye, nose, and throat
Particulate Matter (PM2.5)irritation/Aggravation of respiratory tract15 µg/m315 µg/m312 µg/m312 µg/m3
related ailments
Table 2. Thirty low-cost monitors were examined, and this chart describes which parameters they evaluate, their price, and which published studies reference them. The grey coloured text is used to identify monitors that we found were no longer available for purchase during the study time table.
ProductsPrice (CAD)Measures Temp Measures RHMeasures CO2Measures PM2.5Already Calibrated TVOCOther
Parameters
Research Studies
Air Mentor [29]$250 TRUETRUETRUETRUEFALSETRUE
Airbeam [30]$326 TRUETRUEFALSETRUETRUEFALSEHabitat Map
AirBird [31]$367 TRUETRUETRUEFALSETRUEFALSEHigh CO2 Warning: Light or Sound mode
Air Quality Egg 2 [32]$448 TRUETRUETRUEFALSEFALSETRUENO2, CO, O3, SO2, Air Pressure[33,34,35]
Airthing Wave Mini [36]$100 TRUETRUEFALSEFALSETRUETRUE
Airthings Wave Plus [37]$379 TRUETRUETRUETRUEFALSETRUEAir Pressure, Radon
AirThix IAQ [38] TRUETRUETRUETRUEFALSETRUE
AirVisual Pro [39]$350 TRUETRUETRUETRUEFALSEFALSE [18,20,35]
Aranet4 Home [40]$322 TRUETRUETRUEFALSEFALSEFALSEPressure
Atmotube Pro [41]$452 TRUETRUEFALSETRUEFALSETRUEPressure
Awair Omni [42]$388 TRUETRUETRUETRUEFALSEFALSE
Ambient light sensor, noise sensor
BlueSky Air Quality Monitor 8143 [43]$538 FALSETRUEFALSETRUEFALSEFALSEPM10[33]
CO2 meter [44]$120 TRUETRUETRUEFALSETRUEFALSE
Davis Airlink [45]$327 FALSEFALSEFALSETRUETRUEFALSEPM1, PM19, AQI
Dylos DC1100 Pro Air Quality Monitor [46]$338 TRUEFALSEFALSETRUEFALSEFALSE [18,21,47]
Eve Room [48]$90 TRUETRUEFALSEFALSEFALSETRUE
Foobot [49] TRUETRUETRUEFALSEFALSEFALSE [20,21,33]
[18,34,47,50]
Laser Egg + CO2 [51]$340 FALSETRUETRUETRUEFALSEFALSEWorks with Apple Homekit[20]
Temtop M1O Air Quality Monitor [52] FALSEFALSEFALSETRUEFALSETRUE
Netatmo [53]$150 TRUETRUETRUETRUEFALSEFALSE [20,47]
NuWave [54] TRUETRUETRUETRUEFALSETRUE
Plume labs [55]$258 FALSEFALSEFALSETRUEFALSETRUEPM1, PM10, NO2
PurpleAir PA-I [56]$219 TRUETRUEFALSETRUEFALSEFALSEAir Pressure (300 to 1100 hPa)[21]
[34]
[35]
Qingping Air Monitor [57]$155 TRUETRUETRUETRUETRUEFALSEPM10
Sensedge Mini [58] TRUETRUETRUETRUEFALSETRUE
TruSens [59]$588 FALSEFALSEFALSETRUEFALSETRUEWith smart air purifier, track AQI, PM1, PM10
Uhoo [60]$414 TRUETRUETRUETRUEFALSETRUEAir Pressure, CO, NO2, Ozone[19]
Wynd Air Quality Tracker [61]$80 FALSEFALSEFALSEFALSETRUEFALSEAir Quality Index[21]
Xiaomi Original PM2.5 Detector [62]$80 TRUETRUEFALSETRUETRUEFALSE [21]
Table 3. Technical specifications of the seven low-cost monitors selected for this study.
ProductsIntervalTempRHCO2PM2.5TVOCOther
Parameters
AirBird [31]10 min−20 to +60 °C, (±0.5 °C)1–99% (±3%)0–5000 ppm (±30 ppm ±3% of reading), NDIR--AirBird comes fully calibrated. Sound mode, light mode.
Airthings View Plus [37]5 min10–35 °C/50–95 °F (±0.5 °C/±1 °F)0–80% (±3%)400–5000 ppm (±50 ppm), NDIR0~500 μg/m3-Air Pressure, Radon
detection range: 300 nm to 10 μm
below 150 μg/m3: ± (5 μg/m3 + 15%), above 150 μg/m3: ± (5 μg/m3 + 20%)
Aranet4 Home [40]1, 2, 5 or 10 min0–50 °C (±0.3 °C)0–85% (±3%)0–9999 ppm (± 30 ppm--Air Pressure
± 3% of reading), NDIR
Awair Omni [42]10s−40 to 125 °C (±0.2 °C)0–100% (±2%)400–5000 ppm (±75 ppm or 10%), NDIR0–1000 µg/m3 (±15% or ±15 µg/m3)0–60 ppmGuideline to LEED, WELL, FITWEL, LBC
Ambient light sensor, noise sensor
Certified by RESET
Eve Room [48]2s0 to +50 °C, (±0.3 °C)0–95% (±3%)---Works with Apple Homekit
Laser Egg + CO2 [51]1 min−20 to 100 °C (±1 °C)0–99% (±1%)400–5000 ppm (±30 ppm +3%), NDIR0.3–10 µg/m3 (±10% (3), <30 µg/m3)-Works with Apple Homekit
PurpleAir PA-I [56]≤10 s−40 °C to 85 °C (±1 °C)±3%-0 to 500 μg/m3-PM 0.3, 0.5, 1.0, 2.5, 5.0, & 10 μm
Air Pressure 300 to 1100 hPa
Table 4. Summary of results of accuracy for each device. The CO2 accuracy measurements in the. second column are compared to the lab testing with the research monitor and the CO2 measurements in the third column show how many tests were accurate in a series of eight, 3 min tests. The fourth column indicates PM2.5 accuracy compared to the research meter and the fifth column compares the accuracy results of two devices per brand. The sixth column shows relative humidity accuracy compared to the research meter.
ProductsResponse TimeCO2 AccuracyCO2 Accuracy (Score/8 Tests)PM2.5 AccuracyPM2.5
Accuracy
Temperature AccuracyRH AccuracyResponse to Poor IAQ
AirBird10 minWithin accuracy threshold4/8--1 of 2 devices not within accuracy threshold1 of 2 devices not within accuracy thresholdSound mode, light mode.
Color code on the App.
Airthings View Plus 5 minWithin accuracy threshold8/80–500 μg/m31 of 2 devices not within accuracy threshold2 devices within accuracy threshold2 devices within accuracy thresholdApp notifications.
detection range: 300 nm to 10 μmColor code on the device.
below 150 μg/m3: ± (5 μg/m3 + 15%), above 150 μg/m3: ± (5 μg/m3 + 20%)Methods to the poor IAQ.
Aranet4 Home1 minWithin accuracy threshold2/8--2 devices not within accuracy threshold2 devices not within accuracy thresholdColor code on the device.
Awair Omni10 sWithin accuracy threshold8/80–1000 µg/m3 (±15% or ±15 µg/m3)1 of 2 devices not within accuracy threshold1 of 2 devices not within accuracy threshold2 devices not within accuracy thresholdColor code on the device and App.
Health threshold.
Potential health problems related to the threshold.
evehome5 s----1 of 2 devices not within accuracy threshold2 devices within accuracy thresholdWorks with Apple Homekit
Laser Egg + CO21 minWithin accuracy threshold8/80.3–10 µg/m3 (±10% (3), <30 µg/m3)Not accurate in 4 tests1 of 2 devices not within accuracy threshold2 devices not within accuracy thresholdText code on the device and App.
PurpleAir PA-I5 s--0 to 500 μg/m32 devices within accuracy threshold2 devices within accuracy threshold2 devices within accuracy thresholdColor code on the device and air map.
Table 5. Analysis of the performance between two of the same branded devices. The green indicates better performance while red indicates relatively poor performance between two of the same branded devices, based on the statistical analysis.
ProductFormulap-ValueAdjusted R-SquareBias-Ref
AirBirdy = 21.0551 + 0.9759x***0.996130
Airthings View Plusy = 2.9287 + 1.0062x***0.999250
Aarnet4 Homey = −77.0107 + 1.0157x***0.997230
Awair Omniy = −8.4801 + 1.0032x***0.997375
Laser Egg + CO2y = −24.5797 + 1.0164x***0.999530
Table 6. Lab testing results for PM2.5.
ProductsPM2.5 (Average from Four Tests) (μg/m3)
Handheld-3016-IAQ10
Airthings View Plus #14
Airthings View Plus #25
Awair Omni #13
Awair Omni #23
Laser Egg + CO2 #12
Laser Egg + CO2 #22
Purple Air PA-I #17
Purple Air PA-I #28
Table 7. Scenario 1 results showing the devices being tested and the initial IAQ levels. Scenario 1 was conducted at 8:30 p.m. 29 July 2022.
ProductsIntervalReaction Time (App)Initial Temperature/RHInitial CO2 (ppm)Initial PM2.5 (ug/m3)
AirBird #110 min9 min25 °C/47%449-
AirBird #211 min9 min25 °C/48%427-
Airthings View Plus #15 min4 min26 °C/42%4931
Airthings View Plus #26 min4 min26 °C/44%4761
Aranet4 Home #11, 2, 5 or 10 min1 min26.8 °C/42%452-
Aranet4 Home #21, 2, 5 or 10 min1 min25.9 °C/43%441-
Awair Omni #110 s10 s25.7 °C/45%4002
Awair Omni #210 s10 s25.5 °C/45%4052
Eve Room #12 s2 s25.6 °C/44%--
Eve Room #22 s2 s25.2 °C/46%--
Laser Egg + CO2 #11 min1 min25 °C/47%4000
Laser Egg + CO2 #21 min1 min25 °C/47%4360
PurpleAir PA-I #1≤10 s8 s24 °C/46%-4
PurpleAir PA-I #2≤10 s8 s25 °C/44%-4
Table 8. Scenario 1 results showing the devices being tested and the tested IAQ levels.
ProductsWarning Light/NotificationCO2 (ppm) (20 min)PM2.5 (ug/m3) (Snuff Two Candles)Warning Light/Notification
Activity Stop at 20 min
AirBird #1Green/Yellow for Temp (Phone)463--
AirBird #2Green/Yellow for Temp (Phone)450--
Airthings View Plus #1Good47041 µg/m3Notification from the APP
Airthings View Plus #2Good47541 µg/m3Notification from the APP
Aranet4 Home #1Green465--
Aranet4 Home #2Green490--
Awair Omni #1Green46498 µg/m3Red/Orange
Awair Omni #2Green46699 µg/m3Red/Orange
Eve Room #1----
Eve Room #2----
Laser Egg + CO2 #1Good4573 µg/m3-
Laser Egg + CO2 #2Good4584 µg/m3-
PurpleAir PA-I #1Green-57 µg/m3Pink/Orange
PurpleAir PA-I #2Green-57 µg/m3Pink/Orange
Table 9. Scenario 2 results showing the devices being tested and the initial IAQ levels in the bedroom.
ProductsIntervalReaction Time Using Smartphone AppInitial Temperature °C/RH Initial CO2 (ppm)Initial PM2.5 (ug/m3)Warning Light/Notification
AirBird #110 min9 min24 °C/58%540-Green/Yellow for Temp (Phone)
AirBird #211 min9 min24 °C/59%520-Green/Yellow for Temp (Phone)
Airthings View Plus #15 min4 min24 °C/58%5892Good
Airthings View Plus #26 min4 min25 °C/56%5682Good
Aranet4 Home #11, 2, 5 or 10 min1 min25.6 °C/50%585-Green
Aranet4 Home #21, 2, 5 or 10 min1 min25.2 °C/52%612-Green
Awair Omni #110 s10 s23.5 °C/60%6092Green
Awair Omni #210 s10 s24 °C/62%6202Green
Eve Home #12 s2 s25.4 °C/55%---
Eve Home #22 s2 s25.2 °C/53%---
Laser Egg + CO2 #11 min1 min25 °C/58%5895Good
Laser Egg + CO2 #21 min1 min24°C/59%6005Good
PurpleAir PA-I #1≤10 s8 s25 °C/57%-7Green
PurpleAir PA-I #2≤10 s8 s24 °C/58%-7Green
Table 10. Scenario 2 results showing the devices being tested and the IAQ levels in the bedroom during testing.
ProductsCO2 (ppm) (10 min)Temp/RH (10 min)PM2.5 (ug/m3)Warning Light/NotificationTemp/RH (20 min)CO2 (ppm) (20 min) PM2.5 (ug/m3) (20 min)Warning Light/Notification
AirBird #170225 °C/56%-Green for CO2/Yellow for Temp (Phone)25 °C/57%930-only yellow for temp
AirBird #267025 °C/57%-Green for CO2/Yellow for Temp (Phone)26 °C/58%940-only yellow for temp
Airthings View Plus #168026 °C/53%4Red for Temp, Orange for VOC, overall air quality is fair27 °C/53%10355Phone notification, red light glowing on the device
Red warning on the app for CO2 and Temp
Airthings View Plus #275526 °C/51%4Red for Temp, Orange for VOC, overall air quality is fair27 °C/55%9985Phone notification, red light glowing on the device
Red warning on the app for CO2 and Temp
Aranet4 Home #175425.7 °C/52%-Green26.4 °C/54%906-Green
Aranet4 Home #271325.8 °C/51%-Green26.4 °C/53%876-Green
Awair Omni #171927.1 °C/52%3Orange for temp, yellow for CO2, Yellow for RH28.8 °C/51%8764Orange for temp, yellow for CO2, Yellow for RH
Awair Omni #273027.3 °C/51%3Orange for temp, yellow for CO2, Yellow for RH28.3 °C/52%8904Orange for temp, yellow for CO2, Yellow for RH
Eve Room #1-25.9 °C/53%-- ---
Eve Room #2-25.9 °C/52%-- ---
Laser Egg + CO2 #173927 °C/53%3Green, Air quality good27 °C/55%9153Green, Air quality good
Laser Egg + CO2 #278426 °C/56%3Green, Air quality good28 °C/54%8903Green, Air quality good
PurpleAir PA-I #1-27 °C/55%5Green26 °C/54%-5Green
PurpleAir PA-I #2-26 °C/53%5Green27 °C/53%-5Green
Table 11. Scenario 3 results showing the devices being tested and the initial IAQ levels in the kitchen. Scenario 3 as conducted at 3:30 p.m. July 30 2022.
ProductsIntervalReaction Time (App)Initial Temperature/RH Initial CO2 (ppm)Initial PM2.5 (µg/m3)Warning Light/Notification
AirBird #110 min9 min26 °C/52%500-Green/Yellow for Temp (Phone)
AirBird #211 min9 min26 °C/53%505-Green/Yellow for Temp (Phone)
Airthings View Plus #15 min4 min28 °C/45%5802Air Quality Fair
Airthings View Plus #26 min4 min28 °C/47%5852Air Quality Fair
Aranet4 Home #11, 2, 5 or 10 min1 min26.9 °C/47%529-Green
Aranet4 Home #21, 2, 5 or 10 min1 min26.7 °C/47%517-Green
Awair Omni #110 s10 s26.5 °C/50%5012Green/Good
Awair Omni #210 s10 s26.8 °C/48%4702Green/Good
Eve Room #12 s2 s27.8 °C/49%---
Eve Room #22 s2 s27.1 °C/50%---
Laser Egg + CO2 #11 min1 min27 °C/50%4803Good
Laser Egg + CO2 #21 min1 min26 °C/49%5003Good
PurpleAir PA-I #1≤10 s8 s26 °C/48%-5Green
PurpleAir PA-I #2≤10 s8 s27 °C/49%-5Green
Table 12. Scenario 3 results showing the devices being tested and the IAQ levels in the kitchen during testing.
ProductsTemp/RH
(Fry-Garlic)
PM2.5 (ug/m3)Warning Light/NotificationTemp/RH (Pan-Fry Steak)PM2.5 (ug/m3) (Pan-Fry Steak)Warning Light/Notification
AirBird #125 °C/56%-Green for CO2/Yellow for Temp (Phone)25 °C/57%-only yellow for temp
AirBird #225 °C/57%-Green for CO2/Yellow for Temp (Phone)26 °C/58%-only yellow for temp
Airthings View Plus #126 °C/53%4Red wanring for Temp, Orange for VOC, overall air quality is fair27 °C/53%5Phone notification, red light glowing on the device
Red warning on the app for CO2 and Temp
Airthings View Plus #226 °C/51%4Red wanring for Temp, Orange for VOC, overall air quality is fair27 °C/55%5Phone notification, red light glowing on the device
Red warning on the app for CO2 and Temp
Aranet4 Home #125.7 °C/52%-Green26.4 °C/54%-Green
Aranet4 Home #225.8 °C/51%-Green26.4 °C/53%-Green
Awair Omni #127.1 °C/52%3Orange for temp, yellow for CO2, Yellow for RH28.8 °C/51%4Orange for temp, yellow for CO2, Yellow for RH
Awair Omni #227.3 °C/51%3Orange for temp, yellow for CO2, Yellow for RH28.3 °C/52%4Orange for temp, yellow for CO2, Yellow for RH
Eve Room #125.9 °C/53%-- --
Eve Room #225.9 °C/52%-- --
Laser Egg + CO2 #127 °C/53%3Green, Air quality good27 °C/55%3Green, Air quality good
Laser Egg + CO2 #226 °C/56%3Green, Air quality good28 °C/54%3Green, Air quality good
PurpleAir PA-I #127 °C/55%5Green26 °C/54%5Green
PurpleAir PA-I #226 °C/53%5Green27 °C/53%5Green
Disclaimer/Publisher’s Note: The statements, opinions and data contained in all publications are solely those of the individual author(s) and contributor(s) and not of MDPI and/or the editor(s). MDPI and/or the editor(s) disclaim responsibility for any injury to people or property resulting from any ideas, methods, instructions or products referred to in the content.

