1. Introduction
At present, the strength of steel reinforcement used in prestressed concrete structures in China generally ranges from 300 MPa to 500 MPa [
1]. Among them, HPB300- and HRB400-grade reinforcements are more frequently used, while the utilization of high-strength HRB500 reinforcement is relatively limited. On the other hand, in developed countries in Europe and America, HRB400 and HRB500 reinforcements are predominantly used in concrete structures, with some utilization of HRB600-grade high-strength reinforcement, while reinforcements with strengths lower than 400 MPa are less commonly used. Overall, the strength grade of reinforcements used in the construction field in China are generally lower than those in developed countries.
Compared to ordinary reinforcement, high-strength reinforcement provides numerous advantages [
2]. Concrete elements reinforced with high-strength reinforcement can have their diameters reduced, resulting in savings in steel material, transportation, and installation costs, providing economic benefits. For example, for beam-column joints and other critical areas, the use of high-strength reinforcement can decrease the density of reinforcement, facilitating concrete placement and ensuring construction quality and structural durability. It also helps in shortening the construction period. When high-strength reinforcement is combined with high-performance building materials such as high-strength concrete, this enhances the utilization of material properties.
Extensive research has been conducted on high-strength reinforced concrete beams subjected to bending, both domestically and internationally. Chen Chen [
3], for instance, performed bending tests on four beams with 600 MPa reinforcement and one beam with 400 MPa reinforcement. The results showed that the concrete strain distribution along the section height of the concrete beam reinforced with a 600 MPa high-strength bar conformed to the assumption of the plane section. Under normal service conditions, the theoretical values of average crack spacing for 600 MPa-grade reinforced concrete beams aligned with the experimental values. However, the theoretical value for the maximum crack width was noticeably higher than the experimental value. Shao Hualei and Ma Rongquan et al. [
4] performed a nonlinear finite element analysis on rectangular section simply supported concrete beams. The results showed that the number of cracks increased and deflection deformations increased when 600 MPa high-strength reinforcement was used as a substitute for 400 MPa and 500 MPa reinforcement. Kent A. Harries et al. [
5] conducted experimental studies on high-strength reinforcement with a yield strength of 690 MPa and 827 MPa. They measured longitudinal reinforcement stresses of 414 MPa and 496 MPa during the normal service phase of the concrete beams, respectively. The use of high-strength reinforcement in concrete flexural members leads to higher reinforcement stresses and crack widths during the load-holding phase. The ACI code allows for increased steel stresses in concrete beams under normal loads, thus imposing fewer restrictions on the use of high-strength reinforcement. Amir Soltani et al. [
6] concluded that the upper limit requirement for steel yield strength in ACI-2011 and AASHTO-2010 codes can reach 689 MPa. Studies on experimental data for beams with high-strength reinforcement showed that the steel stress reached 496 MPa during the normal service phase, with an average crack width below 0.43 mm, while the influence of the reinforcement ratio on the test results was not significant. The effect of the reinforcement ratio on the test results was found to be insignificant. Tare K. Hassan et al. [
7] experimentally studied the lap splicing and shear performance of concrete beams reinforced with 830 MPa high-strength reinforcement. The results showed that components with higher-strength confinement of transverse reinforcement had longer plastic extension stages in the load–deflection curve and effectively utilized the plasticity of high-strength longitudinal reinforcement. When the shear span ratio and shear reinforcement ratio were the same, the use of high-strength shear reinforcement could change the failure mode of the component from diagonal tension to shear compression, significantly improving the shear capacity of the component. A large number of samples were calculated to propose recommended values for the reduction factor of bearing capacity, in which the design strength of HRB500 and HRB600 reinforcement was 454 MPa and 545 MPa for PSSF, respectively [
8]. The maximum crack widths calculated on the basis of the proposed formula were on the safe side in relation to Eurocode. It was also confirmed that the distances between cracks do not depend on the manner of loading [
9].
The 600 MPa grade reinforcement is produced using vanadium alloy, microalloying, and specialized rolling processes. In addition to having a higher strength than ordinary reinforcement, it also ensures ductility and purity, while the basic mechanical properties comply with relevant national regulations [
10]. An analysis of the significance of developing HRB600-grade high-strength reinforcement, introduced the development process of the result and described the economic and social benefits of an HRB600 reinforcing bar [
11].
The use of high-strength reinforcement in concrete bending elements not only increases the load-carrying capacity but also results in an increase in crack width during the normal service phase as the stress and strain in the reinforcement increase. The current Chinese code for concrete structures, GB 50010, includes HRB500- and HRBF500-grade high-strength reinforcement but does not yet include HRB600-grade [
9]. Further research is needed to determine whether the crack width formulas specified in the code apply to concrete beams reinforced with HRB600-grade high-strength reinforcement during the normal service phase.
Using experimental research and mathematical analysis, the crack development mechanism of HRB600-grade high-strength reinforced concrete beams is determined, and the relevant crack width standards are supplemented in the specification. This is helpful for research on the bond behavior between high-strength reinforcement and concrete, and for a comprehensive understanding of the mechanical properties and related applications in concrete structures.
2. Experimental Overview
2.1. Design of Prototypes
A total of eight concrete beams reinforced with high-strength HRB600 reinforcement bars, labeled L1 to L8, were designed and fabricated for the experiment. The cross-sectional dimensions of the beams were 300 mm × 500 mm, and the total length of each beam was 4500 mm. Two layers of 10 mm (2
![Buildings 14 00010 i001]()
10) diameter longitudinal reinforcement were provided in the compression zone of the beams, while the middle sections on both sides of the beams were reinforced with two layers of 10 mm diameter (2
![Buildings 14 00010 i001]()
10) stirrups. The reinforcement arrangement and geometric dimensions of the specimens are shown in
Figure 1. The experiment focused on studying the influence of various parameters, including the concrete strength, reinforcement rate, and diameter of the longitudinal reinforcement bar, on the flexural performance and behavior of the high-strength reinforced concrete beam. The main parameters of the tested specimens are listed in
Table 1. Before the experiment, the surface of the specimen was coated with white paint to facilitate crack observation, and a 50 mm × 50 mm grid was drawn within the pure bending section.
2.2. Material Properties
During the specimen fabrication, six cubic specimens (two groups with three specimens in each group) with dimensions of 150 mm × 150 mm × 150 mm were prepared for each reinforcement grade, to conduct material tests. Additionally, three 500 mm long HRB600 reinforcement bars were reserved for material property tests. The axial compression test of the concrete test was conducted on a universal testing machine (UTM) to measure the compressive strength (
fcu) of the cubes and determine standard values of the axial compressive and tensile strengths, as well as to calculate the modulus of elasticity (
Ec). The uniaxial tensile testing of the HRB600-grade high-strength reinforcement bars was performed to measure the mechanical properties, including yield strength (
fy), ultimate strength (
fu), elongation (
δ), and elastic modulus (
Ey), and to calculate the strength-to-yield ratio and strain hardening ratio. The mechanical properties of the concrete material can be found in
Table 2, while the HRB600 high-strength reinforcement material properties are presented in
Table 3.
As per the guidelines specified in the Code for the Design of Concrete Structures (GB 50010), Sections 4.2.5 and 4.2.6 [
11] specify the values of elastic modulus and ultimate strain for ordinary reinforcement bars. The elastic modulus for HRB335, HRB400, and HRB500 grades is defined as 2.0 × 10
5 N/mm², while the ultimate strain is specified to be not less than 7.5% [
12]. According to the test results presented in
Table 3, the elastic modulus of HRB600-grade hot-rolled ribbed high-strength reinforcement was slightly lower compared to ordinary reinforcement, with a recommended value of 1.9 × 10
5 N/mm². However, the measured ultimate strain surpassed the specified minimum requirement of 7.5%. As a result, the HRB600 reinforcement satisfied the requirements set for ordinary hot-rolled ribbed reinforcement.
In addition, according to Sections 3.9.2.2, for frame and diagonal braced members (including staircases) with seismic design levels of one, two, or three, when using ordinary reinforcement for longitudinal tensile reinforcement, the ratio of the measured tensile strength to the measured yield strength of the reinforcement should not be less than 1.25. The ratio of the measured yield strength to the standard yield strength should not exceed 1.3, and the measured total elongation of the reinforcement under maximum tension should not be less than 9% [
10]. As shown in
Table 3, the elongation and strain hardening ratio of the three different diameters of high-strength reinforcement bars tested met the requirements of the seismic code for ordinary reinforcement bars, except for the 22 mm diameter high-strength bars with a strength-to-yield ratio of 1.24, which slightly fell below the 1.25 limit. Therefore, HRB600-grade hot-rolled ribbed high-strength reinforcement bars, in addition to having a higher strength than ordinary reinforcement, exhibit good ductility and a higher safety margin, making them suitable for use in reinforced concrete seismic structures.
2.3. Loading Scheme and Measurement Point Arrangement
Based on the relevant provisions of the Standard for Test Method of Concrete Structures (GB/T 50152 [
13]), the control bending moment value applied to the pure bending section was used as a reference. After each load increment, the load was maintained for 5–10 min until it stabilized before collecting data. A hydraulic jack was employed as the loading equipment, and the loading was performed in a monotonic stepwise manner, controlled by force. Each load level was set at 1/10 of the theoretical ultimate load (
Pu), and the loading was then increased until reaching 0.9
Pu, after which continuous loading was applied, until failure. As shown in
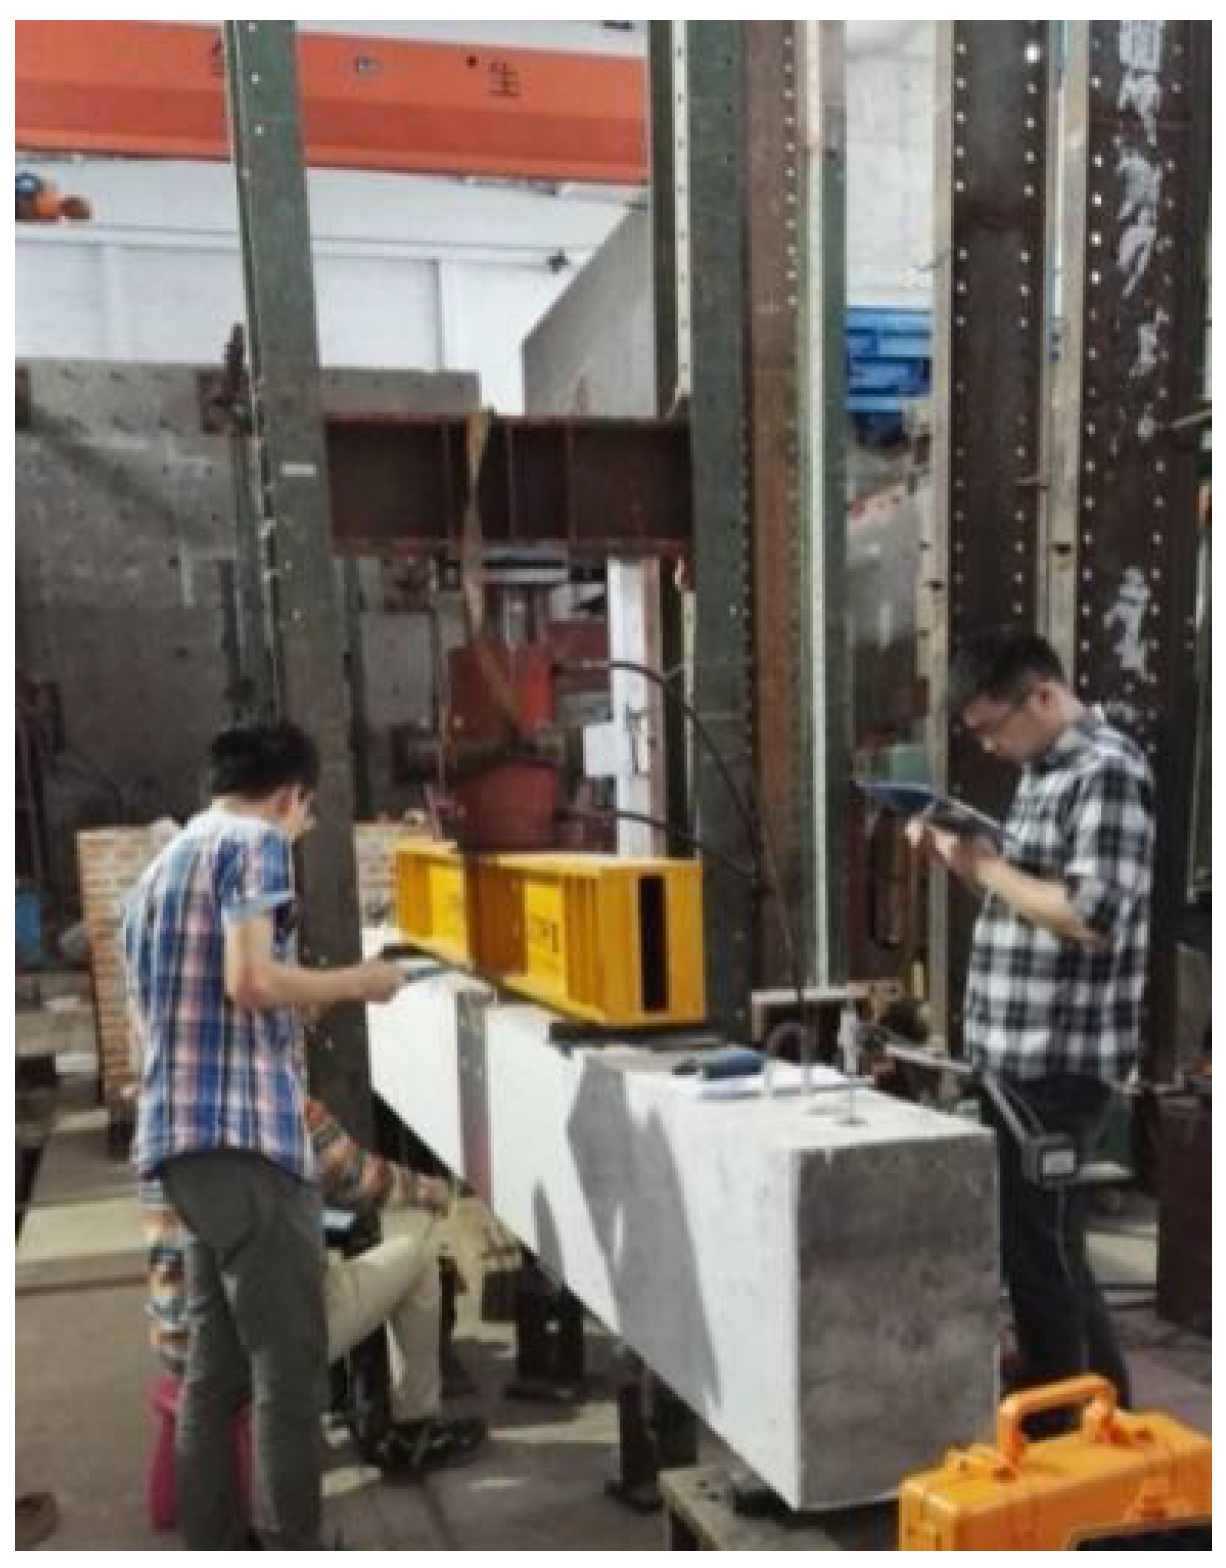
Figure 2, specimens L1 to L4 were loaded using a single jack placed on the distribution beam, while specimens L5 to L8 were loaded using two jacks placed on the distribution beam. The loading test photos of the beams are shown in
Figure 3.
2.4. Measurement Content
To measure the stress variations in the steel reinforcement during the loading process, resistance strain gauges (RSG) were bonded to the longitudinal reinforcement bars of the specimen. Additionally, resistance strain gauges were bonded to the top surface and to one side of the concrete beam, to measure the strain distribution along the height of the beam’s side surface. Displacement transducers were mounted at both ends (F1 and F5) and at the mid-span (F2, F3, and F4), to measure the deflection variation during the loading process. The arrangements of the measurement points on both the reinforcement and concrete are illustrated in
Figure 4 and
Figure 5, respectively. In
Figure 4, the longitudinal steel bars at the top and middle, as well as all hoop bars, are ignored. Throughout the test, visual inspections were conducted to detect the presence of cracks, and their development was closely observed immediately after the member experienced cracking. Starting from the third level of loading, the crack width was measured with a crack observer. This process continued until the eighth level of loading was reached, at which point the observation of crack width was discontinued.
3. Experimental Results and Analysis
3.1. Experimental Observations
All specimens exhibited distinctive plastic failure characteristics during the loading process. Based on the observed patterns of cracks and deflection characteristics of the specimens, the experimental process can be divided into the following five stages:
(1) Elastic stage: During the initial loading or the early stages of loading, the high-strength reinforced concrete beam remains uncracked. As the load was increased, the mid-span deflection, steel strain, and concrete strain exhibited a nearly linear increase;
(2) Cracking stage: When the load reached approximately 0.15~0.2 Pu, one or more small vertical cracks appeared on the side surface of the pure bending section of the beam. At this point, the load–deflection curve exhibited a notable inflection point;
(3) Plastic stage: When loaded to 0.2~0.8 Pu, the number of vertical cracks on the side surface of the pure bending section increased, and the cracks continued to propagate towards the compressed concrete zone, resulting in an increase in the crack width. At approximately 0.4 Pu, the number of major cracks ceased to increase. Later in this stage, some oblique cracks began to appear in the bending–shear section of the beam.
(4) Damage and Failure stage: As the load approached the peak load, the crack width and deflection deformation increased rapidly, and concrete fragments started falling off from the compressed concrete zone;
(5) Descent stage: After reaching the peak load, the applied load decreased, and the crack width and deflection deformations of the beam further increased, ultimately leading to the complete crushing of the compressed concrete zone.
Immediately after the load was applied, the internal microcracks developed into cracks visible on the side surface of the beams. Therefore, it can be seen that cracks in the beam subjected to pure bending action under increasing load initiated successively as a result of the random spread of strength and forming limit in tension. However, the crack formation and development were somewhat stochastic. This shows that many factors, some difficult to establish, affect the formation of cracks in concrete elements.
The test results indicated that the load-bearing performance and failure process of the concrete beam reinforced with HRB600-grade high-strength reinforcement bars were similar to those reinforced with ordinary reinforcement bars. A schematic diagram of the specimen failure is shown in
Figure 6.
3.2. Crack Development and Analysis
3.2.1. Crack Development
When the specimens were loaded to 0.15~0.2
Pu, small vertical cracks appeared near the edge of the concrete tension zone on the side surface. At this stage, the crack width and height extension were relatively small. As the load was increased, the number of cracks increased, and the previously formed cracks propagated toward the compressed concrete zone, resulting in wider crack widths. When loaded to approximately 0.4
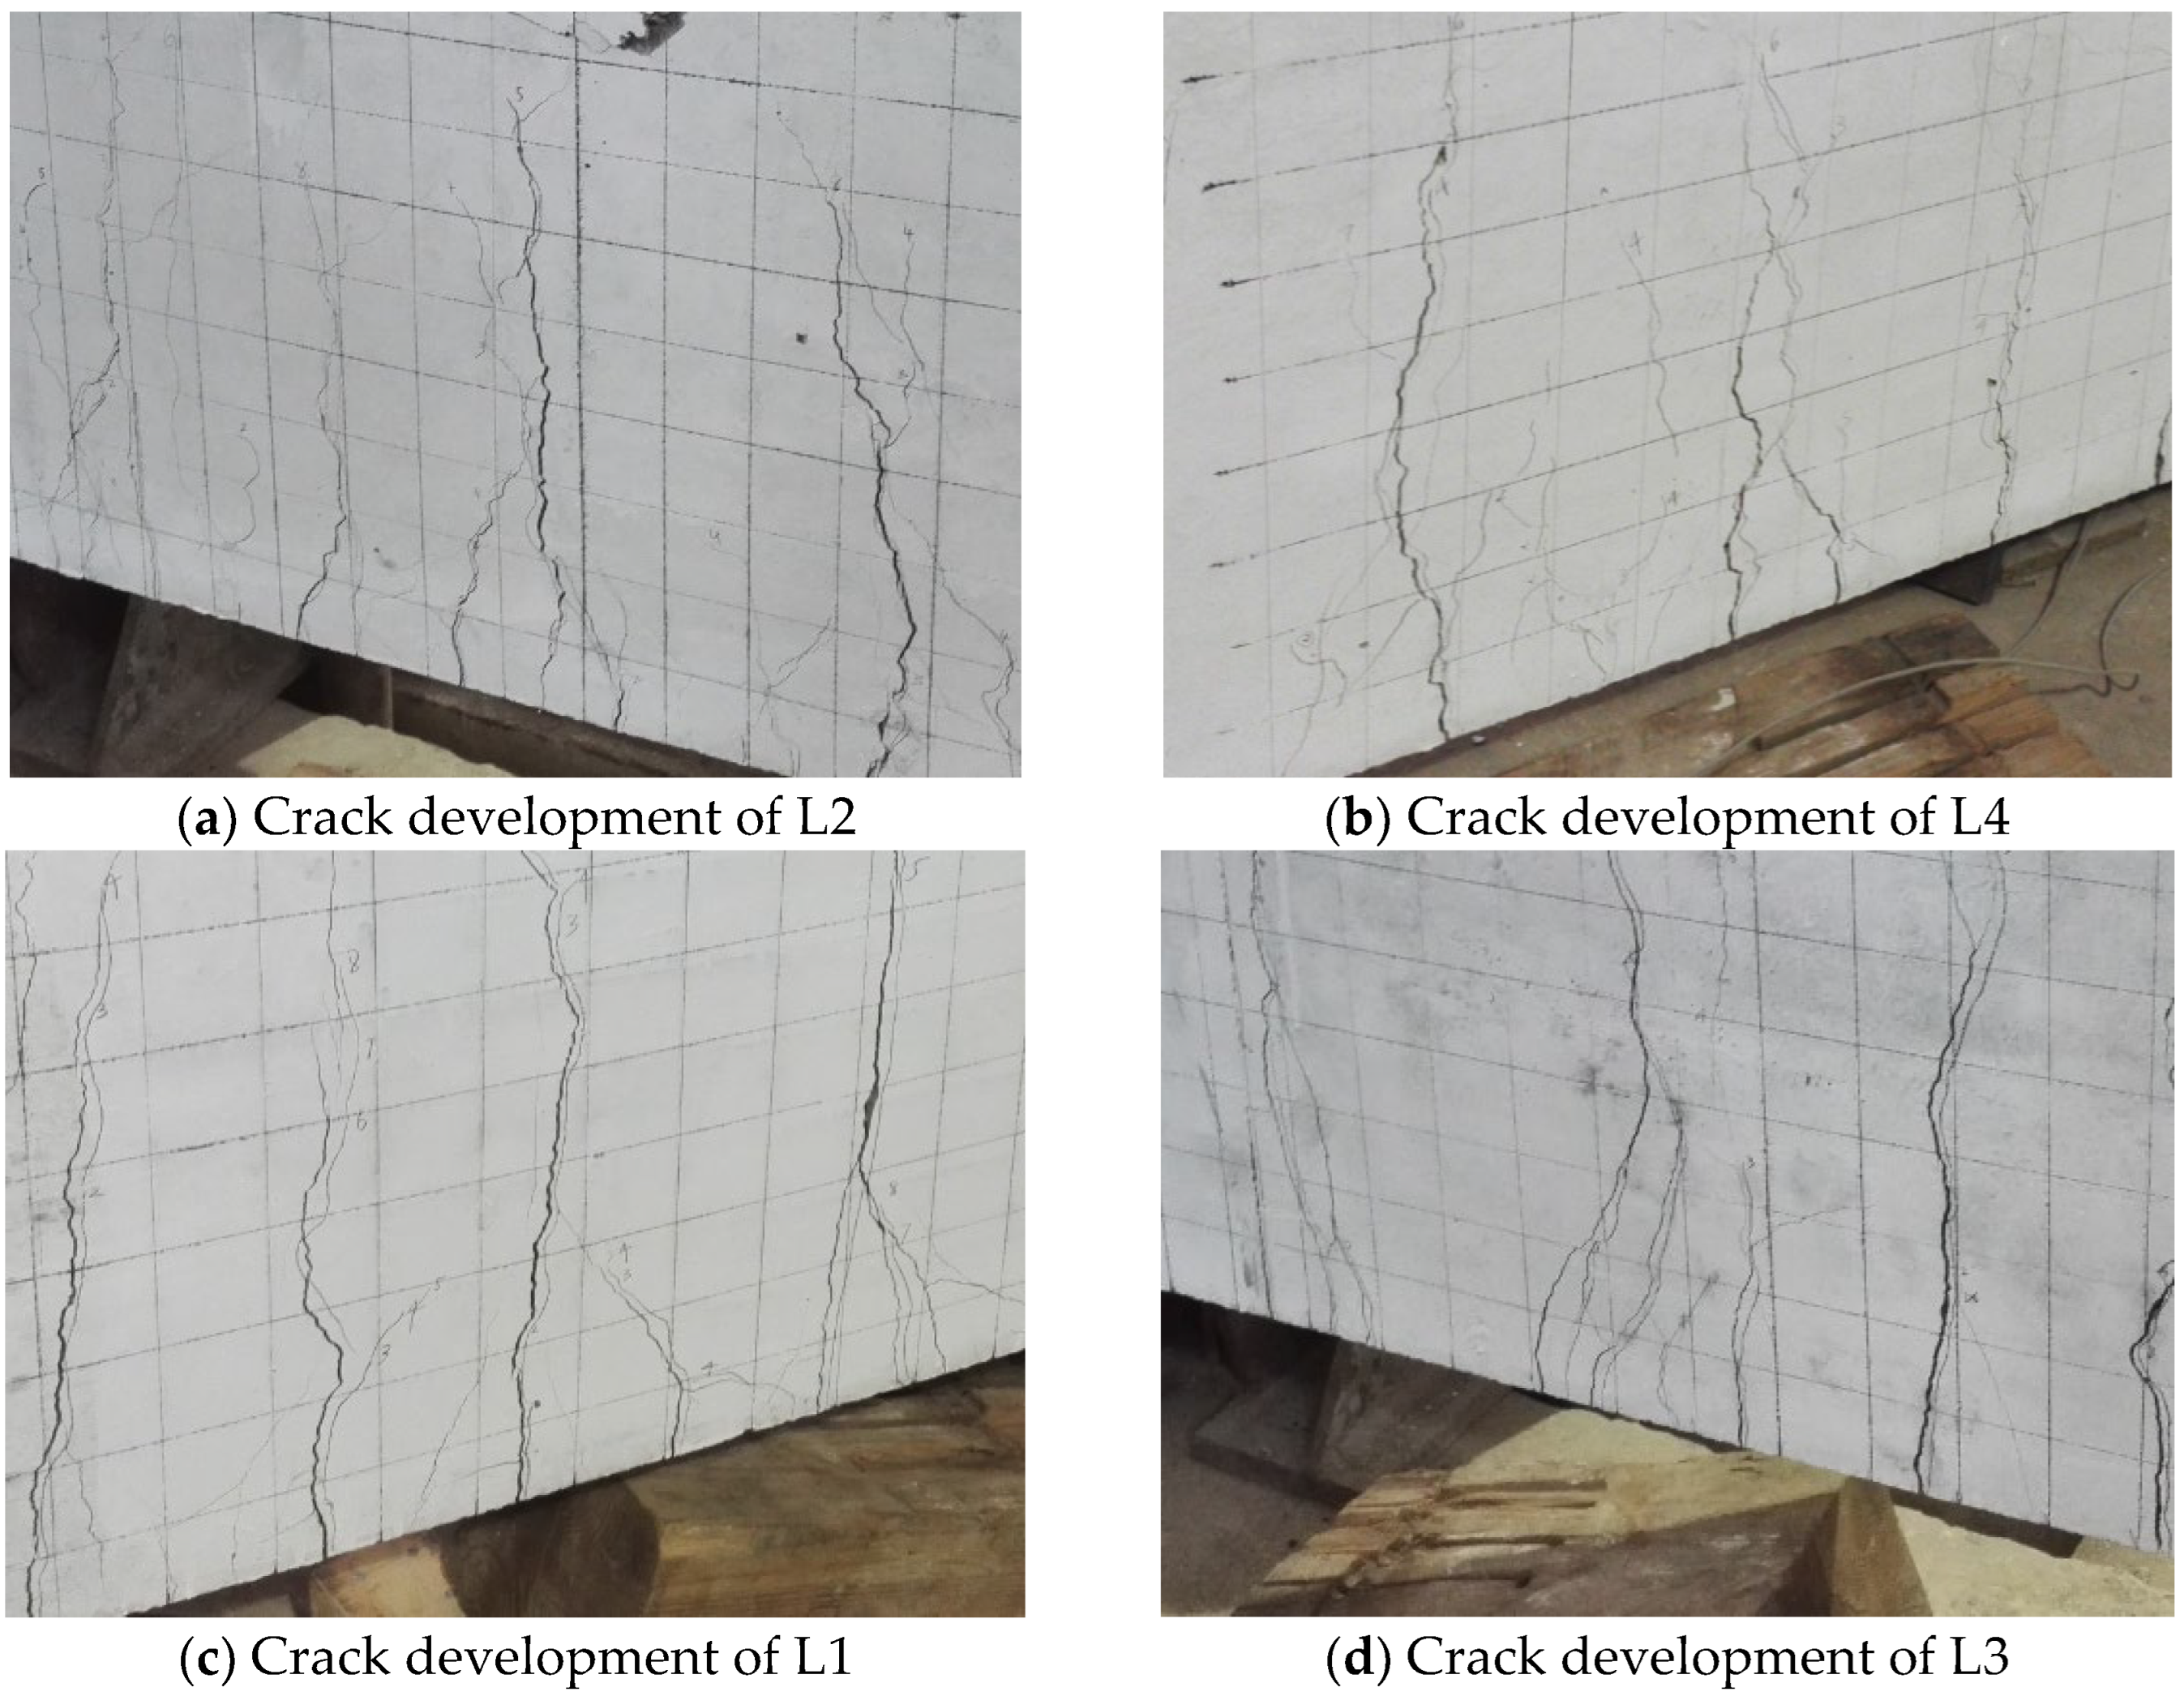
Pu, the main cracks on the beam side no longer increased, and the crack spacing was determined. With a further load increase, small secondary cracks appeared in certain positions of the pure bending section, but their length and width developed slowly. As the loading progressed, the first oblique crack appeared in the bending–shear section near the support location, and the number, width, and length of the oblique cracks also varied. When approaching the peak load, a main crack could be observed rapidly widening, and the compressed concrete region was ultimately crushed. According to the process of crack occurrence and development, there was no significant difference between the concrete beams reinforced with HRB600-grade high-strength reinforcement bars and the ordinary steel-reinforced concrete beams. Some of the cracks on the beam side of the purely curved section are shown in
Figure 7.
Under the same load, with the increase in the concrete strength grade, the crack distribution number and deflection became smaller, indicating that the change in concrete strength grade played an important role in the crack and deflection control of 600 MPa reinforced concrete beams.
3.2.2. Crack Morphology
Taking member L1 as an example, the crack morphology is shown in
Figure 8. Specimens L1 to L4 had the same reinforcement configuration, with concrete strengths of 18.7 MPa, 26.8 MPa, 30.8 MPa, and 40.7 MPa, respectively. Among them, L1 and L3 had a higher number of cracks and smaller crack spacing, while L2 and L4 had fewer cracks and a larger crack spacing. It can be observed that the variation in concrete strength had no significant impact on the crack spacing. Specimens L5 to L8 had the same concrete grade, with the reinforcement ratio increasing from 0.91% to 1.79%. With the increase in reinforcement ratio, the number of cracks significantly increased, and the crack spacing gradually decreased.
3.2.3. Crack Spacing
The crack spacing, including the face, back, and average values of each specimen, can be found in
Table 4. The experimental data show that the average crack spacing of the specimens ranged from 85 mm to 130 mm, with the majority of specimens falling between 90 mm and 110 mm. It is worth noting that
CV in
Table 4 represents the coefficient of variation, which is the ratio of standard deviation to the mean (or average) value, used to measure the degree of dispersion of the test results.
3.2.4. Crack Width
The crack widths for each specimen are presented in
Table 5 and
Table 6. The results indicated that the crack width increased with the applied load. For specimens L1, L2, L4, and L6 loaded to 0.7
Pu, the average crack width did not exceed 0.2 mm. Similarly, for specimens L3, L5, L7, and L8 loaded to 0.8
Pu, the average crack width remained below 0.2 mm. The coefficients of variation in the crack widths of the specimens were between 0.30 and 0.45.
3.2.5. Load vs. Crack Width Curve
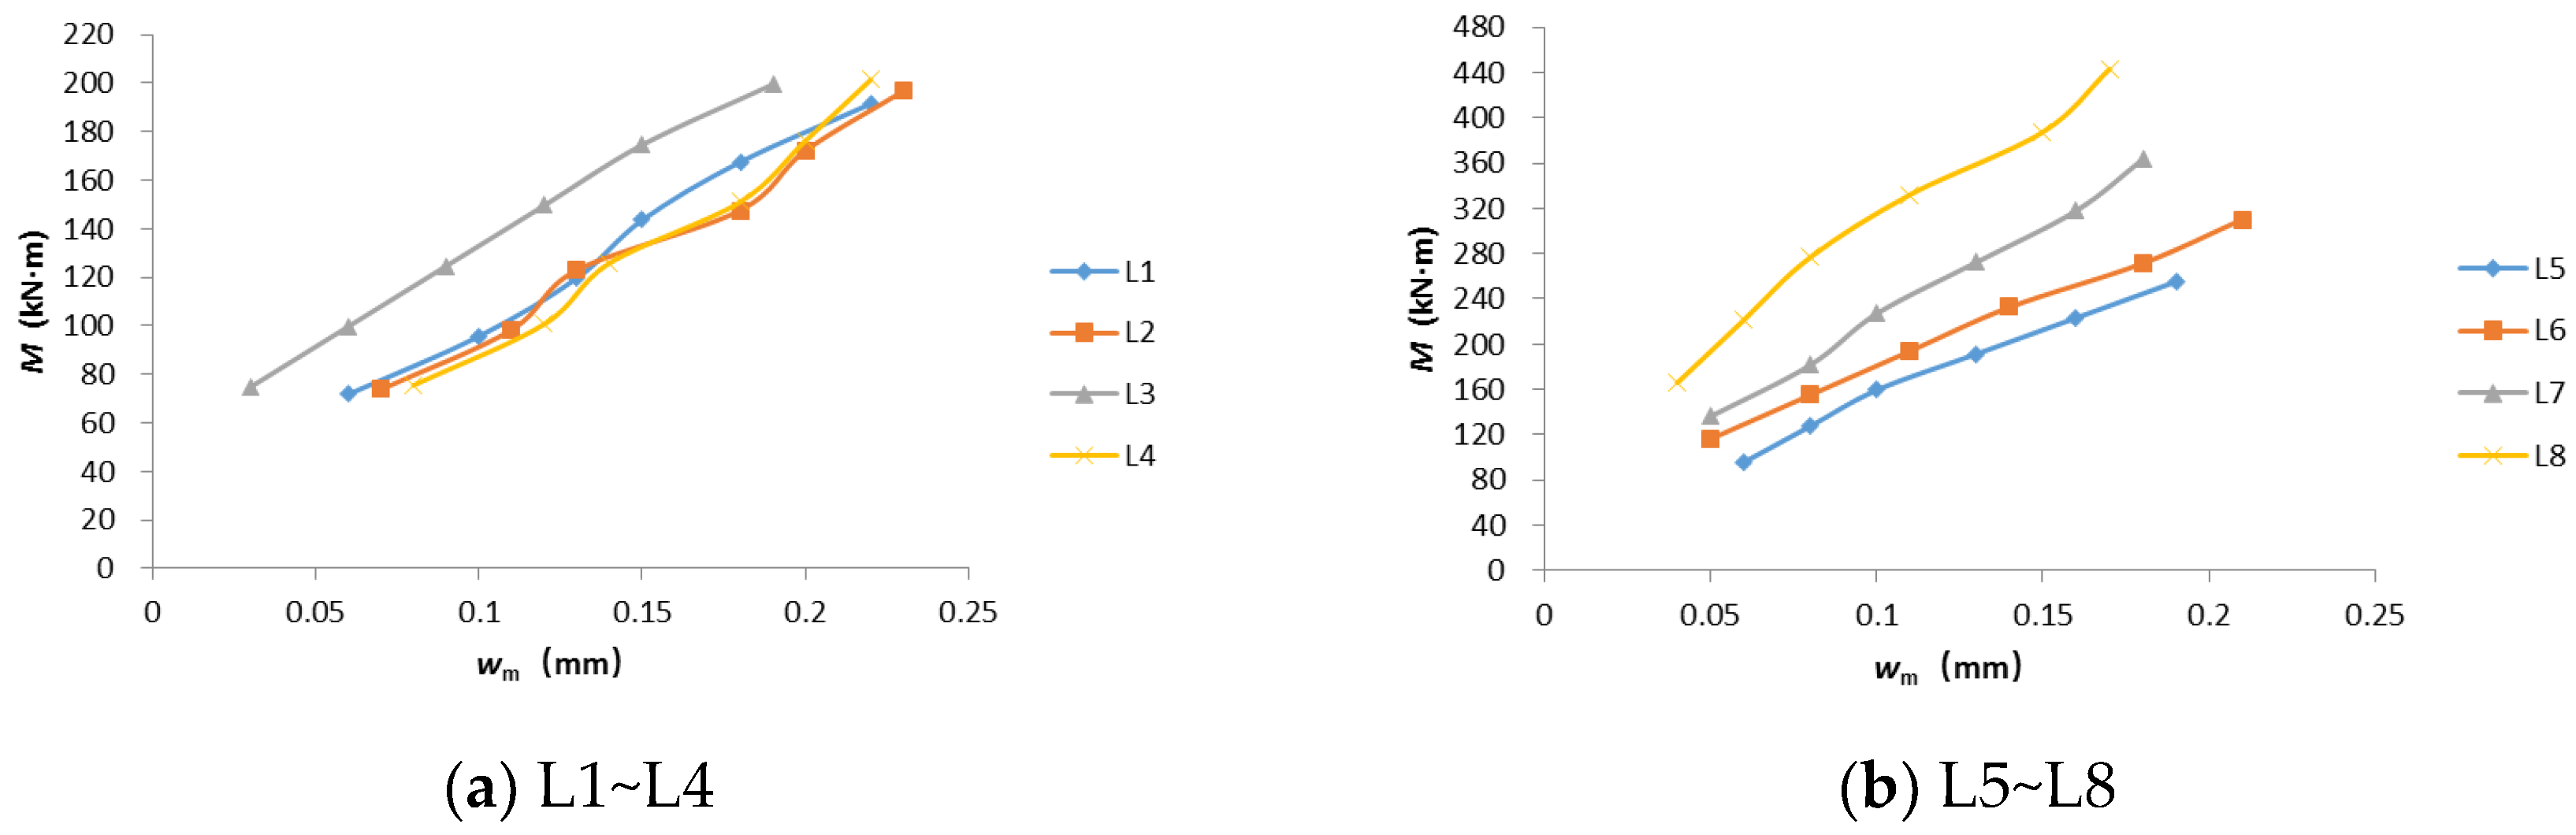
A comparison curve of bending moment
M vs. average crack width
ωm for each specimen is shown in
Figure 9, while a relationship curve of bending moment
M vs. maximum crack width
ωmax is shown in
Figure 10.
The average crack width was generally linearly related to the bending moment, and the average crack width increased as the bending moment increased;
There was some variation in crack width between the two sides of the beam (front and back), with larger differences observed in specimens L1 and L7. When one side had more cracks, the crack width tended to be smaller;
For the same concrete strength and beam cross-sectional dimensions, a higher reinforcement ratio resulted in smaller crack widths under the same load. The influence of concrete strength on crack width was not significant.
3.3. Comparison of Ultimate Load Experimental Values and Theoretical Values
Comparisons between the experimental values and the theoretical values of the ultimate load-bearing capacity for each specimen are presented in
Table 7. The ultimate load experiment values of all beams were greater than the theoretical values, with most beams having test values around 20% higher than the theoretical values. When the reinforcement ratio was the same, the ultimate load capacity increased with an increase in the concrete strength grade. Similarly, when the concrete strength grade was the same, the ultimate load capacity increased with an increase in the reinforcement ratio.
4. Factors Influencing Crack Spacing and Width
The calculation methods for crack width in concrete structures can be categorized into three types: bond-slip theory, no-slip theory, and a combination of bond-slip and no-slip theories. The bond-slip theory assumes that the crack spacing is independent of the concrete strength but proportional to the reinforcement diameter and the reinforcement ratio. All three calculation theories assume that the average crack width is directly proportional to the steel strain.
In this study, the crack data of eight concrete beams reinforced with HRB600 high-strength steel bars were analyzed, to investigate the factors influencing crack spacing and average crack width. The aim was to verify the assumptions and conclusions of the three semi-empirical and semi-theoretical calculation models, and to provide a brief analysis of the rationality of the crack width calculation methods based on empirical and theoretical considerations.
4.1. Factors Influencing the Average Crack Spacing
According to the test results of crack spacing (lm) for the concrete beams reinforced with HRB600-grade high-strength reinforcement bars, this study analyzed the influence of two factors: concrete strength (fcu) and the ratio of reinforcement diameter to reinforcement ratio (d/ρ) on the average crack spacing.
4.1.1. Concrete Strength
Specimens L1 to L4 had the same dimensions and reinforcement configuration, but the concrete strength grade varied from C30 to C60. By analyzing the average crack spacing (
lm) and concrete strength (
fcu) of these four specimens, a relationship curve was plotted, as shown in
Figure 11. It can be observed that, as the concrete strength increased, the crack spacing fluctuated within the range of 115 ± 10 mm, and there was no significant relationship between the concrete strength and crack spacing.
4.1.2. Ratio of Reinforcement Diameter to Reinforcement Ratio
Relationship curves between the average crack spacing (
lm) and the ratio of steel bar diameter to reinforcement ratio (
d/ρ) for each specimen are shown in
Figure 12. It should be noted that for specimens L1 to L4, the average value of (
d/
ρ) was taken due to their similarity. It can be observed that, except for specimen L8, the average crack spacing (
lm) of all specimens increased with an increase in the ratio of steel bar diameter to reinforcement ratio (
d/ρ), following a linear relationship.
From the above analysis, it can be seen that the average crack spacing of the concrete beams reinforced with HRB600-grade high-strength reinforcement bar followed a linear relationship with the ratio of steel bar diameter to reinforcement ratio (d/ρ). This relationship was independent of the concrete strength grade and aligned with the conclusions of the bond-slip theory.
4.2. Factors Influencing the Average Crack Width
Based on the results of the average crack width (ωm) from the current experiment, the influence of the reinforcement strain (εs), the ratio of steel diameter to reinforcement ratio (d/ρ), and the concrete strength (fcu) on the average crack width was analyzed.
4.2.1. Reinforcement Strain
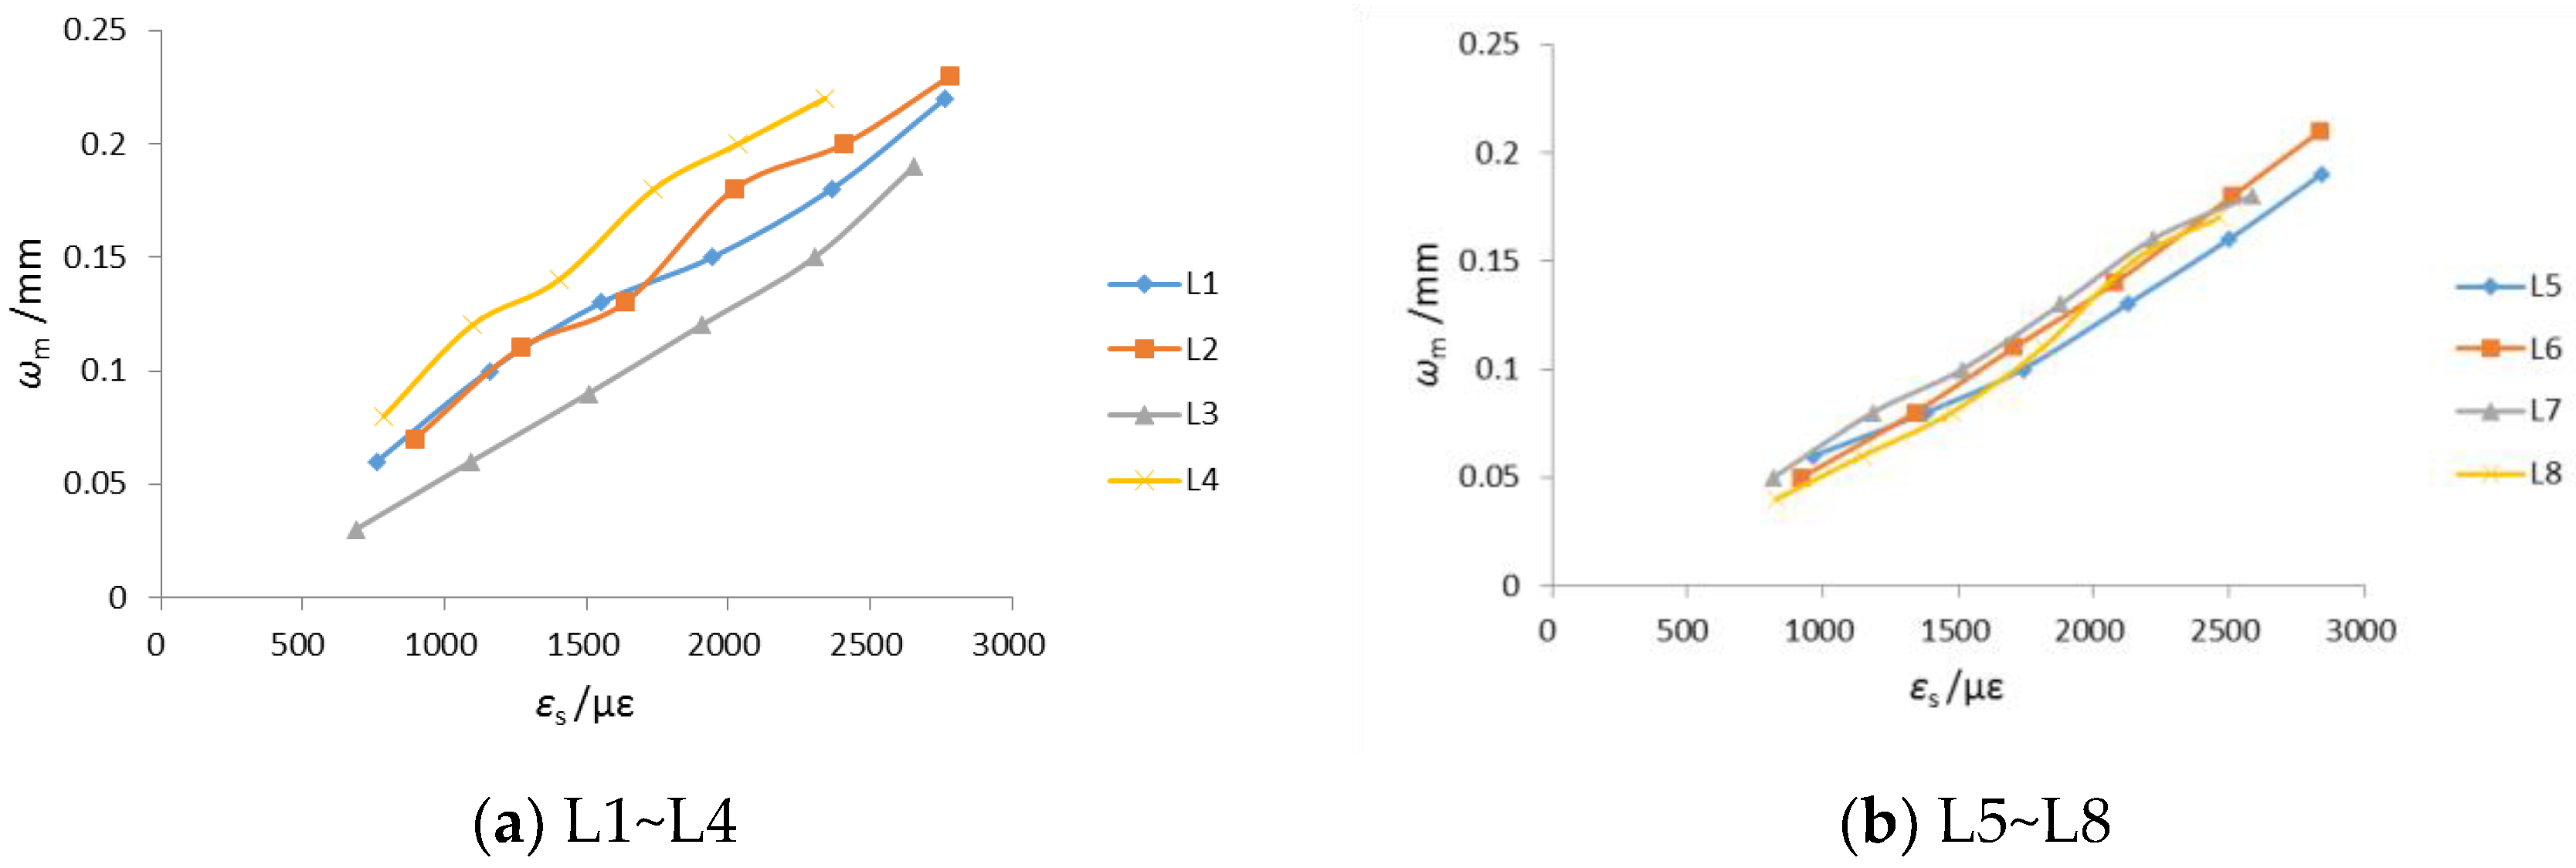
Relationship curves between the average crack width (
ωm) and reinforcement strain (
εs) for each specimen are shown in
Figure 13. It can be observed that the average crack width was generally proportional to the reinforcement strain, which aligns with the assumptions of crack width calculation models based on bond-slip, no-slip, and comprehensive theories.
4.2.2. Ratio of Steel Bar Diameter to Reinforcement Ratio (d/ρ)
When considering the influence of the ratio of steel bar diameter to reinforcement ratio (
d/
ρ), it is necessary to exclude the effect of reinforcement strain (
εs). Based on the previous conclusion mentioning that the average crack width (
ωm) is generally proportional to the reinforcement strain (
εs), a data table was created for each specimen, calculating the ratio
, as shown in
Table 8.
For the same specimen, this parameter is very similar, except for a few data points, which confirm that the average crack width (ωm) is mostly proportional to the reinforcement strain (εs). However, for different specimens, there was a significant difference in this parameter, with the average value ranging from 2.03 to 4.24. The maximum ratio exceeded twice the minimum ratio, indicating that the average crack width was not directly proportional to the ratio of steel bar diameter to reinforcement ratio (d/ρ). This finding is inconsistent with the calculation formula of the bond-slip theory.
4.2.3. Concrete Strength
For specimens L1–L4, which had the same dimensions and reinforcement configuration, the concrete strength grade was increased from C30 to C60. Similarly, it was necessary to consider the exclusion of the influence of steel strain (
εs) on the average crack width (
ωm). A data table was created for specimens L1 to L4, by calculating the ratio
, as shown in
Table 9.
For specimens with different configurations, there was a significant variation in this data, with an average range of 1.29 to 2.88. The maximum ratio was more than twice the minimum ratio. Moreover, the average value of this data for specimens L1 to L4 did not exhibit a monotonic change. This indicates that the average crack width was not significantly related to the concrete strength, which is consistent with the bond-slip theory.
4.3. Rationality of Semi-Empirical and Semi-Theoretical Methods for Crack Width Calculation
Researchers have developed various theories for calculating crack widths in concrete members based on the mechanisms of crack formation and data analysis. These theories have been widely applied in engineering. According to a literature review [
12,
14], crack width calculation methods can be divided into two main types: semi-empirical and semi-theoretical methods, as well as mathematical and statistical methods. The semi-empirical and semi-theoretical methods include bond-slip theory, no-slip theory, and combined theories. When calculating crack width in concrete, the semi-empirical and semi-theoretical methods provide a solid theoretical foundation and wide applicability. However, these methods consider a larger number of parameters, resulting in a lower accuracy compared to mathematical statistical formulas. On the other hand, the mathematical statistical methods take in to account the key influencing factors and demonstrate a better correlation between the calculated values and experimental results. However, these methods are more susceptible to the influence of statistical samples, which limits their applicability compared to the semi-empirical and semi-theoretical methods.
Based on the analysis of the factors influencing the average crack spacing and average crack width in
Section 4.1 and
Section 4.2, it can be concluded that the assumption made by the bond-slip theory for calculating crack spacing aligns well with the experimental results. However, the assumption made for calculating crack width does not match the experimental results. Conversely, according to no-slip theory, the observed crack width at the longitudinal reinforcement position should have been zero, which is significantly different from the experimental results. In contrast, the combination of the bond-slip and no-slip theories proved to be more rational, as it aligns with the experimental and analytical results. Therefore, this combined theory demonstrated greater validity compared to solely relying on the bond-slip or no-slip theories.
5. Determination of the Crack Width Calculation Method
5.1. Crack Width Calculation Method
The crack width calculation formula in the current Chinese Code for Design of Concrete Structures (GB 50010) is based on the combination of bond-slip theory and no-slip theory, as well as extensive experimental data. It has the advantages of a strong theoretical foundation, conceptual clarity, and wide applicability. Considering the rationality of the formula and its general applicability, this study fits the maximum crack width calculation formula for HRB600 high-strength reinforced concrete beams based on the theoretical calculations and formula format specified in GB 50010.
5.2. Modification of the Crack Width Calculation Formula for HRB600 High-Strength Reinforced Concrete Beams
5.2.1. Average Crack Spacing
For rectangular-section concrete flexural members, the crack width formula specified in GB 50010 is as follows:
In this study, based on the data obtained from the analysis of average crack spacing, concrete cover thickness (
c), effective reinforcement ratio (
ρte), and equivalent diameter of longitudinal tensile reinforcement (
deq) for the eight high-strength reinforced concrete beams, curve fitting was conducted as shown in
Figure 14. The fit crack spacing formula was as follows:
In comparison to Equation (1), Equation (2) increases the effect of concrete cover thickness on the average crack spacing, while reducing the influence of the ratio between longitudinal reinforcement diameter and effective reinforcement ratio. When the reinforcement ratio, reinforcement diameter, and cover thickness are within normal ranges, Equation (2) always yields a smaller average crack spacing than Equation (1).
5.2.2. Tensile Stress in Reinforcement
When calculating the tensile stress (
σs) in the longitudinal reinforcement of concrete flexural members according to the Chinese Code, the commonly used method is the internal force arm coefficient. For the internal moment arm coefficient (
γs) of the cracked section in ordinary reinforced concrete beams with rectangular section, the following formula is usually employed:
where
Mq represents the moment value calculated according to the quasi-permanent load combination,
As is the area of longitudinal reinforcement,
h0 is the effective section height,
is the ratio of the modulus of elasticity of steel to the modulus of elasticity of concrete, and
ρ is the reinforcement ratio of tensile longitudinal reinforcement.
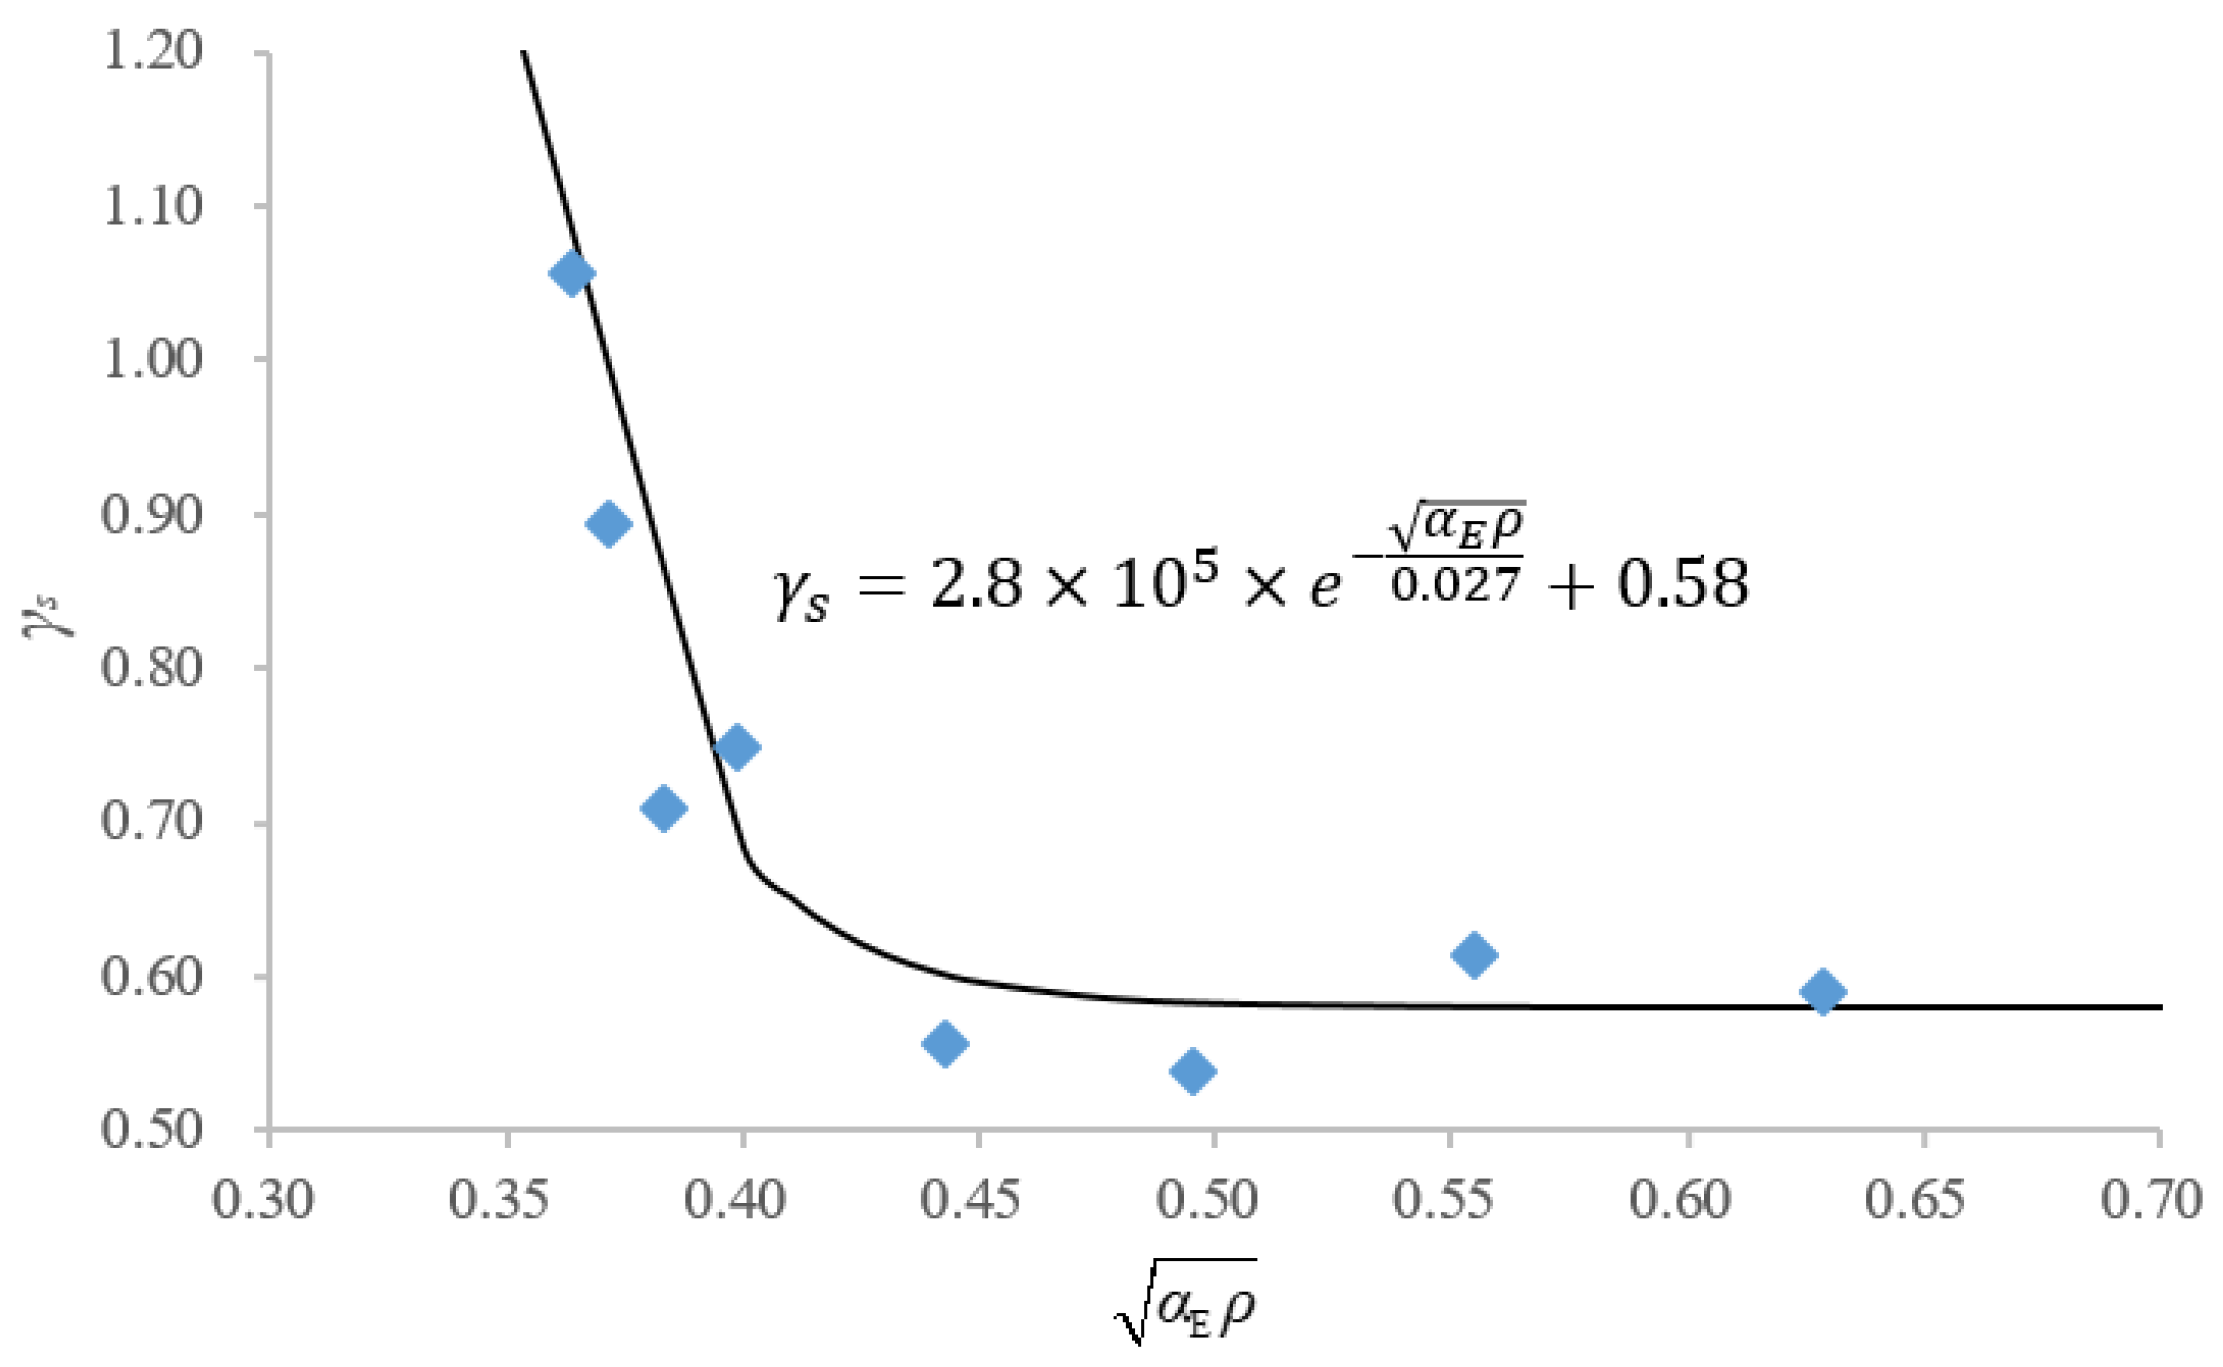
According to the Chinese code GB 50010, when the variation in relative height of the compressed zone is small, the value of
γs typically fluctuates between 0.83 and 0.93, and a value of 0.87 can be used [
12,
15]. Based on the experimental data of the cracked specimens in this study, including the applied moment and average steel strain, it was found that the linear relation in Equation (4) was not suitable for indicating the relation between γ
s and
. Additionally, it is considered that the internal force arm coefficient is significantly influenced by the reinforcement ratio and therefore cannot be considered a constant value. Therefore, a logarithmic function was constructed to express this relation, as shown in
Figure 15. The formula fit for the internal force arm coefficient obtained from the experiments in this study is
5.2.3. Reinforcement Inhomogeneity Coefficient
The reinforcement inhomogeneity coefficient
ψ represents the ratio of average strain in the crack to the steel strain in the crack section, indicating the extent of concrete involvement in tension at the crack section [
10,
16]. A previous study [
17] obtained experimental values for the coefficient by comparing the average strain value of 15 steel strain measurement points in the pure bending section with the maximum value. In this study, with only six longitudinal strain gauges per specimen, an indirect method was used. First, a characteristic coefficient of
αc = 1.9, as specified in the GB 50010 code for reinforced concrete flexural members or eccentrically compressed members, was assumed. Then, based on the formulas fit for average crack spacing in
Section 5.2.1 and the internal moment arm coefficient in
Section 5.2.2, the value of
ψ for the crack spacing in concrete flexural members was indirectly calculated using the experimental data of the maximum crack width. The resulting curve was fit, as shown in
Figure 16. The equation for the reinforcement inhomogeneity coefficient
ψ is as follows:
Due to the limitations of the experimental data and the inability to accurately obtain the strain values of the reinforcement at the crack section, further research is needed regarding the reinforcement inhomogeneity coefficient for HRB600 high-strength reinforced concrete beams.
5.2.4. Maximum Crack Width
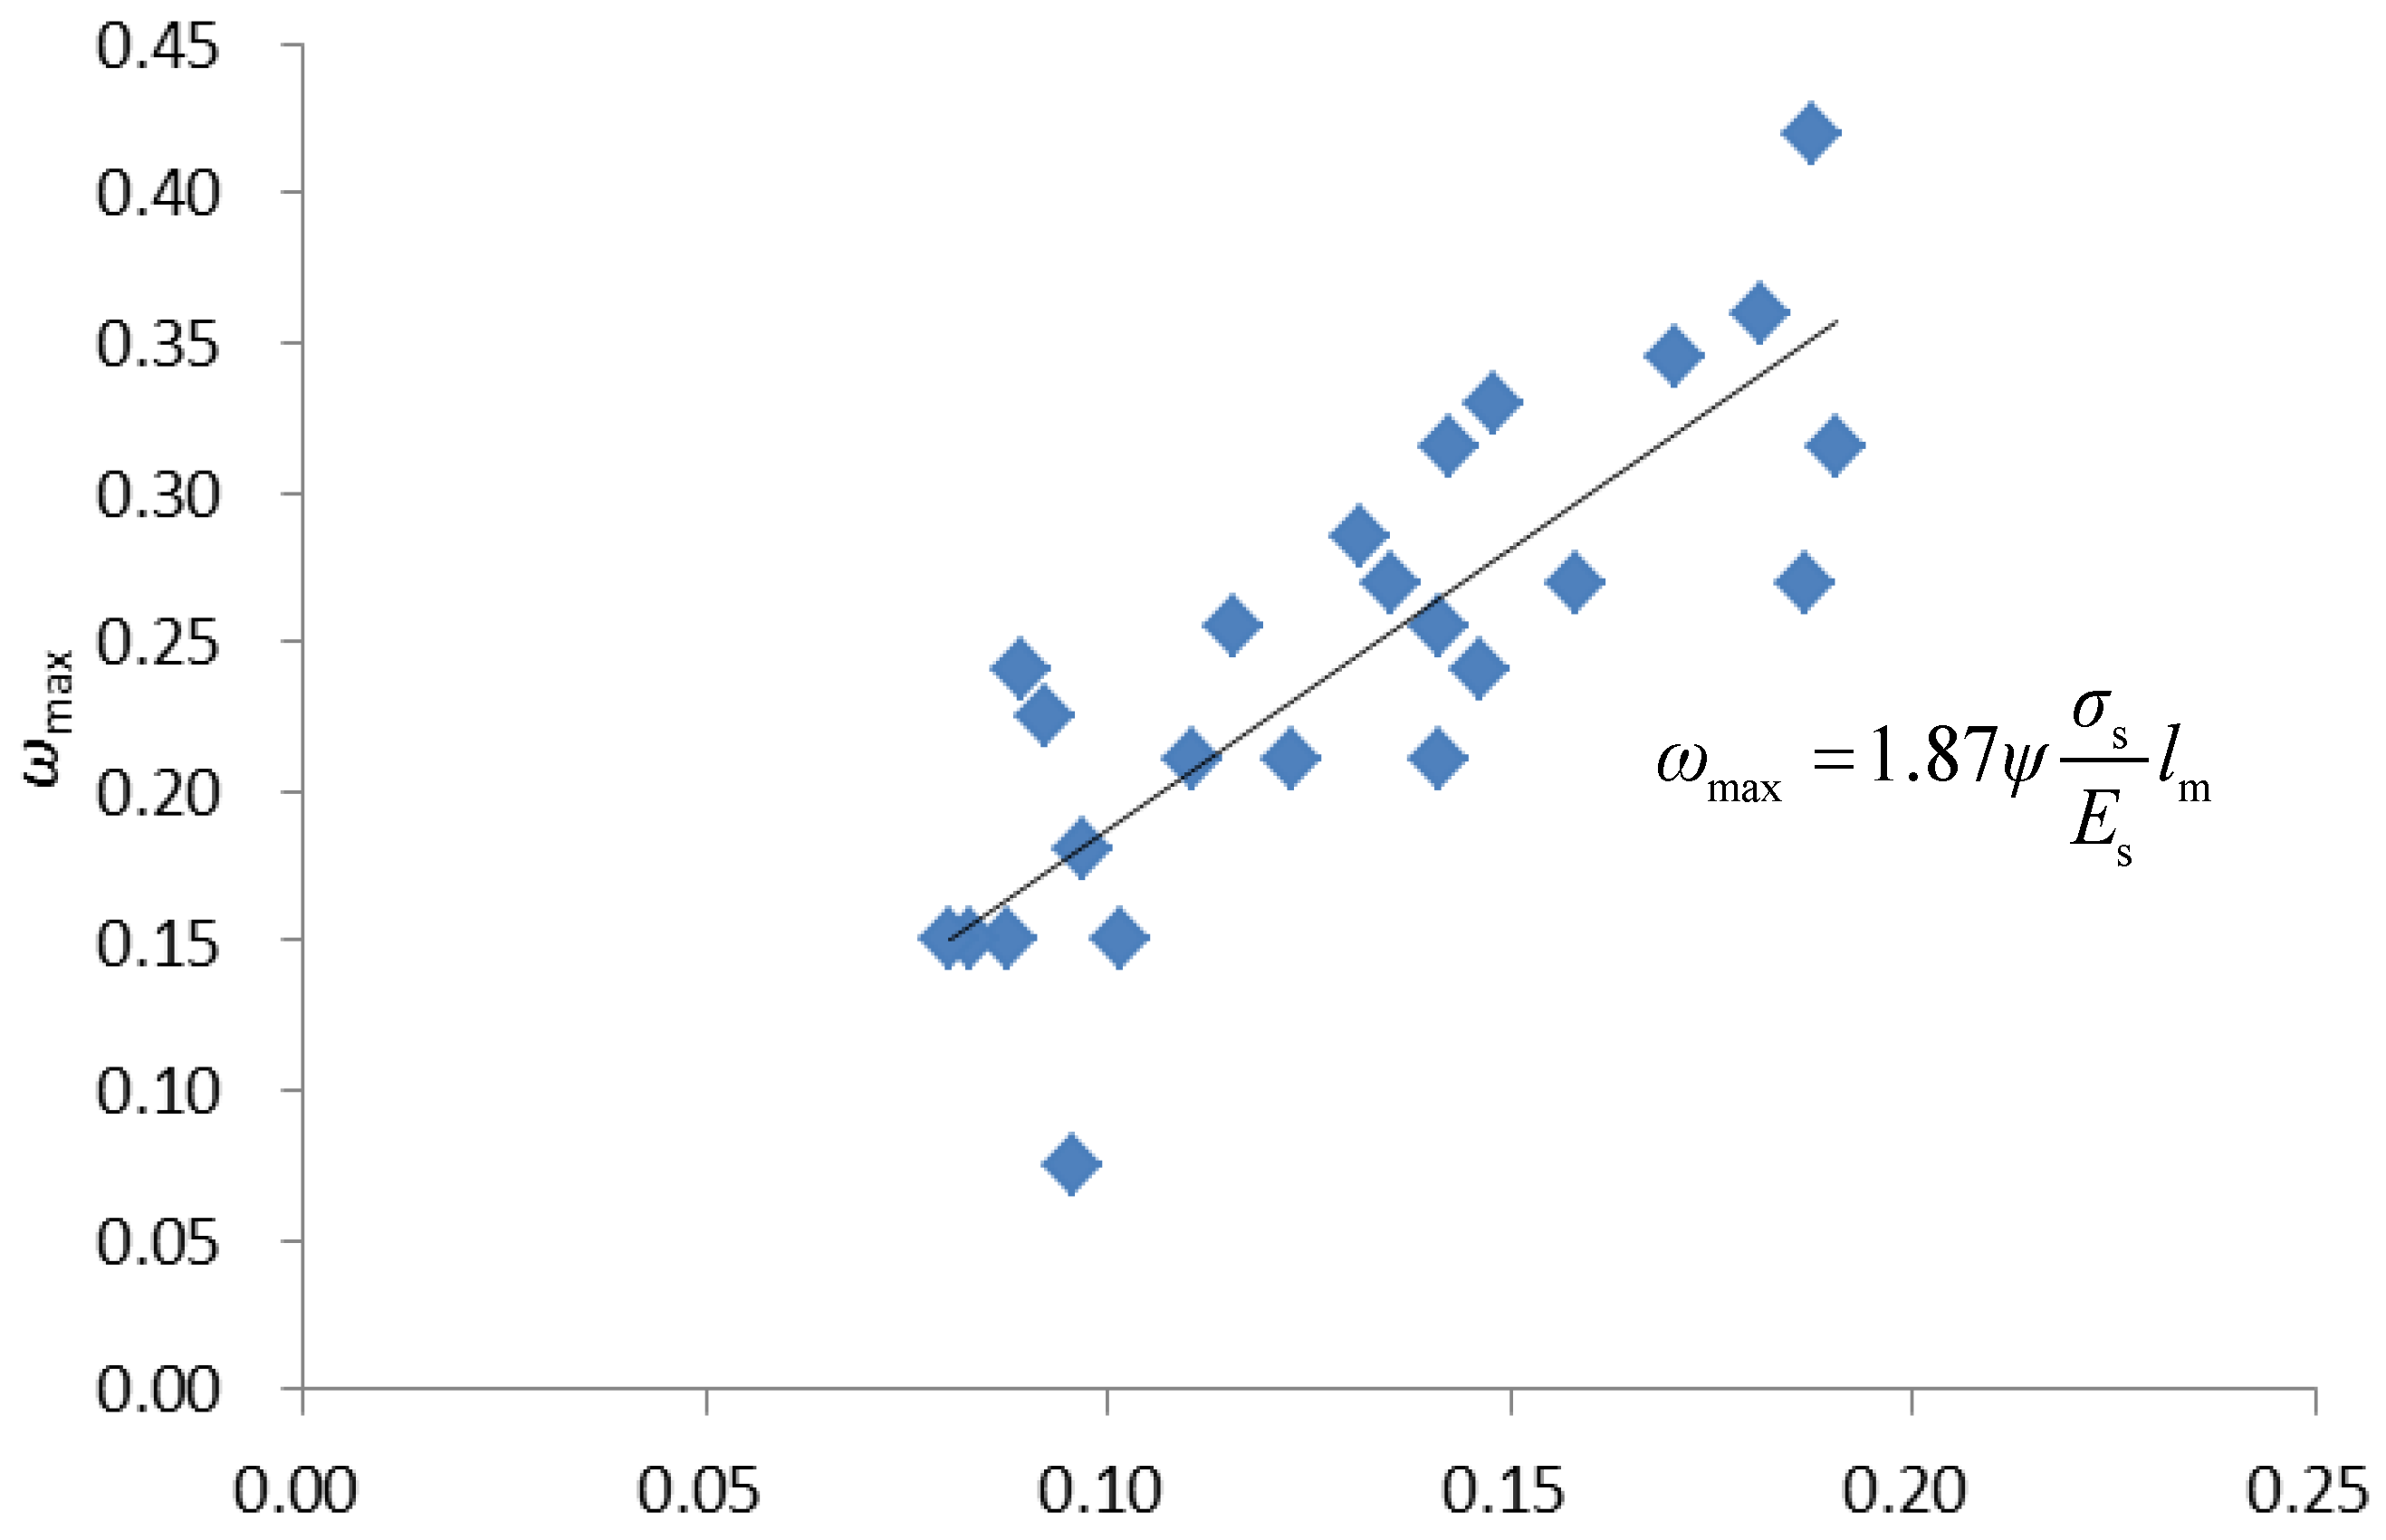
According to the GB 50010, the maximum crack width of a member is determined by the product of the load characteristic coefficient, reinforcement inhomogeneity coefficient, the tensile strain of longitudinal reinforcement, and average crack spacing. In
Section 5.2.1, the equation for average crack spacing is derived, while in
Section 5.2.2, the formula for the internal force arm coefficient is obtained, which allows for the calculation of the tensile strain of longitudinal reinforcement.
Section 5.2.3 provides the formula for the reinforcement inhomogeneity coefficient. Therefore, based on
Section 5.2.1,
Section 5.2.2 and
Section 5.2.3, the formula for calculating the maximum crack width can be derived, as shown in
Figure 17. The intercept value on the vertical axis of the fitted line is relatively small and can be ignored. The load characteristic coefficient of the member can be considered a constant value of 1.87.
The formula for calculating the maximum crack width of an HRB600 high-strength reinforced concrete beam, according to the experimental results in this study, is as follows:
where
acr is the load characteristic coefficient of the member, which is taken as 1.87 for the rectangular section, and
σs is the tensile stress in the longitudinal bars, calculated according to Equations (3) and (5).
6. Conclusions
The experimental program conducted in this study provided valuable insights into the behavior of HRB600-grade high-strength reinforcement in concrete beams and its influence on crack width. Eight concrete beams were constructed and tested, considering factors including concrete strength, reinforcement ratio, and reinforcement diameter.
Based on the test results of this study, the following conclusions can be drawn:
(1) The concrete beam components reinforced with HRB600-grade high-strength reinforcement exhibited a certain level of plasticity during the loading process, similar to ordinary reinforced concrete bending members. The loading test process can be divided into five stages: elastic stage, cracking stage, plastic stage, failure stage, and descent stage;
(2) Crack observation showed that cracks first appeared near the edges of the tensile zone on the side of the pure bending section. As the moment increased, the crack width and length also increased. After reaching the fourth loading level, the main cracks became aligned, and there was no further change in the crack spacing. Before reaching the seventh or eighth loading level, the average crack width did not exceed 0.2 mm, and the coefficients of variation for crack width in most specimens ranged from 0.30 to 0.45. It is worth noting that there was a difference in the crack width on the front and back surfaces of the beam. When the number of cracks on one side was higher, the crack width tended to be smaller;
(3) The crack spacing in the pure bending section of the HRB600-grade high-strength reinforced concrete beam was not related to the concrete strength grade but showed a linear relationship with the ratio of reinforcing bar diameter to reinforcement ratio d/ρ, which aligned with the basic assumption of the bond-slip theory. The average crack width in the pure bending section of the HRB600-grade high-strength reinforced concrete beams was directly proportional to the reinforcement strain. However, it exhibited a non-linearly relationship with the ratio of the reinforcing bar diameter to reinforcement ratio (d/ρ) and showed negligible correlation with the concrete strength grade. These findings indicate that the crack width did not completely conform to the basic assumptions of bond-slip theory and no-slip theory. Instead, the bonded slip and bondless slip combination theory provide a more reasonable explanation that is compatible with the experimental results. This combined theory offers a more comprehensive understanding of the crack width behavior in HRB600-grade high-strength reinforced concrete beams, making it more rational than the individual theories of bond-slip and no-slip;
(4) Based on the fitting analysis of the experimental data of the HRB600-grade high-strength reinforced concrete beams, significant differences were observed in the average crack spacing, internal force arm coefficient, and reinforcement inhomogeneity coefficient compared to the specifications outlined in GB 50010. As a result, a calculation formula for the maximum crack width applicable to HRB600-grade high-strength reinforced concrete beams was proposed based on the aforementioned key coefficients.
Author Contributions
Methodology, H.W.; Validation, L.Z.; Investigation, X.H., A.D. and D.Z.; Data curation, C.Y.; Writing—review & editing, H.W., A.D. and D.Z. All authors have read and agreed to the published version of the manuscript.
Funding
The authors declare that this study has received no funding.
Data Availability Statement
The data presented in this study are openly available.
Conflicts of Interest
Author Dekai Zhang was employed by the company China Construction Eighth Engineering Division Corp., Ltd. The remaining authors declare that the research was conducted in the absence of any commercial or financial relationships that could be construed as a potential conflict of interest.
Nomenclature
| Physical factor: |
| As | Area of longitudinal reinforcement (mm2) |
| Ratio of the modulus of elasticity of steel to the modulus of elasticity of concrete |
| acr | Load characteristic coefficient of the member |
| σs | Tensile stress of steel |
| c | Concrete cover thickness (mm) |
| CV | Coefficient of variation |
| d | Reinforcement diameter |
| d/ρ | Ratio of reinforcement diameter to reinforcement ratio |
| deq | Longitudinal tensile reinforcement |
| Ec | Calculated value of elastic modulus (MPa) |
| Ey | Elastic modulus (MPa) |
| εs | Reinforcement strain |
| fcu | Compressive strength (MPa) |
| fu | Ultimate strength (MPa) |
| fy | Yield strength (MPa) |
| h0 | Effective section height (mm) |
| ρ | reinforcement ratio (%) |
| ρte | Effective reinforcement ratio (%) |
| Pu | Theoretical ultimate load (kN) |
| lm | Average crack spacing (mm) |
| M | Bending moment (kN*mm) |
| Mq | Moment value calculated according to the quasi-permanent load combination (kN*mm) |
| ωm | Average crack width (mm) |
| ωmax | Maximum crack width (mm) |
| δ | Elongation |
| γs | Internal moment arm coefficient |
| ψ | Reinforcement inhomogeneity coefficient |
![Buildings 14 00010 i001]() | HRB400 |
| Abbreviated terms: |
| HRB | Hot-rolled ribbed-steel bar |
| HPB | Hot-rolled plain-steel bar |
| RSG | Resistance strain gauge |
| UTM | Universal testing machine |
References
- Jin, H.; Yang, C.; Song, W.; Li, J. Study on the force performance of reinforced concrete members at 600 MPa level. Urban 2016, 74–77. (In Chinese) [Google Scholar]
- Tavallali, H.; Lepage, A.; Rautenberg, J.; Pujol, S. Cyclic Response of Concrete Frame Members Reinforced with Ultrahigh Strength Steel; Structures Congress: Las Vegas, NV, USA, 2011. [Google Scholar]
- Chen, C. Experimental Study on the Force Performance of 600 MPa Reinforced Concrete Members; Kunming University of Technology: Kunming, China, 2016. (In Chinese) [Google Scholar]
- Shao, H.; Ma, R.; Ge, J.; Bai, J. Theoretical analysis of flexural performance of 600 MPa grade high-strength reinforced concrete beams. Ind. Constr. 2016, 46 (Suppl. S2), 242–246. (In Chinese) [Google Scholar]
- Harries, K.A.; Shahrooz, B.M.; Soltani, A. Flexural Crack Widths in Concrete Girders with High-Strength Reinforcement. J. Bridge Eng. 2012, 17, 804–812. [Google Scholar] [CrossRef]
- Soltani, A.; Harries, K.A.; Shahrooz, B.M. Crack Opening Behavior of Concrete Reinforced with High Strength Reinforcing Steel. Int. J. Concr. Struct. Mater. 2013, 7, 253–264. [Google Scholar] [CrossRef]
- Hassan, T.K.; Mantawy, A.; Soliman, J.; Sherif, A.; Rizkalla, S.H. Bond Characteristics and Shear Behavior of Concrete Beams Reinforced with High-Strength Steel Reinforcement. Adv. Struct. Eng. 2012, 15, 303–318. [Google Scholar] [CrossRef]
- Zhang, F.; Feng, F.; Liu, X. Reliability Analysis of Concrete Beam with High-Strength Steel Reinforcement. Materials 2022, 15, 8999. [Google Scholar] [CrossRef] [PubMed]
- Barbara, G.; Wiesław, T.; Justyna, T. Analysis of Crack Width Development in Reinforced Concrete Beams. Materials 2021, 14, 3043. [Google Scholar]
- Rong, X.; Wang, H.; Liu, P. Experimental study on the flexural performance of reinforced concrete beams configured with 600 MPa grade. J. Hebei Univ. Technol. 2015, 44, 86–89. (In Chinese) [Google Scholar]
- GB 50010; China Academy of Building Science. Code for the Design of Concrete Structures. China Construction Industry Press: Beijing, China, 2010. (In Chinese)
- Meng, X.; Bai, Z. The research and market exploitation about HRB500 reinforcing bar in Chengde Steel. Chin. Soc. Met. 2005, 43, 31–33. (In Chinese) [Google Scholar]
- GB/T 50152; China Academy of Building Science. Standard for Test Method of Concrete Structures. China Construction Industry Press: Beijing, China, 2012. (In Chinese)
- Yan, W. Analysis of Factors Influencing the Crack Width of Reinforced Concrete Beams; Chongqing Jiaotong University: Chongqing, China, 2010. (In Chinese) [Google Scholar]
- Chen, F. Study on the Calculation Model of Crack Width of Concrete Beams with 500 MPa Reinforcement; Tongji University: Shanghai, China, 2009. (In Chinese) [Google Scholar]
- Gu, X. Fundamental Principles of Concrete Structures; Tongji University Press: Shanghai, China, 2015. (In Chinese) [Google Scholar]
- Liu, C.; Bai, G.; Zhang, Y.; Yin, Y. Bending performance test and stiffness calculation method of regenerated concrete beams based on long-term effect of load. J. Build. Struct. 2016, 37 (Suppl. S2), 1–8. (In Chinese) [Google Scholar]
Figure 1.
Specimen reinforcement and geometric dimensions.
Figure 1.
Specimen reinforcement and geometric dimensions.
Figure 2.
Schematic diagram of the loading device for each member. 1—test beam; 2—rolling hinge bearing; 3—fixed hinge bearing; 4—pier; 5—reverse beam and gantry; 6—jack; 7—distribution beam.
Figure 2.
Schematic diagram of the loading device for each member. 1—test beam; 2—rolling hinge bearing; 3—fixed hinge bearing; 4—pier; 5—reverse beam and gantry; 6—jack; 7—distribution beam.
Figure 3.
Picture of the beam loading test.
Figure 3.
Picture of the beam loading test.
Figure 4.
Arrangement of RSG and deflection measurement points in the beam.
Figure 4.
Arrangement of RSG and deflection measurement points in the beam.
Figure 5.
RSG arrangement on both surfaces of the beam.
Figure 5.
RSG arrangement on both surfaces of the beam.
Figure 6.
Picture of L1 at the time of destruction.
Figure 6.
Picture of L1 at the time of destruction.
Figure 7.
Photographs of crack development in some specimens.
Figure 7.
Photographs of crack development in some specimens.
Figure 8.
L1 crack diagram (The numbers represent loading levels, each of which is 0.1 Pu).
Figure 8.
L1 crack diagram (The numbers represent loading levels, each of which is 0.1 Pu).
Figure 9.
Comparison curves of bending moment–average crack width of members L1–L8.
Figure 9.
Comparison curves of bending moment–average crack width of members L1–L8.
Figure 10.
Comparison curves of bending moment–maximum crack width of members L1–L8.
Figure 10.
Comparison curves of bending moment–maximum crack width of members L1–L8.
Figure 11.
Average crack spacing of members L1–L4 in relation to concrete strength.
Figure 11.
Average crack spacing of members L1–L4 in relation to concrete strength.
Figure 12.
Average crack spacing of members L1–L8 in relation to the ratio of reinforcement diameter and reinforcement ratio.
Figure 12.
Average crack spacing of members L1–L8 in relation to the ratio of reinforcement diameter and reinforcement ratio.
Figure 13.
Average crack width of members L1–L8 versus reinforcement strain curve.
Figure 13.
Average crack width of members L1–L8 versus reinforcement strain curve.
Figure 14.
Fitting curve of average crack spacing.
Figure 14.
Fitting curve of average crack spacing.
Figure 15.
Fitted curve of the internal force arm coefficient.
Figure 15.
Fitted curve of the internal force arm coefficient.
Figure 16.
Fitted curve of reinforcement inhomogeneity coefficient.
Figure 16.
Fitted curve of reinforcement inhomogeneity coefficient.
Figure 17.
Fitting curve of maximum crack width.
Figure 17.
Fitting curve of maximum crack width.
Table 1.
Main parameters of the specimen.
Table 2.
Concrete materiality test results.
Table 2.
Concrete materiality test results.
| Strength Grade | fcu/MPa | fck/MPa | ftk/MPa | Ec/MPa |
|---|
| C30 | 27.9 | 18.7 | 2.46 | 30,000 |
| C40 | 40.1 | 26.8 | 3.01 | 32,500 |
| C50 | 46.1 | 30.8 | 3.25 | 34,500 |
| C60 | 62.0 | 40.7 | 3.82 | 36,000 |
Table 3.
HRB600-grade high-strength reinforcement material test results.
Table 3.
HRB600-grade high-strength reinforcement material test results.
| Diameter (mm) | fy/MPa | fu/MPa | δ/% | Es/MPa | fy/fu | fy/600 |
|---|
| 20 | 650.9 | 824.2 | 14.2 | 190,000 | 1.27 | 1.08 |
| 22 | 645.9 | 802.4 | 11.5 | 197,500 | 1.24 | 1.08 |
| 25 | 634.9 | 818.1 | 9.9 | 196,000 | 1.29 | 1.06 |
Table 4.
Average crack spacing of the reinforced concrete beams and its variation coefficient.
Table 4.
Average crack spacing of the reinforced concrete beams and its variation coefficient.
| Specimen Number | Front | Back | Average |
|---|
Average
(mm) | CV | Average
(mm) | CV | Average
(mm) | CV |
|---|
| L1 | 104.7 | 0.43 | 111.9 | 0.40 | 105.5 | 0.35 |
| L2 | 138.6 | 0.30 | 118.1 | 0.30 | 125.3 | 0.32 |
| L3 | 91.5 | 0.41 | 123.8 | 0.34 | 107.6 | 0.38 |
| L4 | 109.4 | 0.33 | 126.0 | 0.40 | 112.7 | 0.33 |
| L5 | 90.9 | 0.34 | 108.8 | 0.34 | 103.2 | 0.35 |
| L6 | 89.5 | 0.34 | 89.1 | 0.39 | 89.3 | 0.36 |
| L7 | 105.8 | 0.36 | 70.3 | 0.38 | 86.2 | 0.40 |
| L8 | 85.2 | 0.39 | 94.5 | 0.40 | 89.8 | 0.39 |
Table 5.
Average crack widths and their coefficients of variation for specimens L1–L4.
Table 5.
Average crack widths and their coefficients of variation for specimens L1–L4.
| Load | L1 | L2 | L3 | L4 |
|---|
Average
(mm) | CV | Average
(mm) | CV | Average
(mm) | CV | Average
(mm) | CV |
|---|
| (0.3 Pu) | 0.06 | 0.36 | 0.07 | 0.46 | 0.03 | 0.39 | 0.08 | 0.50 |
| (0.4 Pu) | 0.10 | 0.35 | 0.11 | 0.36 | 0.06 | 0.55 | 0.12 | 0.37 |
| (0.5 Pu) | 0.13 | 0.36 | 0.13 | 0.40 | 0.09 | 0.54 | 0.14 | 0.34 |
| (0.6 Pu) | 0.15 | 0.32 | 0.18 | 0.36 | 0.12 | 0.41 | 0.18 | 0.32 |
| (0.7 Pu) | 0.18 | 0.36 | 0.20 | 0.33 | 0.15 | 0.38 | 0.20 | 0.28 |
| (0.8 Pu) | 0.22 | 0.30 | 0.23 | 0.29 | 0.19 | 0.31 | 0.22 | 0.27 |
Table 6.
Average crack widths and their coefficients of variation for members L5–L8.
Table 6.
Average crack widths and their coefficients of variation for members L5–L8.
| Load | L5 | L6 | L7 | L8 |
|---|
Average
(mm) | CV | Average
(mm) | CV | Average
(mm) | CV | Average
(mm) | CV |
|---|
| (0.3 Pu) | 0.06 | 0.59 | 0.05 | 0.54 | 0.05 | 0.64 | 0.04 | 0.57 |
| (0.4 Pu) | 0.08 | 0.55 | 0.08 | 0.38 | 0.08 | 0.53 | 0.06 | 0.52 |
| (0.5 Pu) | 0.10 | 0.46 | 0.11 | 0. 34 | 0.10 | 0.55 | 0.08 | 0.43 |
| (0.6 Pu) | 0.13 | 0.42 | 0.14 | 0.29 | 0.13 | 0.51 | 0.11 | 0.40 |
| (0.7 Pu) | 0.16 | 0.42 | 0.18 | 0.28 | 0.16 | 0.41 | 0.15 | 0.31 |
| (0.8 Pu) | 0.19 | 0.37 | 0.21 | 0.23 | 0.18 | 0.37 | 0.17 | 0.31 |
Table 7.
Comparison of Ultimate Load Test Values and Theoretical Values.
Table 7.
Comparison of Ultimate Load Test Values and Theoretical Values.
| Number | Experimental Value
(kN) | Theoretical Value
(kN) | Error
(%) | Number | Experimental Value
(kN) | Theoretical Value
(kN) | Error
(%) |
|---|
| L1 | 562.8 | 478 | 18 | L5 | 772.1 | 642 | 20 |
| L2 | 587.6 | 496 | 18 | L6 | 899.2 | 776 | 16 |
| L3 | 600.0 | 500 | 20 | L7 | 1085.3 | 900 | 21 |
| L4 | 657.4 | 508 | 29 | L8 | 1294.6 | 1074 | 21 |
Table 8.
Analysis of average crack width and reinforcement diameter-to-ratio relationship.
Table 8.
Analysis of average crack width and reinforcement diameter-to-ratio relationship.
| Number of Loading Stages | /10−8 |
|---|
| L1 | L2 | L3 | L4 | L5 | L6 | L7 | L8 |
|---|
| Level 3 | 2.68 | 2.66 | 1.49 | 3.46 | 2.83 | 3.10 | 3.83 | 3.46 |
| Level 4 | 2.94 | 2.95 | 1.87 | 3.72 | 2.64 | 3.40 | 4.24 | 3.75 |
| Level 5 | 2.85 | 2.70 | 2.03 | 3.39 | 2.62 | 3.67 | 4.14 | 3.88 |
| Level 6 | 2.62 | 3.03 | 2.14 | 3.52 | 2.79 | 3.84 | 4.34 | 4.34 |
| Level 7 | 2.59 | 2.82 | 2.21 | 3.34 | 2.91 | 4.08 | 4.53 | 5.01 |
| Level 8 | 2.71 | 2.81 | 2.43 | 3.20 | 3.04 | 4.22 | 4.37 | 4.94 |
| Average | 2.73 | 2.83 | 2.03 | 3.44 | 2.80 | 3.72 | 4.24 | 4.23 |
Table 9.
Analysis table of the relationship between the average crack width and concrete strength.
Table 9.
Analysis table of the relationship between the average crack width and concrete strength.
| Number of Loading Stages | /(L∙T2∙M−1) |
|---|
| L1 | L2 | L3 | L4 |
|---|
| Level 3 | 2.83 | 1.95 | 0.95 | 1.64 |
| Level 4 | 3.10 | 2.17 | 1.19 | 1.77 |
| Level 5 | 3.00 | 1.98 | 1.30 | 1.61 |
| Level 6 | 2.77 | 2.22 | 1.37 | 1.67 |
| Level 7 | 2.73 | 2.07 | 1.41 | 1.58 |
| Level 8 | 2.85 | 2.06 | 1.55 | 1.52 |
| Average | 2.88 | 2.08 | 1.29 | 1.63 |
| Disclaimer/Publisher’s Note: The statements, opinions and data contained in all publications are solely those of the individual author(s) and contributor(s) and not of MDPI and/or the editor(s). MDPI and/or the editor(s) disclaim responsibility for any injury to people or property resulting from any ideas, methods, instructions or products referred to in the content. |
© 2023 by the authors. Licensee MDPI, Basel, Switzerland. This article is an open access article distributed under the terms and conditions of the Creative Commons Attribution (CC BY) license (https://creativecommons.org/licenses/by/4.0/).


 10) diameter longitudinal reinforcement were provided in the compression zone of the beams, while the middle sections on both sides of the beams were reinforced with two layers of 10 mm diameter (2
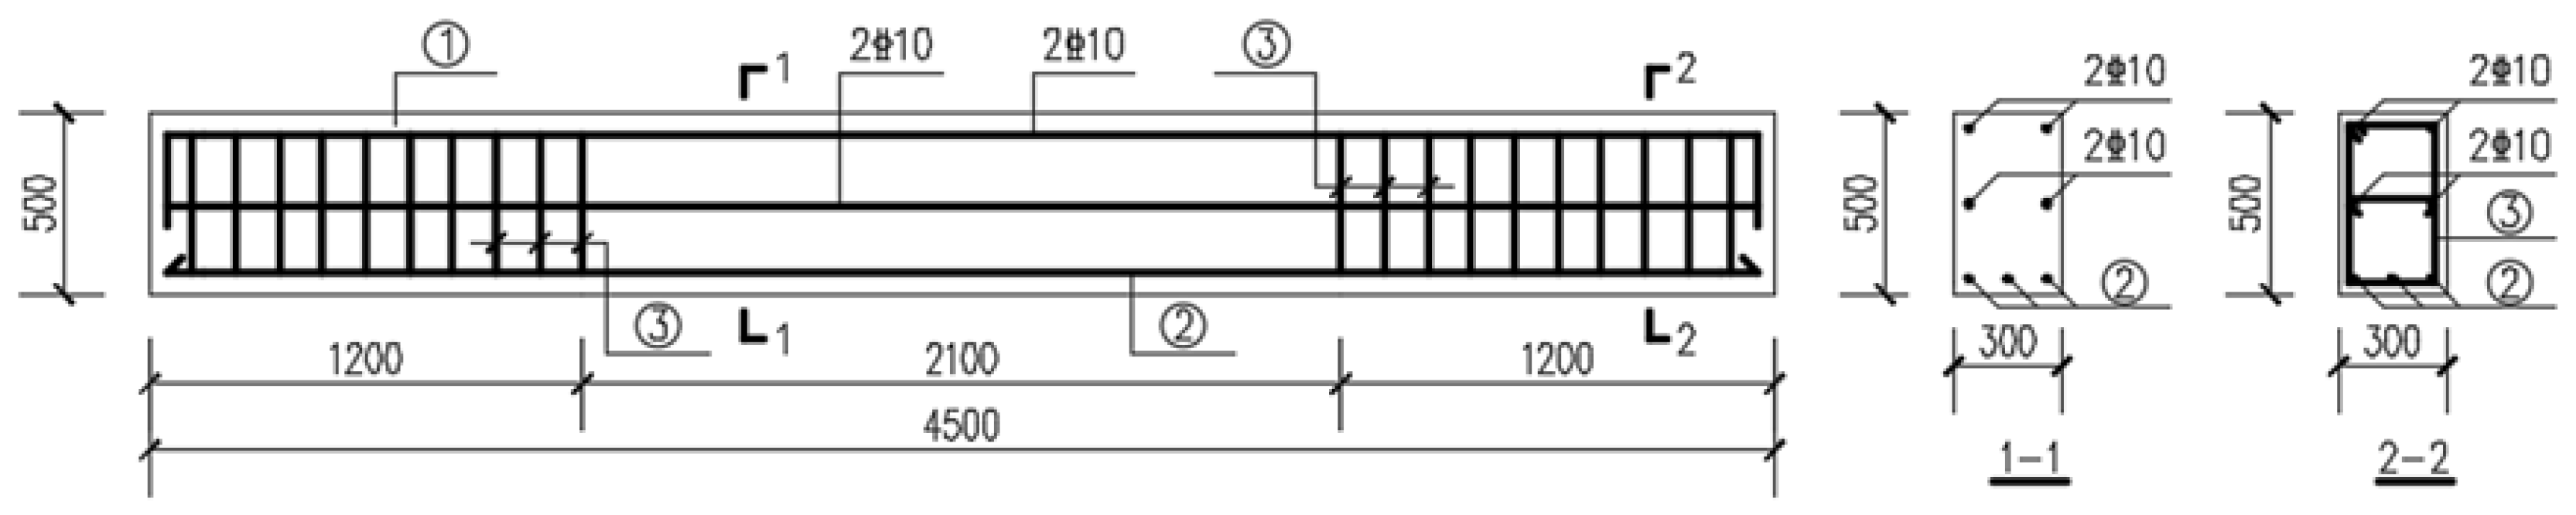


