
Study on Xiamen’s Spring and Winter Thermal Comfort of Outdoor Sports Space in the Residential Community

Abstract
:1. Introduction
2. Materials and Methods
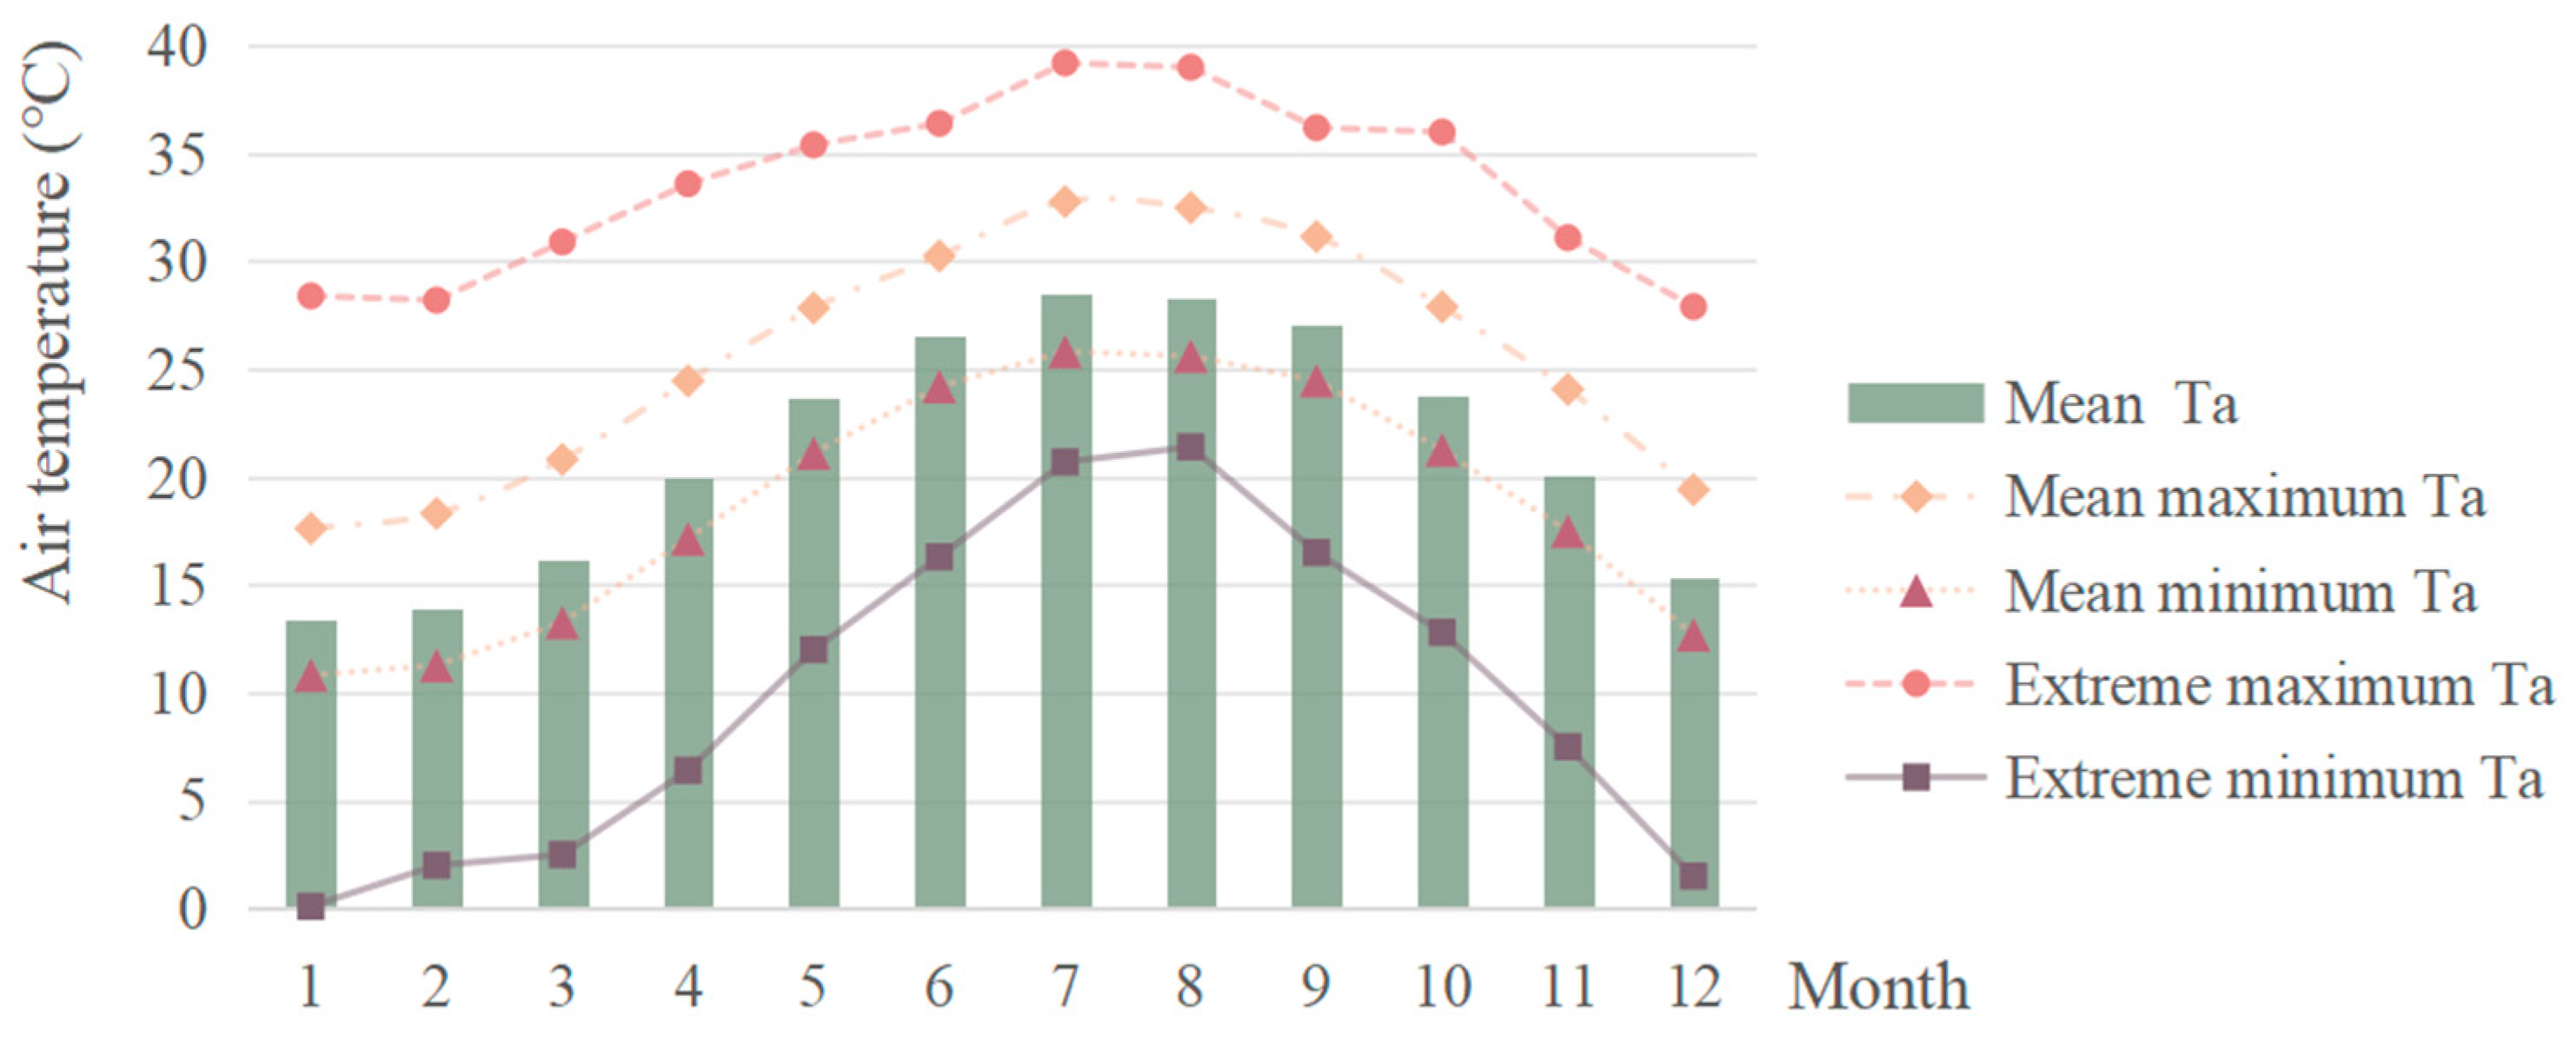
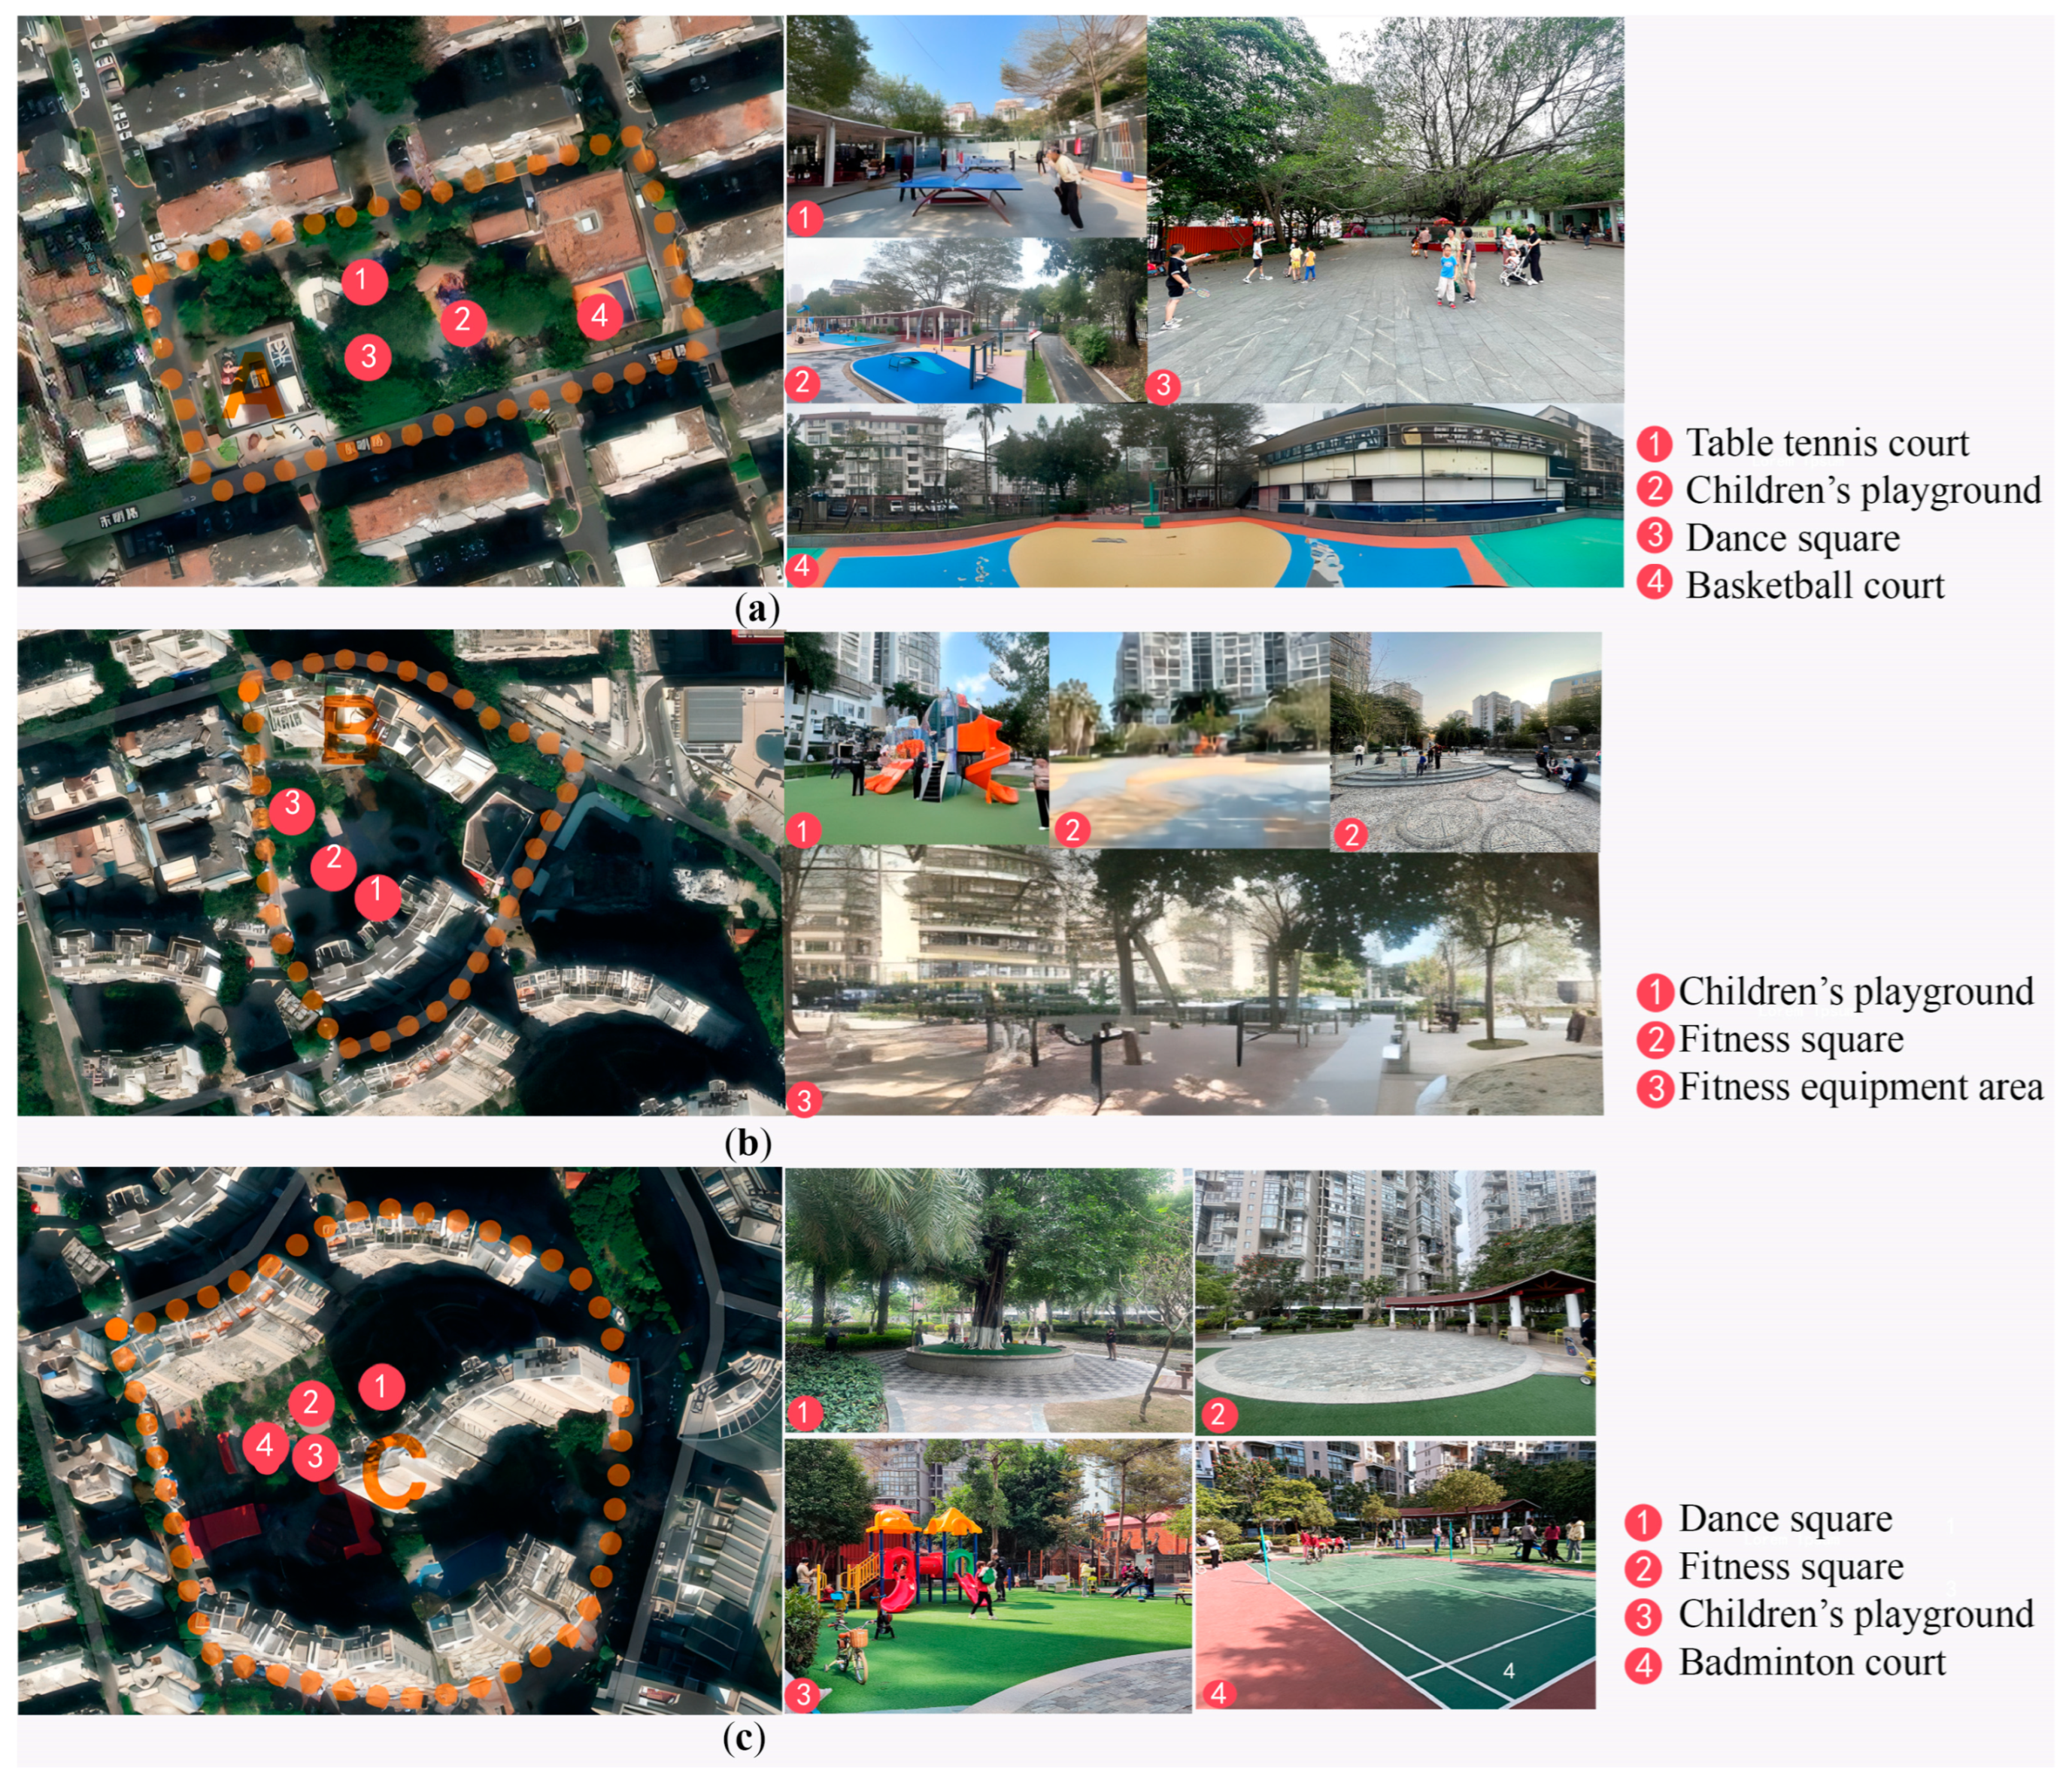
2.1. Study Area and Climate
2.2. Observations and Recording
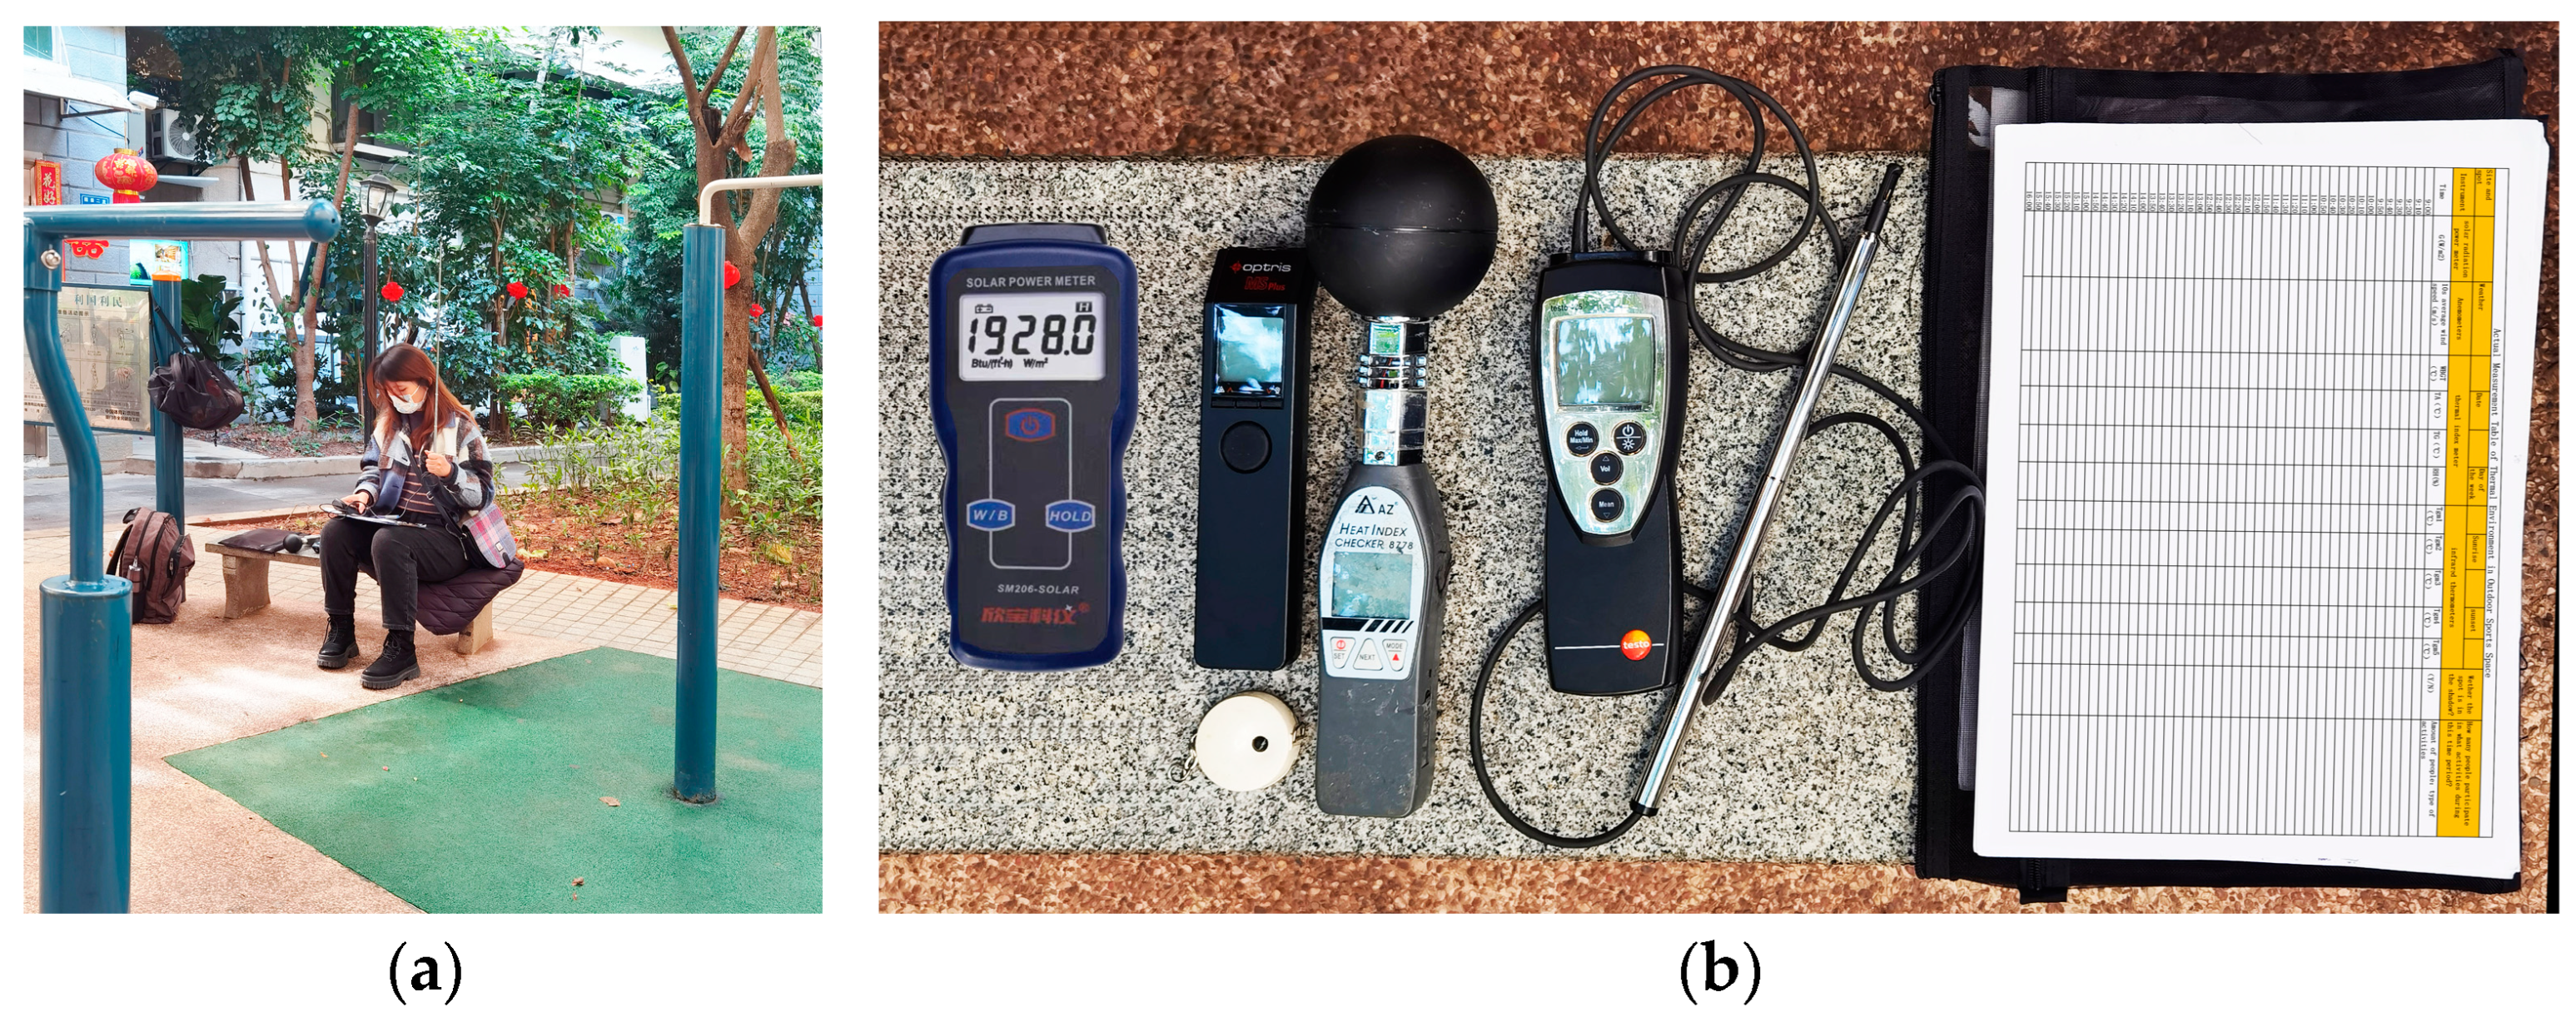
2.3. Meteorological Measurements
2.4. Questionnaire Surveys and Interviews
2.5. Outdoor Thermal Comfort Index
3. Actual Measurement Results
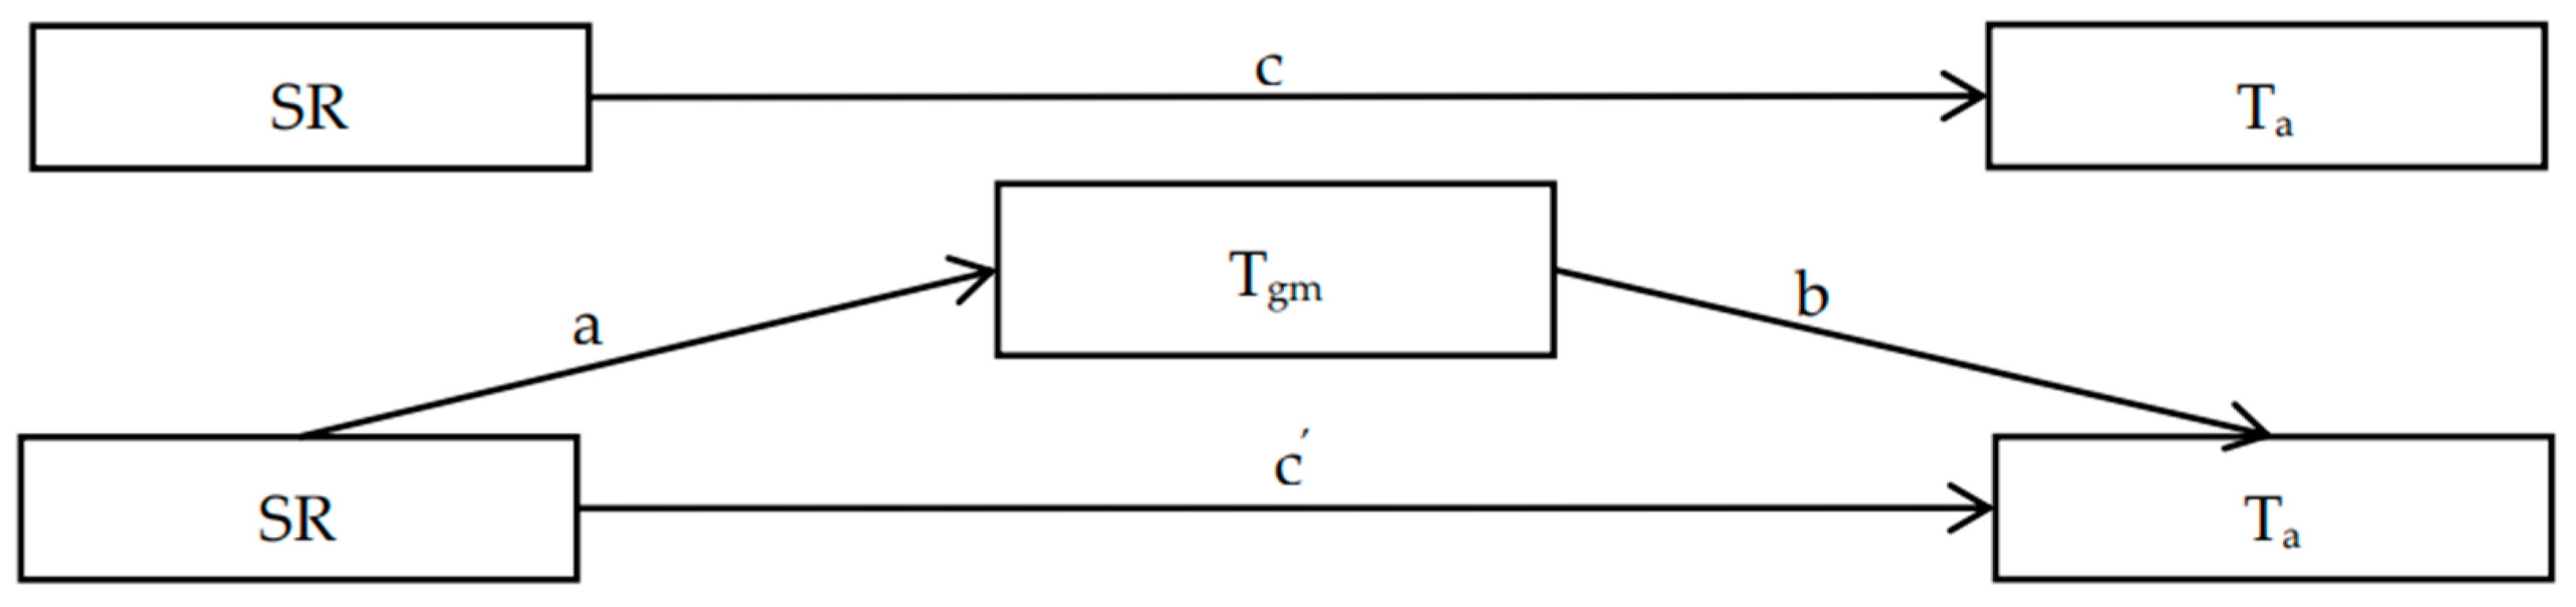
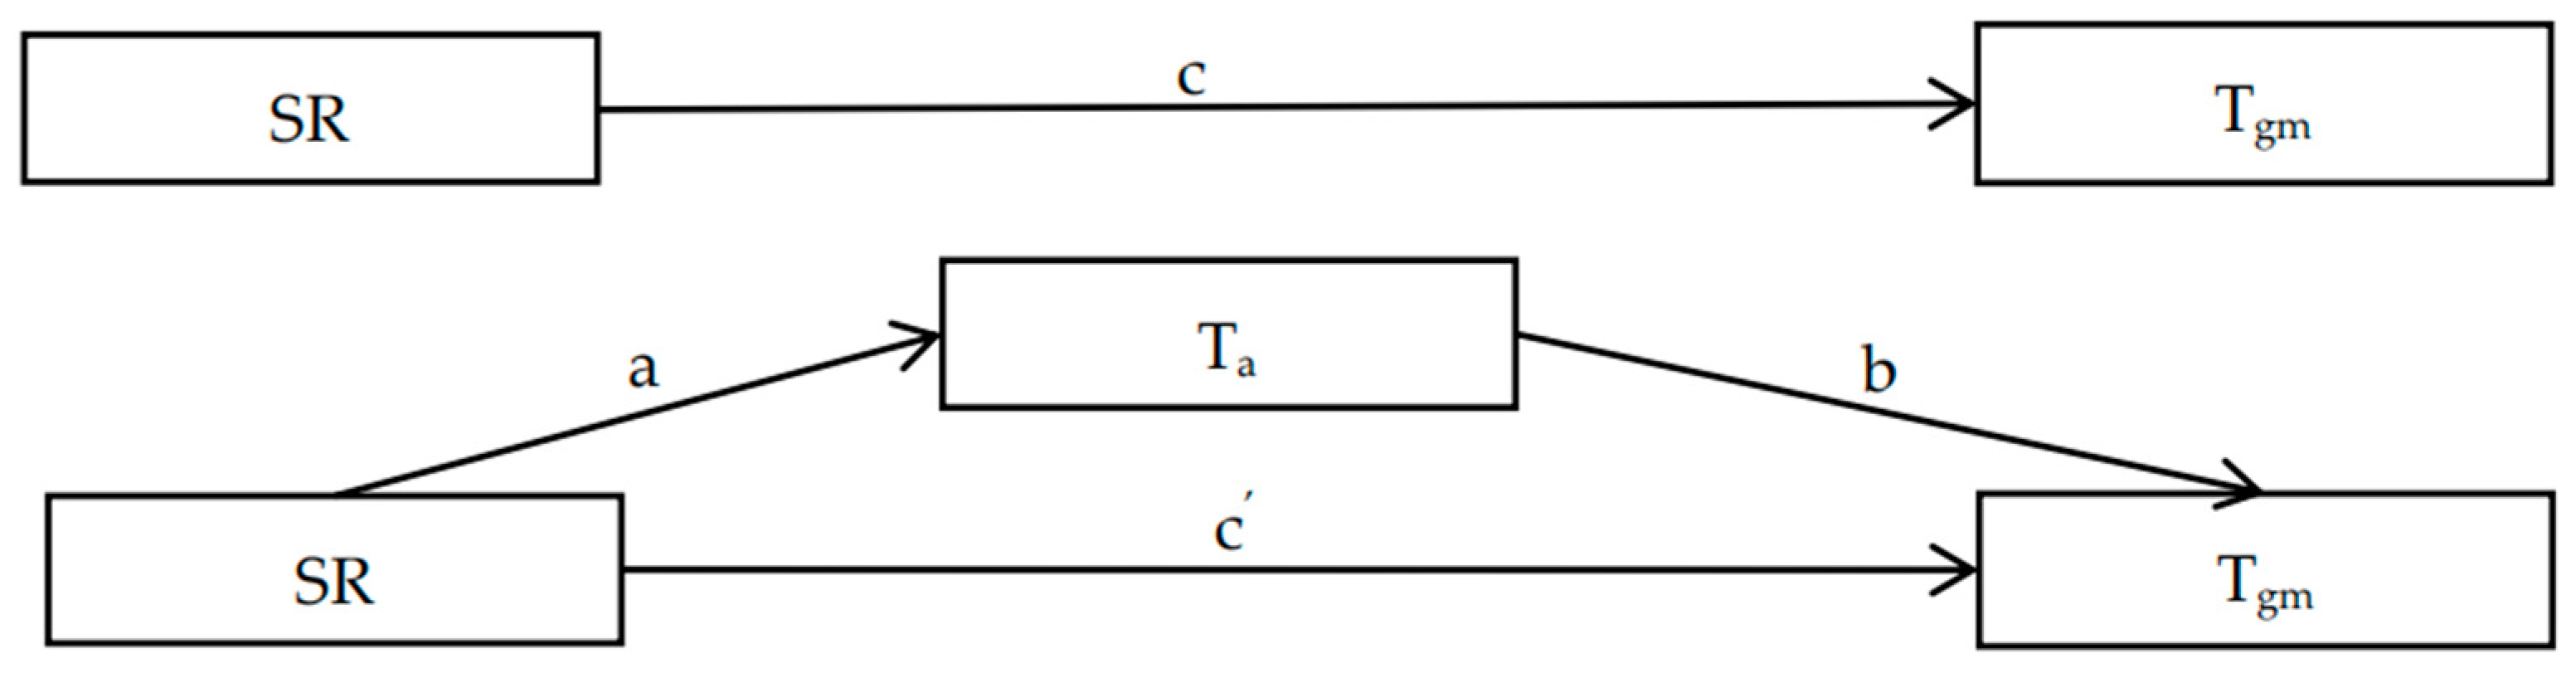
3.1. Factors Affecting Ta
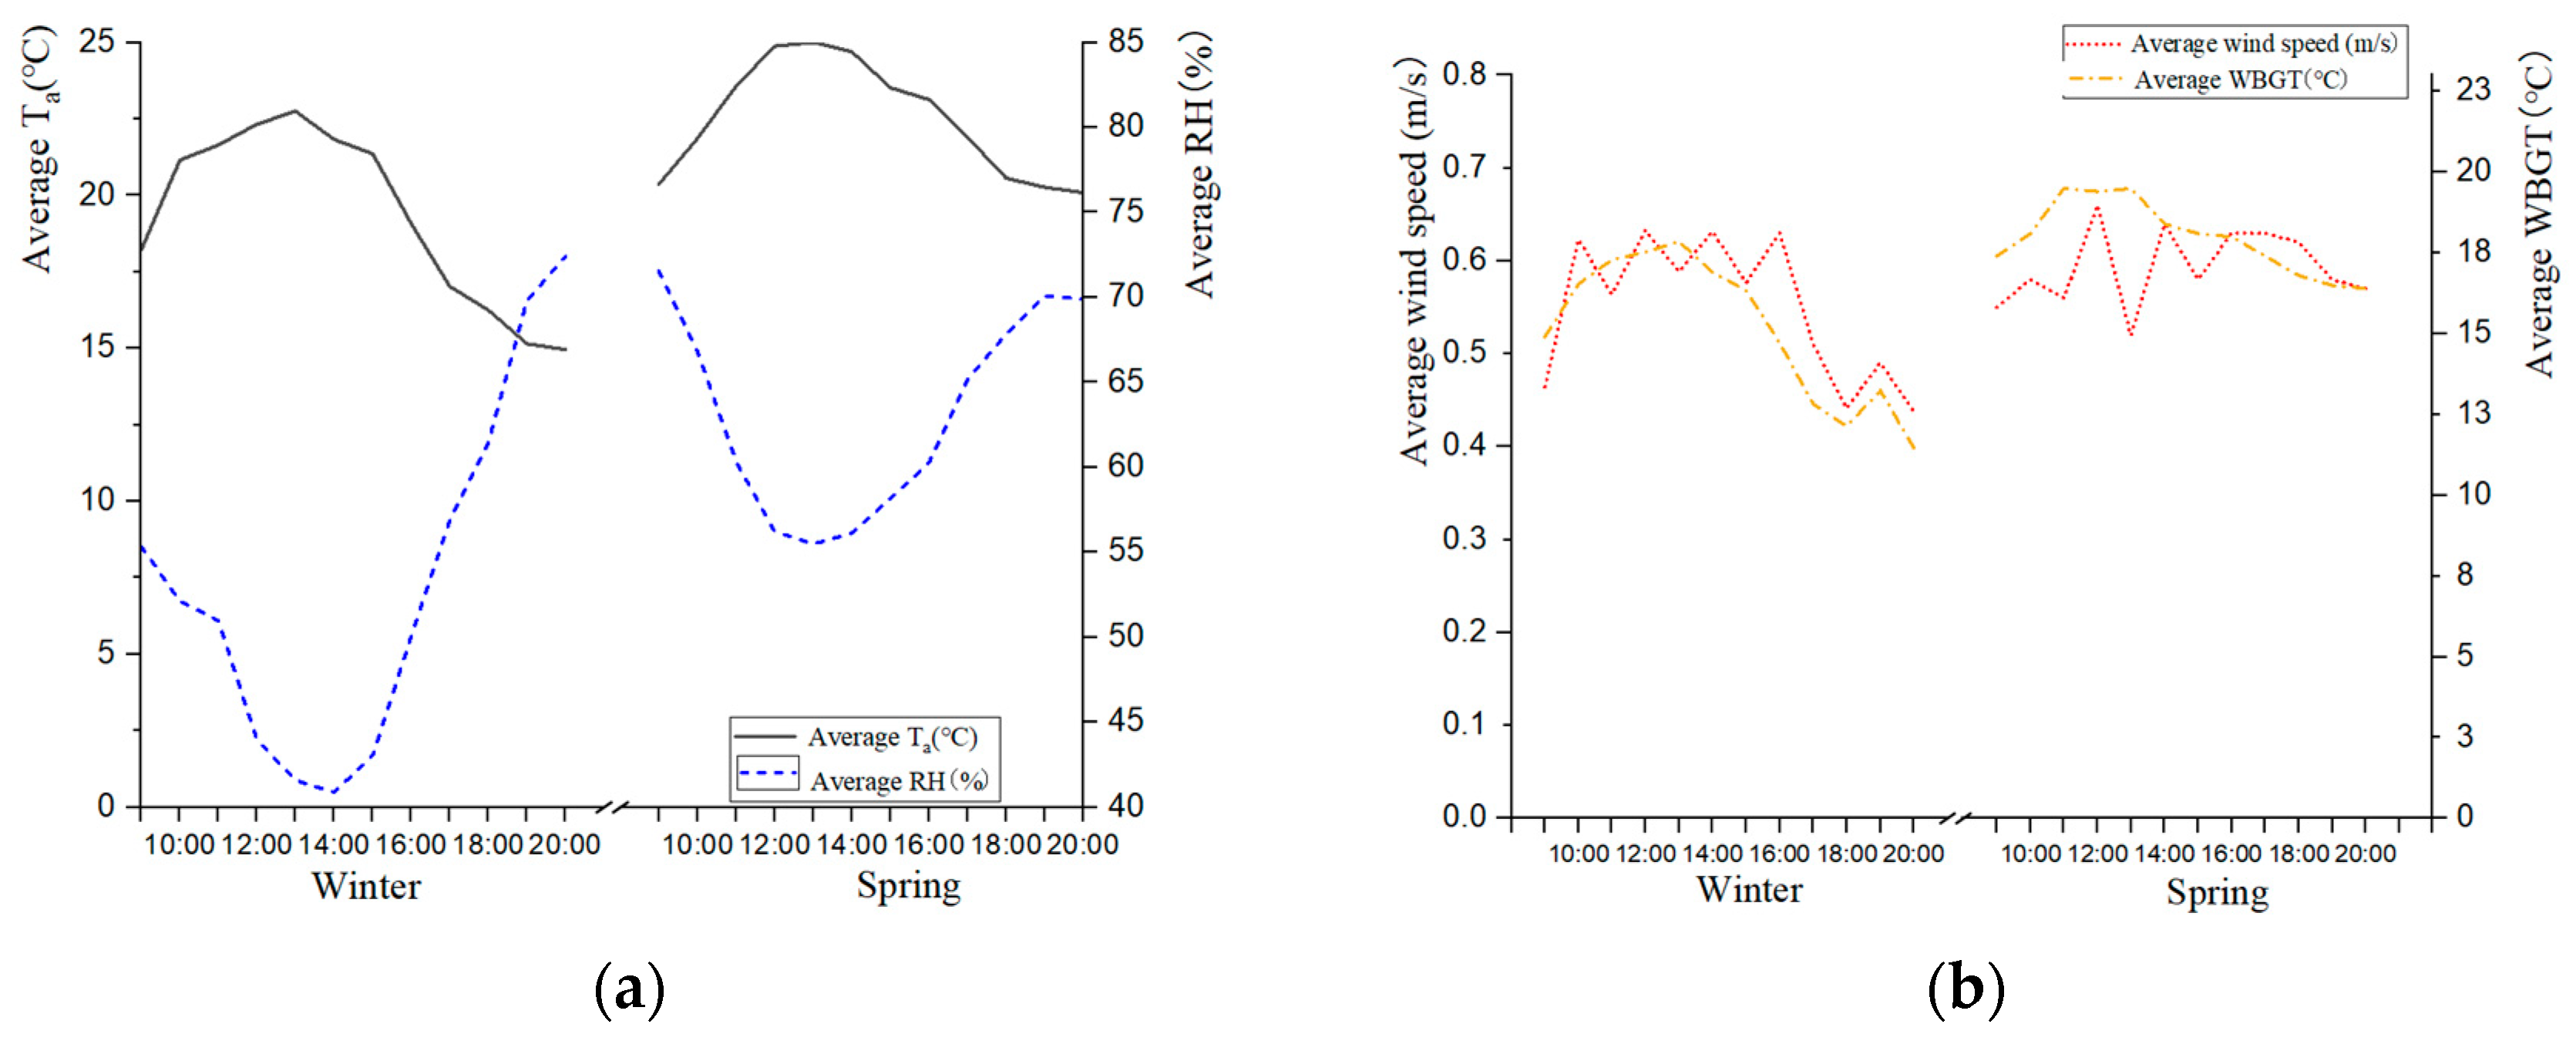
3.2. Micrometeorological Conditions
3.3. Space Use
4. Outdoor Thermal Comfort Questionnaire Analysis
4.1. Thermal Comfort Parameters Vote
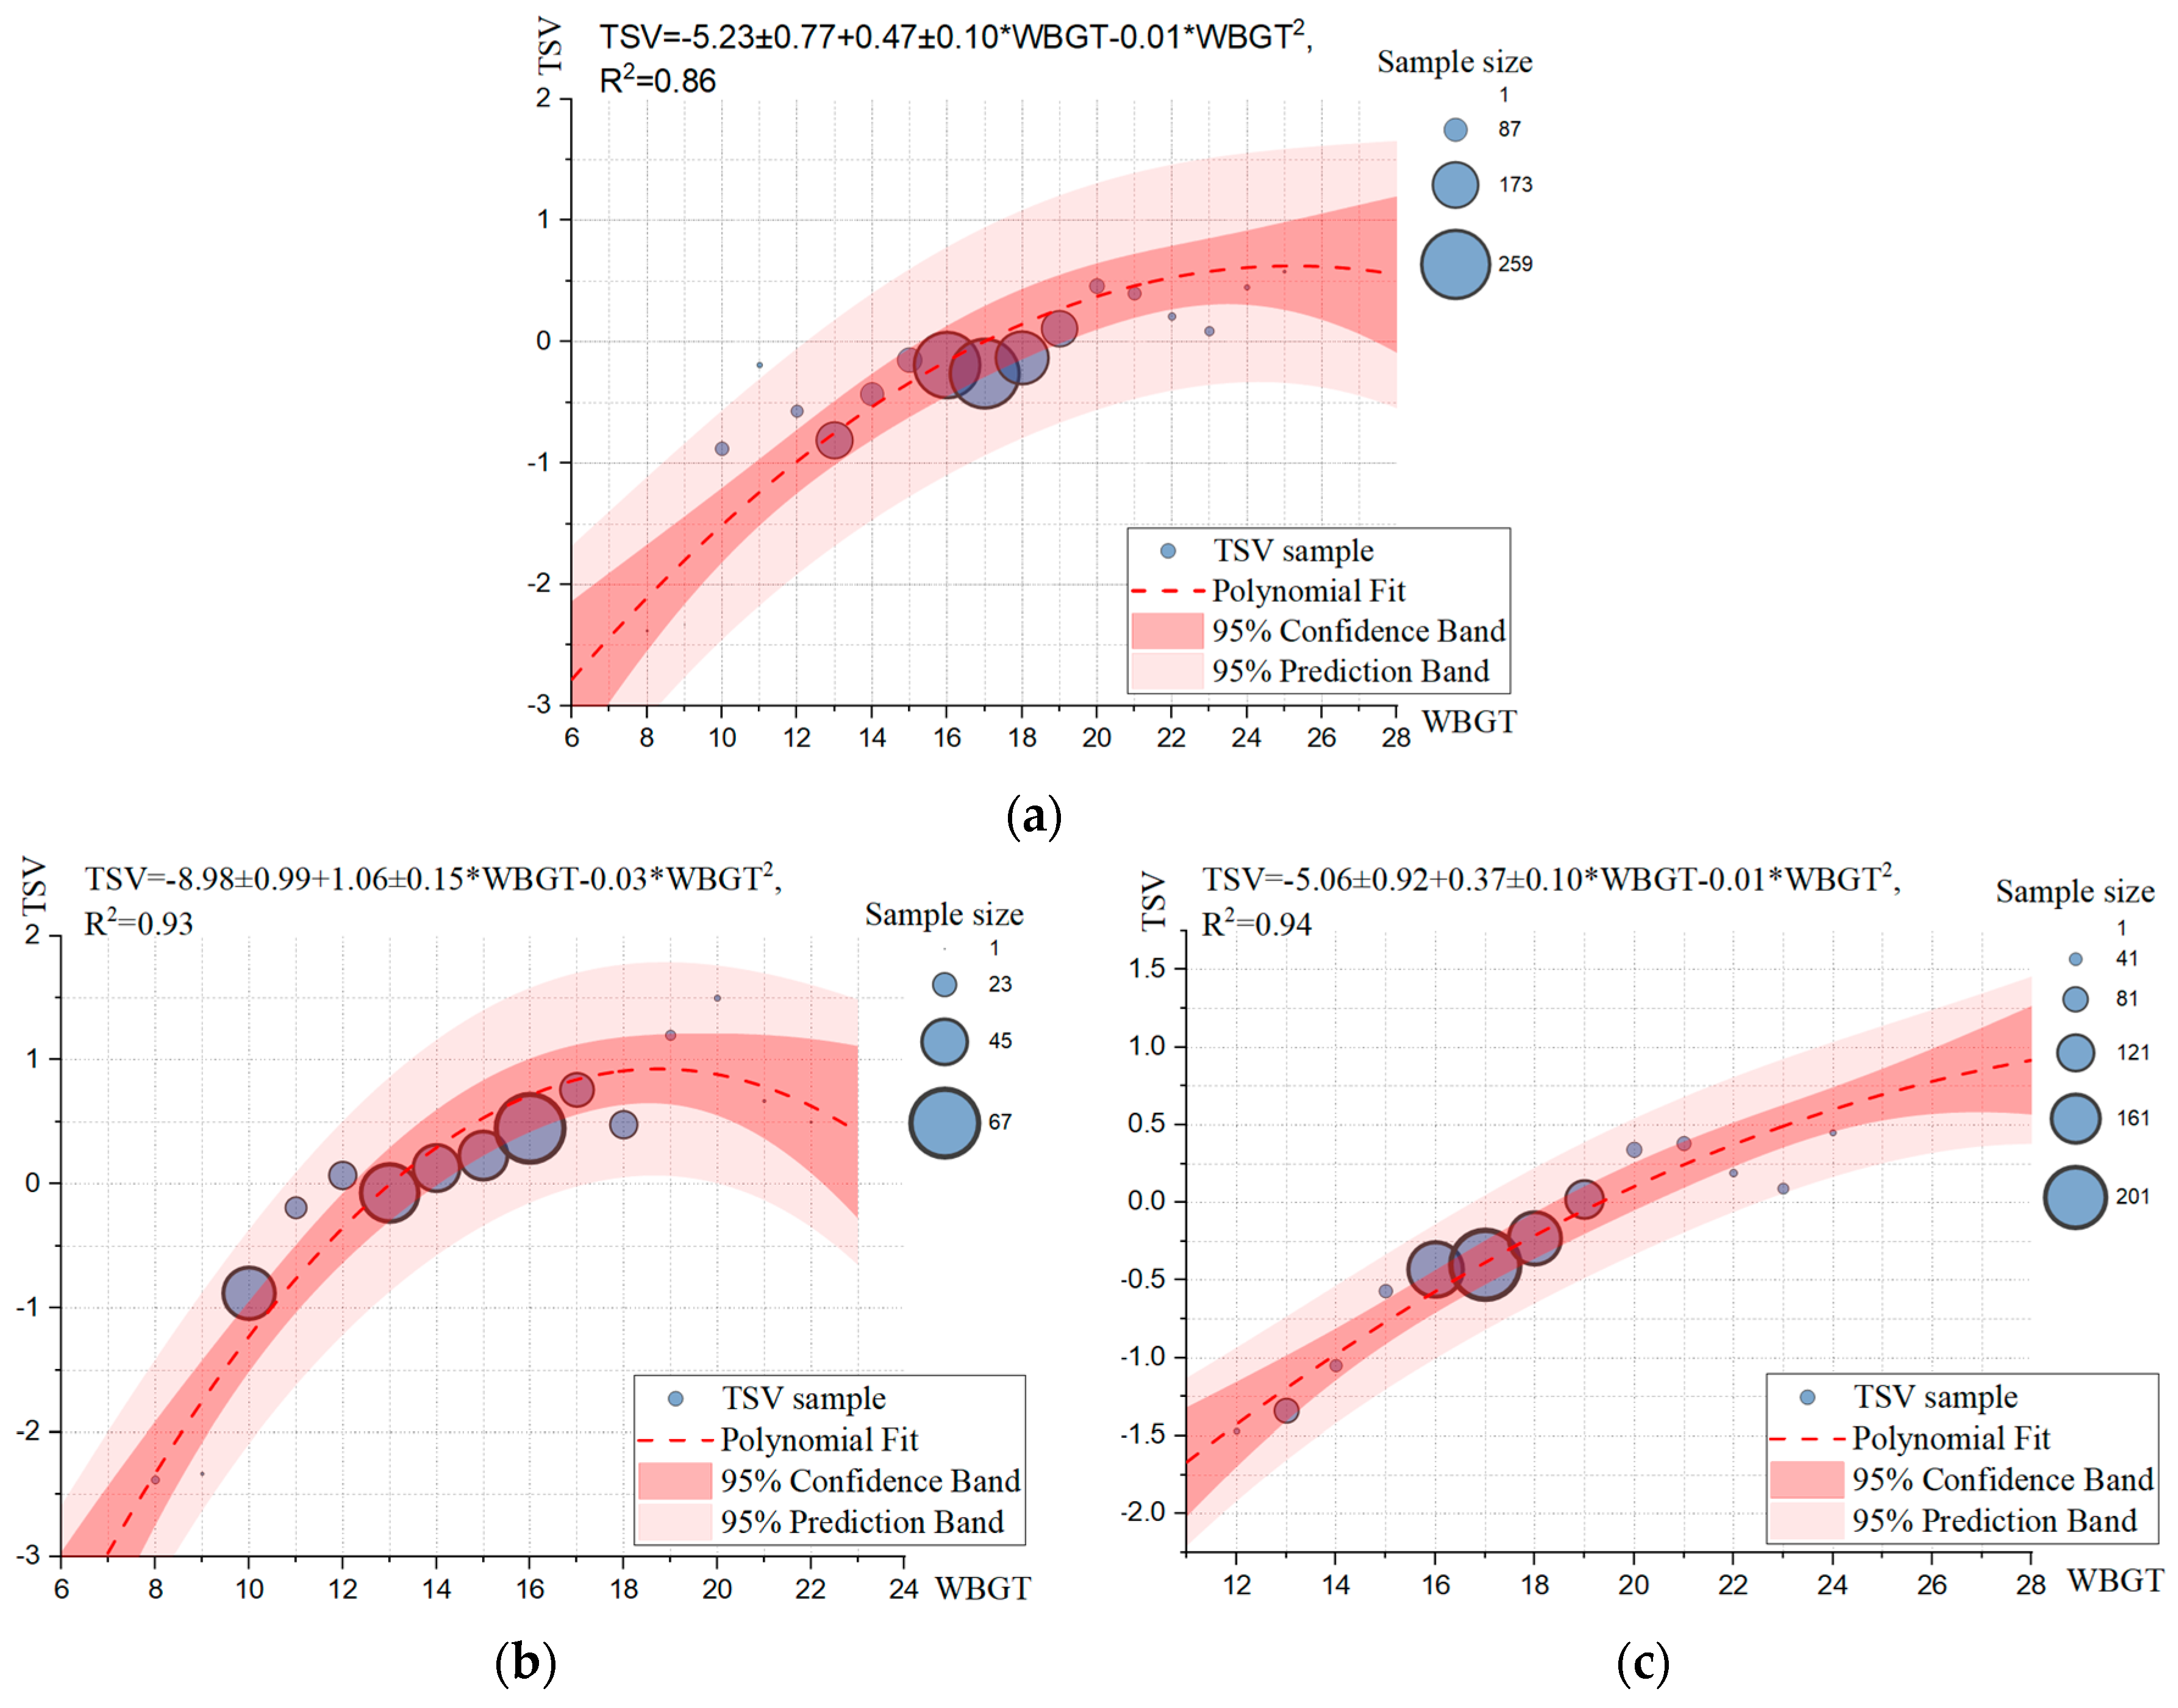
4.2. Quantitative Evaluation of Thermal Sensation
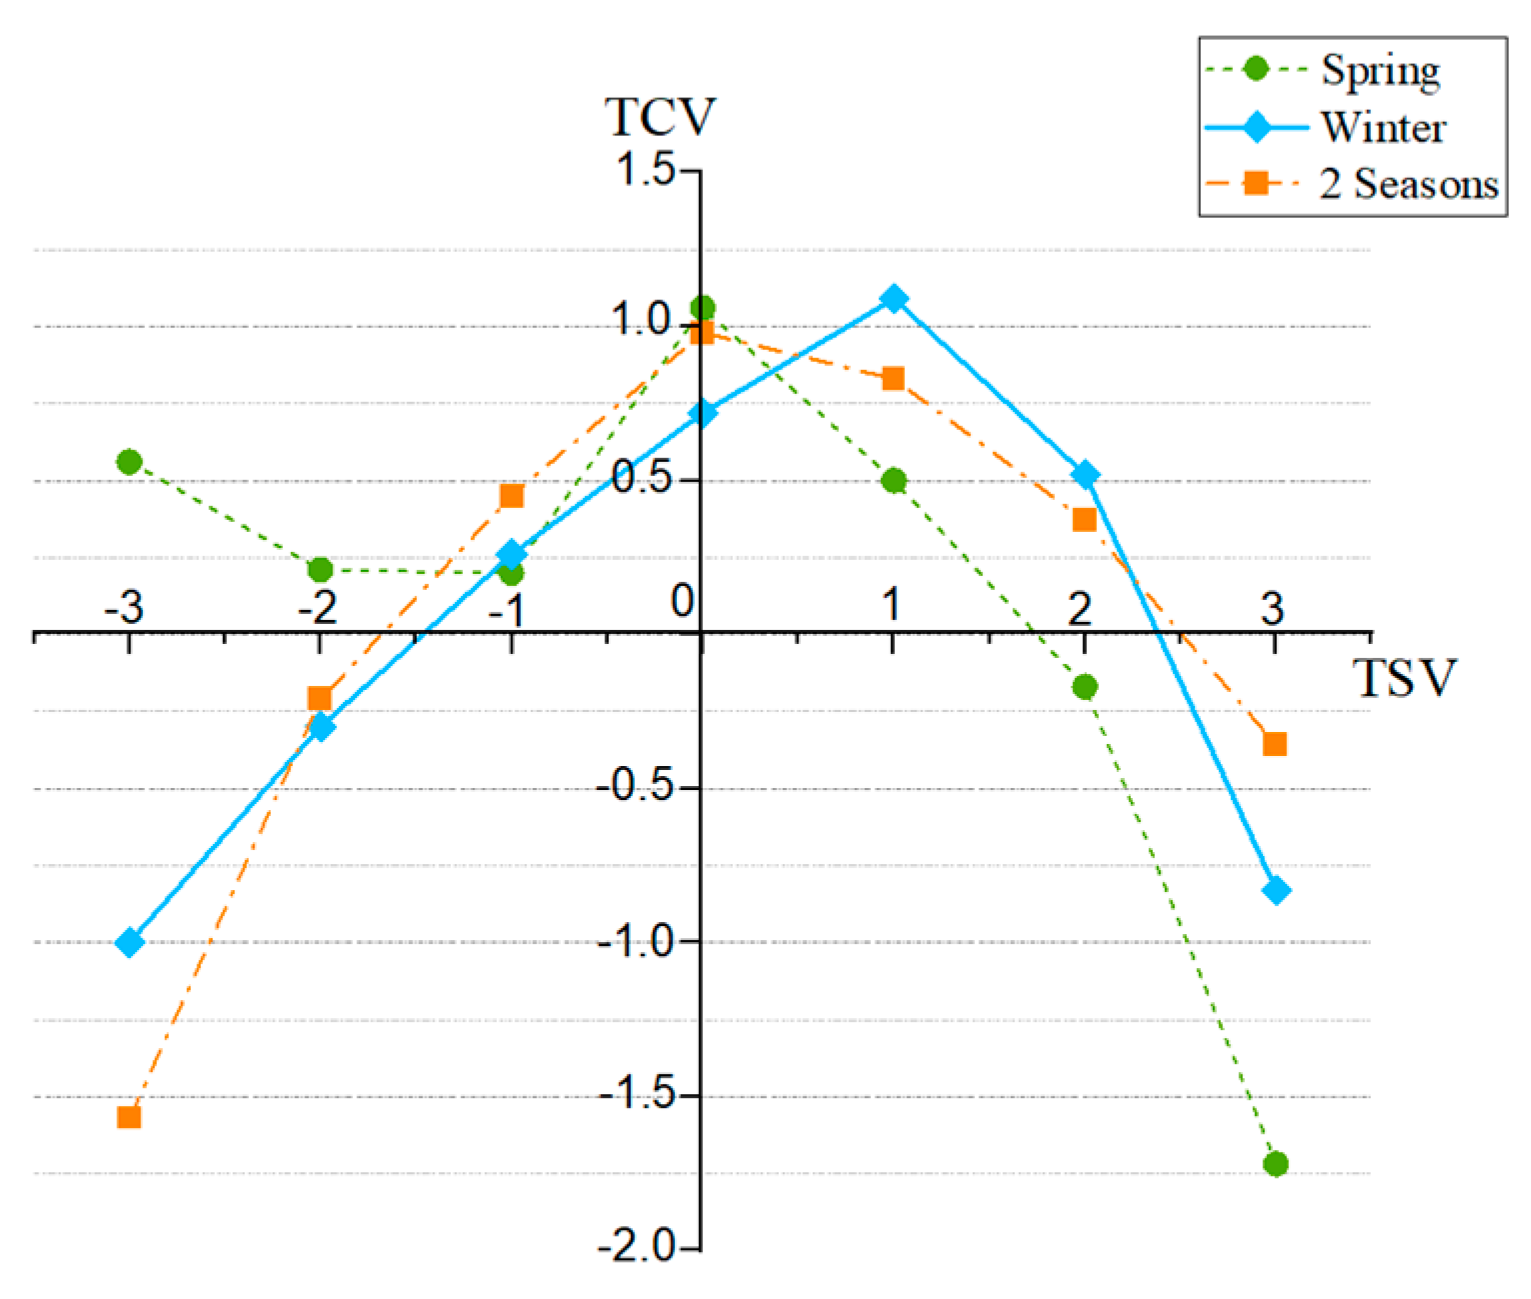
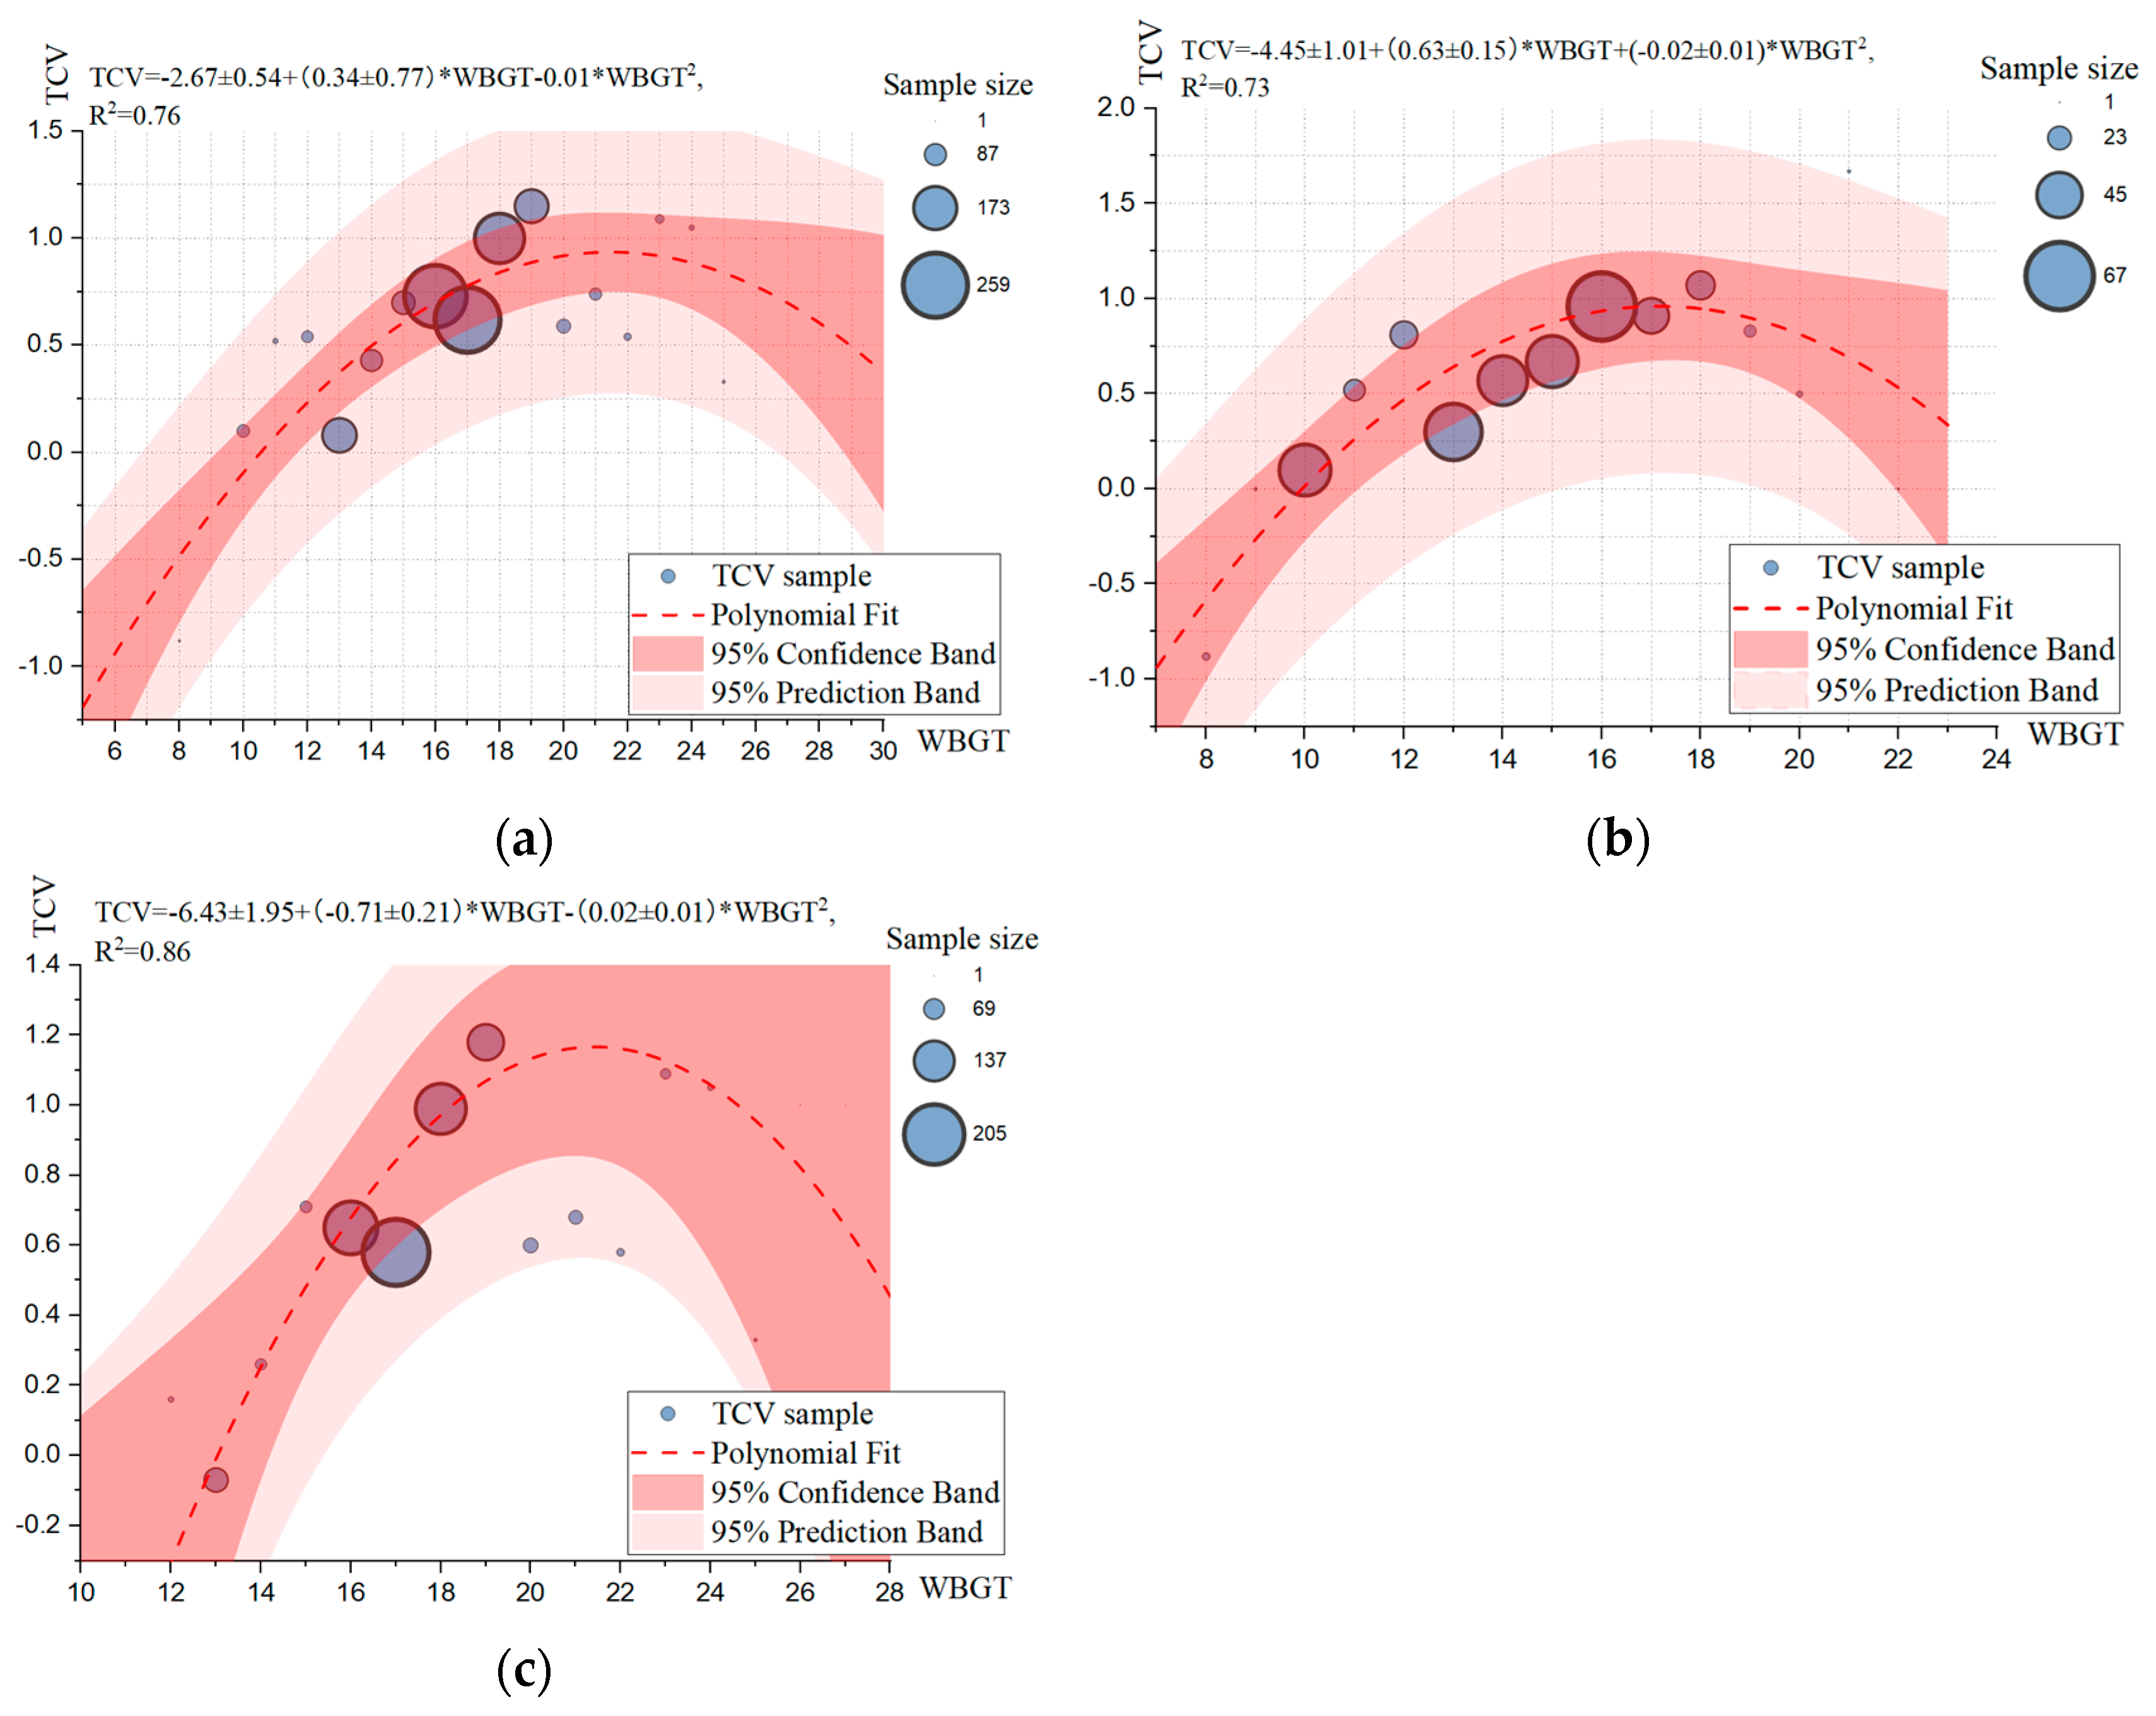
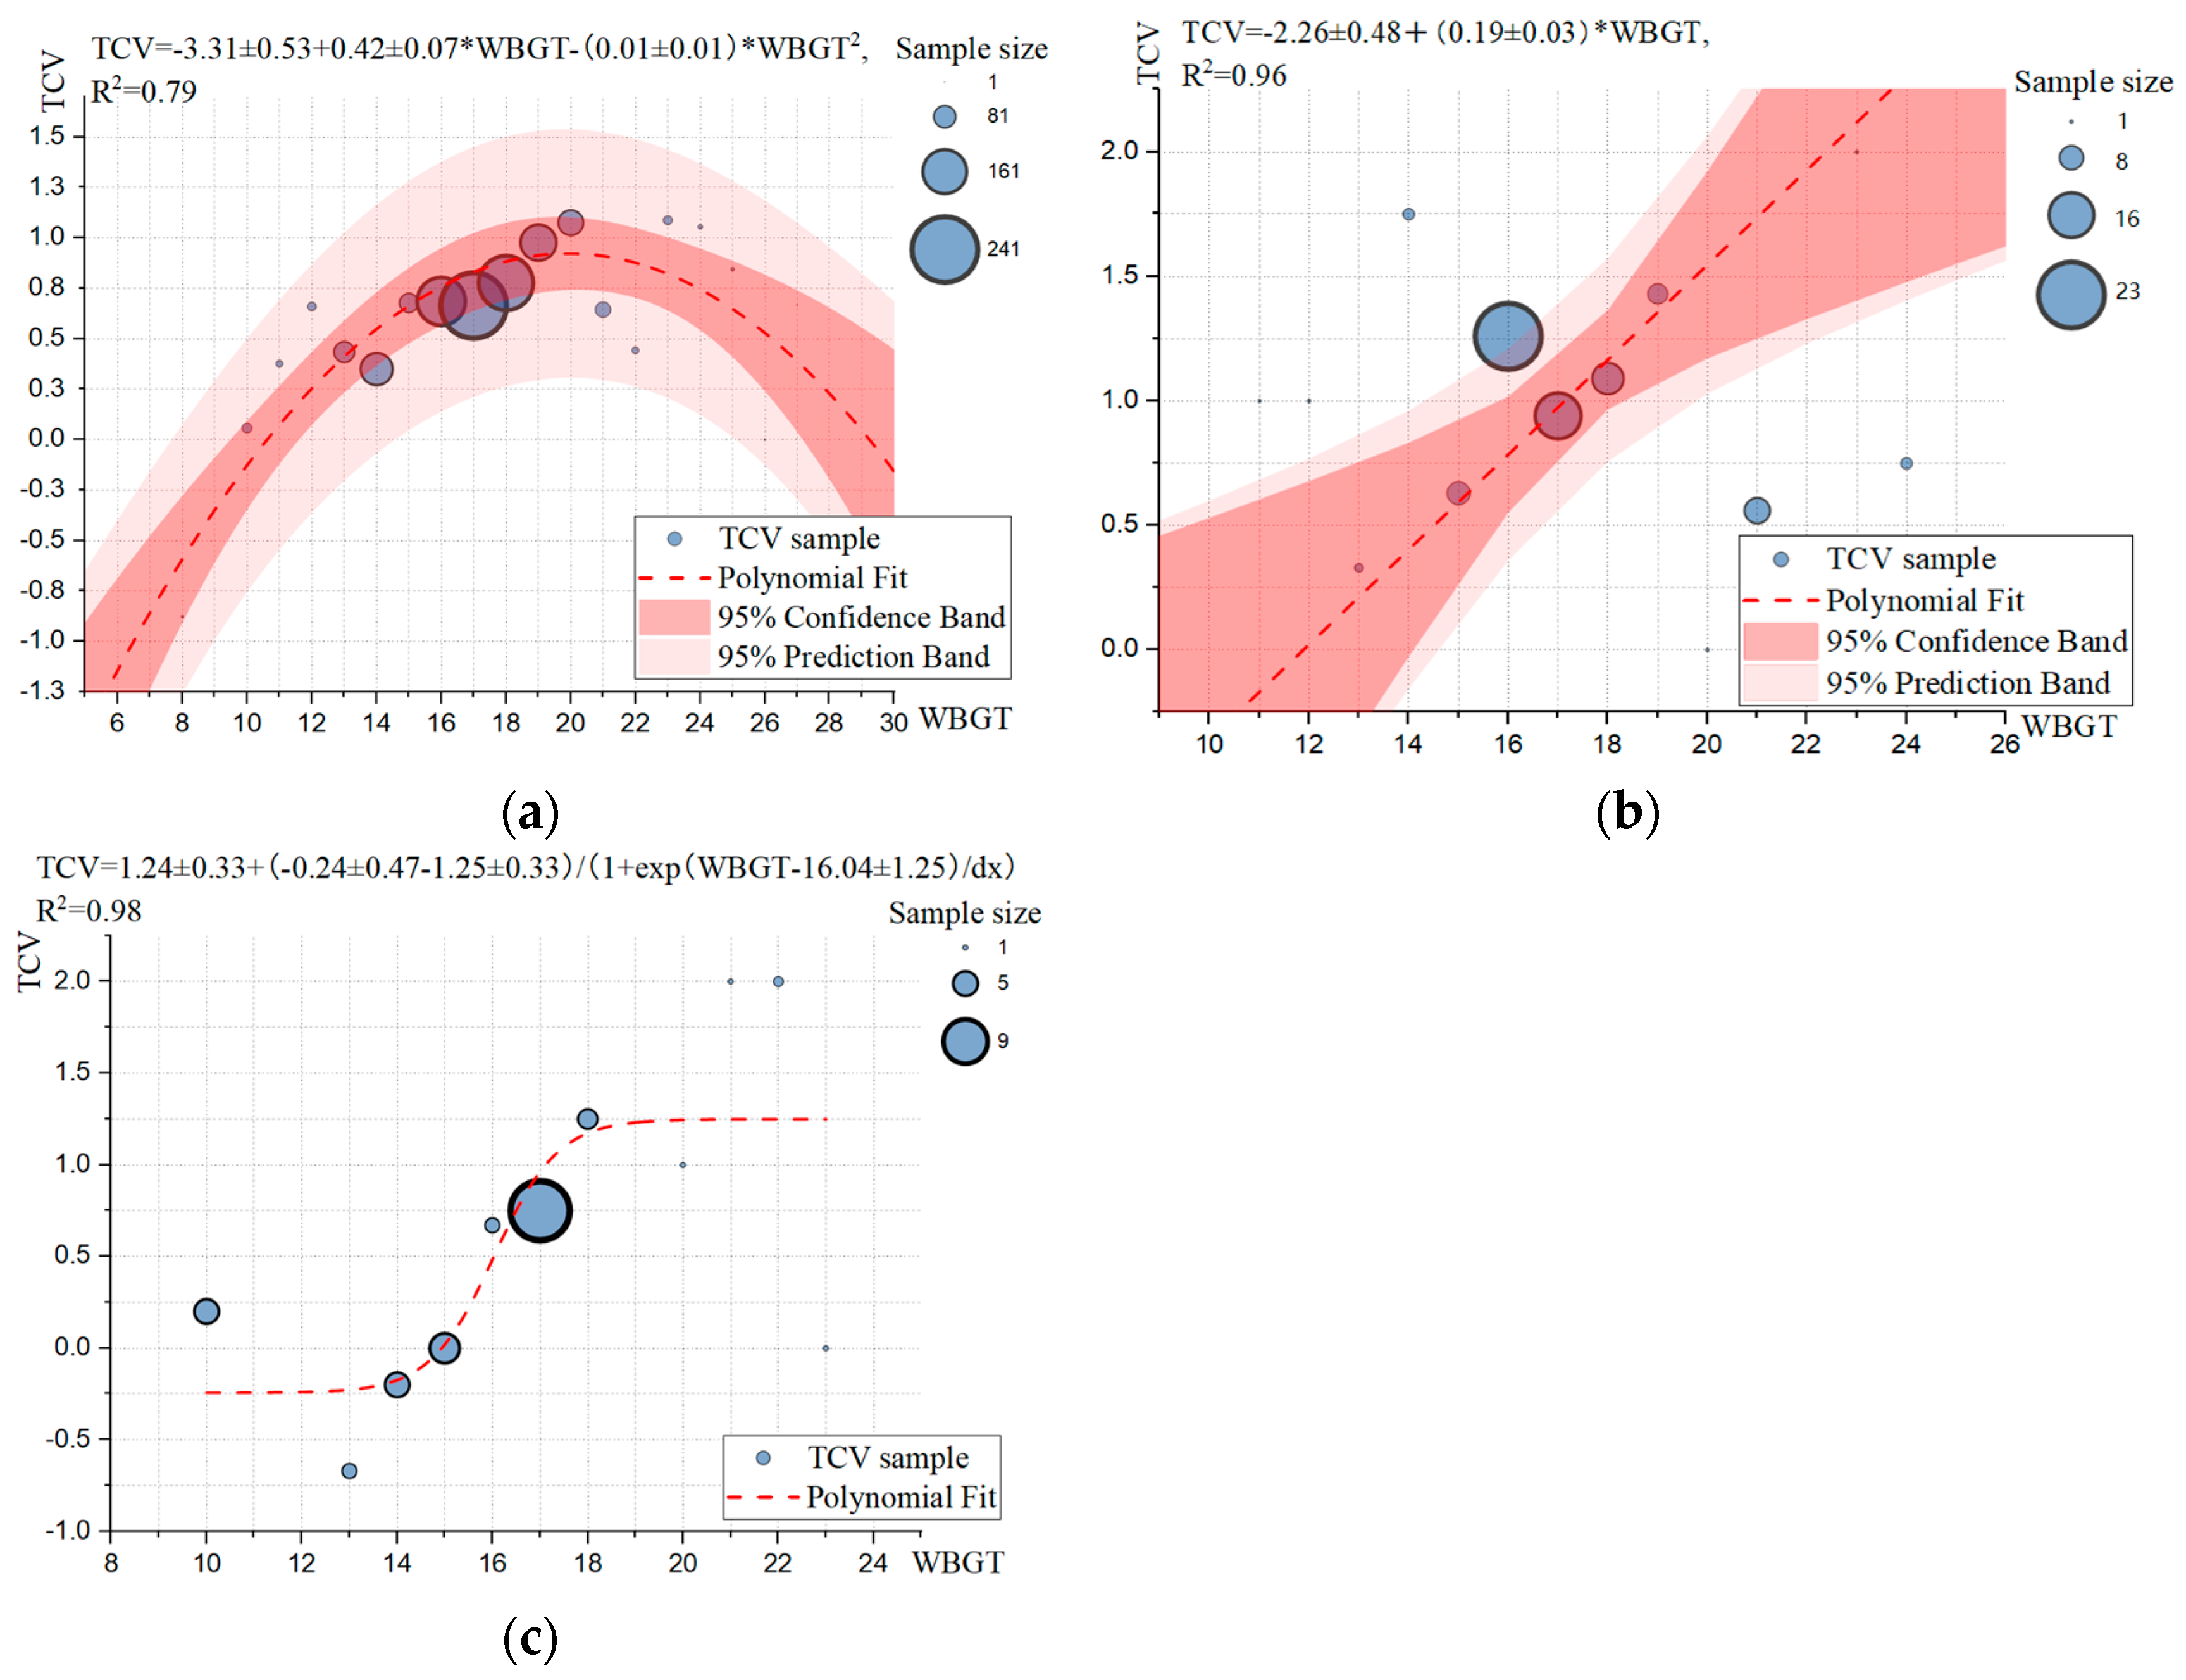
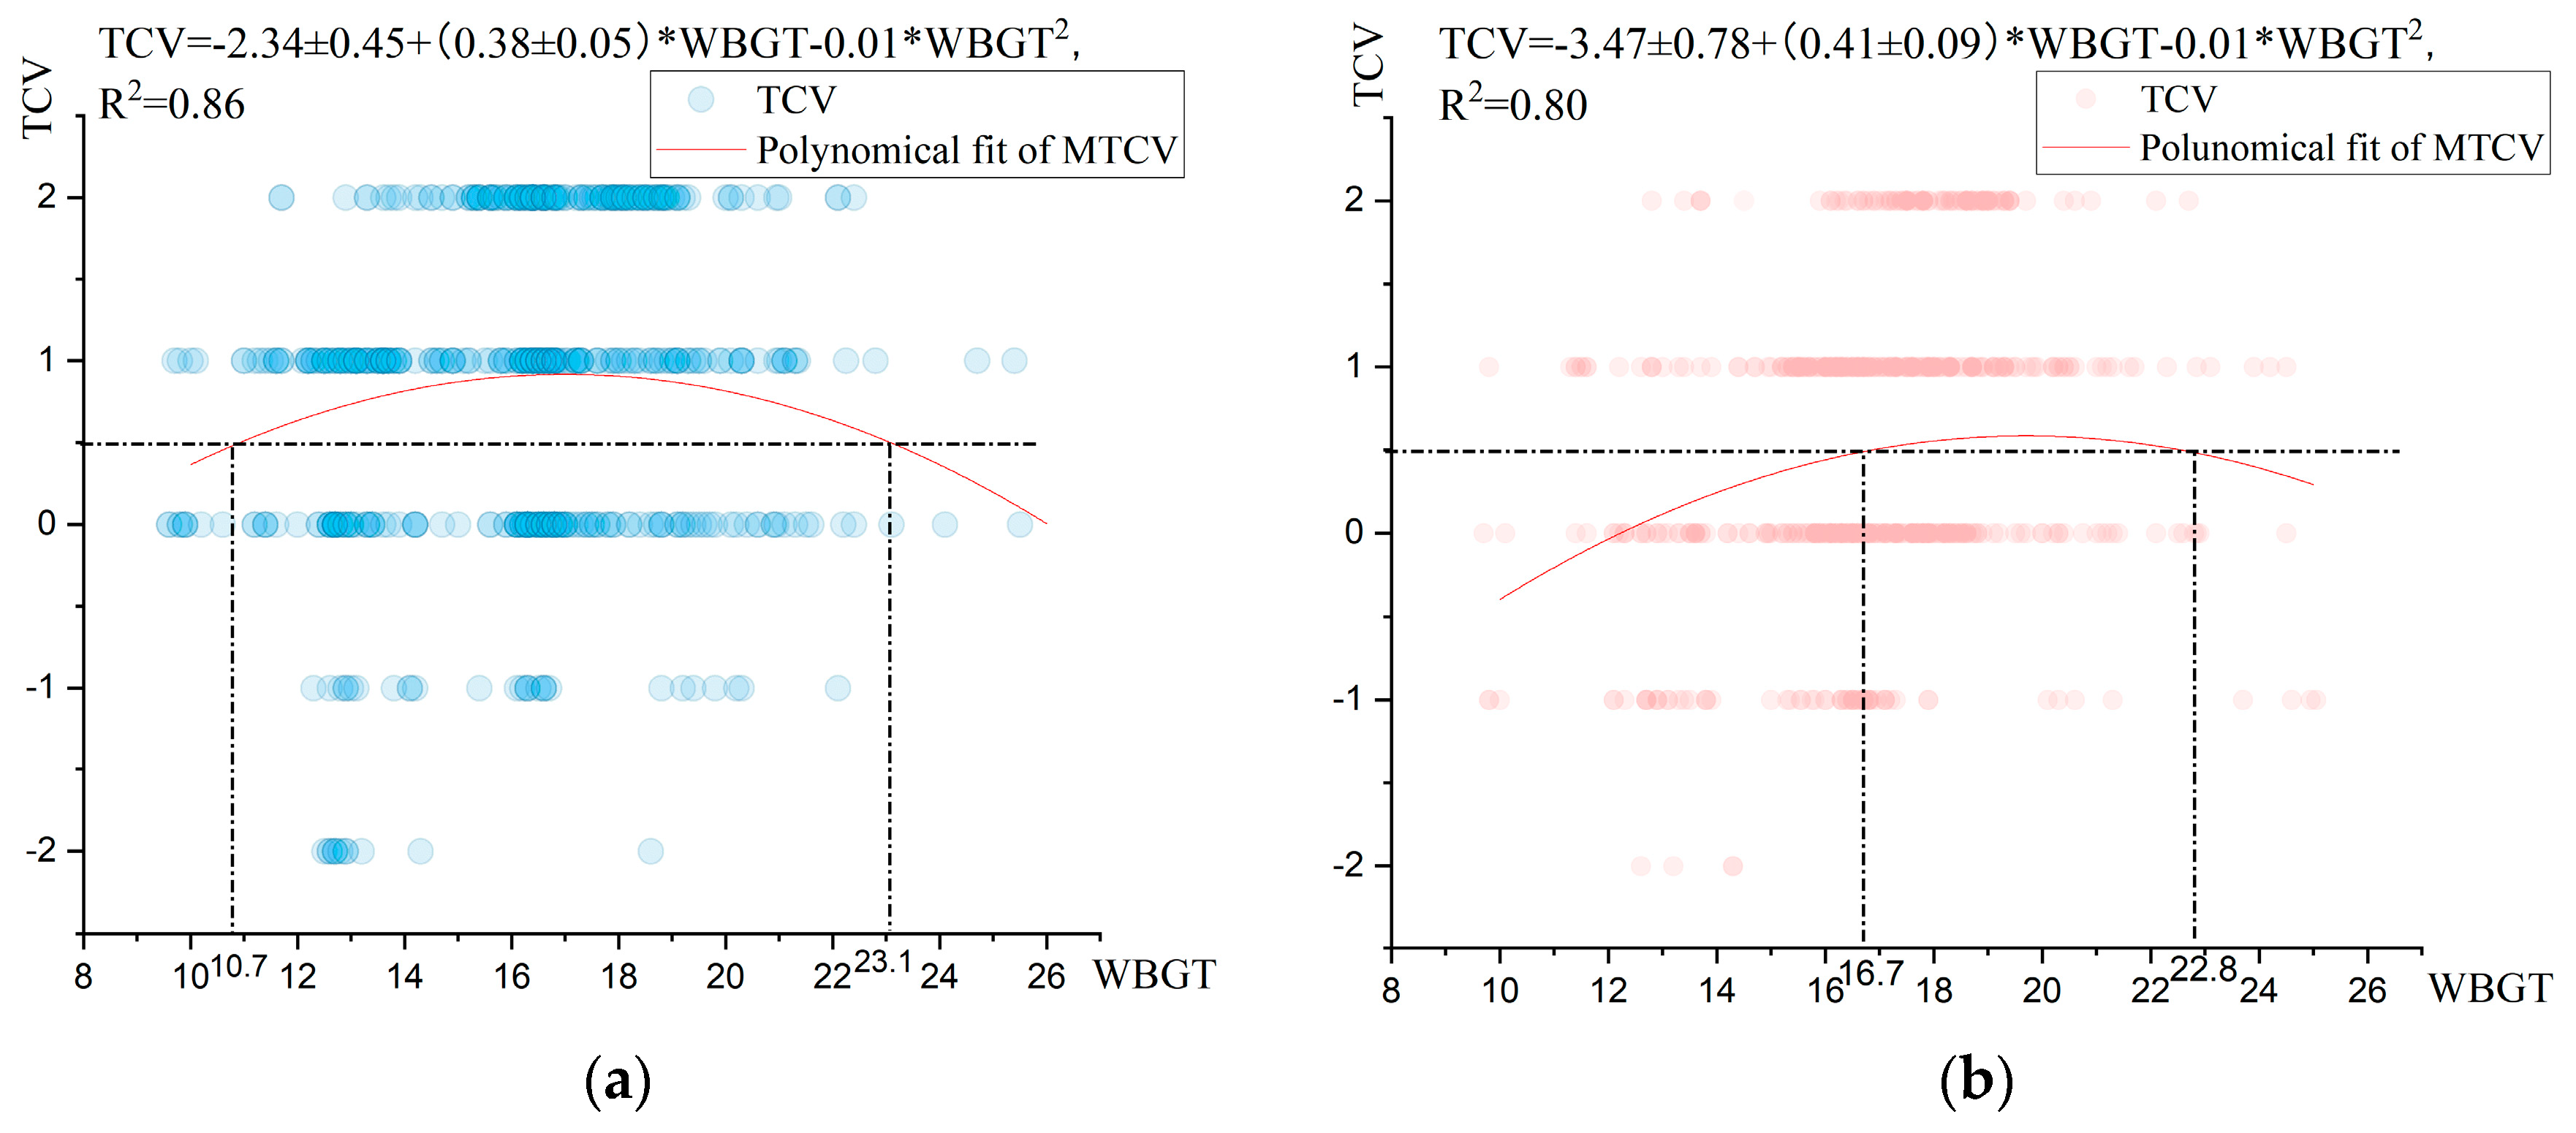
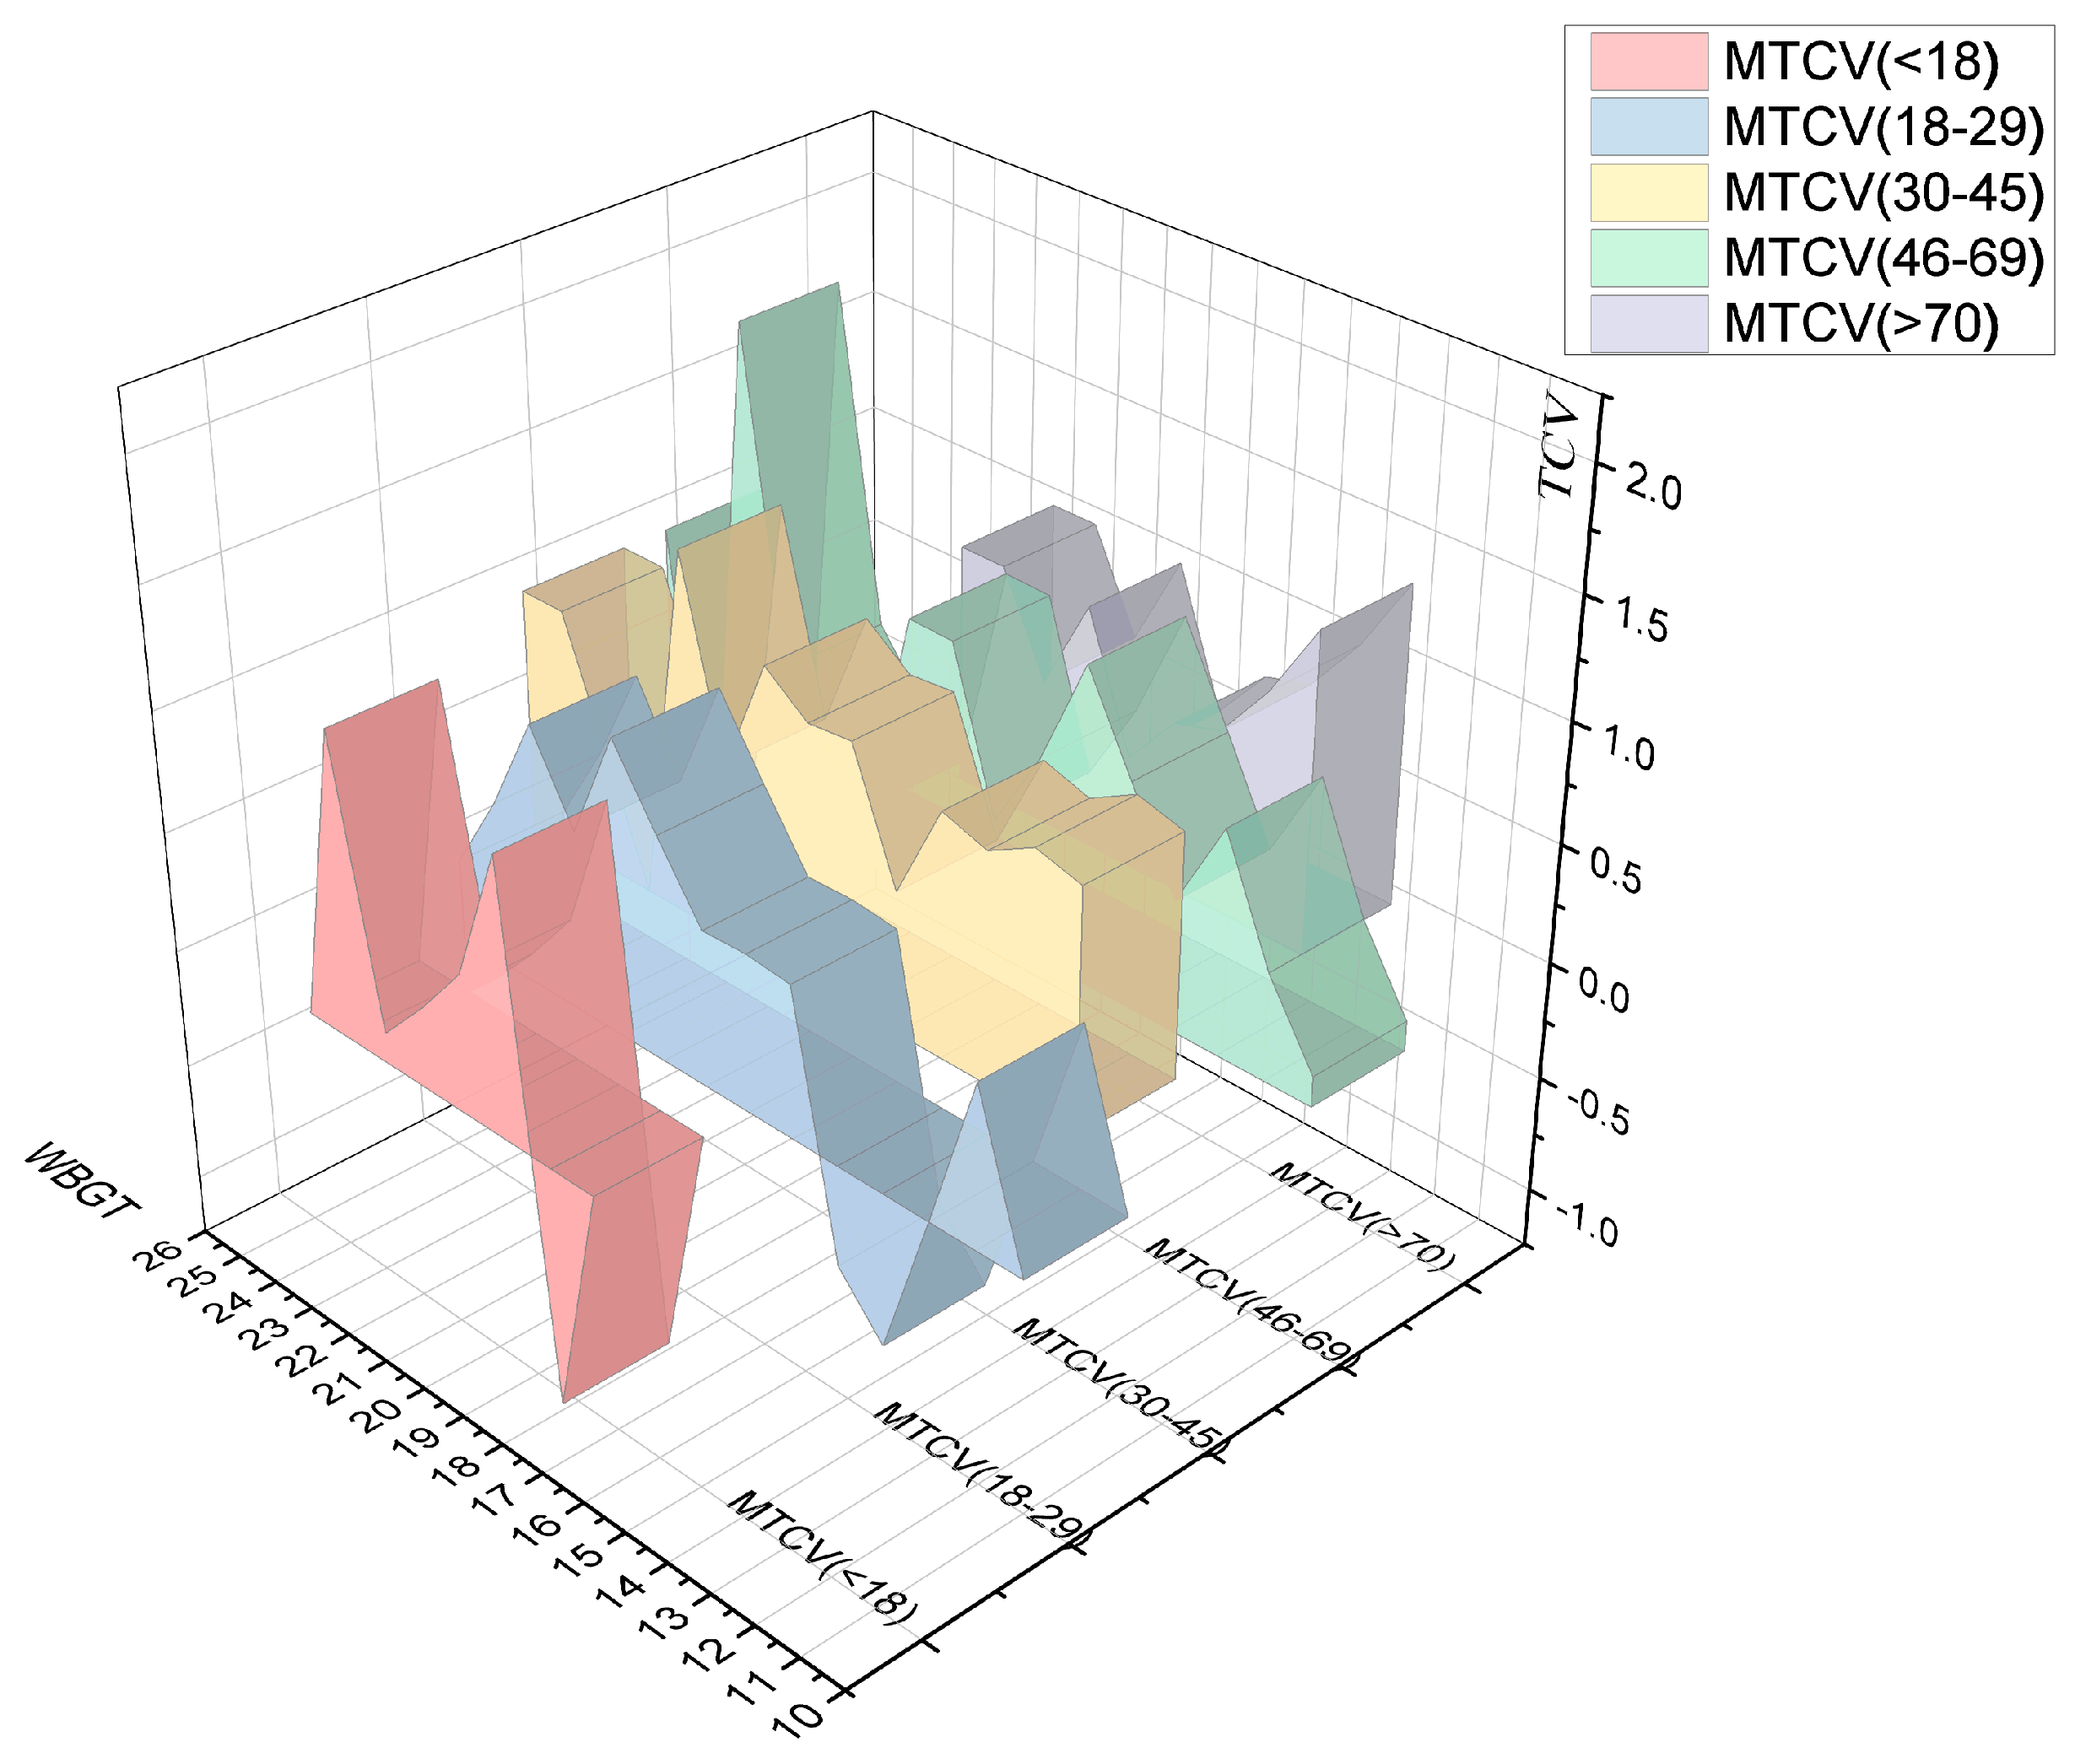
4.3. Quantitative Evaluation of Thermal Comfort
4.4. Quantitative Evaluation of Thermal Unacceptability Rate
4.5. Quantitative Evaluation of Thermal Preference
5. Discussion
5.1. Thermal Comfort Threshold
5.2. Seasonal Thermal Sensation
5.3. Personal Factors on Human Environmental Adaptability
5.4. The Ground Thermal Insulation Performance
5.5. Design Strategies for Outdoor Sports Spaces
5.6. Limitations
6. Conclusions
- (1)
- In humid subtropical areas, the human comfort WBGT threshold for outdoor sports spaces in winter and spring was 14.2–21.7 °C, while it ranged from 15.5 to 20.5 °C in winter and from 16.4 to 23.0 °C in spring. Among the subjects’ personal factors, temperature preference for heat had the most influence on thermal perception, followed by age and gender. As for the adaptability to the thermal environment in outdoor sports spaces during the winter and spring, people who enjoyed the cold and feared the heat had the best adaptability, followed by people who preferred a moderate environment and those who enjoyed the heat and feared the cold. The neutral WBGT ranges were 15.4–23.9 °C, 15.1–22.8 °C and 17.6–23.6 °C, while the neutral WBGT was 18.0 °C, 19.1 °C and 20.5 °C. Females were more sensitive to the changes in the thermal environment and men had a much higher tolerance for low temperatures than women. People who were 30–69 years old had the best adaptability to outdoor sports spaces in winter and spring, followed by the older population (age > 70), and the younger population had the worst endurance (age < 30).
- (2)
- For people doing low-intensity physical activity, the WBGT range when residents felt comfortable (+1) or very comfortable (+2) was between 13.7 and 26.2 °C during winter and spring. After moderate-intensity sports activities, most residents’ comfort range narrowed to 14.5–24.0 °C. For the high-intensity sports activities, the comfortable range was between 16.0 and 22.0 °C. As the intensity of physical activity increased, the thermal comfort range narrowed and the sensitivity to the thermal environment increased. In addition, it is still necessary to pay attention to preventing unconscious heatstroke or burns when engaging in moderate- and high-intensity activities for persons unacclimatized to heat. aAnd for those acclimatized to heat, they should still take care when joining high and very high intensity activities during winter and spring. Extreme cold weather also requires attention to cold prevention.
- (3)
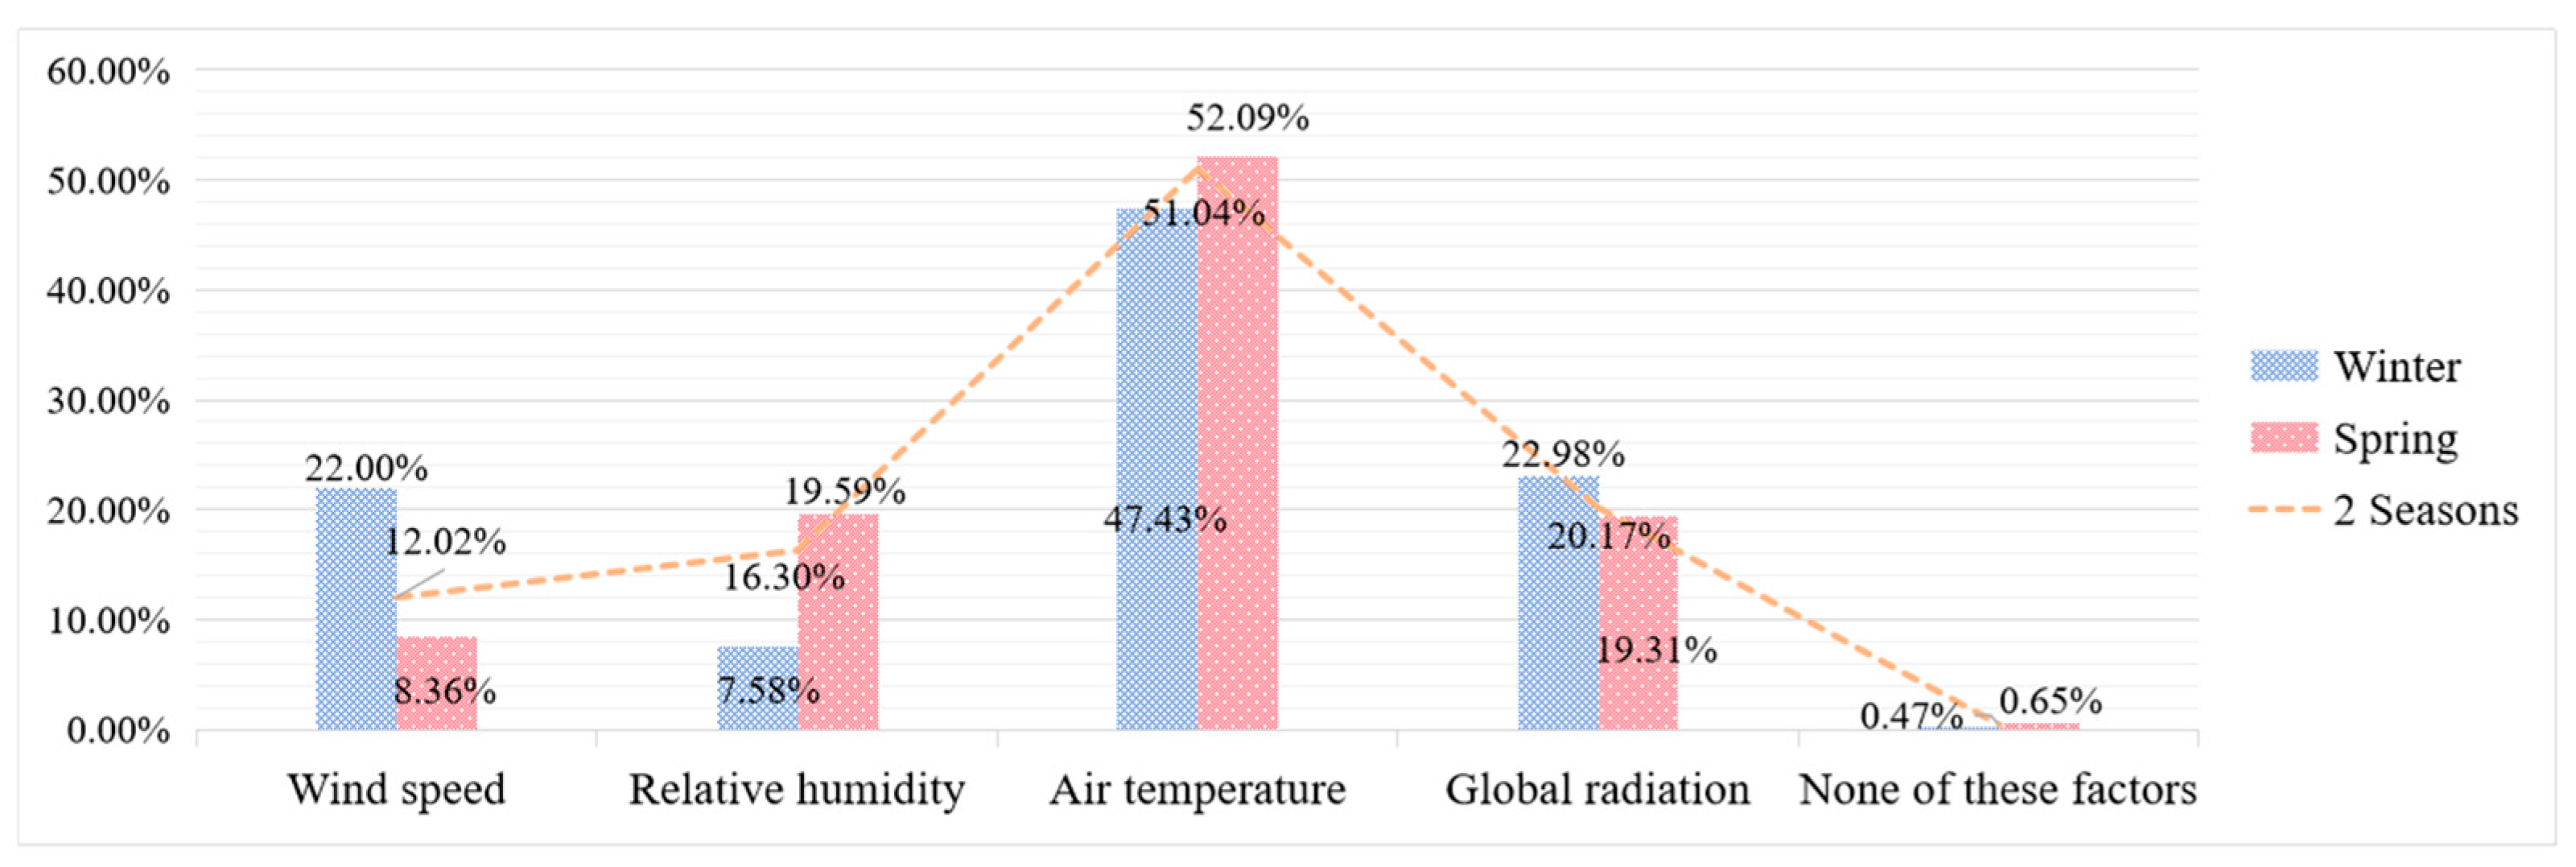
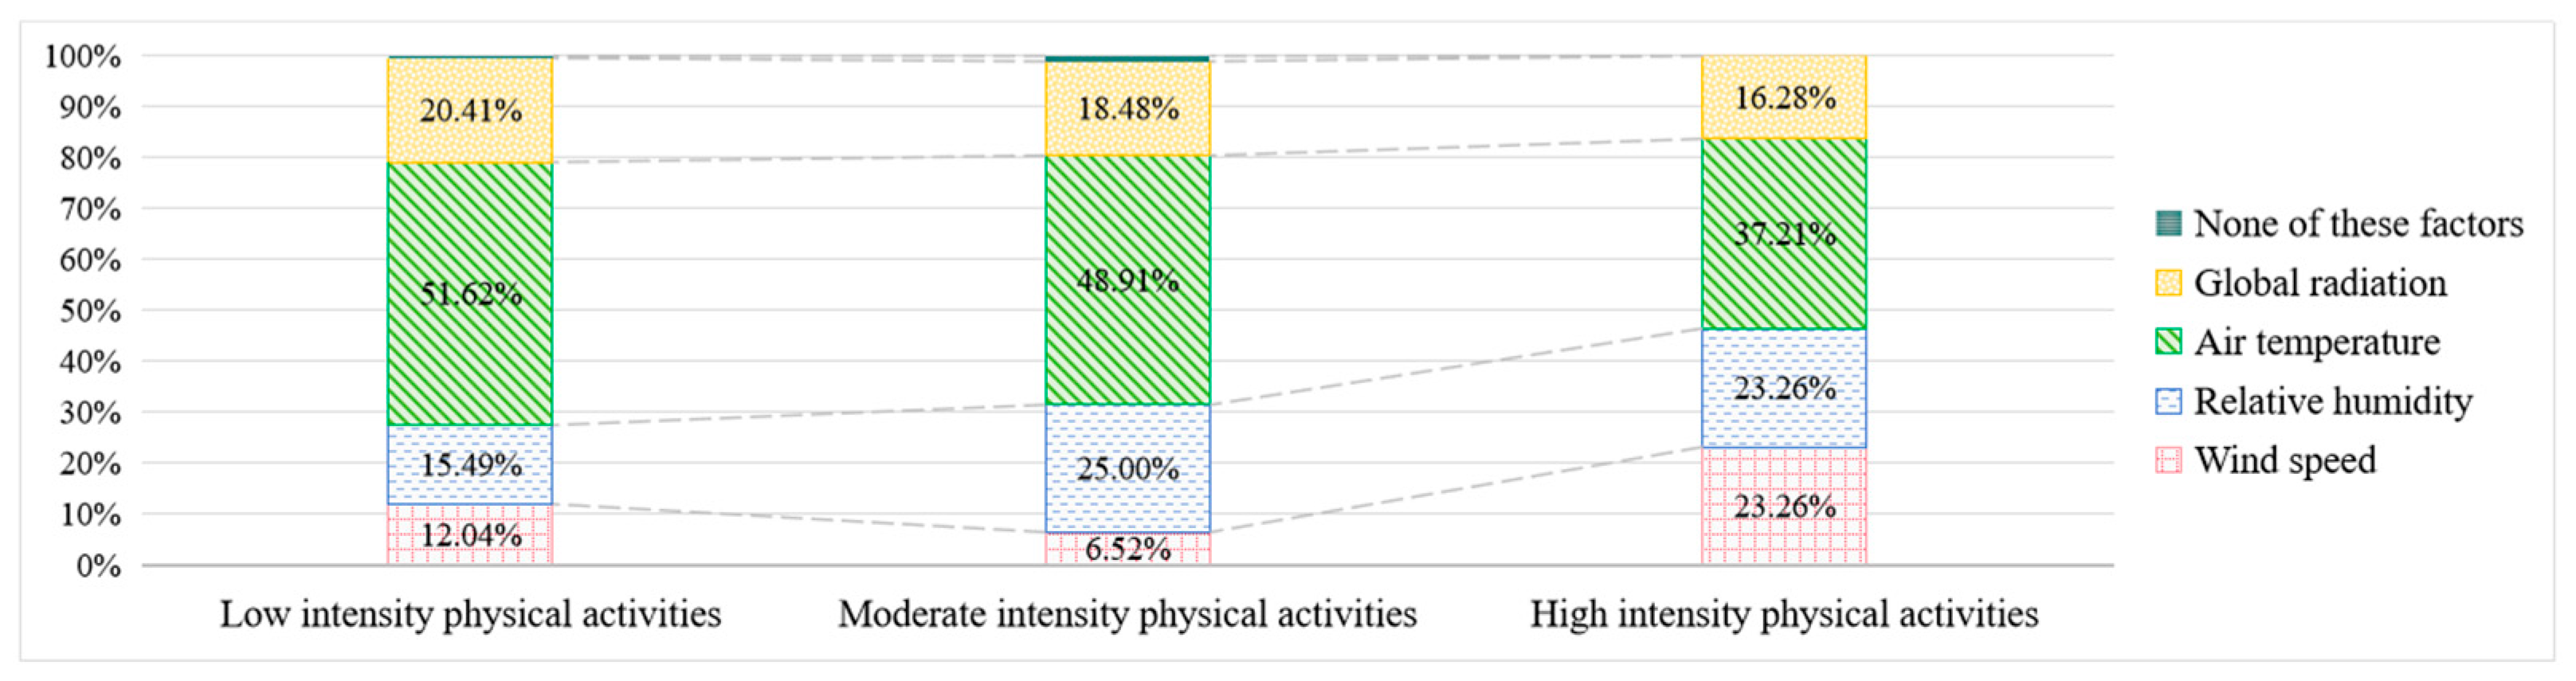
- In humid subtropical areas, the main thermal comfort factors while residents doing outdoor sports activities were Ta, G and RH during winter and spring. It is worth noting that the thermal comfort factors varied from different intensities of physical activities. Ta and G had the greatest impact on low-intensity sports activities. Ta and RH had the greatest impact on moderate-intensity sports activities. Ta, RH and Va had a significant impact on high-intensity sports activities. As the intensity of physical activity increased, the proportion of people who believed that Ta and G were the main factors affecting thermal comfort decreased. According to the measurement results of meteorological conditions in winter and spring, there was a significant negative correlation between the average Ta and average RH, while there was a prominent positive correlation between average wind speed and WBGT.
- (4)
- In winter, it was more comfortable to have “slightly warm” (TSV = 1) than “‘neutral” (TSV = 0) weather, while in spring, it was more comfortable to be “neither hot nor cold” than other sensation. The WBGT comfort range with a “slightly warm” sensation in winter was 14.8–22.6 °C, and the WBGT comfort range with a “neutral” sensation in spring was 16.4–23.0 °C. When the WBGT was equal to 14.2–21.7 °C, it belonged to the moderate range of neither cold nor hot for both seasons. The TSV change ranges were 3.82 in winter and 2.47 in spring, while the WBGT range variation was kept the same at 15 °C. It follows that the subjects’ thermal sensation was more sensitive in winter than in summer in the humid subtropical areas.
- (5)
- The ground materials, sunshine and vegetation coverage of outdoor sports spaces in humid subtropical areas all had a significant impact on adjusting Ta in the microclimate. When choosing the ground materials for an outdoor sports space, the thermal insulation performance in cold seasons, cooling effects in hot seasons, visual comfort, disability inclusivity, wear resistance and life length of the ground materials should be considered together. For all kinds of ground materials, the EPDM surface and acrylic acid had the best thermal insulation performance in winter and spring, followed by terrazzo, square tiles, square stone bricks, and pedestrian road bricks. Cement and artificial turf had the worst performance.
- (6)
- In addition to thermal comfort, factors such as time, weather, the variety and quantity of outdoor space spaces and facilities, high visual comfort, good accessibility, strong safety, regular maintenance of the space and facilities and the sharing level of outdoor sports spaces all had a major impact on outdoor sports activities. The highest attendance of residents was in the midmorning (9:30–11:30), in the afternoon (16: 30–18:00) and in the evening (19:00–20:00) in both the community park and residential quarter’s communal parks.
- (7)
- Due to the annual unique climate characteristics of humid subtropical areas, where solar radiation is strong and it rains frequently, it is recommended to add semi-outdoor spaces with roofs or indoor spaces next to outdoor sports spaces. It can provide sunshade from strong sunshine and shelter from heavy rain, so as to improve the overall thermal comfort and increase residents’ outdoor physical activity. In the urban design process, increasing the development of low and moderate intensity outdoor sports space and facilities was beneficial for improving the overall thermal comfort.
Author Contributions
Funding
Institutional Review Board Statement
Data Availability Statement
Conflicts of Interest
References
- Hallal, P.C.; Andersen, L.B.; Bull, F.C.; Guthold, R.; Haskell, W.; Ekelund, U. Global physical activity levels: Surveillance progress, pitfalls, and prospects. Lancet 2012, 380, 247–257. [Google Scholar] [CrossRef]
- Fang, W.T.; Eric, N.; Chang, M.C. Physical Outdoor Activity versus Indoor Activity: Their Influence on Environmental Behaviors. Int. J. Environ. Res. Public Health 2017, 14, 797. [Google Scholar] [CrossRef]
- Zhao, X.; Bian, Q.; Hou, Y.; Zhang, B. A study on the correlation between spring leisure physical activity levels and microclimate thermal comfort in cold city parks. Chin. Landsc. Arch. 2019, 35, 80–85. (In Chinese) [Google Scholar] [CrossRef]
- Bedimo-Rung, A.L.; Mowen, A.J.; Cohen, D.A. The significance of parks to physical activity and public health: A conceptual model. Am. J. Prev. Med. 2005, 28, 159–168. [Google Scholar] [CrossRef] [PubMed]
- Wang, X.; Rodiek, S. Older Adults’ Preference for Landscape Features Along Urban Park Walkways in Nanjing, China. Int. J. Environ. Res. Public Health 2019, 16, 3808. [Google Scholar] [CrossRef]
- Chang, P.J. Effects of the built and social features of urban greenways on the outdoor activity of older adults. Landsc. Urban Plan. 2020, 204, 103929. [Google Scholar] [CrossRef]
- Lin, T.P. Thermal perception, adaptation and attendance in a public square in hot and humid regions. Build. Environ. 2009, 44, 2017–2026. [Google Scholar] [CrossRef]
- Mora, R. Moving Bodies: Open Gyms and Physical Activity in Santiago. J. Urban Des. 2012, 17, 485–497. [Google Scholar] [CrossRef]
- Chancellor, B. Primary school playgrounds: Features and management in Victoria, Australia. Int. J. Play. 2013, 2, 63–75. [Google Scholar] [CrossRef]
- Lin, T.-P.; Tsai, K.-T.; Liao, C.-C.; Huang, Y.-C. Effects of thermal comfort and adaptation on park attendance regarding different shading levels and activity types. Build. Environ. 2013, 59, 599–611. [Google Scholar] [CrossRef]
- Mahmoud, A.H.A. Analysis of the microclimatic and human comfort conditions in an urban park in hot and arid regions. Build. Environ. 2011, 46, 2641–2656. [Google Scholar] [CrossRef]
- Leng, H.; Liang, S.; Yuan, Q. Outdoor thermal comfort and adaptive behaviors in the residential public open spaces of winter cities during the marginal season. Int. J. Biometeorol. 2020, 64, 217–229. [Google Scholar] [CrossRef]
- Thorsson, S.; Honjo, T.; Lindberg, F.; Eliasson, I.; Lim, E.M. Thermal comfort and outdoor activity in Japanese urban public places. Environ. Behav. 2007, 39, 660–684. [Google Scholar] [CrossRef]
- Akio, M.; Akio, I.; Tadao, K. Investigation and research on the formation of thermal environment in external space of buildings:Thermal environment index and declaration of temperature insensible. In Research Report of Kyushu Branch of Architectural Institute of Japan; Architectural Institute of Japan: Kyushu, Japan, 1986; Volume 29, pp. 141–144. Available online: https://www.aij.or.jp/paper/detail.html?productId=349803 (accessed on 7 August 2023). (In Japanese)
- Hwang, R.L.; Lin, T.P.; Cheng, M.J.; Lo, J.-H. Adaptive comfort model for tree-shaded outdoors in Taiwan. Build. Environ. 2010, 45, 1873–1879. [Google Scholar] [CrossRef]
- Yannas, S. Toward more sustainable cities. Sol. Energy 2001, 70, 281–294. [Google Scholar] [CrossRef]
- Eliasson, I.; Knez, I.; Westerberg, U.; Thorsson, S.; Lindberg, F. Climate and behaviour in a Nordic city. Landsc. Urban Plan. 2007, 82, 72–84. [Google Scholar] [CrossRef]
- Thorsson, S.; Lindqvis, M.; Lindqvis, S. Thermal bioclimatic conditions and patterns of behaviour in an urban park in Goteborg, Sweden. Int. J. Biometeorol. 2004, 48, 149–156. [Google Scholar] [CrossRef]
- Li, S. User’s behavior of small urban spaces in winter and marginal seasons. Archit. Behav. 1994, 10, 95–109. [Google Scholar]
- Nakano, J.; Tanabe, S. Thermal adaptation and comfort zones in urban semi-outdoor environments. Front. Built Environ. 2020, 6, 1–13. [Google Scholar] [CrossRef]
- Da Silveira Hirashim, S.Q.; de Assis, E.S.; Nikolopoulou, M. Daytime thermal comfort in urban spaces: A field study in Brazil. Build. Environ. 2016, 107, 245–253. [Google Scholar] [CrossRef]
- Wang, Y.; Ni, Z.; Peng, Y.; Xia, B. Local variation of outdoor thermal comfort in different urban green spaces in Guangzhou, a subtropical city in South China. Urban For. Urban Green. 2018, 32, 99–112. [Google Scholar] [CrossRef]
- Zhao, L.; Zhou, X.; Li, L.; He, S.; Chen, R. Study on outdoor thermal comfort on a campus in a subtropical urban area in summer, Sustain. Cities Soc. 2016, 22, 164–170. [Google Scholar] [CrossRef]
- Lin, T.P.; Tsai, K.T.; Hwang, R.L.; Matzarakis, A. Quantification of the effect of thermal indices and sky view factor on park attendance. Landsc. Urban Plan. 2012, 107, 137–146. [Google Scholar] [CrossRef]
- Zhou, Z.; Chen, H.; Deng, Q.L. A field study of thermal comfort in outdoor and semi-outdoor environments in a humid subtropical climate city. J. Asian Arch. Build. Eng. 2013, 12, 73–79. [Google Scholar] [CrossRef]
- Heng, S.L.; Chow, W. How ‘hot’ is too hot? Evaluating acceptable outdoor thermal comfort ranges in an equatorial urban park. Int. J. Biometeorol. 2019, 63, 801–816. [Google Scholar] [CrossRef] [PubMed]
- Li, K.M.; Zhang, Y.F.; Zhao, L.H. Outdoor thermal comfort and activities in the urban residential community in a humid subtropical area of China. Energy Build. 2016, 133, 498–511. [Google Scholar] [CrossRef]
- Wang, Q.; Li, M.; Li, X.Y. Research on the landscape design of fitness facilities in community parks based on microclimate human comfort. Chin. Landsc. Arch. 2021, 37, 68–73. (In Chinese) [Google Scholar] [CrossRef]
- ISO 7726-1998; Ergonomics of the Thermal Environment Instruments for Measuring Physical Quantities. International Organization for Standardization: Geneva, Switzerland, 1998.
- ISO 10551-2019; Ergonomics of the Physical Environment—Subjective Judgement Scales for Assessing Physical Environments. International Organization for Standardization: Geneva, Switzerland, 2019.
- GB/T 18977-2003; Ergonomics of Thermal Environment, Evaluation of the Impact of Thermal Environment Using Subjective Judgment Scales. General Administration of Quality Supervision, Inspection and Quarantine of the People’s Republic of China: Beijing, China, 2003. (In Chinese)
- Zhang, L.; Meng, Q.L.; Zhao, L.H.; Zhang, Y.F. Simplified calculation method for urban thermal environment evaluation indicators in humid and hot areas. J. South China Univ. Technol. 2008, 36, 96–100. (In Chinese) [Google Scholar]
- Nikolopoulou, M.; Baker, N.; Steemers, K. Thermal comfort in outdoor urban spaces: Understanding the human parameter. Sol. Energy 2001, 70, 227–235. [Google Scholar] [CrossRef]
- Lin, B.R. Research on the Impact of Greening on Outdoor Thermal Environment. Ph.D. Thesis, Tsinghua University, Beijing, China, 2004. [Google Scholar]
- ASHRAE. Physiological Principles and Thermal Comfort. In Handbook of Fundamentals; American Society of Heating, Refrigerating and Air-Conditioning Engineers: Atlanta, CA, USA, 2001; Chapter 8; pp. 8.1–8.20. [Google Scholar]
- ASHRAE Standard 55-2017; Thermal Environmental Conditions for Human Occupancy. Standing Standard Project Committee: Atlanta, CA, USA, 2017.
- Shah, Y.; Kurelek, J.W.; Peterson, S.D.; Yarusevych, S. Experimental investigation of indoor aerosol dispersion and accumulation in the context of COVID-19: Effects of masks and ventilation. Phys. Fluids 2021, 33, 073315. [Google Scholar] [CrossRef]
- Jin, L.; Meng, Q.L.; Zhao, L.H. Thermal comfort of a courtyard in Guangzhou in Summer. In Proceedings of the Indoor Air Quality and Climate, Beijing, China, 4–9 September 2005. [Google Scholar]
- ISO 7243-2017; Ergonomics of the Thermal Environment Assessment of Heat Stress Using the WBGT. International Organization for Standardization: Geneva, Switzerland, 2017.
- Santamouris, M.; Gaitani, N.; Spanou, A.; Saliari, M.; Giannopoulou, K.; Vasilakopoulou, K.; Kardomateas, T. Using cool paving materials to improve microclimate of urban areas-Design realization and results of the flisvos project. Build. Environ. 2012, 53, 128–136. [Google Scholar] [CrossRef]
- Kruger, E.L.; Rossi, F.A. Effect of personal and microclimatic variables on observed thermal sensation from a field study in southern Brazil. Build. Environ. 2011, 46, 690–697. [Google Scholar] [CrossRef]
- Zhou, Z.Q.; Liang, D. Experimental investigation of the effect of surgical masks on outdoor thermal comfort in Xiamen, China. Build. Environ. 2022, 229, 109893. [Google Scholar] [CrossRef] [PubMed]
- Hwang, R.L.; Lin, T.P. Thermal Comfort Requirements for Occupants of Semi-Outdoor and Outdoor Environments in Hot-Humid Regions. Arch. Sci. Rev. 2007, 50, 357–364. [Google Scholar] [CrossRef]
- Pressman, N. Harsh Living Conditions: A Research Agenda. Habitat Int. 1989, 13, 13–22. [Google Scholar] [CrossRef]
- Chen, L.; Wen, Y.; Zhang, L.; Xiang, W.N. Studies of thermal comfort and space use in an urban park square in cool and cold seasons in Shanghai. Build. Environ. 2015, 94, 644–653. [Google Scholar] [CrossRef]
- Auchterlonie, R.; Brannock, C.; Jackson, V.; Luong, A.; Weeks, K.; Valdez, R. Guiding the Design of Inclusive Playgrounds through Needs Assessment and Materials Selection; IEEE Press: Charlottesville, VA, USA, 2021; pp. 1–6. [Google Scholar] [CrossRef]
- Lin, T.P.; De Dear, R.; Hwang, R.L. Effect of thermal adaptation on seasonal outdoor thermal comfort. Int. J. Clim. 2011, 31, 302–312. [Google Scholar] [CrossRef]


| Year | Season | Days in Total | Month | Day 1 | Sites |
|---|---|---|---|---|---|
| 2023 | Winter | 10 | January | 16, 17, 18, 19, 21, 22 | All 3 sites |
| February | 24, 25, 26, 28 | All 3 sites | |||
| Spring | 7 | March | 23, 27, 28, 29, 31 | All 3 sites | |
| April | 1, 2 | Binglang fitness park, Lianban New Village |
| No. | Instrument Name | Type | Parameter | Resolution Ratio | Range | Accuracy |
|---|---|---|---|---|---|---|
| 1 | Hand-held anemometer | Testo 425 | Va | 0.01 m/s | 0–20 m/s | ±0.03 m/s |
| 2 | Thermal index WBGT meter (black ball diameter 75 mm) | Taiwan Hengxin 8778 | Ta | 0.1 °C | 0–50 °C | ±0.6 °C |
| Tg | 0.1 °C | 0–80 °C | ±1.5 °C (15–40 °C); ±2 °C (other) | |||
| RH | 0.1% | 0–100% | ±3% (10–90% RH); ± 5% (other) | |||
| WBGT | 0.1 °C | 0–50 °C | ±1.5 °C (15~40 °C); ±2 °C (other) | |||
| 3 | Infrared thermometer | Optris MS+ | Tgm | 0.1 °C | −32–53 °C | ±1 °C |
| 4 | Solar power meter | Xinbao SM206-solar | SR | 0.1 W/m2 | 0.1–1999.9 W/m2 | ±10% R, R: reading |
| Item | Test Conclusion | c Total Effect | a | b | a × b Mediating Effect | c’ Direct Effect | Formula for Calculating the Proportion of Effects | The Proportion of Effects |
|---|---|---|---|---|---|---|---|---|
| SR => Tgm => Ta | Partial mediation | 0.009 ** | 0.016 ** | 0.012 ** | 0.000 | 0.0009 ** | a × b/c | 2.218% |
| Item | Test Conclusion | c Total Effect | a | b | a × b Mediating Effect | c’ Direct Effect | Formula for Calculating the Proportion of Effects | The Proportion of Effects |
|---|---|---|---|---|---|---|---|---|
| SR => Ta => Tgm | Partialmediation | 0.016 ** | 0.009 ** | 0.876 ** | 0.008 | 0.008 * | a × b/c | 48.712% |
| Site | Binglang Fitness Park | |||
|---|---|---|---|---|
| Children’s Playground | Basketball Court | Table Tennis Court | Fitness Square | |
| Photo |  | 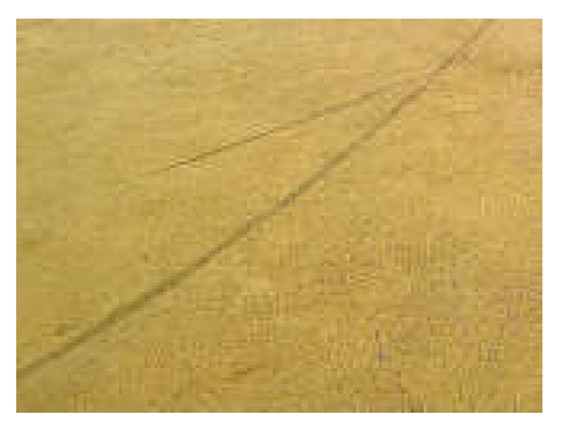 | 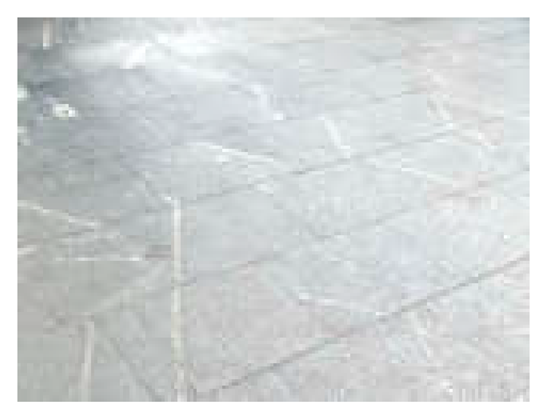 | 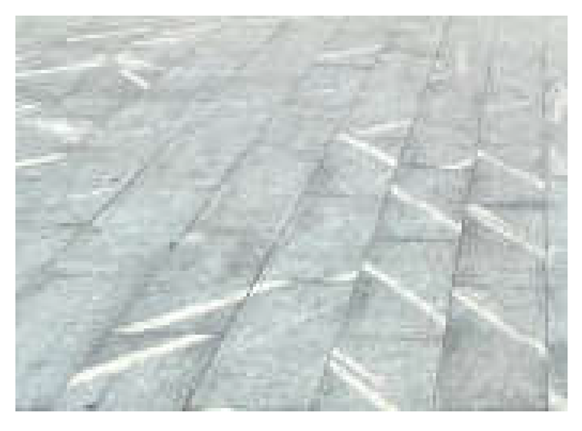 |
| Material | EPDM | EPDM | Square stone bricks | Square stone bricks |
| Site | Xinjing Center Phase II | Lianban New Village Area II | ||
| Badminton Court | Children’s Playground | Fitness square | Children’s Playground | |
| Photo | 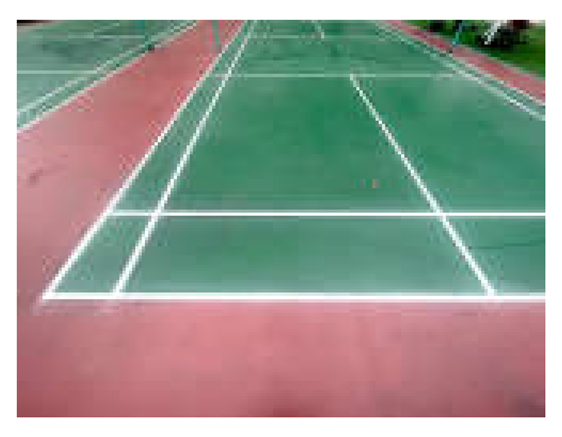 | 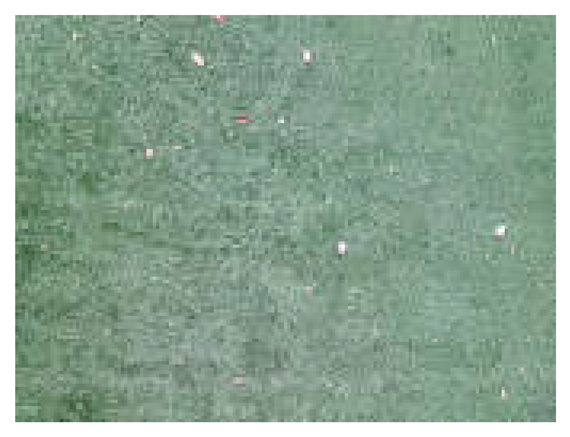 | 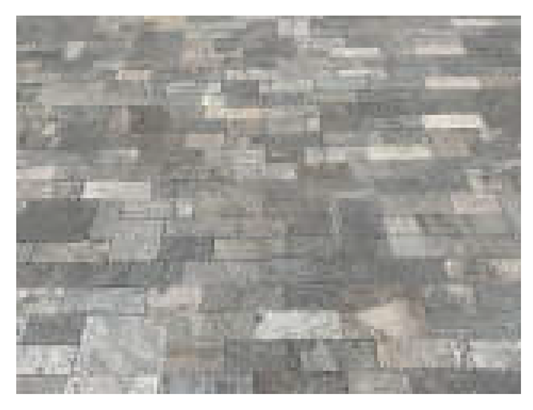 |  |
| Material | Acrylic acid | Artificial grass | Square stone bricks | Artificial grass |
| Site | Lianban New Village Area II | |||
| Fitness square | Fitness square | Fitness equipment area | Fitness equipment area | |
| Photo |  |  |  |  |
| Material | Terrazzo | Square tiles | Pedestrian road bricks | Cement |
| Time | Ta (°C) | RH (%) | Va (m/s) | WBGT (°C) | ||||||||
|---|---|---|---|---|---|---|---|---|---|---|---|---|
| Max | Min | Avg | Max | Min | Avg | Max | Min | Avg | Max | Min | Avg | |
| Winter | 30.3 | 11.8 | 18.94 | 93.20 | 14.00 | 50.44 | 2.52 | 0.02 | 0.53 | 24.6 | 7.4 | 15.29 |
| Spring | 33.7 | 13.25 | 20.97 | 91.30 | 15.90 | 66.70 | 3.27 | 0.04 | 0.44 | 27.3 | 11.9 | 18.06 |
| Season | TSV | −3 (Cold) | −2 (Cool) | −1 (Slightly Cool) | 0 (Neutral) | +1 (Slightly Warm) |
|---|---|---|---|---|---|---|
| WBGT | ||||||
| Winter | <7.8 | 7.8–9.5 | 9.5–11.6 | 11.6–14.8 | 14.8–22.6 | |
| Spring | <8.8 | 8.8–11.7 | 11.7–16.4 | 16.4–23.0 | 23.1–27.0 1 | |
| Winter and spring | <6.8 | 6.8–10.0 | 10.0–14.2 | 14.2–21.7 | 21.7–27.0 1 | |
| Season | Activity intensity | Low-Intensity Sports Activity (°C) | Moderate-Intensity Sports Activity (°C) | High-Intensity Sports Activities (°C) |
|---|---|---|---|---|
| WBGT | ||||
| Winter | 12.6–21.0 | 14.0–19.0 | 17.6–21.0 | |
| Spring | 15.0–27.0 | 15.0–24.0 | 15.7–22.0 | |
| Winter and spring | 13.7–26.2 | 14.5–24.0 | 16.0–22.0 | |
| Season | Dimensions | 90% Thermal Acceptability (°C) | TSV = 0 (Neutral) (°C) | TSV = 1 (Slightly Hot) TSV (°C) | TCV = 1 (Comfortable) and 2 (Very Comfortable) (°C) | Thermal Environment does not Need to be Changed (°C) | Thermal Comfort Threshold (°C) |
|---|---|---|---|---|---|---|---|
| WBGT | |||||||
| Winter | 11.4–20.5 | 11.6–14.8 | 14.8–22.6 | 12.1–22.2 | 15.5–21.9 | 15.5–20.5 | |
| Spring | 15.7–23.4 | 16.4–23.0 | 23.0–27.0 | 16.1–26.8 | 14.6–24.4 | 16.4–23.0 | |
| Winter and Spring | 11.6–25.1 | 14.2–21.7 | 21.7–28.4 | 14.1–28.9 | 14.6–24.4 | 14.6–21.7 | |
| Temperature Preference | Neutral WBGT (°C) | Neutral WBGT Range (°C) |
|---|---|---|
| Likes heat and fears cold | 20.5 | 17.6–23.6 |
| Neutral | 19.1 | 15.1–22.8 |
| Likes cold and fears heat | 18.0 | 15.4–23.9 |
Disclaimer/Publisher’s Note: The statements, opinions and data contained in all publications are solely those of the individual author(s) and contributor(s) and not of MDPI and/or the editor(s). MDPI and/or the editor(s) disclaim responsibility for any injury to people or property resulting from any ideas, methods, instructions or products referred to in the content. |
© 2023 by the authors. Licensee MDPI, Basel, Switzerland. This article is an open access article distributed under the terms and conditions of the Creative Commons Attribution (CC BY) license (https://creativecommons.org/licenses/by/4.0/).
Share and Cite
Ye, J.; Lai, W.; Wu, Z. Study on Xiamen’s Spring and Winter Thermal Comfort of Outdoor Sports Space in the Residential Community. Buildings 2023, 13, 2369. https://doi.org/10.3390/buildings13092369
Ye J, Lai W, Wu Z. Study on Xiamen’s Spring and Winter Thermal Comfort of Outdoor Sports Space in the Residential Community. Buildings. 2023; 13(9):2369. https://doi.org/10.3390/buildings13092369
Chicago/Turabian StyleYe, Jingyi, Wanling Lai, and Zhengwang Wu. 2023. "Study on Xiamen’s Spring and Winter Thermal Comfort of Outdoor Sports Space in the Residential Community" Buildings 13, no. 9: 2369. https://doi.org/10.3390/buildings13092369
APA StyleYe, J., Lai, W., & Wu, Z. (2023). Study on Xiamen’s Spring and Winter Thermal Comfort of Outdoor Sports Space in the Residential Community. Buildings, 13(9), 2369. https://doi.org/10.3390/buildings13092369