Figure 1.
National GHG Record by Sectors in Peru [
13].
Figure 1.
National GHG Record by Sectors in Peru [
13].
Figure 2.
(a) Map of the Americas; (b) map of Peru; (c) map of the Lima region; (d) map of the Surco district.
Figure 2.
(a) Map of the Americas; (b) map of Peru; (c) map of the Lima region; (d) map of the Surco district.
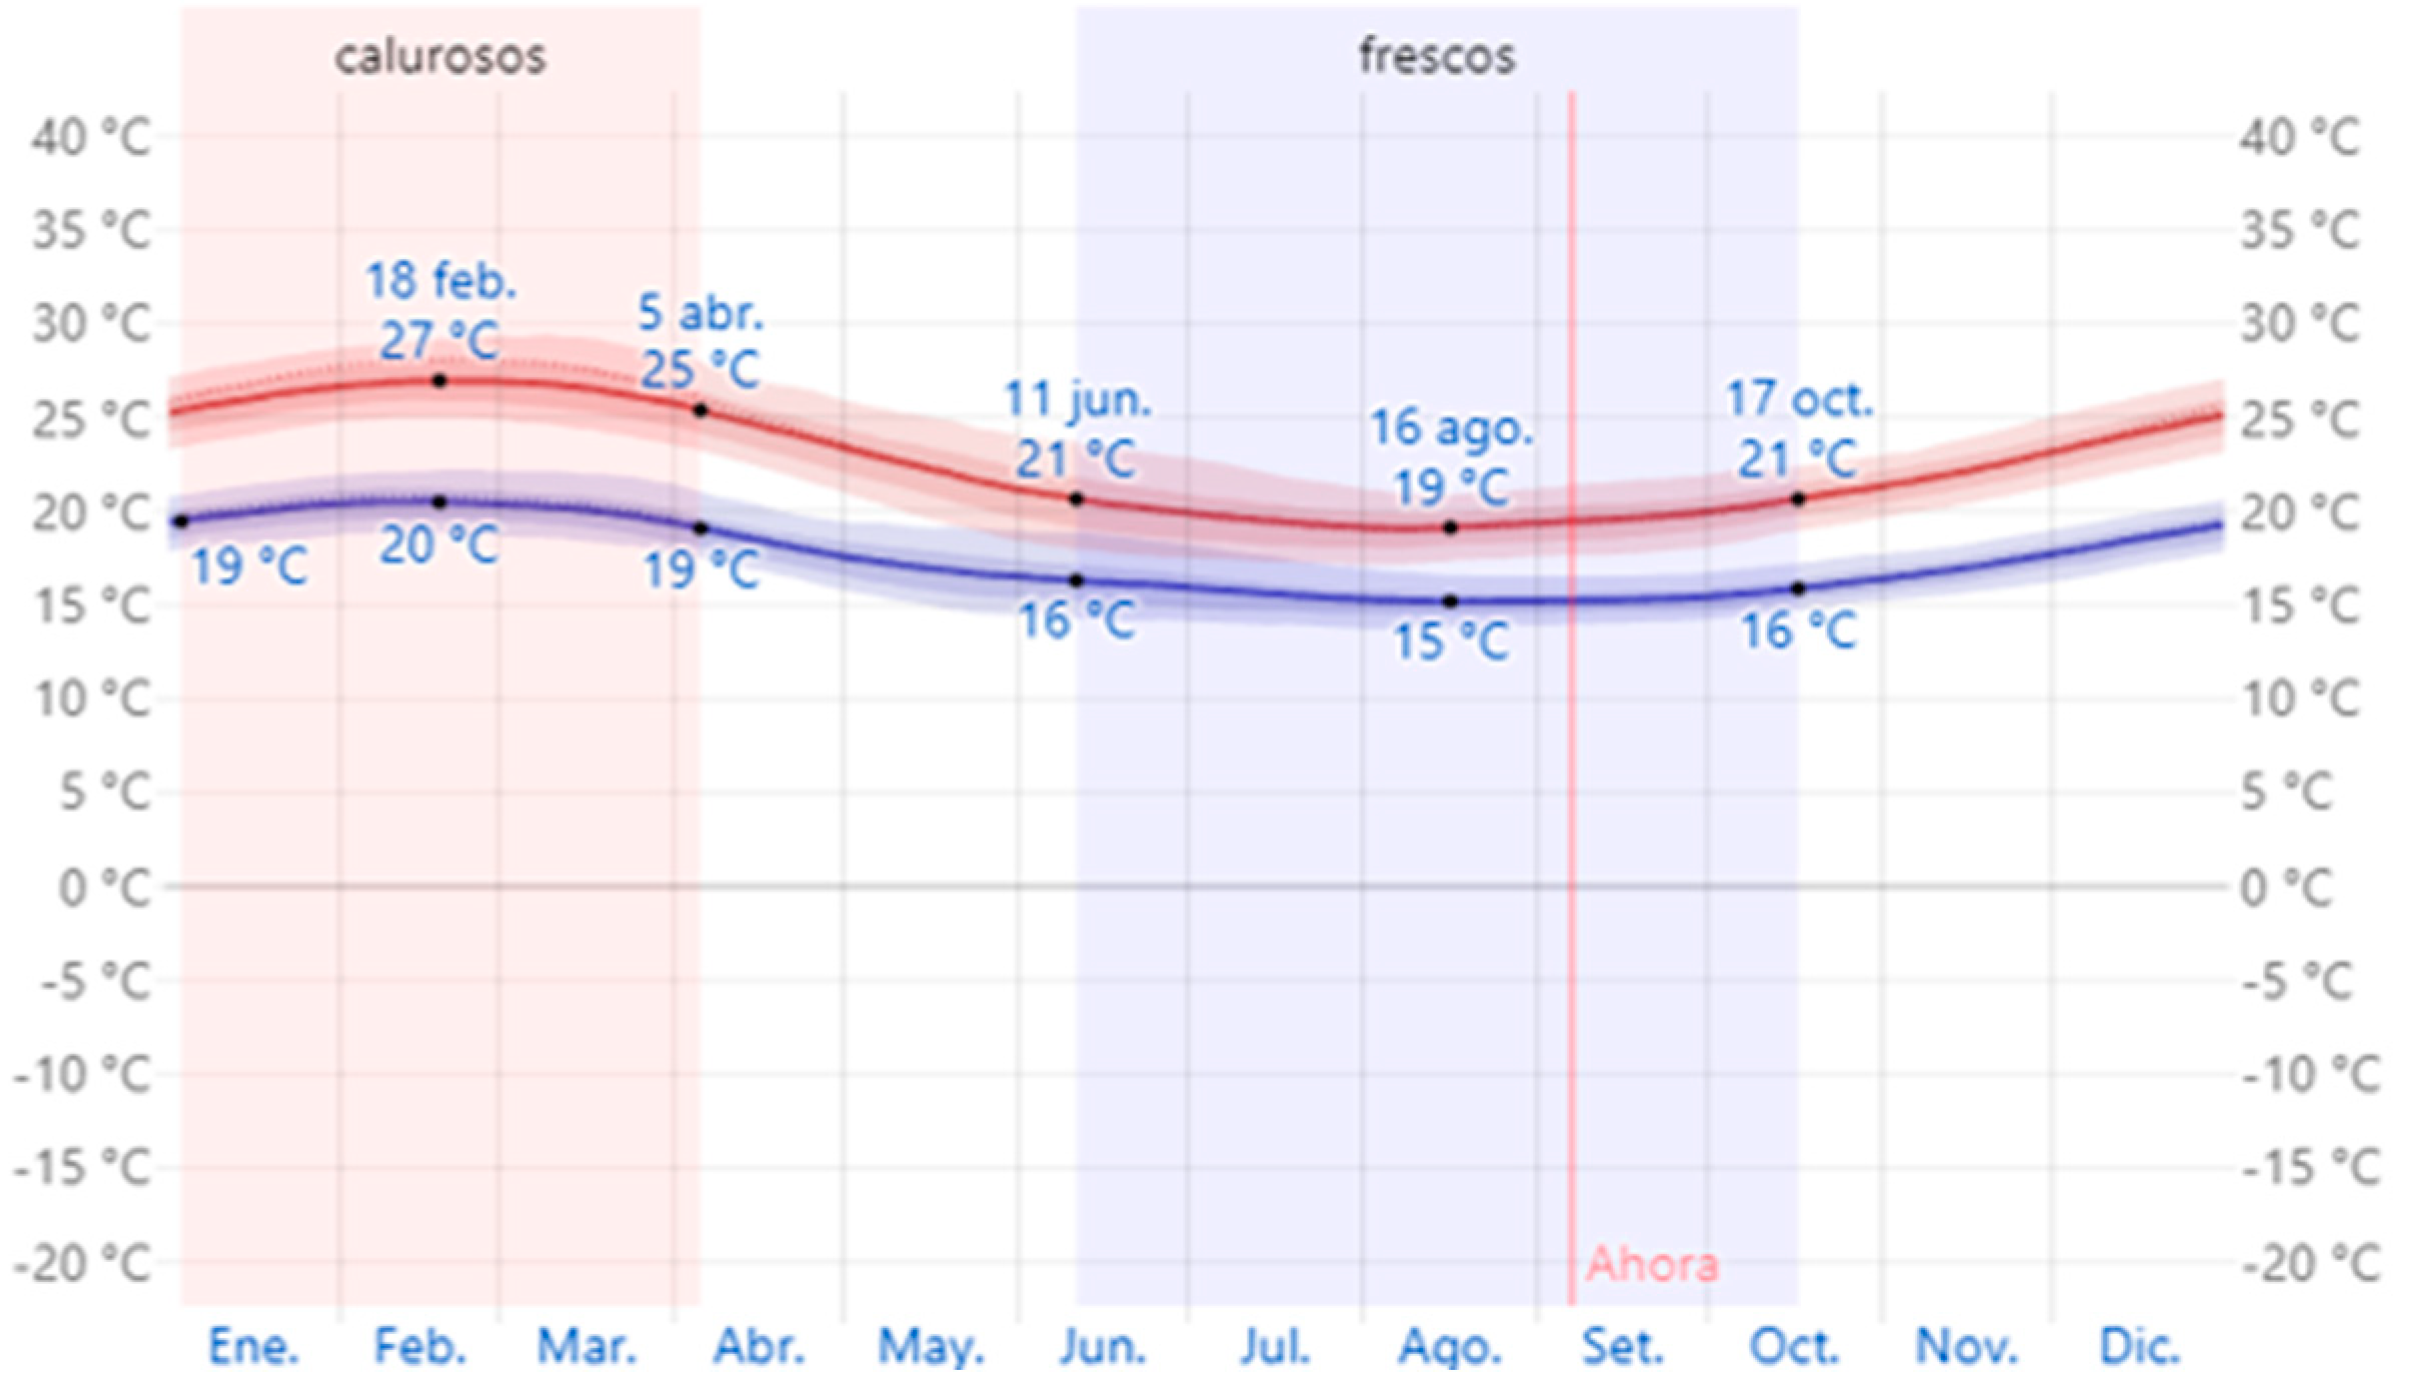
Figure 3.
Temperature diagram of Santiago de Surco district [
48].
Figure 3.
Temperature diagram of Santiago de Surco district [
48].
Figure 4.
Solar energy diagram of Santiago de Surco district [
48].
Figure 4.
Solar energy diagram of Santiago de Surco district [
48].
Figure 5.
Rainfall diagram of Santiago de Surco district [
48].
Figure 5.
Rainfall diagram of Santiago de Surco district [
48].
Figure 6.
Wind speed diagram of Santiago de Surco district [
48].
Figure 6.
Wind speed diagram of Santiago de Surco district [
48].
Figure 7.
Psychrometric chart for Santiago de Surco district. Note: adapted from EM 110 Standard. Thermal and lighting comfort.
Figure 7.
Psychrometric chart for Santiago de Surco district. Note: adapted from EM 110 Standard. Thermal and lighting comfort.
Figure 8.
(a) Map of Santiago de Surco district in Lima, Peru; (b) location of the School of Biological Sciences in the Ricardo Palma University campus.
Figure 8.
(a) Map of Santiago de Surco district in Lima, Peru; (b) location of the School of Biological Sciences in the Ricardo Palma University campus.
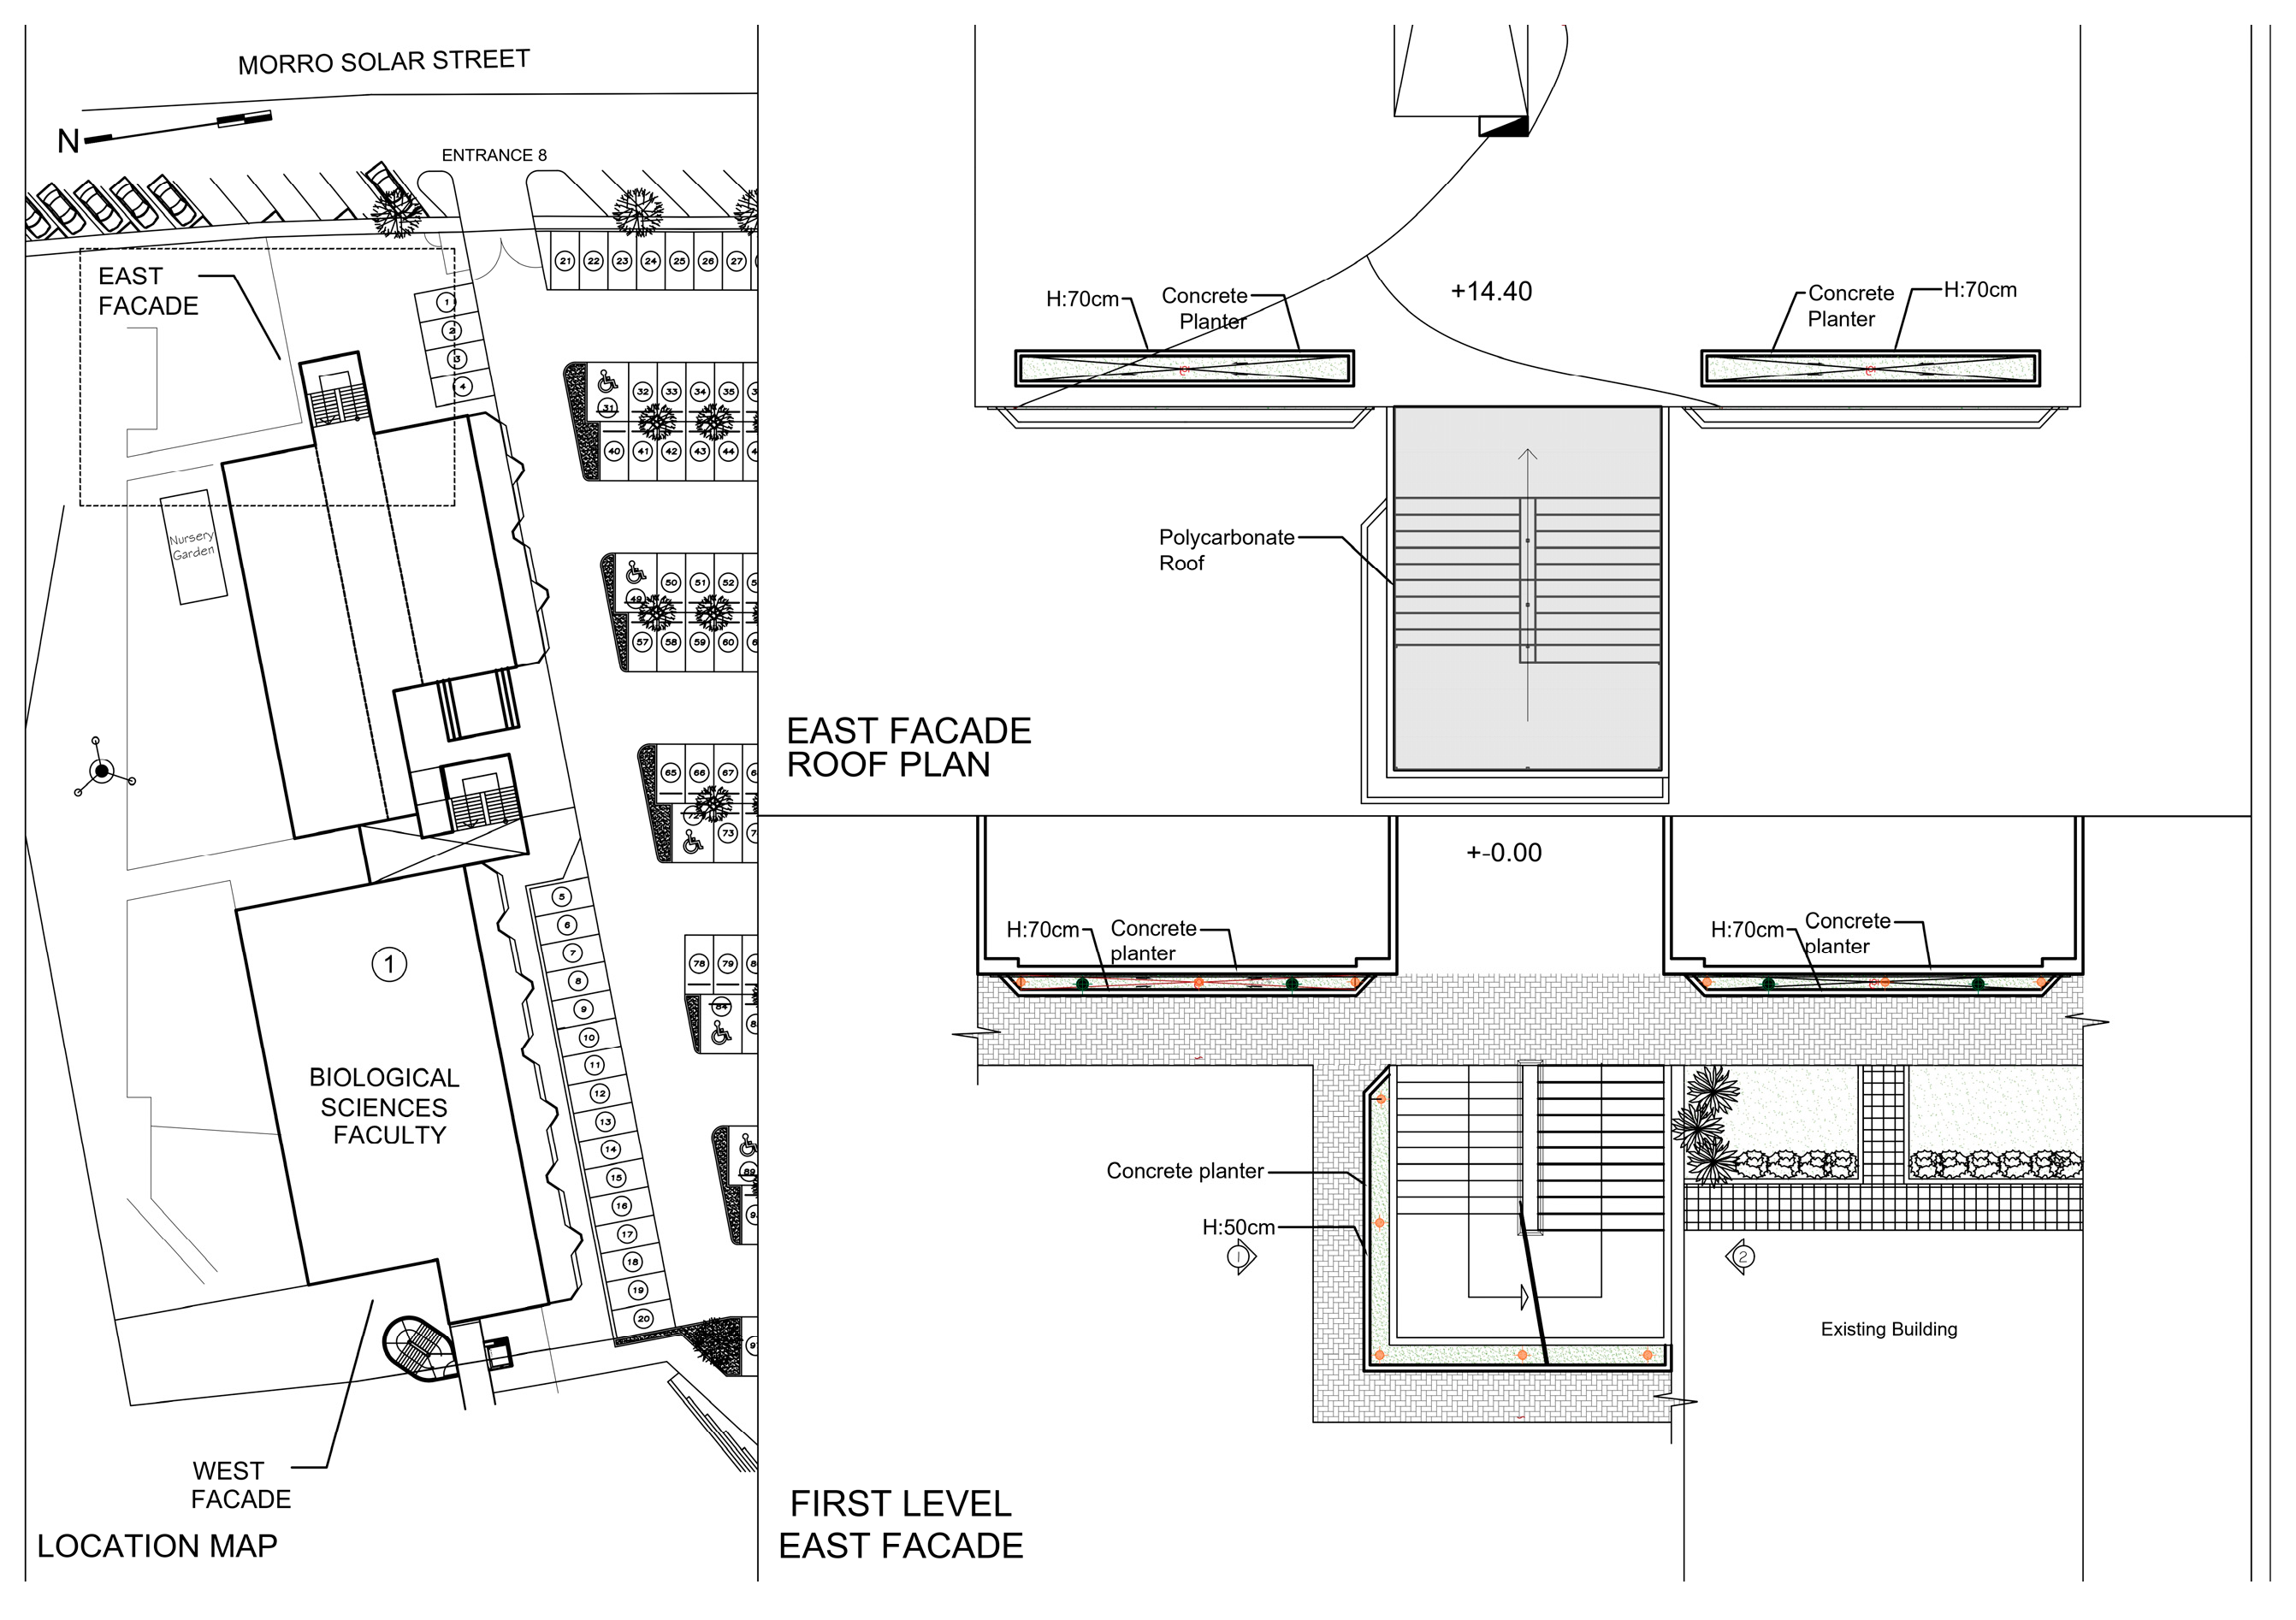
Figure 9.
Faculty of Biological Sciences architectural plan.
Figure 9.
Faculty of Biological Sciences architectural plan.
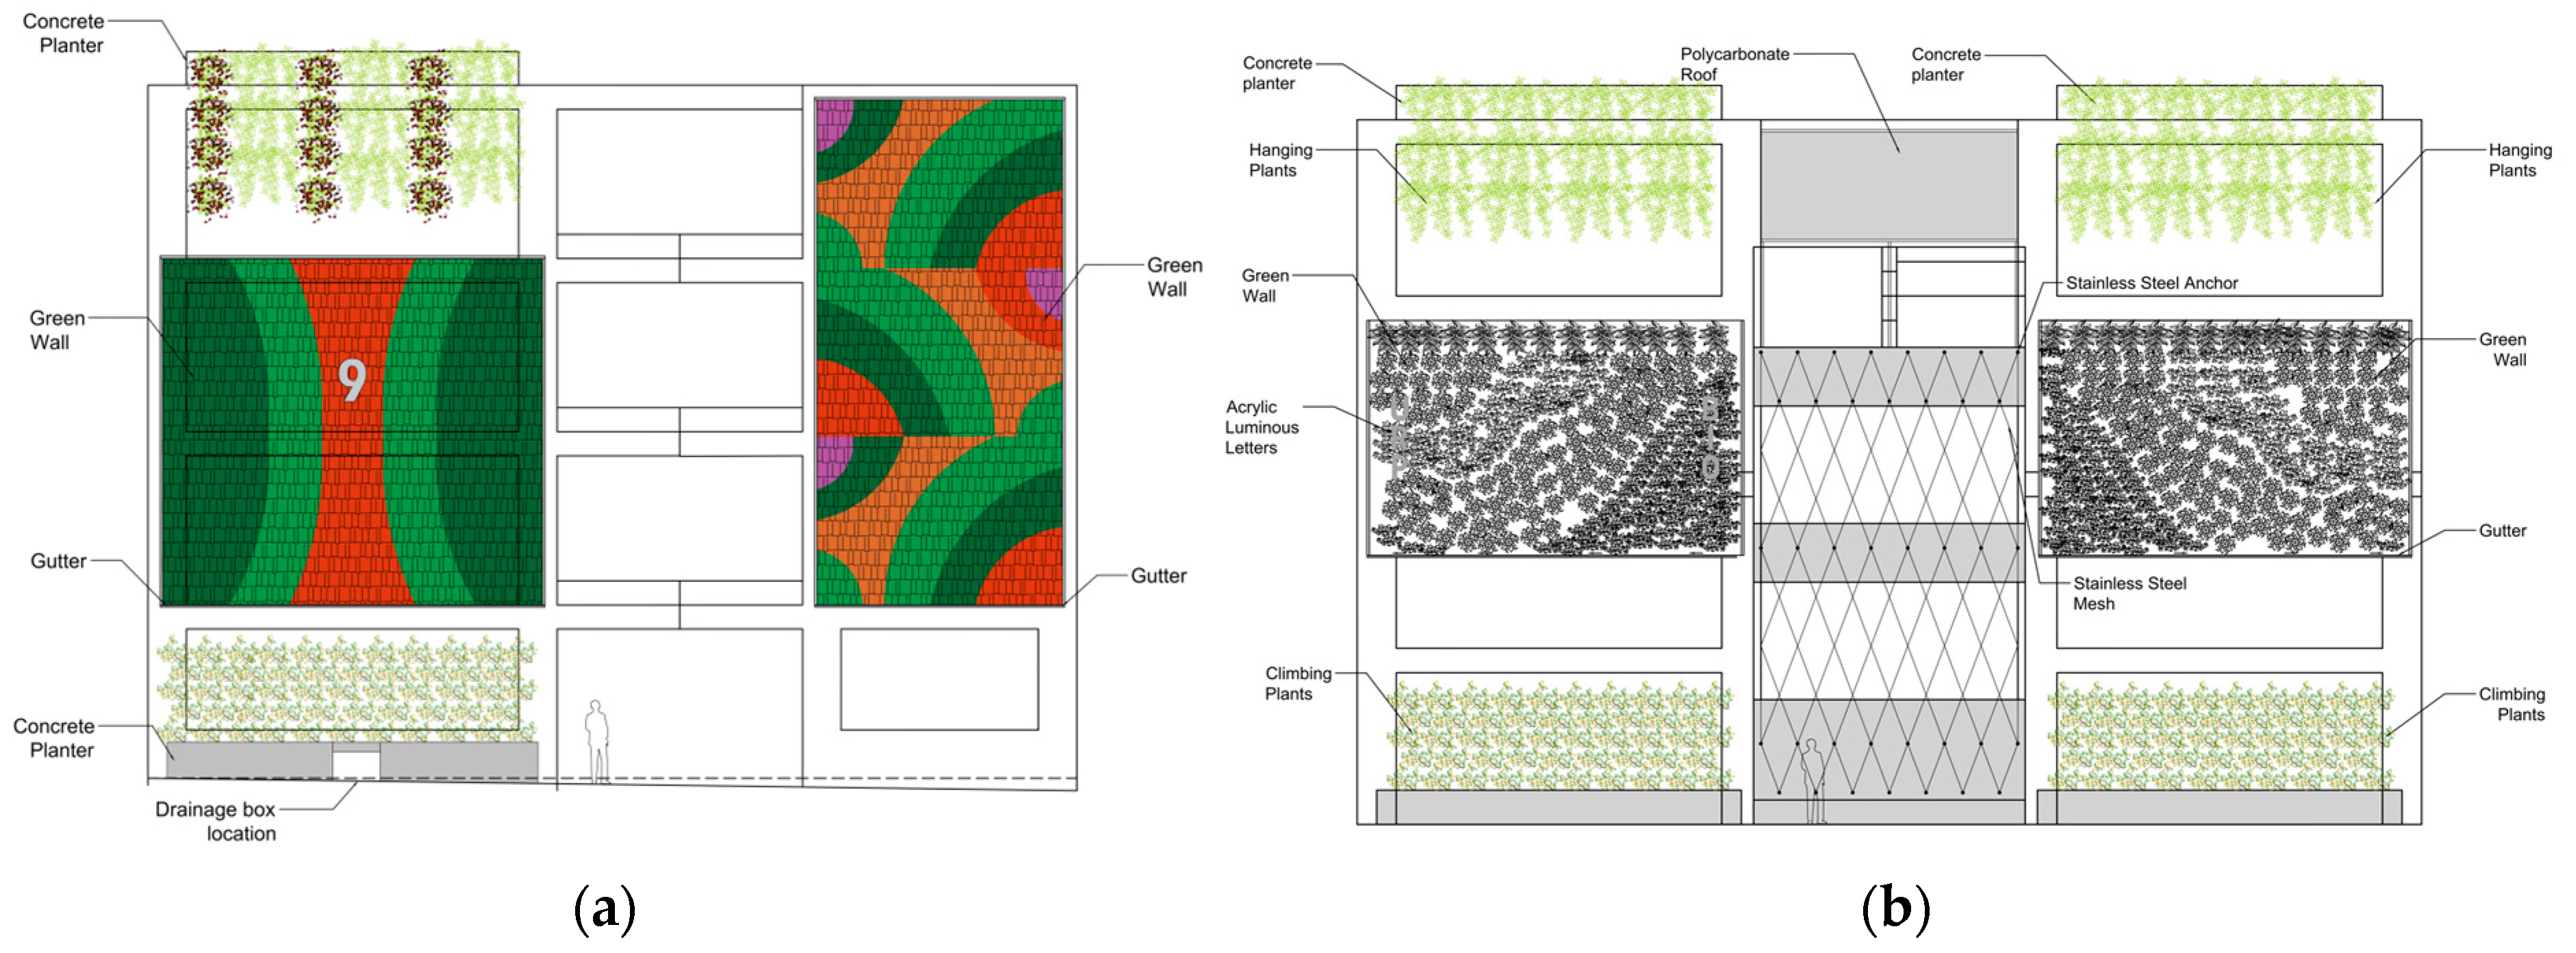
Figure 10.
(a) Green wall on west façade; (b) green wall on east facade.
Figure 10.
(a) Green wall on west façade; (b) green wall on east facade.
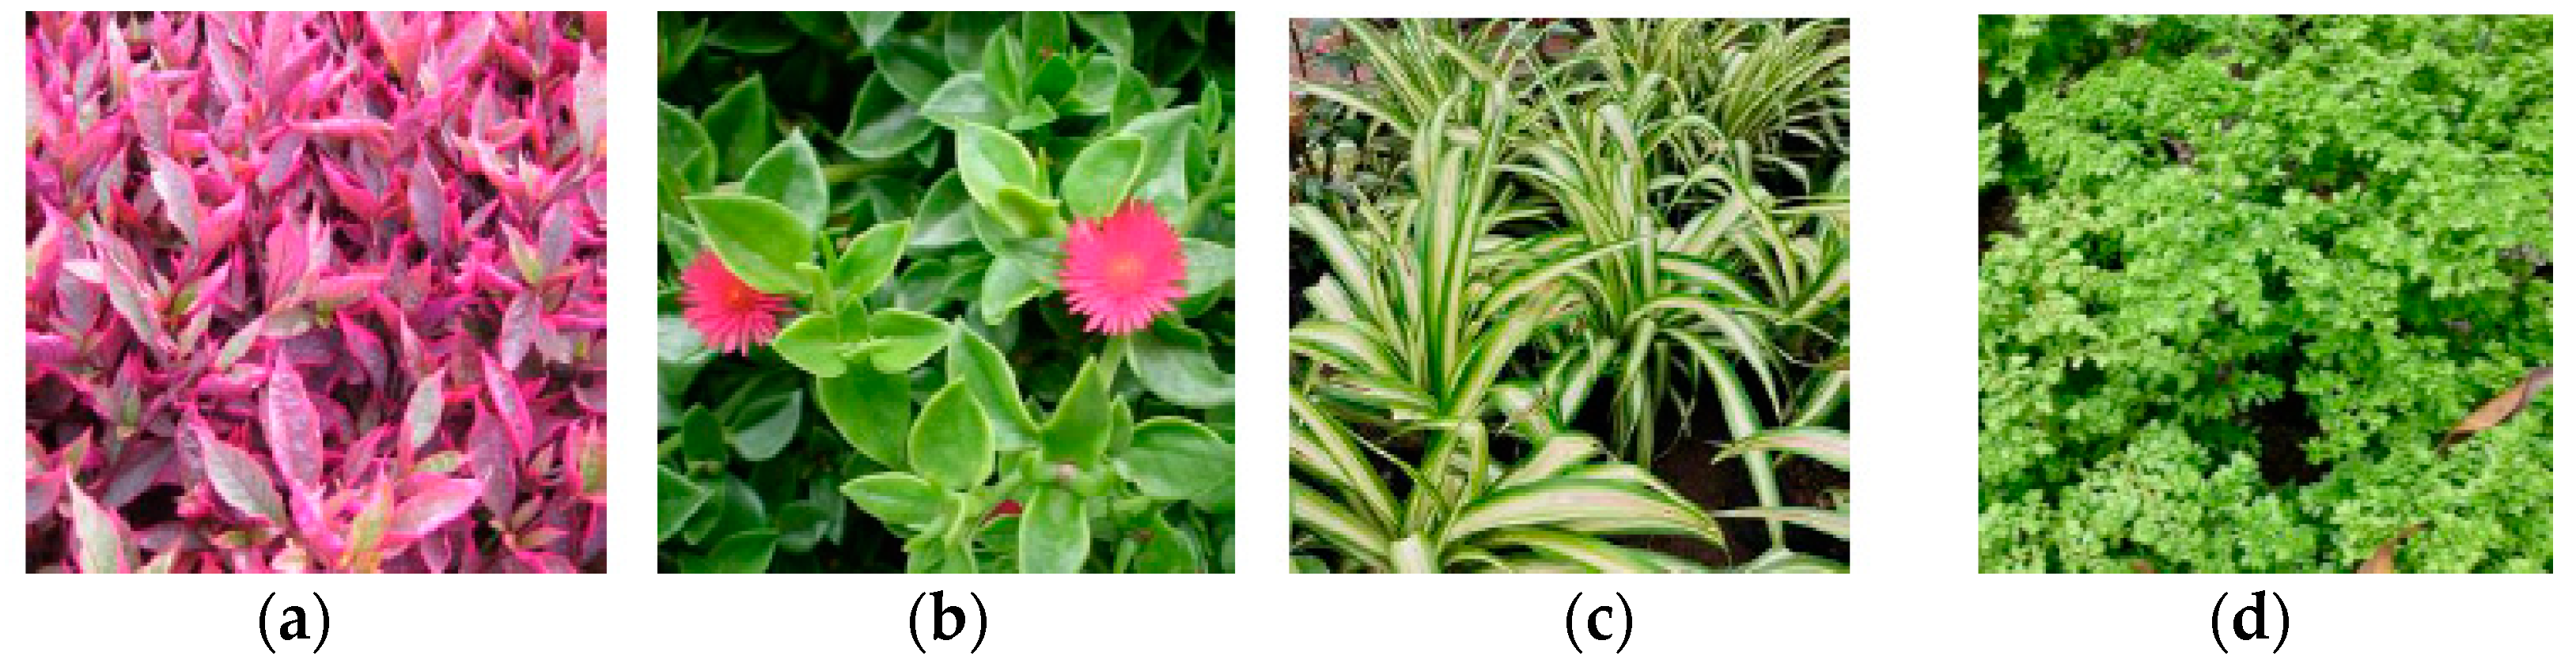
Figure 11.
(a) Rhoeo; (b) Money Plant; (c) Bridal Veil; (d) Baby’s Tears.
Figure 11.
(a) Rhoeo; (b) Money Plant; (c) Bridal Veil; (d) Baby’s Tears.
Figure 12.
(a) Rhodeo; (b) Portalucam; (c) Bridal Veil; (d) Baby’s Tears.
Figure 12.
(a) Rhodeo; (b) Portalucam; (c) Bridal Veil; (d) Baby’s Tears.
Figure 13.
Climbing plants in the Faculty of Biological Sciences stairs.
Figure 13.
Climbing plants in the Faculty of Biological Sciences stairs.
Figure 14.
Applied green wall system, reprinted with permission from Ref. [
49]. 2023, Verdinova.
Figure 14.
Applied green wall system, reprinted with permission from Ref. [
49]. 2023, Verdinova.
Figure 15.
(a) East facade of the School of Biological Sciences in July 2022, during intervention. (b) East facade of the School of Biological Sciences in August 2022, during planting. (c) East facade of the School of Biological Sciences in October 2022, showing the completed wall. (d) East facade of the School of Biological Sciences in March 2023, showing the growth of climbing plants.
Figure 16.
(a) West facade of the School of Biological Sciences in November 2022: the beginning of the construction works on the facade. (b) West facade of the School of Biological Sciences in December 2022: placement of metal posts for supporting the green wall. (c) West facade of the School of Biological Sciences in January 2023: installation of the geomembrane and textile mesh for later planting. (d) West facade of the School of Biological Sciences in January 2023: installation of the geomembrane and textile mesh for later planting.
Figure 17.
(a) West facade of the School of Biological Sciences in March 2023: works in the final stage. (b) West facade of the School of Biological Sciences in May 2023: completed implementation. (c) West facade of the School of Biological Sciences in May 2023: completed implementation and functioning of the installed lighting.
Figure 18.
(a) East facade of the School of Biological Sciences without intervention in January 2022. (b) Proposed intervention for the east facade of the School of Biological Sciences.
Figure 18.
(a) East facade of the School of Biological Sciences without intervention in January 2022. (b) Proposed intervention for the east facade of the School of Biological Sciences.
Figure 19.
(a) West facade of the School of Biological Sciences without intervention in January 2022. (b) Proposed intervention for the west facade of the School of Biological Sciences.
Figure 19.
(a) West facade of the School of Biological Sciences without intervention in January 2022. (b) Proposed intervention for the west facade of the School of Biological Sciences.
Figure 20.
Comparison of results obtained for the east facade of the School of Biological Sciences. (a) Annual solar radiation received on the east facade without green walls. (b) Annual solar radiation received on the east facade with green walls.
Figure 20.
Comparison of results obtained for the east facade of the School of Biological Sciences. (a) Annual solar radiation received on the east facade without green walls. (b) Annual solar radiation received on the east facade with green walls.
Figure 21.
Comparison of results obtained on the west facade of the Faculty of Biological. (a) Result of annual radiation obtained on the west facade of the Faculty of Biological Sciences without green walls. (b) Result of annual radiation obtained on the west facade of the Faculty of Biological Sciences with green walls.
Figure 22.
Comparison of results in thermal balance: (a) thermal balance result in adjacent areas of the east facade without green walls on the first floor on 21 March. (b) Thermal balance result in adjacent areas of the east facade with green walls on the first floor on 21 March.
Figure 22.
Comparison of results in thermal balance: (a) thermal balance result in adjacent areas of the east facade without green walls on the first floor on 21 March. (b) Thermal balance result in adjacent areas of the east facade with green walls on the first floor on 21 March.
Figure 23.
Comparison of results in thermal balance: (a) thermal balance result in adjacent areas of the east facade without green walls on the first floor on 21 June. (b) Thermal balance result in adjacent areas of the east facade with green walls on the first floor on 21 June.
Figure 23.
Comparison of results in thermal balance: (a) thermal balance result in adjacent areas of the east facade without green walls on the first floor on 21 June. (b) Thermal balance result in adjacent areas of the east facade with green walls on the first floor on 21 June.
Figure 24.
Comparison of results in thermal balance: (a) thermal balance result in adjacent areas of the east facade without green walls on the first floor on 21 December. (b) Thermal balance result in adjacent areas of the east facade with green walls on the first floor on 21 December.
Figure 24.
Comparison of results in thermal balance: (a) thermal balance result in adjacent areas of the east facade without green walls on the first floor on 21 December. (b) Thermal balance result in adjacent areas of the east facade with green walls on the first floor on 21 December.
Figure 25.
Building Energy Model simplified—thermal zones analysis and the identification of the thermal block of the first floor towards the east side of the building for analysis.
Figure 25.
Building Energy Model simplified—thermal zones analysis and the identification of the thermal block of the first floor towards the east side of the building for analysis.
Figure 26.
Comparison of results in thermal balance: (a) thermal balance result in adjacent areas of the east facade without green walls on the second floor on 21 March. (b) Thermal balance result in adjacent areas of the east facade with green walls on the second floor on 21 March.
Figure 26.
Comparison of results in thermal balance: (a) thermal balance result in adjacent areas of the east facade without green walls on the second floor on 21 March. (b) Thermal balance result in adjacent areas of the east facade with green walls on the second floor on 21 March.
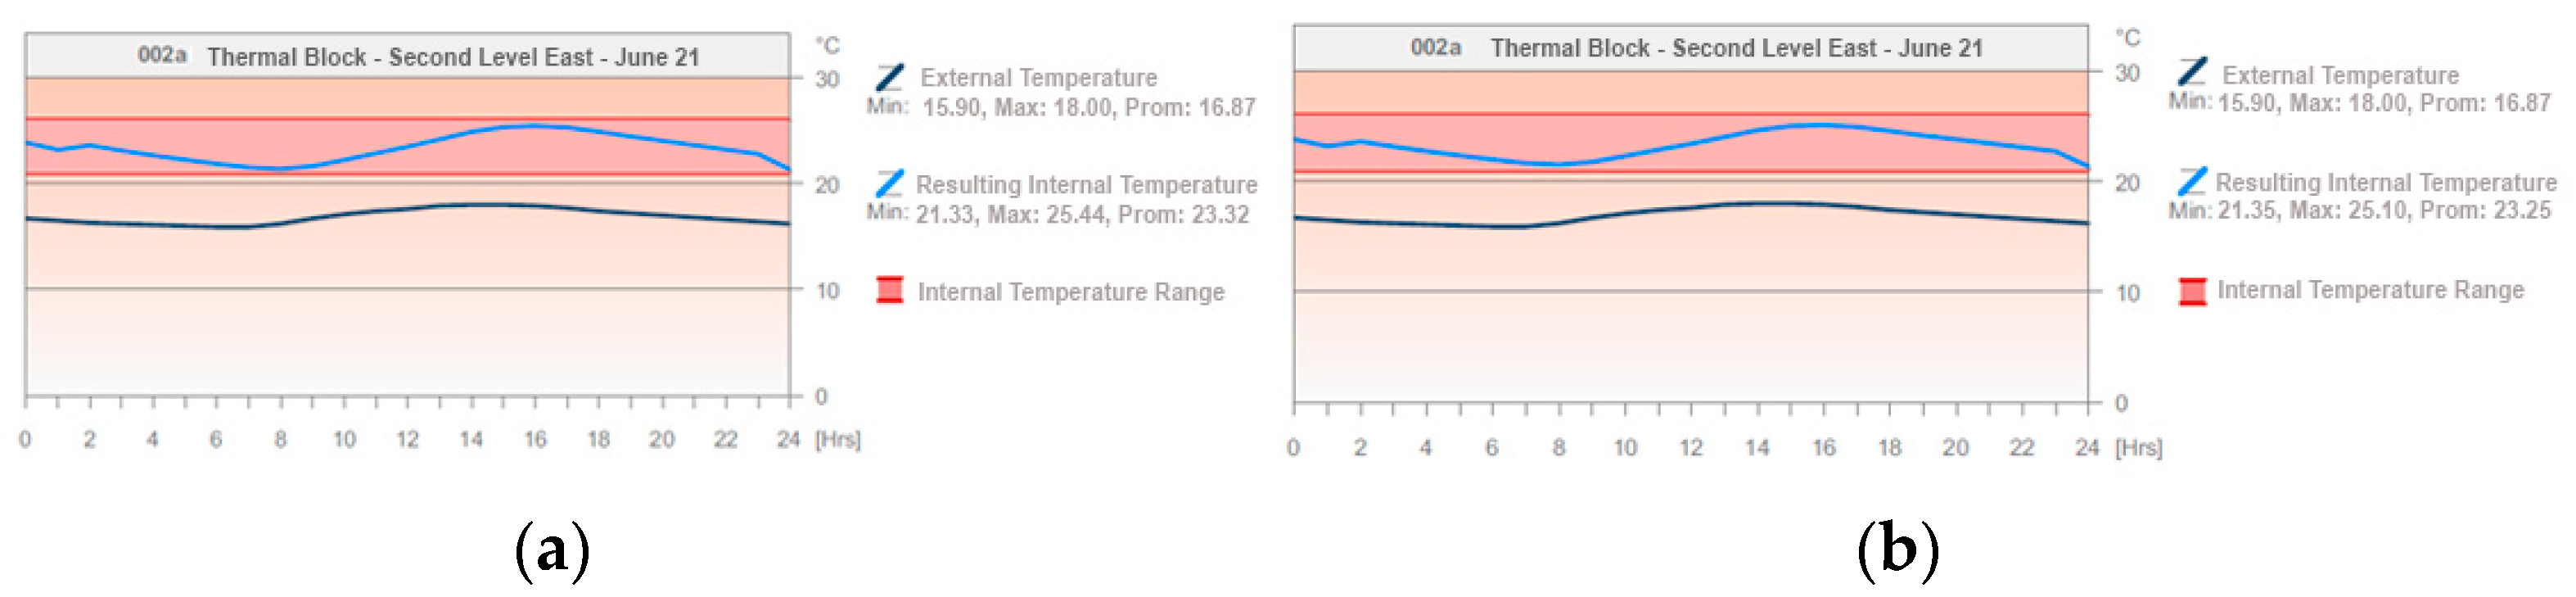
Figure 27.
Comparison of results in thermal balance: (a) thermal balance result in adjacent areas of the east facade without green walls on the second floor on 21 June. (b) Thermal balance result in adjacent areas of the east facade with green walls on the second floor on 21 June.
Figure 27.
Comparison of results in thermal balance: (a) thermal balance result in adjacent areas of the east facade without green walls on the second floor on 21 June. (b) Thermal balance result in adjacent areas of the east facade with green walls on the second floor on 21 June.
Figure 28.
Comparison of results in thermal balance: (a) thermal balance result in adjacent areas of the east facade without green walls on the second floor on 21 December. (b) Thermal balance result in adjacent areas of the east facade with green walls on the second floor on 21 December.
Figure 28.
Comparison of results in thermal balance: (a) thermal balance result in adjacent areas of the east facade without green walls on the second floor on 21 December. (b) Thermal balance result in adjacent areas of the east facade with green walls on the second floor on 21 December.
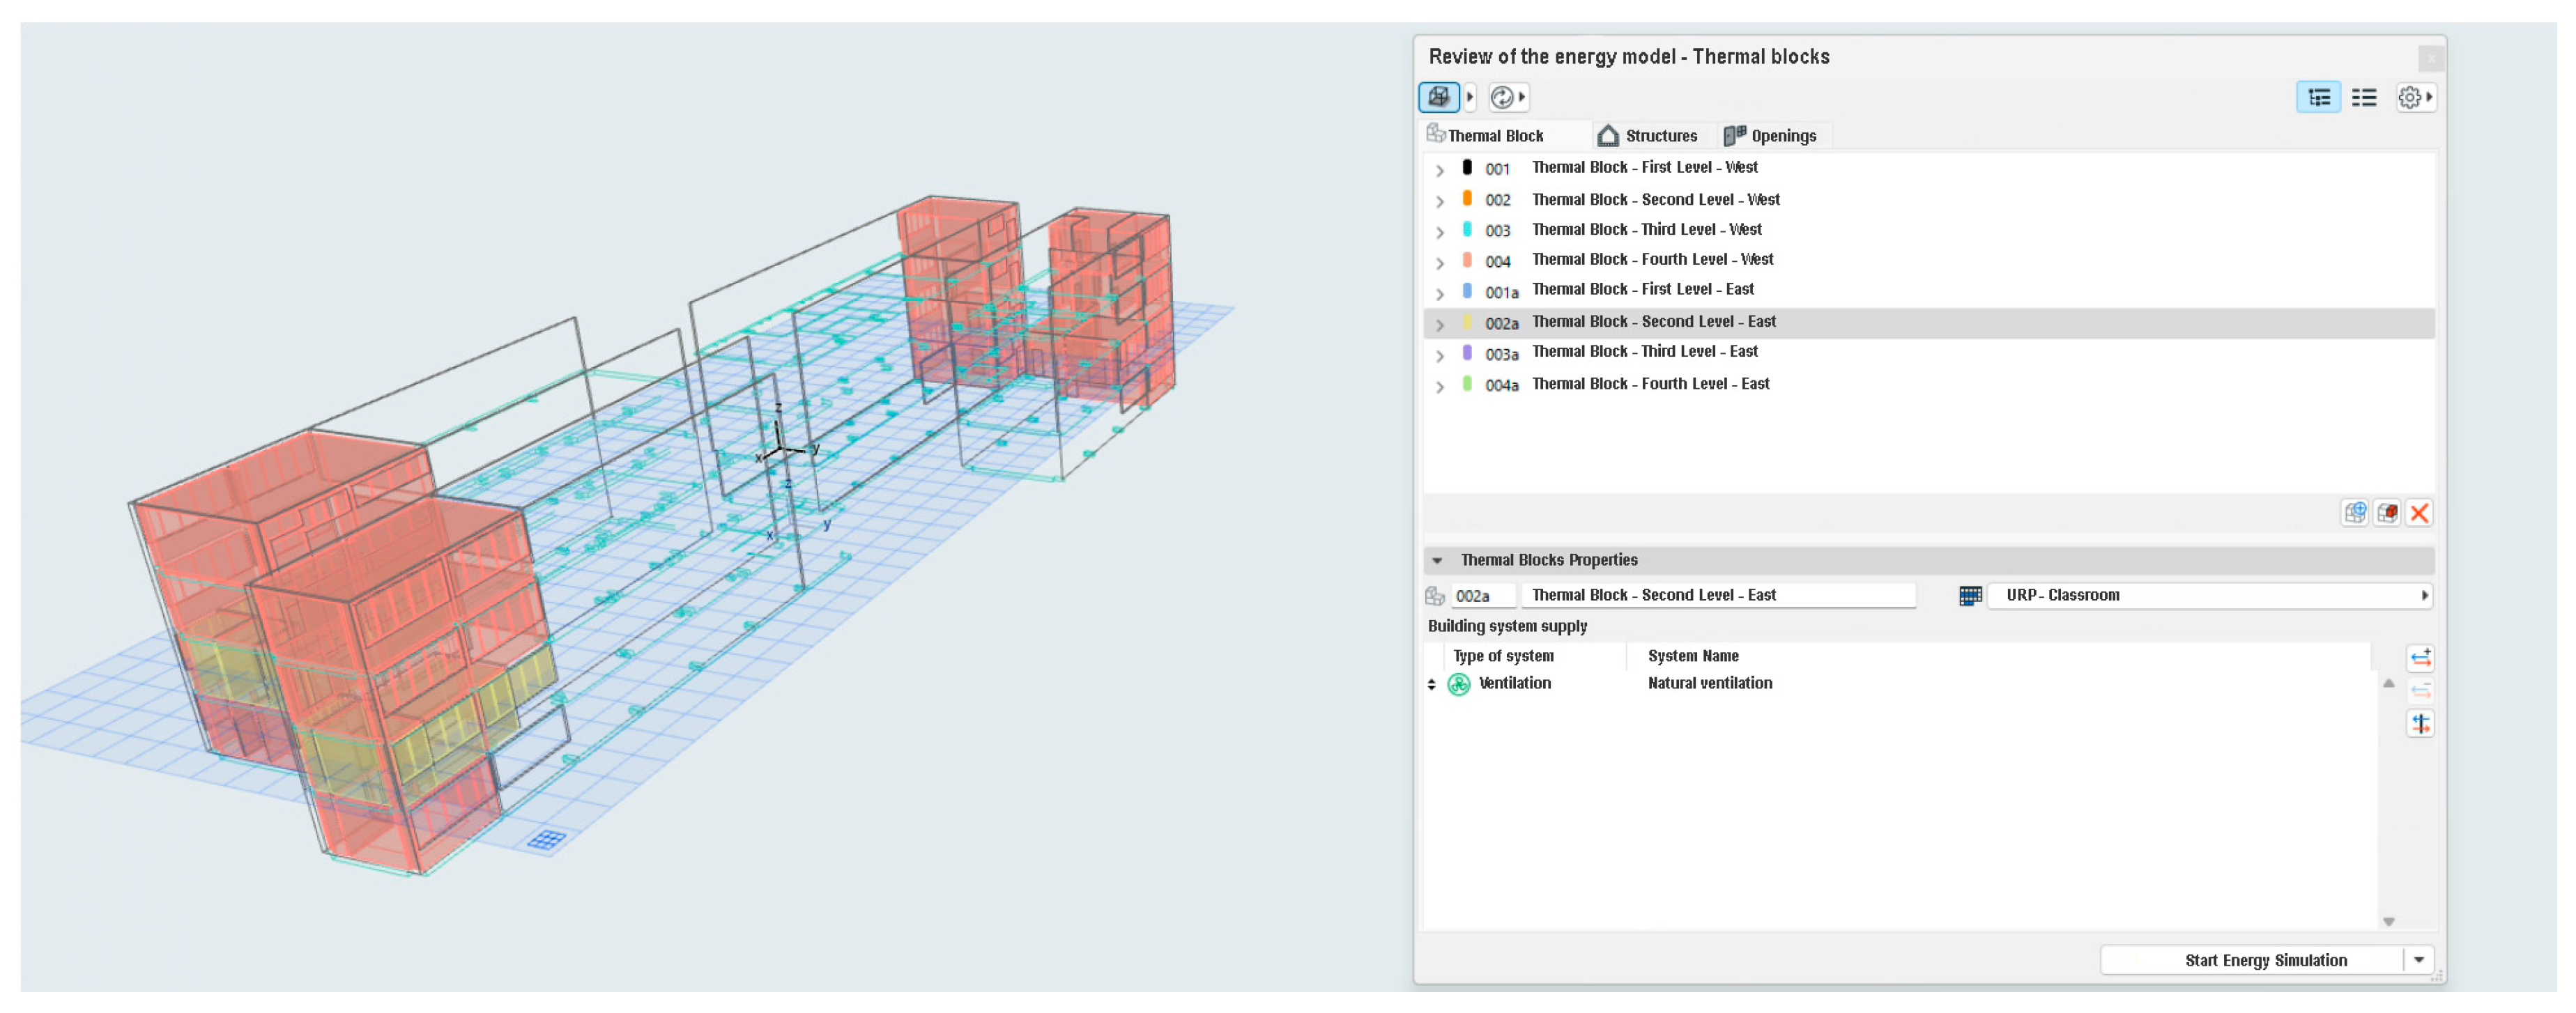
Figure 29.
Building Energy Model simplified—thermal zones analysis and the identification of the thermal block of the second floor towards the east side of the building for analysis.
Figure 29.
Building Energy Model simplified—thermal zones analysis and the identification of the thermal block of the second floor towards the east side of the building for analysis.
Figure 30.
Comparison of results in thermal balance: (a) thermal balance result in adjacent areas of the east facade without green walls on the third floor on 21 March. (b) Thermal balance result in adjacent areas of the east facade with green walls on the third floor on 21 March.
Figure 30.
Comparison of results in thermal balance: (a) thermal balance result in adjacent areas of the east facade without green walls on the third floor on 21 March. (b) Thermal balance result in adjacent areas of the east facade with green walls on the third floor on 21 March.
Figure 31.
Comparison of results in thermal balance: (a) thermal balance result in adjacent areas of the east facade without green walls on the third floor on 21 June. (b) Thermal balance result in adjacent areas of the east facade with green walls on the third floor on 21 June.
Figure 31.
Comparison of results in thermal balance: (a) thermal balance result in adjacent areas of the east facade without green walls on the third floor on 21 June. (b) Thermal balance result in adjacent areas of the east facade with green walls on the third floor on 21 June.
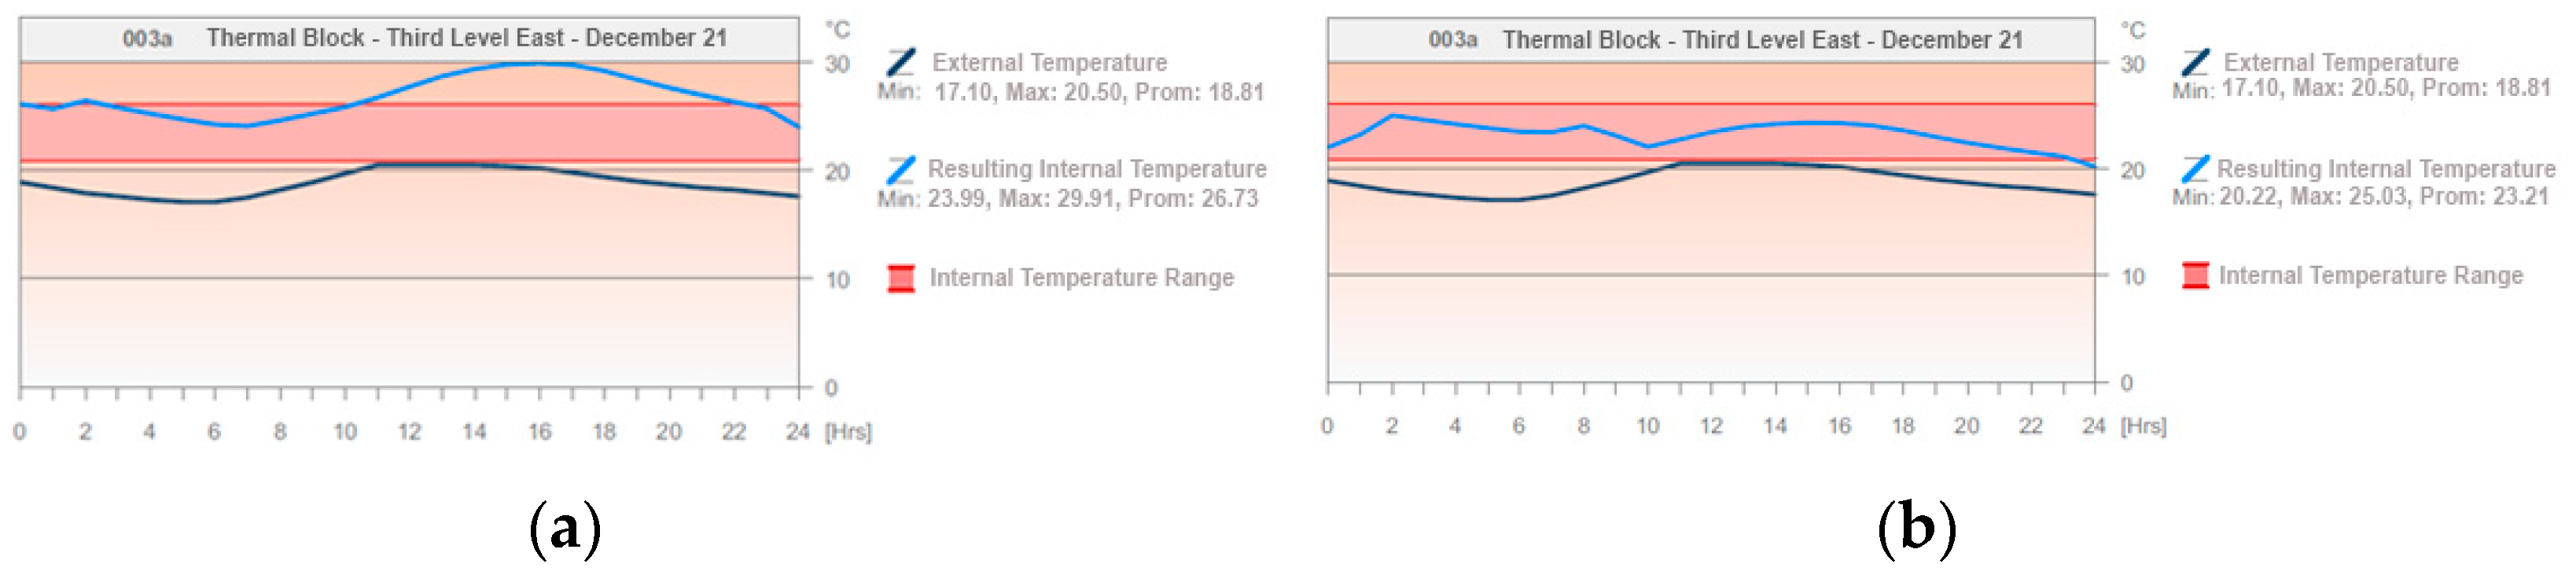
Figure 32.
Comparison of results in thermal balance: (a) thermal balance result in adjacent areas of the east facade without green walls on the third floor on 21 December. (b) Thermal balance result in adjacent areas of the east facade with green walls on the third floor on 21 December.
Figure 32.
Comparison of results in thermal balance: (a) thermal balance result in adjacent areas of the east facade without green walls on the third floor on 21 December. (b) Thermal balance result in adjacent areas of the east facade with green walls on the third floor on 21 December.
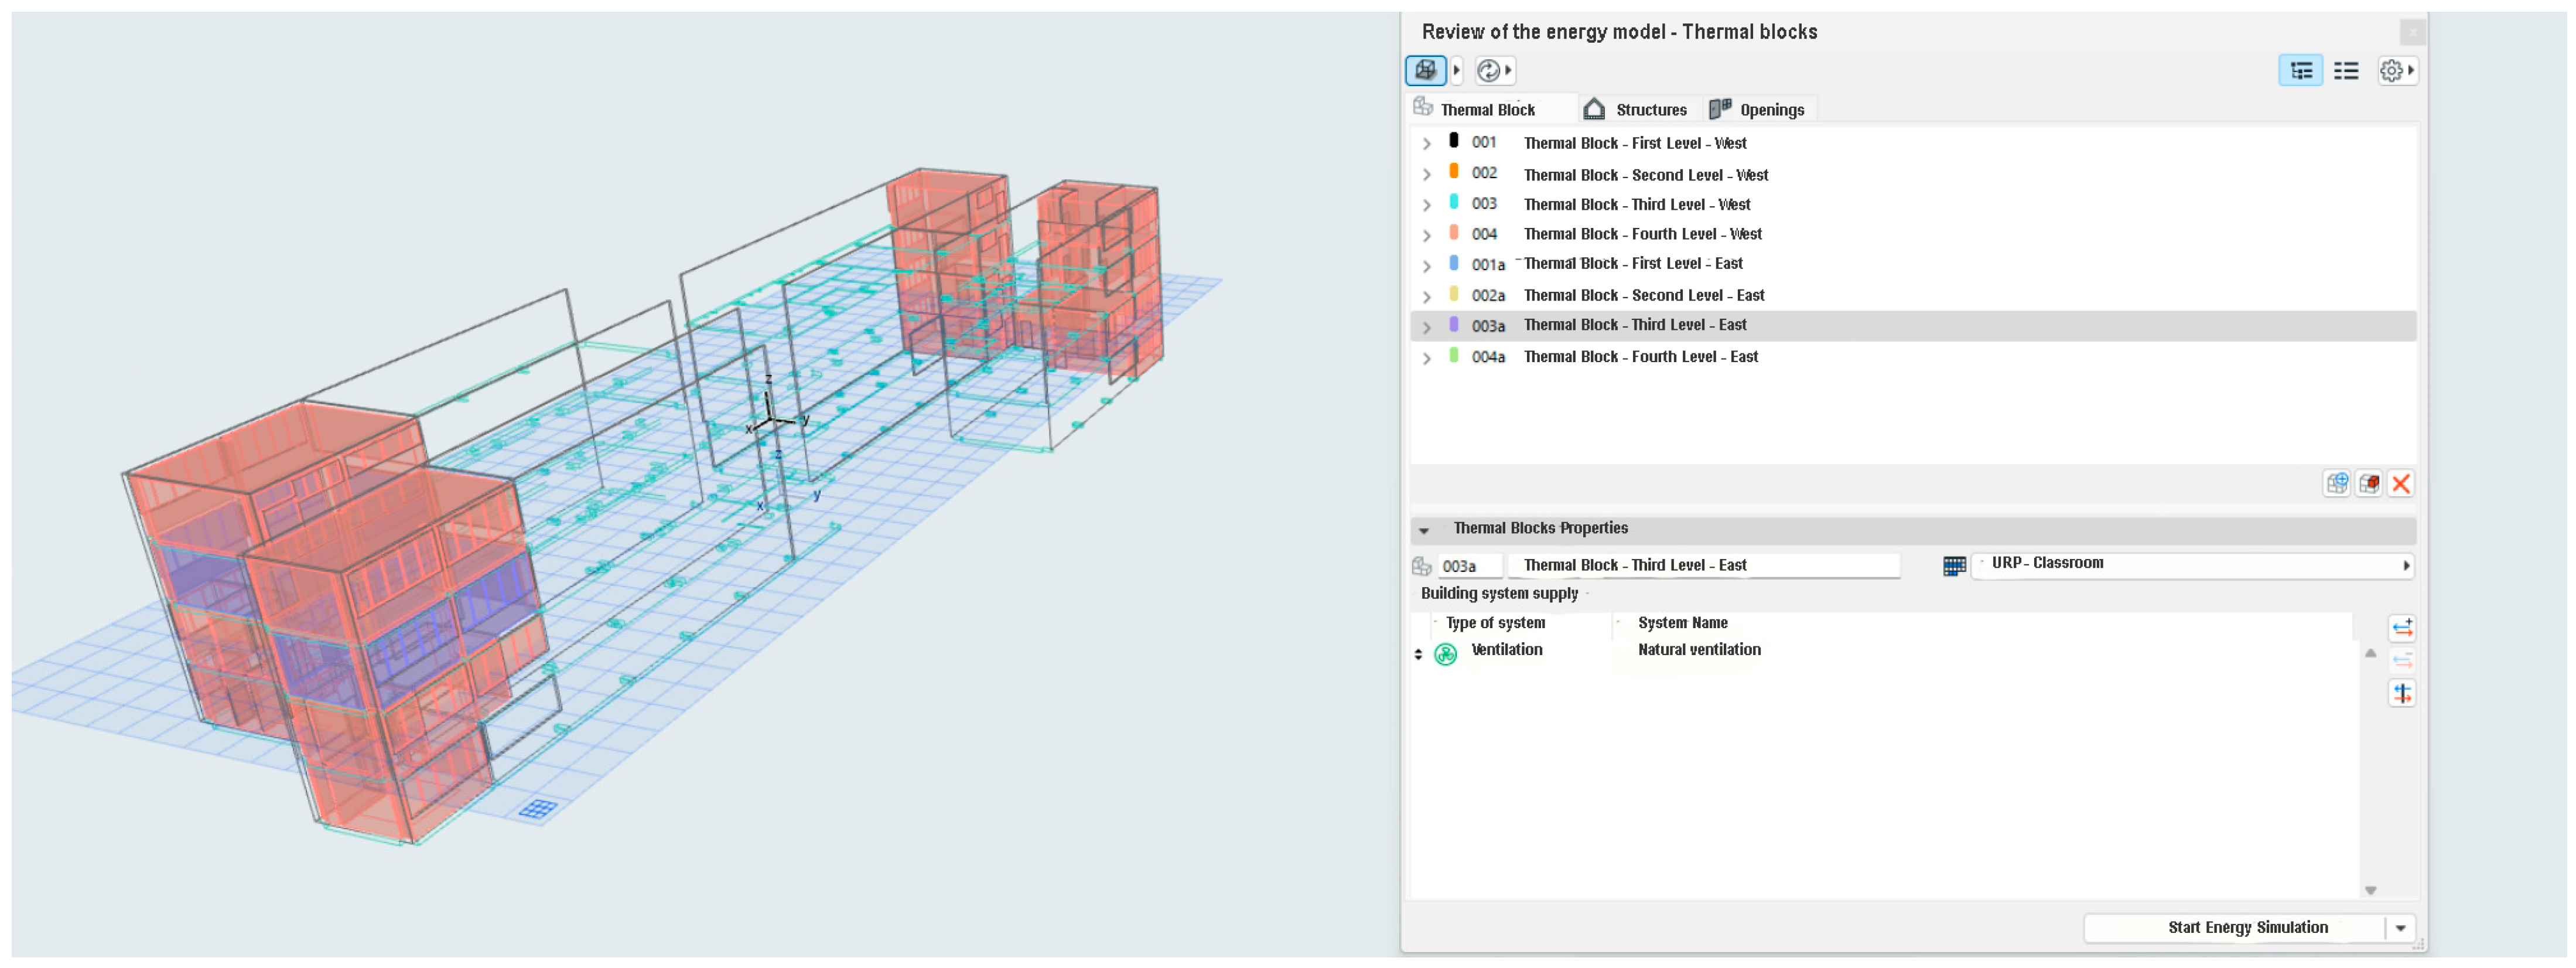
Figure 33.
Building Energy Model simplified—thermal zones analysis and the identification of the thermal block of the third floor towards the east side of the building for analysis.
Figure 33.
Building Energy Model simplified—thermal zones analysis and the identification of the thermal block of the third floor towards the east side of the building for analysis.
Figure 34.
Comparison of results in thermal balance: (a) thermal balance result in adjacent areas of the east facade without green walls on the fourth floor on 21 March. (b) Thermal balance result in adjacent areas of the east facade with green walls on the fourth floor on 21 March.
Figure 34.
Comparison of results in thermal balance: (a) thermal balance result in adjacent areas of the east facade without green walls on the fourth floor on 21 March. (b) Thermal balance result in adjacent areas of the east facade with green walls on the fourth floor on 21 March.
Figure 35.
Comparative results in thermal balance: (a) thermal balance result in adjacent areas to the east facade without green walls on the fourth floor on 21 June; (b) thermal balance result in adjacent areas to the east facade with green walls on the fourth floor on 21 June.
Figure 35.
Comparative results in thermal balance: (a) thermal balance result in adjacent areas to the east facade without green walls on the fourth floor on 21 June; (b) thermal balance result in adjacent areas to the east facade with green walls on the fourth floor on 21 June.
Figure 36.
Comparative results in thermal balance: (a) thermal balance result in adjacent areas of the east facade without green walls on the fourth floor on 21 December; (b) thermal balance result in adjacent areas of the east facade with green walls on the fourth floor on 21 December.
Figure 36.
Comparative results in thermal balance: (a) thermal balance result in adjacent areas of the east facade without green walls on the fourth floor on 21 December; (b) thermal balance result in adjacent areas of the east facade with green walls on the fourth floor on 21 December.
Figure 37.
Building Energy Model simplified—thermal zones analysis and the identification of the thermal block of the fourth floor towards the east side of the building for analysis.
Figure 37.
Building Energy Model simplified—thermal zones analysis and the identification of the thermal block of the fourth floor towards the east side of the building for analysis.
Figure 38.
Building Energy Model simplified—thermal zones analysis and the identification of the thermal block towards the west side of the building for analysis.
Figure 38.
Building Energy Model simplified—thermal zones analysis and the identification of the thermal block towards the west side of the building for analysis.
Figure 39.
Building Energy Model simplified—thermal zones analysis and the identification of the thermal block of the second and third floor towards the east side of the building for analysis.
Figure 39.
Building Energy Model simplified—thermal zones analysis and the identification of the thermal block of the second and third floor towards the east side of the building for analysis.
Figure 40.
(a) Result of the thermal balance in adjacent spaces to the west facade without green walls on the first floor on 21 March; (b) result of the thermal balance in adjacent spaces to the west facade with green walls on the first floor on 21 March.
Figure 40.
(a) Result of the thermal balance in adjacent spaces to the west facade without green walls on the first floor on 21 March; (b) result of the thermal balance in adjacent spaces to the west facade with green walls on the first floor on 21 March.
Figure 41.
Comparison of thermal balance results: (a) result of the thermal balance in adjacent spaces to the west facade without green walls on the first floor on 21 June; (b) result of the thermal balance in adjacent spaces to the west facade with green walls on the first floor on 21 June.
Figure 41.
Comparison of thermal balance results: (a) result of the thermal balance in adjacent spaces to the west facade without green walls on the first floor on 21 June; (b) result of the thermal balance in adjacent spaces to the west facade with green walls on the first floor on 21 June.
Figure 42.
On 21 December, a comparison of thermal balance results in adjacent spaces to the west facade of the School of Biological Sciences shows the following: (a) without green walls, the average temperature is 27.67 °C during the summer solstice. (b) After installing green walls, the average temperature decreases to 23.68 °C, resulting in a temperature reduction of 3.99 °C. Moreover, without green walls, the comfort level is achieved for 7 h per day, while with green walls, this figures increases to 24 h per day, representing a 242.85% increase in comfort hours.
Figure 43.
Building Energy Model simplified—thermal zones analysis and the identification of the thermal block of the first floor towards the west side of the building for analysis.
Figure 43.
Building Energy Model simplified—thermal zones analysis and the identification of the thermal block of the first floor towards the west side of the building for analysis.
Figure 44.
A comparison of thermal balance results on 21 March in adjacent spaces to the west facade of the School of Biological Sciences shows the following: (a) without green walls on the second floor, the average temperature is 29.12 °C. (b) After installing green walls on the second floor, the average temperature decreases to 24.40 °C, resulting in a temperature reduction of 4.72 °C. Additionally, without green walls, the comfort level is achieved for 4 h per day, while with green walls, this figures increases to 24 h per day, representing a 500.00% increase in comfort hours.
Figure 45.
A comparison of thermal balance results on 21 June in adjacent spaces to the west facade of the School of Biological Sciences shows the following: (a) without green walls on the second floor, the average temperature is 27.67 °C. (b) After installing green walls on the second floor, the average temperature decreases to 23.68 °C, resulting in a temperature reduction of 3.99 °C. Additionally, without green walls, the comfort level is achieved for 7 h per day, while with green walls, this figures increases to 24 h per day, representing a 242.85% increase in comfort hours.
Figure 46.
Comparison of results in thermal balance: (a) result of the thermal balance in areas adjoining the west facade without green walls on the second floor on 21 December; (b) result of the thermal balance in areas adjoining the west facade with green walls on the second floor on 21 December.
Figure 46.
Comparison of results in thermal balance: (a) result of the thermal balance in areas adjoining the west facade without green walls on the second floor on 21 December; (b) result of the thermal balance in areas adjoining the west facade with green walls on the second floor on 21 December.
Figure 47.
Building Energy Model simplified—thermal zones analysis and the identification of the thermal block of the second floor towards the west side of the building for analysis.
Figure 47.
Building Energy Model simplified—thermal zones analysis and the identification of the thermal block of the second floor towards the west side of the building for analysis.
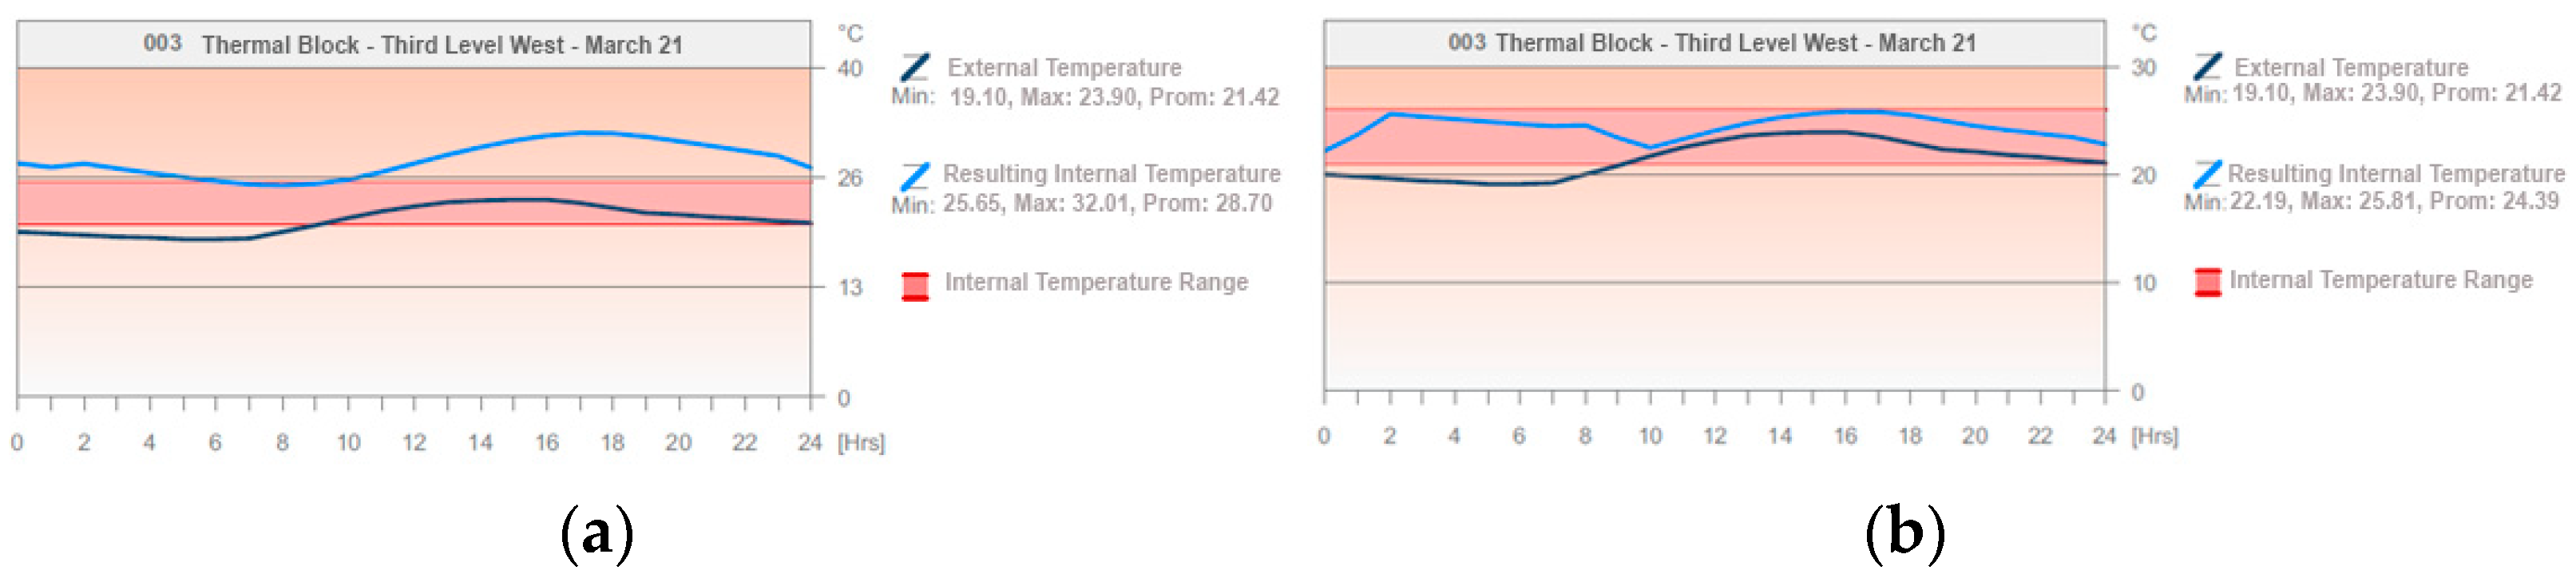
Figure 48.
Comparison of results in thermal balance: (a) result of the thermal balance in areas adjoining the west facade without green walls on the third floor on 21 March; (b) result of the thermal balance in areas adjoining the west facade with green walls on the third floor on 21 March.
Figure 48.
Comparison of results in thermal balance: (a) result of the thermal balance in areas adjoining the west facade without green walls on the third floor on 21 March; (b) result of the thermal balance in areas adjoining the west facade with green walls on the third floor on 21 March.
Figure 49.
Comparison of results in thermal balance: (a) result of the thermal balance in areas adjoining the west facade without green walls on the third floor on 21 June; (b) result of the thermal balance in areas adjoining the west facade with green walls on the third floor on 21 June.
Figure 49.
Comparison of results in thermal balance: (a) result of the thermal balance in areas adjoining the west facade without green walls on the third floor on 21 June; (b) result of the thermal balance in areas adjoining the west facade with green walls on the third floor on 21 June.
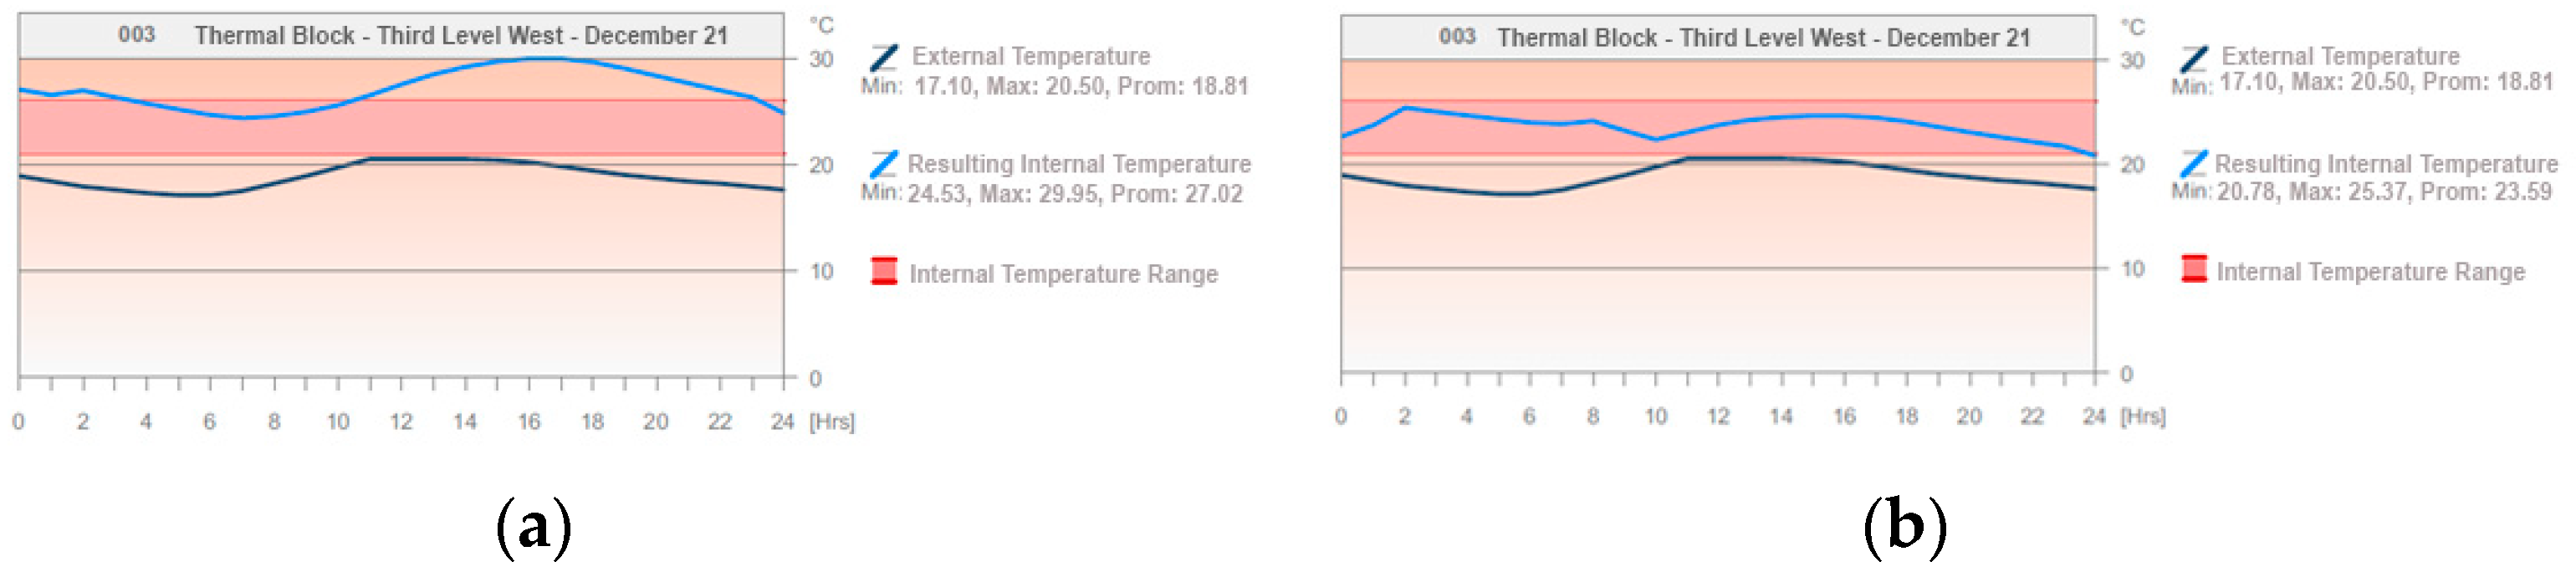
Figure 50.
Comparison of results in thermal balance: (a) result of the thermal balance in areas adjoining the west facade without green walls on the third floor on 21 December; (b) result of the thermal balance in areas adjoining the west facade with green walls on the third floor on 21 December.
Figure 50.
Comparison of results in thermal balance: (a) result of the thermal balance in areas adjoining the west facade without green walls on the third floor on 21 December; (b) result of the thermal balance in areas adjoining the west facade with green walls on the third floor on 21 December.
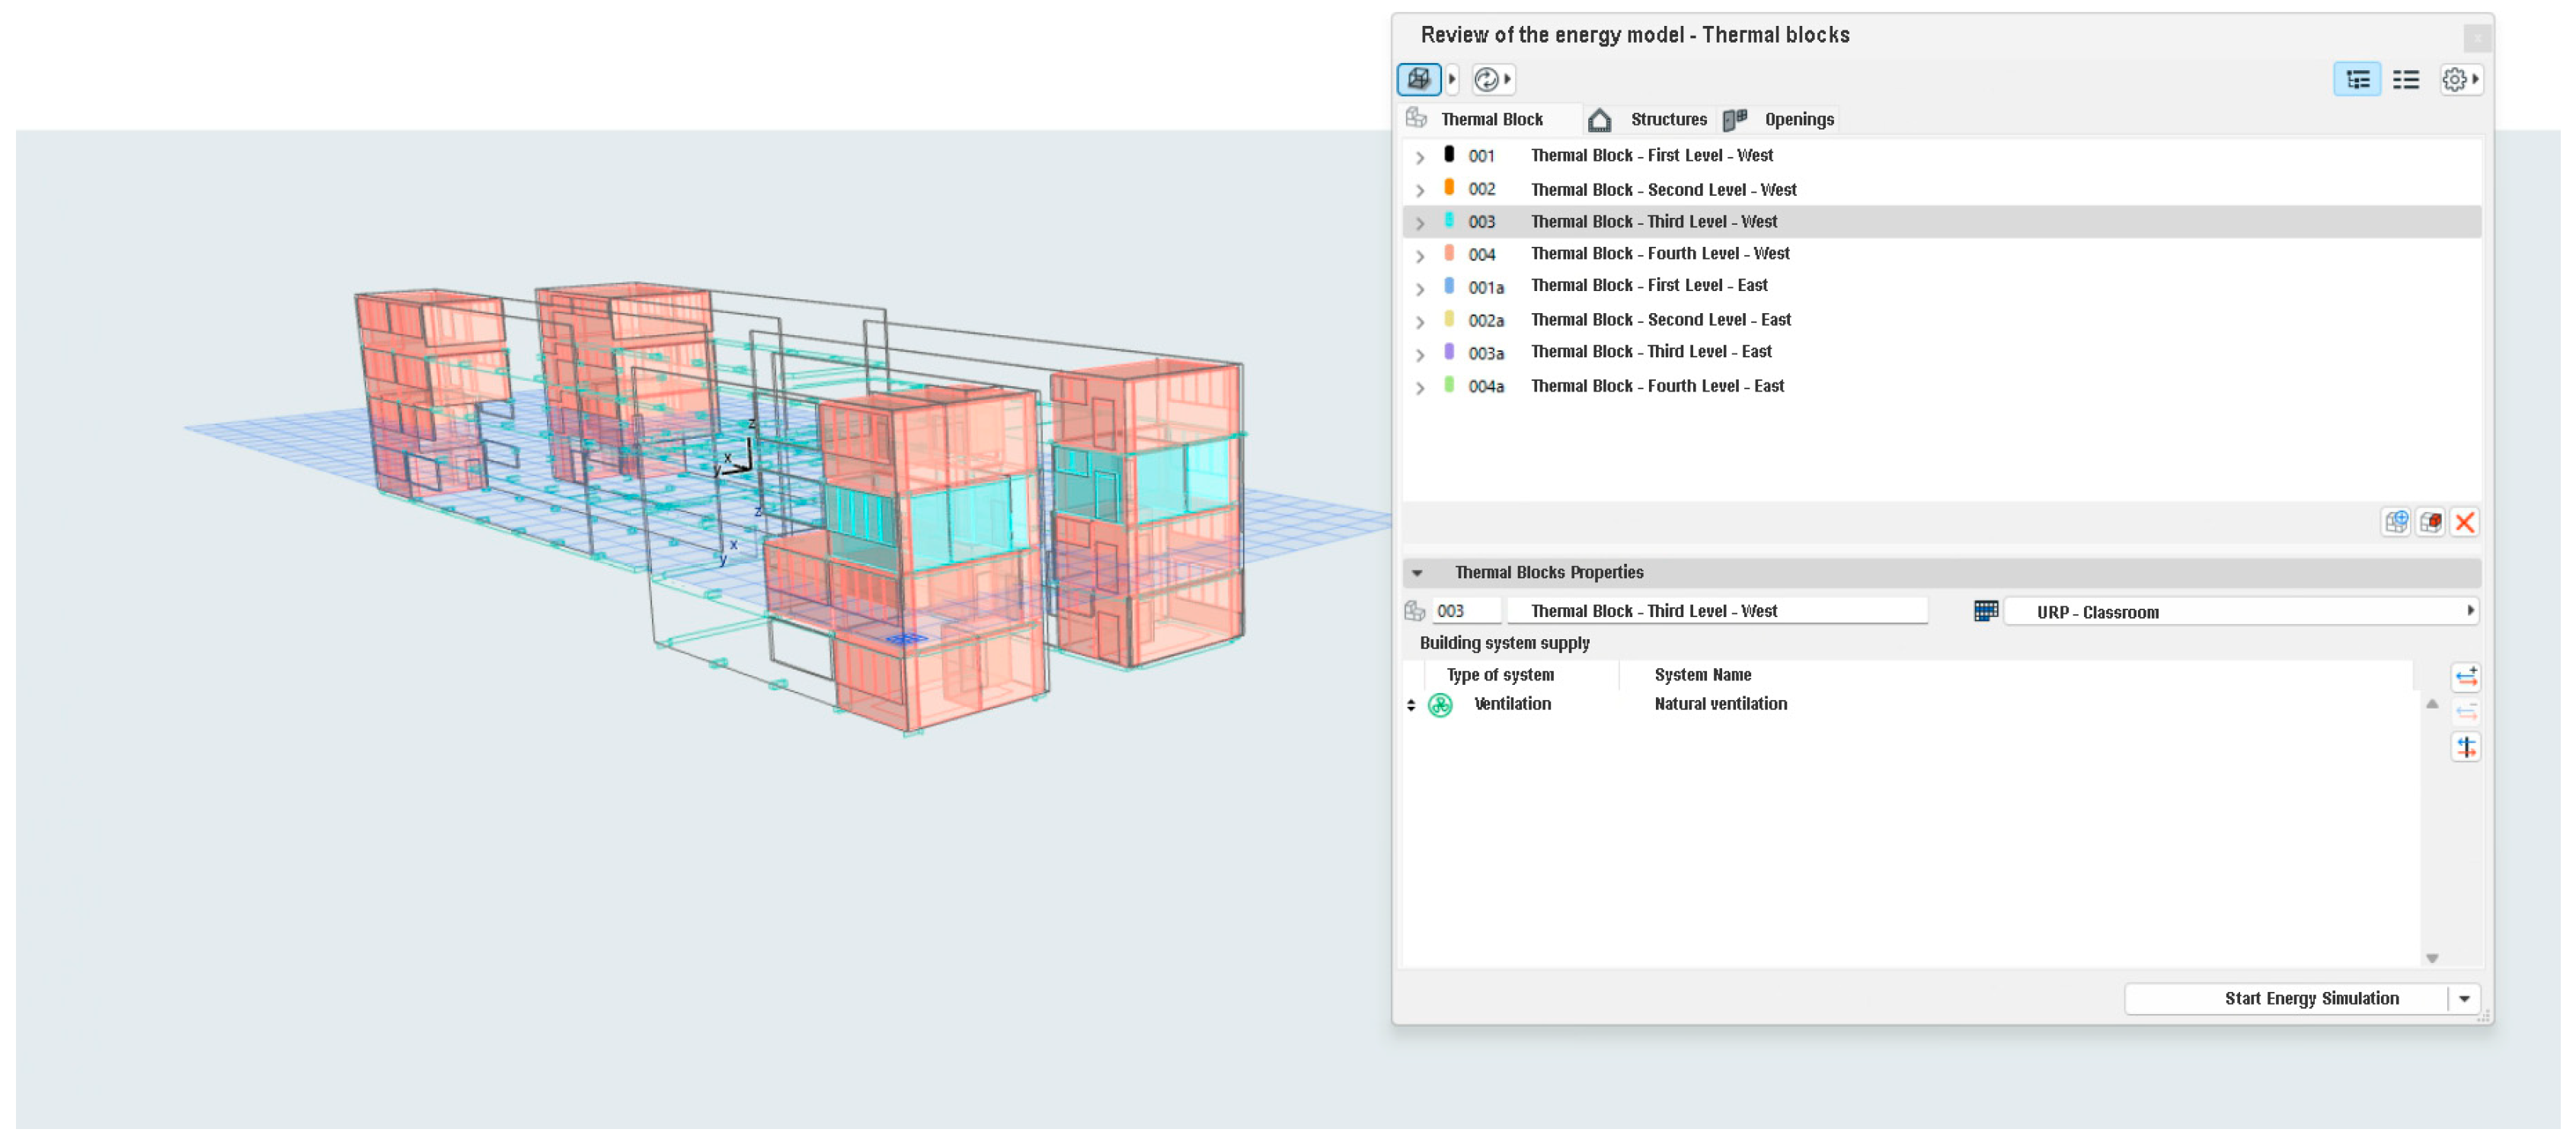
Figure 51.
Building Energy Model simplified—thermal zones analysis and the identification of the thermal block of the third floor towards the west side of the building for analysis.
Figure 51.
Building Energy Model simplified—thermal zones analysis and the identification of the thermal block of the third floor towards the west side of the building for analysis.
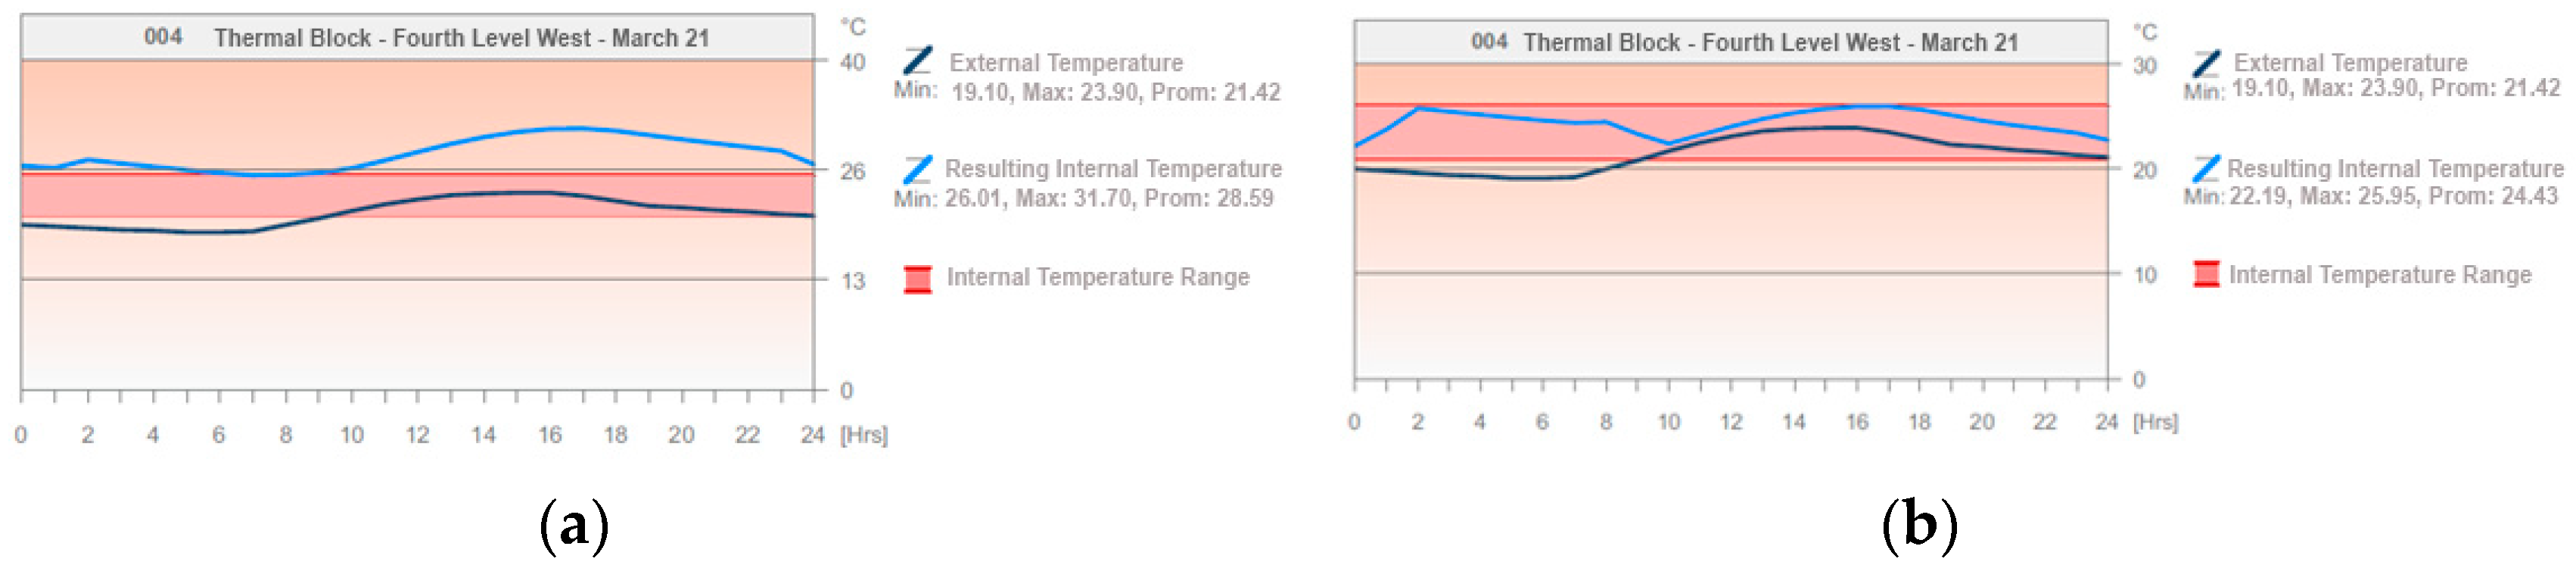
Figure 52.
Comparison of thermal balance results: (a) thermal balance result in adjacent spaces to the west facade without green walls on the fourth floor on 21 March; (b) thermal balance result in adjacent spaces to the west facade with green walls on the fourth floor on 21 March.
Figure 52.
Comparison of thermal balance results: (a) thermal balance result in adjacent spaces to the west facade without green walls on the fourth floor on 21 March; (b) thermal balance result in adjacent spaces to the west facade with green walls on the fourth floor on 21 March.
Figure 53.
Comparison of thermal balance results: (a) thermal balance result in adjacent spaces to the west facade without green walls on the fourth floor on 21 June; (b) thermal balance result in adjacent spaces to the west facade with green walls on the fourth floor on 21 June.
Figure 53.
Comparison of thermal balance results: (a) thermal balance result in adjacent spaces to the west facade without green walls on the fourth floor on 21 June; (b) thermal balance result in adjacent spaces to the west facade with green walls on the fourth floor on 21 June.
Figure 54.
Comparison of thermal balance results: (a) thermal balance result in adjacent spaces to the west facade without green walls on the fourth floor on 21 December; (b) thermal balance result in adjacent spaces to the west facade with green walls on the fourth floor on 21 December.
Figure 54.
Comparison of thermal balance results: (a) thermal balance result in adjacent spaces to the west facade without green walls on the fourth floor on 21 December; (b) thermal balance result in adjacent spaces to the west facade with green walls on the fourth floor on 21 December.
Figure 55.
Simplified energy model of a building: the thermal transmittance of openings and the thermal transmittance of the green walls of the building are identified.
Figure 55.
Simplified energy model of a building: the thermal transmittance of openings and the thermal transmittance of the green walls of the building are identified.
Figure 56.
Thermal simulation of the green wall (temperature). Archicad EcoDesigner STAR—energy model review.
Figure 56.
Thermal simulation of the green wall (temperature). Archicad EcoDesigner STAR—energy model review.
Figure 57.
Thermal simulation of the green wall (energy flux). Archicad EcoDesigner STAR—energy model review.
Figure 57.
Thermal simulation of the green wall (energy flux). Archicad EcoDesigner STAR—energy model review.
Figure 58.
Simplified energy model of a building, which includes thermal zones and identifies the thermal block on the first and fourth floors on the west side of the building.
Figure 58.
Simplified energy model of a building, which includes thermal zones and identifies the thermal block on the first and fourth floors on the west side of the building.
Figure 59.
Thermal simulation of the climbing wall (temperature). Archicad EcoDesigner STAR—energy model review.
Figure 59.
Thermal simulation of the climbing wall (temperature). Archicad EcoDesigner STAR—energy model review.
Figure 60.
Thermal simulation of the climbing wall (energy flux). Archicad EcoDesigner STAR—energy model review.
Figure 60.
Thermal simulation of the climbing wall (energy flux). Archicad EcoDesigner STAR—energy model review.
Table 1.
Solar radiation received on the east facade walls of the School of Biological Sciences, expressed in kWh, as follows.
Table 1.
Solar radiation received on the east facade walls of the School of Biological Sciences, expressed in kWh, as follows.
| Date | W/o Green Walls | With Green Walls | Reduction Percentage |
|---|
| 21 March | 415 | 109 | 74% |
| 21 June | 270 | 79 | 71% |
| 21 December | 412 | 119 | 71% |
Table 2.
Solar radiation received on the west facade walls of the School of Biological Sciences, expressed in kWh, as follows.
Table 2.
Solar radiation received on the west facade walls of the School of Biological Sciences, expressed in kWh, as follows.
| Date | W/o Green Walls | With Green Walls | Reduction Percentage |
|---|
| 21 March | 277 | 102 | 63% |
| 21 June | 319 | 87 | 73% |
| 21 December | 414 | 124 | 70% |
Table 3.
Number of hours in a state of comfort on the east facade of the School of Biological Sciences.
Table 3.
Number of hours in a state of comfort on the east facade of the School of Biological Sciences.
| Floor | Time | W/o Green Walls (h) | With Green Walls (h) | Increase (%) |
|---|
| 1 | 21 March | 5 | 24 | 380 |
| 21 June | 22 | 24 | 9.09 |
| 21 December | 11 | 22 | 100 |
| 2 | 21 March | 16 | 24 | 50 |
| 21 June | 24 | 24 | 0 |
| 21 December | 14 | 23 | 64.28 |
| 3 | 21 March | 10 | 24 | 140 |
| 21 June | 20 | 22 | 10 |
| 21 December | 12 | 22 | 83.35 |
| 4 | 21 March | 10 | 24 | 140 |
| 21 June | 20 | 24 | 20 |
| 21 December | 12 | 22 | 83.33 |
| Total | | 219 | 352 | 60.73 |
Table 4.
Number of hours in a state of comfort on the west facade of the School of Biological Sciences.
Table 4.
Number of hours in a state of comfort on the west facade of the School of Biological Sciences.
| Floor | Time | W/o Green Walls (h) | With Green Walls (h) | Increase (%) |
|---|
| 1 | 21 March | 4 | 24 | 500 |
| 21 June | 20 | 20 | 0 |
| 21 December | 7 | 24 | 242.85 |
| 2 | 21 March | 6 | 24 | 300 |
| 21 June | 24 | 24 | 0 |
| 21 December | 9 | 22 | 144.44 |
| 3 | 21 March | 5 | 24 | 380 |
| 21 June | 24 | 24 | 0 |
| 21 December | 8 | 24 | 200 |
| 4 | 21 March | 5 | 24 | 380 |
| 21 June | 20 | 24 | 20 |
| 21 December | 8 | 23 | 187.50 |
| Total | | 210 | 345 | 64.28 |
Table 5.
Absorbed CO2 and produced fresh air, annually, on the east facade of the School of Biological Sciences.
Table 5.
Absorbed CO2 and produced fresh air, annually, on the east facade of the School of Biological Sciences.
| Floor | Green Wall (m2) | Absorbed CO2 (kg) | Produced Fresh Air (kg) |
|---|
| 1 | 73.38 | 168.77 | 124.75 |
| 2 | 85.30 | 196.19 | 145.01 |
| 3 |
| 4 | 53.82 | 123.79 | 91.49 |
| Total | 212.50 | 488.75 | 361.25 |
Table 6.
Absorbed CO2 and produced fresh air, annually, on the west facade of the School of Biological Sciences.
Table 6.
Absorbed CO2 and produced fresh air, annually, on the west facade of the School of Biological Sciences.
| Floor | Green Wall (m2) | Absorbed CO2 (kg) | Produced Fresh Air (kg) |
|---|
| 1 | 73.38 | 168.77 | 124.75 |
| 2 | 85.30 | 196.19 | 145.01 |
| 3 |
| 4 | 53.82 | 123.79 | 91.49 |
| Total | 212.50 | 488.75 | 361.25 |
Table 7.
Absorbed CO2 and produced fresh air, annually, on the east and west facades of the School of Biological Sciences.
Table 7.
Absorbed CO2 and produced fresh air, annually, on the east and west facades of the School of Biological Sciences.
| Floor | Green Wall (m2) | Absorbed CO2 (kg) | Produced Fresh Air (kg) |
|---|
| 1 | 146.76 | 337.54 | 249.50 |
| 2 | 170.60 | 392.38 | 290.02 |
| 3 |
| 4 | 107.64 | 247.58 | 182.98 |
| Total | 425.00 | 977.50 | 722.50 |
Table 8.
Percentage of reduction on the west facades in the schools of Biology, Architecture, and Engineering.
Table 8.
Percentage of reduction on the west facades in the schools of Biology, Architecture, and Engineering.
| | Date | W/o Green Walls | With Green Walls | Reduction Percentage |
|---|
| School of Biology | 21 March | 277 | 102 | 63% |
| 21 June | 319 | 87 | 73% |
| 21 December | 414 | 124 | 70% |
| School of Architecture | 21 March | 277 | - | 0% |
| 21 June | 319 | - | 0% |
| 21 December | 414 | - | 0% |
| School of Engineering | 21 March | 277 | - | 0% |
| 21 June | 319 | - | 0% |
| 21 December | 414 | - | 0% |


 ,
, 


