
Application of Stochastic Finite Element Modeling to Reinforced Lightweight Concrete Beams Containing Expanded Polystyrene Beads


Abstract
:1. Introduction
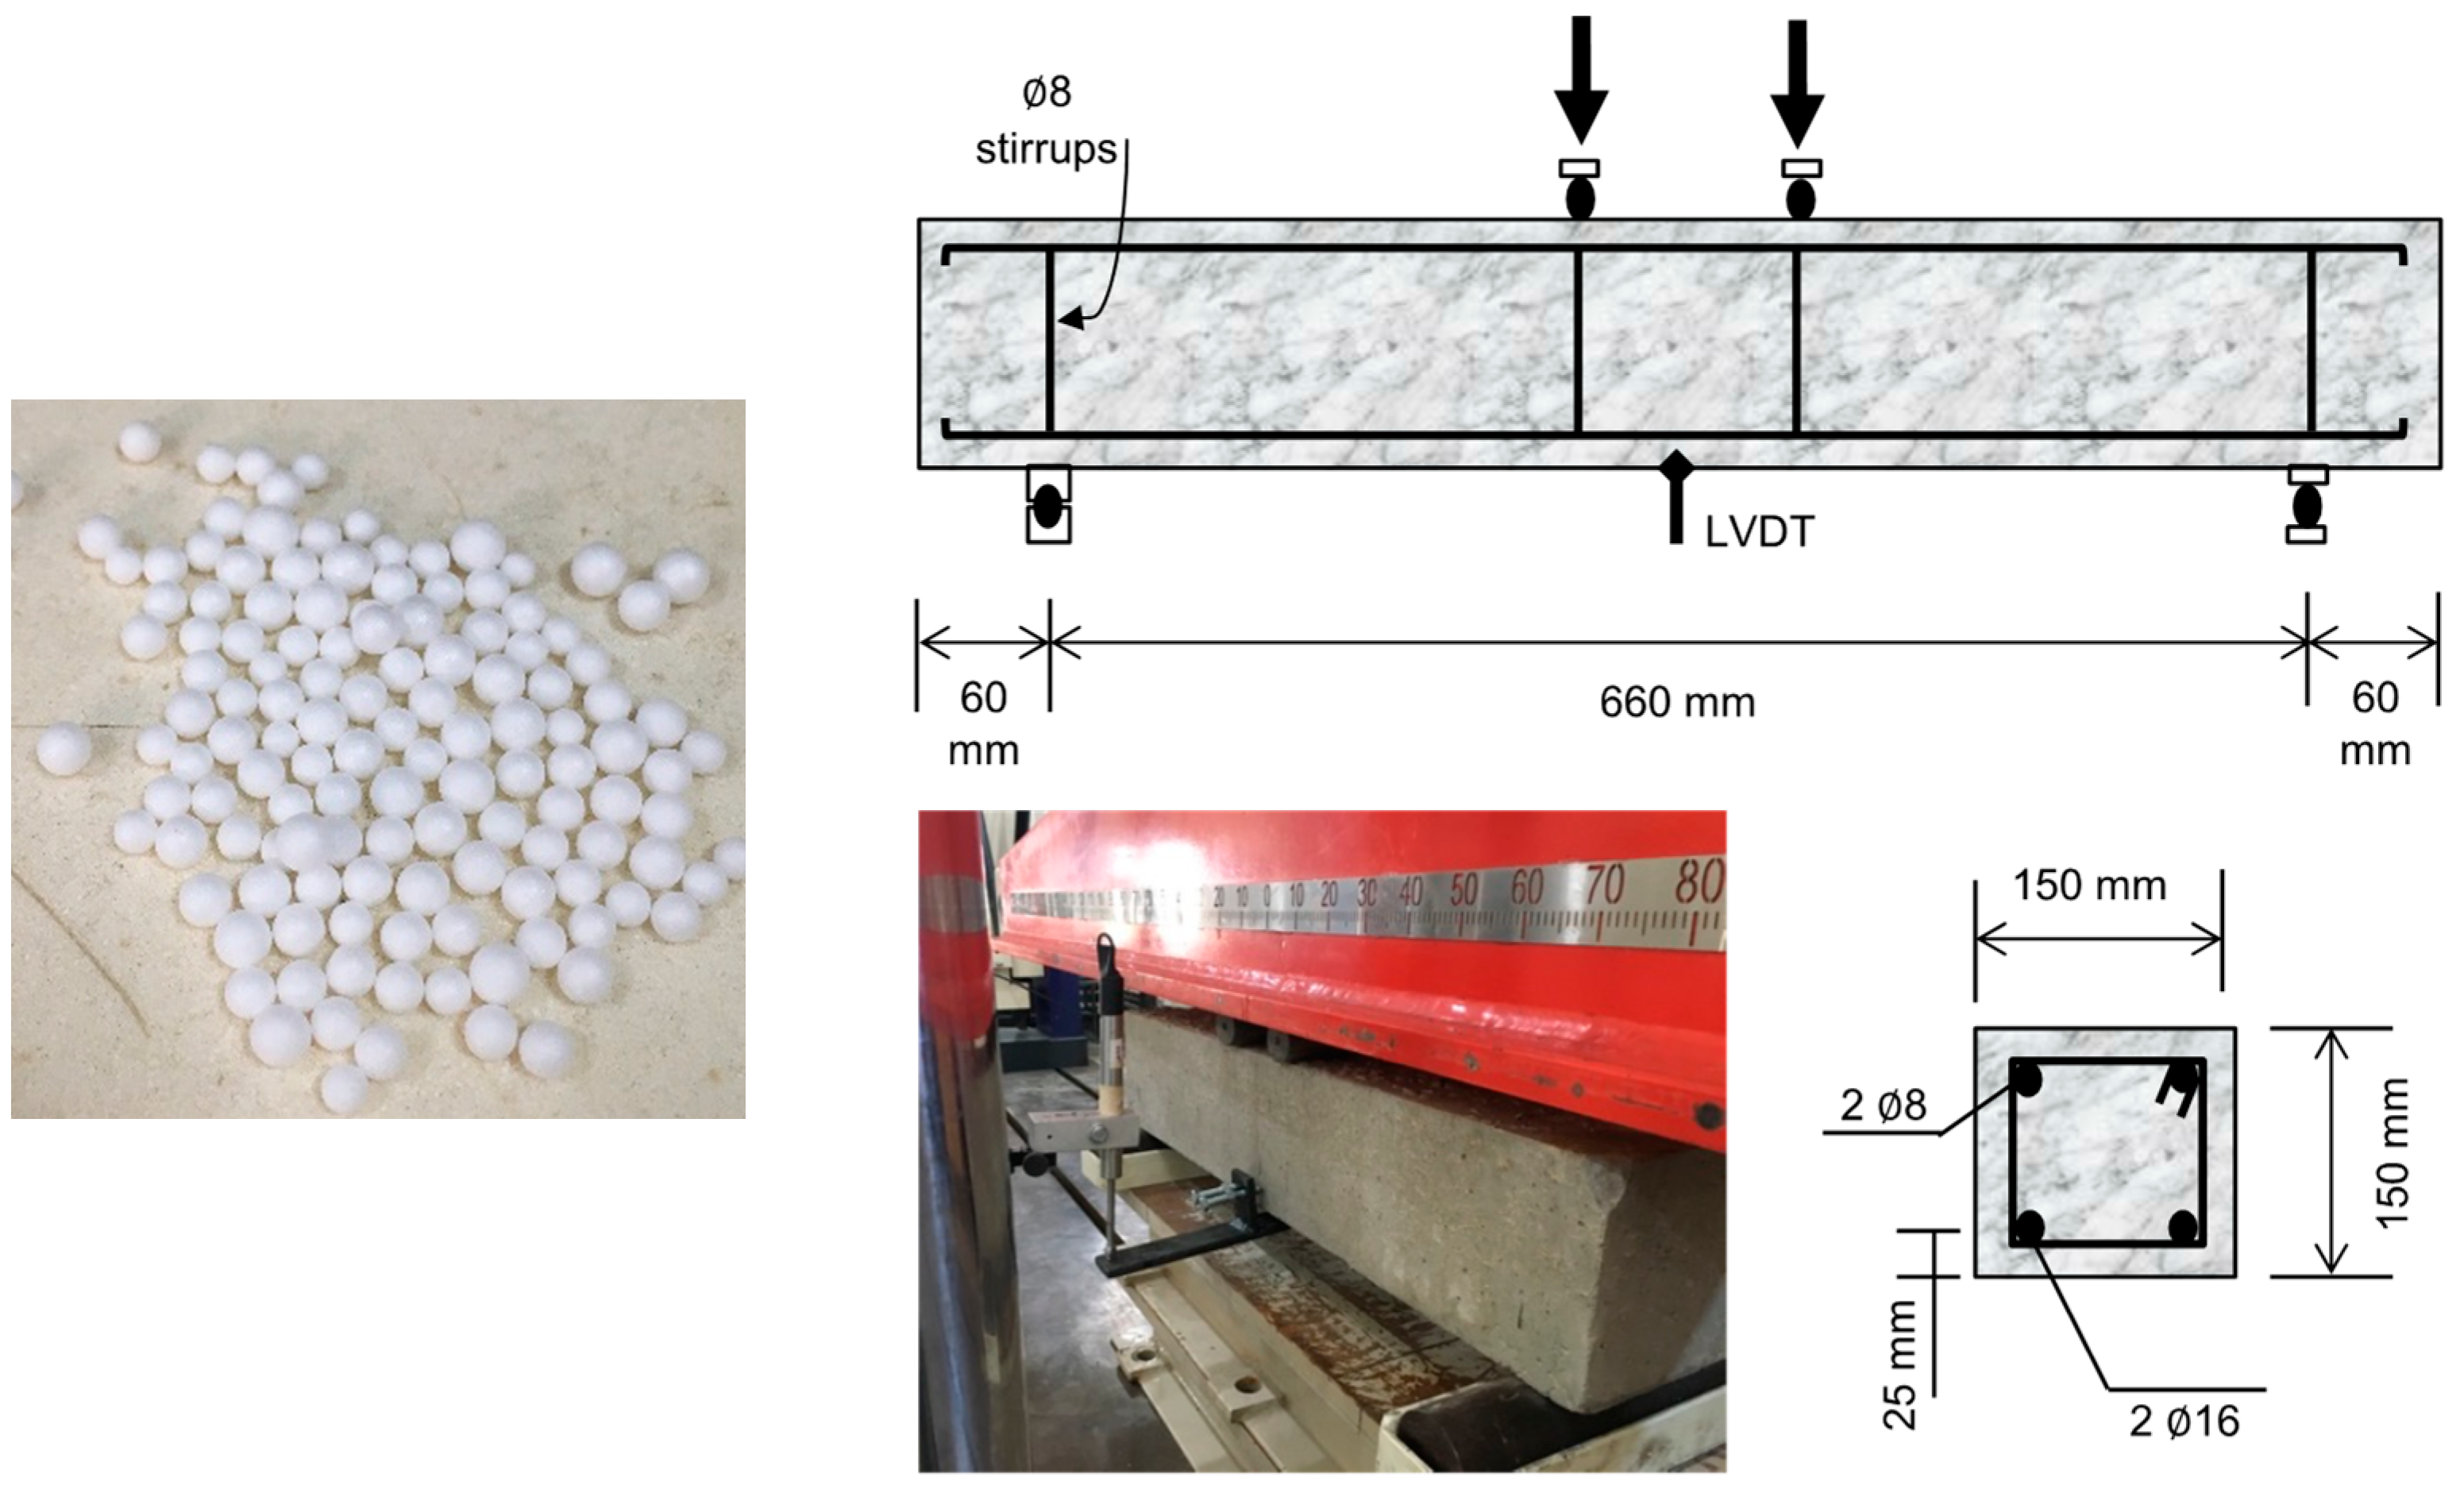
2. Summary of Experimental Program Executed for Shear Strength Testing of RC Beams Containing EPS Additions
- , MPa = 0.134 (, MPa) − 1.87 R2 = 0.95
- E, GPa = 0.836 (, MPa) − 1.65 R2 = 0.98
- , kg/m3 = 17.95 (, MPa) + 1527.1 R2 = 0.45

| Concrete Mechanical Properties | RC Beam Properties | |||||||
|---|---|---|---|---|---|---|---|---|
| , kg/m3 | , MPa | , MPa | , GPa | Load When First Crack Appeared, kN | Max. Crack Opening, mm | Pmax, kN | Deflection (δmax) at Pmax, mm | |
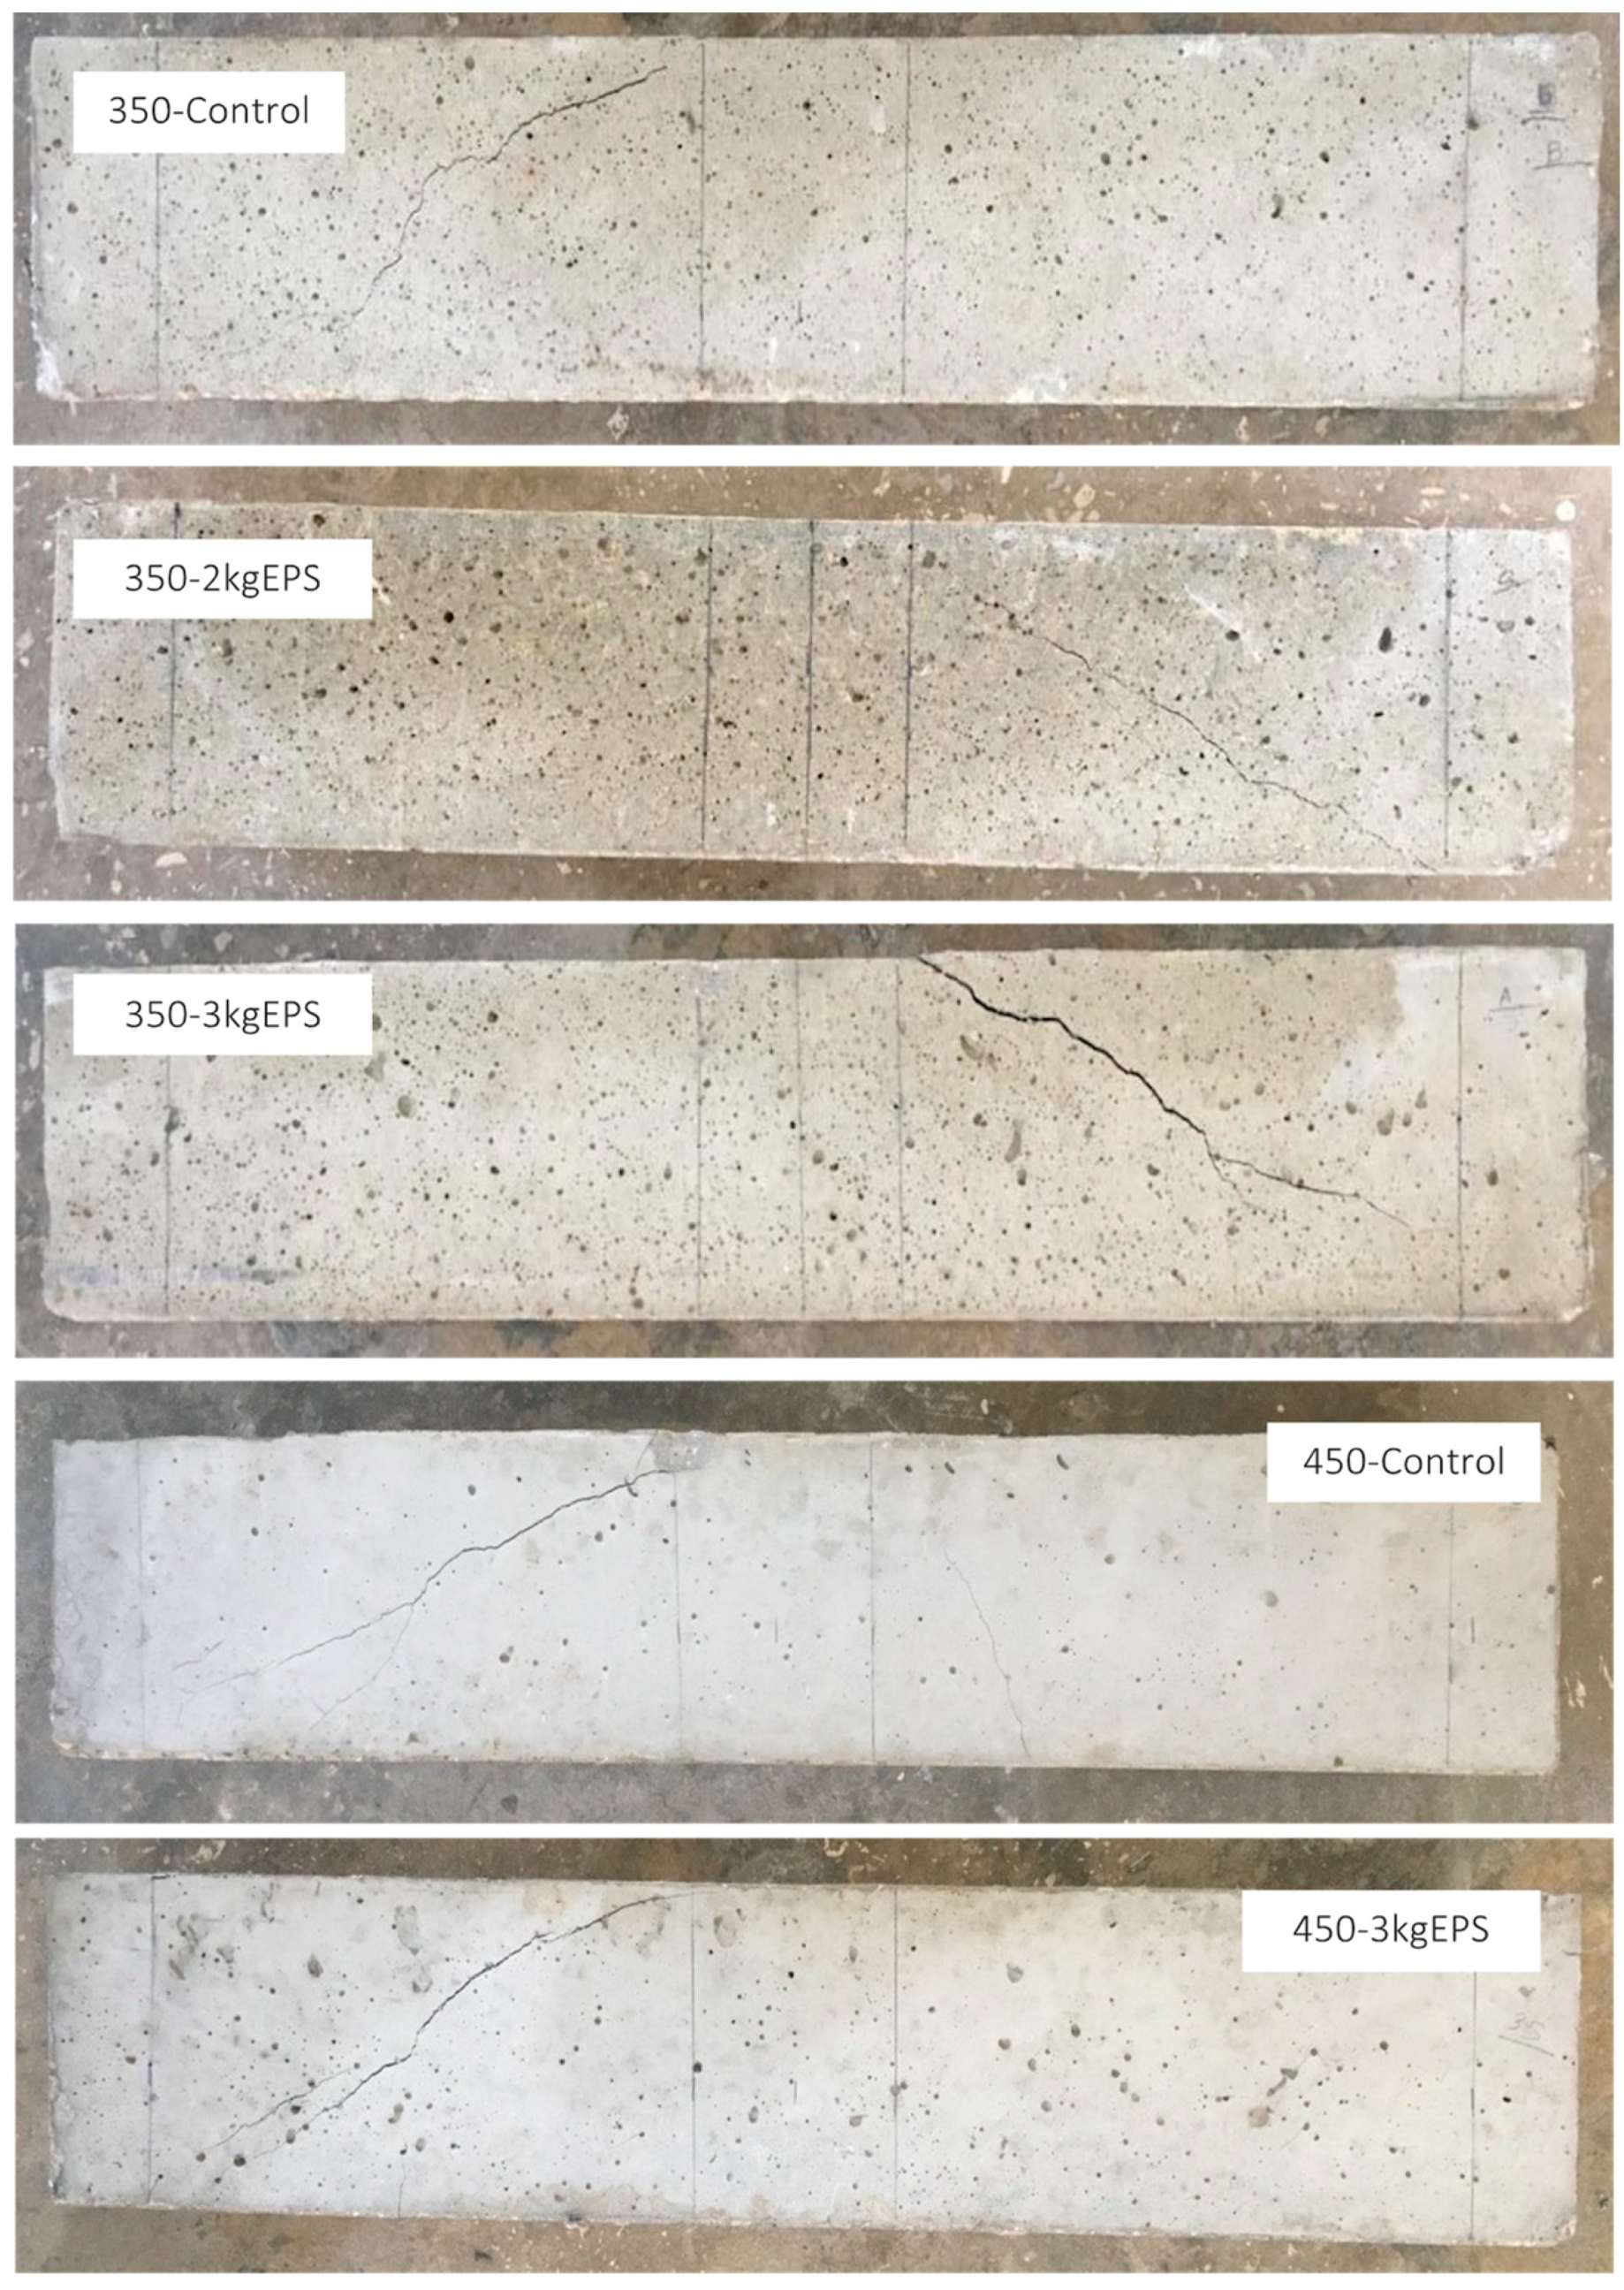
| 350-Control | 2375 (1.9%) | 36.64 (5.1%) | 2.9 (6.8%) | 29.8 (7.7%) | 60.5 (11.4%) | 0.7 (9.2%) | 82.88 (8.8%) | 3.9 (11.2%) |
| 350-2 kg EPS | 2205 (2.5%) | 31.85 (8%) | 2.11 (9.9%) | 24.2 (11.5%) | 51.3 (18.5%) | 1.3 (16.1%) | 58.62 (13.2%) | 2.55 (16.4%) |
| 350-3 kg EPS | 1955 (2.3%) | 25.06 (10.3%) | 1.55 (11.2%) | 19.8 (13%) | 50.4 (18%) | 1.52 (17%) | 57.98 (18.6%) | 2.37 (22.1%) |
| 450-Control | 2390 (2.7%) | 48.2 (4.9%) | 4.57 (7%) | 38.76 (7.4%) | 73.6 (9.6%) | 0.86 (8%) | 95.03 (9.6%) | 3.57 (13%) |
| 450-3 kg EPS | 1895 (2.5%) | 35.6 (10.6%) | 3.3 (11%) | 27.4 (13.2%) | 44 (20.1%) | 1.12 (12.3%) | 50.52 (19.2%) | 1.84 (22%) |
3. Phase 1-Deterministic Finite Element (FE) Modeling
3.1. Description of the Model
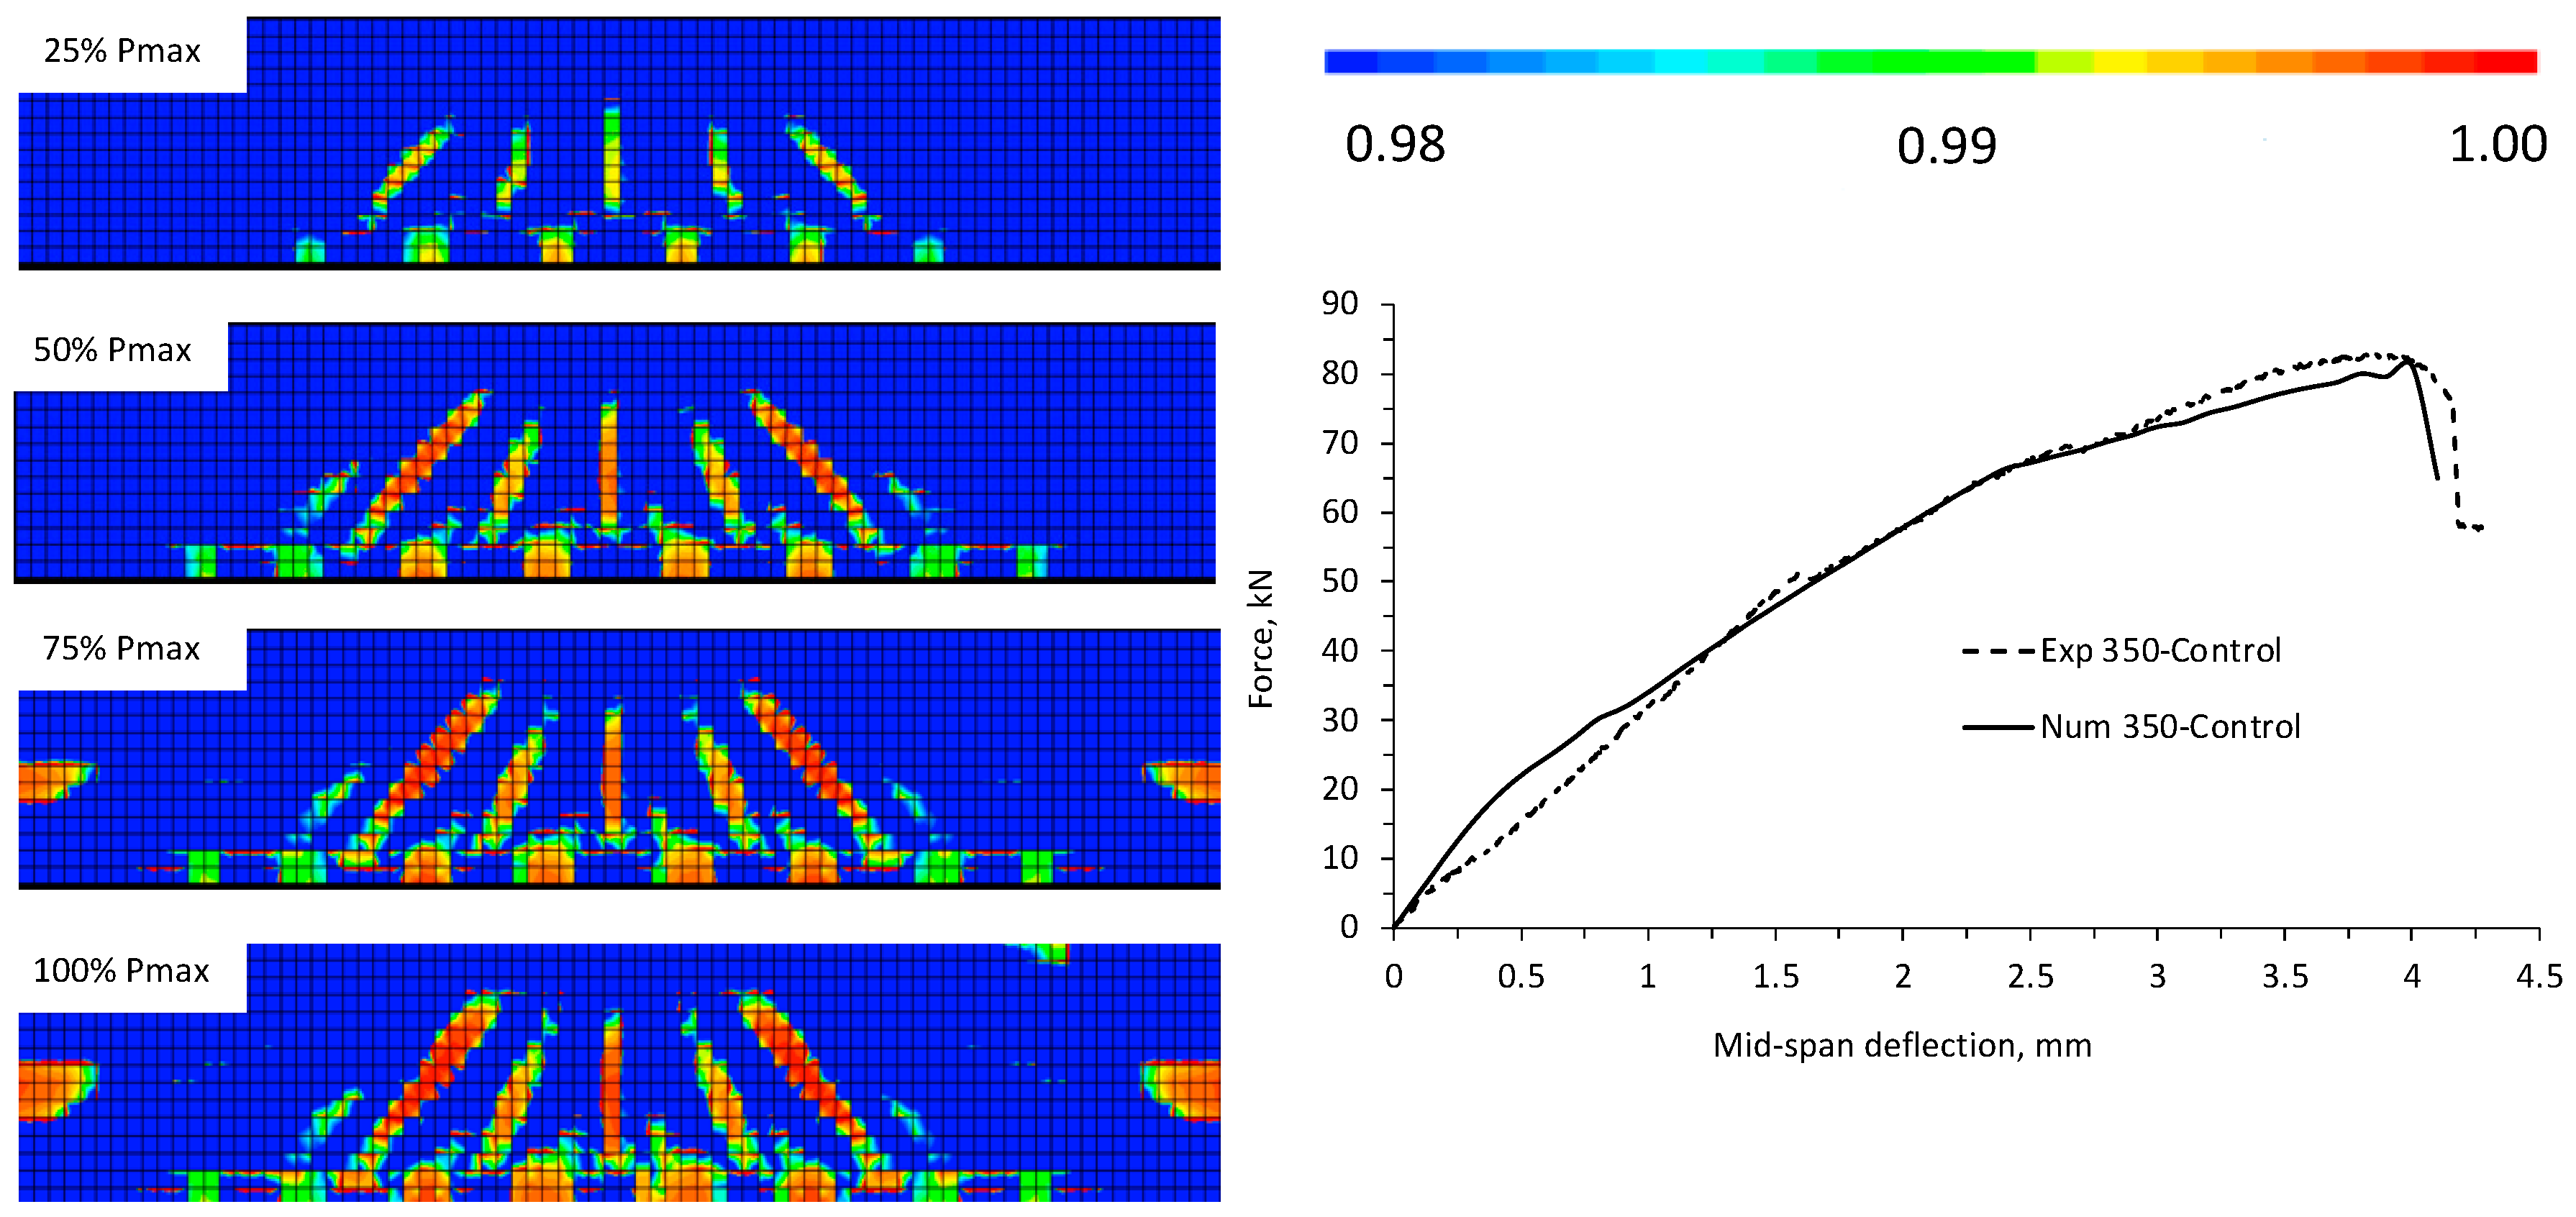
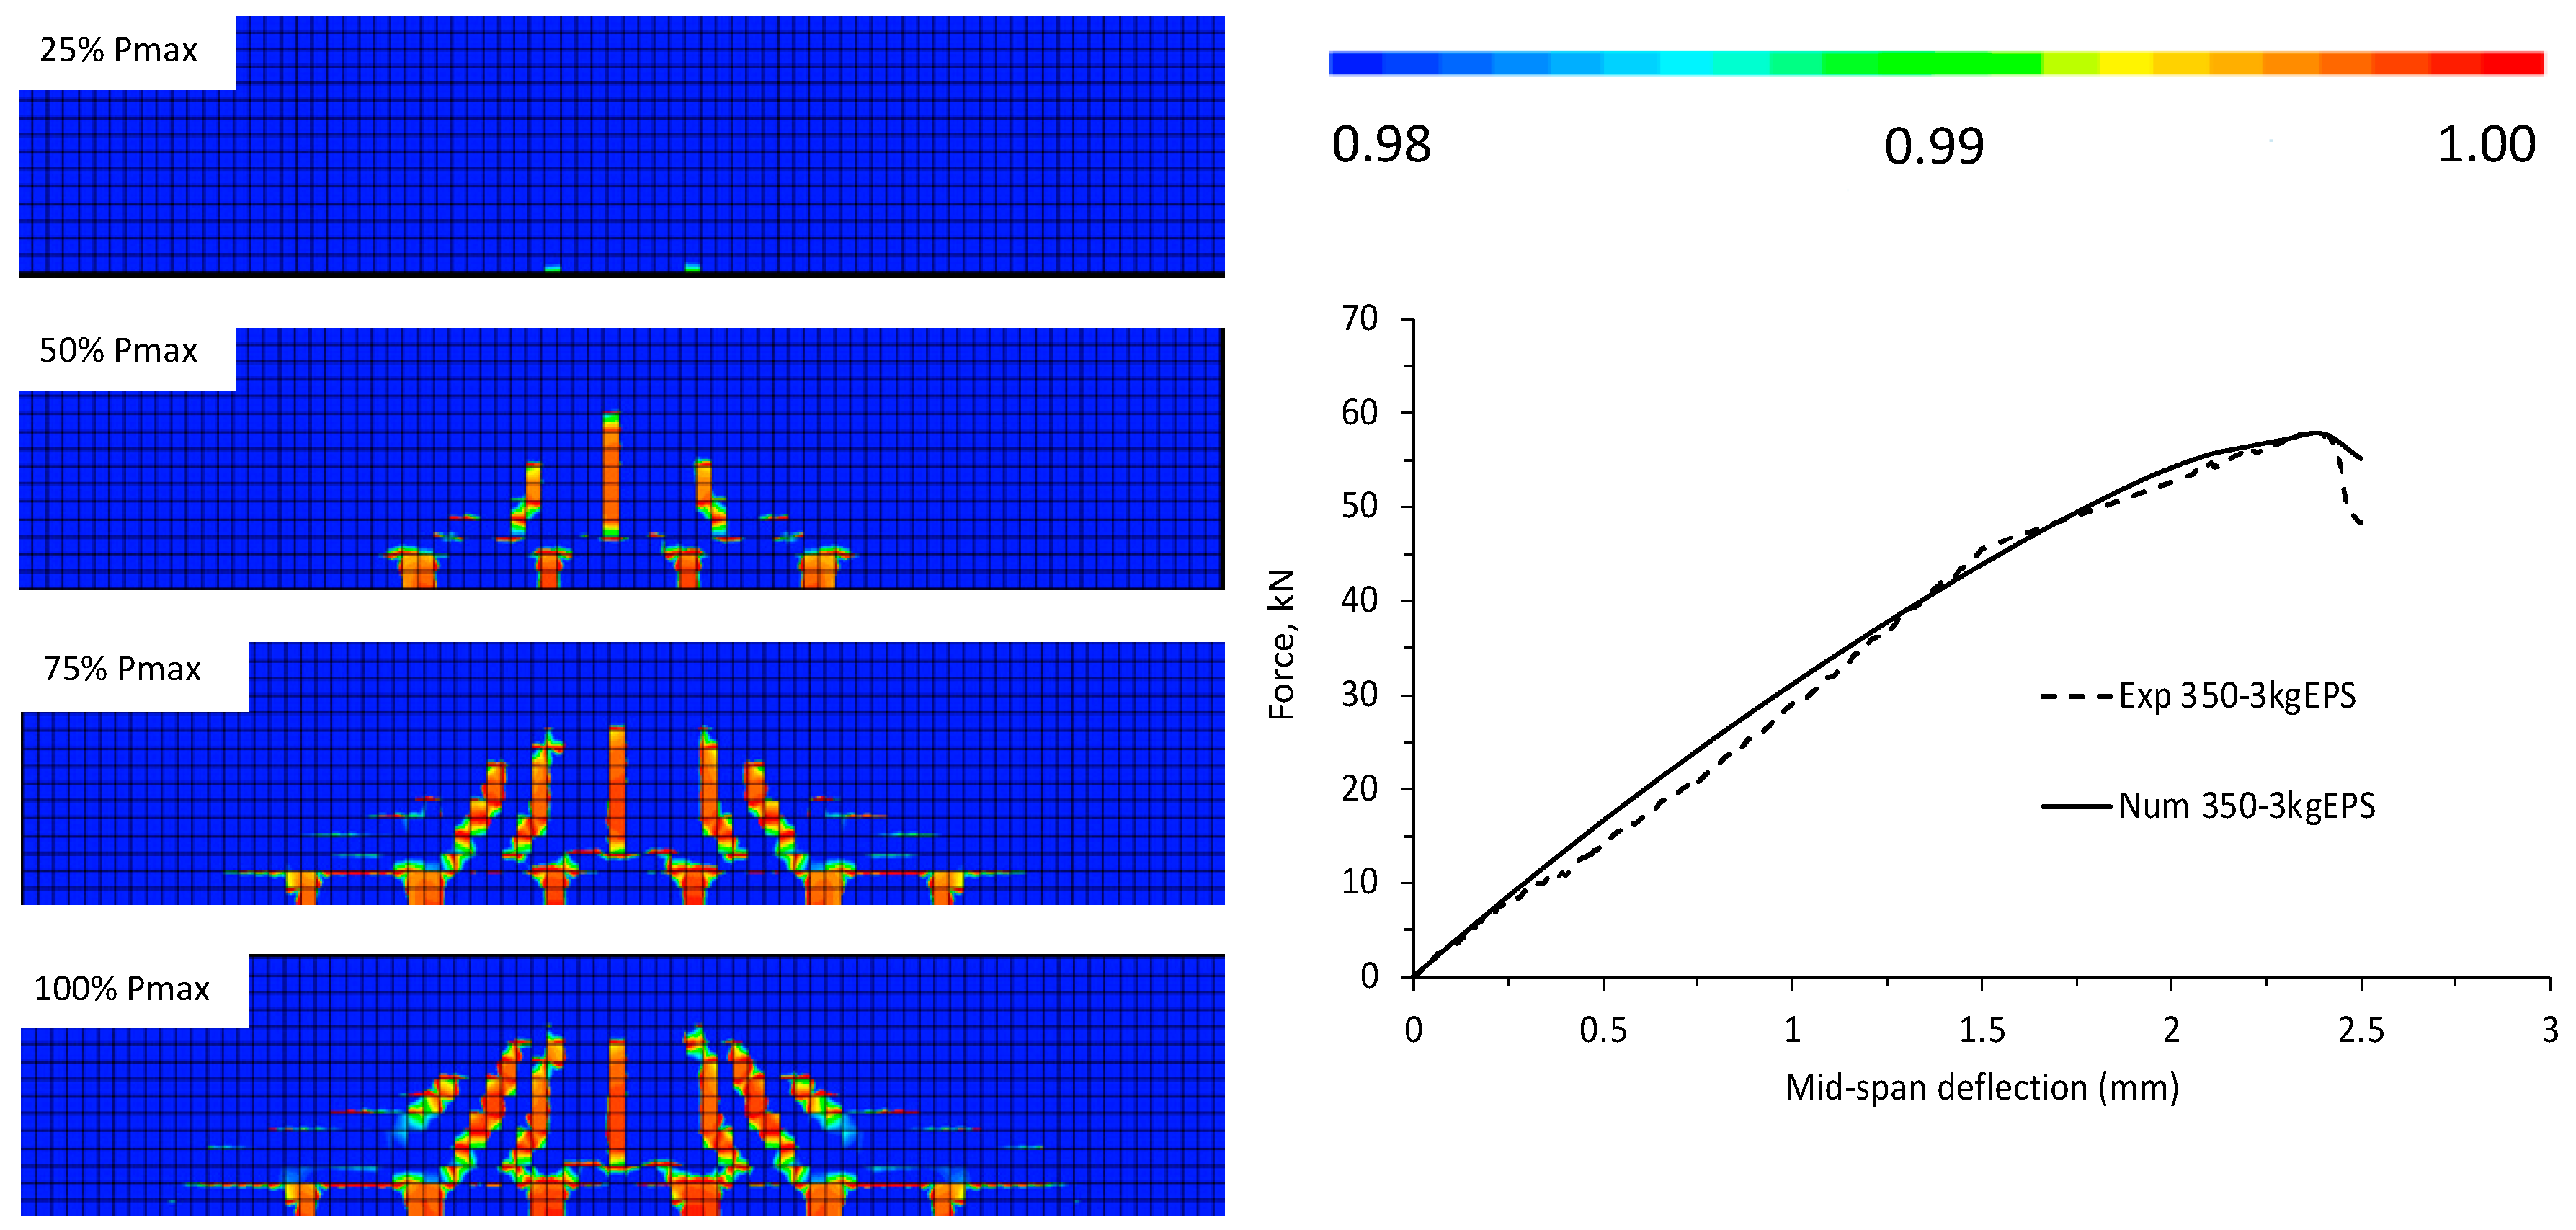
3.2. Damage Field Distribution
3.3. Equivalent Strain εeq Distribution
3.4. Maximum Load and Deflection at Failure
4. Phase 2-Stochastic FE Modeling for RC Beams
4.1. Methodology
4.2. Application of Stochastic FE Method to RC Beams
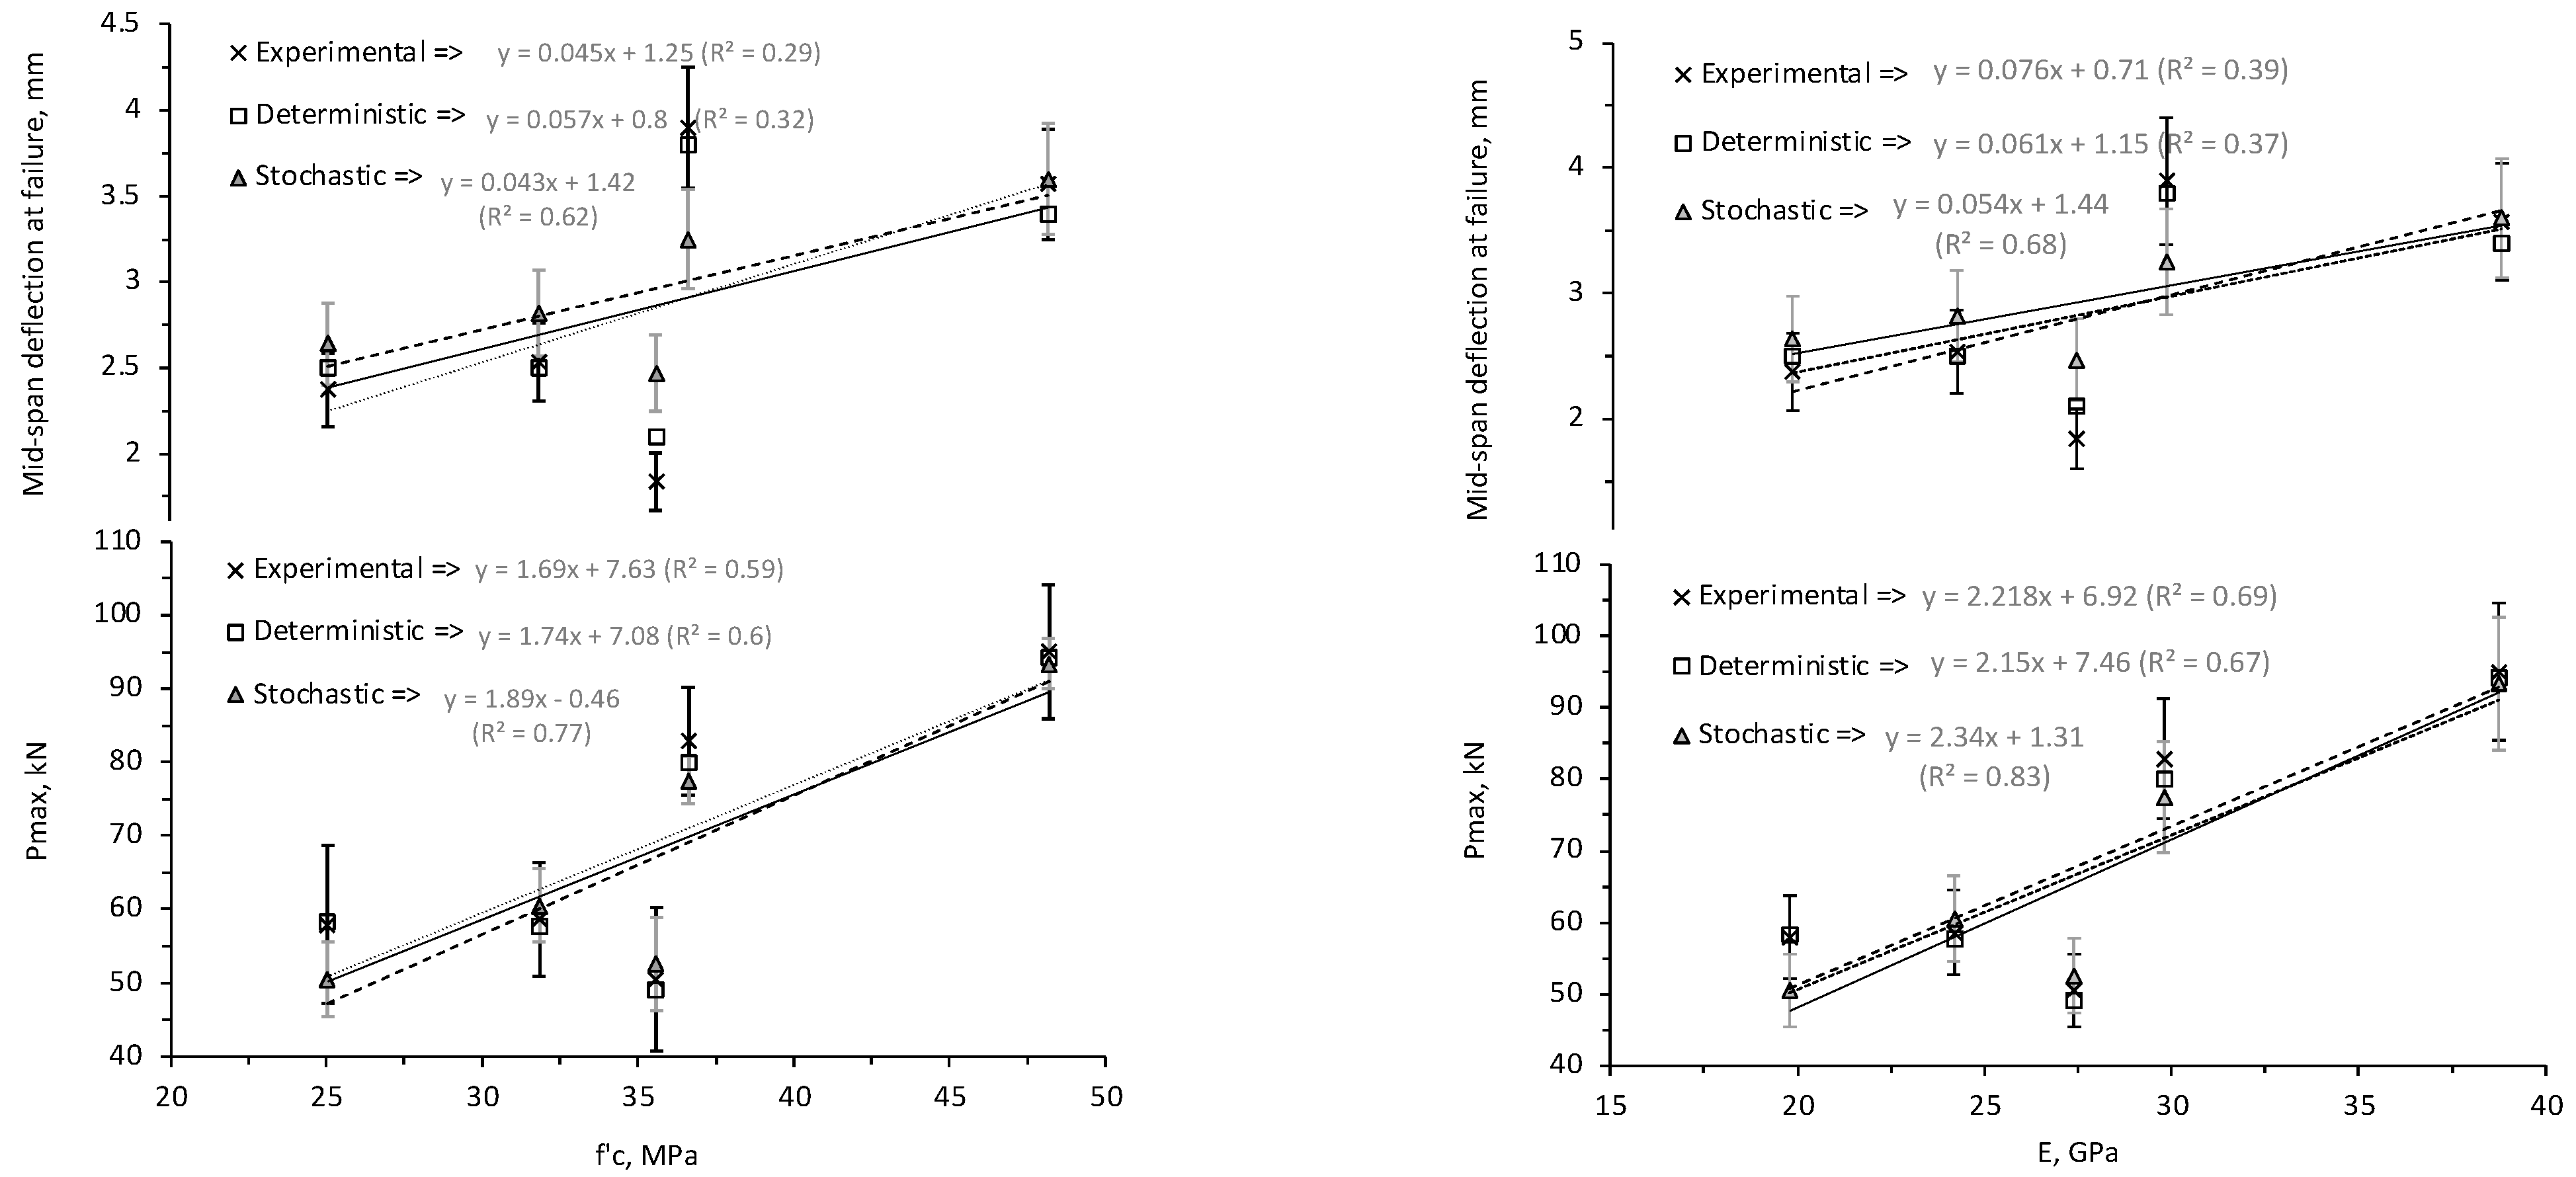
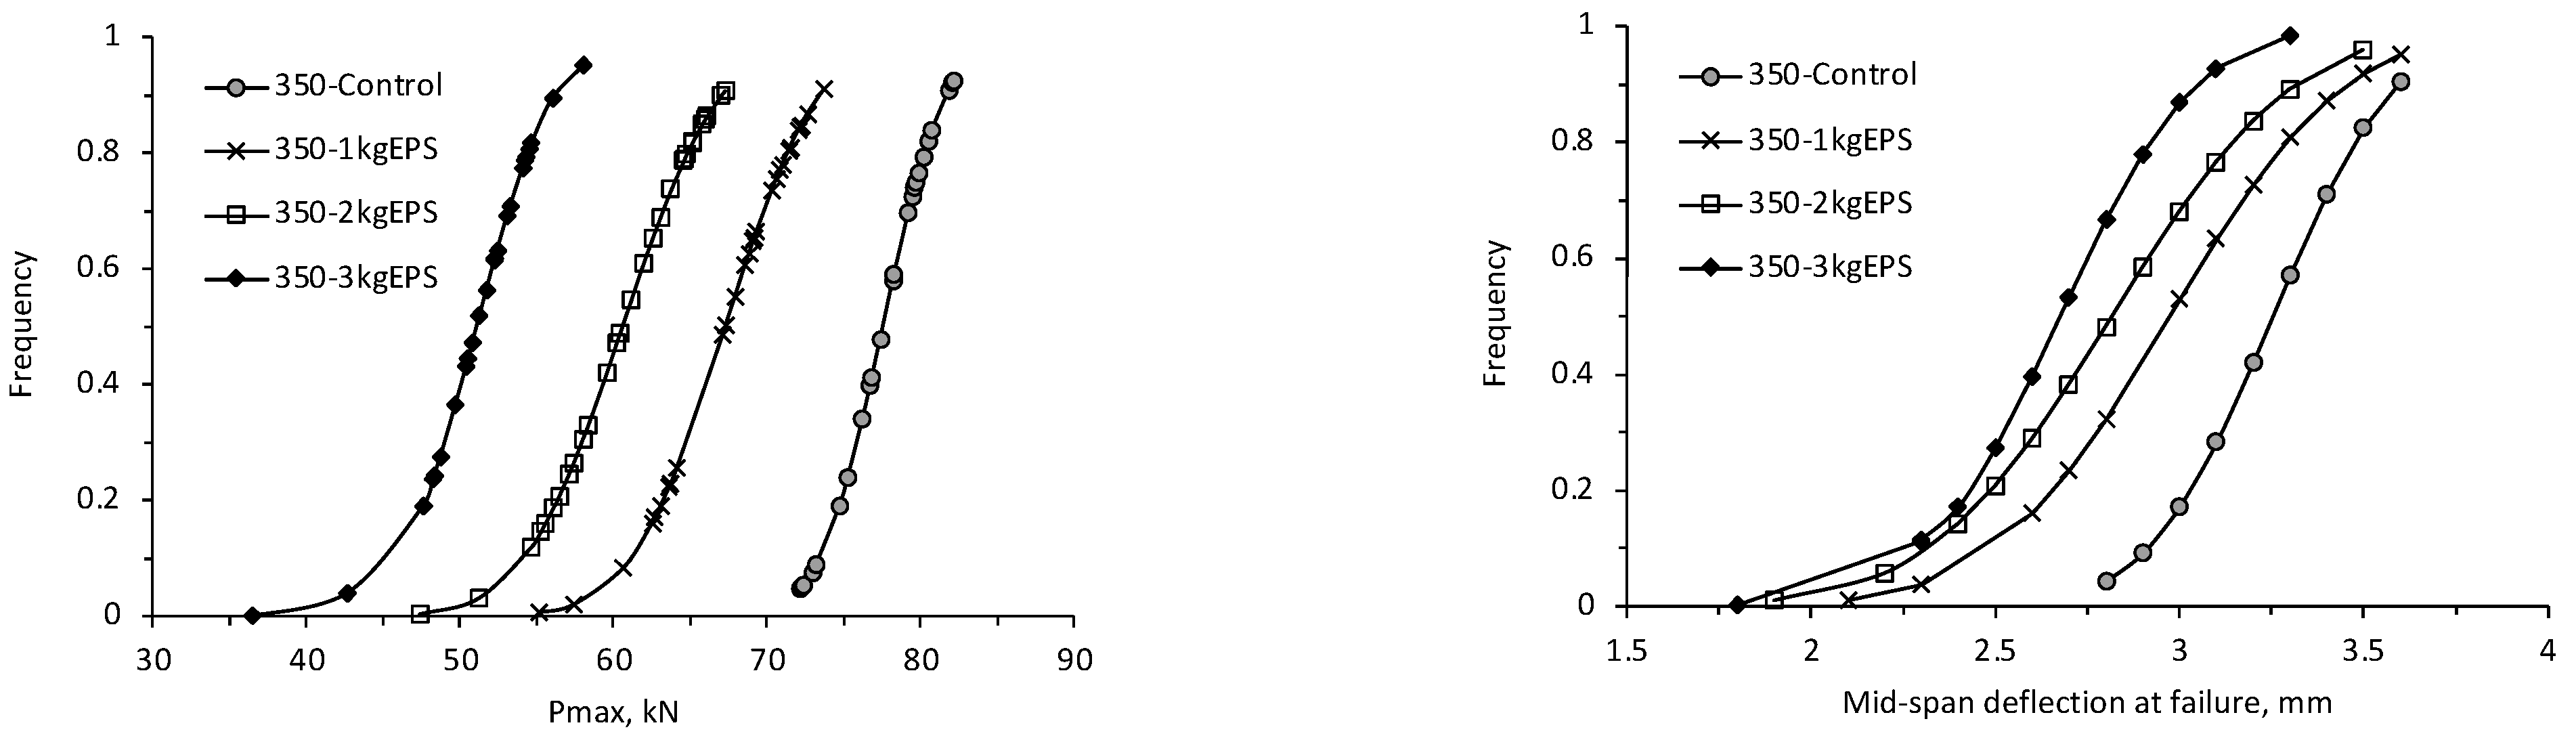
4.3. Comparison between Experimental vs. FE Modeling
5. Summary and Conclusions
Author Contributions
Funding
Data Availability Statement
Conflicts of Interest
References
- Adeala, A.J.; Soyemi, O.B. Structural use of expanded polystyrene concrete. Int. J. Innov. Sci. Res. Technol. 2020, 5, 1131–1138. [Google Scholar] [CrossRef]
- Assaad, J.; Chakar, E.; Zéhil, G.P. Testing and modeling the behavior of sandwich lightweight panels against wind and seismic loads. Eng. Struct. 2018, 175, 457–466. [Google Scholar] [CrossRef]
- Assaad, J.J.; Mikhael, C.; Hanna, R. Recycling of waste expanded polystyrene concrete in lightweight sandwich panels and structural applications. Clean. Mater. 2022, 4, 100095. [Google Scholar] [CrossRef]
- Mousavi, S.A.; Zahrai, S.M.; Bahrami-Rad, A. Quasi-static cyclic tests on super-lightweight EPS concrete shear walls. Eng. Struct. 2014, 65, 62–75. [Google Scholar] [CrossRef]
- Lakshmikandhan, K.N.; Harshavardhan, B.S.; Prabakar, J.; Saibabu, S. Investigation on wall panel sandwiched with lightweight concrete. In IOP Conference Series: Materials Science and Engineering; IOP Publishing: Bristol, UK, 2017; Volume 225, p. 012275. [Google Scholar]
- Tomlinson, D.; Fam, A. Analytical approach to flexural response of partially composite insulated concrete sandwich walls used for cladding. Eng. Struct. 2016, 122, 251–266. [Google Scholar] [CrossRef]
- Alshihri, M.M.; Azmy, A.M.; El-Bisy, M.S. Neural networks for predicting compressive strength of structural light weight concrete. Constr. Build. Mater. 2009, 23, 2214–2219. [Google Scholar] [CrossRef]
- Al-Khaiat, H.; Haque, M.N. Effect of initial curing on early strength and physical properties of a lightweight concrete. Cem. Concr. Res. 1998, 28, 859–866. [Google Scholar] [CrossRef]
- Fathi, M.; Yousefipour, A.; Farokhy, E.H. Mechanical and physical properties of expanded polystyrene structural concretes containing Micro-silica and Nano-silica. Constr. Build. Mater. 2017, 136, 590–597. [Google Scholar] [CrossRef]
- Li, C.; Miao, L.; You, Q.; Hu, S.; Fang, H. Effects of viscosity modifying admixture (VMA) on workability and compressive strength of structural EPS concrete. Constr. Build. Mater. 2018, 175, 342–350. [Google Scholar] [CrossRef]
- Akers, D.J.; Gruber, R.D.; Ramme, B.W.; Boyle, M.J.; Grygar, J.G.; Rowe, S.K.; Bremner, T.W.; Kluckowski, E.S.; Sheetz, S.R.; Burg, R.G.; et al. ACI 213R-03, Guide for Structural Lightweight-Aggregate Concrete (Superseded); American Concrete Institute: Farmington Hills, MI, USA, 2003. [Google Scholar]
- Chen, B.; Liu, J. Properties of lightweight expanded polystyrene concrete reinforced with steel fiber. Cem. Concr. Res. 2004, 34, 1259–1263. [Google Scholar] [CrossRef]
- Al Arab, A.; Hamad, B.; Chehab, G.; Assaad, J.J. Use of ceramic-waste powder as value-added pozzolanic material with improved thermal properties. J. Mater. CivilEng. 2020, 32, 04020243. [Google Scholar] [CrossRef]
- Assaad, J.J.; Daou, A.; Daou, Y. Bond properties of polymer-modified lightweight self-consolidating concrete containing expanded polystyrene. Adv. Civ. Eng. Mater. 2019, 8, 558–572. [Google Scholar] [CrossRef]
- Assaad, J.J.; Issa, C.A. Effect of recycled acrylic-based polymers on bond stress-slip behavior in reinforced concrete structures. J. Mater. Civ. Eng. 2017, 29, 04016173. [Google Scholar] [CrossRef]
- Assaad, J.J.; El Mir, A. Durability of polymer-modified lightweight flowable concrete made using expanded polystyrene. Constr. Build. Mater. 2020, 249, 118764. [Google Scholar] [CrossRef]
- Nguyen, D.H.; Han, N.D.; Vu, A.T.; Nguyen, T.K.; Hoang, T.N. Experimental Investigation on Flexural Behavior of Reinforced Lightweight Concrete Slabs Using Recycled Expanded Polystyrene. In Structural Health Monitoring and Engineering Structures: Select Proceedings of SHM&ES; Springer: Singapore, 2020; pp. 241–250. [Google Scholar]
- Mohammed, H.J.; Aayeel, O.K. Flexural behavior of reinforced concrete beams containing recycled expandable polystyrene particles. J. Build. Eng. 2020, 32, 101805. [Google Scholar] [CrossRef]
- El-Khatib, A.; Assaad, J.J. Flexural and Shear Strengths of Structural Concrete Containing Plastic Wastes and Styrene–Butadiene Rubber Latex. Int. J. Civ. Eng. 2022, 20, 967–979. [Google Scholar] [CrossRef]
- Agbor, R.; Mama, B.; Okafor, F.; Ubi, S. Prediction of flexural strength of expanded polystyrene lightweight concrete using Scheffe’s Model. Int. J. Adv. Res. Eng. Technol. 2020, 11, 492–503. [Google Scholar]
- Sadrmomtazi, A.; Sobhani, J.; Mirgozar, M.A. Modeling compressive strength of EPS lightweight concrete using regression 2013, neural network and ANFIS. Constr. Build. Mater. 2013, 42, 205–216. [Google Scholar] [CrossRef]
- Sobhani, J.; Ejtemaei, M.; Sadrmomtazi, A.; Mirgozar, M.A. Modeling flexural strength of EPS lightweight concrete using regression 2019, neural network and ANFIS. Int. J. Optim. Civ. Eng. 2019, 9, 313–329. [Google Scholar]
- Mama, B.; Okafor, F.; Ubi, S. Optimizing the flexural and split tensile strength properties of polystyrene concrete using the Osadebe’s Model: A mathematical approach to sustainable environmental and housing development. World Wide J. Multidiscip. Res. Dev. 2021, 7, 36–72. [Google Scholar]
- Rossi, P.; Ulm, F.-J.; Hachi, F. Compressive behavior of concrete: Physical mechanisms and modeling. J. Eng. Mech. 1996, 122, 1038–1043. [Google Scholar] [CrossRef]
- Tang, X.; Zhou, Y.; Zhang, C.; Shi, J. Study on the heterogeneity of concrete and its failure behavior using the equivalent probabilistic model. J. Mater. Civ. Eng. 2010, 23, 402–413. [Google Scholar] [CrossRef]
- Breysse, D. Numerical study of the effect of inhomogeneities and boundary conditions on the tensile strength of concrete. Mater. J. 1991, 88, 489–498. [Google Scholar]
- Carmeliet, J.; de Borst, R. Stochastic approaches for damage evolution in standard and non-standard continua. Int. J. Solids Struct. 1995, 32, 1149–1160. [Google Scholar] [CrossRef]
- Colliat, J.-B.; Hautefeuille, M.; Ibrahimbegovic, A.; Matthies, H.G. Stochastic approach to size effect in quasi-brittle materials. Comptes Rendus Mec. 2007, 335, 430–435. [Google Scholar] [CrossRef]
- Vorechovsky, M. Interplay of size effects in concrete specimens under tension studied via computational stochastic fracture mechanics. Int. J. Solids Struct. 2007, 44, 2715–2731. [Google Scholar] [CrossRef]
- Malecki, T.; Marzec, I.; Bobinski, J.; Tejchman, J. Effect of a characteristic length on crack spacing in a reinforced concrete bar under tension. Mech. Res. Commun. 2007, 34, 460–465. [Google Scholar] [CrossRef]
- De Larrard, T.; Colliat, J.; Benboudjema, F.; Torrenti, J.; Nahas, G. Effect of the Young modulus variability on the mechanical behaviour of a nuclear containment vessel. Nucl. Eng. Des. 2010, 240, 4051–4060. [Google Scholar] [CrossRef]
- Syroka-Korol, E.; Tejchman, J.; Mroz, Z. FE calculations of a deterministic and statistical size effect in concrete under bending within stochastic elasto-plasticity and non-local softening. Eng. Struct. 2013, 48, 205–219. [Google Scholar] [CrossRef]
- Bouhjiti, D.; Baroth, J.; Briffaut, M.; Dufour, F.; Masson, B. Statistical modeling of cracking in large concrete structures under thermo-hydro-mechanical loads: Application to nuclear containment buildings. Part 1: Random field effects (reference analysis). Nucl. Eng. Des. 2018, 333, 196–223. [Google Scholar] [CrossRef]
- Cast3M-CEA. Commissariat A L’Energie Atomique Et Aux Energies Alternatives. Description of the Finite Element Code and Software. 2020. Available online: www-cast3m.cea.fr (accessed on 10 August 2023).
- Ghannoum, M. Effects of Heterogeneity of Concrete on the Mechanical Behavior of Structures at Different Scales. Ph.D. Thesis, Université Grenoble Alpes, Saint-Martin-d’Hères, France, 2017. [Google Scholar]
- Llau, A.; Jason, L.; Dufour, F.; Baroth, J. Finite element modelling of 1D steel components in reinforced and prestressed concrete structures. Eng. Struct. 2016, 127, 769–783. [Google Scholar] [CrossRef]
- Jason, L.; Ghavamian, S.; Courtois, A. Truss vs solid modeling of tendons in prestressed concrete structures: Consequences on mechanical capacity of a Representative Structural Volume. Eng. Struct. 2010, 32, 1779–1790. [Google Scholar] [CrossRef]
- Mazars, J. A description of micro-and macroscale damage of concrete structures. Eng. Fract. Mech. 1986, 25, 729–737. [Google Scholar] [CrossRef]
- Giry, C.; Dufour, F.; Mazars, J. Modified nonlocal damage model based on stress state influence. IJSS 2011, 48, 3431–3443. [Google Scholar]
- Mazars, J.; Hamon, F.; Grange, S. A new 3D damage model for concrete under monotonic 2015, cyclic and dynamic loadings. Mater. Struct. 2015, 48, 3779–3793. [Google Scholar] [CrossRef]
- Baroth, J.; Dufour, F.; Jason, L.; Llau, A. Condensed SFEs for nonlinear mechanical problems. Comput. Methods Appl. Mech. Eng. 2016, 309, 434–452. [Google Scholar]
- Giry, C.; Oliver-Leblond, C.; Dufour, F.; Ragueneau, F. Cracking analysis of reinforced concrete structures. Eur. J. Environ. Civ. Eng. 2014, 18, 724–737. [Google Scholar] [CrossRef]
- Khalil, N.; Assaad, J.J. Bond properties between smooth carbon fibre-reinforced polymer bars and ultra-high performance concrete modified with polymeric latexes and fibres. Eur. J. Environ. Civ. Eng. 2022, 26, 6211–6228. [Google Scholar] [CrossRef]


| Experimental Test | Deterministic FE | Stochastic FE | ||||
|---|---|---|---|---|---|---|
| Pmax, kN | δmax, mm | Pmax, kN | δmax, mm | Pmax, kN | δmax, mm | |
| 350-Control | 82.88 Std = 7.3 COV = 8.8% | 3.9 Std = 0.44 COV = 11.2% | 80.04 | 3.78 | 77.53 Std = 3.21 COV = 4% | 3.25 Std = 0.26 COV = 8.1% |
| 350-2 kg EPS | 58.62 Std = 7.73 COV = 13.2% | 2.55 Std = 0.41 COV = 16.4% | 57.8 | 2.45 | 60.54 Std = 5.03 COV = 8.3% | 2.82 Std = 0.39 COV = 13.8% |
| 350-3 kg EPS | 57.98 Std = 10.78 COV = 18.6% | 2.37 Std = 0.52 COV = 22.1% | 58.25 | 2.53 | 50.5 Std = 5.1 COV = 10% | 2.64 Std = 0.38 COV = 14.4% |
| 450-Control | 95.03 Std = 9.12 COV = 9.6% | 3.57 Std = 0.46 COV = 13% | 94.23 | 3.42 | 93.36 Std = 3.43 COV = 3.67% | 3.6 Std = 0.14 COV = 3.9% |
| 450-3 kg EPS | 50.52 Std = 9.7 COV = 19.2% | 1.84 Std = 0.4 COV = 22% | 49.1 | 2.14 | 52.58 Std = 6.31 COV = 12% | 2.47 Std = 0.404 COV = 16.3% |
Disclaimer/Publisher’s Note: The statements, opinions and data contained in all publications are solely those of the individual author(s) and contributor(s) and not of MDPI and/or the editor(s). MDPI and/or the editor(s) disclaim responsibility for any injury to people or property resulting from any ideas, methods, instructions or products referred to in the content. |
© 2023 by the authors. Licensee MDPI, Basel, Switzerland. This article is an open access article distributed under the terms and conditions of the Creative Commons Attribution (CC BY) license (https://creativecommons.org/licenses/by/4.0/).
Share and Cite
Ghannoum, M.; Abdelkhalek, L.; Assaad, J.J. Application of Stochastic Finite Element Modeling to Reinforced Lightweight Concrete Beams Containing Expanded Polystyrene Beads. Buildings 2023, 13, 2294. https://doi.org/10.3390/buildings13092294
Ghannoum M, Abdelkhalek L, Assaad JJ. Application of Stochastic Finite Element Modeling to Reinforced Lightweight Concrete Beams Containing Expanded Polystyrene Beads. Buildings. 2023; 13(9):2294. https://doi.org/10.3390/buildings13092294
Chicago/Turabian StyleGhannoum, Maria, Lara Abdelkhalek, and Joseph J. Assaad. 2023. "Application of Stochastic Finite Element Modeling to Reinforced Lightweight Concrete Beams Containing Expanded Polystyrene Beads" Buildings 13, no. 9: 2294. https://doi.org/10.3390/buildings13092294
APA StyleGhannoum, M., Abdelkhalek, L., & Assaad, J. J. (2023). Application of Stochastic Finite Element Modeling to Reinforced Lightweight Concrete Beams Containing Expanded Polystyrene Beads. Buildings, 13(9), 2294. https://doi.org/10.3390/buildings13092294