Abstract
In order to study the influence of tunnel volume loss on adjacent framed buildings with different shallow foundations, this paper carried out physical model experiments with two common types of footings (isolated and strip footings) under different working conditions based on the digital image correlation (DIC) technique. The main finding of the present paper is that the increase in formation loss rate will aggravate the deformation and damage of the structure, and the strip foundation shows stronger integrity and stability compared with the isolated foundation in this process. With the increase in the eccentricity of the frames with respect to the tunnel, the overall tilt and damage degree of structural elements increases first and then decreases for both foundations, reaching the maximum value with the eccentric distance of one multiple of the tunnel diameter. Interestingly, when the isolated footings are located directly above the tunnel, the damage in the inner panels is the most severe and gradually decreases with eccentricity, changing from a sagging mode to a hogging mode for the frame form. While the strip footings always maintain slight hogging, and the trend of the damage degree of panels is similar to that of elements, with the eccentric distance reaching two times the tunnel diameter, the strip foundation structure tends to be stable, while the isolated one still needs attention for its potential possibility of damage in panels. The research results have reference value for the impact assessment of adjacent shallow-foundation framed buildings in subway tunnel construction.
1. Introduction
The construction of underground tunnelling inevitably changes the in situ stress fields, causing soil volume loss, thus having different adverse effects on the adjacent buildings with various foundations [1]. It is necessary to study the deformation characteristics of structures and strata as well as soil–structure interactions minimize the potential risk of ground movement to buildings [2,3,4].
To predict the deformation of the building, Son and Cording [5] investigated the settlement pattern of different shallow-footing buildings under tunnel excavation and found that there are great limitations in just using the ground settlement curves due to the complex interactions between substructure and soil. Moussaei et al. [6] conducted tunnel excavation simulation tests for a building model with refined characteristics and an empirical formula for the relationship between the maximum ground settlement and the relative density of soil, of which the application conditions are subject to further discussion. It can be concluded that the interaction between soil and foundation is essential for the deformation of the building. On this basis, Boldini et al. [7] used the real contact method to simulate the interaction between strip foundations and adjacent soil to explore the influence of building deformation on soil deformation, but this method was difficult to evaluate the concrete deformation and damage of structures effectively. Xu et al. [8] fabricated different structure models with raft and separate footings and discussed tunnelling-induced soil movements and deformation fields, framed building displacements, and structure shear distortions under the influence of foundation configuration. In addition, it is found that the building characteristics also play an important role in determining the building deformation, like the building position, the building length, and the area of facade openings, etc. [9,10]. For now, the systematic study of the influence of the structure characteristics on ground displacement and structure deformation is still insufficient, and the effective evaluation of the impact of tunnel excavation on the formation and adjacent buildings is still an important challenge for the research community [11,12,13,14].
In terms of structural form, the framed structure is one of the most common building structures. Accordingly, it can be considered that isolated and strip foundations are the most common in low-height framed structure buildings. In this paper, tunnelling beneath adjacent framed buildings with isolated and strip foundations was simulated by physical model tests, and the deformation of ground and structures were monitored using a digital image correlation (DIC) technique during the experiments.
2. Physical Model Test System
2.1. Model Set Up
The self-developed laboratory model test system was used in the experiment, as shown in Figure 1. The span of the building frame is the same as the tunnel diameter. The overall frame of the model box is made of aluminium alloy, and the four walls are made of transparent tempered glass to allow for the acquisition of digital images of structure model and soil. The width of the box can be freely adjusted to satisfy the research requirements, and the internal dimensions of the model box are set to 1.5 m × 1 m × 0.3 m in this study [15].
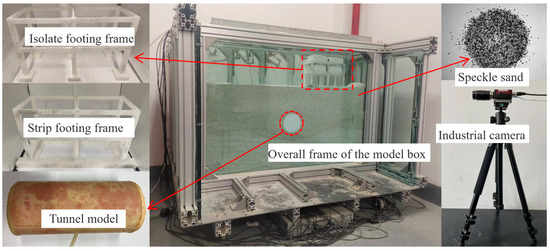
Figure 1.
Laboratory model test system.
A fine-grained dry silica sand with a relative density of 31% was used, part of which is sprayed black to make scattered formation in advance [15]. The relative density of the ground is controlled by the dropping heights, which were set at 20 cm in this test. According to previous studies, the friction between the tempered glass panel and the sand was small, which could be neglected [16]. The tunnel model is made of PVC pipe with a diameter (D) of 15 cm, corresponding to a tunnel with an internal diameter of 6 m in the actual project [14,15]. The geometric similarity ratio is 1:40, and the relative burial depth C/D (C, cover) is set to 1.5, corresponding to a shallow urban buried tunnel. Tunnel volume loss (Vl) induced during tunnelling is simulated through the liquid drainage method. The outer surface of the tunnel model is wrapped by a latex membrane, and the inner part is filled with water, and the water volume and drainage rate can be controlled by a peristaltic pump.
The structure models are made of photosensitive resin through 3D printing, of which the facade is also sprayed with speckle, as shown in Figure 2. And the physical and mechanical parameters of the material are shown in Table 1. In addition, according to Ritter et al. [10] and Xu et al. [8], it makes little difference whether the foundations are buried in soil in the model experiments; hence, the structures are placed on the ground surface similarly in this test.
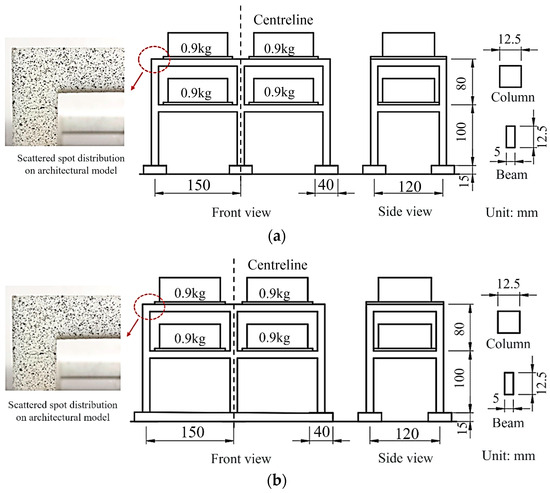
Figure 2.
Schematic diagram of building model dimensions. (a) Isolated footing frame structure model. (b) Strip footing frame structure model.

Table 1.
3D-printing material parameters.
In the monitoring process of the DIC, an industrial camera is used to take pictures continuously, and the displacement or deformation contours of the whole section can be obtained by processing the global target points in the photos at different times. DIC is an image-based non-contact measurement technique in which a series of images are compared with a reference image or each other to acquire the displacement of the target object. We can thus identify the location of a sub-image in the deformed image and determine the displacement components by minimizing or maximizing the correlation coefficient. The point P’(xi + ui, yi + vi) after deformation corresponding to the coordinate P (xi, yi) in the reference image can be obtained by searching for a match in region of interest (ROI). On this basis, full-field displacements related to varied loading stages can be determined by optimizing the correlation function. More details on DIC can be found in previous studies [17,18]. The DIC monitoring principle is shown in Figure 3.
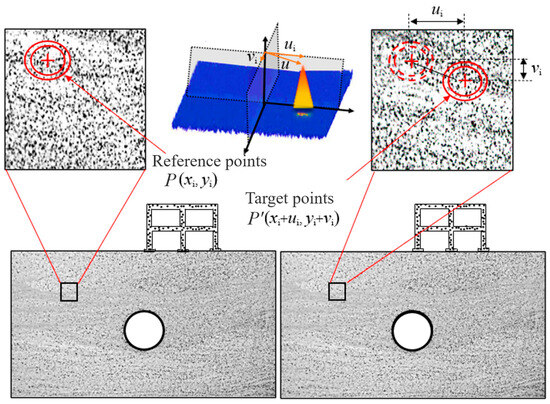
Figure 3.
DIC monitoring principle.
2.2. Model Similarity
The actual building material for comparison was selected as C30 concrete, of which the elastic modulus is 30 GPa. According to the similarity theory, some parameters of dimensions and deformation between the model and the actual buildings are shown in Table 2.
Table 2.
Parameters of dimensions and deformation.
The inter-story load in the actual buildings is taken as 8 kN/m2, which is applied in the form of a loading box. Since the inter-story load and the elasticity modulus share the same dimension, the similarity ratio of load is also set to 1:16.6. In addition, the distance between adjacent columns along the length of the frame is 150 mm, and the distance between columns in the width direction is 120 mm; so, the mass of a single loading box is 0.15 m × 0.12 m × 8000 N/m2/16.6/10 N/kg = 0.9 kg.
2.3. Test Conditions Control
Different construction conditions were simulated by changing the relative position of the structure to the tunnel and tunnel volume loss. For the relative position of the structure, the horizontal distance between the centrelines of the structure and the tunnel is defined as the eccentricity (e). e = 0 corresponds to the condition in which the structures are located directly above the tunnel. And then, the structure was moved to the right, setting the position of the structure every 0.5D interval, from 0 to 2.0D, for a total of 5 conditions, as shown in Figure 4.
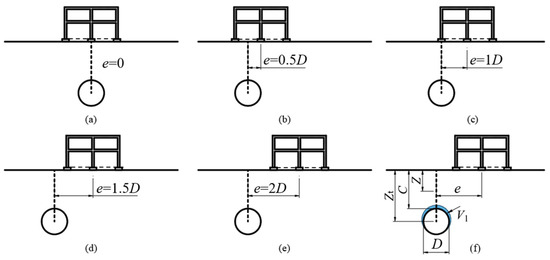
Figure 4.
Schematic diagram of relative position of building structure and tunnel. (a) the structures are located directly above the tunnel. (b) the structure is located 0.5D away from the tunnel. (c) the structure is located 1D away from the tunnel. (d) the structure is located 1.5D away from the tunnel. (e) the structure is located 2D away from the tunnel. (f) diagram of the relationship between structure and tunnel location..
Different degrees of tunnel volume loss can be triggered during tunnel construction due to factors such as excavation speed and formation conditions [19]. Based on a large amount of engineering field data, Wu and Zhu [20] statistically summarized the ground loss caused by different diameter tunnelling and found that the maximum value of volume loss caused by the construction of small- and medium-diameter shield tunnels was about 3.79% and the minimum value was about 0.03%. With reference to the above data and combined with the experimental conditions, three types of tunnel volume losses of Vl = 1.5%, 2.4% and 3.4% were selected for the tests, which corresponded to normal to large excavation disturbance conditions, respectively. The corresponding water volume of Vl = 1.5% is initially extracted, followed by a two-minute interval, during which the extraction continues with the corresponding water volume of Vl = 2.4%, and finally reaches Vl = 3.4%.
3. Results and Analysis
By extracting from DIC monitoring data, the complete strain field contours of the formation and structure under different working conditions can be obtained. The vertical displacement contours under isolated footings corresponding to e = 1D are shown in Figure 5 for instance. Ground movements and structural distortion characteristics can be analysed based on the different strain contours obtained.
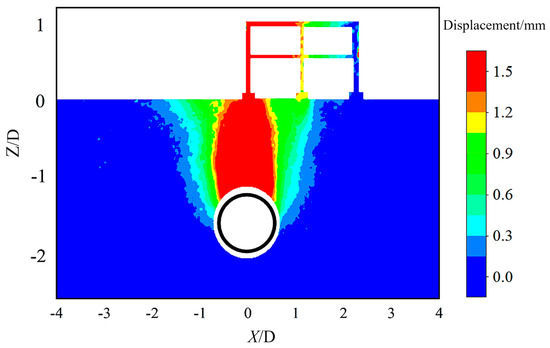
Figure 5.
Vertical displacement contours under isolated footings (e = 1D).
3.1. Displacements of Surface and Footings
The displacement curves of the ground surface and footings were extracted and drawn in Figure 6, where the surface displacement curves of greenfield are drawn in dashed lines as a reference for comparison, where displacement curves of soil beneath foundation are presented in solid lines, while that under greenfield are presented in dotted lines, and tunnel volume loss of Vl = 1.5%, 2.4% and 3.4% are in black, red and blue, respectively. For different foundations, isolated footings are represented by thin lines, and strip footings are represented by thick lines. Positive horizontal and vertical displacements are oriented towards the right and upwards, respectively, while positive volumetric strains are contractive.
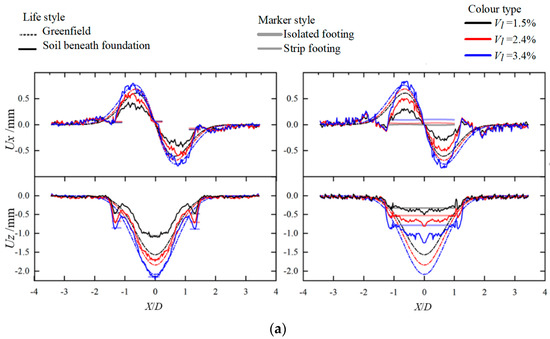
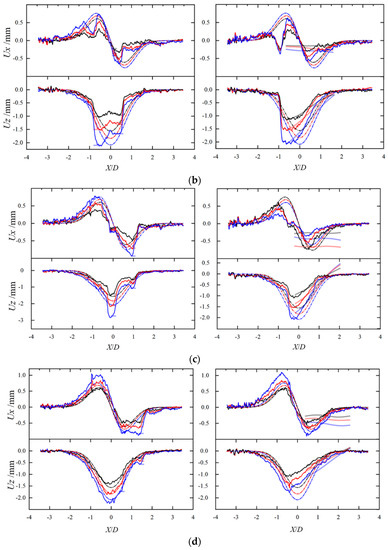
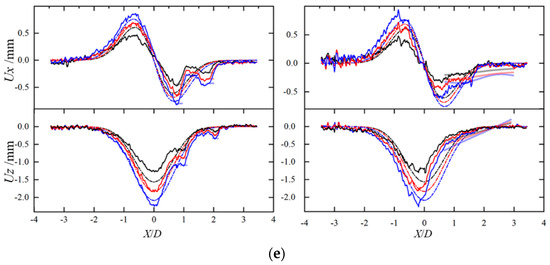
Figure 6.
Displacement curves of the ground surface and footings. (a) e = 0. (b) e = 0.5D. (c) e = 1D. (d) e = 1.5D. (e) e = 2.0D.
For the greenfield, the surface settlement curves at different volume losses all fit well with the Peck–Gaussian function [21]. At a tunnel volume loss of 1.5%, the soil volume loss at the surface is 1.81 mm2, which is calculated through the volume of the surface settlement trough. While tunnel volume loss goes up to 2.4% and 3.4%, the soil volume loss is 2.62 mm2 and 3.42 mm2, respectively. It is obvious that the relationship between soil volume loss and tunnel volume loss is not 1:1, which is caused by contractive/dilative response to shearing in sand [8,22]. For horizontal displacement, the topsoil on both sides of the tunnel moves towards the tunnel centre. The maximum horizontal displacement is 0.51 mm at a tunnel volume loss of 1.5%, while 0.73 mm and 0.92 mm correspond to volume losses of 2.4% and 3.4%, respectively. The maximum horizontal displacement of the ground surface increases approximately linearly with the increase in tunnel volume loss.
When the frames are located directly above the tunnel (e = 0), the settlements of end footings for the isolated foundation are greater than that in the corresponding greenfield at different tunnel volume losses because of the embedment, while the maximum surface settlement (middle footing) is instead smaller than that in the greenfield, interestingly. It can be conducted that the separate foundation limits the vertical maximum displacement of the soil to a certain extent. While the surface settlements of strip foundations are much smaller than those of greenfield and under the isolated foundation, due to the larger area of application of the load. In addition, since the settlement of the middle footing is larger than that of the end footings for isolated foundation, resulting in a sagging deformation of the frame, while that is not obvious for the strip foundation owing to its large total stiffness. This will be analysed and discussed in detail later on. For eccentric cases with e = 0.5~1D, the settlements under the left and middle footings are larger than those of the greenfield, which presents an inclined “W” shape. While the settlement of strip footings is dominated by overall deformation due to the larger stiffness, and the settlement line is approximately linear, it can be seen that both foundation structure is significantly sloped in these cases, reaching the maximum tilt with e = 1D. In that case, the vertical displacement of right footing is near 0, while that of the right side of the strip foundation is even positive, indicating that its right side has been lifted off the surface, which could be treated as a trend of “foot lifting”. For the eccentricity with e = 2D, the surface settlements under both foundations are back to following the Gauss distribution closely, with tilt weakened greatly.
The eccentricity also affects the distribution of horizontal displacement. Relative to the greenfield case, the horizontal displacements of the surface were largely restricted by the foundation roughness and building pressure. The displacement of the middle footing is much larger than that of each end footing with e = 0.5~1.5D, while that of the strip footings is negative and similar in value, indicating that the foundation moves slightly to the left as a whole, increasing with the increase in tunnel volume loss. And the horizontal displacement of surface under both foundations is similar to that of greenfield as well with eccentricity reaching 2D. It is noted that compared with strip foundation, isolated foundation is more likely to be affected by soil deformation, and it is more prone to some risks of severe internal deformation or excessive tilt due to the significant differential displacements.
3.2. Structure Deformation
3.2.1. Structural Deformation Parameters
In order to evaluate the structural deformation of frames, the approach summarized by Son and Cording [23] based on strain and angular distortion is adopted. These parameters are determined by measuring the vertical (V) and horizontal (U) displacements at the four corners of the frame or a panel (geometrical area delimited by two columns and two slabs), as shown in Figure 7.
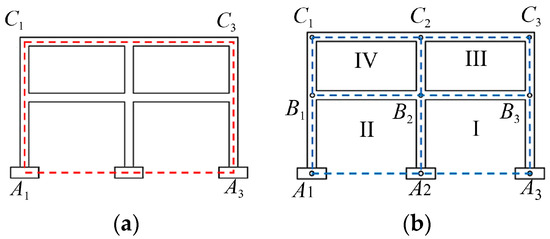
Figure 7.
Schematic diagram of building displacement measurement points. (a) Frame. (b) Panels.
Horizontal strain at base (εa,b) is the differential horizontal displacement at the base over the length (L) of the panel (Figure 8).
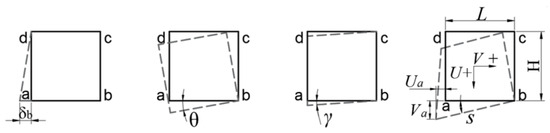
Figure 8.
Deformation of a panel.
Slope s is defined as differential vertical displacement at the base over the length L of the panel.
Tilt θ is the rigid rotation of the panel and is defined as
The angular distortion β is calculated by subtracting tilt θ from the slope s [23], which is equal to the shear distortion γ [8].
3.2.2. Overall Deformation
The overall slope (s) and tilt (θ) are obtained based on the displacement of the four corners at the edge of the frame and compared with the slope (sg) at the corresponding position of the greenfield for reference, as shown in Figure 9.
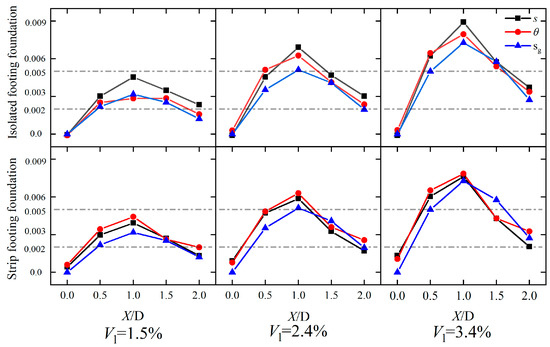
Figure 9.
Structure overall slope and tilt.
With the increase in the eccentricity, the overall slope (s) and tilt (θ) variation trend of the both foundation structure is similar, increasing first and then decreasing, reaching the maximum with e = 1D, which is consistent with the trend of greenfield. Compared with the strip foundation, the overall slope and tilt of the isolated foundation is slightly larger at the same eccentric distance.
Rankin [24] noted that the risk category could be divided into four levels based on the maximum slope of the building: negligible damage would be expected for a slope less than 0.002, slight damage with 0.002~0.005, moderate damage with 0.005~0.02, and greater than 0.02 for high damage. In this study, at a tunnel volume loss of 1.5%, the damage degree changed from negligible to slight for both foundations with an eccentricity of approximately 0.5D to 1.5D, while the overall slope is more than 0.5% with a similar eccentricity at Vl = 2.4%, making building at risk of moderate damage. And when tunnel volume loss reached 3.4%, the moderate damage range extends to 0.3~1.7D, indicating a further increase in the risk range. In addition, both structures were close to slight damage under different tunnel volume losses when the eccentric distance reached 2D. It can be seen that in engineering practice, excavation disturbance should be strictly controlled where there are adjacent buildings within the width of two times the tunnel diameter, so as to reduce the overall tilt of buildings.
3.2.3. Structural Deformation Characteristics
The variation of the deflection ratios caused by the differential vertical displacements of middle and end points on the foundations can be used to subdivide structural deformation characteristics into sagging and hogging, as shown in Figure 10. The deflection ratio can be defined as Δ/L, where Δ is the relative settlement of middle point, a positive value corresponding to hogging mode while a negative value corresponding to sagging mode, and L is the length of the frame. Typically, since the main reinforcement is mainly set at the bottom of the beam, foundation and other elements, the hogging mode is likely to be more damaging than the sagging mode for a given deflection ratio [25].
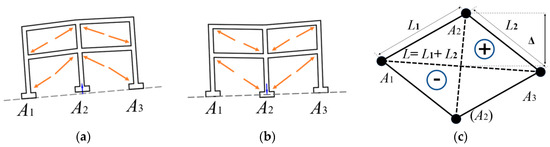
Figure 10.
Schematic diagram of structure deformation characteristics. (a) Hogging mode. (b) Sagging mode. (c) Relative settlement.
Figure 11 shows the variation of the deflection ratios with eccentricity in sagging and hogging. It can be seen that the building-to-tunnel position plays a key role in controlling the structural deformation characteristics, especially for the isolated foundation. The frame shows a significant sagging deformation with a great deflection ratio at zero eccentricity, increasing with the tunnel volume loss. Interestingly, with the increase in the eccentric distance, it gradually turns into the hogging deformation, and the turning position is around e = 0.7D. Until the eccentricity reaches two times the tunnel diameter, the structure still shows a certain degree of hogging deformation, which still needs to be paid attention to. While the strip foundation presents completely different migration characteristics, the deflection ratio is about 0 at zero eccentricity, where the foundation remains flat and straight owing to its large stiffness. With the increase in eccentricity, the structure remains in the hogging mode, and the deflection ratio increases firstly and then decreases. The deflection ratio tends to 0 at the position of e = 2D, back to the stable state closely for the frame. It can be concluded that the isolated foundation structure is more prone to deflection deformation due to its smaller total stiffness compared with the strip one.
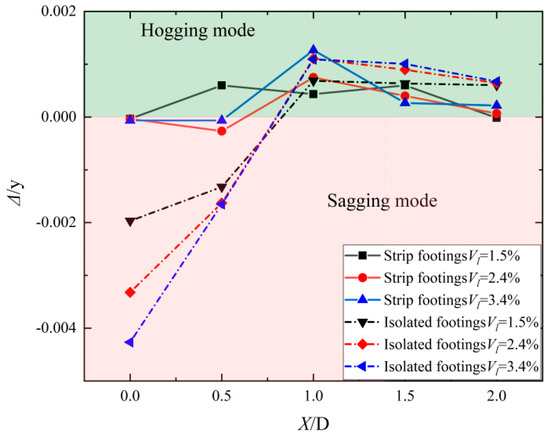
Figure 11.
Deflection ratios with eccentricity.
3.2.4. Panel Damage Level
The distribution of distortion with panels can determine its damage level, which can be represented by the critical tensile strain εcrit, as shown in Table 3 [26]. And the critical tensile strain εcrit = γ/2 can be calculated from γ using a Mohr’s circle of strain under plane-strain conditions with the horizontal strain of the panels neglected [23].
Table 3.
Damage level based on critical tensile strain.
The critical tensile strains of different panels are calculated and the damage level are distinguished by a colour scheme, as shown in Figure 12.
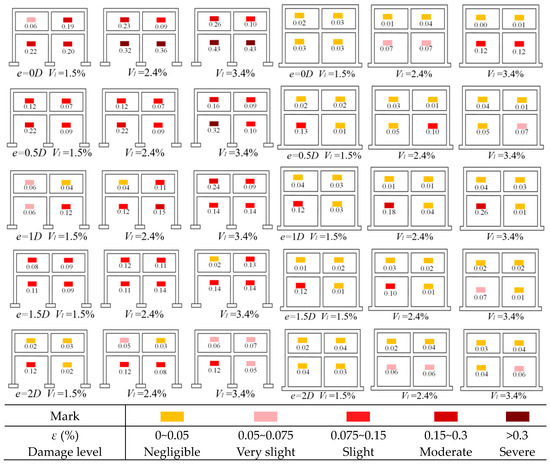
Figure 12.
Damage level of panels.
For zero eccentricity, the isolated foundation structure was moderately damaged at a low tunnel volume loss, and achieved severe damage with increase in tunnel volume loss, with the maximum tensile strain reaching 0.43%, while the damage of strip foundation could be ignored at a low volume loss and reached a medium level at high volume loss. It can be again confirmed that the isolated foundation buildings are in a risk of cracking where tunnelling passes directly under the structure. For an eccentric case with e = 0.5D, the damage degree of the isolated foundation was decreased markedly, but the damage of the lower left panel was still at a moderate-to-severe level. While the damage of the strip foundation structure was less than slight at different volume losses. It can be regarded that the increase in tilt could reduce the damage level within panels to some degree. For the case with e = 1D, it is known from the previous section that the overall tilt of both foundations reached the maximum, whereas the internal damage of the isolated foundation structure was somewhat lower than that of the first two locations, and moderate only in the upper left panel at a high tunnel volume loss. While the damage of the strip foundation increased with the eccentricity, the maximum tensile strain of the lower left panel reached 0.26% at high tunnel volume loss, that is, up to the moderate level. With eccentricity reaching 1.5~2D, the frames gradually moved away from the tunnel range, the damage level of both structures reduced observably, below the slight level. Especially for the strip foundation, the damage could be ignored at the location with e = 2D.
It can be seen that the isolated foundation buildings would present a higher damage level than that with the strip foundation at the same location. In addition, it is worth noting that the trends with the location are different for two foundation structures: the damage of the isolated foundation structure tends to decrease with the eccentricity, while the damage increases firstly and then decreases for strip foundation structure, reaching the maximum damage level with e = 1D. It needs to be said that the structural model was simplified without walls in this study, that is, the resistance of walls to panel deformation was ignored. The calculated maximum tensile strain value should be larger than that of the actual building, but the overall variation trend of damage degree has an important reference value for practical engineering.
3.3. Shear Distortion of Ground and Structure
To comprehensively characterize tunnel–soil–frame interaction, the DIC data were processed to obtain the shear-strain contours for selected tests at a tunnel volume loss of Vl = 3.4%. The shear-strain distribution in the greenfield is shown in Figure 13, and the shear-strain contours within ground and structural elements under different foundation structures are shown in Figure 14.
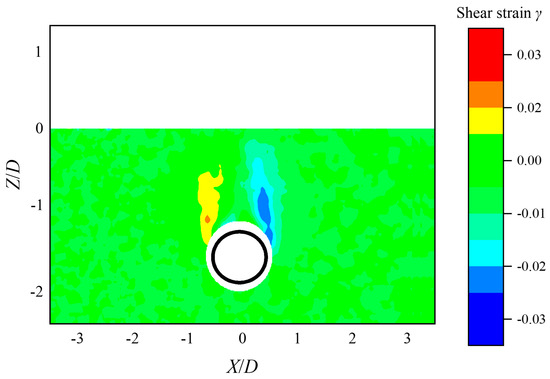
Figure 13.
Shear-strain distribution in the greenfield.
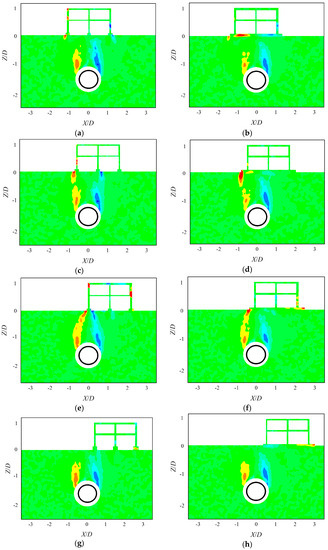
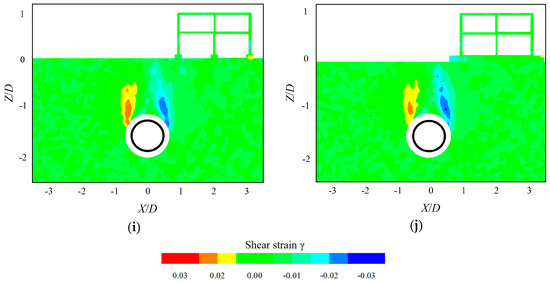
Figure 14.
Shear-strain contours within ground and structural elements. (a) e = 0 Isolated footings. (b) e = 0 Strip footings. (c) e = 0.5D Isolated footings. (d) e = 0.5D Strip footings. (e) e = 1D Isolated footings. (f) e = 1D Strip footings. (g) e = 1.5D Isolated footings. (h) e = 1.5D Strip footings. (i) e = 2.0D Isolated footings. (j) e = 2.0D Strip footings.
When the structure was located directly above the tunnel (e = 0), compared to the greenfield, a slight increase in shear strain at the tunnel shoulders can be observed, and the distribution pattern was kept approximately the same. And the large shear strains within and beneath both side columns (footings) were present for the isolated foundation structure, while large shear-strain areas occur in the foundation beam between columns for the strip one. That is, there is a significant localized increase in shear strain within both foundation structural elements.
At the location with e = 0.5D, for the isolated foundation frame, the large shear strains extend upward from the tunnel shoulders to the bottom of the two columns on the left, and an obvious strain increase appears within the left column, while the shear strain increases locally beneath the left edge of the strip foundation significantly, with slight shear strains within the structure. For the case with e = 1D, the distributions of the shear strains are similar for both foundation structures, extending from the tunnel shoulders to the left footing or left edge of the foundation. Local strain increased obviously within the left and right columns and the top beam of the frame for the isolated foundation frame, while slight strain increasing occurs in the right side of the strip foundation beam. When the eccentricity distance is more than 1.5D, the phenomena of shear strains extending to foundations disappears. No significant shear strain increasing could be seen in both foundation structures, and the shear strain is small in the ground, close to that in the greenfield.
It is noted that the shear-strain-increasing area presented in the structure where the building was mainly located within a certain range, about one multiple of the tunnel diameter horizontally, led to a great risk for structural-element breaking.
4. Discussion
4.1. Setting of Test Conditions
In this study, laboratory model tests based on the DIC technique were adopted to investigate the response of underground tunnelling under two different adjacent shallow-foundation structures. There are many factors that can cause the ground deformation in the actual construction, taking the shield method tunnel as an example, mainly including soil movement, shield retreat, soil crowded into shield tail space, changing the advancing direction, deformation of the shield segments, etc. [27,28]. The combined effect of various factors makes it more difficult to consider the complex ground-deformation problem. However, fundamentally, it can be considered that the tunnel volume loss generated during the construction leads to the soil movement [11,29,30]. In this paper, the process of reducing the tunnel volume loss by the liquid drainage method can grasp the main contradiction from many complex influencing factors, which has strong operability and rationality, and has been adopted by many scholars [17,31,32].
The test was conducted in a natural gravity environment (1 g), and the relevant parameters satisfy the similarity theory requirements as described in Section 2.2. A large number of scholars such as Marshall et al. [33], He et al. [34], Hassoun et al. [35], and Fang et al. [36] have carried out model tests at 1 g, and the test results are intuitive and effective, indirectly verifying the feasibility and rationality of the method. Some scholars carried out model tests based on the centrifuge, e.g., Xu et al. [8,37] investigated the tunnel–soil–frame interaction under raft and separate footings at an elevated gravity level of 68 g. Compared with Franza and DeJong [38], it is put forward that soil near the surface was largely restricted by the foundation, and a shear band at the soil–foundation interface was observed, which is consistent with results of this paper. Compared to large-scale model tests, some deformation features are difficult to show clearly due to the limitations of the space inside the centrifuge and the operating environment. Compared with the centrifuge model test, the model test at 1 g is low cost, easy to operate and observe, and convenient for the application of some techniques such as the DIC technique.
The soil’s movement and frame deformation can be monitored completely and comprehensively through the DIC technique, through which the processed images are sharper and more accurate than GEOPIV. For this purpose, sand is chosen as the formation medium. On the one hand, sand is easy to be painted and made into a scattered stratum, and on the other hand, the main performance parameters of sand are friction angle and density, of which the influence of cohesion can be ignored [39]. Based on the complete displacement or strain field, this study investigates the characteristic response of ground and structures from different perspectives, including surface and ground displacement, overall structural and panel deformation, and shear-strain distribution, etc. During the process, the eccentricity of the frames was set from above the tunnel to two times the tunnel diameter horizontally, which covers the main range affected and can basically meet the requirements of the investigation.
The frame structures with isolated or strip foundation are the most common structural forms for low buildings, which have different significant limiting effects on the ground deformation [40]. As a general understanding, the strip foundation has higher total stiffness and less distributed stress at the bottom; therefore, the stability and safety of strip foundation buildings are naturally higher [41]. Even so, the differential and common deformation and damage characteristics, which are hard to reveal by monitoring during the construction, are worthy of in-depth exploration and investigation. Interestingly, especially for the isolated foundation frame, the trends of panel damage and structural element damage with eccentricity are different. Among them, the panel damage focuses on the evaluation within the panel, mainly in the wall crack damage of the building, while the structural elements correspond to the main load-bearing members such as beams and columns; thus, these two kinds of damage should be considered separately. The corresponding test conclusions have an important reference value for the evaluation of the environmental impact around the tunnel projects.
4.2. Difficulties and Prospects
The difficulty of this study lies in the restoration of the real stratum, which is mostly complicated by the combination of coarse-grained soil and fine-grained soil, which greatly increases the difficulty of simulation. In addition, the deformation of fine-grained soil is difficult to be monitored by DIC technique. On the other hand, although the deformation amount of coarse-grained soil and fine-grained soil is different, the deformation law of the whole soil layer is similar, and the influence law of the foundation is analogical. Therefore, sand is commonly used as the experimental stratum material of the underground tunnel model, which is accepted by the majority of scholars [42]. In future research, we will consider combining LVDT and GEOPIV or other testing methods to try to conduct model test research in fine-grained soil and composite soil.
However, the setting of the eccentric position in this study has certain limitations. For example, e = 1D also corresponds to the building edge right above the tunnel, and e = 2D corresponds to the whole frame being out of the influence range of the tunnel horizontally. The mechanism of the influence of the position needs to be further explored. On the other hand, the monitoring data of specific projects were not compared with the experimental data for the verification of this study. In the next research work, as hard as it may be, further integration of similar model tests with the actual project are considered to conduct an in-depth comparison and discussion.
5. Conclusions
This paper presents a detailed physical model experimental study based on the DIC technique to investigate the response of formation and two shallow-foundation frame structures caused by underground tunnelling. It can be concluded that, in addition to the relative position of the structure to the tunnel and tunnel volume loss, the foundation type also has a great influence on the deformation of soil and structure. The specific conclusions can be drawn as follows:
- The vertical displacement at the bottom of the isolated footings is greater than that of the greenfield, which transforms the settlement curve from a Gaussian distribution form to a sloping W-shape with some eccentricity, and the differential vertical and horizontal displacements of the column footings further cause the deformation inside the structure. The displacement of the strip footings is dominated by the overall deformation, with the settlement similarly maintaining an approximately linear and horizontal displacement.
- The overall tilt of the both foundation structures tends to increase firstly and then decrease with the eccentricity, reaching the maximum with the eccentricity of one multiple of the tunnel diameter. Within that eccentricity range of 0 to 1 multiples of the tunnel diameter, the shear-strain-increasing area is presented significantly, and there is a risk for structural-element breaking, especially for the isolated foundation structure.
- The damage of the panels is the most serious when the isolated foundation structure is located directly above the tunnel, with the most pronounced sagging deformation as well. With the increase in eccentricity, the panel damage decreases gradually, changing from a sagging mode to a hogging one. The strip foundation structure always keeps a slight hogging deformation, and the damage level of the panels increased first and then decreased with the eccentricity, consistent with the trend of its overall tilt.
- The deformation and damage of the strip foundation structure is reduced to a negligible state when eccentricity reached two times the tunnel diameter, whereas the structure with the isolated foundation still showed some degree of hogging deformation at this location, with the damage of the panels in the range of the slight level; so, it is necessary to enhance the monitoring of the structure within two times the tunnel diameter horizontally.
Author Contributions
Methodology, Y.L. and W.L.; Software, T.W. and Z.L. (Zhu Liang); Validation, Z.L. (Zhifang Liu); Formal analysis, G.L.; Investigation, H.X.; Writing—original draft, Y.L.; Writing—review & editing, Q.Z. All authors have read and agreed to the published version of the manuscript.
Funding
The completion of this work was supported by Key-Area Research and Development Program of Guangdong Province (NO. 2020B0101130009), Collaborative Innovation Center for Natural Resources Planning and Marine Technology of Guangzhou (No. 2023B04J0301), Guangdong Enterprise Key Laboratory for Urban Sensing, Monitoring and Early Warning (No. 2020B121202019), The Science and Technology Foundation of Guangzhou Urban Planning & Design Survey Research Institute (Grant No. RDI2220204037) and the Natural Science foundation of Zhejiang Province (Grant No. LGJ22D020001 & No. LQ20E080006).
Data Availability Statement
The data used to support the findings of this study are included within the article.
Conflicts of Interest
The authors declare that they have no conflict of interest.
References
- Giardina, G.; Milillo, P.; Dejong, M.J.; Perissin, D.; Milillo, G. Example applications of satellite monitoring for post-tunnelling settlement damage assessment for the crossrail project in london: An interdisciplinary approach. In Structural Analysis of Historical Constructions; Springer: Berlin/Heidelberg, Germany, 2019; pp. 2225–2235. [Google Scholar]
- Shahin, H.M.; Nakai, T.; Zhang, F.; Kikumoto, M.; Nakahara, E. Behavior of ground and response of existing foundation due to tunneling. Soils Found. 2011, 51, 395–409. [Google Scholar] [CrossRef]
- Fang, Q.; Du, J.M.; Li, J.Y.; Zhang, D.L.; Cao, L.Q. Settlement characteristics of large-diameter shield excavation below existing subway in close vicinity. J. Cent. South Univ. 2021, 28, 882–897. [Google Scholar]
- Elkayam, I.; Klar, A. Nonlinear elastoplastic formulation for tunneling effects on superstructures. Can. Geotech. J. 2018, 56, 956–969. [Google Scholar] [CrossRef]
- Son, M.; Cording, E.J. Responses of buildings with different structural types to Excavation-Induced ground settlements. J. Geotech. Geoenviron. 2011, 137, 323–333. [Google Scholar] [CrossRef]
- Moussaei, N.; Khosravi, M.H.; Hossaini, M.F. Physical modeling of tunnel induced displacement in sandy grounds. Tunn. Undergr. Space Technol. 2019, 90, 19–27. [Google Scholar] [CrossRef]
- Daniela, B.; Nunzio, L.; Sara, B.; Angelo, A. Finite Element modelling of tunnelling-induced displacements on framed structures. Tunn. Undergr. Space Technol. 2018, 80, 222–231. [Google Scholar]
- Xu, J.; Franza, A.; Marshall, A.M. Response of framed buildings on raft foundations to tunneling. J. Geotech. Geoenviron. 2020, 146, 04020120. [Google Scholar] [CrossRef]
- Ritter, S.; Giardina, G.; Dejong, M.J.; Mair, R.J. Centrifuge modelling of building response to tunnel excavation. Int. J. Phys. Model. Geotech. 2017, 18, 1–16. [Google Scholar] [CrossRef]
- Ritter, S.; Giardina, G.; Franza, A.; Dejong, M.J. Building deformation caused by tunneling: Centrifuge modeling. J. Geotech. Geoenviron. 2020, 146, 1–17. [Google Scholar] [CrossRef]
- Zheng, H.; Li, P.; Ma, G. Stability analysis of the middle soil pillar for asymmetric parallel tunnels by using model testing and numerical simulations. Tunn. Undergr. Space Technol. 2020, 108, 103686. [Google Scholar] [CrossRef]
- Fang, Q.; Wang, G.; Yu, F.; Du, J. Analytical algorithm for longitudinal deformation profile of a deep tunnel. J. Rock Mech. Geotech. Eng. 2021, 13, 10. [Google Scholar] [CrossRef]
- Li, P.; Wei, Y.; Zhang, M.; Huang, Q.; Wang, F. Influence of non-associated flow rule on passive face instability for shallow shield tunnels. Tunn. Undergr. Space Technol. 2022, 119, 104202. [Google Scholar]
- Sohaei, H.; Namazi, E.; Hajihassani, M.; Marto, A. A review on tunnel–pile interaction applied by physical modeling. Geotech. Geol. Eng. 2020, 38, 3341–3362. [Google Scholar] [CrossRef]
- Wang, T.; Wang, R.; Xue, F.; Tang, N. Experimental Investigation on the Effect of Volume Loss on Ground Movements Induced by Tunnelling in Sand. KSCE J. Civ. Eng. 2023, 27, 122–134. [Google Scholar] [CrossRef]
- Chapman, D.N.; Ahn, S.K.; Hunt, D.V. Investigating ground movements caused by the construction of multiple tunnels in soft ground using laboratory model tests. Can. Geotech. J. 2007, 44, 631–643. [Google Scholar] [CrossRef]
- Kirugulige, M.S.; Tippur, H.V. Measurement of Fracture Parameters for a Mixed-Mode Crack Driven by Stress Waves using Image Correlation Technique and High-Speed Digital Photography. Strain 2009, 45, 108–122. [Google Scholar] [CrossRef]
- Pan, B.; Wu, D.; Xia, Y. High-temperature deformation field measurement by combining transient aerodynamic heating simulation system and reliability-guided digital image correlation. Opt. Lasers Eng. 2010, 48, 841–848. [Google Scholar] [CrossRef]
- Loganathan, N.; Poulos, H.G.; Stewart, D.P. Centrifuge model testing of tunnelling-induced ground and pile deformations. Géotechnique 2000, 50, 283–294. [Google Scholar]
- Wu, C.S.; Zhu, Z.D. Comparative study on ground loss ratio due to shield tunnel with different diameters. Yantu Gongcheng Xuebao/Chin. J. Geotech. Eng. 2018, 40, 2257–2265. [Google Scholar]
- Peck, R.B. Deep excavations and tunnelling in soft ground. In Proceedings of the 7th International Conference on Soil Mechanics and Foundation Engineering, Mexico City, Mexico, 25–29 August 1969. [Google Scholar]
- Hajihassani, M.; Sohaei, H.; Namazi, E.; Marto, A. Experimental study of surface failure induced by tunnel construction in sand. Eng. Fail. Anal. 2020, 118, 104897. [Google Scholar]
- Son, M.; Cording, E.J. Estimation of building damage due to excavation-induced ground movements. J. Geotech. Geoenviron. Eng. 2005, 131, 162–177. [Google Scholar] [CrossRef]
- Rankin, W.J. Ground movements resulting from urban tunnelling: Predictions and effects. Geol. Soc. Lond. Eng. Geol. Spec. Publ. 1988, 5, 79–92. [Google Scholar] [CrossRef]
- Mair, R.J.; Taylor, R.N.; Burland, J.B. Prediction of ground movements and assessment of risk of building damage due to bored tunnelling. In Proceedings of the Geotechnical Aspects of Underground Construction in Soft Ground, London, UK, 15–17 April 1996; pp. 713–718. [Google Scholar]
- Boscardin, M.D.; Cording, E.J. Building response to Excavation-Induced settlement. J. Geotech. Eng. 1989, 115, 1–21. [Google Scholar] [CrossRef]
- Shahin, H.M.; Nakai, T.; Ishii, K.; Iwata, T.; Kuroi, S. Investigation of influence of tunneling on existing building and tunnel: Model tests and numerical simulations. Acta Geotech 2016, 11, 1–14. [Google Scholar] [CrossRef]
- Yu, L.; Zhang, D.; Fang, Q.; Cao, L.; Zhang, Y.; Xu, T. Face stability of shallow tunnelling in sandy soil considering unsupported length-ScienceDirect. Tunn. Undergr. Space Technol. 2020, 102, 103445. [Google Scholar] [CrossRef]
- Zhang, Y.; Yin, Z.; Xu, Y. Analysis on three-dimensional ground surface deformations due to shield tunnel. Chin. J. Rock Mech. Eng. 2002, 21, 388–392. [Google Scholar]
- Cao, L.; Zhang, D.; Fang, Q. Semi-analytical prediction for tunnelling-induced ground movements in multi-layered clayey soils. Tunn. Undergr. Space Technol. 2020, 102, 103446. [Google Scholar] [CrossRef]
- Li, P.; Chen, K.; Wang, F.; Li, Z. An upper-bound analytical model of blow-out for a shallow tunnel in sand considering the partial failure within the face. Tunn. Undergr. Space Technol. 2019, 91, 102981–102989. [Google Scholar] [CrossRef]
- Liu, X.; Fang, Q.; Zhang, D.; Liu, Y. Energy-based prediction of volume loss ratio and plastic zone dimension of shallow tunnelling-ScienceDirect. Comput. Geotech 2020, 118, 103343. [Google Scholar] [CrossRef]
- Marshall, A.M.; Farrell, R.; Klar, A.; Mair, R. Tunnels in sands: The effect of size, depth and volume loss on greenfield displacements. Géotechnique 2012, 62, 385–399. [Google Scholar] [CrossRef]
- He, C.; Feng, K.; Fang, Y.; Jiang, Y.C. Surface settlement caused by twin-parallel shield tunnelling in sandy cobble strata. J. Zhejiang Univ. Sci. A 2012, 13, 858–869. [Google Scholar] [CrossRef]
- Hassoun, M.; Villard, P.; Al Heib, M.; Emeriault, F. Soil reinforcement with geosynthetic for localized subsidence problems: Experimental and analytical analysis. Int. J. Geomech. 2018, 18, 4018131–4018133. [Google Scholar] [CrossRef]
- Fang, Y.; Chen, Z.; Tao, L.; Cui, J.; Yan, Q. Model tests on longitudinal surface settlement caused by shield tunnelling in sandy soil. Sustain. Cities Soc. 2019, 47, 101504. [Google Scholar] [CrossRef]
- Xu, J.; Franza, A.; Marshall, A.M.; Losacco, N.; Boldini, D. Tunnel-framed building interaction: Comparison between raft and separate footing foundations. Géotechnique 2021, 71, 631–644. [Google Scholar] [CrossRef]
- Franza, A.; Dejong, M.J. Elastoplastic solutions to predict tunneling-induced load redistribution and deformation of surface structures. J. Geotech. Geoenviron. 2019, 145, 4019007. [Google Scholar] [CrossRef]
- Fuglsang, L.D.; Ovesen, N.K. The application of the theory of modelling to centrifuge studies. In Centrifuges in Soil Mechanics; CRC Press: Boca Raton, FL, USA, 2020. [Google Scholar]
- Farrell, R.; Mair, R.; Sciotti, A.; Pigorini, A. Building response to tunnelling. Soils Found 2014, 54, 269–279. [Google Scholar] [CrossRef]
- Fu, J.; Yu, Z.; Wang, S.; Yang, J. Numerical analysis of framed building response to tunnelling induced ground movements. Eng. Struct 2018, 158, 43–66. [Google Scholar] [CrossRef]
- Ritter, S.; Giardina, G.; Dejong, M.J.; Mair, R.J. Influence of building characteristics on tunnelling-induced ground movements. Géotechnique 2017, 67, 926–937. [Google Scholar] [CrossRef]
Disclaimer/Publisher’s Note: The statements, opinions and data contained in all publications are solely those of the individual author(s) and contributor(s) and not of MDPI and/or the editor(s). MDPI and/or the editor(s) disclaim responsibility for any injury to people or property resulting from any ideas, methods, instructions or products referred to in the content. |
© 2023 by the authors. Licensee MDPI, Basel, Switzerland. This article is an open access article distributed under the terms and conditions of the Creative Commons Attribution (CC BY) license (https://creativecommons.org/licenses/by/4.0/).