Article

Energy Consumption Difference Found between Typical and Standard Occupancy in Residential Buildings in a Tropical Developing Country

by
Jinela González
1,
Dafni Mora
1,2,3 and
Miguel Chen Austin
1,2,3,*
1
Research Group Energética y Confort en Edificaciones Bioclimáticas (ECEB), Faculty of Mechanical Engineering, Universidad Tecnológica de Panamá, Panama City 0819-07289, Panama
2
Centro de Estudios Multidisciplinario en Ciencias, Ingeniería y Tecnología (CEMCIT-AIP), Panama City 0819-07289, Panama
3
Sistema Nacional de Investigación (SNI), Panama City 0816-02852, Panama
*
Author to whom correspondence should be addressed.
Buildings 2023, 13(9), 2235; https://doi.org/10.3390/buildings13092235
Submission received: 23 July 2023 / Revised: 26 August 2023 / Accepted: 30 August 2023 / Published: 2 September 2023
(This article belongs to the Section Building Energy, Physics, Environment, and Systems)

Abstract

:
Buildings are highly demanding of global energy consumption. Their functions, design, location, and other parameters influence the magnitude of such consumption. However, a key factor that can significantly change energy demand is the occupant’s interaction with the environment. It is, therefore, prudent to integrate the occupant profile within the six determinants of energy use, as proposed by the International Energy Agency. International standards propose an occupancy profile that has been implemented for design and performance analysis. However, these do not reflect reality, have little precision in their results, and affect occupant comfort and energy consumption expectations. To mitigate this problem, the literature proposes various methodologies to establish a mainly stochastic analysis offering optimal results. Panama, a country in the process of improving its energy matrix, finds it convenient to apply studies on the occupants’ behavior (OB) and preferences to guarantee comfort and avoid energy losses, supporting the purposes established in the National Energy Plan of Panama 2015–2050, guiding energy policy. This research seeks to define a particular pattern in occupants’ behavior in Panama through the analysis of surveys, identify its impact on energy consumption through dynamic simulation, and compare it with energy consumption generated by international standards. Results showed great differences in the energy consumption estimated via typical OB-based surveys and OB from standards, where the consumption by the latter can increase above 50%, while with surveys, this differs from the reference by no more than 11%.

1. Introduction

The climatic conditions are positioned at the center of attention to find solutions that mitigate the current problems. These investigations go hand in hand with the study of the generation and consumption of electricity to seek sustainability as proposed by the Sustainable Development Goals (SDGs), mainly related to the SDG7, SDG12, and SDG13 since they include: affordable and clean energy, sustainability in cities and communities, and climate action, but mainly SDG 7 which seeks to “ensure access to affordable, reliable, sustainable and modern energy for all” [1,2].
For this, organizations are responsible for making complementary studies between energy and the environment, focusing mainly on energy use. The International Energy Agency (IEA) and the Energy in Buildings and Communities (EBC) program identify occupant behavior as one of the six determining factors in energy use, mainly because today, buildings are among the largest consumers of energy [3,4]. The impact of occupant behavior on energy consumption has been studied in different parts of the world. However, there is evidence in the literature that some occupants do not know the principles of how a building operates and make energy-inappropriate uses [5]. The latter has consequences on the energy performance of a building.
One of the existing problems in the building is the design, mainly the design of the HVAC system, due to the energy demand that can be incurred. Therefore, an air conditioning design must always be carried out according to the needs of the building and contemplating the environmental conditions surrounding it. There are standard criteria that define the occupant’s behavior for different enclosures, and based on that information, designs are developed that finally do not fit with reality, causing energy and economic losses, in addition to thermal dissatisfaction in the occupants. All these effects must be mitigated by creating new strategies that allow the occupants to know the measure of energy use. The methodologies used have implemented energy software to determine the variables needed to be analyzed, such as energy consumption, temperatures, thermal comfort, etc.
The occupants’ behavior entails a high impact on the energy consumption of buildings, and its improvement corresponds to one of the energy-saving strategies [6]. Occupant behavior is linked to indoor air quality (IAQ), as occupants can manipulate HVAC system conditions to meet their thermal comfort needs [7]. Indoor air quality is considered acceptable when no harmful concentrations determined by the authorities are found, and 80% or more of occupants indicate a state of satisfaction [8,9]. During the design of buildings, the occupants’ behavior must be analyzed, contemplating thermal comfort and preferences instead of using standardized values that do not determine a realistic behavior. Building designs have been designed for occupants, but there is evidence that they do not meet the occupants’ satisfaction and present thermal discomfort [10].
Furthermore, it should not be assumed that all occupants will be able to understand how buildings operate to use energy-saving systems [3] appropriately. T. Hong et al. [11] compare the unoccupied hours suggested by the standard schedule for Department of Energy buildings and those calculated by averaging the hours vacated per office using the stochastic method. As a result, using the stochastic method results in twice as many unoccupied hours as the normalized schedule, and using the survey method to determine the number of hours that offices remain unoccupied favors the energy performance of the building.
Another purpose of assessing occupant behavior is to offer more direct feedback. Such is the case of M. Ashouri et al. [12], where they replicate a building. However, improvements are added to this second version to be classified as an energy-efficient building; in this way, recommendations are made to the occupants on how they should use energy to reduce their consumption. In addition, it has been shown that around 20% of energy can be saved if changes in occupant behavior are recorded to improve energy efficiency. For instance, Chacon et al., through optimization analysis, reported 40% energy savings when the retrofit measures involve changes in occupant behavior [13]. Aversa et al. reported about 18% energy savings when the stochastic characteristics of occupant behavior are accounted for in controlled systems [14].
Regarding statistical approaches, the research of L. Giusti et al. [15] in dwellings in Abu Dhabi (UAE) uses statistical correlation to find the proportionality between the number of people in the dwelling, occupant preferences in the use of equipment, and the impact on energy consumption. It is found that there is a positive correlation between the number of occupants of the dwelling and the use of air conditioning equipment and between r = 0.82 area of the dwelling with energy consumption r = 0.93 .
Frequency analysis is widely used to identify a pattern of behavior after surveys are applied, such as [16], where they process the surveys identifying which actions are often performed to elaborate the probability equations. The most prominent behavior is turning on the AC when it feels hot and turning off when it feels cold, the light is on when it is dark and turns off when sleeping, and the windows remain open, except when the AC is on.
A. Rinaldi et al. [17] carried out research developed at the Polytechnic University of Bari in Italy. Through online surveys aimed at students, it seeks to detect the main factors that influence energy efficiency and identify respondents’ behavior patterns in the buildings where they reside, considering multifamily, semidetached, and separate houses.
In Athens, Greece, Vogiatzi et al. [18] surveyed 451 people in spring 2016, collecting information on building characteristics, occupant behavior and energy use, and sociodemographic profiles. It is identified that the level of schooling is related to energy saving; children under 12 years of age do not maintain good practices, unlike those over 12 or university students. In addition, in residences with more (five or more) occupants, there is more energy awareness than those residences where there are fewer people. It may be because consumption tends to increase as more people go. However, they undergo more rigorous practices to save energy. The same phenomenon occurs with income since higher-income people can acquire equipment with technology for lower energy consumption or make structural reforms to reduce consumption.
Developing a study on the occupant’s behavior under local conditions allows us to enter a precise alternative to improve energy efficiency in buildings in Panama. It is important to develop this process in the design phase, through dynamic simulations, and during the rehabilitation of buildings. In Panama, the Sustainable Construction for Energy Saving guide, Resolution No. 3980 [19], must be considered for structural design. No account for occupancy or energy usage recommendations is considered in this guide.
Thus, this present study analyses the characteristics of various case studies through surveys regarding occupant behavior in Panama, still considered a developing country, aiming at identifying typical OB profiles and the relationship between energy consumption and residential building-related aspects. Aspects include surface area, construction year, number of air conditioners, and income. Survey results are processed with a method of statistical analysis to identify a particular occupation profile in Panama and to know its impact on energy consumption to compare them with the energy consumption generated by the profiles based on standard criteria through dynamic simulations. The findings reported help to advance the OB research and building energy performance in current design and regulations in a tropical developing country.

2. Materials and Methods

Figure 1 shows the methodology followed to meet the objectives set. The first phase was based on applying surveys as a preliminary approach. Next is the analysis of the surveys, which was carried out using statistical methods to define the occupant’s preferences corresponding to phase 3. The analysis results were then fed into the energy software to produce results for a typical residential building with AC and without AC, just as standard profiles were applied to define comparisons.

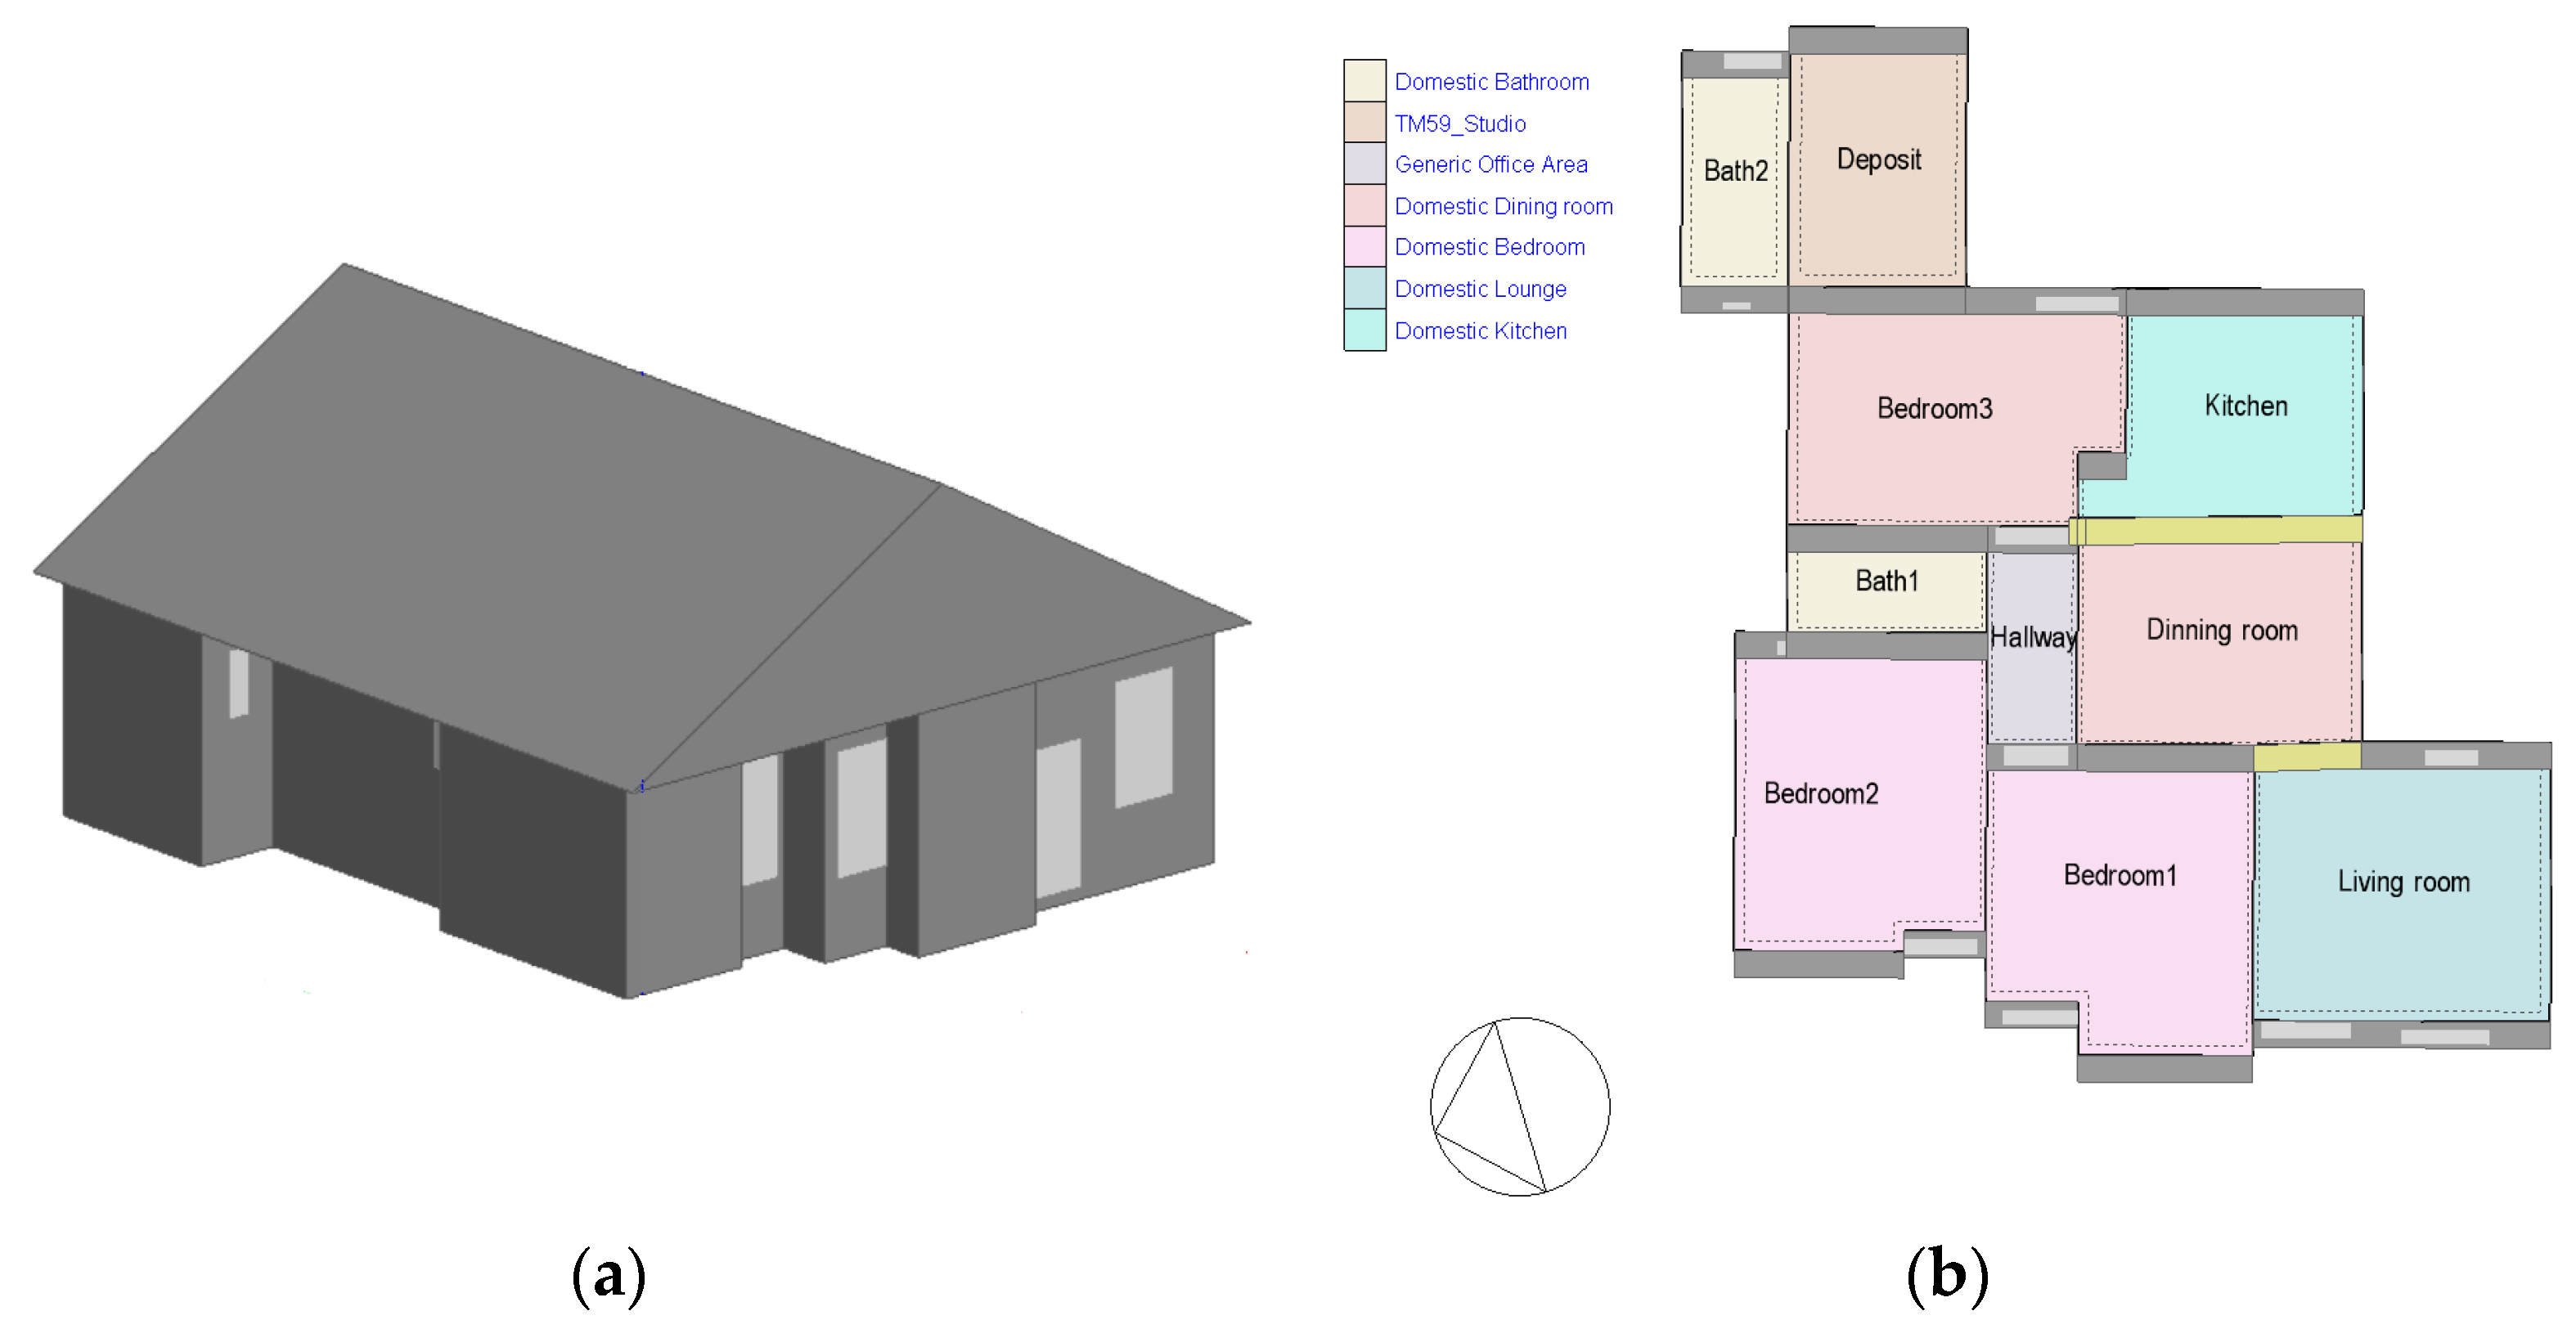
2.1. Description of the Case Study

The survey tool was used to determine the occupancy profile in Panama. The applied survey provided quantitative and qualitative information through open and closed questions regarding occupancy hours; closed because most of the questions are accompanied by a series of possible answers, where one or more than one must be selected. The surveys correspond to those applied in [20]. The surveys were applied during the COVID-19 pandemic.

2.2. Survey

The survey was distributed via email and answered by forty participants and comprised a set of forty-three questions divided into three sections, each with different approaches, for a greater scope of the areas competent to the performance of occupant behavior. Described below:
  • General characteristics of the building and the occupants correspond to the first section, which included 17 questions that sought to know the number of people living in the residences, their ages, and monthly income. As for the building aspects: year of construction, area, years of construction, and materials that make up the windows, walls, doors, and roof.
  • Ventilation and refrigeration systems: focused on knowing the amount of air conditioning equipment and fans. It comprises 11 questions.
  • Water heater and use of gas and electrical items: it consisted of 15 questions, which allow us to know the number of appliances and their period of use, the average monthly energy consumption of the house, and the month where it is higher.

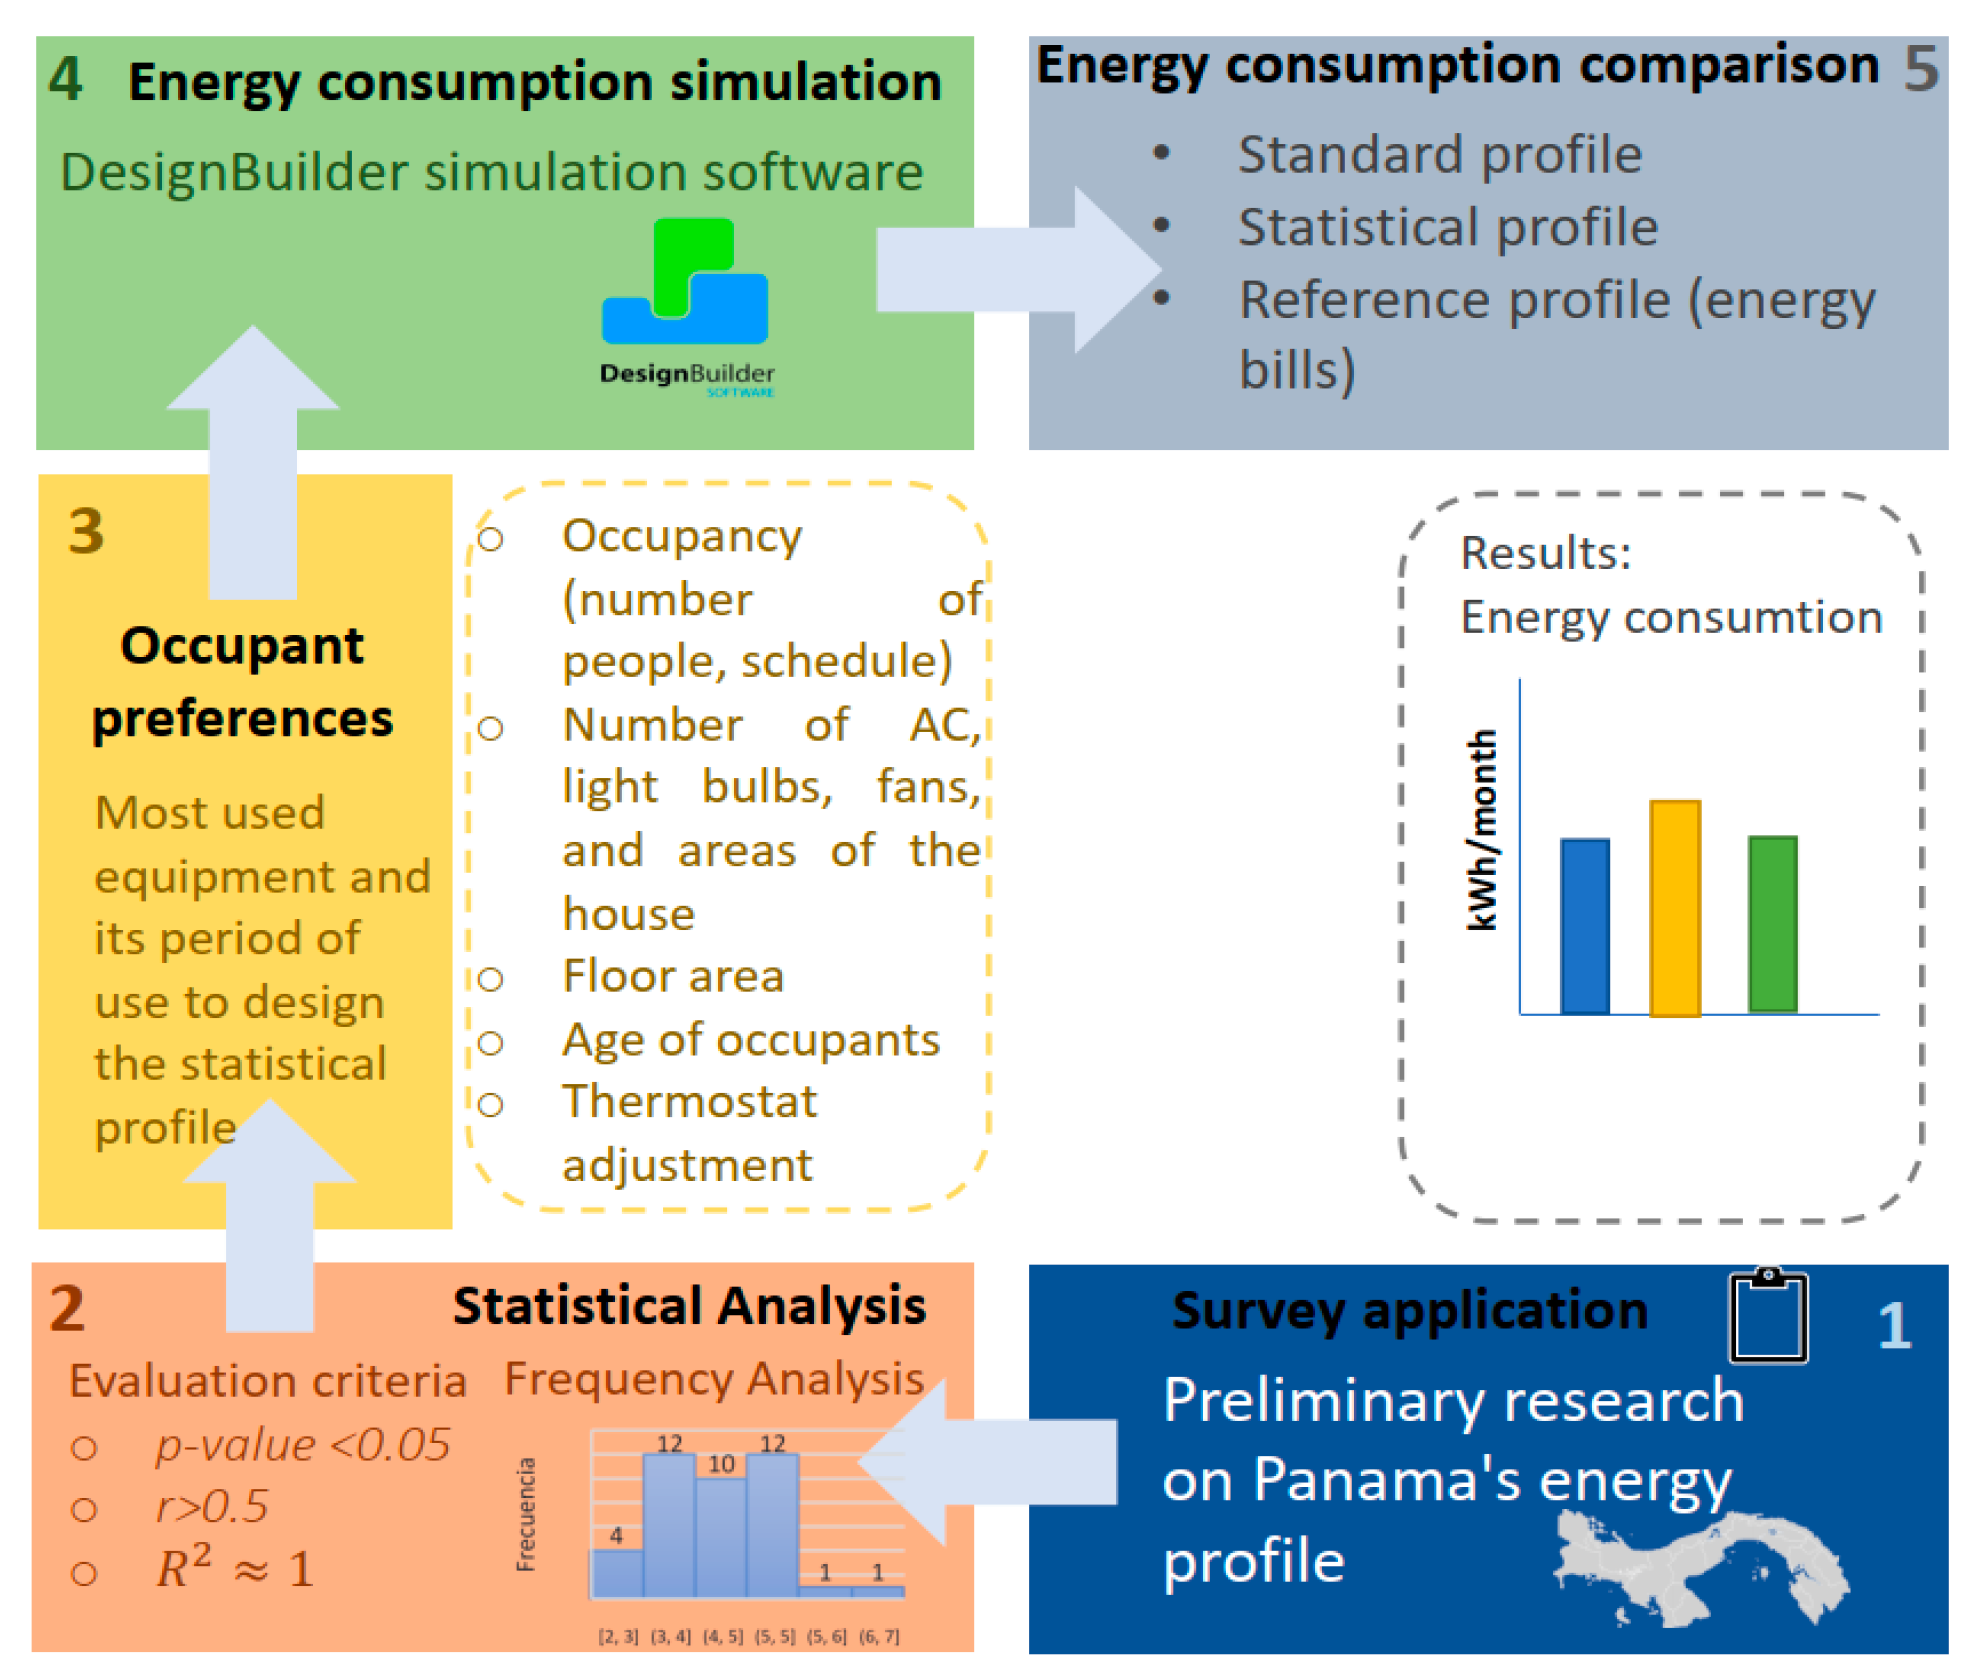
2.3. Typical Occupant Behavior Estimation
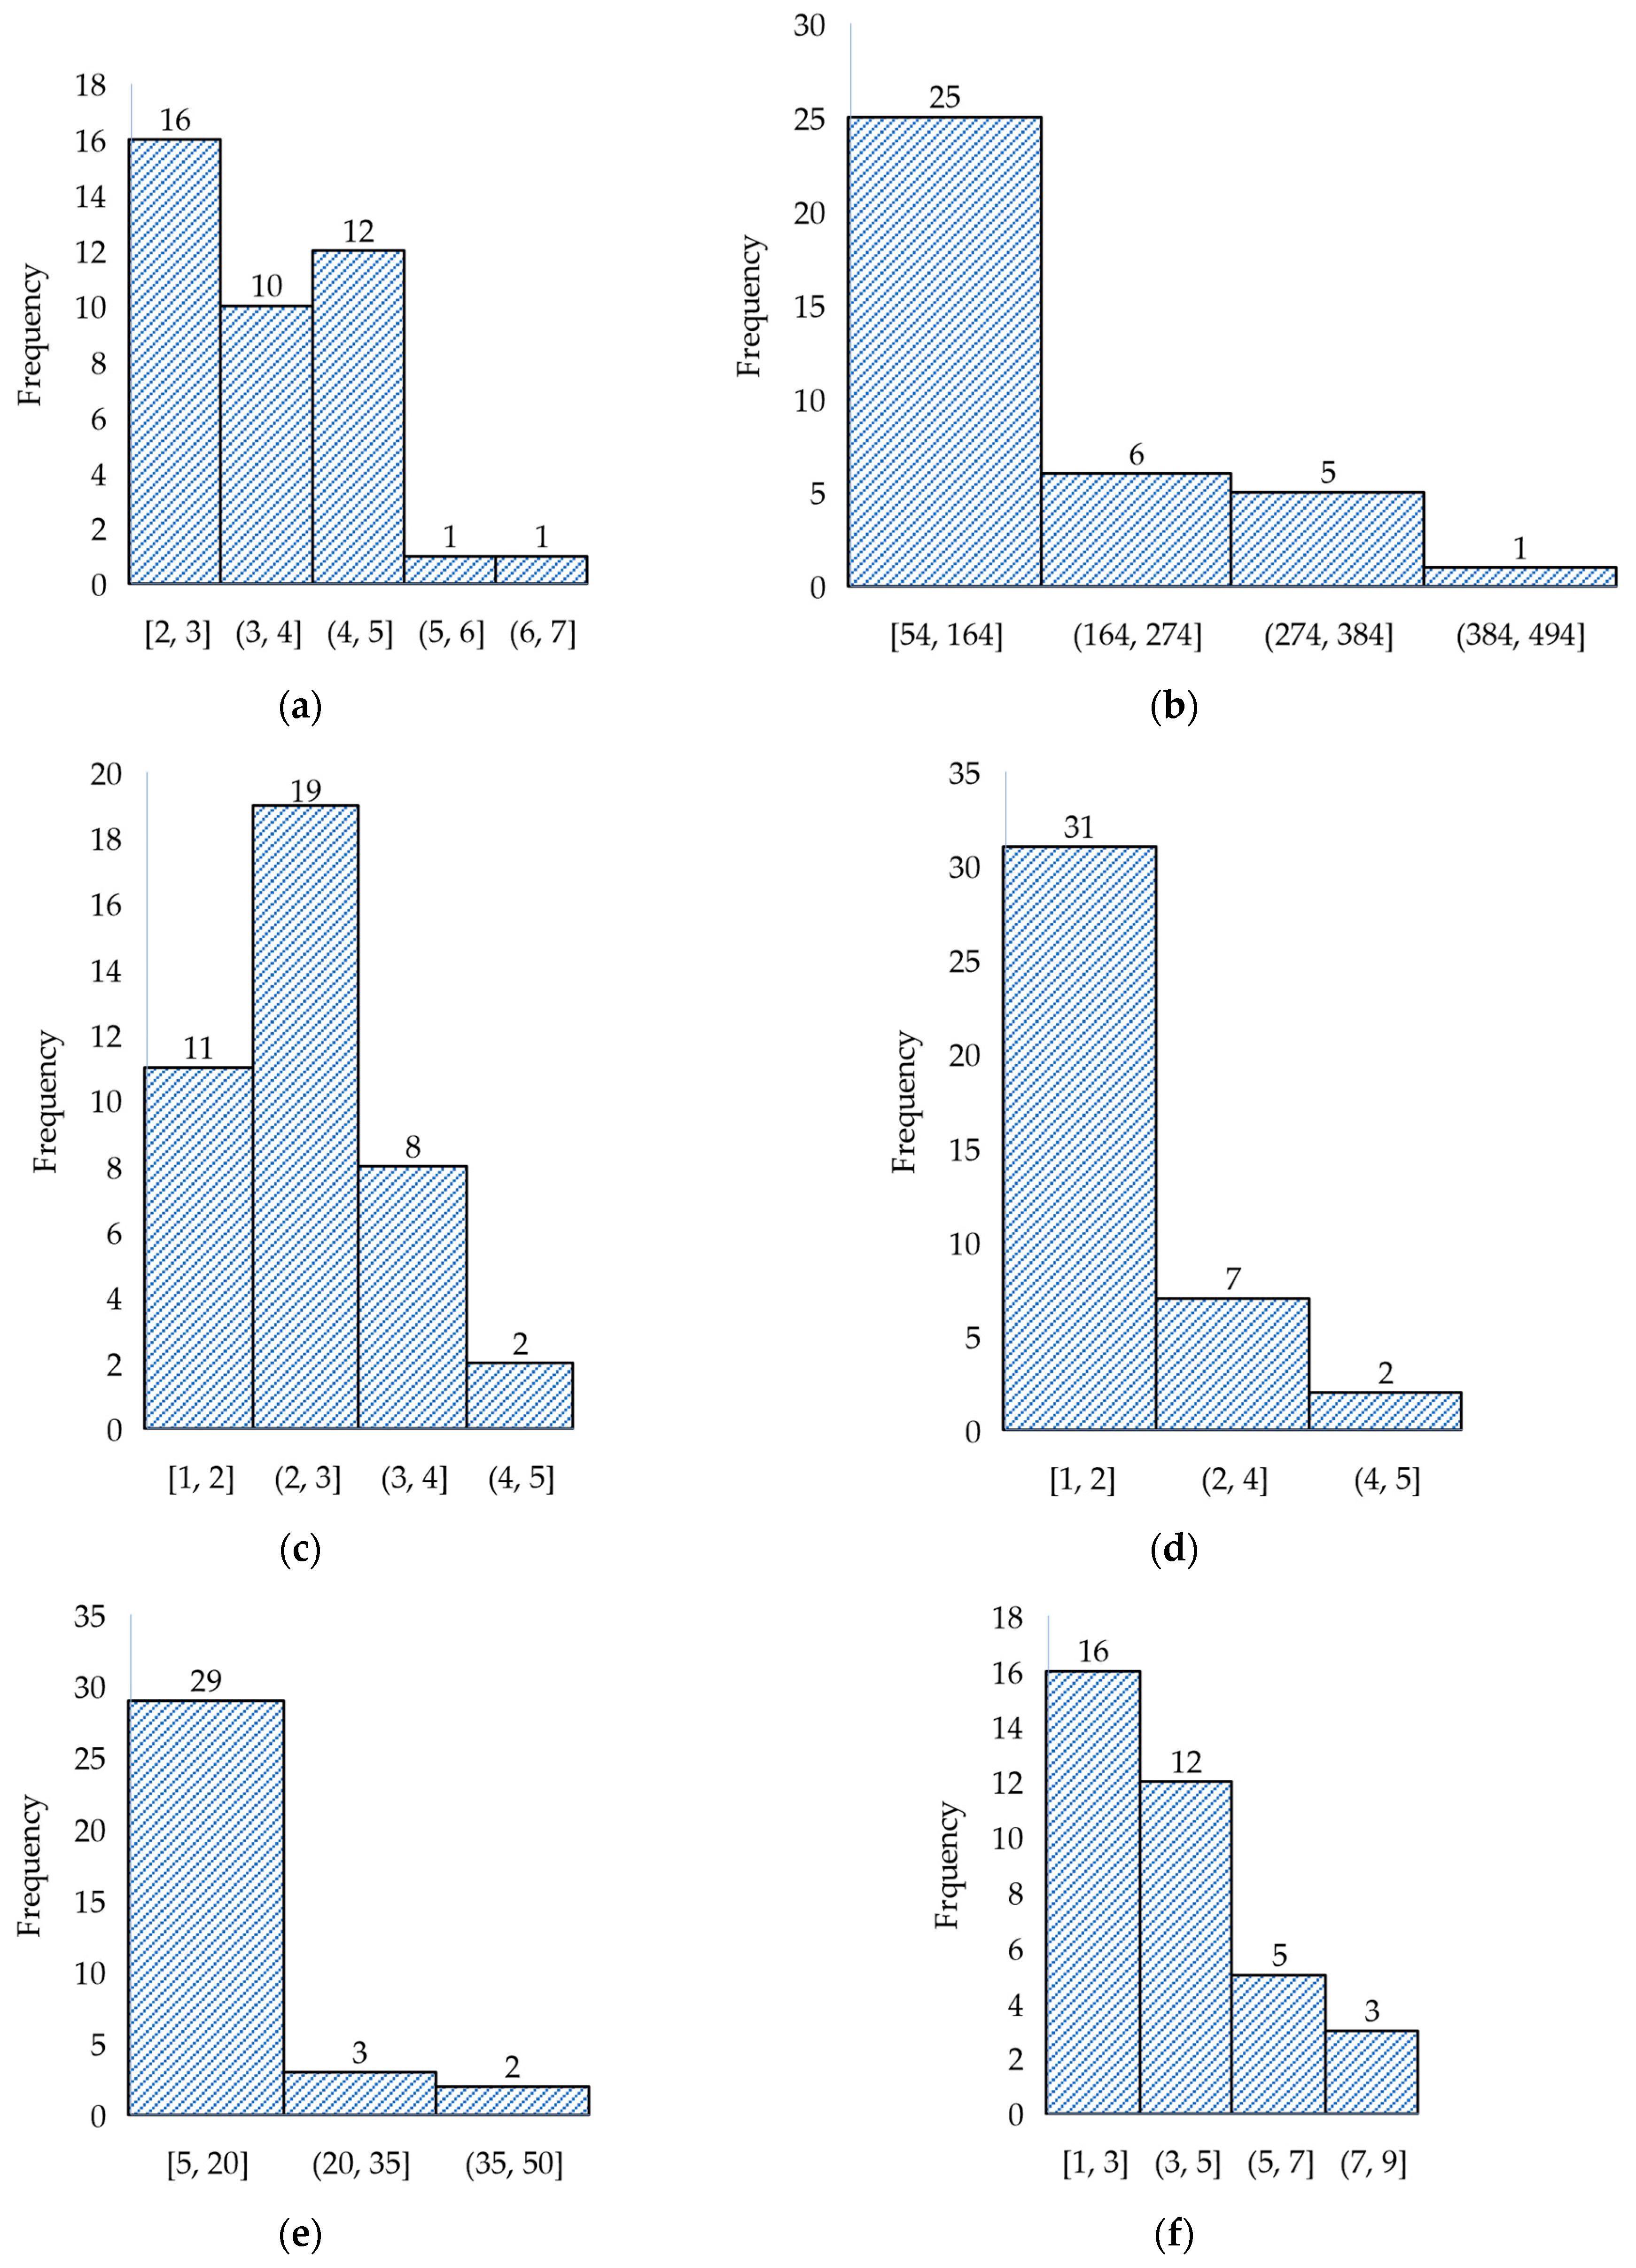
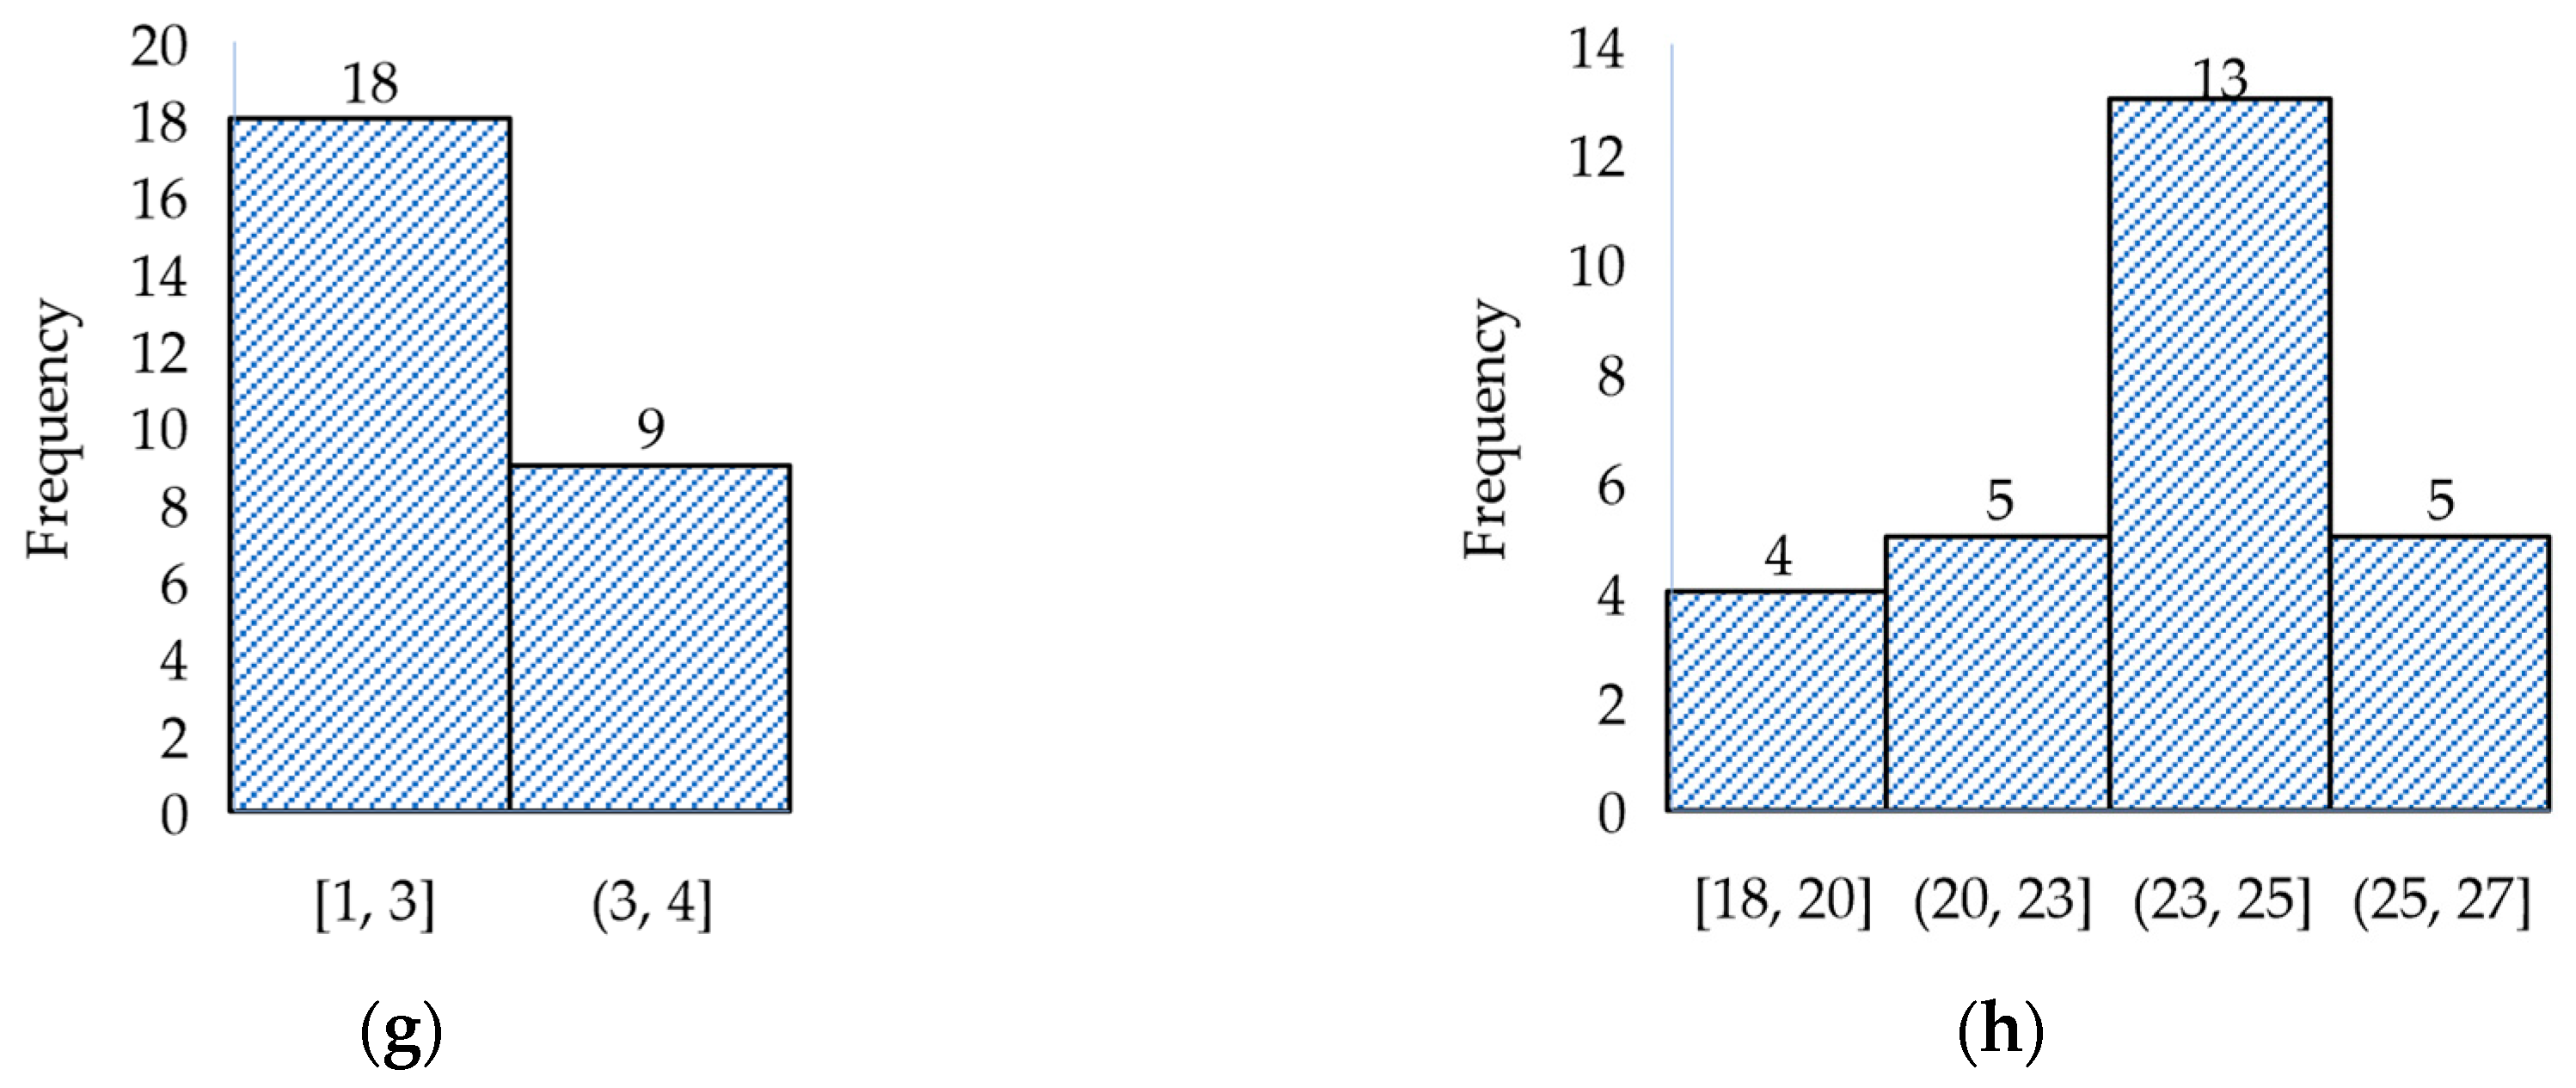
The occupant behavior estimation was carried out through the statistical analysis of the applied surveys. Arithmetic average and frequency analysis were considered two methods to estimate occupant behavior. The first refers to the sum of the data analyzed, subsequently divided into the amount of these [21,22], and the second is represented by bar graphs called histograms, where above the horizontal axis, the bars are raised to a certain level that will be proportional to the frequency, that is, it increases or decreases depending on the frequency [23].

Frequency Analysis

The frequency analysis results were considered by means of two methods: frequency average and frequency mode. This is because the dispersion of the data can be wide; in this case, the range of data was considered most frequently and performed a modal analysis. For cases with reduced data dispersion, the mean was performed in those ranges [24]. We proceed to the substitution in Equations (1) and (2) below for this. The mean value is calculated using Equation (1).
x ¯ = i = 1 c f i m i n
where c is the number of intervals in the data pool, f i is the absolute frequency of each interval, m i is the average distance between the extreme values of each interval, better known as class the mark, and n represents the amount of data processed.
For the mode (MO), the modal interval must be determined. This corresponds to the one value that has an absolute frequency or frequency density (in the case that the amplitude of intervals varies) greater than the other intervals [24] and is defined by Equation (2):
M O = L M O + f i f i 1 f i f i + 1 + f i f i 1 ·
L M O is the lower limit of the selected interval; f i 1 and f i + 1 are the absolute frequency that precedes and continues to the absolute frequency with greater density ( f i ), respectively. Finally, ∆ represents the difference between the maximum and minimum limit of the modal range.

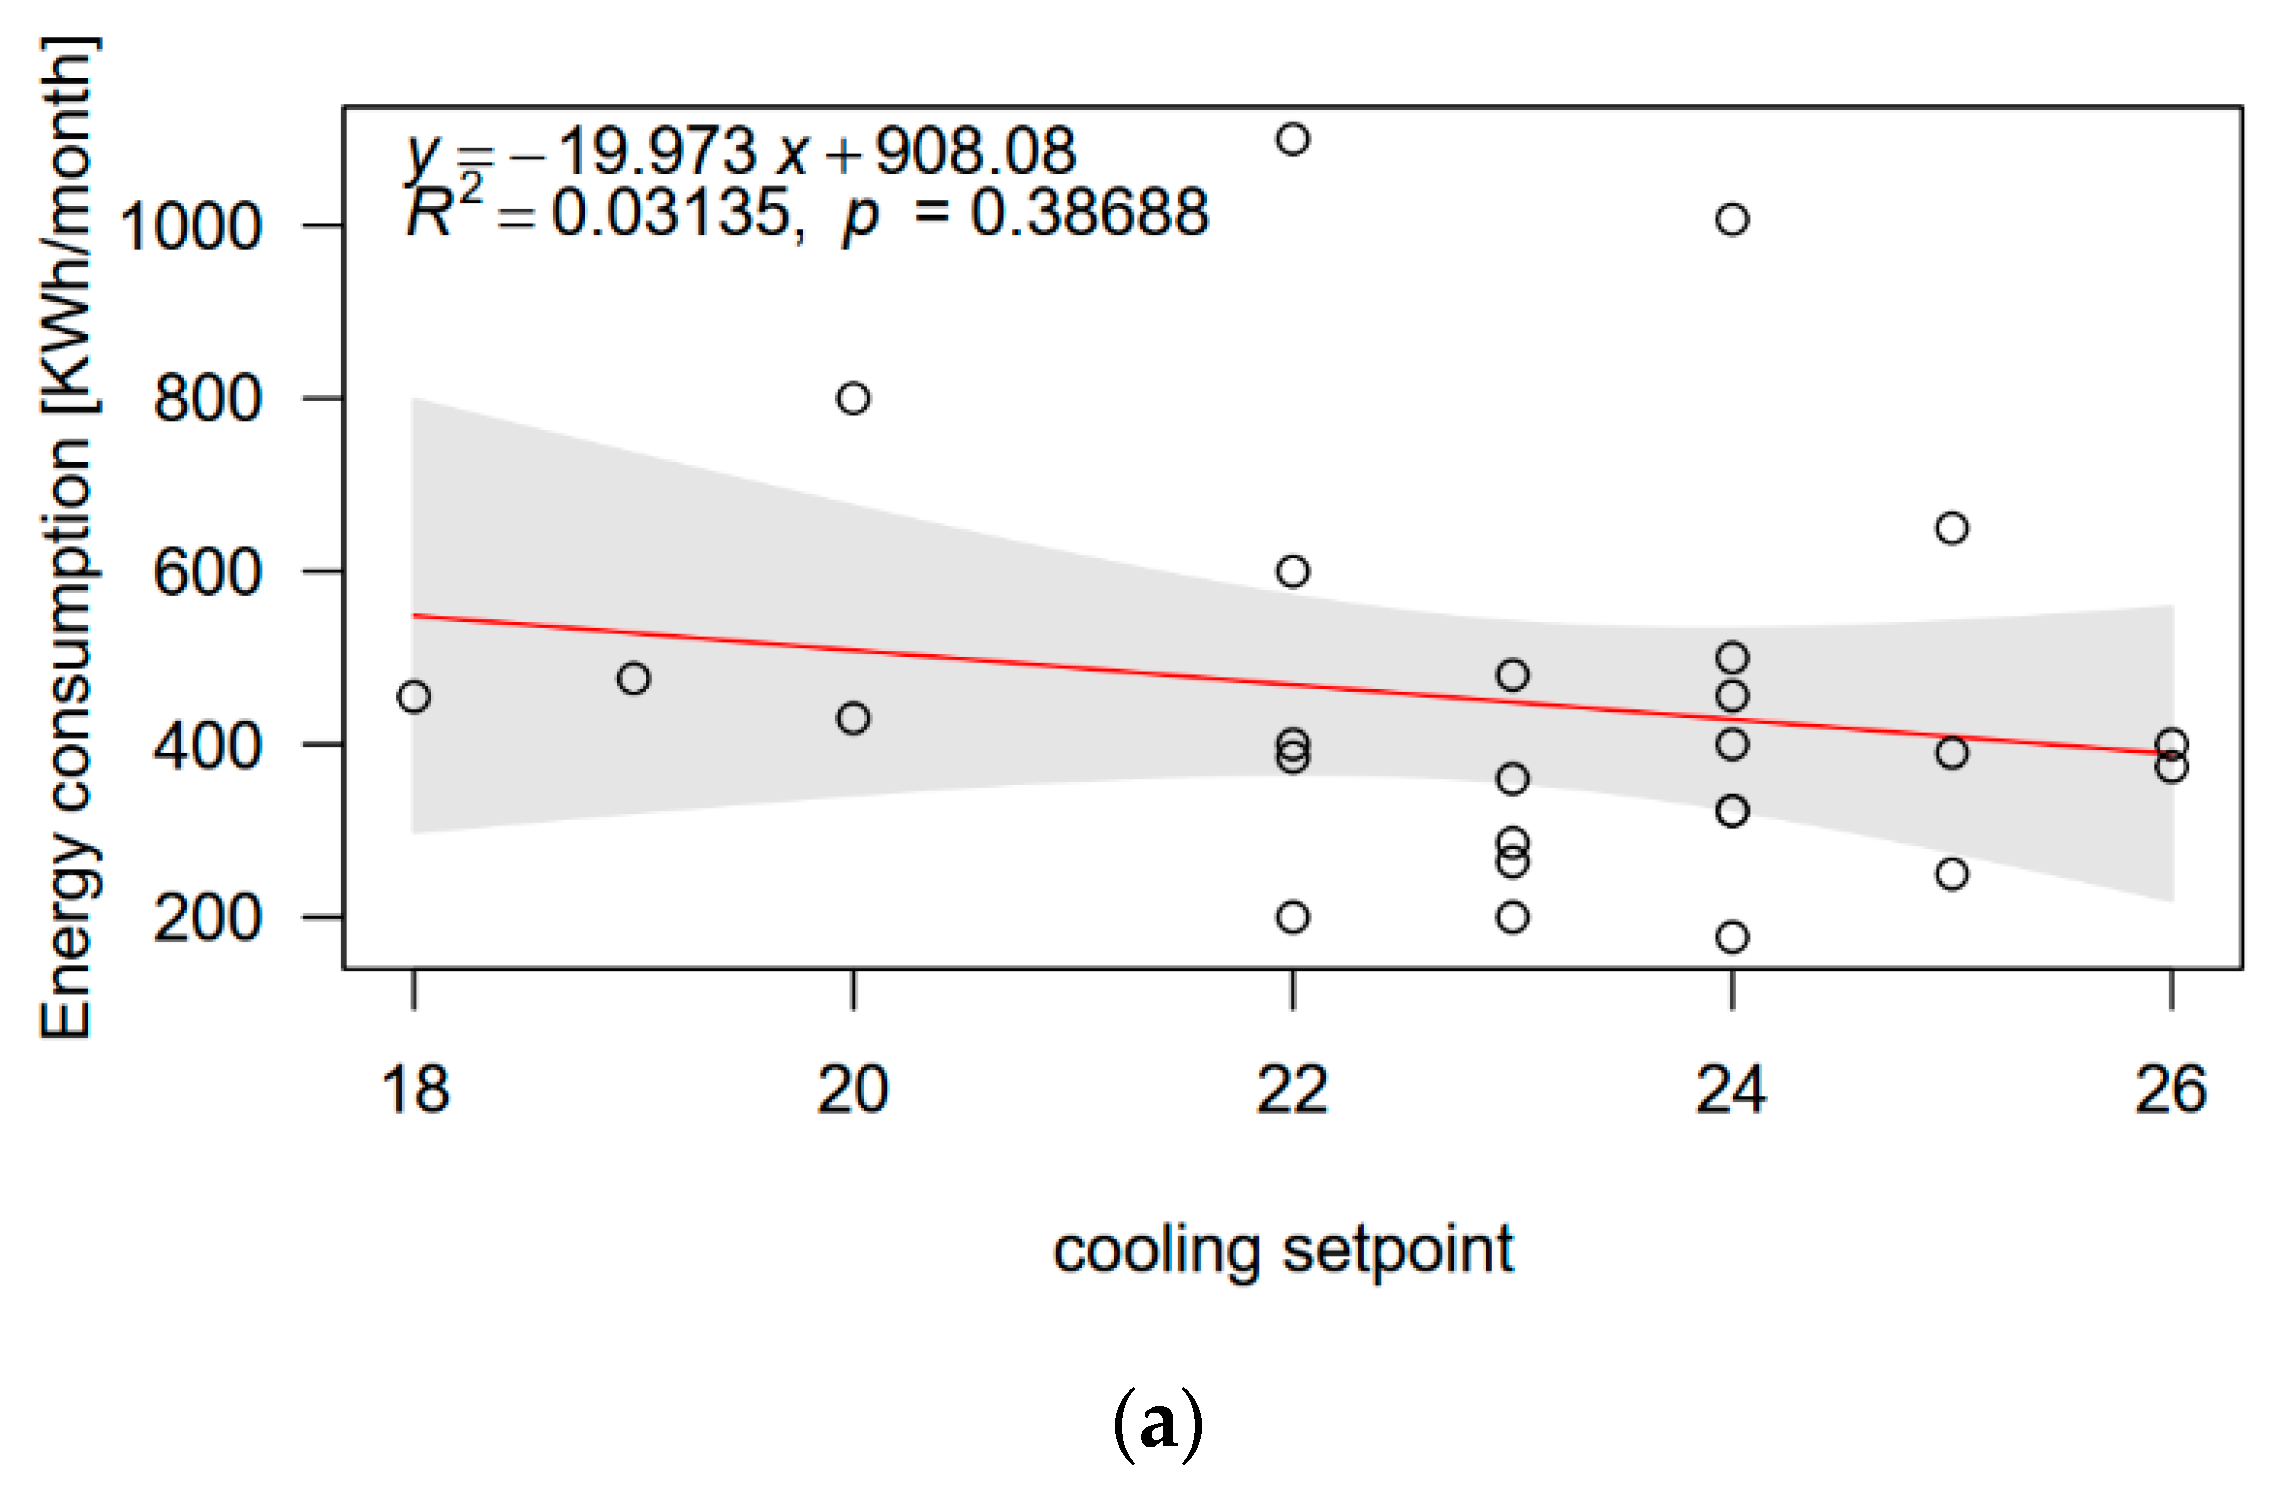
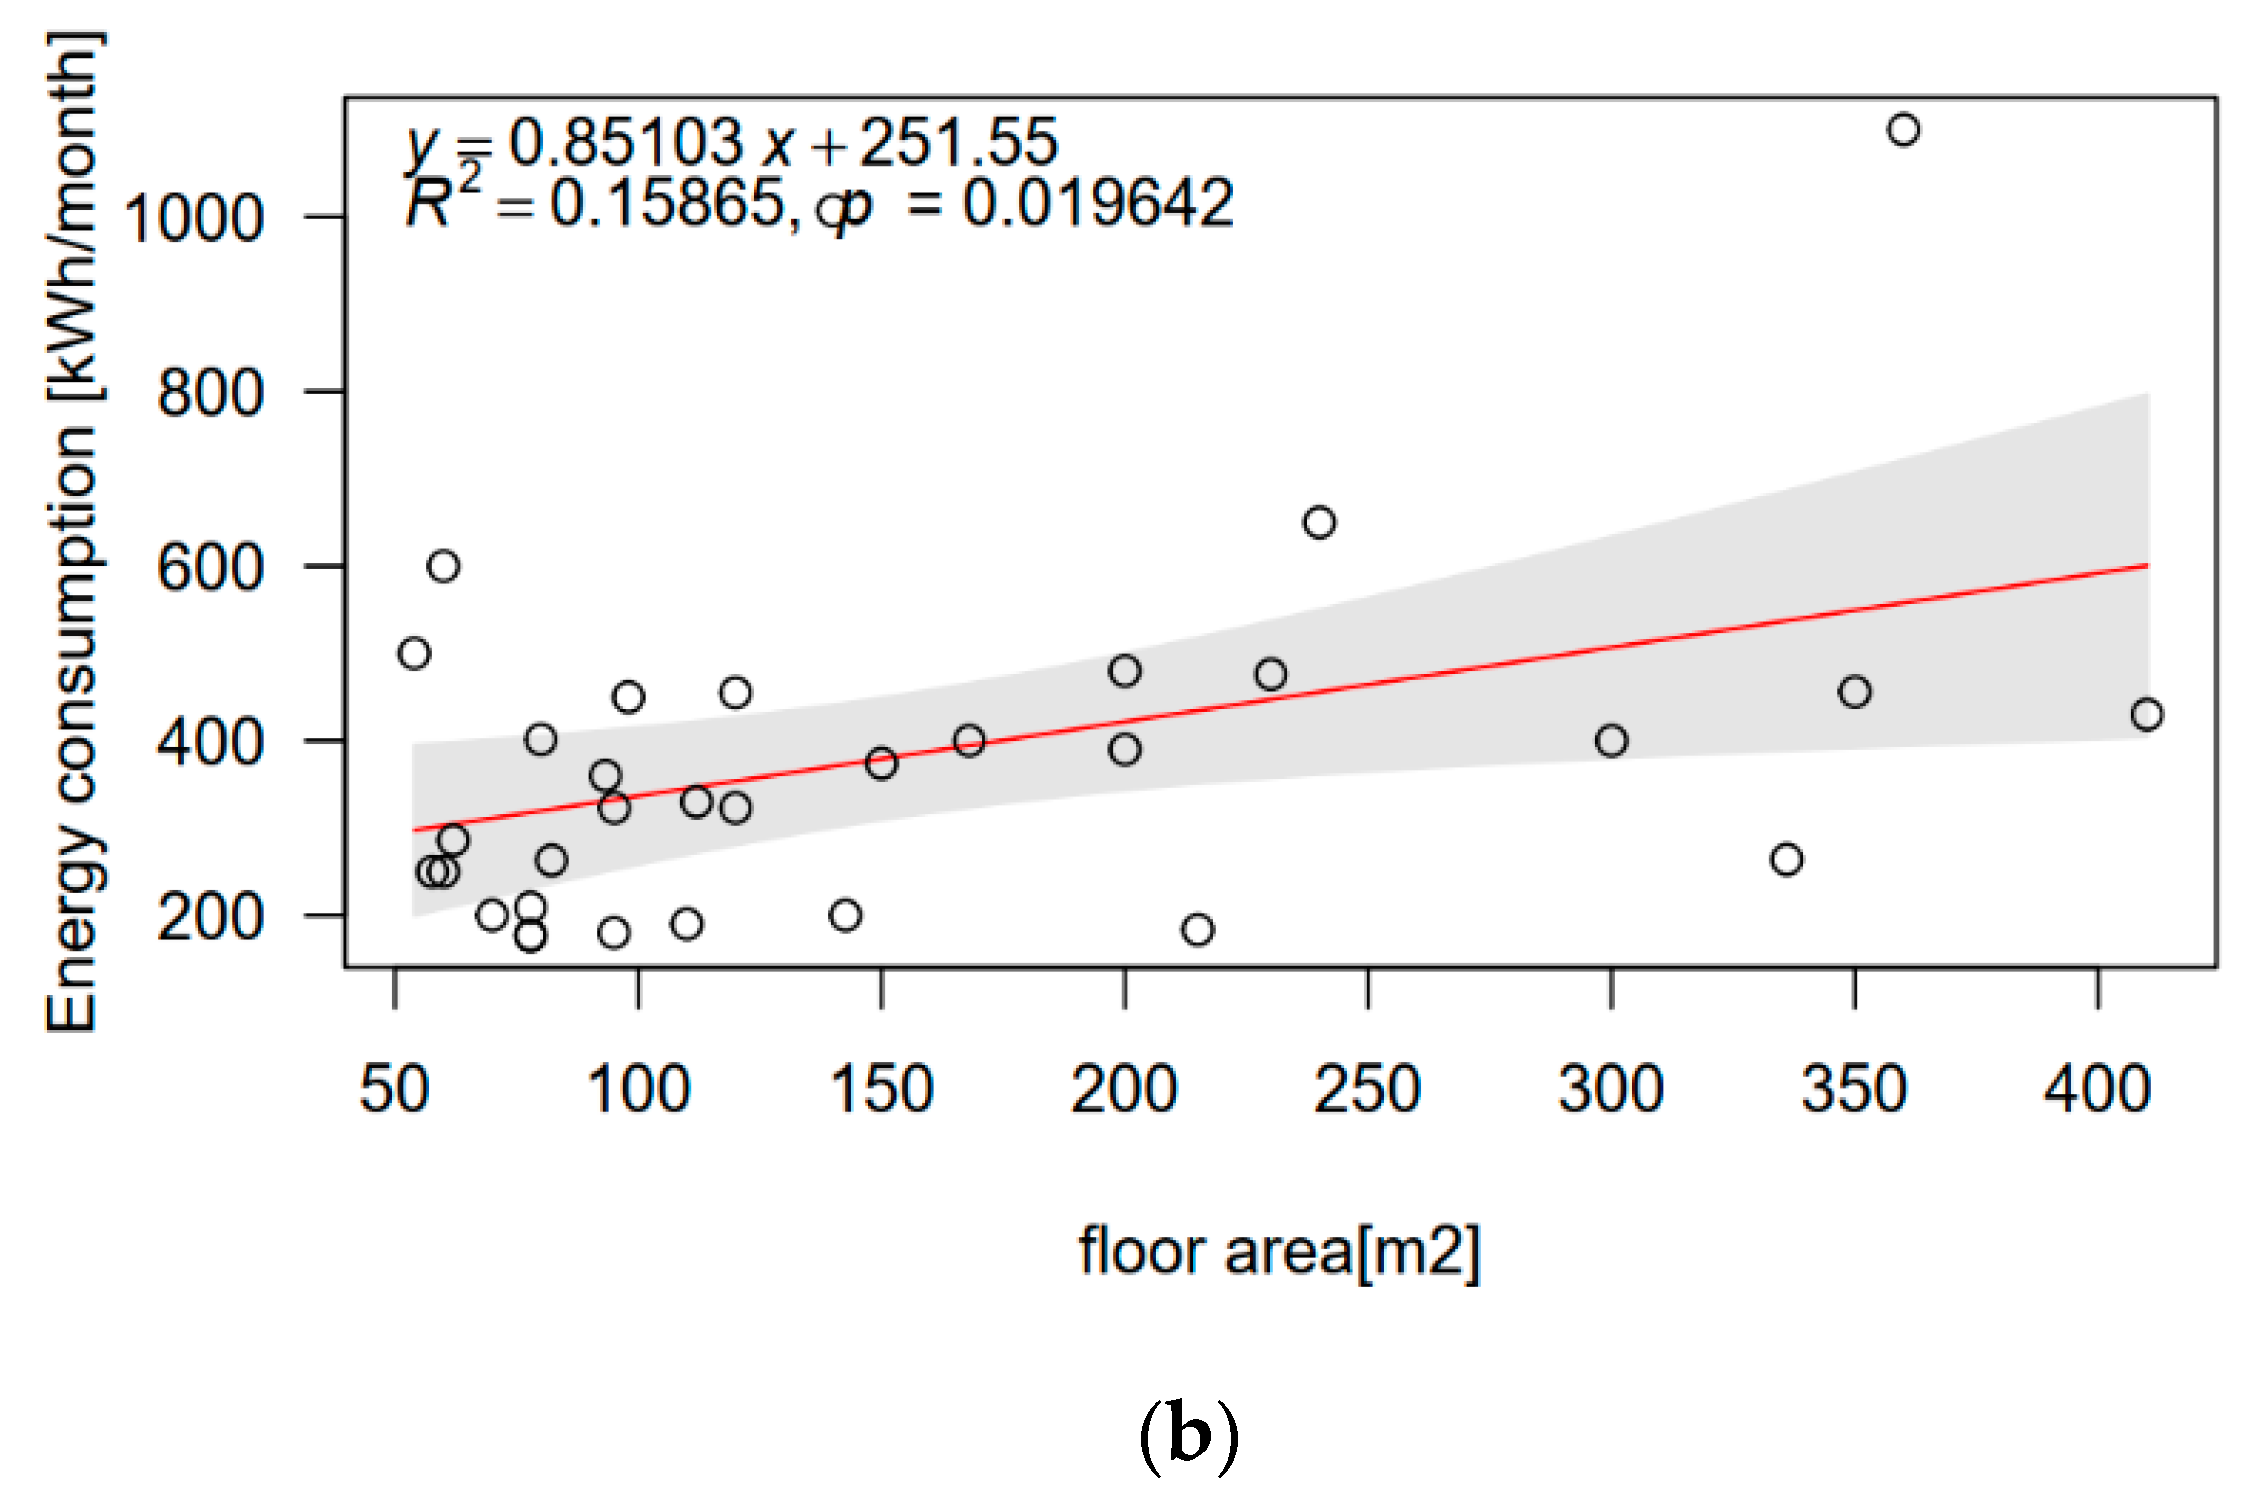
2.4. Dependence on Energy Consumption through Correlation Analysis

Implementing the RStudio software 1.4.1106, a statistical analysis was performed to determine the influence of certain parameters on energy consumption. Such parameters were taken from the literature [15,25]: number of occupants, air conditioning (AC), light bulbs, fans, zones of the house, floor area, age of occupants, and thermostat adjustment.
The indicators evaluated the parameters which were the determination coefficient R2 > 0.5, the Pearson correlation coefficient r > 0.5, and the p-value < 0.05. The first indicator was implemented to make predictions regarding energy consumption, the second identified the correlation between energy consumption and the parameters chosen, and finally, the third measured the significance of the correlation results.

2.5. Comparison of Typical and Standard Occupant Behavior

Using DesignBuilder software v.6.1.6.11 (based on the EnergyPlus engine), it was possible to compare energy consumption between standard, statistical (customized) profiles and the energy consumption indicated by the surveys, validated by the electricity bill. For the simulation of the different profiles, a 3D model of a house located in Panama was implemented, specifically in the province of Herrera, district of Chitre (Figure 2). It has a floor area of 80.9 m2 and ceiling height of 3 m. As for the exterior glazed area, there are 11.85 m2. Description of building materials is shown in Table 1. The climate classification for this region, according to the Köppen–Geiger classification, is tropical savannah (Awi) climate.
The 3D model inputs were the meteorological data, construction materials, occupancy (number of people and schedule), appliances and air conditioning usage, temperature setpoint, and windows state.
The comparison of energy consumption consisted of the study of the following different profiles:
  • Standard criteria: Standard data provided by the energy software were used, those generated by DesignBuilder and those established by ASHRAE 90.1. The simulations were carried out over a year, and through frequency analysis, the consumption pattern in that year was determined for each standard criterion considered.
  • Statistical profile: The survey responses were processed by modal and mean analysis to obtain a single profile. Then, it was introduced in the software to define energy consumption. This value was compared with real energy consumption.
  • Real energy consumption: In the applied surveys, energy consumption values were recorded and processed through histograms to define a consumption pattern and correspond to the reference consumption of this research. The values registered were taken from the electricity bill of the respondents.
The energy consumption values were compared to determine the differences between implementing standard and customized criteria.

2.6. Energy Consumption Comparison Evaluating the Thermal Comfort and Variation of the Air Conditioning Temperature and a Retrofitted House

In Panama, the regulation of sustainable buildings (RES for its acronym in Spanish) is governed [26], showing a series of requirements to design and build homes to improve thermal comfort and reduce energy consumption.
The Sustainable Building Regulations (RES) include the following parameters:
  • U Wall = 0.47 W/m2 K;
  • U Ceiling = 0.46 W/m2 K;
  • Window glazing conductivity = 0.9 W/m K.
This part of the research seeks to evaluate the thermal comfort in the air conditioning areas while adjusting their temperature and generating different energy consumption (for each adjustment). These are compared with the energy consumption corresponding to a residence designed as the RES indicates to analyze the impact of occupant behavior (thermostat setting) and the impact of a design that should favor energy savings.

3. Results Analysis

This section provides information on the results of the different phases carried out in the project. First, the tabulation of applied surveys, followed by their respective analysis using statistical methods, thus reflecting the energy consumption by the analysis of surveys and the comparison with other profiles.

3.1. Tabulation of Survey Results

Table 2 shows the amount of selection of each answer concerning multiple-choice questions or closed answers.
Regarding open responses, these were graphically captured using histograms. Figure 3a–f defines the houses’ compositions regarding certain equipment and the number of rooms and bathrooms. For houses with air conditioning (AC), Figure 3g,h were considered. The histograms were processed by the Equation (2).
Table 3 shows the results generated by analyzing the frequency of the variables presented in Figure 3. The Equations (1) and (2) were implemented.
Frequency analysis is performed to determine the energy consumption resulting from the energy consumption dataset indicated by respondents who have AC. This is shown in Figure 4. When calculating the mode, the resulting energy consumption is 404.5 kWh/month, applying the mode analysis.
Figure 4b shows the histogram of the energy consumption captured by respondents who said they did not have AC; to determine the most frequent value, through the statistical analysis of fashion, it is determined that this consumption is: 217.86 kWh.
Figure 5 shows the comfort perception results of those who have AC. The use of this cooling system reaches the position “Very pleasant” by most respondents 54%, while 25% also have a satisfactory position selecting “Pleasant” and 10% as “Neutral”; that is, when using the AC, there is no condition of dissatisfaction. However, when 33% decide not to use AC, they are in an unpleasant position.
Humidity meets the dissatisfaction of almost a third of respondents, which may be because Panama is a country with high humidity levels. The rest of the respondents do not manifest greater discomfort, and it may be because 44.5% of respondents who use AC use it in “cool” mode, including dehumidifying the air in the enclosure.
When using the fan (either ceiling or wall mounted), the same phenomenon happens as when using AC; there are only perceptions of “Pleasant”, “Very Pleasant”, and “Neutral”, with 50%, 11%, and 39%, respectively. But it does not reach such high numbers in the first two, as in the case of the use of AC. On the contrary, by not using a fan, there is only “Very unpleasant” conditions, 25%, and 36% as “Unpleasant.” The perception of the state of dissatisfaction takes this equipment to indispensable use, above the AC, to channel comfort to a better level.
Natural ventilation is more inclined towards satisfactory perception but not more than using a fan and AC. Also, this condition is viable when the AC is in off mode. It is likely that natural ventilation will not be frequently used during the summer, and AC can provide satisfaction when the temperature begins to rise or is accompanied by the application of the fan. This limits the possibility of knowing the occupant’s comfort under natural ventilation only in the summer. However, it is worth noting that natural ventilation alone is a viable option under shade and favorable winds. The perception of sunlight presents similar percentages in the implementation of natural ventilation, which may be related to the insertion of sunlight into the enclosure when natural ventilation is enabled, and the presence of natural lighting in the enclosure can be counted as a preference at this time.
Figure 6 shows the occupant’s comfort level without air conditioning. The perception of “Very unpleasant” is remarkable, with 43% when not using the fan, coinciding with the analysis of Figure 5, and it is reiterated that its function is essential to have acceptable comfort. Results show that 64% indicated a “Pleasant” feeling when using the fan, above the use of natural ventilation (or just ventilation), which in turn has “Unpleasant” conditions. The humidity does not register an “Unpleasant” condition as large as in Figure 5. This may be due to the adaptation mechanism they could be acquired by only having a fan as a ventilation system. When analyzing natural ventilation, it is classified as “Unpleasant” by 43%, and is proportional to “Very unpleasant” when not using the fan; this is a limitation if the respondent interprets natural ventilation as a substitute for a fan instead of both. Thus, indicating that natural ventilation would not be enough.

3.2. Typical Occupant Behavior Estimation for the Case Study

This subsection shows the statistical analysis implemented to identify occupant preferences. The factors considered were the number of occupants (X1), air conditioning (AC) (X2), light bulbs (X3), fans (X4), areas of the house (X5), floor area (X6), age of occupants (X7), thermostat adjustment (X10). This section seeks to find the behavior of energy consumption depending on the occupant’s preferences as far as the use of appliances is concerned [27].
Pearson’s coefficient, r, must be greater than 0.5 to meet a positive correlation. In Figure 7, the number of occupants X1, air conditioning X2, light bulbs X3, fans X4, and sections of the house X5 influence energy consumption; that is, as these numbers grow, consumption also increases.
However, energy consumption is also influenced by the temperature chosen for the air conditioning and by the floor area of the house, so the linear regression statistical analysis is performed. In Figure 8a, despite not complying with the linear regression coefficient value R2 and the p-value, the slight trend of decrease in energy consumption can be visualized by increasing the temperature assigned to the air conditioning since, by decreasing the temperature difference between the exterior and that of the enclosure, consumption is reduced. The opposite effect occurs in Figure 8b, where the trend of increasing energy consumption is seen as the floor area of the house is larger since, in turn, this increases the possibility of acquiring equipment or a greater number of occupants.

3.3. Comparison of Occupant Behavior: Resulting Profiles for Simulation

This section shows the periods of use of equipment and occupancy percentages for the different profiles studied.

3.3.1. Statistical Profile

The statistical profile corresponds to a personalized deterministic profile. The periods of equipment use and occupancy are shown in Table 4 and apply to homes with AC or without AC.

3.3.2. Standard Profile

DesignBuilder: Table 5 shows the periods of equipment use and occupancy, and applies them to homes with AC or without AC.
The ASHRAE 90.1 profile: Table 6 shows the periods of equipment use and occupancy, and applies them to homes with AC or without AC.

3.4. Energy Consumption Comparison: Profile Evaluations

This section compares the energy consumption recorded in the simulation runs for each profile (statistical, the standard by ASHRAE 90.1, the standard by DesignBuilder domestic templates).

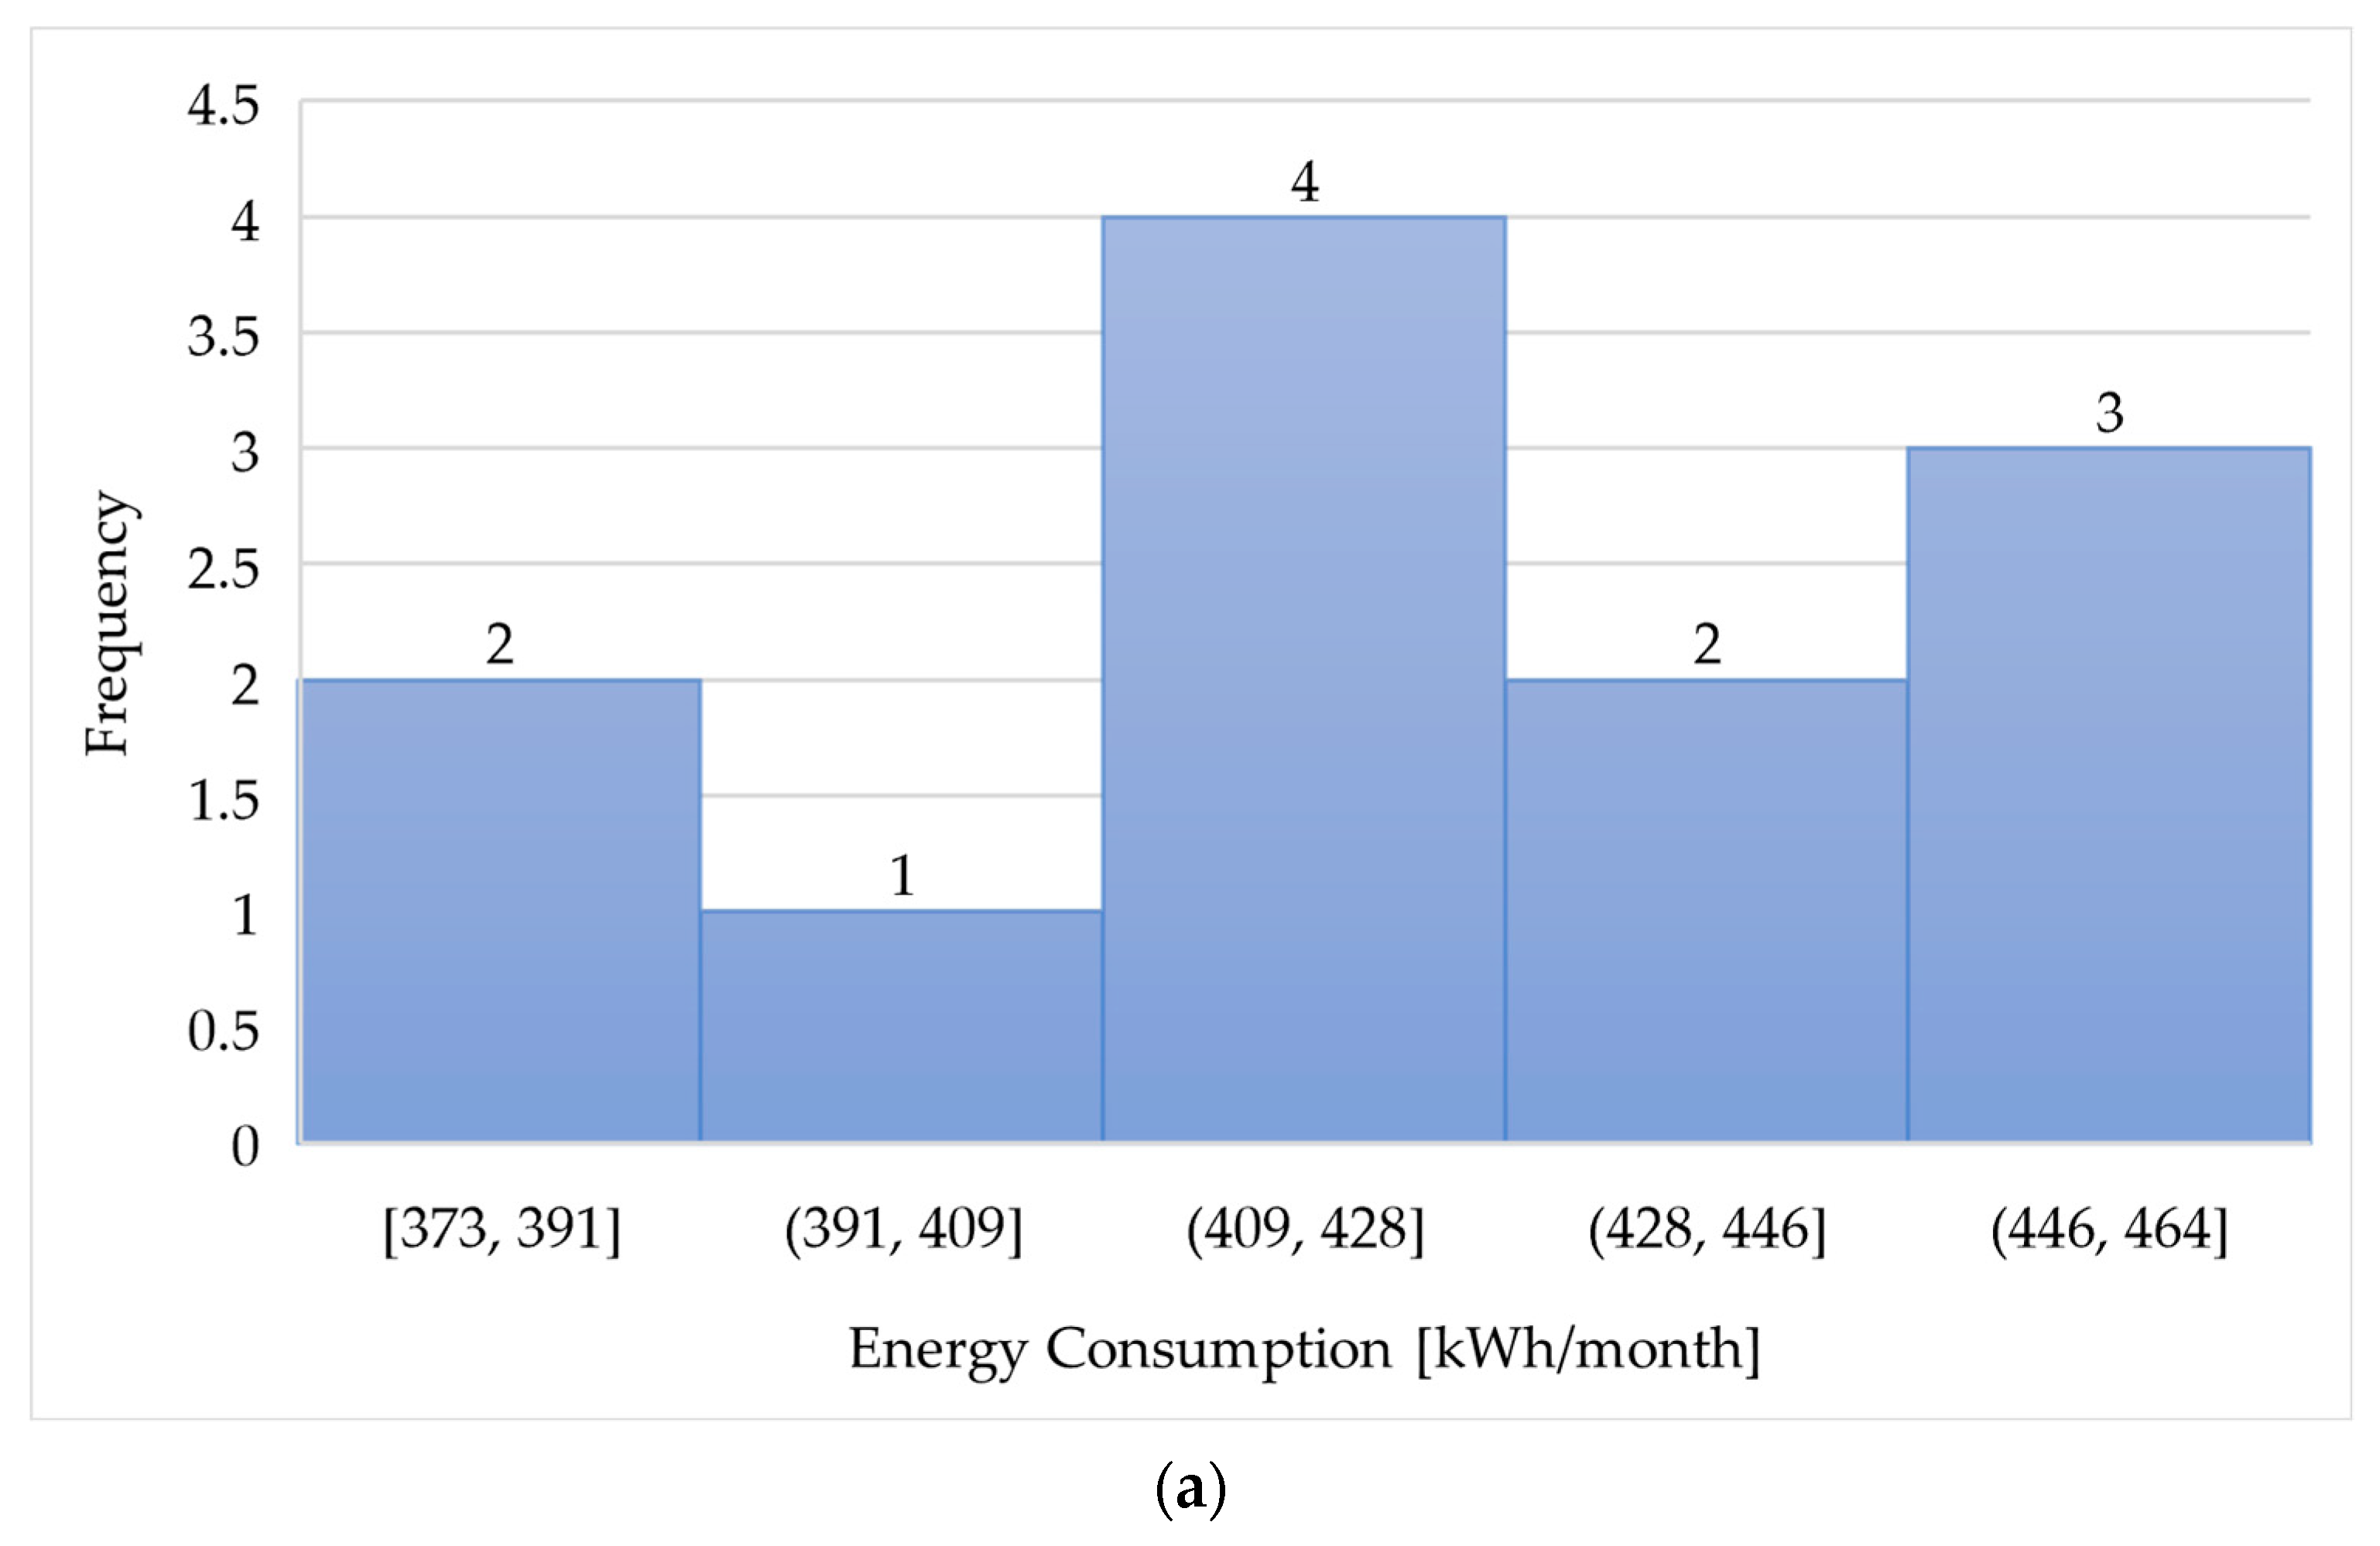
3.4.1. Histogram Analysis (Houses with AC)

Figure 9 presents the resulting monthly energy consumption values, using histograms to highlight the frequency of the energy consumption values of the homes with AC when using the statistical profile (Figure 9a), the standard profile from ASHRAE 90.1 (Figure 9b), and the standard profile from Designbuilder domestic templates (Figure 9c).

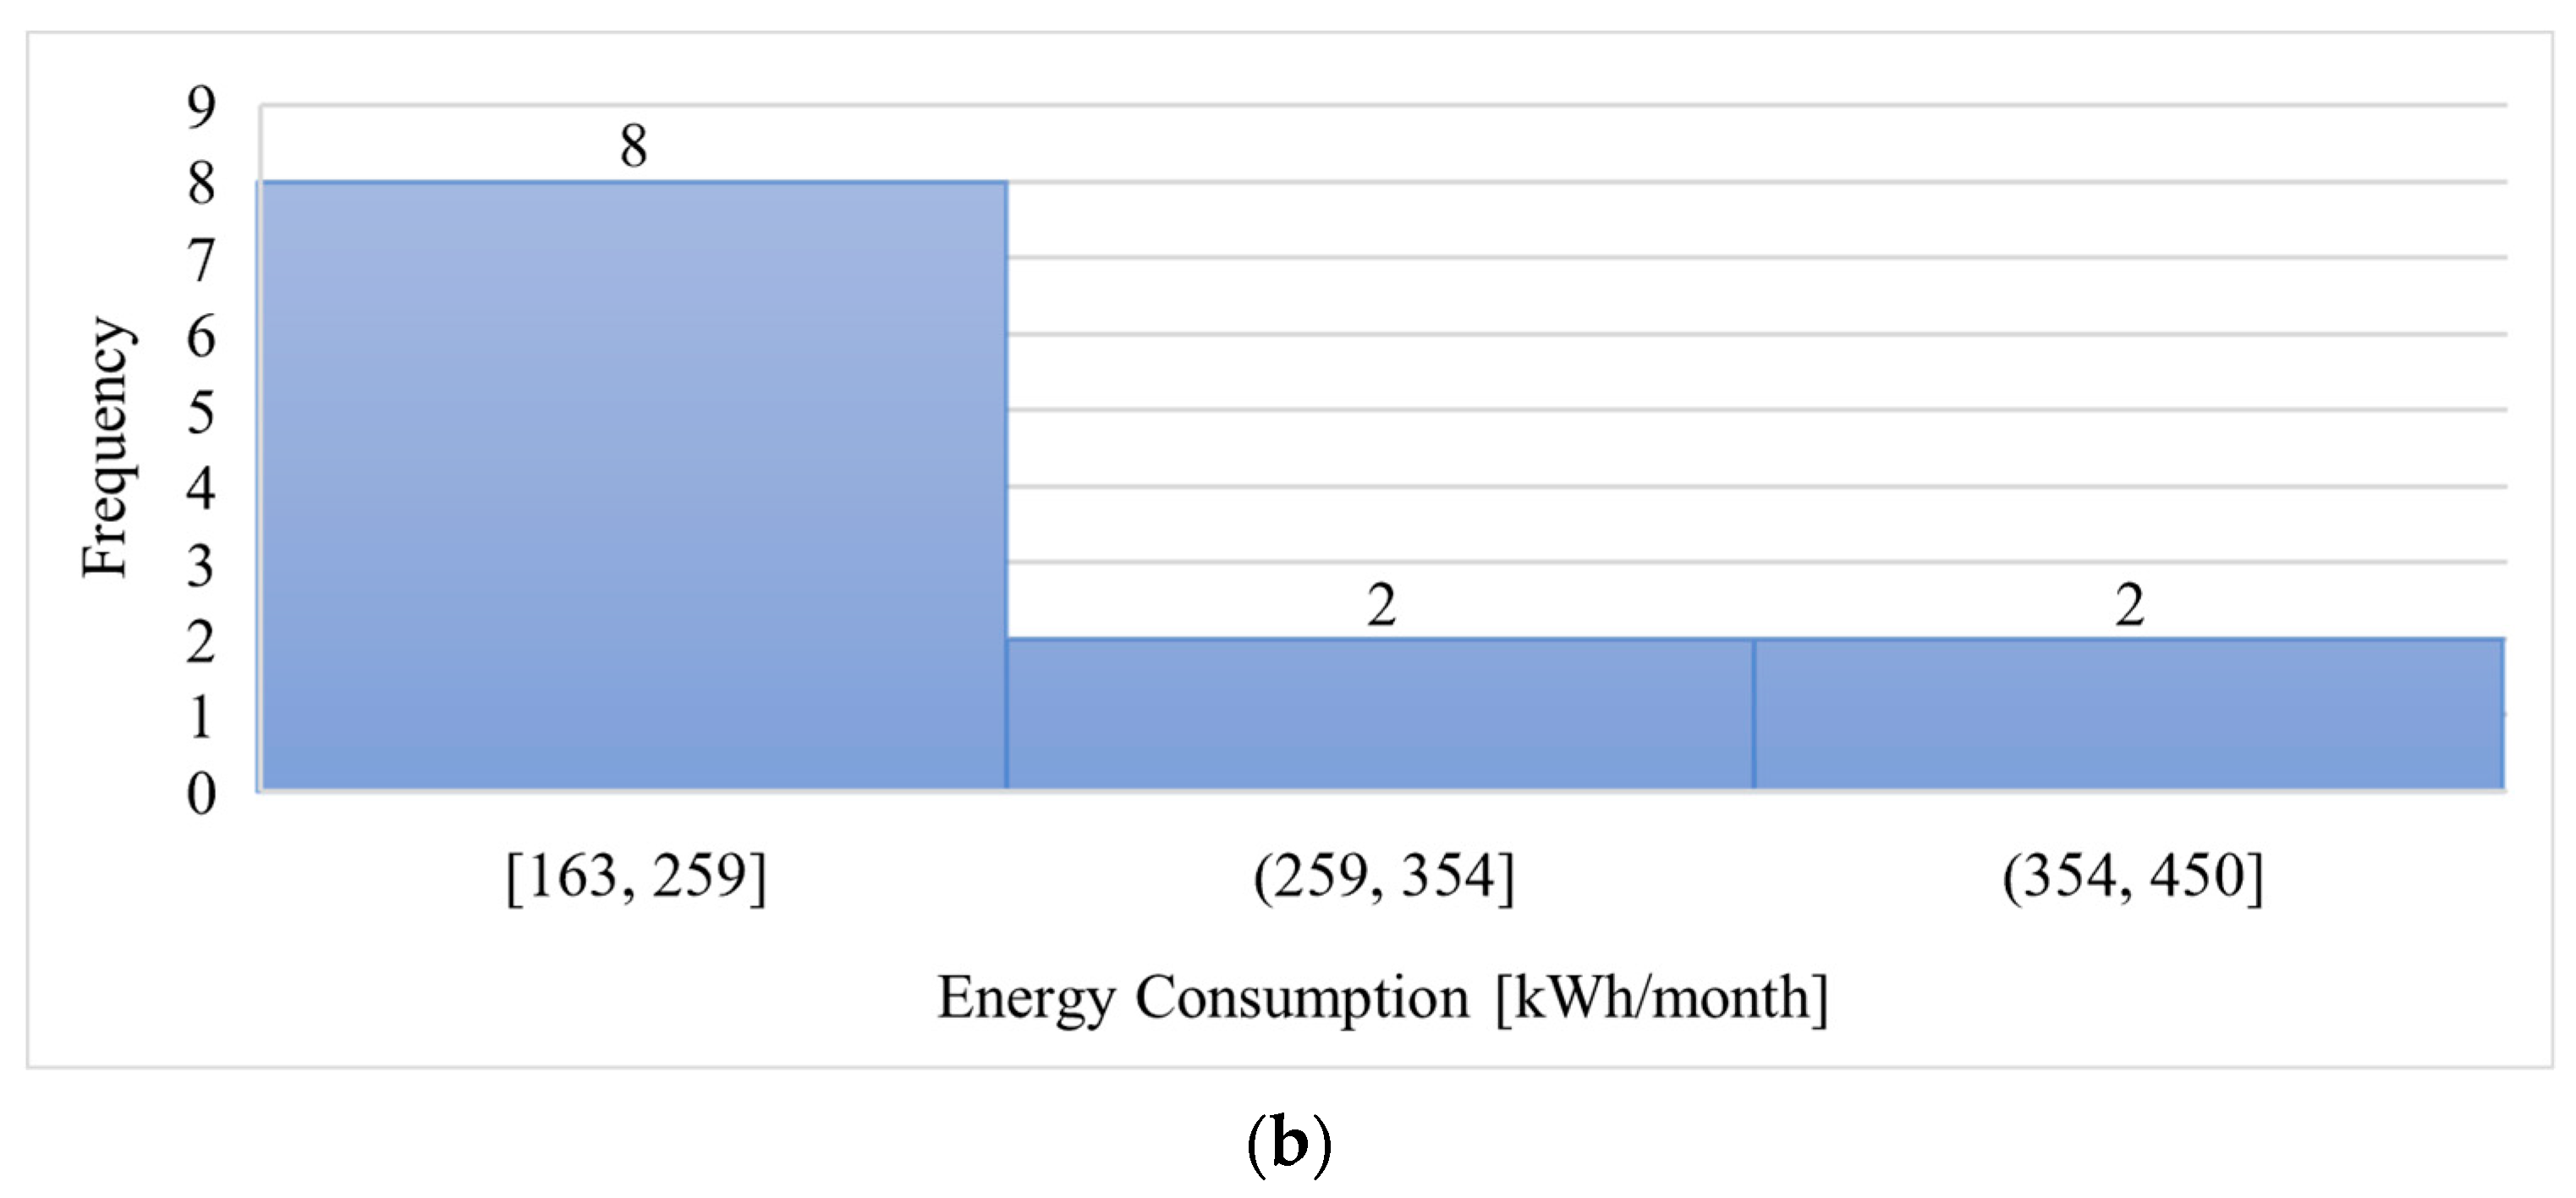
3.4.2. Histogram Analysis (Houses without AC)

Figure 10 presents the resulting monthly energy consumption values using histograms to highlight the frequency of the energy consumption values of the homes without AC when using the statistical profile (Figure 10a), the standard profile from ASHRAE 90.1 (Figure 10b), and the standard profile from Designbuilder domestic templates (Figure 10c).

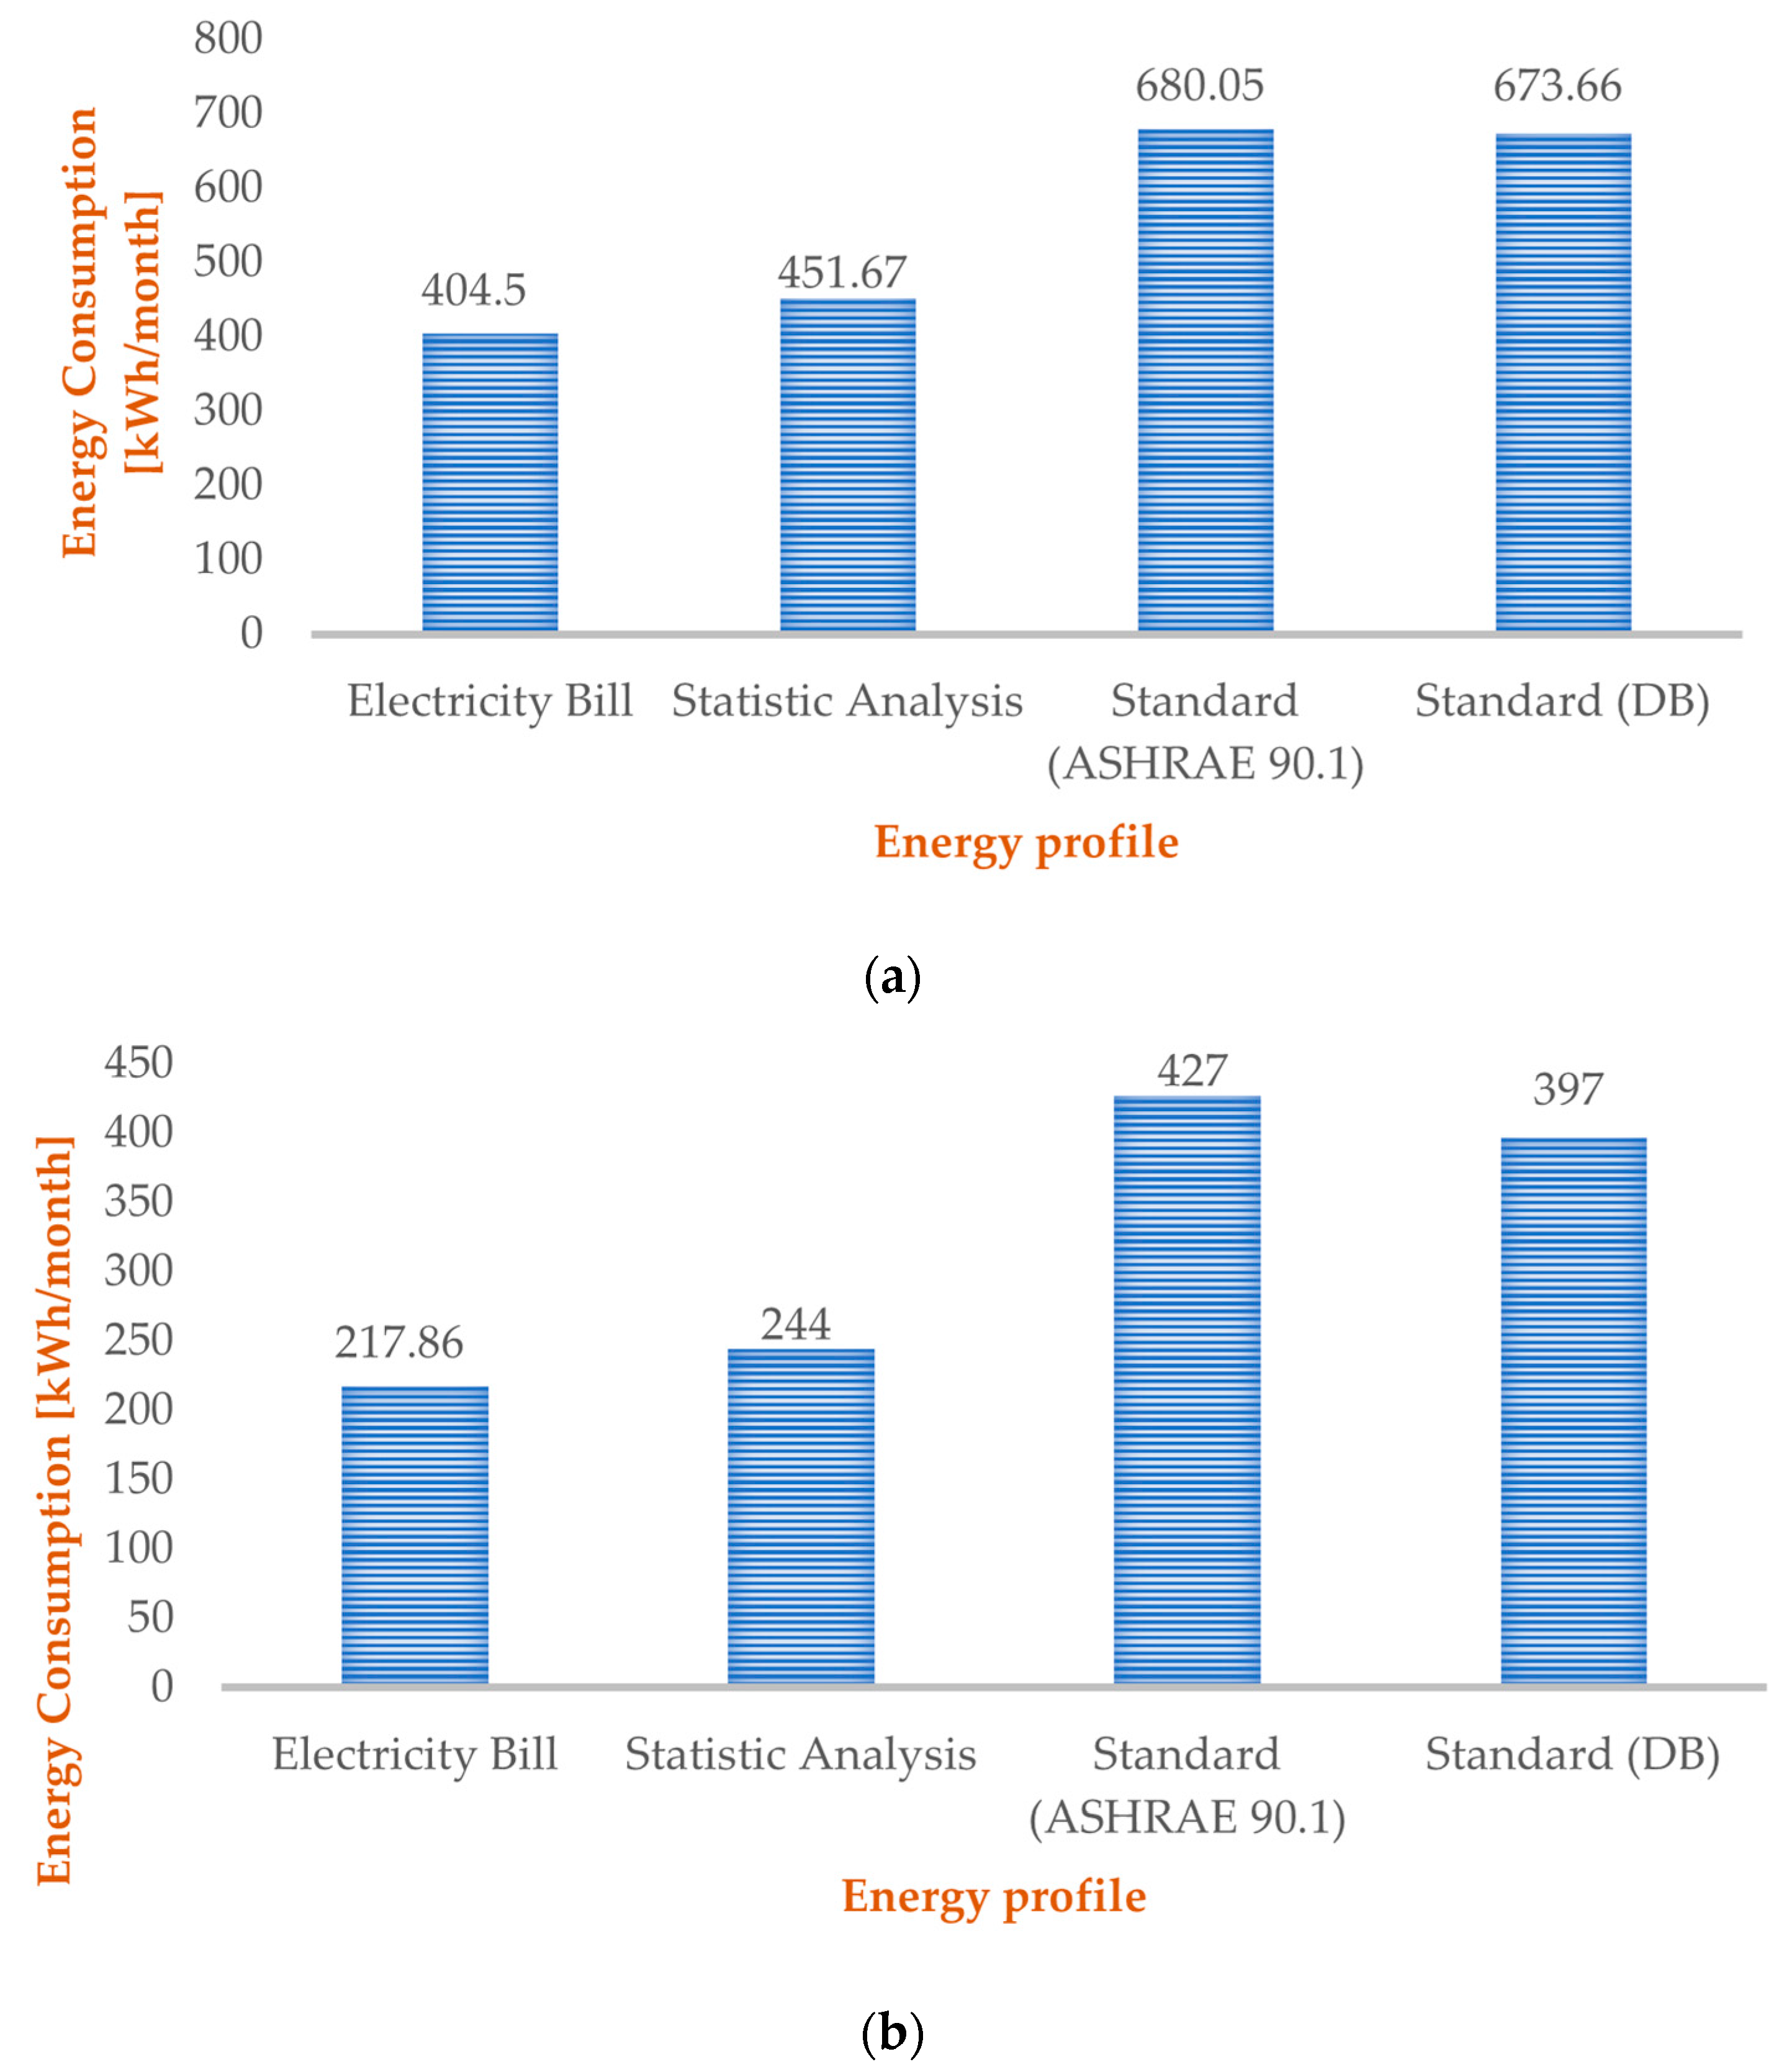
3.4.3. Energy Consumption Comparison

A comparison was made in energy consumption (Figure 11) for air-conditioned and non-air-conditioned residences. In both cases, the energy consumption with the closest approximation to that established by electricity billing is the result of Panama’s energy profile as a result of the statistical analysis of surveys. This study highlights the difference between the application of standard and customized criteria. More detailed occupant data is available when establishing surveys, allowing us to know occupancy preferences and interaction with the equipment, unlike the standard profiles used; Table 5 and Table 6 show how the selected occupation and interaction periods differ from the statistical profile in Table 4.
In the condition of a house with air conditioning, when implementing the statistical profile, it is shown that this varies by 11%, by 68% with the standard established by the DesignBuilder software, and by 66.54% with the standard of ASHRAE 90.1. Conversely, in a house without air conditioning, the consumption is lower; however, the standard profiles of ASHRAE 90.1 and the DesignBuilder software overestimate this consumption by 60% and 56%, respectively. The most approximate energy consumption is the statistical profile with a small variation of 4% concerning electrical bills.

3.5. Energy Consumption Comparison following the Parameters of the RES

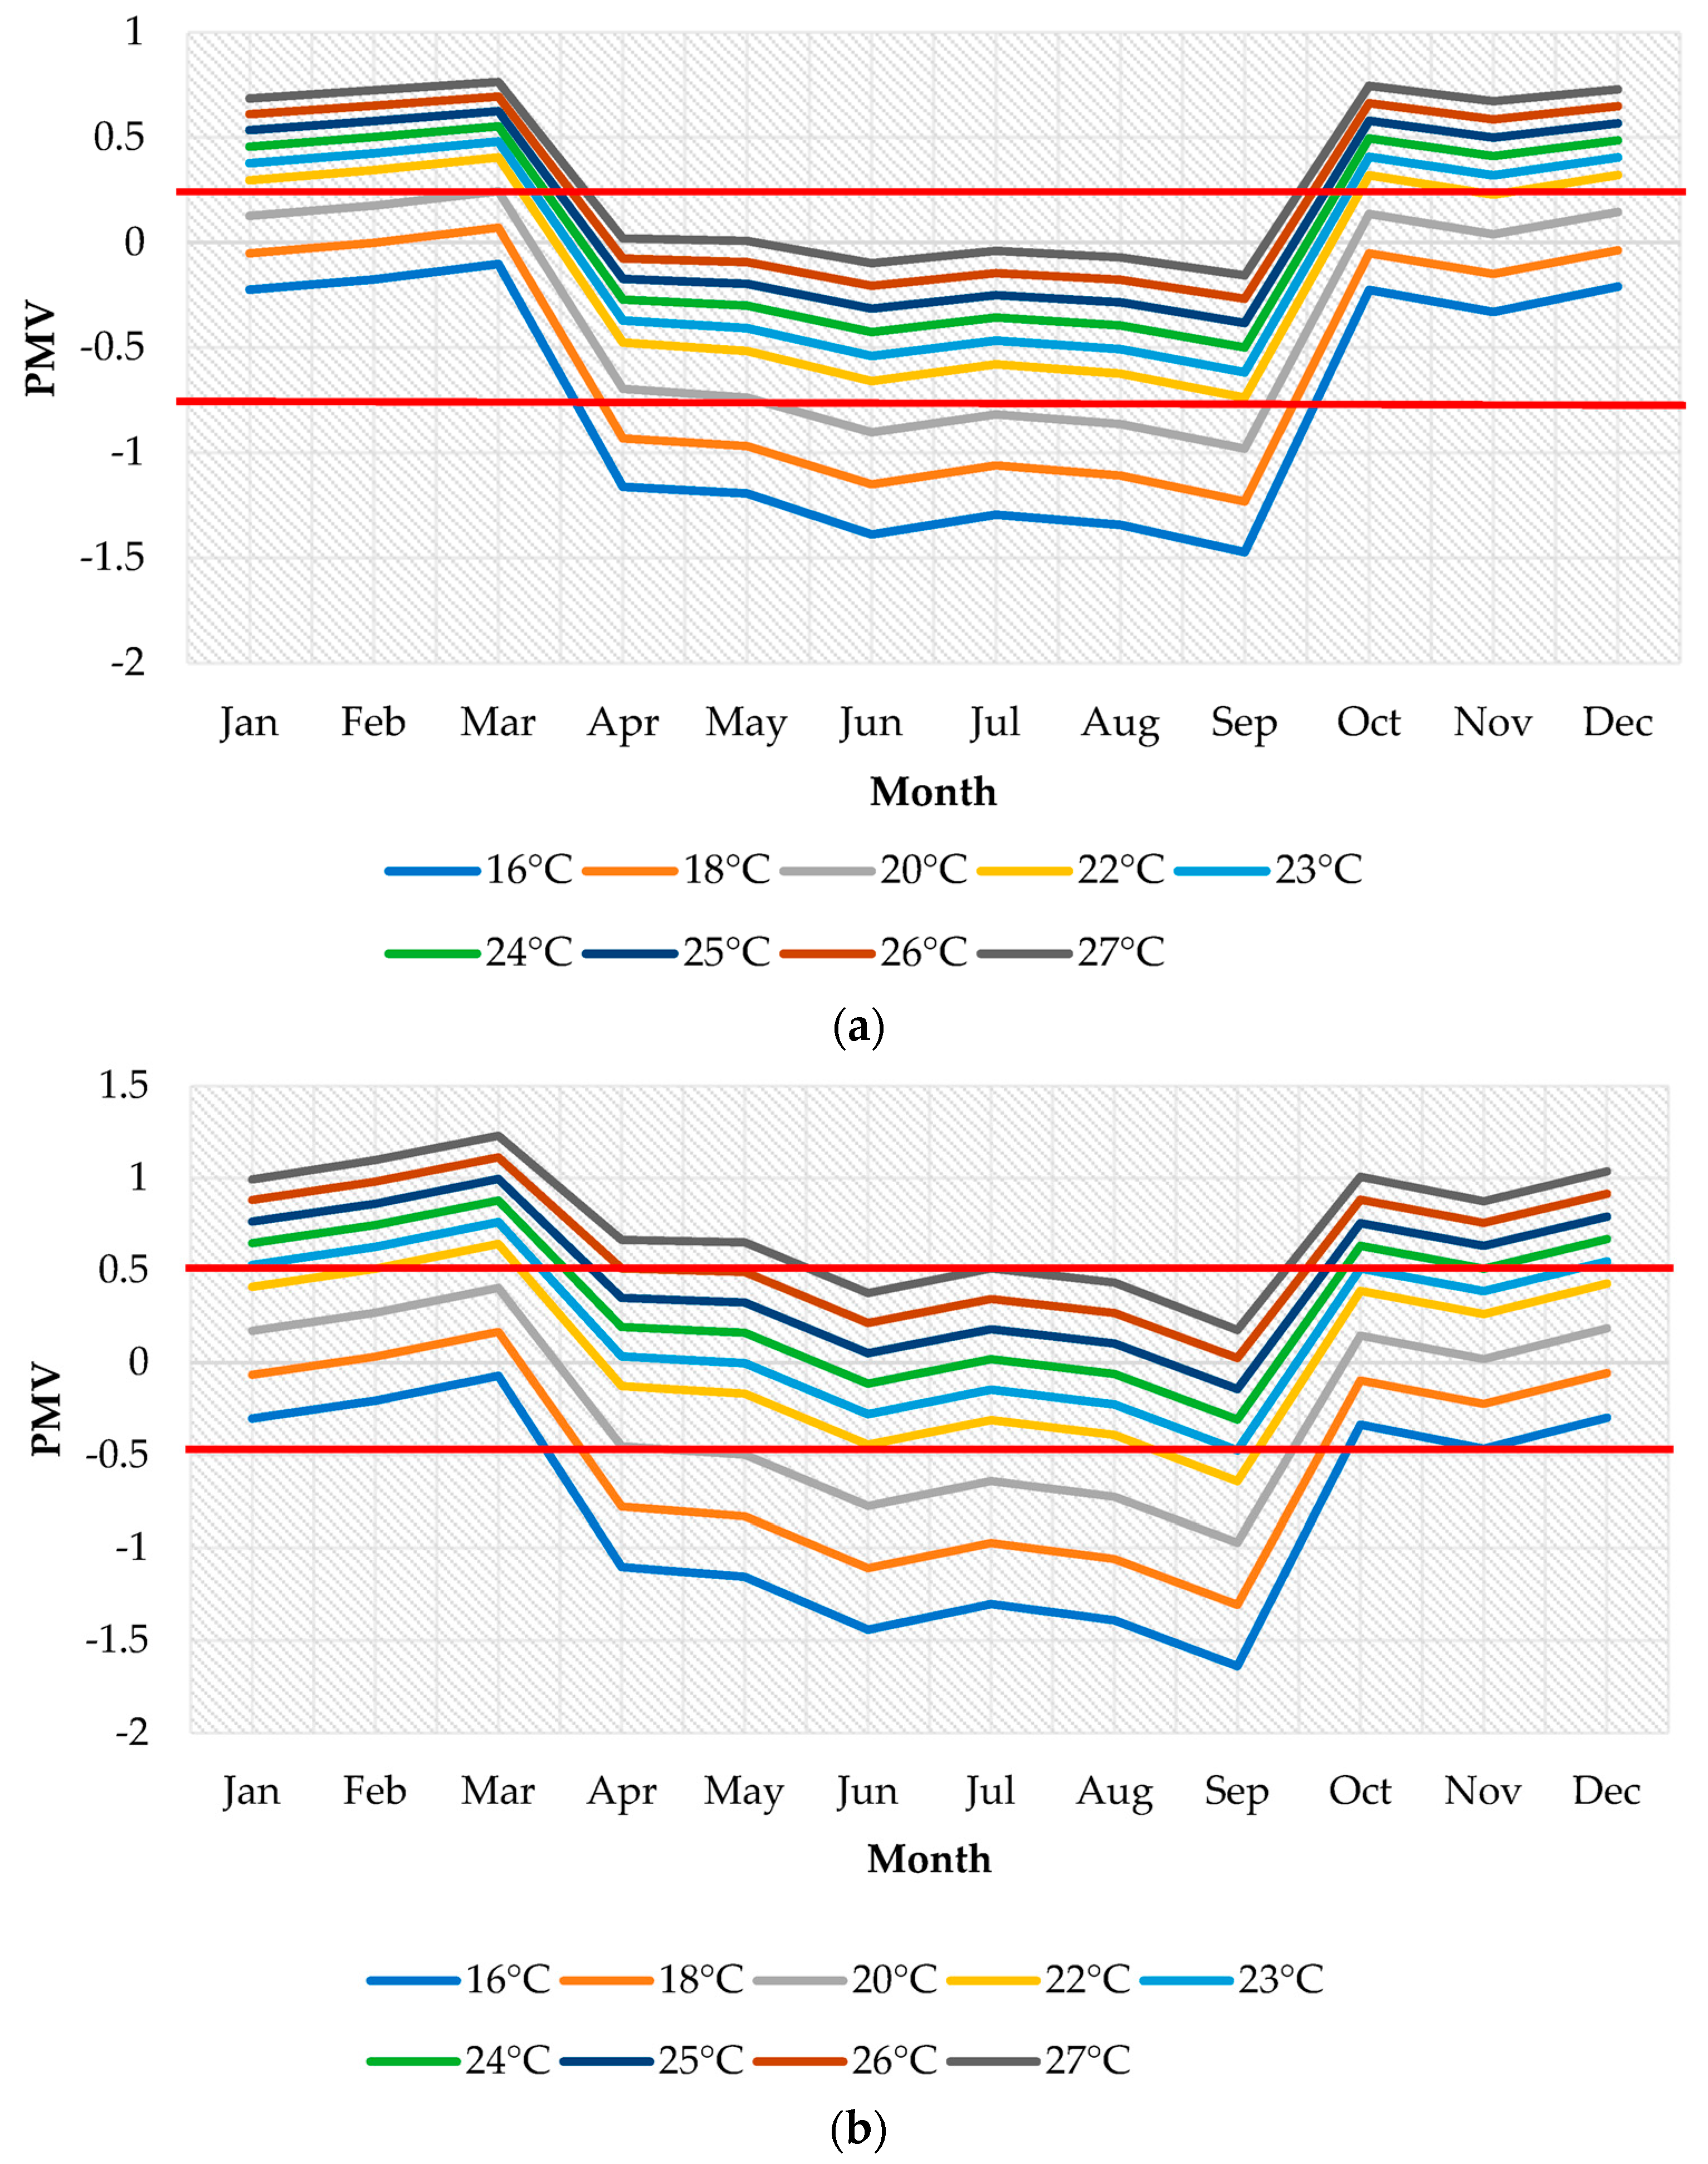
3.5.1. Setpoint Temperature Variations: PMV and Energy Consumption Analysis

Figure 12a shows the comfort analysis for room 1 and Figure 12b for room 2 since they are the areas that have air conditioning. Temperature that remains within the acceptable range of ±0.5 is 24 °C. However, the temperatures of 23 °C, 25 °C and 26 °C are slightly out of range, but these are considered in the analysis of energy consumption to identify the variation of consumption based on the change in set point temperature. Based on the general study, 24 °C is a suitable temperature, as is 23 °C.
By adjusting the air conditioning to 26 °C and 25 °C, there is an energy saving of 11.5% and 5.9%, respectively (Figure 13). Taking as a reference the temperature at 24 °C (defined by the applied survey).

3.5.2. Energy Consumption of the Dwelling Designed According to the RES’s Parameters

Figure 14 shows the monthly energy consumption of a home complying with the heat transfer coefficients requested by the RES. After the application of these, there is a saving of 8.16%.
This analysis was carried out to determine that the occupant’s behavior significantly influences energy consumption. By raising the temperature of adjustment of the air conditioning, a saving of 11.5% is generated (maintaining thermal comfort in the acceptable ranges most of the time), while the renovated house represents a saving of 8.6%; that is, although the house has improvements in its architecture, the actions of the occupant in terms of temperature control can generate significant increases or savings in energy consumption, even being superior to architectural reforms.

4. Discussions

The research consisted of knowing in a preliminary way an occupation profile in Panama through surveys to evaluate the impact of this profile on energy consumption. This allowed comparisons between energy consumption since standard profiles from the ASHRAE 90.1 standard and the profile incorporated in the simulation software were also analyzed.
This research involved a statistical analysis to identify factors influencing energy consumption. It was found that the number of people, air conditioners, light bulbs, fans, and areas of the house have a positive correlation with energy consumption. According to [28], the number of people positively correlates with energy consumption. The air conditioning parameter is identified in [29] as a commonly used equipment, so a positive correlation with energy consumption is expected. On the other hand, the lighting load impacts the energy consumed [30], as does the use of fans, since, according to surveys, lighting remains on for 8 h and increases consumption. The areas of the house present a positive correlation since these spaces house artifacts, such as those mentioned above, and can increase consumption. The correlation study presented in Figure 7 shows that the floor area of the house is not correlated with energy consumption. However, according to the literature [15,28], floor area does maintain a correlation with consumption; for this reason, it was decided to perform a linear regression analysis to identify the trend line. It shows an increasing energy consumption behavior as the floor area increases, so it accepts what has been shown in previous studies.
The perception of comfort they maintain at a precise moment guides the occupants’ behavior. As explained above, air conditioning is an equipment that balances thermal comfort well, as shown in Figure 5. It should be noted that it depends on the setting temperature. According to Figure 12a,b, the temperature that fits best in the range is 23 °C, coinciding with what is presented in [31]. However, the temperature of 24 °C also handles the range of acceptable comfort. To reduce consumption, 25 °C and 26 °C temperatures can also be considered since they remain within the comfort range most months.
The survey-based occupant profile is very different from the standard profiles from ASHRAE 90.1 and the DesignBuilder profiles of 66.5% and 68%, respectively. In [32], this phenomenon of differences between the profiles studied is identified, and the profile from interviews and monitoring is highlighted as the profile closest to the measured data. In addition [33], they demonstrate in their study in which they used energy standards from different countries that occupancy is much lower than what these standards demonstrate. According to [34], people do not fix their behavior to standardized patterns; they can make decisions according to their comfort or own considerations. In addition, behavioral profiles are focused on unitary patterns but do not evaluate the interaction between users since comfort conflicts may occur. By not considering all these variables, standardized standards cannot yield reliable results; in the case of energy, they cannot resemble a realistic consumption value. The latter leads to problems in the design of buildings since, previously, occupancy parameters and energy consumption patterns are not applicable.
On the other hand, studies have been carried out with various methodologies, including Artificial Neural Networks (ANN) that, through input data learning, can predict. The case of [35] shows that the ANN has a difference of 7.36% in the energy consumption estimation, above the linear regression analysis executed. In this type of tool, the precision is greater since various inputs, such as occupation parameters, temperature, humidity, irradiation, viewing speed, and cloudiness, support it. On the other hand, in [36], they implemented this tool and predicted the energy consumption with an RMSE range of only 0.26 and 0.98 kWh, which also allowed them to define an optimization in the behavior of the occupant to improve consumption, like the controller designed in [37] where energy consumption is improved by optimizing the cooling load. Although these tools have greater scope, the energy analysis executed and the results in this research are acceptable.

5. Conclusions

This research revealed various results, such as the occupancy profile and preferences of occupants in Panama. The investigation of the profile of the occupant in Panama through statistical analysis carried out on the applied surveys demonstrated the importance of developing a study of frequency through histograms, compared to the application of the mean, since, being a considerable dispersion of data, it is feasible to identify the most recurrent values, apart from that it can be applied to quantitative and qualitative data. The occupancy profile in Panama, considering the parameters with the highest selection by the respondents, consists of a one-story house consisting of three bedrooms and two bathrooms, four occupants, with a total monthly income of approximately PAB 1946.00; has two air conditioners adjusted to 24 °C and three fans. According to the comfort analysis for the summer season, the latter is essential in homes. Respondents also widely use air conditioning; most have at least one.
The highlights of this article are the following:
  • The occupancy period found reaches almost 100% throughout the day since this survey was applied during the quarantine period due to the COVID-19 health crisis. As for the electrical devices used, light bulbs, televisions, air conditioners, fans, and computers, apart from the refrigerator, which is continuously used, were highlighted as the most used equipment.
  • After knowing the occupancy profile, the factors that influence energy consumption with greater significance were found by adopting the correlation indicator. These correspond to the number of occupants, air conditioners, light bulbs, fans, and building areas.
  • Energy consumption showed an increasing trend as the floor area increased, the same when the setpoint temperature of the air conditioner decreased as the temperature differential increased. These factors coincide with what has been found in the literature.
  • The comparison of energy consumption, based on various profiles, shows that occupant preferences significantly influence energy consumption. Considering standard criteria, a building specifically in Panama produces surplus energy. When comparing homes with and without air conditioners, it was proven that this equipment greatly influences energy consumption. The differences concerning the occupancy profile found for a residence without air conditioning were smaller. This difference increases by over 60% when a home has air conditioning. However, all percentages are significant. For this reason, the importance of considering the role and preferences of the occupant was demonstrated.
  • The comparison of energy consumption by varying the air conditioning temperature, together with the comfort analysis, allowed us to define the temperature that entails greater energy savings without negatively impacting the occupant’s thermal comfort. On the other hand, the renovated house produces energy savings. However, the occupants’ behavior impacts more notably on consumption. Therefore, it was determined that establishing architectural improvements represents energy savings, but this must be complemented by occupant behavior with a conscious focus on savings to find favorable numbers.

Author Contributions

Conceptualization, D.M. and M.C.A.; Methodology, J.G. and M.C.A.; Software, D.M.; Formal analysis, J.G.; Resources, D.M.; Data curation, J.G.; Writing—original draft, J.G.; Writing—review & editing, M.C.A.; Project administration, M.C.A.; Funding acquisition, D.M. All authors have read and agreed to the published version of the manuscript.

Funding

This research was funded by the Panamanian Institution Secretaría Nacional de Ciencia, Tecnología e Innovación SENACYT (https://www.senacyt.gob.pa/), under the project codes FID18-056 and IDDS22-30, as well as supported by the Sistema Nacional de Investigación (SNI).

Data Availability Statement

Data is available upon request.

Acknowledgments

The authors would like to thank the Technological University of Panama and the Faculty of Mechanical Engineering for their collaboration, together with the Research Group ECEB (https://eceb.utp.ac.pa/, accessed on 30 August 2023).

Conflicts of Interest

The authors declare no conflict of interest.

References

  1. Annibaldi, V.; Cucchiella, F.; De Berardinis, P.; Gastaldi, M.; Rotilio, M. An integrated sustainable and profitable approach of energy efficiency in heritage buildings. J. Clean. Prod. 2020, 251, 119516. [Google Scholar] [CrossRef]
  2. SDG 7: Ensure Access to Affordable, Reliable, Sustainable and Modern Energy for all in Latin America and the Carribean. 2019. Available online: https://www.cepal.org/sites/default/files/static/files/sdg7_c1900693_press.pdf (accessed on 22 July 2023).
  3. International Energy Agency. IEA-EBC: Energy use in buildings. Int. J. Ambient. Energy 2015, 36, 49. [Google Scholar] [CrossRef]
  4. Balvedi, B.F.; Ghisi, E.; Lamberts, R. A review of occupant behaviour in residential buildings. Energy Build. 2018, 174, 495–505. [Google Scholar] [CrossRef]
  5. Karjalainen, S. Should we design buildings that are less sensitive to occupant behaviour? A simulation study of effects of behaviour and design on office energy consumption. Energy Effic. 2016, 9, 1257–1270. [Google Scholar] [CrossRef]
  6. Csoknyai, T.; Legardeur, J.; Akle, A.A.; Horváth, M. Analysis of energy consumption profiles in residential buildings and impact assessment of a serious game on occupants’ behavior. Energy Build. 2019, 196, 1–20. [Google Scholar] [CrossRef]
  7. Ahmad, J.; Larijani, H.; Emmanuel, R.; Mannion, M.; Javed, A. Occupancy detection in non-residential buildings—A survey and novel privacy preserved occupancy monitoring solution. Appl. Comput. Inform. 2018, 17, 279–295. [Google Scholar] [CrossRef]
  8. Sociedad Americana de Ingenieros de Calefacción Refrigeración y Acondicionamiento de Aire Inc. ANSI/ASHRAE 62.1 Ventilacion para una Calidad Aceptable de Aire Interior. Estándar 2007, 12. ISSN 1041-2336. [Google Scholar]
  9. González, J.; Quijada, M.C.; Serrano, J.; Sc, M. Indoor Air Quality Assessment via Experimentally Calibrated Dynamic Simulation: A Case Study in an Office Building in Panama. In Proceedings of the 20th LACCEI International Multi-Conference for Engineering, Education, and Technology: “Education, Research and Leadership in Post-Pandemic Engineering: Resilient, Inclusive and Sustainable Actions”, Hybrid Event, Boca Raton, FL, USA, 18–22 July 2022. [Google Scholar]
  10. O’Brien, W.; Wagner, A.; Schweiker, M.; Mahdavi, A.; Day, J.; Kjærgaard, M.B.; Carlucci, S.; Dong, B.; Tahmasebi, F.; Yan, D.; et al. Introducing IEA EBC annex 79: Key challenges and opportunities in the field of occupant-centric building design and operation. Build. Environ. 2020, 178, 106738. [Google Scholar] [CrossRef]
  11. Sun, K.; Hong, T. A framework for quantifying the impact of occupant behavior on energy savings of energy conservation measures. Energy Build. 2017, 146, 383–396. [Google Scholar] [CrossRef]
  12. Ashouri, M.; Fung, B.C.M.; Haghighat, F.; Yoshino, H. Systematic approach to provide building occupants with feedback to reduce energy consumption. Energy 2020, 194, 9. [Google Scholar] [CrossRef]
  13. Chacon, L.; Austin, M.C. A Multiobjective Optimization Approach for Retrofitting Decision-Making towards Achieving Net-Zero Energy Districts: A Numerical Case Study in a Tropical Climate. Smart Cities 2022, 5, 405–432. [Google Scholar]
  14. Aversa, A.; Ballestero, L.; Austin, M.C. Highlighting the Probabilistic Behavior of Occupants’ Preferences in Energy Consumption by Integrating a Thermal Comfort Controller in a Tropical Climate. Sustainability 2022, 14, 9591. [Google Scholar]
  15. Giusti, L.; Almoosawi, M. Impact of building characteristics and occupants’ behaviour on the electricity consumption of households in Abu Dhabi (UAE). Energy Build. 2017, 151, 534–547. [Google Scholar] [CrossRef]
  16. An, J.; Yan, D.; Hong, T.; Sun, K. A novel stochastic modeling method to simulate cooling loads in residential districts. Appl. Energy 2017, 206, 134–149. [Google Scholar] [CrossRef]
  17. Rinaldi, A.; Schweiker, M.; Iannone, F. On uses of energy in buildings: Extracting influencing factors of occupant behaviour by means of a questionnaire survey. Energy Build. 2018, 168, 298–308. [Google Scholar] [CrossRef]
  18. Vogiatzi, C.; Gemenetzi, G.; Massou, L.; Poulopoulos, S.; Papaefthimiou, S.; Zervas, E. Energy use and saving in residential sector and occupant behavior: A case study in Athens. Energy Build. 2018, 181, 1–9. [Google Scholar] [CrossRef]
  19. Secretaría Nacional de Energía. Método simplificado de Implementación de la Guía de Construcción Sostenible de Panamá-Resolución N°3980. Gac. Digit. 2019, 148, 1–348. Available online: https://www.gacetaoficial.gob.pa/pdfTemp/28090_A/GacetaNo_28090a_20160805.pdf (accessed on 3 January 2023).
  20. Austin, M.C.; Arnedo, L.; Yuil, O.; Mora, D. Energy consumption influenced by occupant behavior: A study in residential buildings in Panama. In Proceedings of the LACCEI International Multi-Conference for Engineering, Education and Technology, Bogota, DC, Colombia, 9–10 December 2021; pp. 1–9. [Google Scholar] [CrossRef]
  21. Montgomery, D.C.; Hines, W.W. Probabilidad y Estadística Para Ingeniería y Administración, 3rd ed.; Compañía Editorial Continental: Mexico City, Mexico, 1996. [Google Scholar]
  22. Hernández Martín, Z. Métodos de Análisis de Datos; Springer: Madrid, Spain, 2012. [Google Scholar]
  23. Sullenberger, A.B.; Naiman, A.; Rosenfeld, R.; Zirkel, G. Understanding Statistics; Cato Institute: Washington, DC, USA, 1975; Volume 6. [Google Scholar]
  24. De Coninck, R.; Helsen, L. Practical implementation and evaluation of model predictive control for an office building in Brussels. Energy Build. 2016, 111, 290–298. [Google Scholar] [CrossRef]
  25. Ramos, G.; Lamberts, R.; Abrahão, K.C.F.J.; Bandeira, F.B.; Teixeira, C.F.B.; de Lima, M.B.; Broday, E.E.; Castro, A.P.A.S.; Leal, L.d.Q.; De Vecchi, R.; et al. Adaptive behaviour and air conditioning use in Brazilian residential buildings. Build. Res. Inf. 2021, 49, 496–511. [Google Scholar] [CrossRef]
  26. JTIA. Reglamento de Edificaciones Sostenibles (RES); Gaceta Oficial de Panamá. Resolución de la JTIA No. 035; JTIA: Panama City, Panama, 2019; Volume 148, p. 6. [Google Scholar]
  27. González, J.; Austin, M.C.; Mora, D. Estimation of Residential Energy Consumption Accounting for Occupant-Behavior and Building Characteristics: A Coupled Statistical Approach with Reduced Survey and Simulation Tool. In Lecture Notes in Networks and Systems; 347 LNNS; Springer: Cham, Switzerland, 2022; pp. 164–171. [Google Scholar]
  28. González-Torres, M.; Pérez-Lombard, L.; Coronel, J.F.; Maestre, I.R.; Yan, D. A review on buildings energy information: Trends, end-uses, fuels and drivers. Energy Rep. 2022, 8, 626–637. [Google Scholar] [CrossRef]
  29. Zhang, Y.; Bai, X.; Mills, F.P. Characterizing energy-related occupant behavior in residential buildings: Evidence from a survey in Beijing, China. Energy Build. 2020, 214, 109823. [Google Scholar] [CrossRef]
  30. Kamel, E.; Sheikh, S.; Huang, X. Data-driven predictive models for residential building energy use based on the segregation of heating and cooling days. Energy 2020, 206, 118045. [Google Scholar] [CrossRef]
  31. Pandey, B.; Bohara, B.; Pungaliya, R.; Patwardhan, S.C.; Banerjee, R. A thermal comfort-driven model predictive controller for residential split air conditioner. J. Build. Eng. 2021, 42, 102513. [Google Scholar] [CrossRef]
  32. Carpino, C.; Loukou, E.; Heiselberg, P.; Arcuri, N. Energy performance gap of a nearly Zero Energy Building (nZEB) in Denmark: The influence of occupancy modelling. Build. Res. Inf. 2020, 48, 899–921. [Google Scholar] [CrossRef]
  33. O’Brien, W.; Tahmasebi, F.; Andersen, R.K.; Azar, E.; Barthelmes, V.; Belafi, Z.D.; Berger, C.; Chen, D.; De Simone, M.; D’Oca, S.; et al. An international review of occupant-related aspects of building energy codes and standards. Build. Environ. 2020, 179, 106906. [Google Scholar] [CrossRef]
  34. Harputlugil, T.; De Wilde, P. Energy Research & Social Science The interaction between humans and buildings for energy efficiency: A critical review. Energy Res. Soc. Sci. 2021, 71, 101828. [Google Scholar] [CrossRef]
  35. Keun, M.; Kim, Y.; Srebric, J. Predictions of electricity consumption in a campus building using occupant rates and weather elements with sensitivity analysis: Artificial neural network vs. linear regression. Sustain. Cities Soc. 2020, 62, 102385. [Google Scholar] [CrossRef]
  36. Amasyali, K.; El-gohary, N.M. Real data-driven occupant-behavior optimization for reduced energy consumption and improved comfort. Appl. Energy 2021, 302, 117276. [Google Scholar] [CrossRef]
  37. Talebi, A.; Hatami, A. Online fuzzy control of HVAC systems considering demand response and users ’ comfort. Energy Sources, Part B Econ. Plan. Policy 2020, 15, 403–422. [Google Scholar] [CrossRef]
Figure 1. Research flow followed in this study.
Buildings 13 02235 g001
Figure 2. House 3D model, which complies with typical single-story house dimensions: (a) axonometric view and (b) plan view with thermal zones.
Buildings 13 02235 g002
Figure 3. Histograms by: (a) number of occupants, (b) floor area (m2), (c) number of bedrooms, (d) number of bathrooms, (e) number of light bulbs, (f) number of fans, (g) number of AC, and (h) setpoint temperature.
Buildings 13 02235 g003aBuildings 13 02235 g003b
Figure 4. Energy consumption obtained from electricity bills: (a) house with AC and (b) house without AC.
Buildings 13 02235 g004aBuildings 13 02235 g004b
Figure 5. Occupant comfort with air conditioning.
Buildings 13 02235 g005
Figure 6. Occupant comfort without air conditioning.
Buildings 13 02235 g006
Figure 7. Correlation plot. Reprinted with permission from [27].
Buildings 13 02235 g007
Figure 8. Tendency analysis: (a) temperature setpoint; (b) floor area.
Buildings 13 02235 g008aBuildings 13 02235 g008b
Figure 9. Histogram analysis for houses with AC: (a) statistical profile, (b) standard profile (ASHRAE 90.1), (c) standard profile (DesignBuilder).
Buildings 13 02235 g009
Figure 10. Histogram analysis for houses without AC: (a) statistical profile, (b) standard profile (ASHRAE 90.1), (c) standard profile (DesignBuilder).
Buildings 13 02235 g010
Figure 11. Energy consumption comparison: (a) houses with AC and (b) houses without AC.
Buildings 13 02235 g011
Figure 12. Monthly PMV variation by set point temperature variations: (a) Room 1 and (b) Room 2. Comfort range inside red lines between −0.5 and 0.5.
Buildings 13 02235 g012
Figure 13. Monthly energy consumption comparison by cooling setpoint.
Buildings 13 02235 g013
Figure 14. Energy consumption of the refurbished house.
Buildings 13 02235 g014
Table 1. Description of building materials.
Wall MaterialThickness [m]Conductivity [W m/K]
Painting0.0010.3
Plaster0.010.7
Block0.12.3
Plaster0.010.7
Painting0.0010.3
U = 1.41 [W m2/K]
Table 2. Summary of survey responses.
Ranking
A. General CharacteristicsB. Cooling and Ventilation Systems
Monthly incomes%Type of windows%Annual Frequency of AC use%Annual Frequency of fan use%
USD 350.00–USD 1825.0045Sliding 60Always63Always90
USD 1826.00–USD 3999.0040Jalousie 52.5December to April30Dec to Apr8
more than USD 4000.0012.5Sash 2.5May to November7May to Nov3
Type of dwelling Casement 2.5Monthly Frequency of AC useMonthly Frequency of fan use
Residence82.5Awning 2.5Always65Always90
Apartment17.5Fixed 2.5More than 4 times23More than 4 times10
dwelling status Type of windows glass Less than 4 times12Less than 4 times0
own90Sigle glass85Types of AC Types of fan
rented10Single tinted glass7.5Split Inverter66pedestal53
Year of construction Double glass7.5Split 24ceiling37
After 2000’s55sun protection for windows Window10wall8
1990–200010Clare paint34systems during winter table2
Before 198010Shade trees30windows opening and fan75
1980–19900Orientation13windows opening13
Type of ceiling Insulation in the enclosure10AC and fan usage12
Zinc52.5Eaves10C. Water Heater and Appliances
Tejalit22.5Double gladez window4Types of stove %Energy consumption
concrete22.5Humidity Issues gas95[162.8–382.8]54
Tiles over zinc/wood2.5Mold58electric5(382.8–602.8]36
Windows frame materialsAllergies42Types of water heater (602.8, 822.8]5
Aluminum75Bad odors32gas78(822.8, 1042.8]3
PVC22.5Wood warping26electric22(1042.8, 1262.8]2
Wood2.5
Table 3. Results and method used for variables studied.
Variable StudiedFrequency Analysis ResultMethod Implemented: Frequency Analysis by
Number of occupants4Average
Floor area116 m2Mode
Number of bedrooms3Mode
Number of bathrooms2Mode
Number of light bulbs13Mode
Number of fans3Mode
Number of AC2Mode
Setpoint temperature24 °CMode
Table 4. DesignBuilder profile from residence template.
Occupation Profile
Number of Occupants4 people
Occupancy hours% occupation
12:00 a.m.–7:00 a.m.100
8:00 a.m.–3:00 p.m.75
4:00 p.m.–11:00 p.m.100
Occupant preferences
Thermostat adjustment TemperatureMonthly frequency of useAnnual frequency of use
24 °CEvery monthAlways
Fan Every monthalways
Hours of AC use per day5
EquipmentQuantityTotal hours of use/dayDays/week
WeekWeekendFrequency of use
Lights13887
Computers or printers207:3507:007
Sound equipment104:5004:053
Television207:4509:137
Microwaves100:3500:206
Refrigerator124:0024:007
Clothes iron100:3500:452
Washing machine101:4502:002
Table 5. DesignBuilder profile.
EquipmentPeriod of Use
Natural ventilationMonday–Sunday24 h
Air conditioning (only for the house that applies it)Monday–Sunday8:00 a.m.–7:00 p.m.24 °C
Refrigerator Monday–Sunday24 h
ComputerMonday–Sunday8:00 a.m.–7:00 p.m.
Period of occupation and illumination Period of occupation, lighting, use of equipment
Dining room-Schedule% Kitchen-Schedule%
(12:00 a.m.–6:00 a.m.)0 (12:00 a.m.–7:00 a.m.)0
(6:00 a.m.–7:00 a.m.)25 (7:00 a.m.–10:00 a.m.)100
(7:00 a.m.–9:00 a.m.)100 (10:00 a.m.–7:00 p.m.)0
(9:00 a.m.–10:00 a.m.)25 (7:00 p.m.–11:00 p.m.)20
(10:00 a.m.–6:00 p.m.)0 (11:00 p.m.–12:00 a.m.)0
(6:00 p.m.–7:00 p.m.)50
(7:00 p.m.–9:00 p.m.)100
(9:00 p.m.–10:00 p.m.)30
(10:00 p.m.–12:00 a.m.)0
Occupancy, mechanical ventilation and lighting of rooms on weekdays and weekendsPeriod of occupation, lighting, mechanical ventilation
Schedule% Room-Schedule%
(12:00 a.m.–7:00 a.m.)100 (12:00 a.m.–4:00 p.m.)0
(7:00 a.m.–8:00 a.m.)50 (4:00 p.m.–6:00 p.m.)50
(8:00 a.m.–9:00 a.m.)25 (6:00 p.m.–10:00 p.m.)100
(9:00 a.m.–10:00 p.m.)0 (10:00 p.m.–11:00 p.m.)66
(10:00 p.m.–11:00 p.m.)25 (11:00 p.m.–12:00 a.m.)0
(11:00 p.m.–12:00 a.m.)75
Table 6. ASHRAE 90.1 profile.
EquipmentPeriod of Use
Natural ventilationMonday–Sunday24 h
Air conditioning (only for the house that applies it)Monday–Sunday8:00 a.m.–7:00 p.m.24 °C
Refrigerator Monday–Sunday24 h
ComputerMonday–Saturday8:00 a.m.–7:00 p.m.
Period of occupation of the residence% Period of occupation, lighting, use of equipment%
(12:00 a.m.–5:00 a.m.)100 (12:00 a.m.–6:00 a.m.)0
(5:00 a.m.–6:00 a.m.)80 (7:00 a.m.–10:00 p.m.)100
(6:00 a.m.–8:00 a.m.)75 (10:00 p.m.–11:00 p.m.)80
(8:00 a.m.–9:00 a.m.)50 (11:00 p.m.–12:00 a.m.)20
(9:00 a.m.–3:00 p.m.)43
(3:00 p.m.–6:00 p.m.)50
(6:00 p.m.–9:00 p.m.)75
(9:00 p.m.–12:00 a.m.)80
Disclaimer/Publisher’s Note: The statements, opinions and data contained in all publications are solely those of the individual author(s) and contributor(s) and not of MDPI and/or the editor(s). MDPI and/or the editor(s) disclaim responsibility for any injury to people or property resulting from any ideas, methods, instructions or products referred to in the content.

