Abstract
By investigating the bond performance between glass-fiber-reinforced polymer (GFRP) bars and concrete, GFRP bars can be better applied to concrete structures as a building material. This paper considered the effects of three different GFRP bar surface treatments, three bonding lengths, corrosive solution, and immersion time on the bonding strength. The test results indicated that the bond strength decreases with the increase in the diameter and bond length. The bonding between GFRP bars and concrete can be improved by treating the surface of the bars in different ways. Compared with the control group, the bond strength of the specimens in the saline solution decreased by 1.3–21.4%, and the bond strength of the specimens in the alkaline solution decreased by 26.5–38.8%. In the corrosive environment, the bond properties are degraded. A bond strength calculation formula considering the surface treatment method of the GFRP bars was proposed. The prediction formula of the bond strength retention rate between the GFRP bar and concrete in the corrosive environment was established. The formula was validated with the available research data and the calculated values agreed well with the test values. The MBPE model and CMR model are modified to establish the bond-slip model of the GFRP bars and concrete in the corrosive environment. The model curve is close to the test curve. This paper provides a theoretical basis for future research on the bond-slip performance of GFRP bars and concrete.
1. Introduction
In the use of a reinforced concrete structure, concrete plays a certain role in protecting the steel bars, but due to the external temperature, it is not stable; moreover, corrosive media intrusion, the concrete cover being too small, and other reasons, result in the destruction of the surface protective film of the steel bars. As the corrosion of steel bars occurs, the mechanical properties decrease [1,2,3]. The main advantages of fiber-reinforced polymer (FRP) bars are their low density, light weight, ease of construction, and corrosion resistance. Compared with steel bars, FRP bars can operate in some harsh environments, such as acid, alkaline, saline, and so on, and the durability of the structure is guaranteed. FRP bars are a good choice to replace steel bars in some offshore buildings. FRP bars, instead of steel bars, have become the object of research by scholars from various countries [4,5,6,7]. At present, there are mainly glass-fiber-reinforced polymer (GFRP) bars, carbon-fiber-reinforced polymer (CFRP) bars, basalt-fiber-reinforced polymer (BFRP) bars, etc. The mechanical properties of different fiber bars are slightly different. CFRP has higher mechanical properties, better corrosion resistance, fatigue resistance, creep resistance, etc. The price of CFRP is relatively expensive. In contrast, GFRP and BFRP with higher elongation are cheaper and environmentally friendly in the preparation process. At the same time, their mechanical properties and long-term durability are also satisfactory during service [8,9,10].
In the performance evaluation of FRP bar structures, one of the key indicators is the bond performance between the FRP bar and concrete. The results of the current study show that the bond performance of FRP bars and concrete can be summarized as: (1) the maximum average bond stress decreases as the diameter increases; (2) the maximum average bond stress decreases as the bond length increases [11,12,13]. However, the method of surface treatment of the FRP bars also has an impact on the bond strength. Currently, there are no relevant instructions for the surface treatment of FRP bars, resulting in a wide variation in the bonding properties of the different bars [14,15,16,17].
To achieve the long-term durability of structures, it is necessary to explore their bonding mechanism and the long-term degradation performance in extreme environments. At present, studies have confirmed that the bond strength will decrease in extreme environments [17]. Liang et al. [18] conducted a 120 h aging test on FRP bars in an alkaline environment. The results indicated that the decrease in the bond strength was associated with the type of FRP bars. Dong et al. [19,20] analyzed the bond strength changes with different curing ages. The results demonstrated that the bond performance reduced in seawater, and the bond-slip curve was wavy with decreasing peaks. Yang et al. [21] analyzed the bond strength immersed in seawater, which was lower than that under standard curing conditions and which fully demonstrated that seawater would have adverse effects on the bond properties. Zhou et al. [22] showed that the maximum bond strength loss of the GFRP bar after 75 days of corrosion was 11%, 22%, 17.2%, and 14%, respectively, in the environment of tap water, with a pH = 2, 3, and 4. The results of Yan et al. [23,24] showed that the concrete cover with three times the diameter of the bars was not sufficient to resist the environmental factors under various weathering effects, and all the specimens failed due to concrete splitting. Nepomuceno et al. [25] established a database based on the results of 1002 pullout tests and provided the long-term prediction of the durability in different types of exposure environments. Xiong et al. [26] conducted the fatigue bond performance test on the BFRP bar and seawater sand concrete. The influencing factors of its bond performance were the concrete strength, steel bar diameter, and surface shape, respectively. Zheng et al. [27] conducted the pullout test on GFRP bars following 270 days of corrosion; each specimen suffered an average loss of 51.5% of the bond strength in the saline solution, followed by tap water (29.0%) and the alkaline solution (39.5%).
To sum up, as GFRP bars have a similar thermal expansion coefficient and the excellent bonding properties of steel bars, they can replace steel bars and work well with concrete. The bond-stress–slip relationship can quantitatively describe the interface behavior. Typical models include the Malvar model [28], MBPE model [29], Gao model [30], and CMR model [29]. The bonding performance determines the efficiency of the stress transfer between the FRP bar and concrete, thus affecting the carrying capacity and working performance of the structure. Therefore, the bonding properties in the corrosive environment are crucial to the structural performance. The research on the bond properties under corrosive environments is still limited. In this paper, through 12 groups of specimens, the bonding properties between GFRP bars and concrete were investigated in normal service, as well as in saline and alkaline environments, and the effects of the surface treatment method, bonding length, corrosion solution type, and immersion time on the degradation of the bonding properties were analyzed. A model for calculating the bond strength considering the surface treatment and corrosive environment of the FRP bars is proposed. The MBPE and CMR models have been modified by the summary and analysis of existing bond-slip models to describe the bond-slip between GFRP bars and concrete in the corrosive environment.
2. Experimental Work
2.1. Materials
According to [31], the total length of the tensile specimen is 1000 mm, and both ends are anchored by a steel tube sleeve. The length of steel tube is 40 times that of the diameter of the bars, and epoxy resin glue is used between the sleeve and the GFRP bar. The tensile test of the GFRP bars is shown in Figure 1. The GFRP bars are 8 mm and 12 mm in diameter, and the average tensile strength was measured at 1080 MPa and 870 MPa, respectively. The average elastic modulus is 47.3 GPa and 44.5 GPa. The average compressive strength of concrete cube (side length is 150 mm) is 42.3 MPa. The mixture ratio of concrete is shown in Table 1.
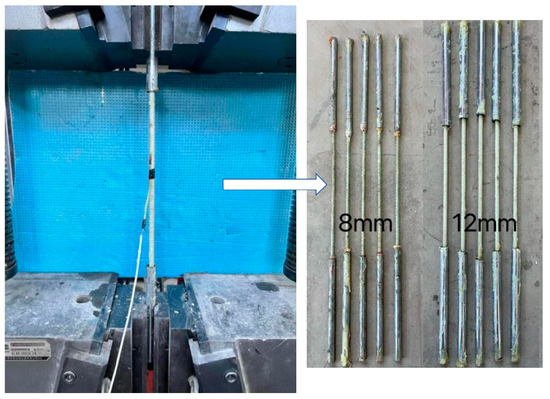
Figure 1.
The tensile test of GFRP bars.

Table 1.
Mixture ratio of concrete (kg/m3).
2.2. Environmental Conditions
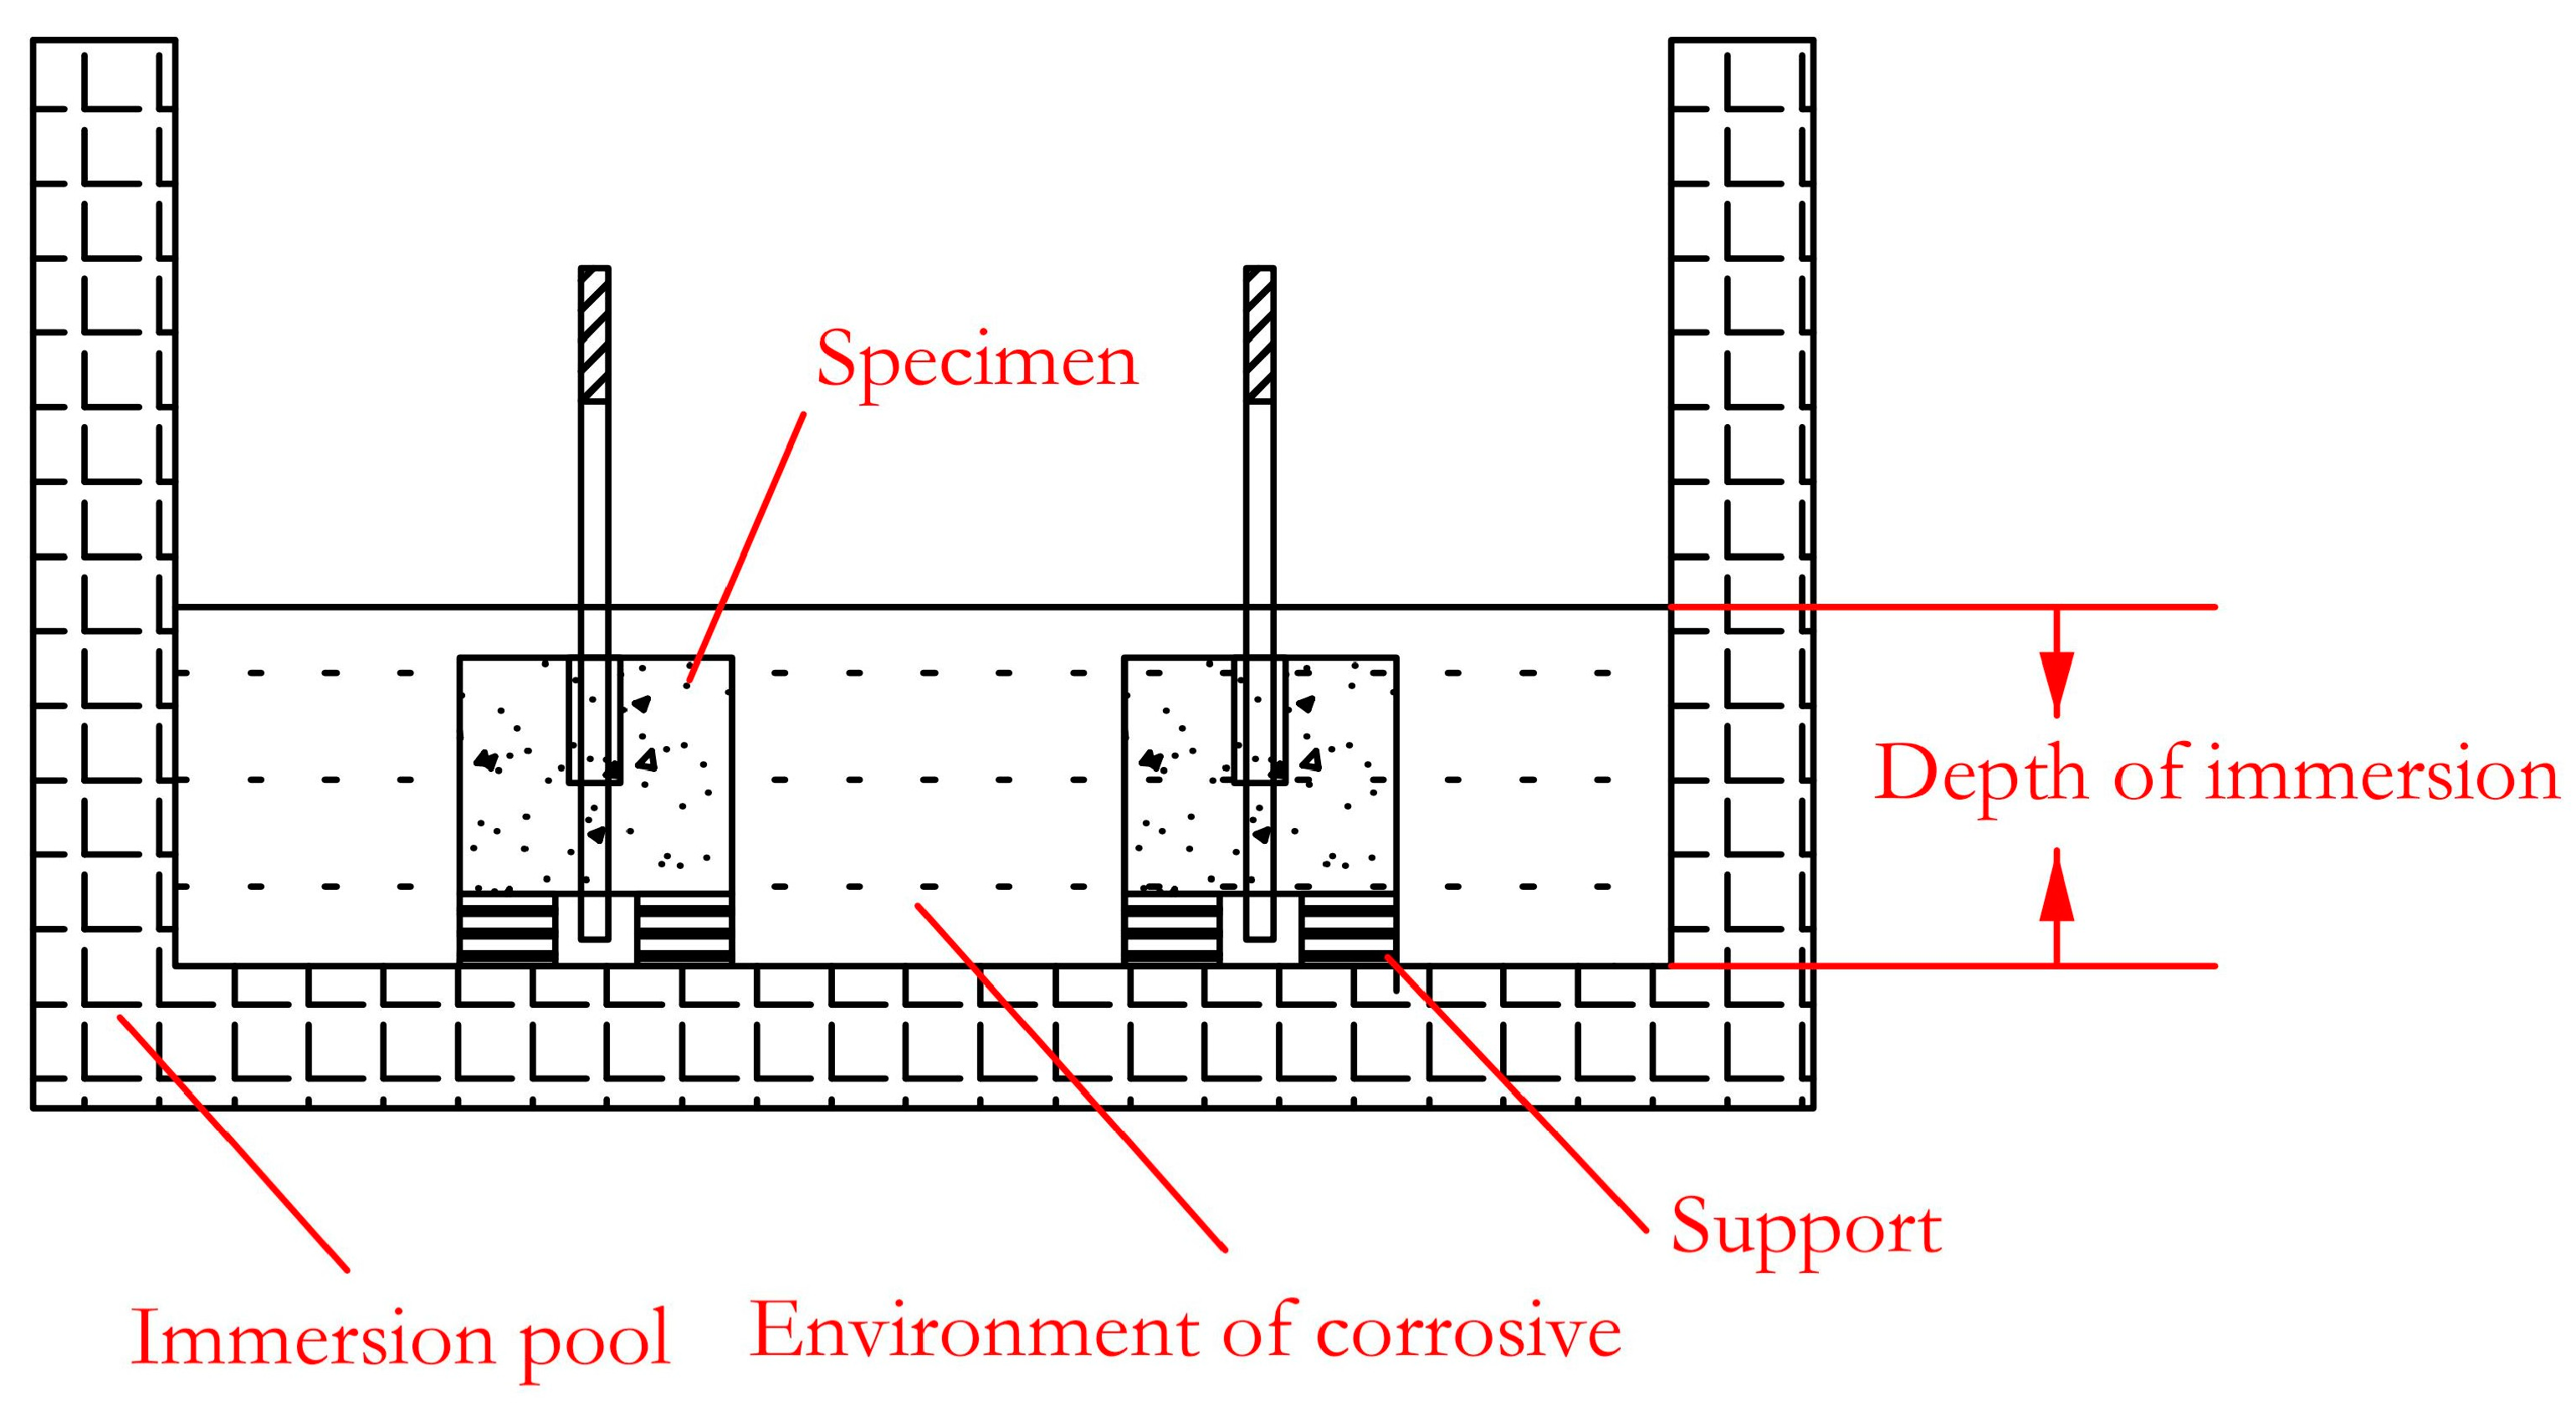
For the concrete structure in coastal areas or the structure of deicing salt (mostly containing chloride ions) used on road surfaces in cold areas, it will be corroded by chloride ions. In addition, concrete has a high alkalinity inside, so it is of great significance to study the alkaline resistance of GFRP bars for the durability of the concrete structure. In view of this, saline solution and alkaline solution are used as the corrosion environment in this paper to further explore the bond-degradation performance of the GFRP bar and concrete. The immersion container adopts a corrosion-resistant plastic box with a size of 100 × 83 × 60 cm, and the immersion solution is a saline [32] and alkaline solution [33]. The specific ingredients are shown in Table 2 and Table 3. The temperature was set at room temperature (20 ± 3 °C). The pH value of the saline and alkaline solutions was 6.5 and 12.5, respectively. A pad was placed at the bottom of the box to place the specimen, as shown in Figure 2. The saline and alkaline solutions were poured, respectively, to ensure that the specimen was immersed in the solution. During the immersion period, the pH value of the solution was measured every 5 days according to the standard. If the pH value changed due to water evaporation, it was adjusted in time. It was ensured that the solution height exceeded the specimen height and the pH value remained unchanged. The immersion time of the specimens was 30, 60, and 90 days, respectively.
Table 2.
Saline solution (per 1 L of deionized water).
Table 3.
Alkaline solution (per 1 L of deionized water).
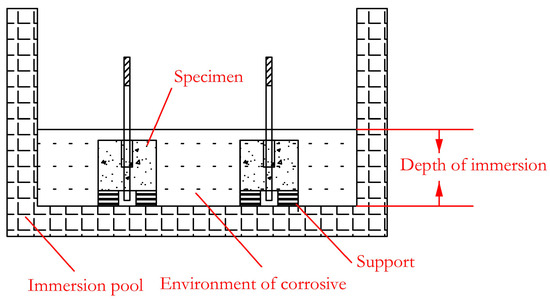
Figure 2.
Schematic diagram of immersion.
- (1)
- Mechanical property test of concrete under a saline environment
The standard cubic concrete test specimens were corroded and immersed in a saline solution for 30, 60, and 90 days, respectively. When the corrosion period was reached, the concrete cube test specimens were removed, the surface solution was dried, and the test was carried out within 24 h. The concrete compressive test results showed that the average compressive strength was 42.8 MPa at 30 days, 41.5 MPa at 60 days, and 39.7 MPa at 90 days. When the saline solution was immersed for 30 days, there was almost no degradation of the compression strength of the concrete test specimens. Compared with 30 days of corrosion, when the corrosion time was 60 and 90 days, the compression strength of the concrete was reduced by 3.03% and 7.2%, respectively. With the longer immersion time, more and more chloride ions enter the concrete, thus causing certain degradation to the concrete.
- (2)
- Mechanical property test of concrete under an alkaline environment
The concrete cube test specimens were immersed in an alkaline solution for 30, 60, and 90 days, respectively. When the immersion days were reached, the concrete test specimens were removed. As there was lime mud on the surface of the alkaline solution, it was rinsed in clean water, and the surface water was dried before the test was carried out. The concrete compressive test results showed that the average compressive strength was 41.7 MPa at 30 days, 39.5 MPa at 60 days, and 38.4 MPa at 90 days. When the alkaline solution was immersed for 30 days, there was almost no degradation of the compression strength of the concrete test specimens. Compared with 30 days of corrosion, when the corrosion time was 60 and 90 days, the strength of concrete was reduced by 5.28% and 7.99%, respectively. With the longer immersion time, more and more hydroxide ions enter the concrete, thus causing certain degradation to the concrete.
2.3. Design of Specimen
The influencing factors of the test are: different treatment forms of the GFRP bars’ surface, the bond length, immersion solution type, and immersion time. The specific information is shown in Table 4.
Table 4.
Specific information of specimens.
2.4. Preparation of Pullout Specimens
The curing agent used in the production of the pullout specimens is epoxy resin glue, and the central pullout specimens are made in reference to the ACI 440.3R-12 [34]. The concrete specimen adopts a cube with a side length of 150 mm, a free end length of 50 mm, and a loading end length of 300 mm. The length of the whole bar is 500 mm, and the specimen is shown in Figure 3.
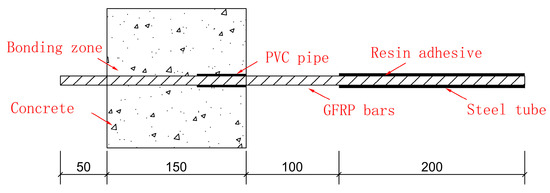
Figure 3.
Pullout test specimen.
- (1)
- Preparation for work
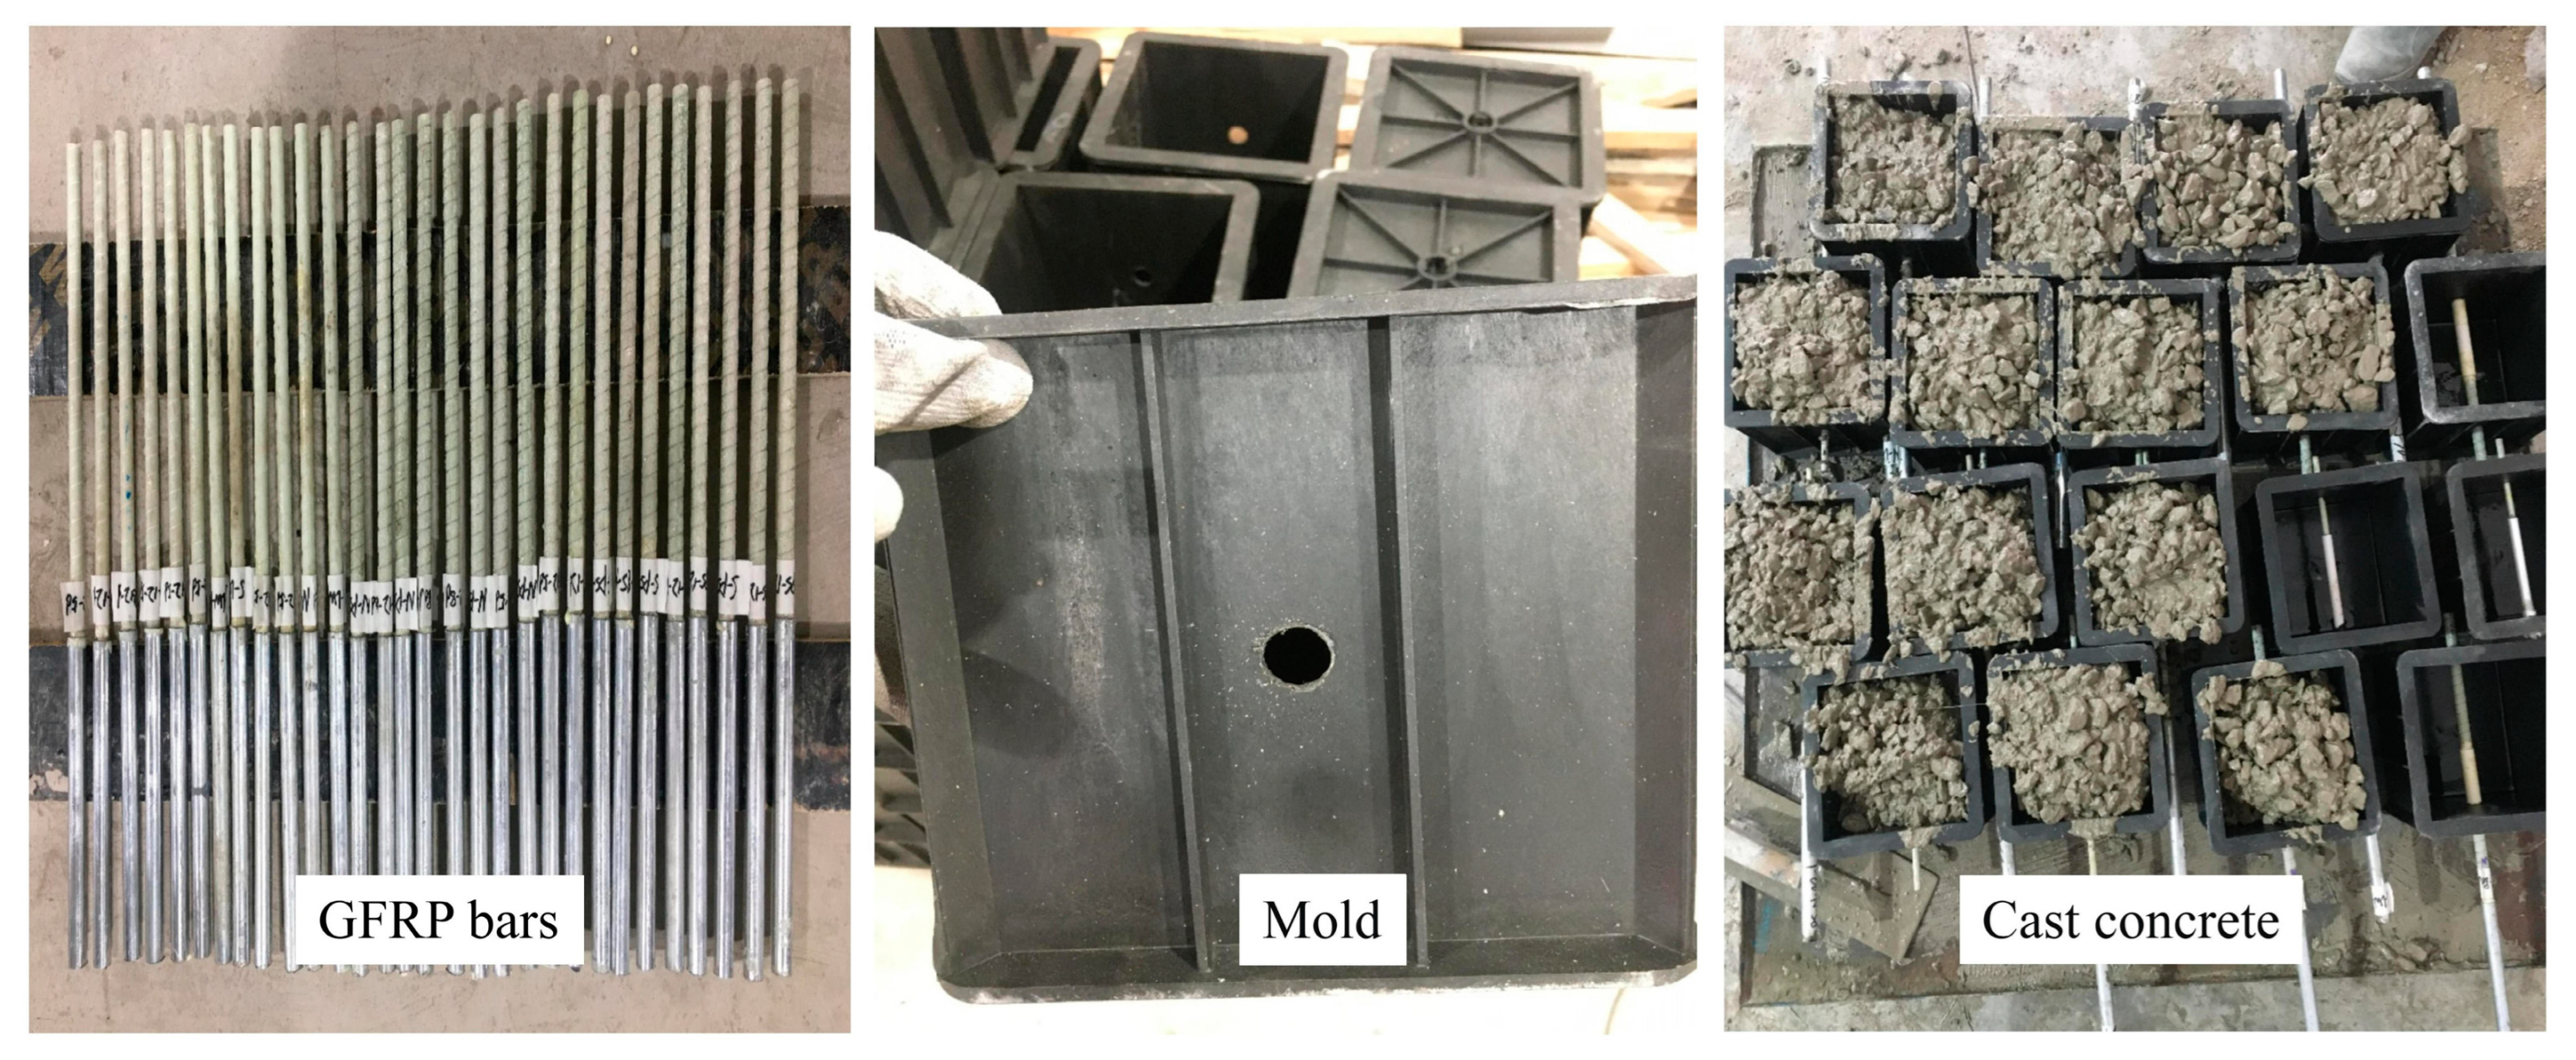
In Figure 4, the GFRP bar is cut into 500 mm long lengths, the steel pipe is cut into 200 mm long lengths, and the PVC pipe is cut into the required length according to the different bonding lengths. The steel sleeve was placed on the loading end, namely one end of the bars, and infused epoxy resin glue was used to fix it. The bonding length was controlled by PVC pipe, which was respectively set on the GFRP bar. Holes were punched in the middle of the plastic mold according to the bars of different diameters. The inside of the mold was wiped clean, and the mold release oil was evenly applied.

Figure 4.
Preparation of specimen.
- (2)
- Immersion the specimen
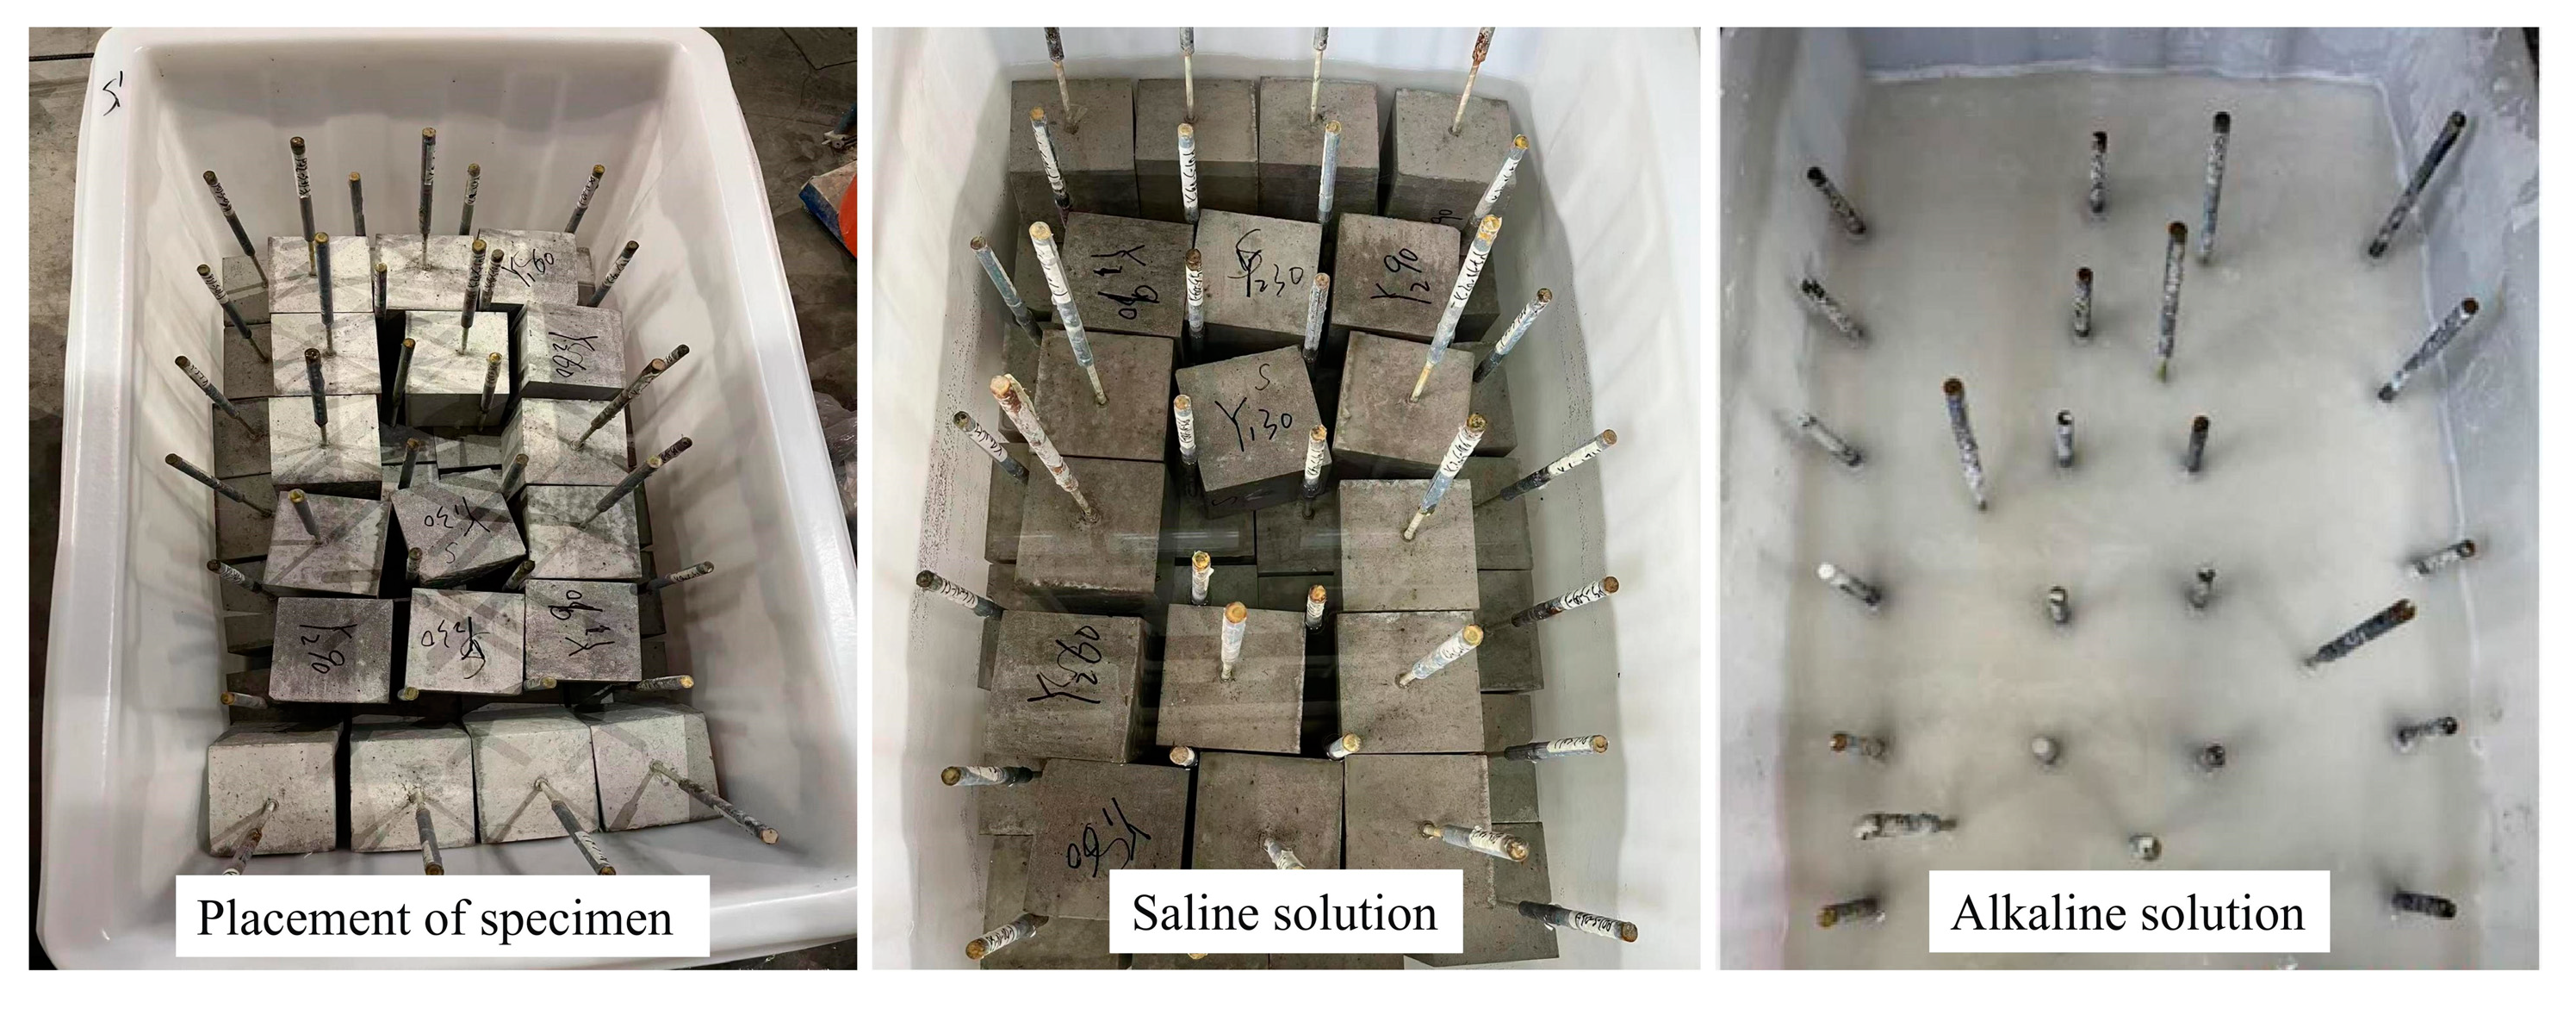
The specimens were arranged neatly in the immersion box and filled with saline and alkaline solutions, as shown in in Figure 5. When the immersion time was reached, the specimen was removed and the impurities on the surface of the specimen were rinsed with clean water. After the specimen was completely dried, the pullout test was carried out within 24 h after the specimen was removed from the solution.
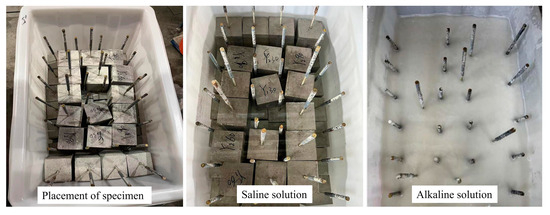
Figure 5.
Specimen placement and immersion.
2.5. Test Setup and Procedures
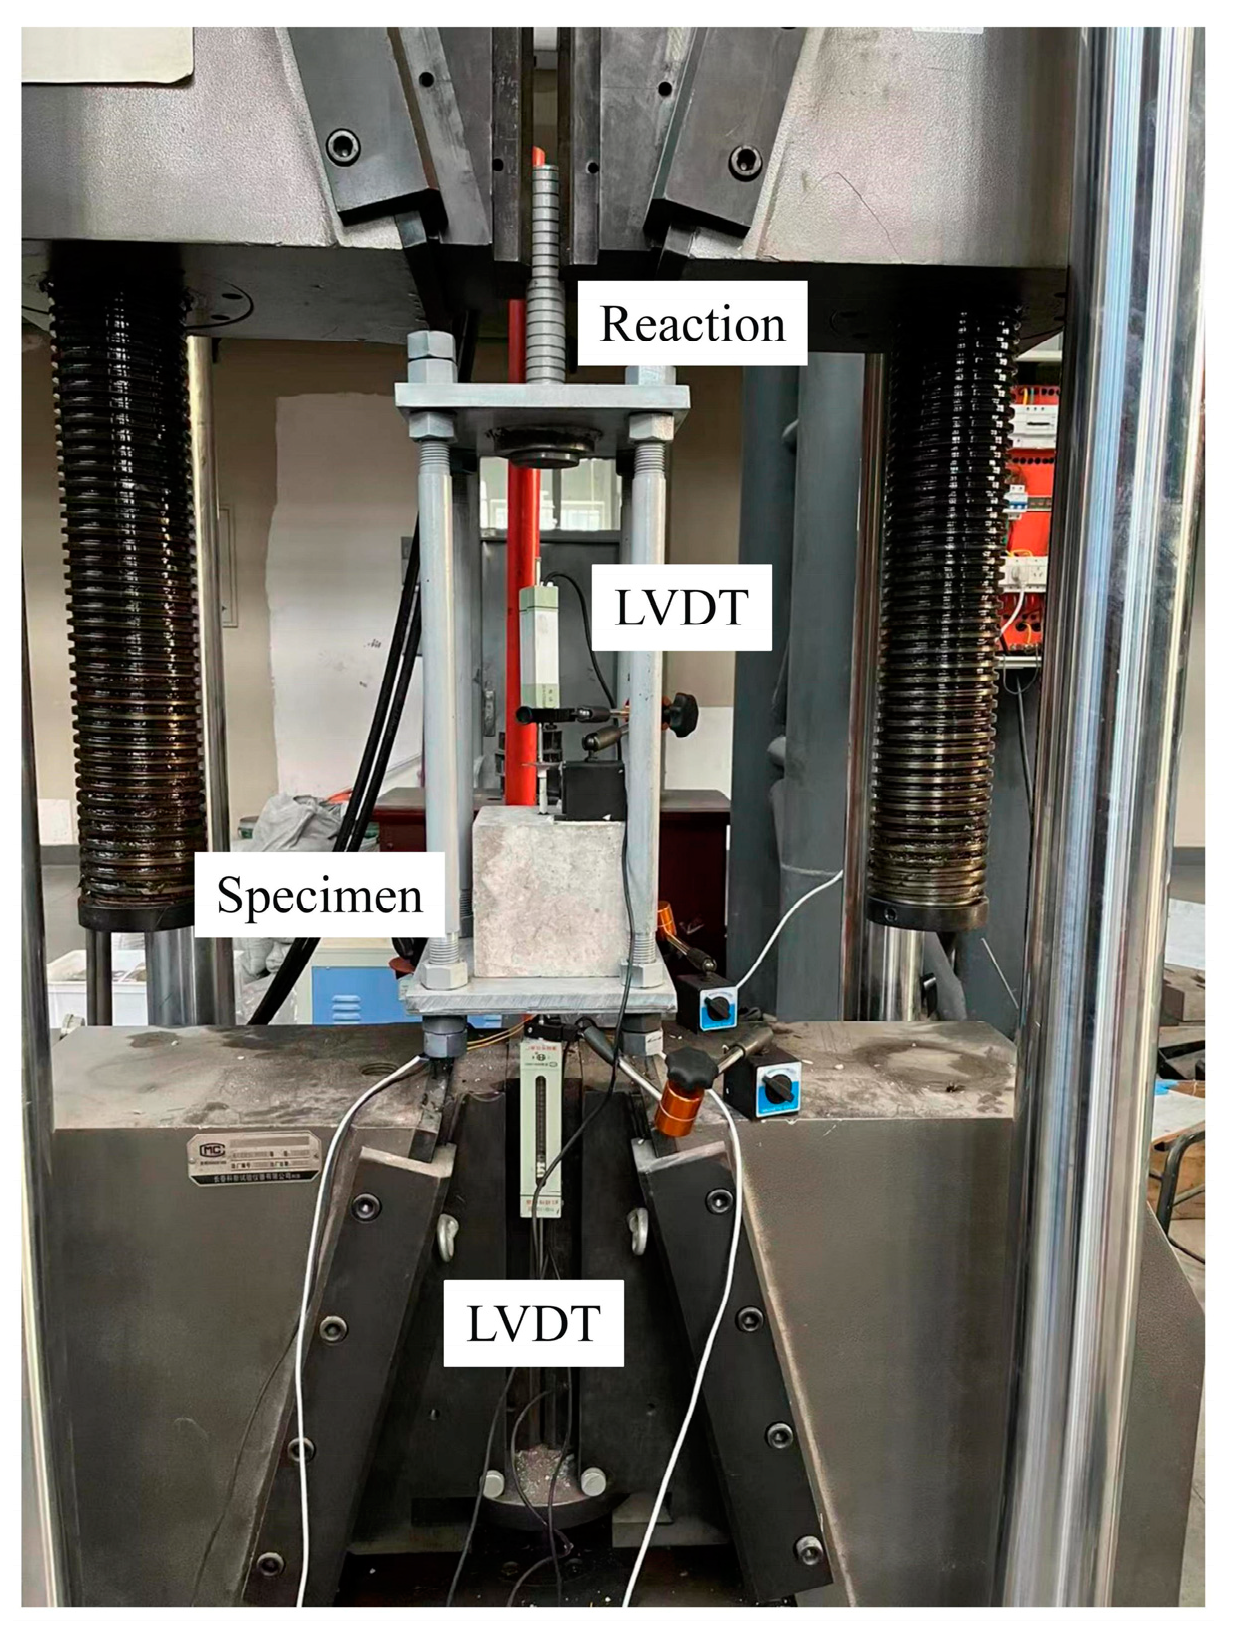
The test loading device is shown in Figure 6. The fixture of the test machine holds the reaction frame, and the lower fixture of the test machine holds one end of the steel casing and fixes it. The test machine is stretched upward, and the free end of the LVDTs measures the slip of specimen. Three LVDTs are distributed at the loading end, and the angle between the three LVDTs is 120°. The average of three LVDTs is used as the slip value for the loading end.
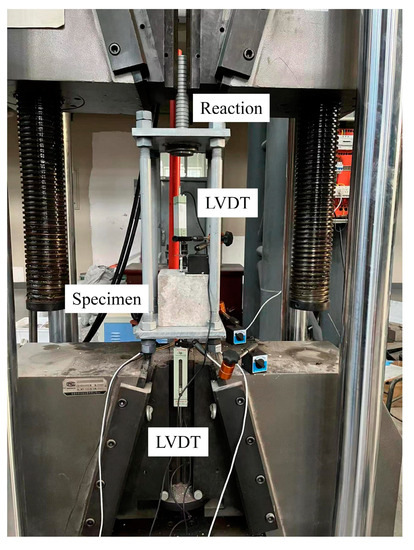
Figure 6.
Test setup.
3. Test Results and Discussion
3.1. Test Observations
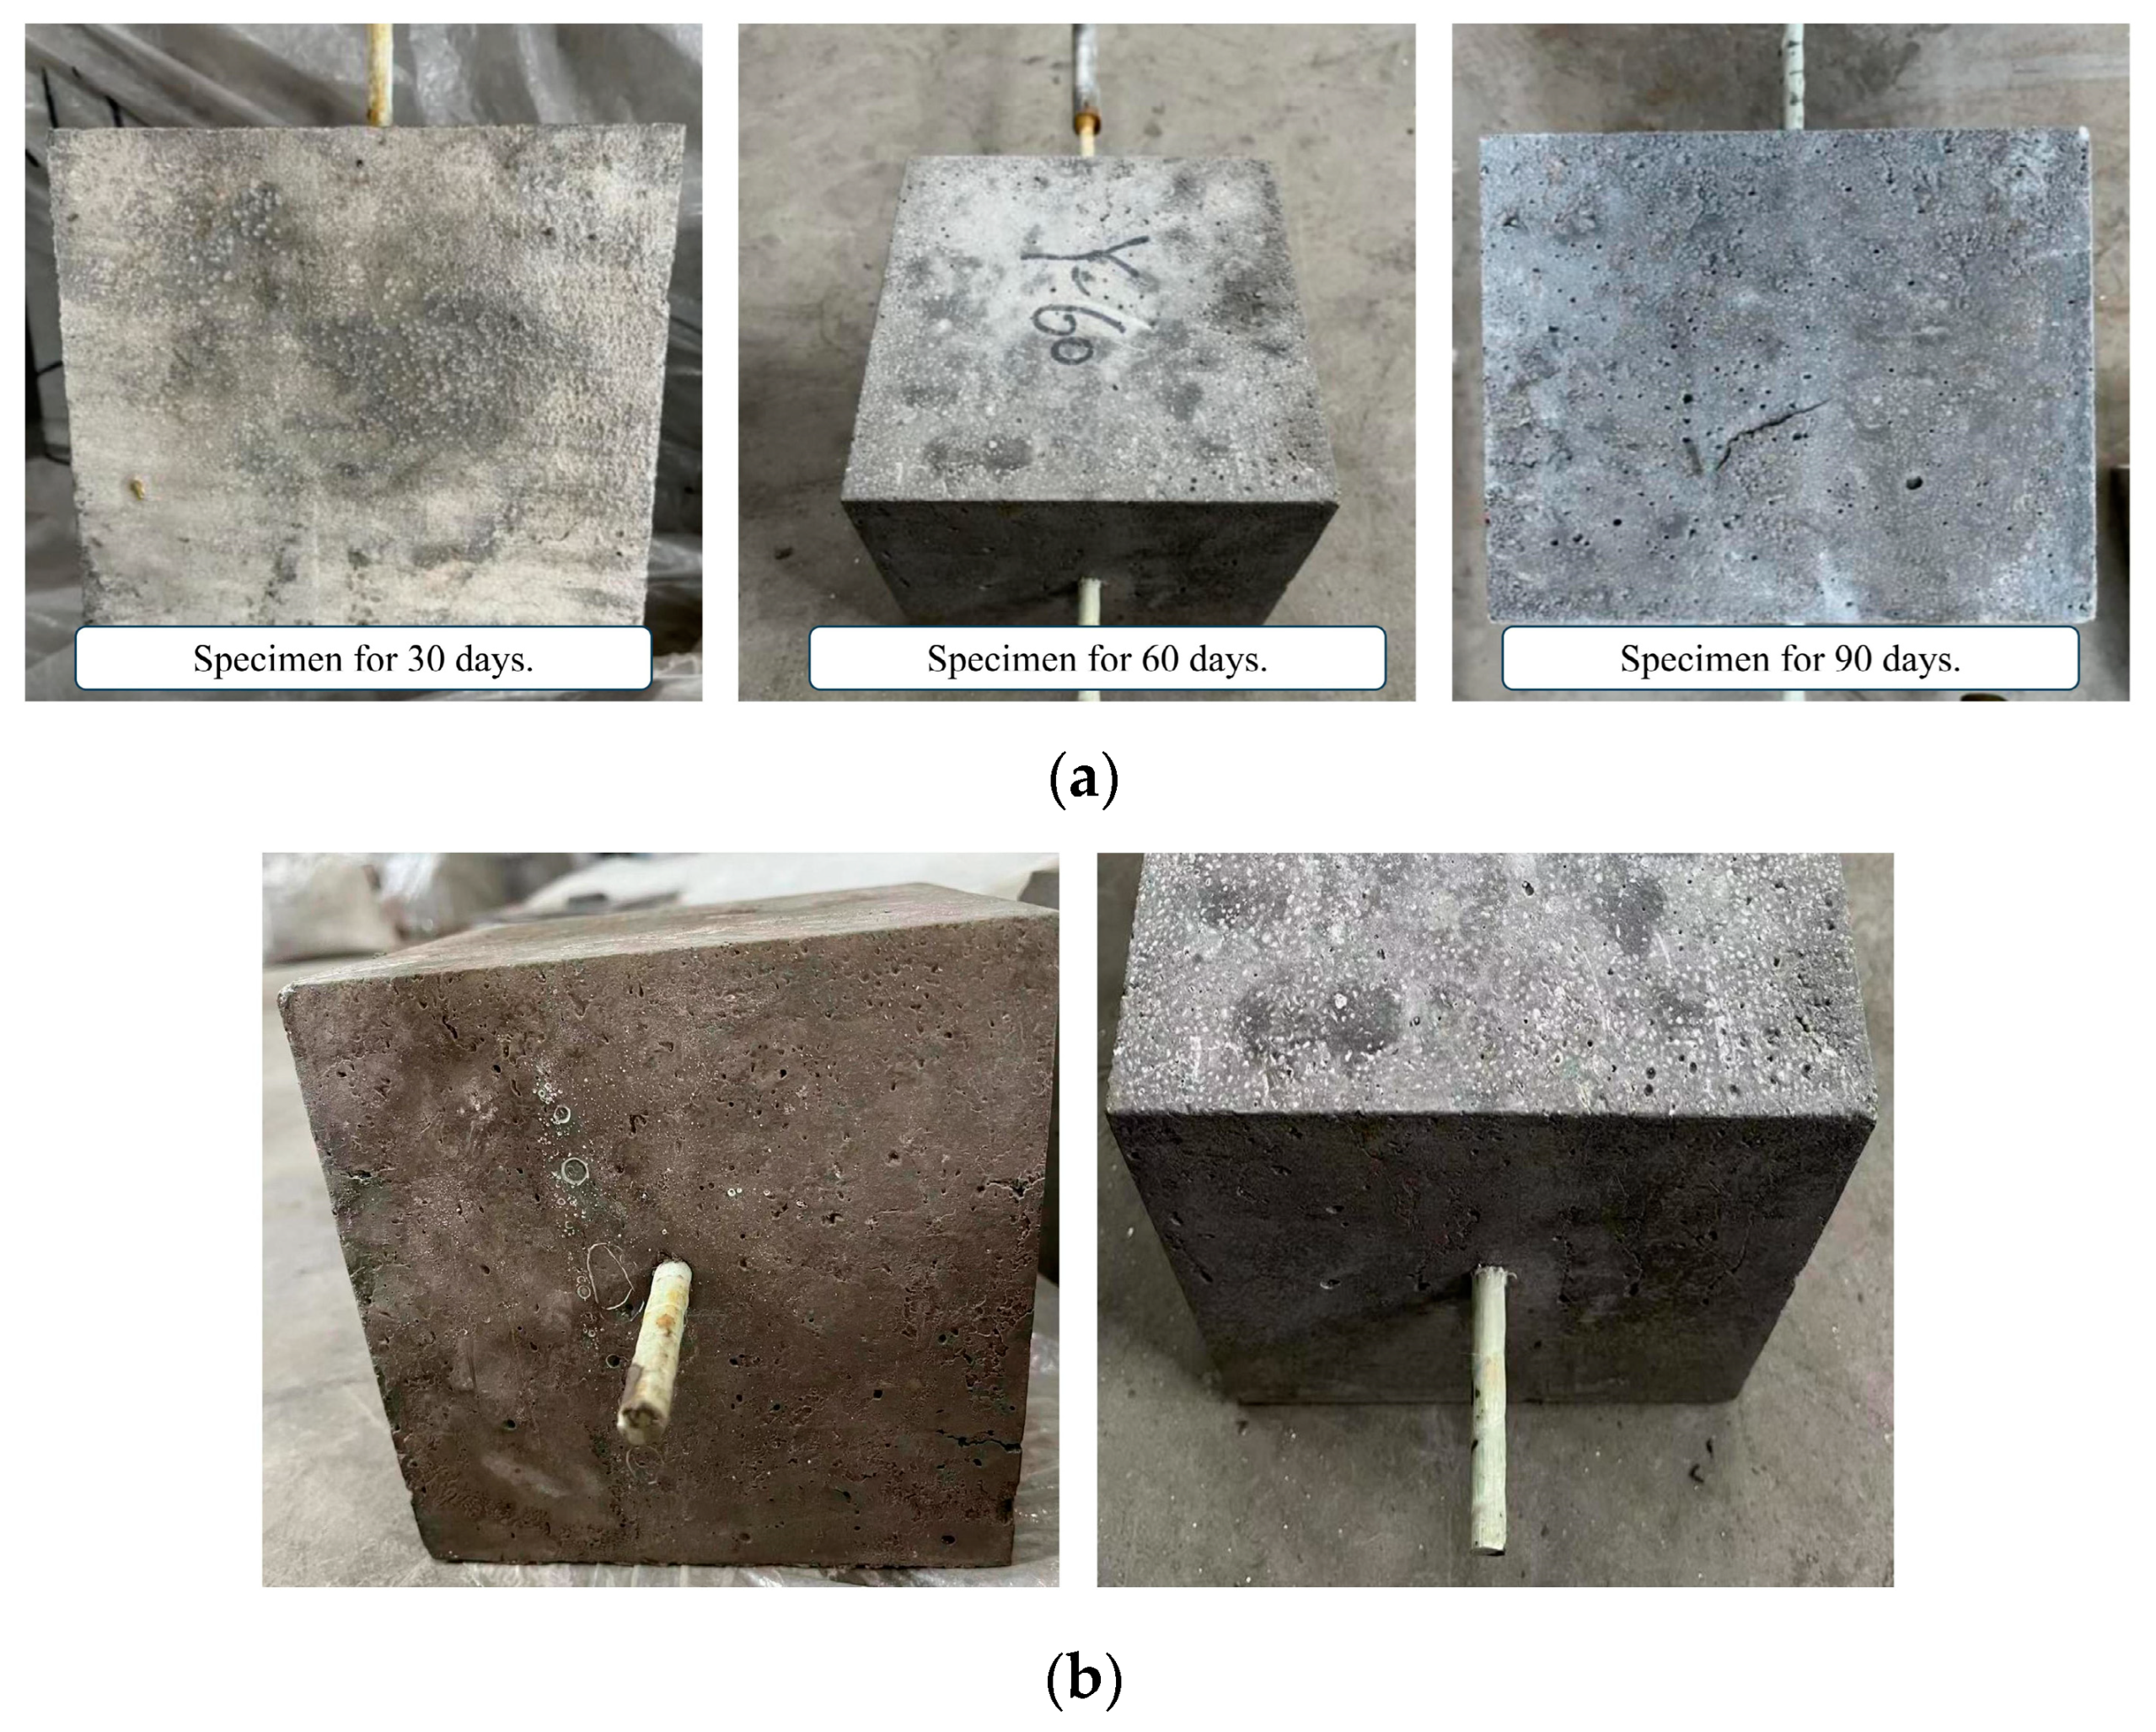
Figure 7 shows the surface changes of the specimen after immersion with the saline solution. It can be seen that there are white crystal particles attached to the surface of the specimen. This is because, with the increase in the immersion time, part of the water in the solution will be evaporated, resulting in the increase in the solution saturation and the precipitation of sodium chloride and sodium sulfate crystals. Sulfate ions penetrate into the interior of the concrete from the outside and react chemically with the components of the concrete. There are more and more pits on the surface of the specimen due to the saline solution.

Figure 7.
Surface characteristics of specimens immersed in saline solution. (a) Corrosion of concrete surface; (b) Corrosion of GFRP bars’ surface.
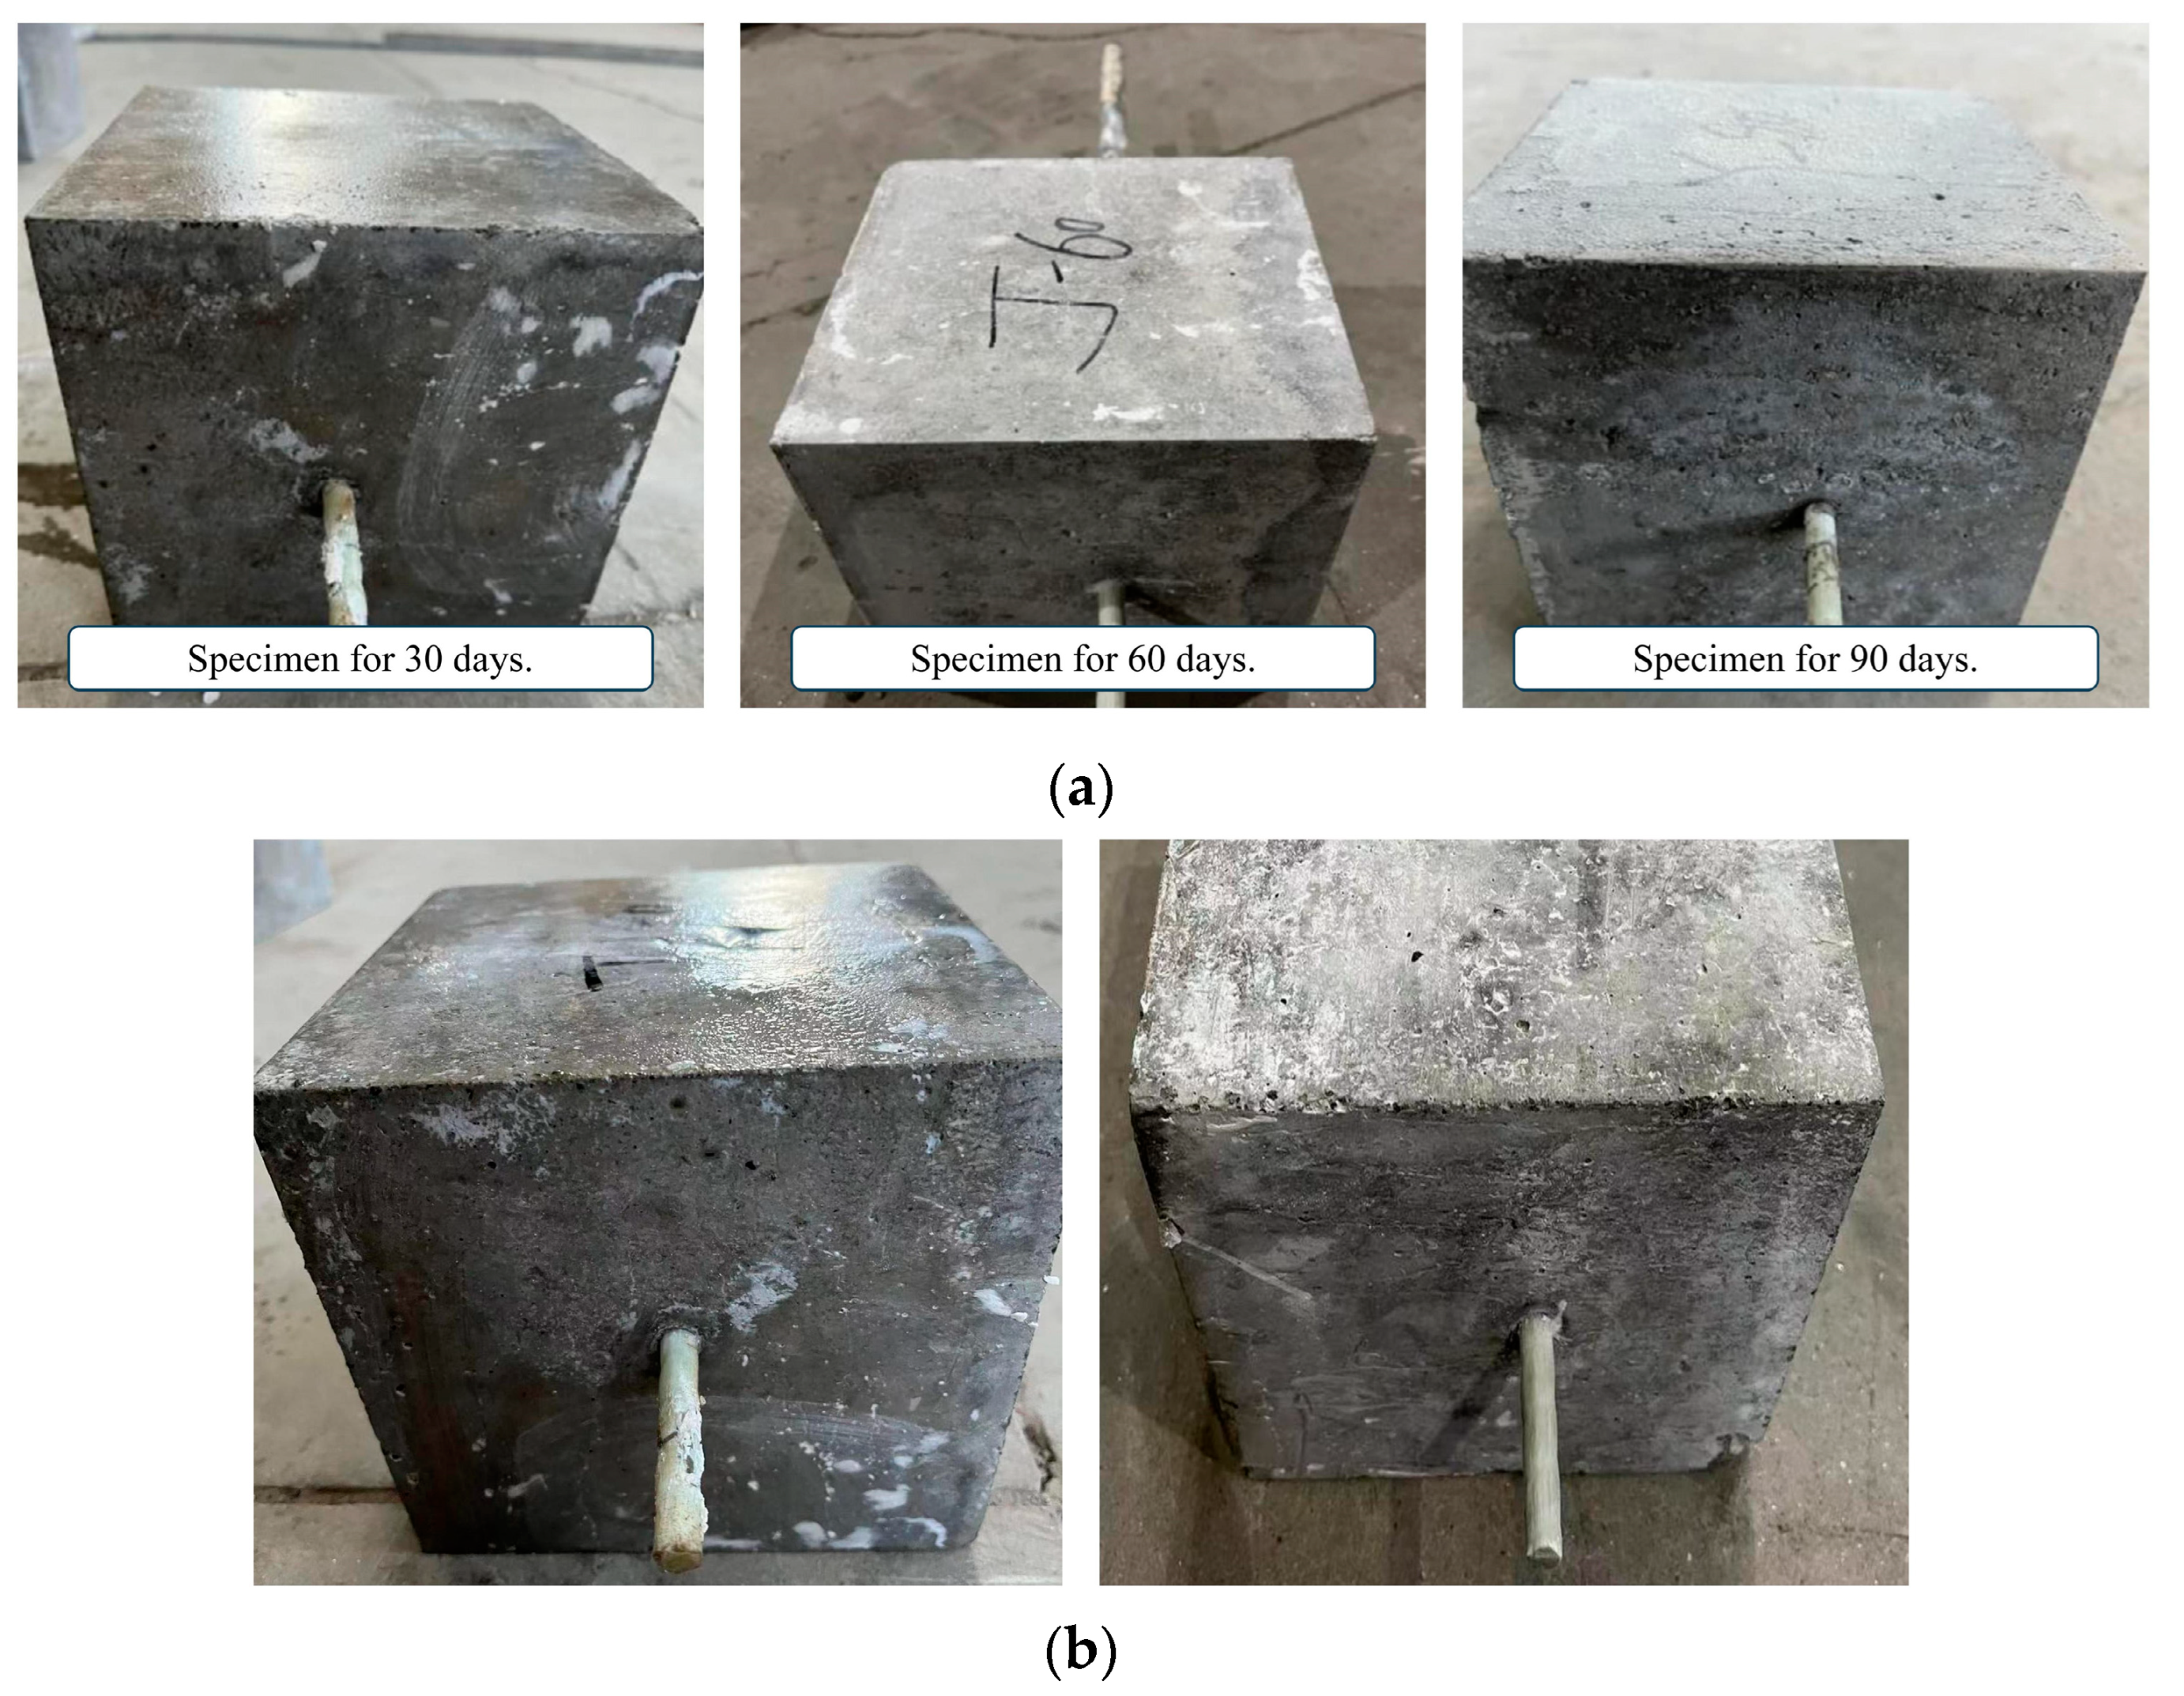
Figure 8 shows the surface changes of the specimen after immersion in the alkaline solution. The proportion of calcium hydroxide in the alkaline solution is relatively large, and calcium hydroxide is slightly dissolved in water at room temperature, and a layer of lime slurry floats in the alkaline solution. The surface of the specimens is stained with the lime slurry, and many impurities, such as lime powder, remain after washing and drying. After immersion, the GFRP bars corrode severely and the surface fibers become more brittle.
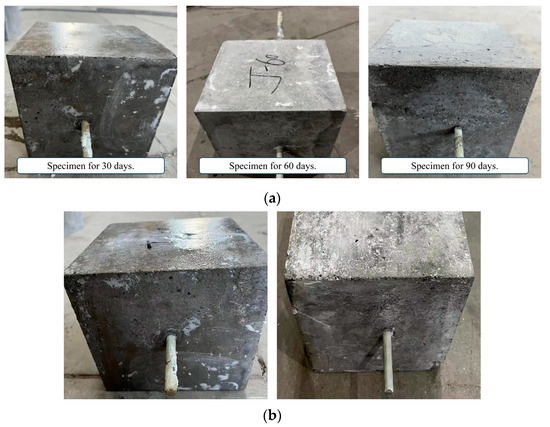
Figure 8.
Surface characteristics of specimens immersed in alkaline solution. (a) Corrosion of concrete surface; (b) Corrosion of GFRP bars’ surface.
3.2. Failure Modes
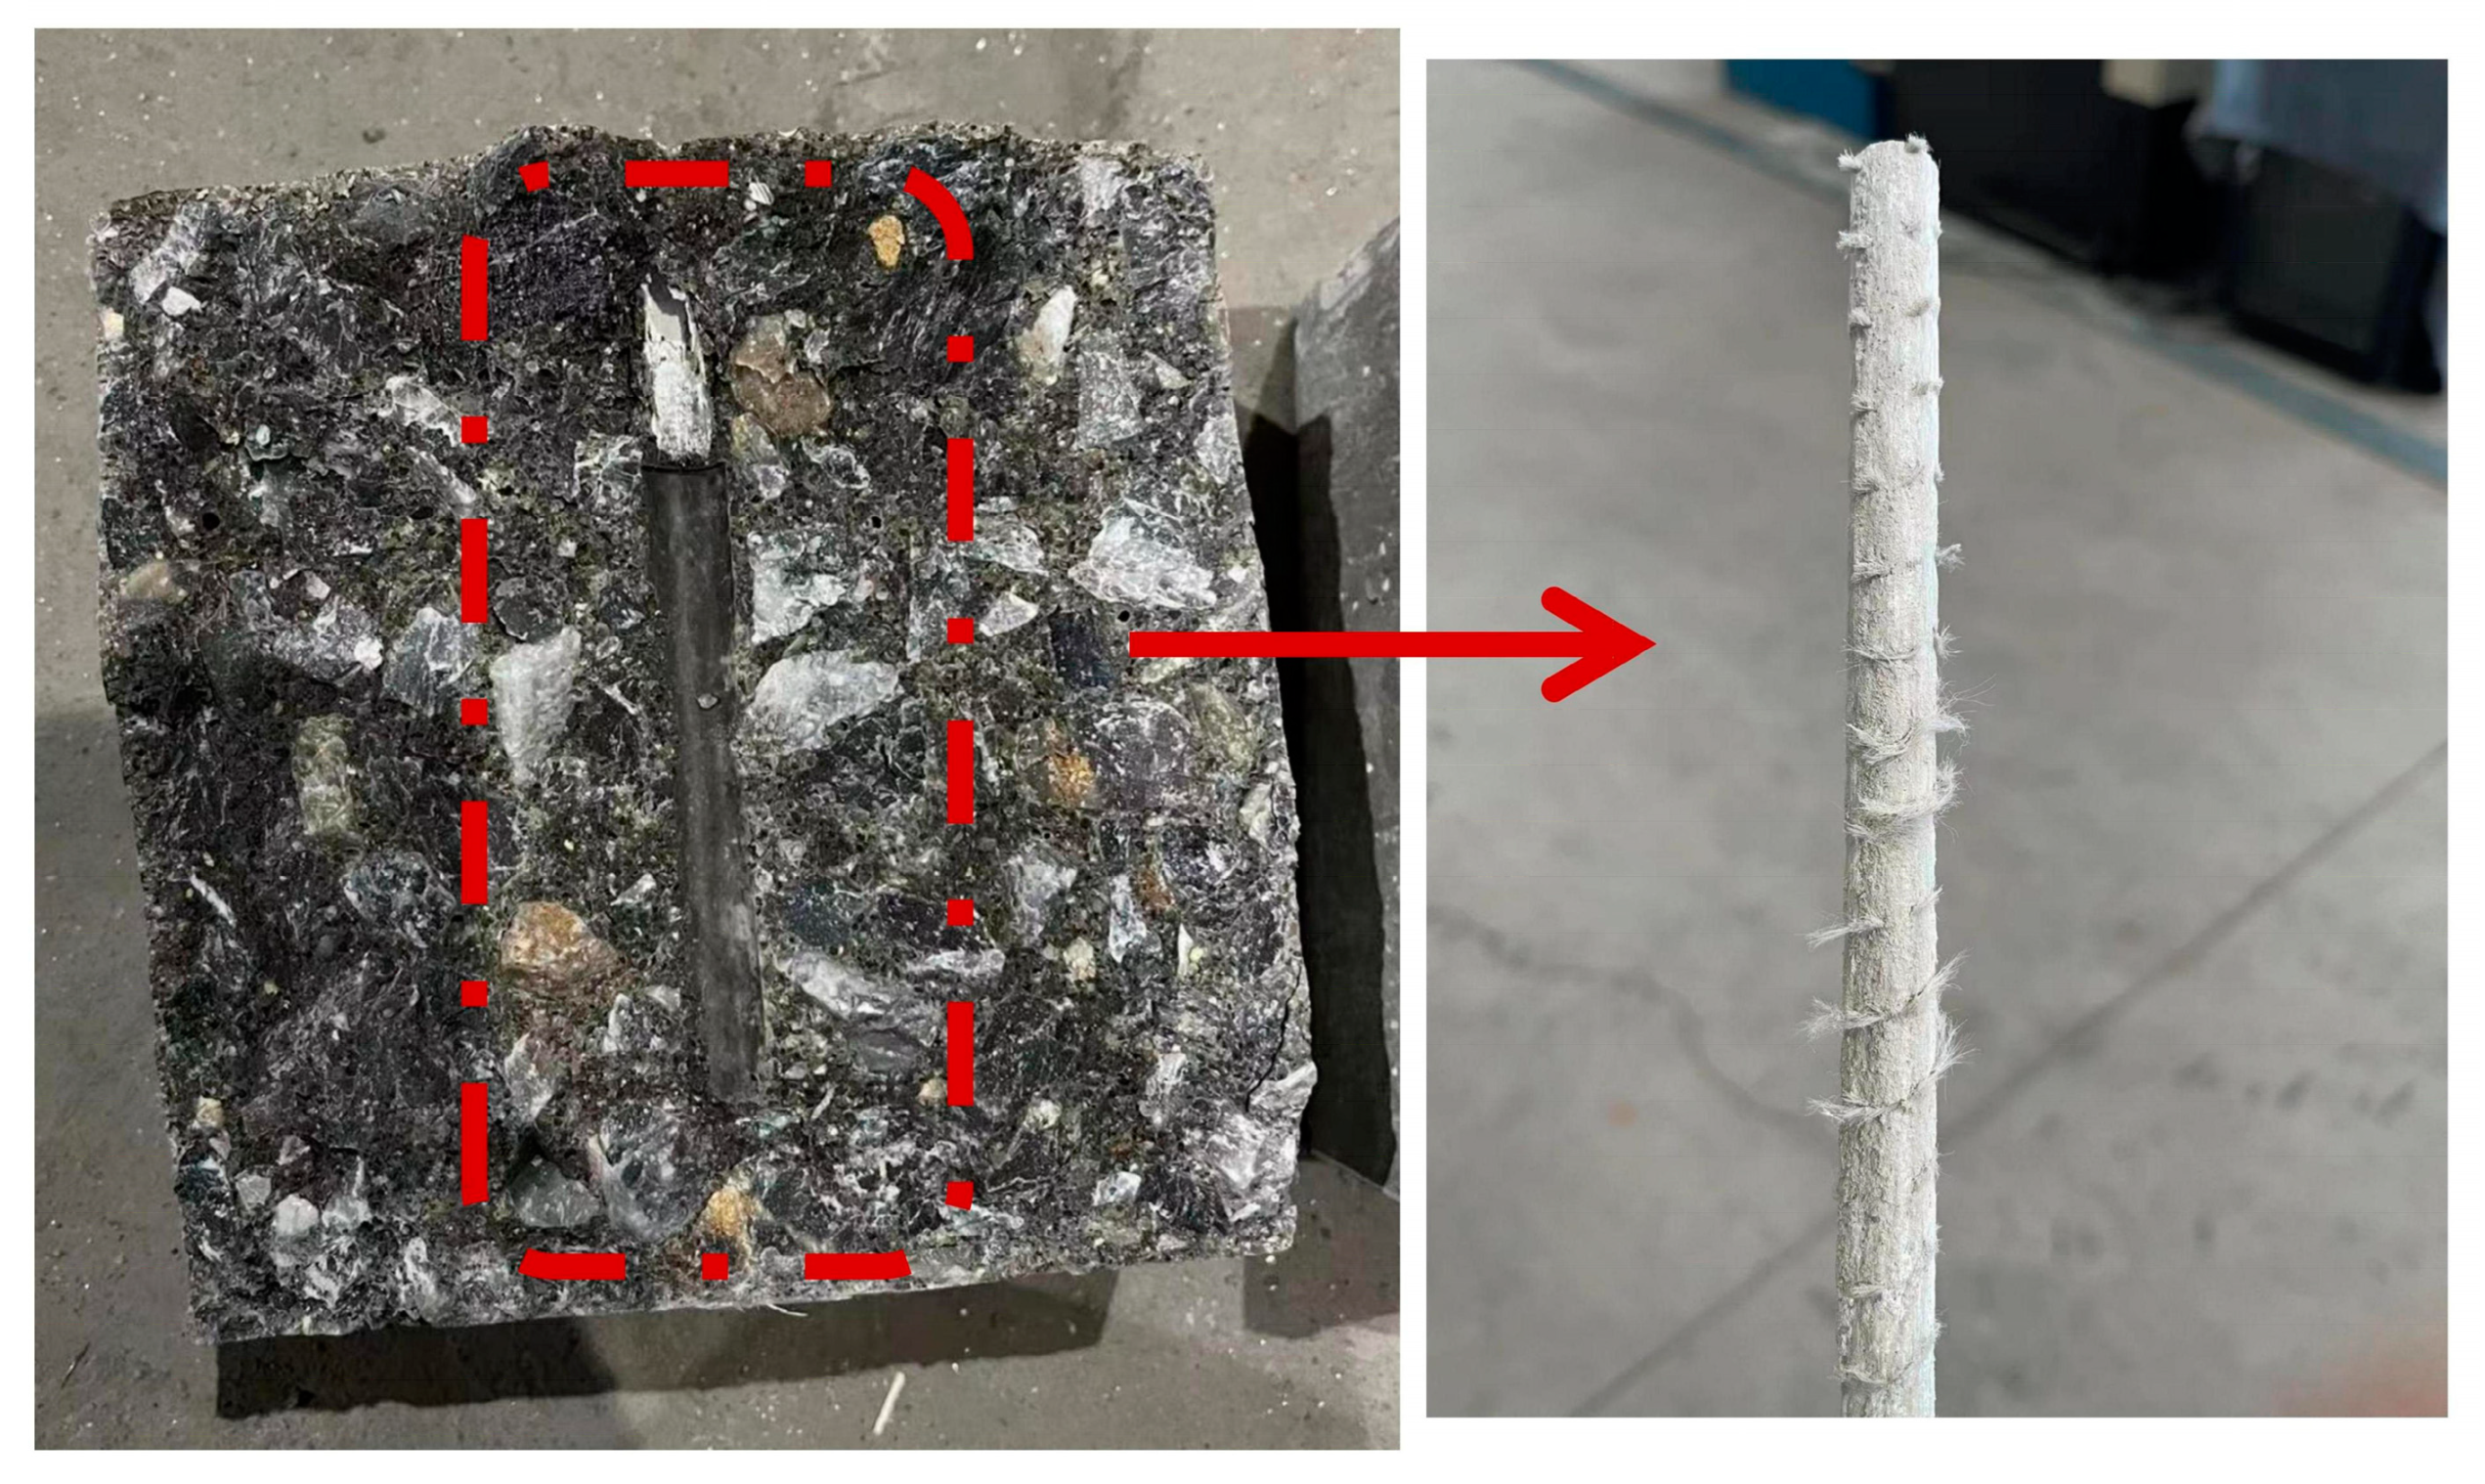
Through 12 groups of 36 tested specimens, the failure mode was pullout failure. When the GFRP bars were pulled out, the concrete remained relatively intact and largely free of cracks. To accurately analyze the failure pattern, the concrete was split and the interface between bars and concrete was observed. As shown in Figure 9, it can be clearly observed that the GFRP bars are severely worn and become smooth in the bonding section. The surface fibers are almost completely cut off by concrete, and the concrete damage is not serious. The reason for this phenomenon may be that the rib on the surface of the bars itself is relatively shallow, which is difficult to cause shear damage to the concrete, and the mechanical interaction is relatively small. The test results of 12 groups of 36 specimens and the bond strength values calculated by applying Equation (1) are recorded in Table 5. In Equation (1), τ is the bond strength (MPa); P is the ultimate pullout load (N); d is the diameter of GFRP bar (mm); l is the bond length (mm).
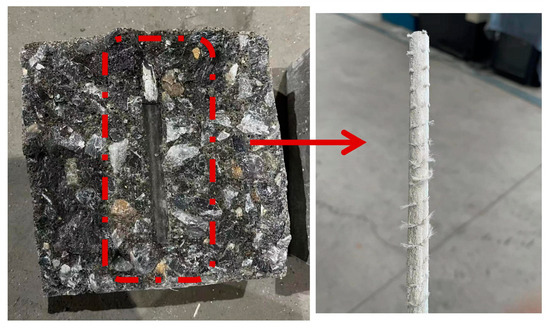
Figure 9.
Bond surface of the specimen.
Table 5.
GFRP–concrete pullout test results under corrosive environment.
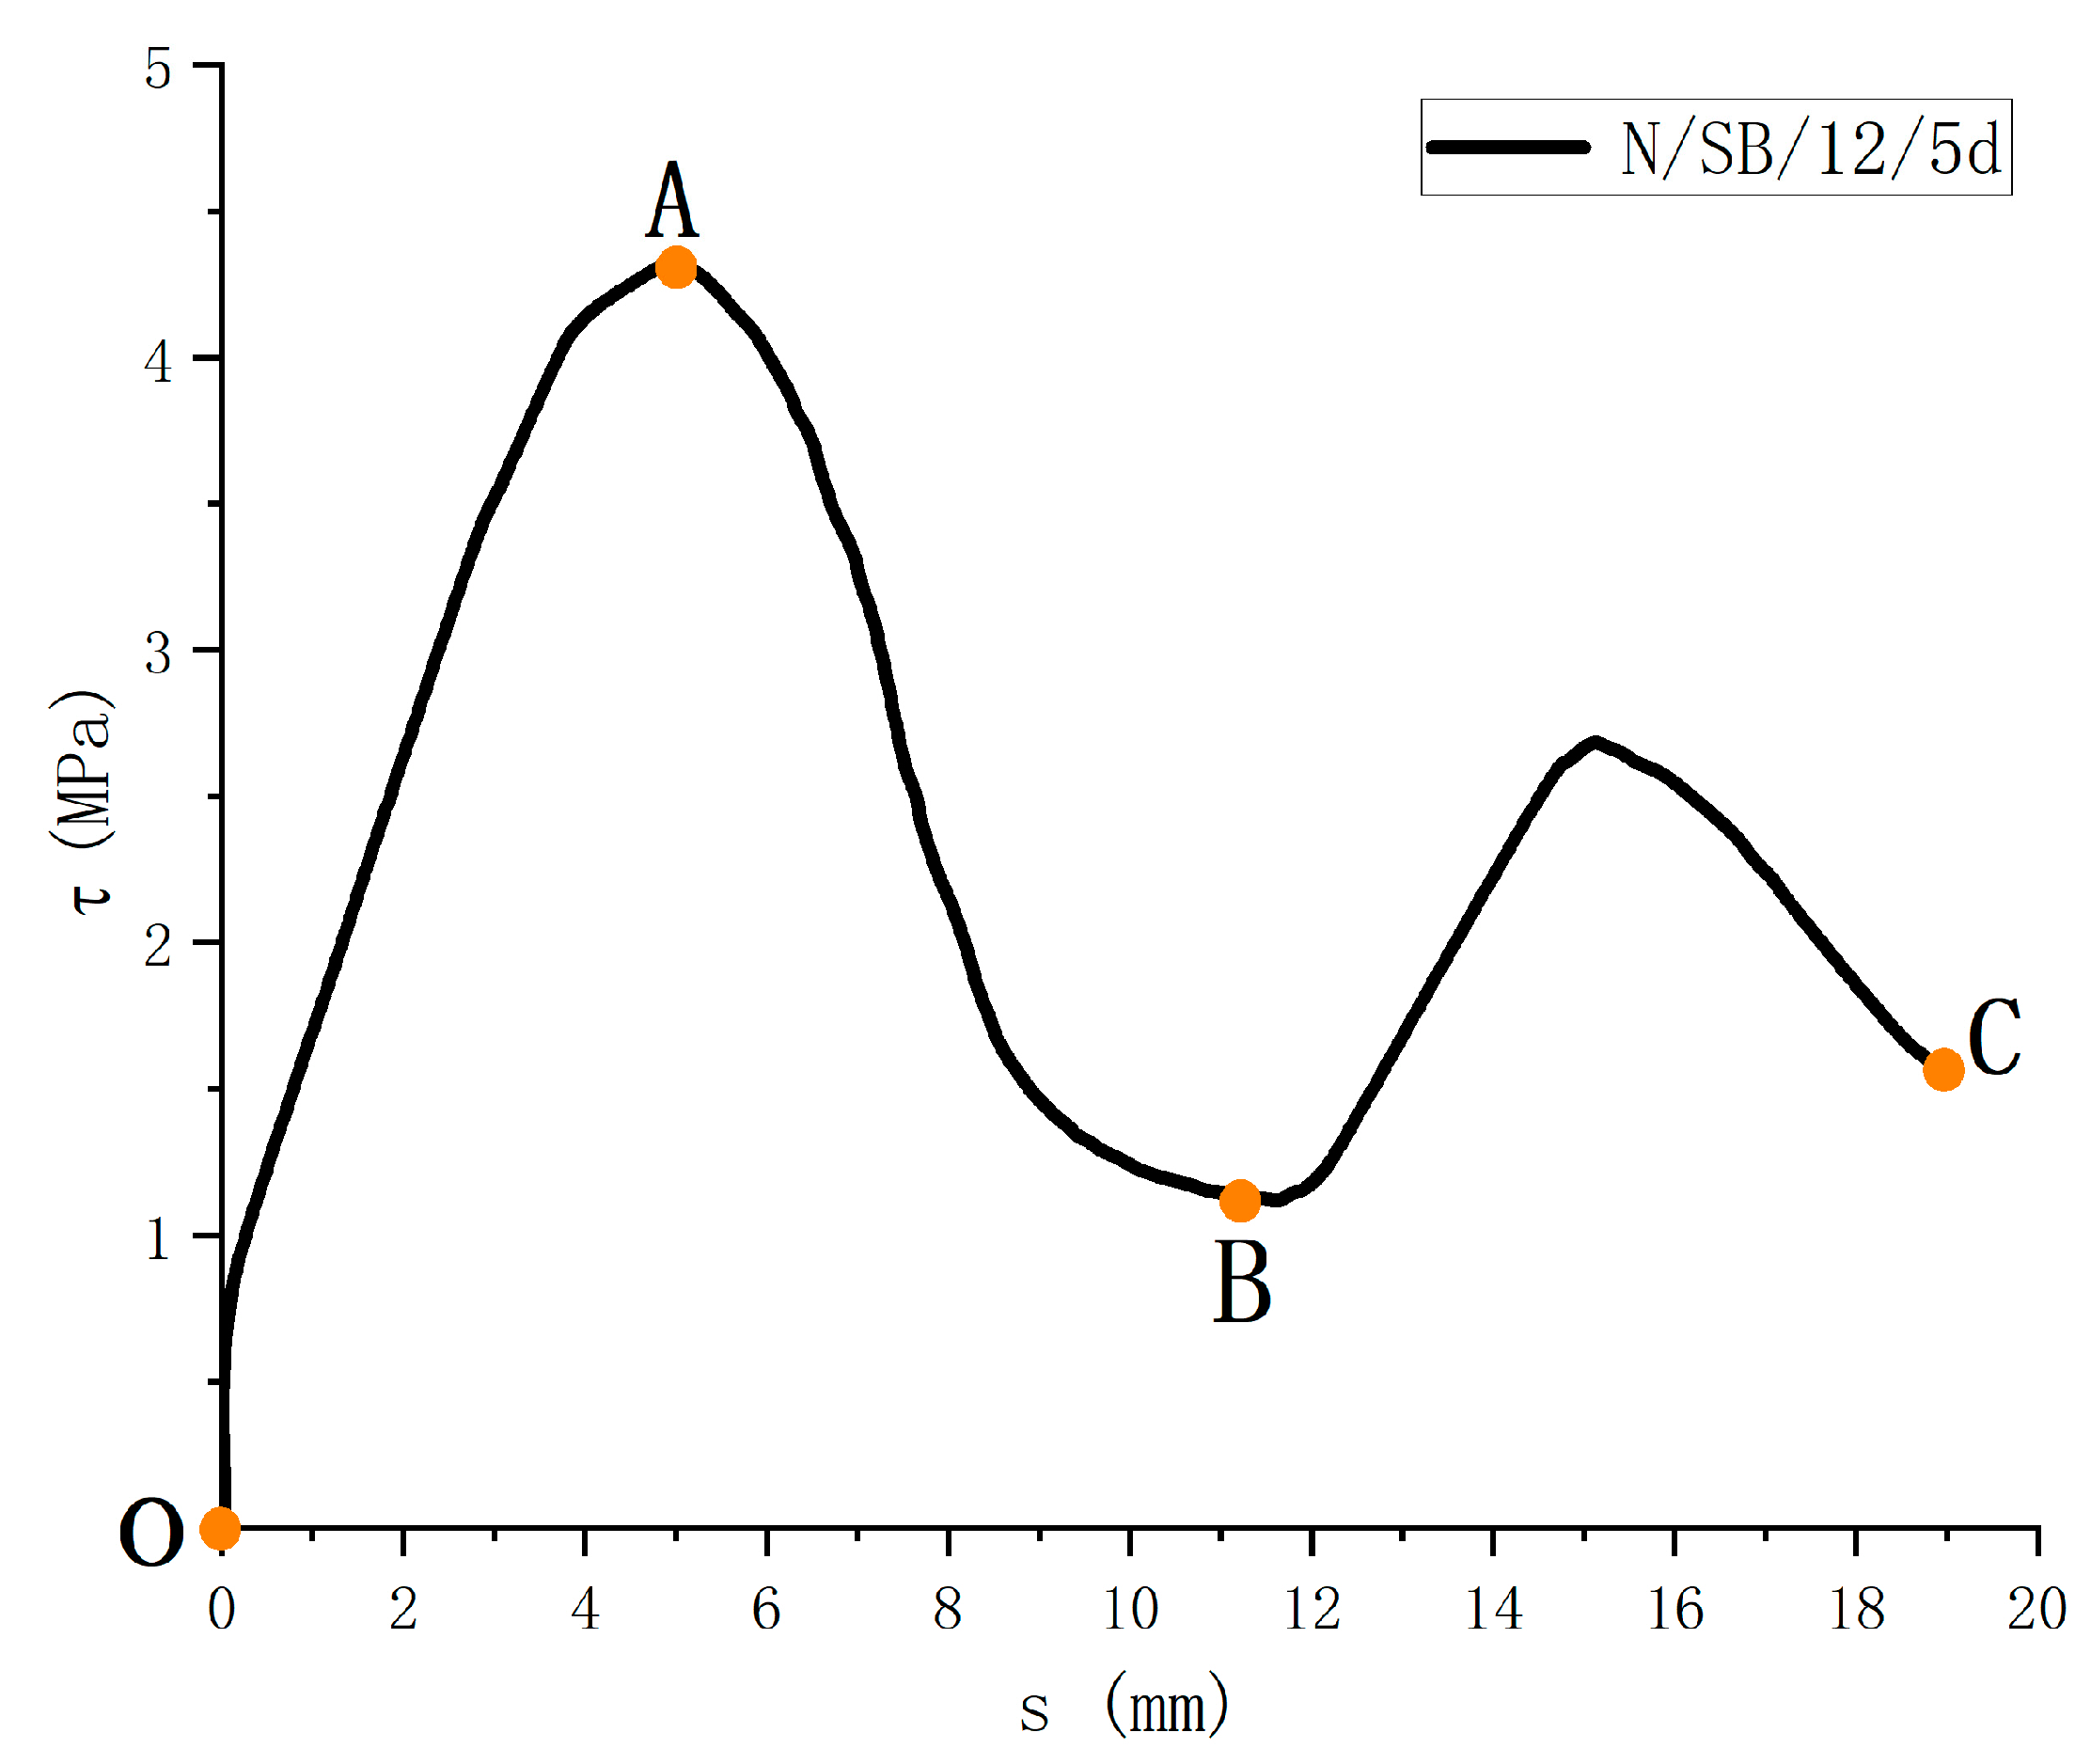
The τ-s relationship is shown in Figure 10. It can be obtained that, although the test materials, test variables, and external influencing factors are different, they can be roughly summarized into three stages. Among them, the first two stages are mainly used to analyze and discuss the bond performance.
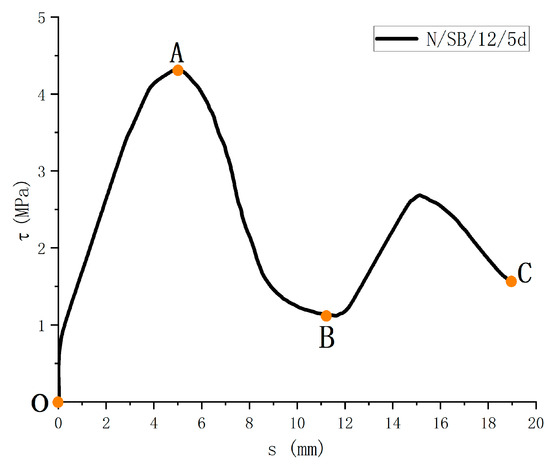
Figure 10.
Bond-slip curve of specimen.
OA ascending section: Firstly, the bond layer between the two materials is destroyed, and the slip begins to occur. The amount of slip increases gradually, and the bond strength increases gradually. The curve is in the rising segment, and the line shape is closer to the exponential rising form. The specimen is in the stage of elastoplastic deformation.
AB descending section: After the bond strength reaches maximum value, the specimen has a relatively large pullout or splitting failure. The bonding stress, nevertheless, does not disappear immediately. The bond strength slowly decreases, and the curve enters the lower half section. Through the analysis of the existing models, most of the models approximate the curve of the lower half section as linear. During this stage, the mechanical interaction is significantly reduced and the concrete shears at the “ribs” on the surface of the FRP bars, resulting in a decreasing average bond strength.
BC residual stress section: After the descending section, the adhesive stress between the GFRP bar and concrete still has some friction force, and the bonded specimen enters the residual stress stage. The curve shows a sinusoidal wave shape, with each peak weakening as the amount of slip increases.
3.3. Analysis of Influencing Factors
3.3.1. Effect of the Surface Treatment of the GFRP Bar
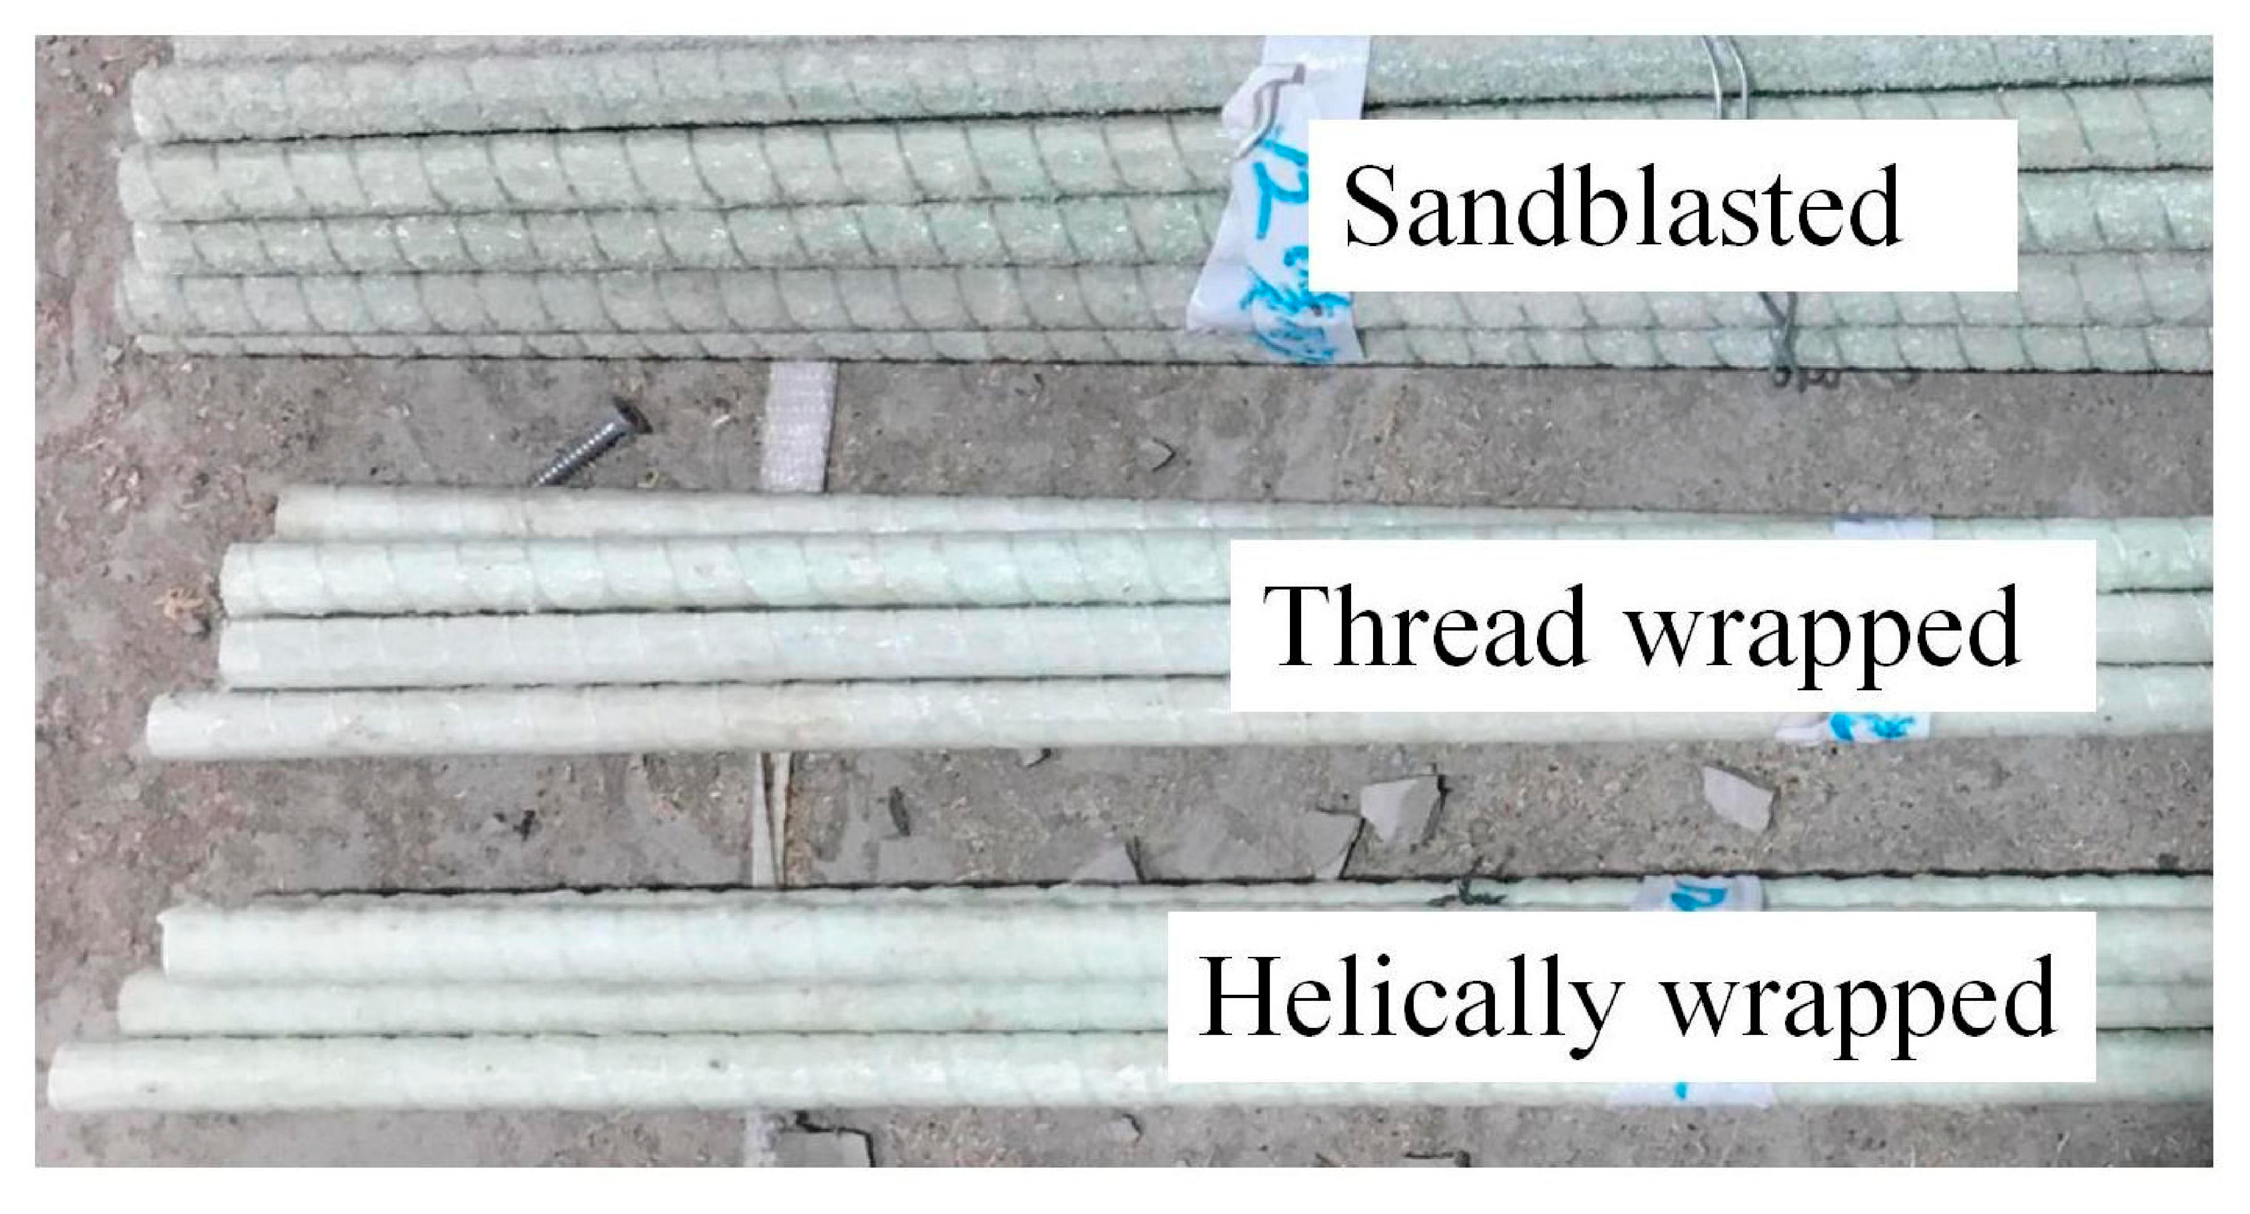
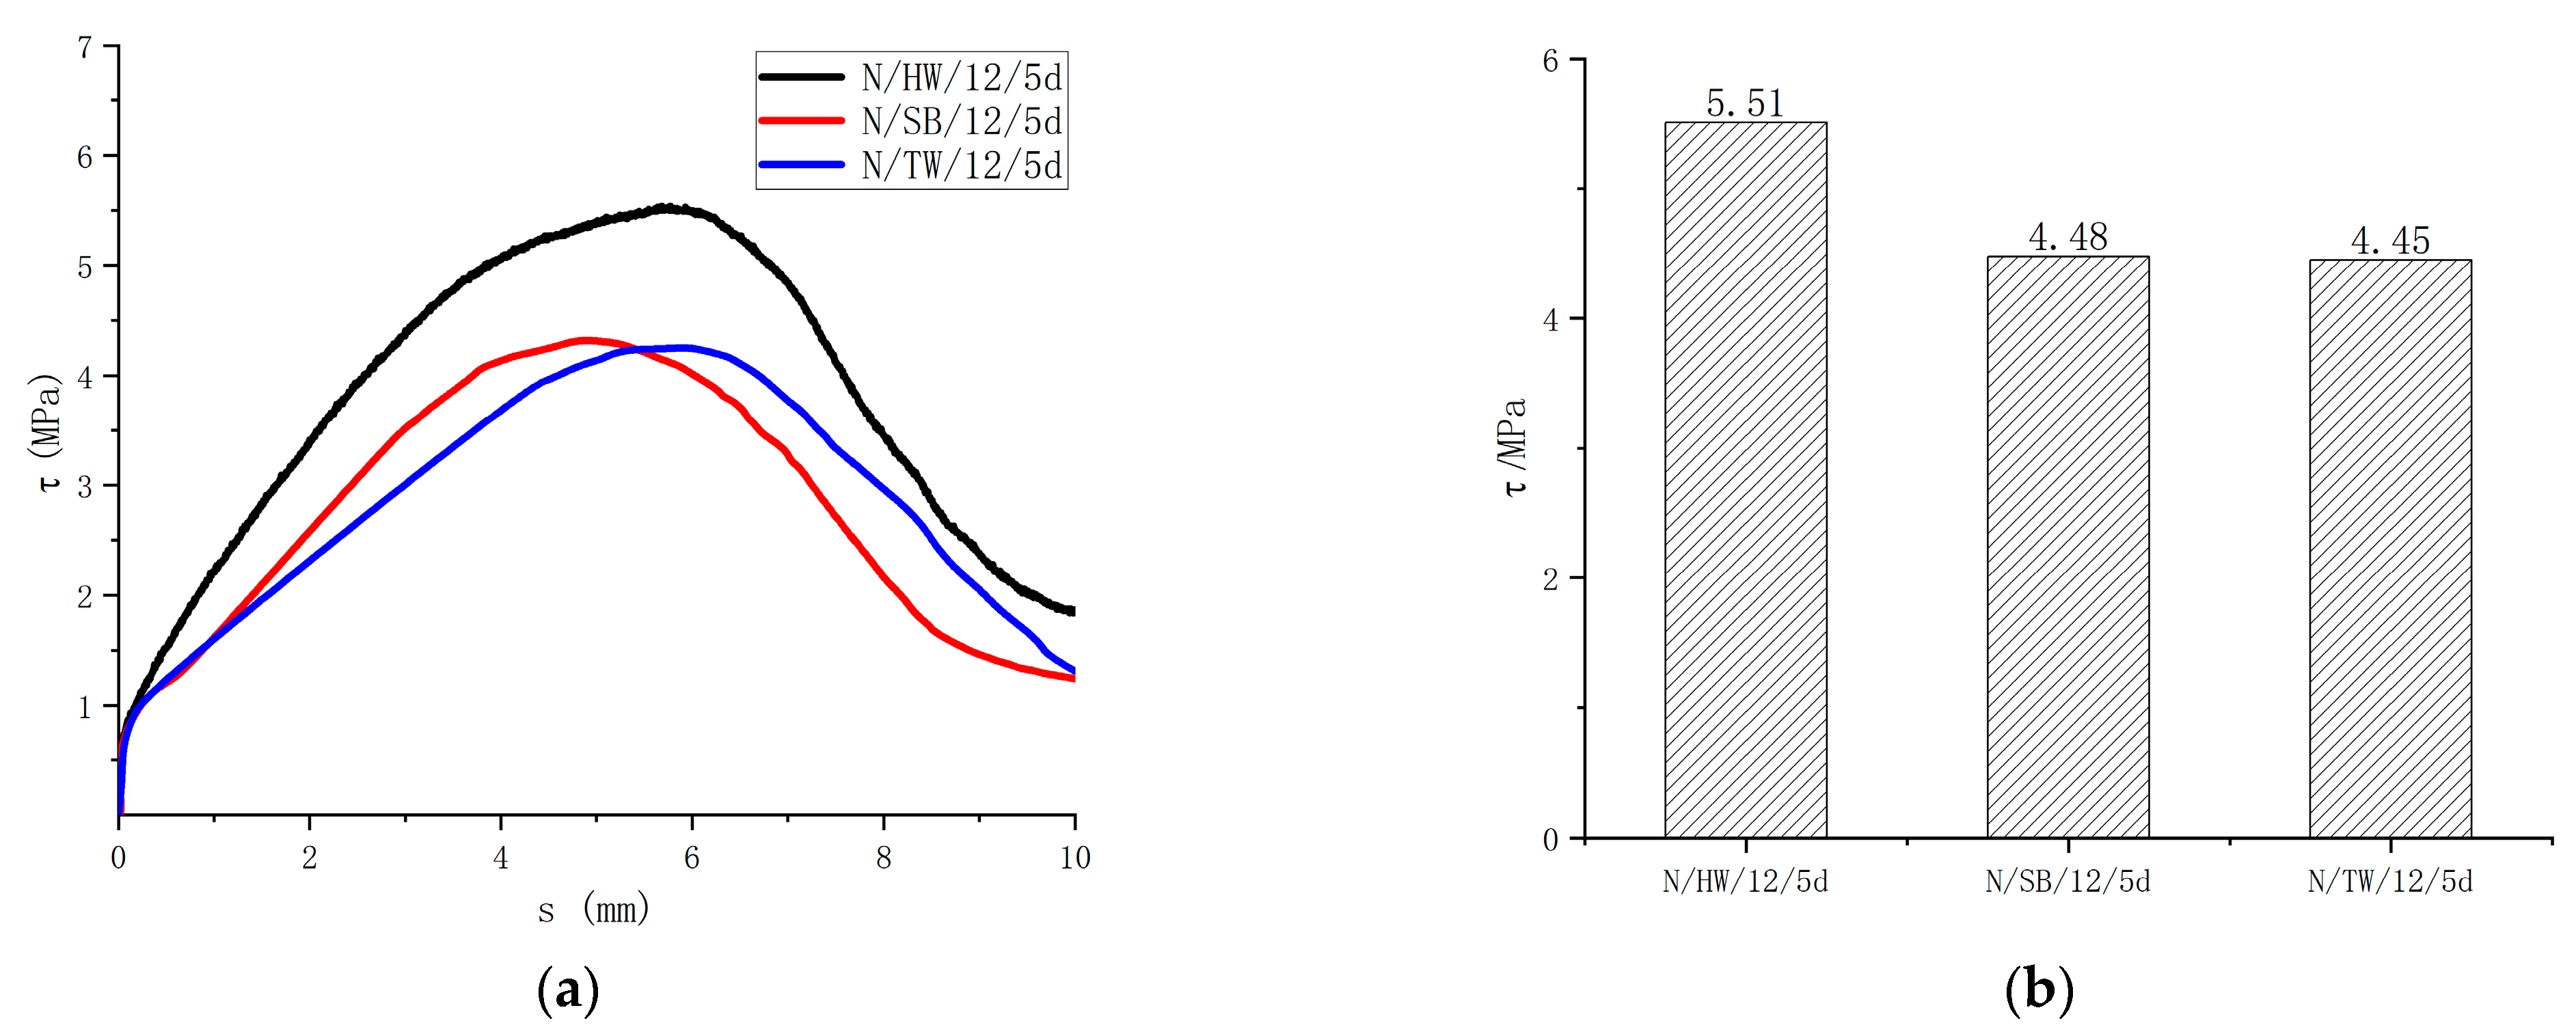
Figure 11 shows the surface forms of the specimens with helically wrapped, sandblasted, and thread-wrapped. The bond strength with helically wrapped, sandblasted, and thread-wrapped are 5.51 MPa, 4.48 MPa, and 4.45 MPa, respectively, as shown in Figure 12. The surface treatment of the GFRP bars will significantly enhance the bond with the concrete. The greater the friction of the specimens, the greater the bond strength. The different surface forms of the bars provide different adhesion forces. Helically wrapped bars increased the friction and mechanical interaction, thus providing greater adhesion forces. The test results indicated that the bond strength of the GFRP bars also varied depending on the surface form. Compared with the helically wrapped form, the bond strength of sandblasted and thread-wrapped forms was reduced by 18.7% and 19.2% respectively. Therefore, the helically wrapped form is recommended for the surface forms of the GFRP bar.
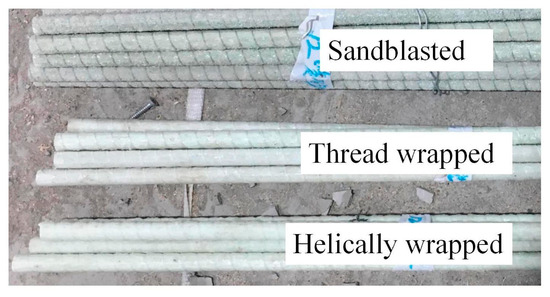
Figure 11.
The surface treatment of GFRP bars.
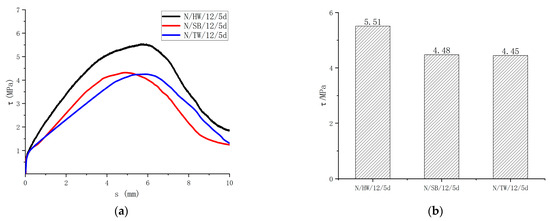
Figure 12.
Influence of the surface form of GFRP bars on the bond strength. (a) Bond-slip curves of different surface treatments of the GFRP bar; (b) Bond strength of different surface treatment of the GFRP bar.
3.3.2. Effect of Bond Length
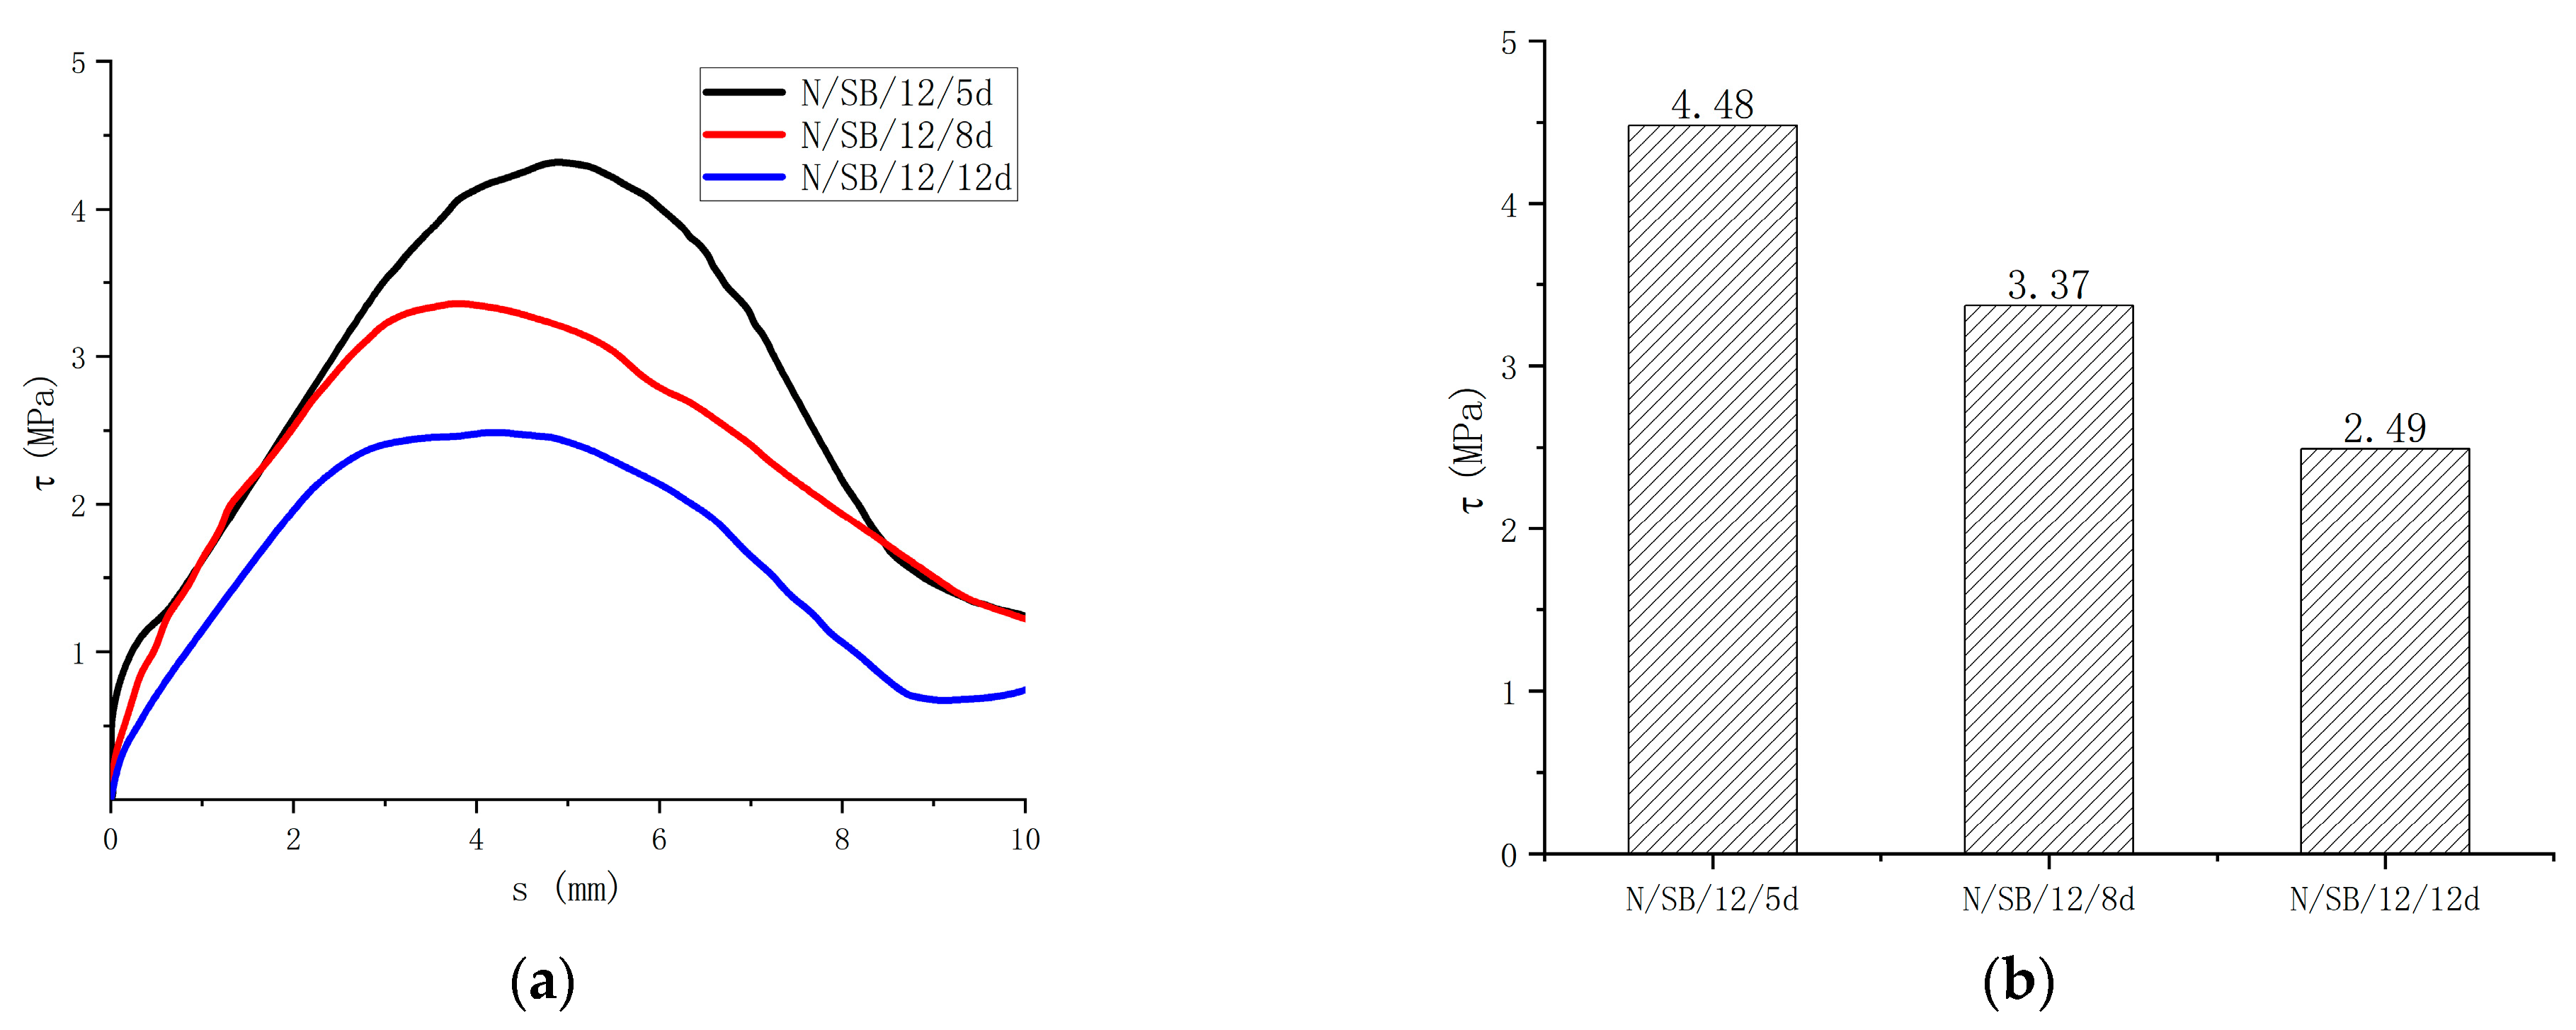
Regarding the effect of the bond length on the bond strength of the specimen, the results can be seen in Figure 13. In comparison to the 5d bond length, the bond strengths of the 8d and 12d specimens were reduced by 24.7% and 44.4%, respectively. The bond strength decreases with the increase in the bond length, which is caused by the uneven bond stress distribution of the GFRP bar along the bond length. With the increase in the bond length, the bond stress distribution becomes more uneven, so the strength becomes smaller.

Figure 13.
Comparisons of test results with different bond length. (a) Bond-slip curves of different bond lengths; (b) Bond strength of different bond lengths.
3.3.3. Effect of Immersion Solution Type
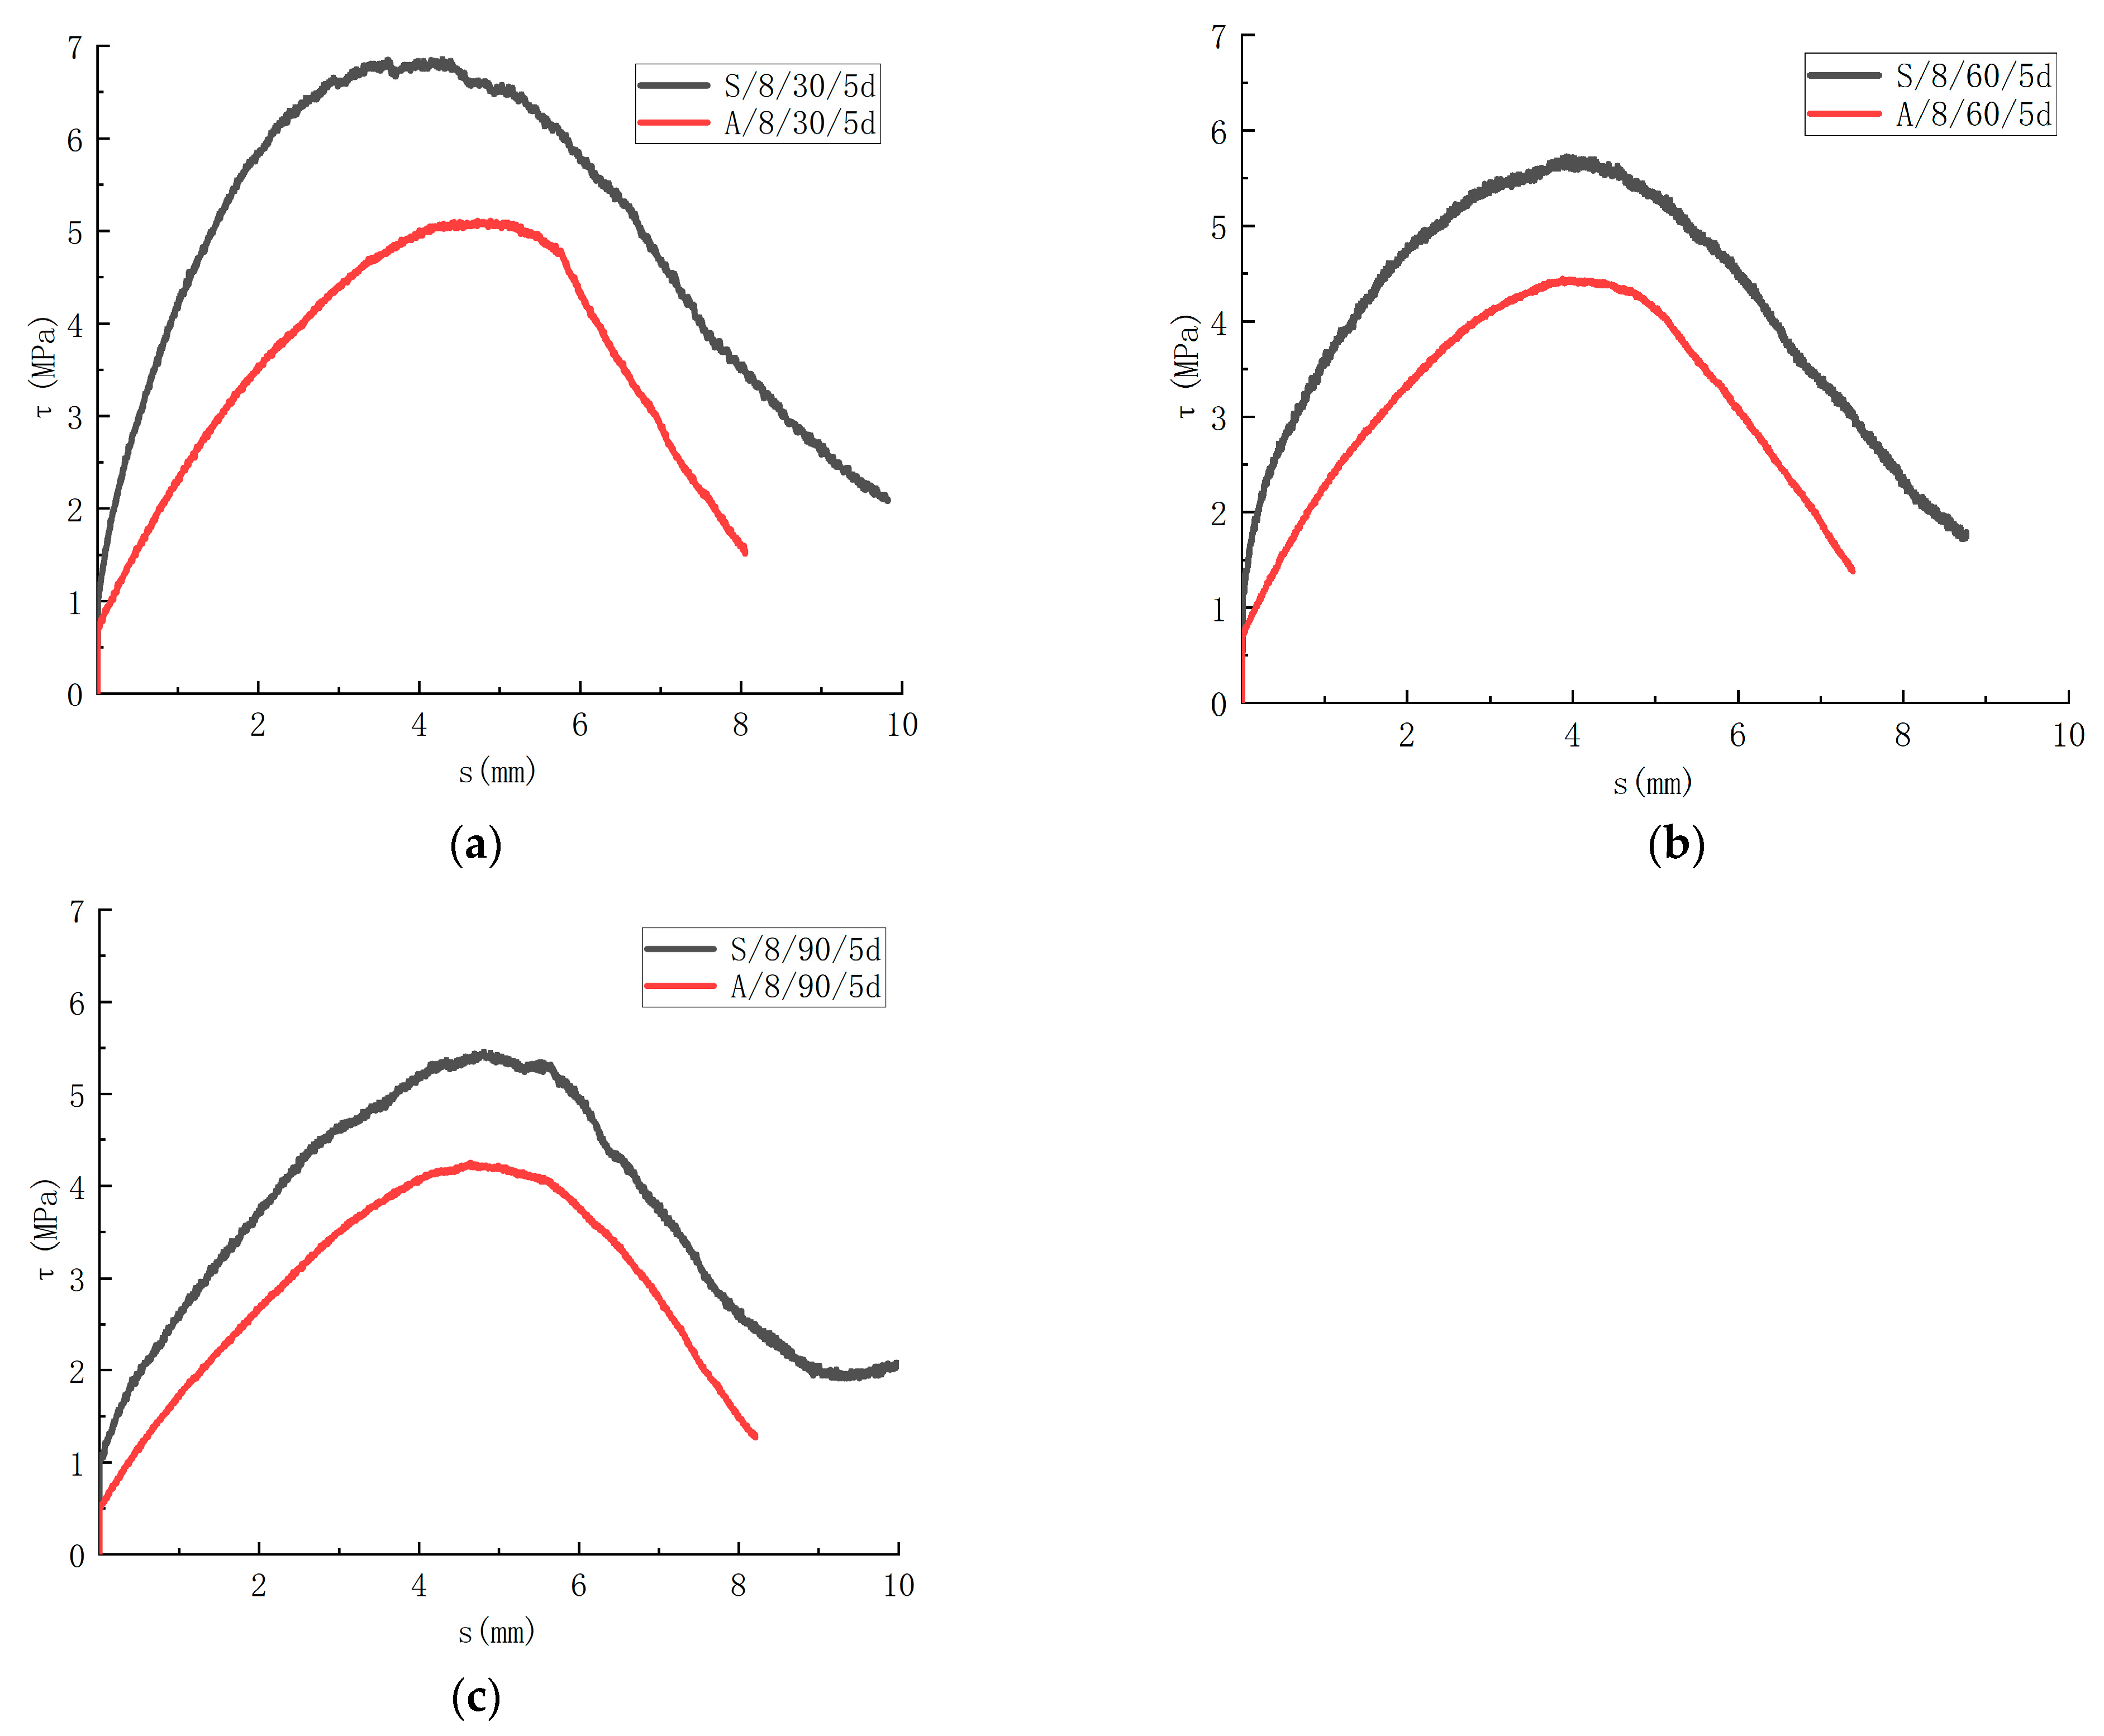
The degradation properties of the GFRP bars in different corrosive solutions are different. In this paper, the influence of the saline solution and alkaline solution on the bond strength is analyzed. The τ-s curves of different solutions are shown in Figure 14. After immersion for 30 days, the bond strength of the specimen was 6.86 MPa after being corroded by the saline solution. The specimen was corroded by the alkaline solution, and the bond strength was 5.11 MPa. With immersion for 60 days, the bond strength was 5.73 MPa with corrosion in the saline solution. The specimen was corroded in the alkaline solution, and the bond strength was 4.45 MPa. With immersion for 90 days, the bond strength was 5.46 MPa with corrosion in the saline solution. The specimen was corroded in the alkaline solution, and the bond strength was 4.25 MPa. In comparison to the control group, the bond strength decreased by 1.3% when the specimens were immersed in the saline solution for 30 days. The bond strength degenerated by 17.6% for 60 days. The bond strength deteriorated 21.4% with 90 days of immersion. In comparison to the control group, the bond strength of the specimens deteriorated by 26.5% with immersion in the alkaline solution for 30 days. The bond strength decreased by 36.0% for 60 days. The bond strength decreased by 38.8% with immersion for 90 days. It can be seen that the corrosive rate of the specimen in the alkaline solution is greater than that in the saline solution.
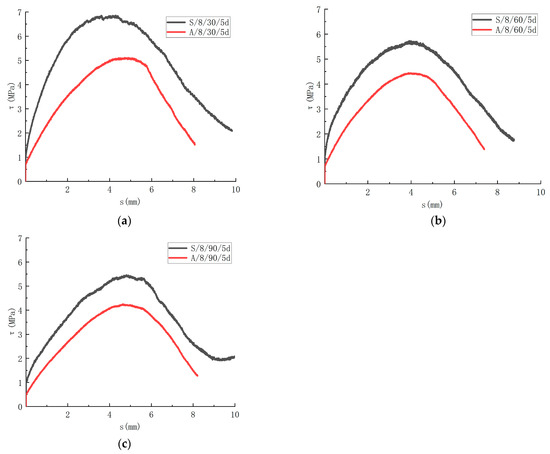
Figure 14.
Influence of corrosion solution on the bond-slip. (a) Comparison of test results for 30 days immersion; (b) Comparison of test results for 60 days immersion; (c) Comparison of test results for 90 days immersion.
3.3.4. Effect of Immersion Time
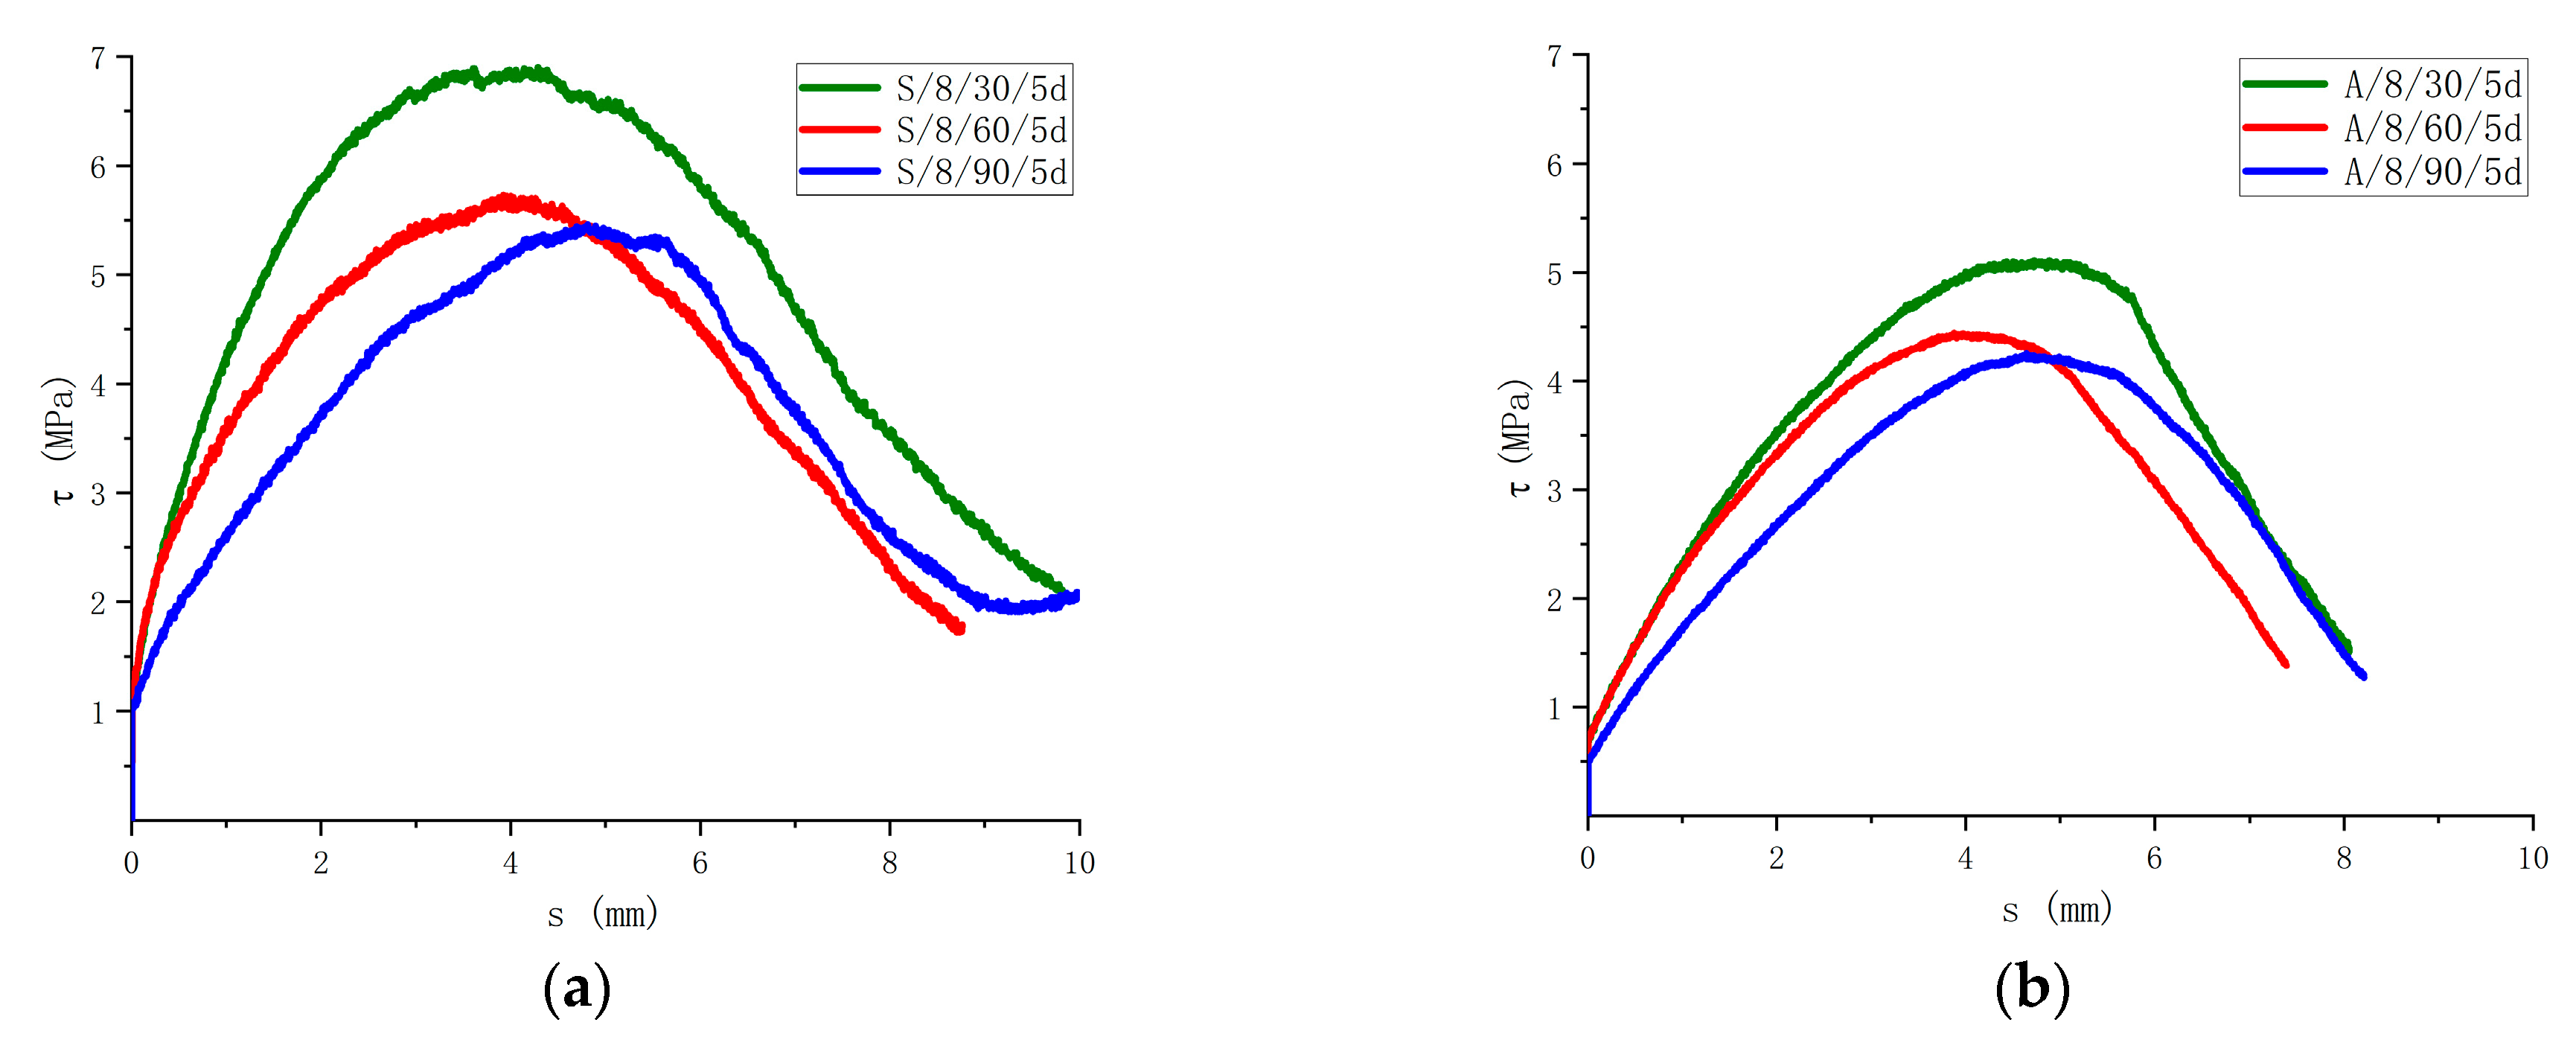
In the saline and alkaline environments, different immersion times have different effects on the bond strength, as shown in Figure 15. In the saline solution, the bond strength after being immersed for 30 days decreased by 1.3% compared with the control group. The bond strength after being immersed for 60 days was 16.5% lower than that of the specimens immersed for 30 days. The bond strength after being immersed for 90 days decreased by 4.7% compared with that of the specimens immersed for 60 days. The bond strength after being immersed in the alkaline solution for 30 days decreased by 26.5% compared with that of the specimens without the corrosive. The bond strength after being immersed for 60 days was 12.9% lower than that of the specimens immersed for 30 days. The bond strength after being immersed for 90 days was 4.5% lower than that of the specimens immersed for 60 days. It can be seen that 30 to 60 days in the saline solution has the greatest impact on the degradation in the bond strength of the specimens, 30 days in the alkaline solution has the greatest impact on the degradation in the bond strength, and the bonding degradation efficiency of the specimens immersed for 60 to 90 days gradually slows down.
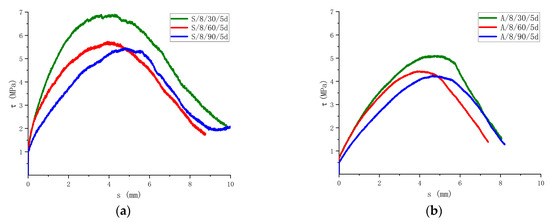
Figure 15.
Influence of the immersion time on the bonding strength. (a) Comparison of results in saline solution; (b) Comparison of results in alkaline solution.
3.4. Bond Strength Model
The design and calculation method of the bond strength is necessary when it is applied to the concrete structure under the corrosive environment. In this paper, the calculation formula of the recommended bond strength calculation model is given. According to the test results and the factors affecting the bond performance, the calculation models of existing scholars are selected, and the comparison of the existing calculation models is shown in Table 6 and Figure 16.
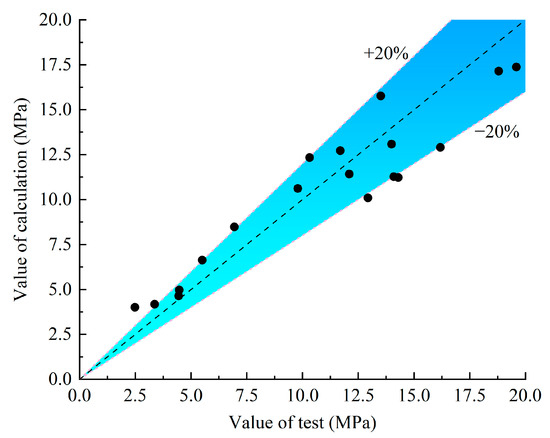
Figure 16.
Comparison results between the test value and the calculated value.
ACI 440.1R-06 [35] stipulates the bond strength calculation method of FRP–concrete. The formula adopts a standardized bond stress, a standardized concrete cover thickness, and a standardized bond length, but this specification does not consider different forms of GFRP bars and the influence of environmental factors, as shown in Equation (2):
For the calculation method in ACI 440.1R-06 [35], the influence of the different surface conditions of the GFRP bars is not considered, which is obviously inconsistent with the results discussed in the previous section. Therefore, it is necessary to propose a more accurate calculation model for predicting the bond strength. The formula in ACI 440.1R-06 has been adopted as the reference for this paper, and the calculation formula of the bond strength, which is more effective and suitable for the consideration of environmental factors, is proposed according to the results of the discussion of the influence parameters above. See Equation (3), where is the influence coefficient of the surface of the bars. When the surface of the bars is ordinarily helically wrapped, is 1.0; when the surface is helically wrapped–sandblasted, is 1.8; when surface is helically wrapped–thread-wrapped, is 2.2; when surface is thread-wrapped, is 0.7; when surface is sandblasted, is 0.75. In Table 6 and Figure 16, the existing test results of other scholars are selected for verification.
Table 6.
GFRP–concrete pullout test results.
Table 6.
GFRP–concrete pullout test results.
| Source of Data | Number | Value of Test (MPa) | Value of Calculation (MPa) |
|---|---|---|---|
| This paper | N/HW/8/5d | 6.95 | 8.48 |
| N/HW/12/5d | 5.51 | 6.63 | |
| N/SB/12/5d | 4.48 | 4.97 | |
| N/TW/12/5d | 4.45 | 4.64 | |
| N/SB/12/8d | 3.37 | 4.17 | |
| N/SB/12/12d | 2.49 | 4.00 | |
| Stefanovicova et al. [36] | P-FHW7-1 | 18.8 | 17.14 |
| P-FHW7-2 | 20.5 | 17.58 | |
| P-FHW7-3 | 19.6 | 17.37 | |
| P-FS8-1 | 14.0 | 13.08 | |
| P-FS8-2 | 11.7 | 12.72 | |
| P-FS10-1 | 12.1 | 11.42 | |
| P-FS10-2 | 14.1 | 11.27 | |
| P-FS10-3 | 14.3 | 11.23 | |
| Gao et al. [37] | R1-C1-8-N | 13.51 | 15.76 |
| R1-C1-12-N | 10.32 | 12.33 | |
| R1-C1-16-N | 9.79 | 10.61 | |
| R2-C1-8-N | 16.19 | 12.90 | |
| R2-C1-12-N | 12.94 | 10.09 |
3.5. Prediction and Analysis of Strength Degradation
The above test results show that the degradation of the GFRP bars and concrete specimens in the saline environment is smaller than that in the alkaline environment, indicating that the degradation mechanism of the GFRP bars and concrete is different for the two solutions. The microstructure characteristics of the GFRP bar are analyzed. The degradation of the GFRP bars can be classified into two categories in the alkaline solution: leaching and etching [38,39].
As can be seen from Equations (4) and (5), the dissolution of the GFRP bars in water would finally evolve into an alkali attack. The degradation processes are aggravated in the presence of alkaline solutions (hydroxyl ions). An alkali–aggregate reaction will also occur in the concrete itself, and the alkali expansibility of the aggregate will lead to concrete cracking [40], which will lead to the degradation of the surface condition of the GFRP bar and the loosening of the bond between bar and concrete, resulting in the decrease of the bond strength.
A saline environment generally refers to a chloride or sulfate environment, such as , , , etc. As a composite material, the GFRP bar is composed of fiber and matrix, so the performance degradation mechanism of the FRP bar is closely related to its components. The ions of , , , , and in the solution can enter the inside of the bars through the resin outside the fiber. The diameter of chloride ions is larger than that of other ions because there are few microcracks in the bars and the diffusion channel is narrow. Therefore, chloride ion diffuses slowly along the internal microcracks of the reinforcement compared with other media. With the increase in the soaking time, water molecules continue to enter, the microcracks increase with the continuous diffusion of water molecules, and finally chloride ions enter the interior of the bars. At the same time, with a large number of hydroxide ions and sodium ions in the saline solution, including chloride ions, the two chemicals react with each other, destroying the composition of the concrete. Under normal circumstances, hydroxide ions will directly deteriorate the structure of each component through chemical reactions, while chloride ions can only lead to a decrease in the interfacial bond strength through diffusion, so the GFRP bars are more affected by alkaline solutions.
The ions in the corrosion solution cause chemical corrosion to the concrete and GFRP bar. Starting from the corrosion mechanism of ions, by establishing an ion diffusion model, considering the influence of chemical reactions, porosity, temperature field, and other factors on the ion diffusion rate, the initial condition and boundary conditions in the diffusion process are set by using finite element and mathematical models. Finally, the analytical solution of the predicted strength is obtained [41,42,43]. The corrosion of the concrete and GFRP bars by various ions in the corrosion solution is an extremely complex physicochemical process. Therefore, due to the limited test data, this paper does not conduct an in-depth study on the degradation mechanism, and considers the influence of the strength-retention rate and corrosion time on the strength degradation of specimens from a macro perspective.
The ACI 440.1R-15 [44] proposes that, for concrete structures exposed to corrosives, the environmental impact factor is set at 0.7, which is a conservative estimate made by the design steering committee for design safety. According to the test data, the influencing factors of the bond strength include the type of solution and the immersion time, so it is necessary to refine the environmental impact factors.
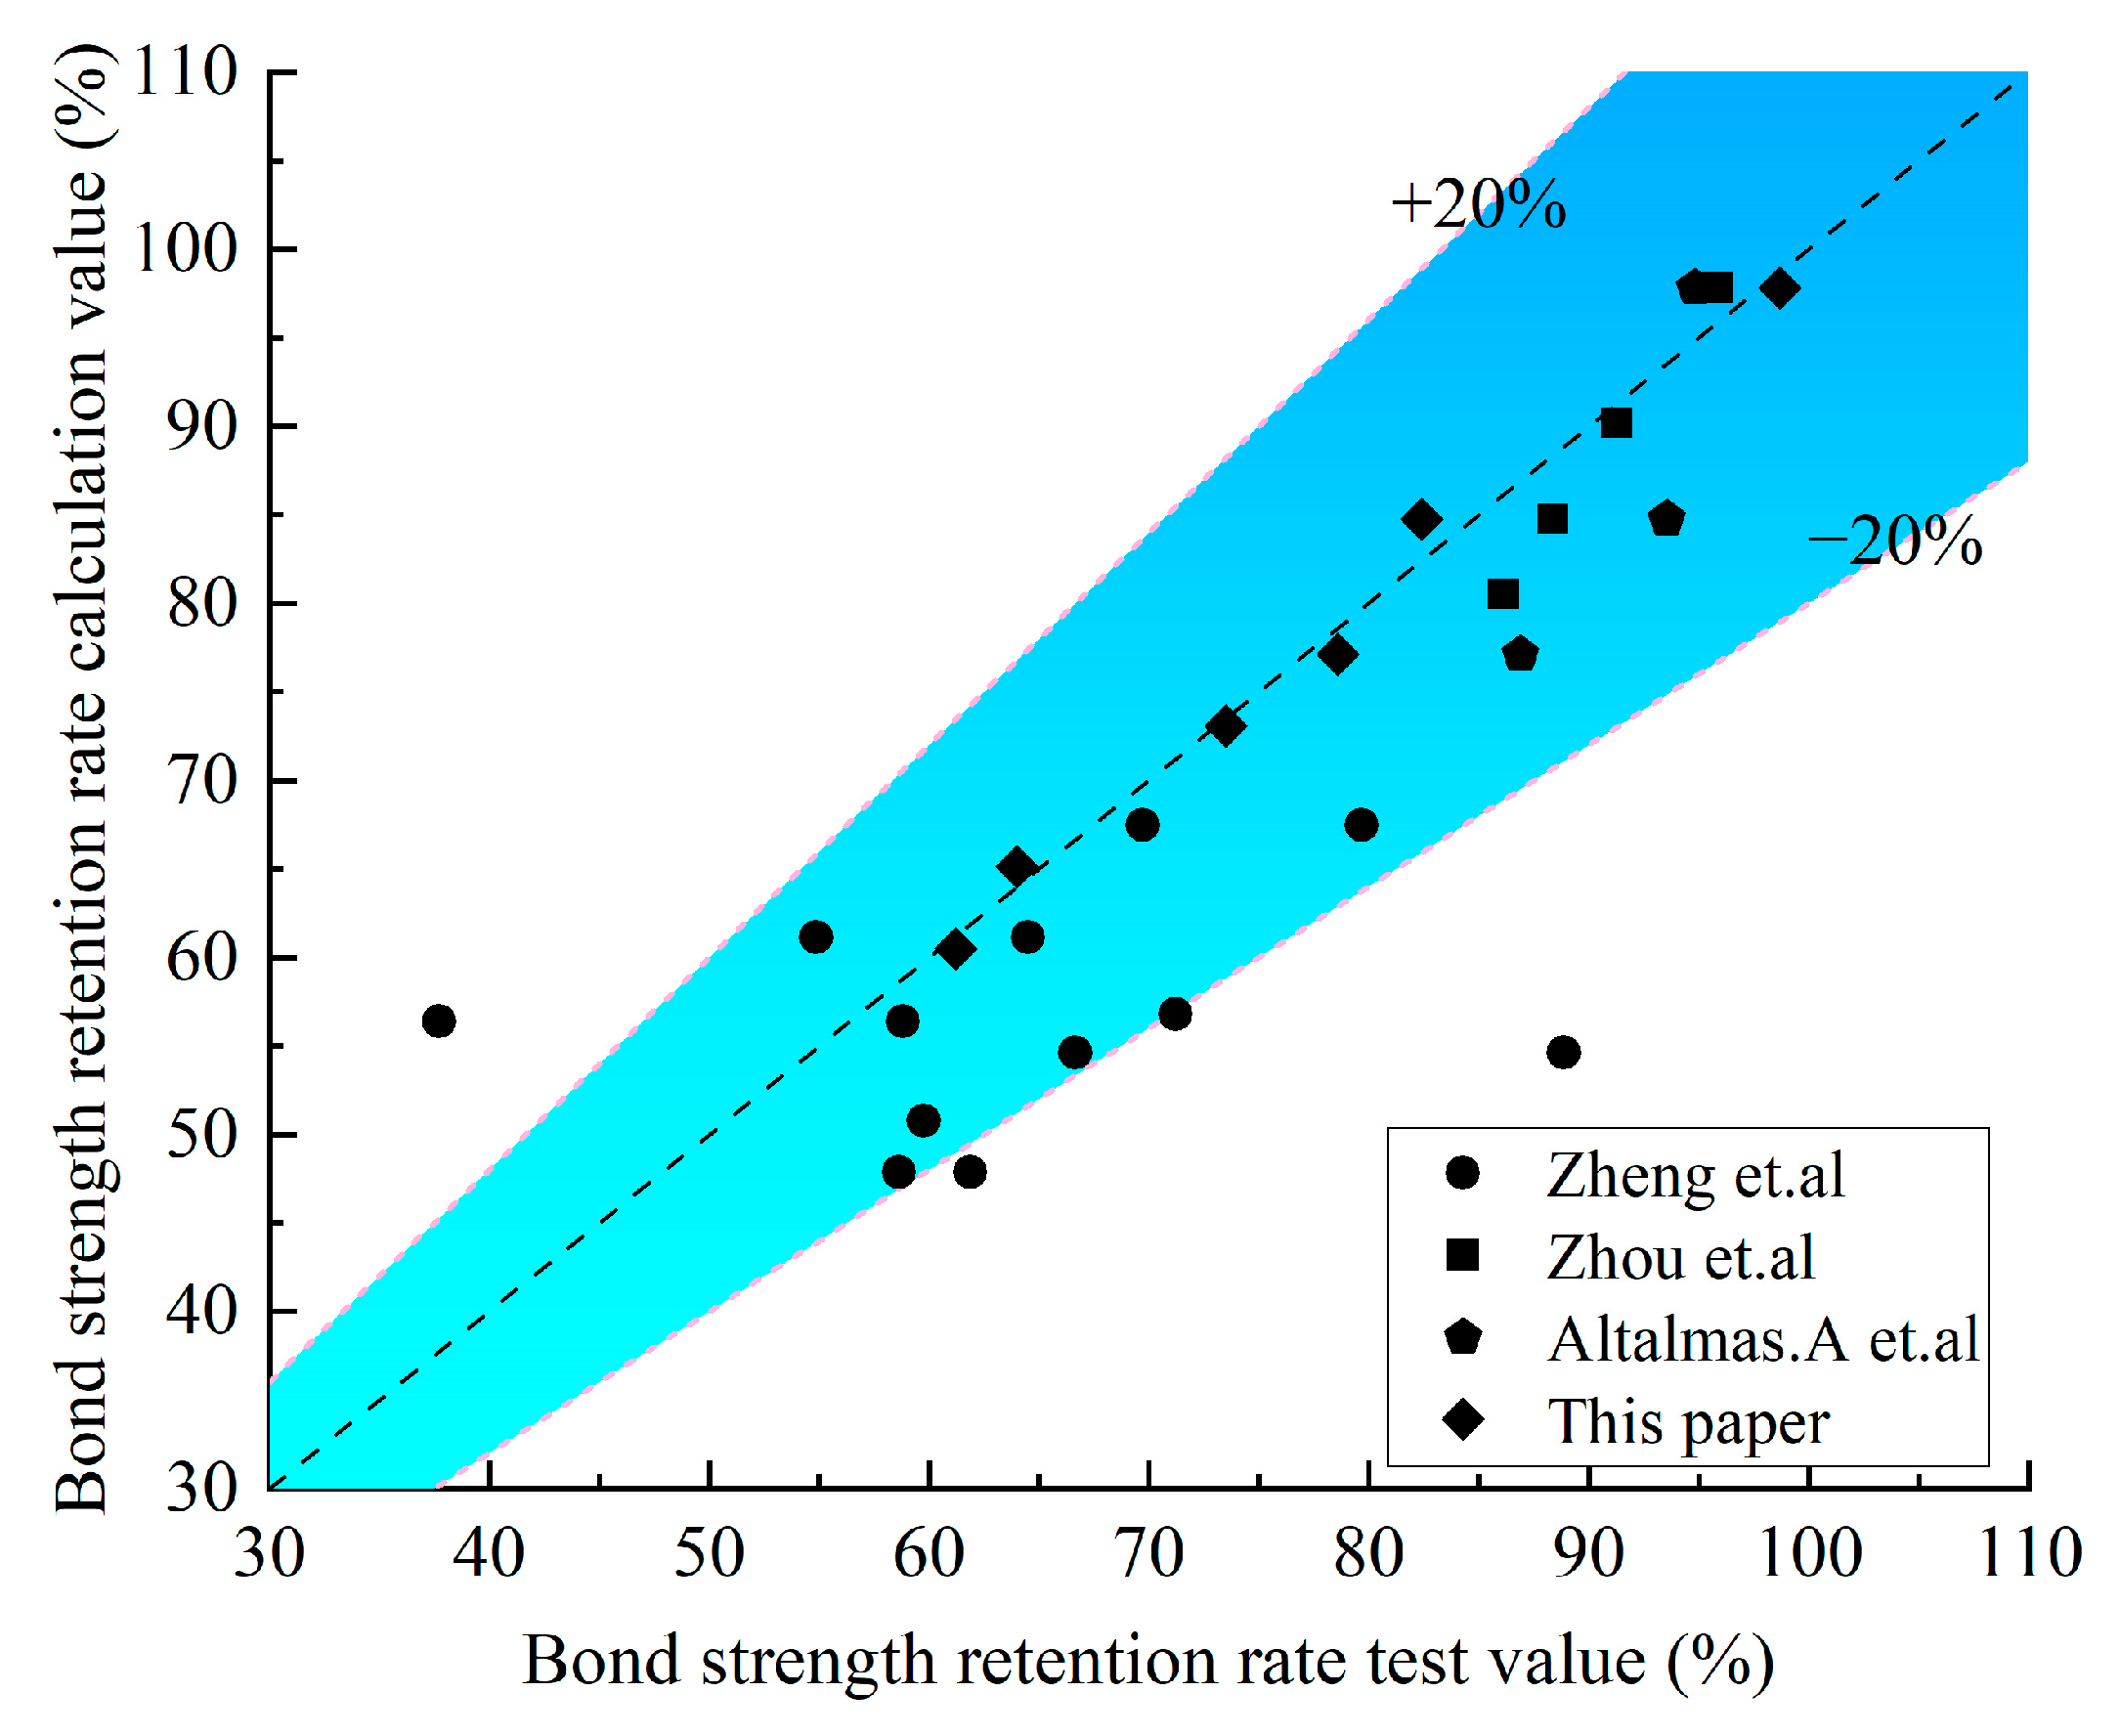
Bank et al. [45] discovered that the strength retention rate of the FRP is linearly related to the logarithm of the corrosion age. Combined with the test data in this paper, a linear function was used to fit the relationship between the bonding carrying capacity of the GFRP–concrete bond interface and the degradation of the corrosive time in the saline and alkaline environments. Before fitting, the bonding carrying capacity and corrosive time were normalized, and Y is the strength retention rate, t is the corrosive time (day), while A and B are the fitting parameters. The expression of the linear function is shown in Equation (6), and the corresponding parameters are shown in Table 7 and Table 8. The existing research results of other scholars are selected for verification, and it is proved that the calculated and tested values are in a better fit, as shown in Figure 17.
Table 7.
Parameter of fit.
Table 8.
Bond test results of specimens exposed in different solutions.
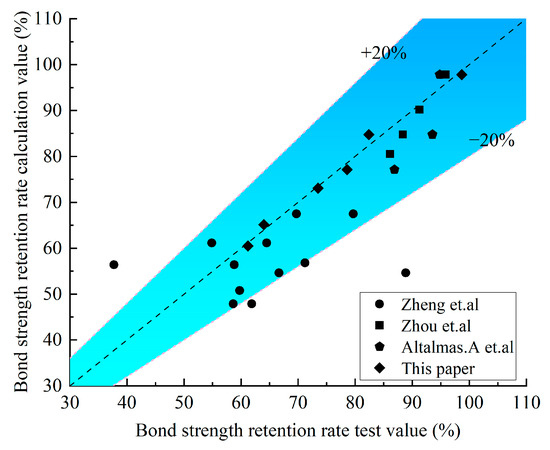
Figure 17.
Comparison results between the test value and the calculated value [22,27,46].
3.6. Bond-Slip Model of GFRP Bars to Concrete in Corrosive Environment
The scholars have established several models suitable for the FRP bar through experimental and theoretical research, mainly including the MBPE and CMR models, etc. The existing models do not consider the influencing factors of the corrosion environment. This paper modifies the MBPE and CMR models. A modified bond-slip model considering the corrosive environment is proposed.
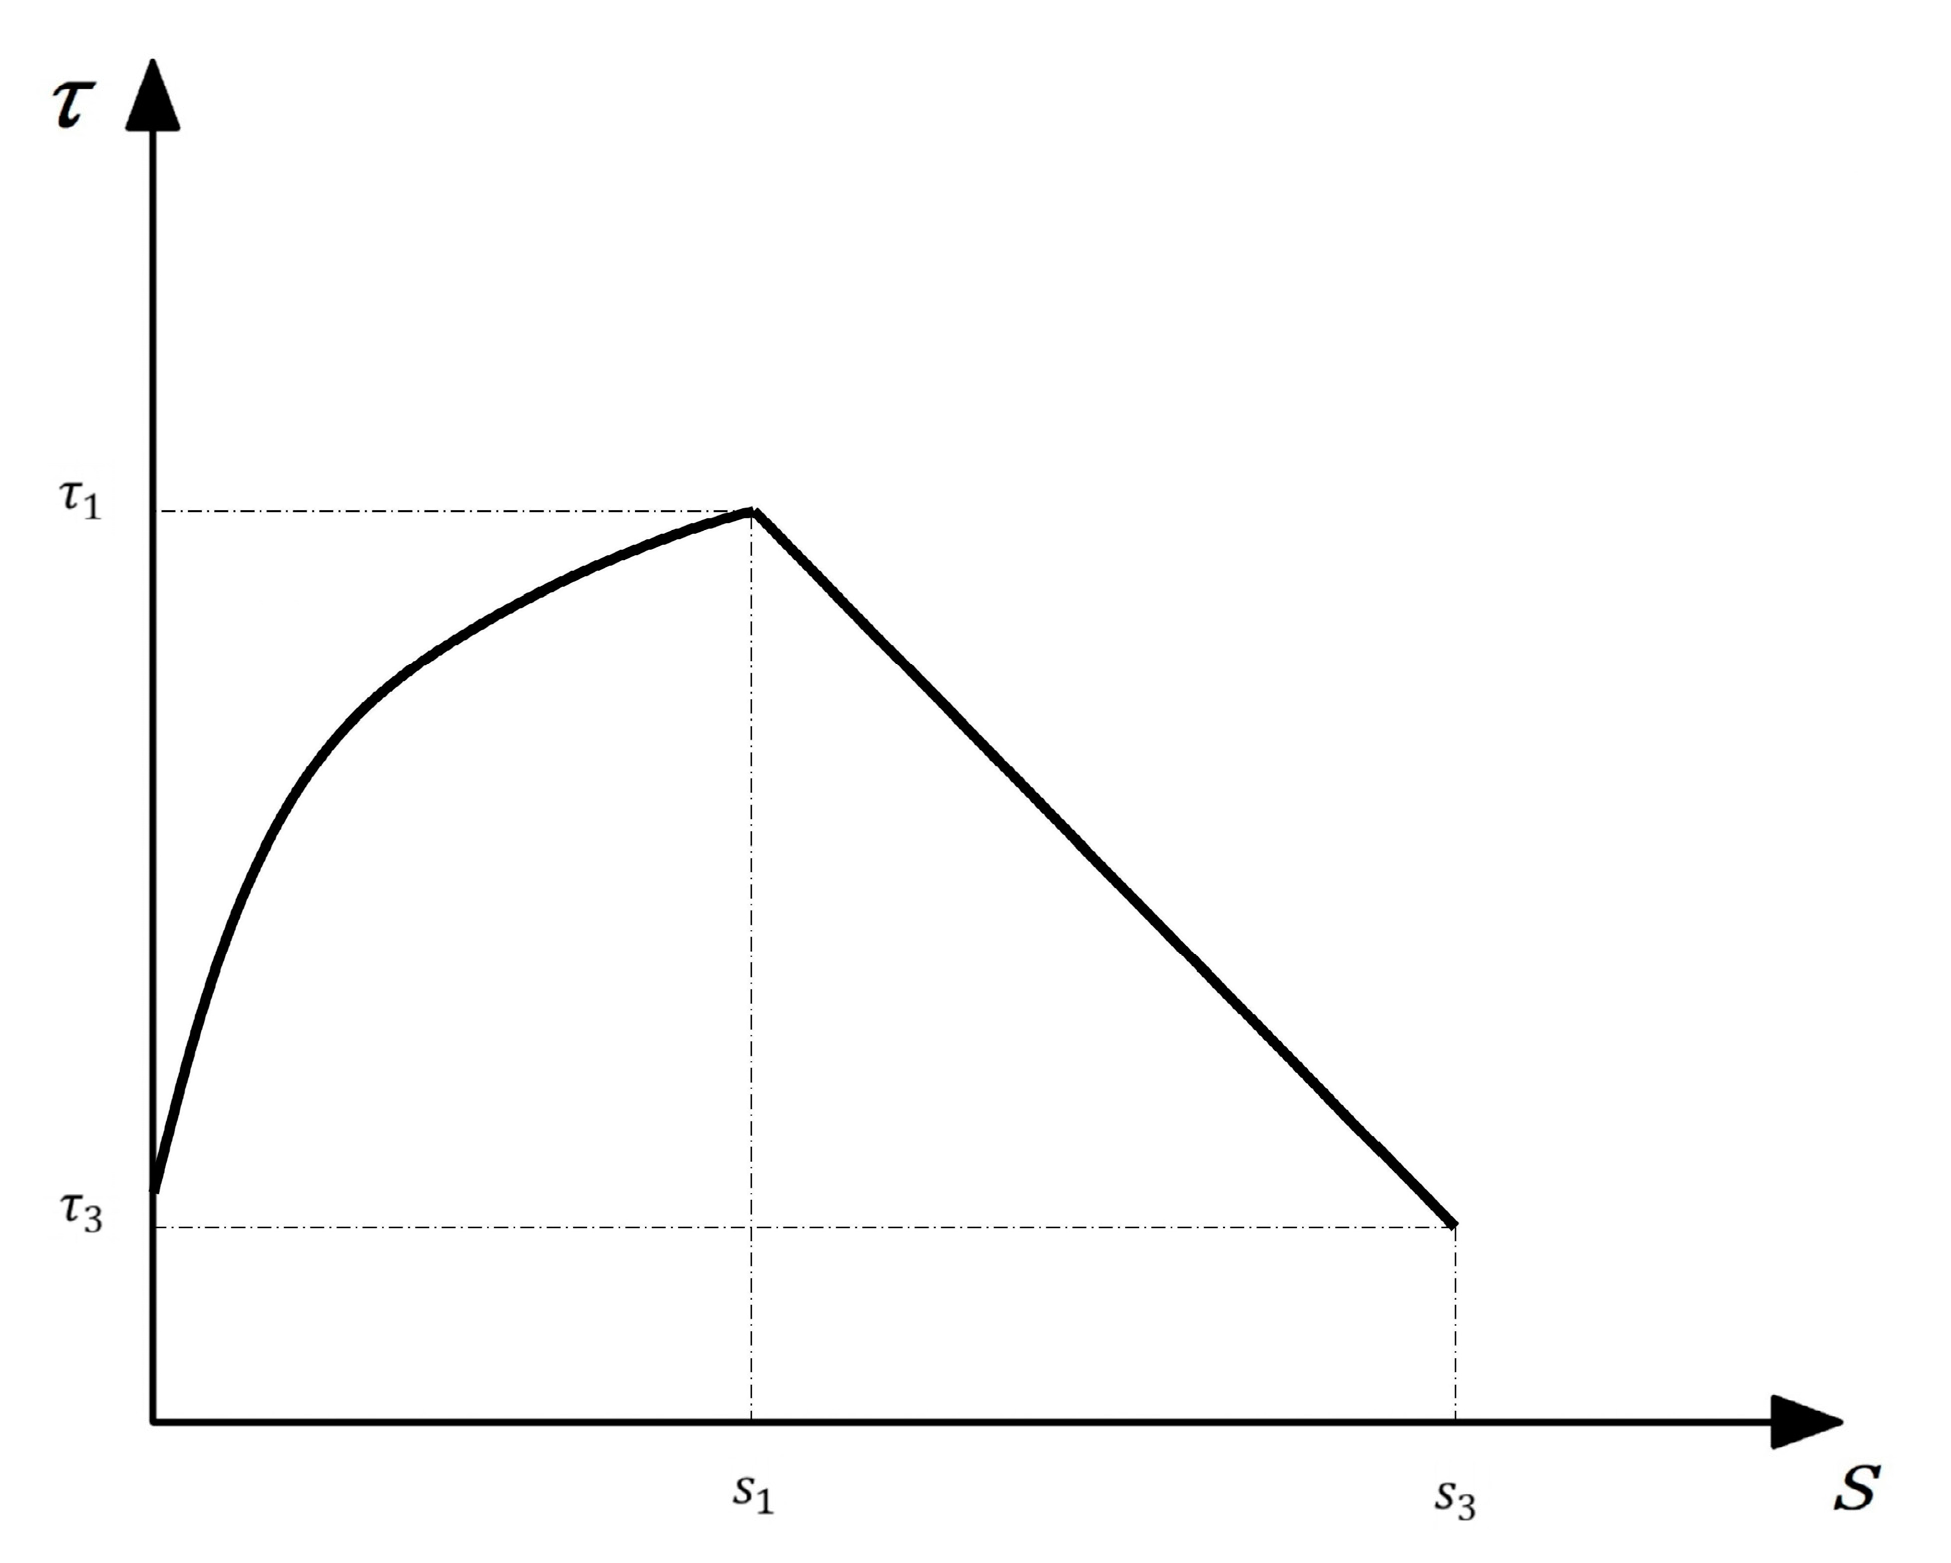
In the MBPE model [29], the corresponding expression is Equation (7). The simplified curve is shown in Figure 18.
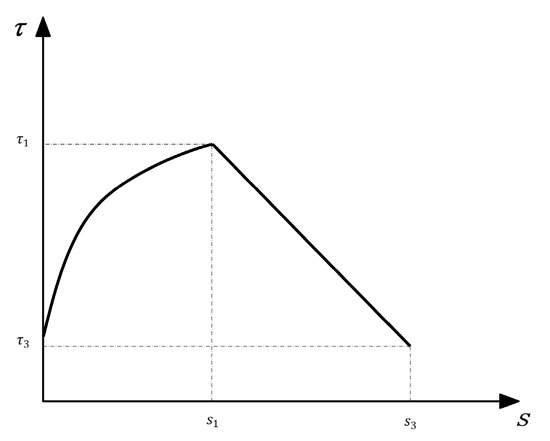
Figure 18.
The simplified MBPE model.
For the actual engineering design, only the use stage of the structure needs to be considered, so it is only necessary to ensure that the curve has a more accurate rising segment. Based on this, Cosenza et al. [29] proposed a new model that considers the ascending segment of the curve, namely the CMR model, whose expression is Equation (8). β and is obtained according to the test results, and the simplified τ-s curve is shown in Figure 19.
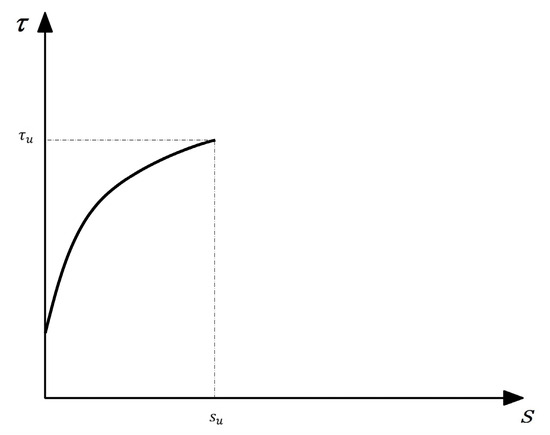
Figure 19.
The simplified CMR model.
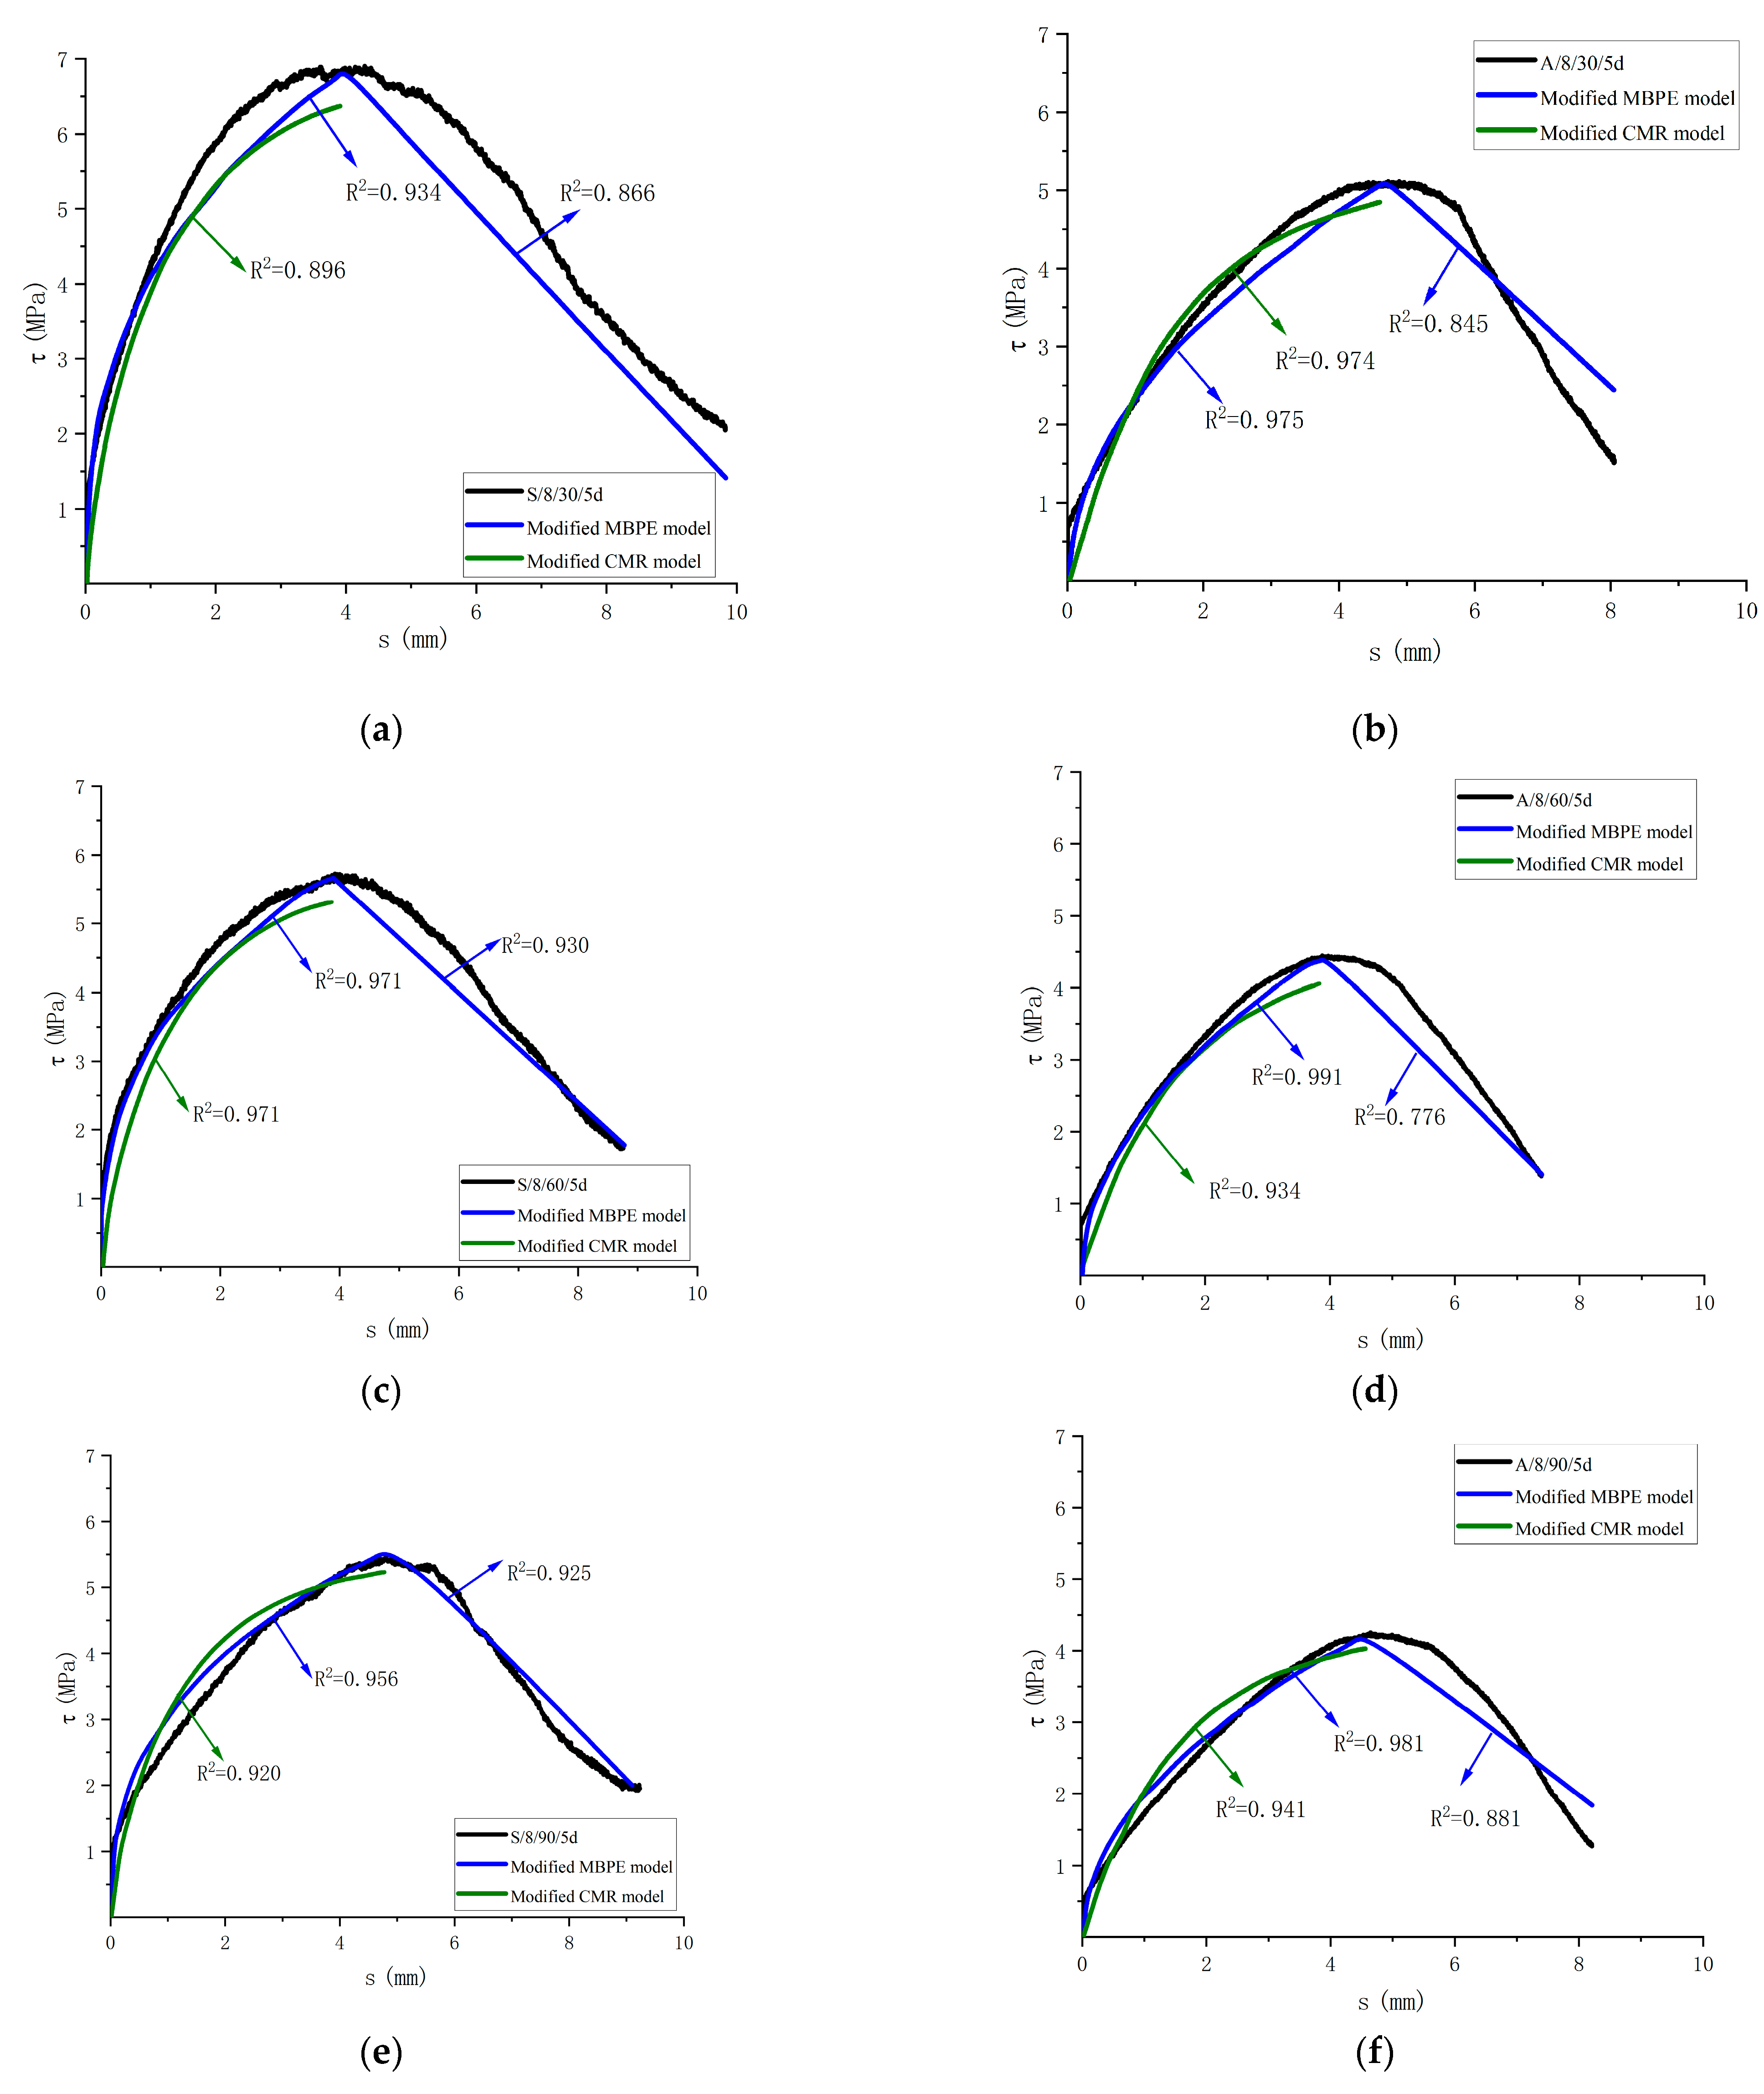
This paper simplifies the bond-slip curve by dividing it into two segments: an ascending segment and a descending segment, and it is all parabolic. Through the analysis of the three existing models, the GFRP bar–concrete bond-slip test data in the corrosive environment were fitted to the existing calculation model, and the obtained results were sorted out, as shown in Table 9. It shows that, for the ascending curve, the MBPE and CMR models are closer to the test curve, and for the descending curve, the MBPE model is in good agreement. For the actual engineering design, only the trial stage of the structure, namely the rising section, needs to be considered. According to the corrosive environment, the corresponding fitting parameter values of the MBPE and CMR models are given in Table 10, and the modified curve is compared with the test curve. Figure 20 shows the fitting curve of some specimens. The modified MBPE model and CMR model can be used to describe the bond-slip in the corrosive environment.
Table 9.
Prediction model calculation results and the corresponding regression parameters.
Table 10.
Parameter of fit.
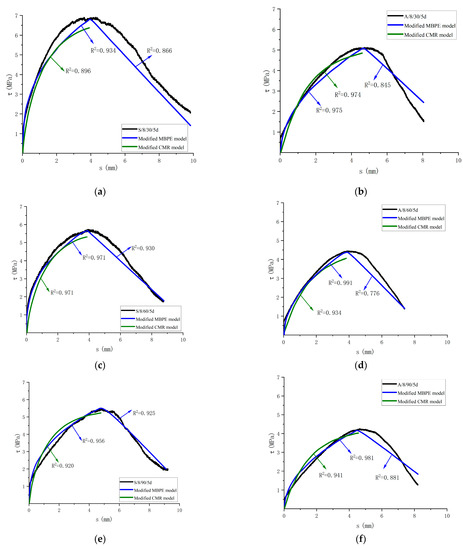
Figure 20.
Comparison between the modified model curve and test curve. (a) Comparison of the test curve and the modified model curve of S/8/30/5d; (b) Comparison of the test curve and the modified model of A/8/30/5d; (c) Comparison of the test curve and the modified model curve of S/8/60/5d; (d) Comparison of the test curve and the modified model of A/8/60/5d; (e) Comparison of the test curve and the modified model curve of S/8/90/5d; (f) Comparison of the test curve and the modified model of A/8/90/5d.
4. Conclusions
In order to explore the influence of corrosive media on the bond properties of GFRP bars and concrete, this paper conducted central pullout tests on 12 groups of 36 specimens in a normal environment, a saline environment, and an alkaline environment, respectively. To study the influence of the surface treatment of the bars, the bond length, corrosion solution, and immersion time on the bond properties, we analyzed the degradation law of the bond strength. The conclusions are as follows:
- (1)
- In this study, as the diameter of the GFRP bar decreases, the smaller the bond length of the specimen and the increase in the bond strength. Different surface treatment methods can increase the bond strength. The effect of the helically wrapped form is the best, followed by the sandblasted form, and the thread-wrapped form is the lowest.
- (2)
- Compared with the control group, the bond strength of the specimens in the saline solution decreased by 1.3–21.4%, and the bond strength of the specimens in the alkaline solution decreased by 26.5–38.8%. In the two corrosion environments (saline solution and alkaline solution), the bond properties are degraded, and the degradation degree of the specimens in the alkaline solution is greater. As the immersion time increases, the bond strength decreases more in the early immersion period and less in the later immersion period.
- (3)
- A formula for calculating the bond strength considering the surface treatment method of the GFRP bars was established, and a prediction formula for the retention rate of the bond strength degradation considering the corrosive environment was established, which was verified by the existing research results and test phenomena, and the calculated value was in good agreement with the test value.
- (4)
- Considering the effects of corrosive environments based on existing bond-slip models, the MBPE and CMR models were selected to compare with the test curve in this paper. This paper presents the fitted values of the corresponding parameters of the modified CMR and modified MBPE models according to the type of solution. The modified MBPE model and the CMR model curves are close to the test curve.
Author Contributions
Conceptualization, B.W.; Resources, B.W.; Writing—review and editing, B.W.; Supervision, B.W.; Funding acquisition, B.W.; Validation, G.L.; Writing—original draft, G.L.; Writing—review and editing, G.L.; Visualization, G.L.; Investigation, H.M.; Visualization, H.M. All authors have read and agreed to the published version of the manuscript.
Funding
This research was funded by Jilin Province Science and Technology Development program.
Data Availability Statement
Not applicable.
Conflicts of Interest
The authors declare no conflict of interest.
References
- Zhang, P.; Hu, Y.; Pang, Y.Y.; Zhang, S.Q.; Zia, A.; Gao, D.Y.; Zhu, H.; Sheikh, S.A. Experimental study on the bond behavior of GFRP plate-high-strength concrete composite interfaces under the coupled effects of sustained load and seawater immersion. Structures 2021, 30, 316–328. [Google Scholar] [CrossRef]
- Gomaa, A.M.; Lotfy, E.M.; Khafaga, S.A.; Hosny, S.; Ahmed, M.A. Experimental, numerical, and theoretical study of punching shear capacity of corroded reinforced concrete slab-column joints. Eng. Struct. 2023, 289, 116280. [Google Scholar] [CrossRef]
- Su, C.; Wang, X.; Ding, L.N.; Wu, Z.S. Seismic degradation behavior of steel-FRP composite bar reinforced concrete beams in marine environment based on experimental and numerical investigation. Compos. Struct. 2023, 313, 116949. [Google Scholar] [CrossRef]
- Wu, W.W.; He, X.J.; Yang, W.R.; Alam, M.S.; Wei, B.Y.; He, J. Degradation factors and microstructure degradation characteristics of B/ GFRP bars in harsh environment: A review. Constr. Build. Mater. 2023, 366, 130246. [Google Scholar] [CrossRef]
- Zhang, Z.Y.; Wu, X.H.; Sun, Q.; Tian, P.G.; Hu, G.X. Compressive behavior of corroded reinforced concrete columns strengthened with BFRP reinforced ECC in marine environment. Ocean Eng. 2023, 279, 114533. [Google Scholar] [CrossRef]
- Ge, W.J.; Zhang, S.K.; Zhang, Z.W.; Guan, Z.W.; Ashour, A.; Sun, C.Z.; Lu, W.G.; Cao, D.F. Eccentric compression behavior of Steel-FRP composite bars RC columns under coupling action of chloride corrosion and load. Structures 2023, 50, 1051–1068. [Google Scholar] [CrossRef]
- Yazdani, S.; Al Azzawi, M.; Garcia, C.Q.; Mullins, G.; Sen, R. Glass Fiber-Reinforced Polymer Effectiveness in Field Repair of Piles. ACI Struct. J. 2023, 120, 31–47. [Google Scholar]
- Xian, G.J.; Guo, R.; Li, C.G.; Hong, B. Mechanical properties of carbon/glass fiber reinforced polymer plates with sandwich structure exposed to freezing-thawing environment: Effects of water immersion, bending loading and fiber hybrid mode. Mech. Adv. Mater. Struct. 2023, 30, 814–834. [Google Scholar] [CrossRef]
- Wu, J.Y.; Zhu, Y.Q.; Li, C.G. Experimental Investigation of Fatigue Capacity of Bending-Anchored CFRP Cables. Polymers 2023, 15, 2483. [Google Scholar] [CrossRef]
- Wang, Z.K.; Zhao, X.L.; Xian, G.J.; Wu, G.; Raman, R.K.S.; Al-Saadi, S.; Haque, A. Long-term durability of basalt- and glass-fibre reinforced polymer (BFRP/GFRP) bars in seawater and sea sand concrete environment. Constr. Build. Mater. 2017, 139, 467–489. [Google Scholar] [CrossRef]
- Pan, Y.F.; Yu, Y.X.; Yu, J.C.; Lu, Z.Y.; Chen, Y.H. Effects of simulated seawater on static and fatigue performance of GFRP bar-concrete bond. J. Build. Eng. 2023, 68, 105985. [Google Scholar] [CrossRef]
- Tastani, S.P.; Pantazopoulou, S.J. Bond of GFRP bars in concrete: Experimental study and analytical interpretation. J. Compos. Constr. 2006, 10, 381–391. [Google Scholar] [CrossRef]
- Chen, C.; Li, X.; Zhao, D.B.; Huang, Z.Y.; Sui, L.L.; Xing, F.; Zhou, Y.W. Mechanism of surface preparation on FRP-Concrete bond performance: A quantitative study. Compos. Part B 2019, 163, 193–206. [Google Scholar] [CrossRef]
- Hua, Y.T.; Yin, S.P.; Wang, Z.H. Analysis of influence factors on interfacial bond between BFRP bars and seawater sea-sand concrete. J. Reinf. Plast. Compos. 2021, 40, 16–28. [Google Scholar] [CrossRef]
- Harajli, M.; Abouniaj, M. Bond Performance of GFRP Bars in Tension: Experimental Evaluation and Assessment of ACI 440 Guidelines. J. Compos. Constr. 2010, 14, 659–668. [Google Scholar] [CrossRef]
- Henin, E.; Morcous, G. Bond behavior of helically wrapped sand coated deformed Glass Fiber-Reinforced Polymer (GFRP) bars in concrete. Constr. Build. Mater. 2021, 288, 123120. [Google Scholar] [CrossRef]
- El Refai, A.; Ammar, M.A.; Masmoudi, R. Bond Performance of Basalt Fiber-Reinforced Polymer Bars to Concrete. J. Compos. Constr. 2015, 19, 04014050. [Google Scholar] [CrossRef]
- Liang, H.J.; Li, S.; Lu, Y.Y.; Yang, T. The combined effects of wet-dry cycles and sustained load on the bond behavior of FRP-concrete interface. Polym. Compos. 2019, 40, 1006–1017. [Google Scholar] [CrossRef]
- Dong, Z.Q.; Wu, G.; Xu, Y.Q. Experimental study on the bond durability between steel-FRP composite bars (SFCBs) and sea sand concrete in ocean environment. Constr. Build. Mater. 2016, 115, 277–284. [Google Scholar] [CrossRef]
- Dong, Z.Q.; Wu, G.; Xu, B.; Wang, X.; Taerwe, L. Bond performance of alkaline solution pre-exposed FRP bars with concrete. Mag. Concr. Res. 2018, 70, 894–904. [Google Scholar] [CrossRef]
- Yang, S.T.; Yang, C.; Huang, M.L.; Liu, Y.; Jiang, J.T.; Fan, G.X. Study on bond performance between FRP bars and seawater coral aggregate concrete. Constr. Build. Mater. 2018, 173, 272–288. [Google Scholar] [CrossRef]
- Zhou, J.K.; Chen, X.D.; Chen, S.X. Durability and service life prediction of GFRP bars embedded in concrete under acid environment. Nucl. Eng. Des. 2011, 241, 4095–4102. [Google Scholar] [CrossRef]
- Yan, F.; Lin, Z.B.; Yang, M.J. Bond mechanism and bond strength of GFRP bars to concrete: A review. Compos. Part B 2016, 98, 56–69. [Google Scholar] [CrossRef]
- Yan, F.; Lin, Z.B.; Zhang, D.L.; Gao, Z.L.; Li, M.L. Experimental study on bond durability of glass fiber reinforced polymer bars in concrete exposed to harsh environmental agents: Freeze-thaw cycles and alkaline-saline solution. Compos. Part B 2017, 116, 406–421. [Google Scholar] [CrossRef]
- Nepomuceno, E.; Sena-Cruz, J.; Correia, L.; D’Antino, T. Review on the bond behavior and durability of FRP bars to concrete. Constr. Build. Mater. 2021, 287, 123042. [Google Scholar] [CrossRef]
- Xiong, Z.; Mai, G.H.; Qiao, S.H.; He, S.H.; Zhang, B.F.; Wang, H.L.; Zhou, K.T.; Li, L.J. Fatigue bond behaviour between basalt fibre-reinforced polymer bars and seawater sea-sand concrete. Ocean Coastal Manag. 2022, 218, 106038. [Google Scholar] [CrossRef]
- Zheng, Y.L.; Ni, M.Z.; Lu, C.H.; Chu, T.S.; Wu, X.L. Bond Behavior of GFRP-Concrete Under Long-term Exposure to Aggressive Environments. J. Adv. Concr. Technol. 2020, 18, 730–742. [Google Scholar] [CrossRef]
- Lin, X.S.; Zhang, Y.X. Evaluation of bond stress-slip models for FRP reinforcing bars in concrete. Compos. Struct. 2014, 107, 131–141. [Google Scholar] [CrossRef]
- Cosenza, E.; Manfredi, G.; Realfonzo, R. Behavior and Modeling of Bond of FRP Rebars to Concrete. J. Compos. Constr. 1997, 1, 40–51. [Google Scholar] [CrossRef]
- Gao, D.Y.; Zhu, H.T.; Xie, J.J. The constitutive models for bond slip relation between FRP rebars and concrete. Ind. Constr. 2003, 33, 41–43,82. [Google Scholar]
- ASTM D7205/D7205M-06; Standard Test Method for Tensile Properties of Fiber Reinforced Polymer Matrix Composite Bars. ASTM International: West Conshohocken, PA, USA, 2011.
- ASTM D1141-98(2013); Standard Practice for the Preparation of Substitute Ocean Water. ASTM International: West Conshohocken, PA, USA, 2013.
- ACI 440.3R-04; Guide Test Methods for Fiber-Reinforced Polymers (FRPs) for Reinforcing or Strengthening Concrete Structures. ACI Committee 440, American Concrete Institute: Farmington Hills, MI, USA, 2004.
- ACI 440.3R-12; Guide Test Methods for Fiber Reinforced Polymer (FRP) Composites for Reinforcing or Strengthening Concrete and Masonry Structures. ACI Committee 440, American Concrete Institute: Farmington Hills, MI, USA, 2012.
- ACI 440.1R-06; Guide for the Design and Construction of Structural Concrete Reinforced with FRP Bars. ACI Committee 440, American Concrete Institute: Farmington Hills, MI, USA, 2006.
- Stefanovicova, M.; Gajdosova, K.; Sonnenschein, R.; Borzovic, V. Experimental evaluation of the bond Between concrete and GFRP bars with different surface treatments. J. Compos. Mater. 2022, 56, 3423–3437. [Google Scholar] [CrossRef]
- Gao, K.; Li, Z.; Zhang, J.R.; Tu, J.W.; Li, X.P. Experimental Research on Bond Behavior between GFRP Bars and Stirrups-Confined Concrete. Appl. Sci. 2019, 9, 1340. [Google Scholar] [CrossRef]
- Chen, Y.; Davalos, J.F.; Ray, I.; Kim, H.Y. Accelerated aging tests for evaluations of durability performance of FRP reinforcing bars for concrete structures. Compos. Struct. 2007, 78, 101–111. [Google Scholar] [CrossRef]
- Lu, C.H.; Yang, Y.T.; He, L.Y. Mechanical and durability properties of GFRP bars exposed to aggressive solution environments. Sci. Eng. Compos. Mater. 2021, 28, 11–23. [Google Scholar] [CrossRef]
- Gillott, J.E. Alkali-aggregate reactions in concrete. Eng. Geol. 1975, 9, 303–326. [Google Scholar] [CrossRef]
- Gospodinov, P.N. Numerical simulation of 3D sulfate ion diffusion and liquid push out of the material capillaries in cement composites. Cem. Concr. Res. 2005, 35, 520–526. [Google Scholar] [CrossRef]
- Wang, G.; Wu, Q.; Zhou, H.; Peng, C.; Chen, W. Diffusion of chloride ion in coral aggregate seawater concrete under marine environment. Constr. Build. Mater. 2021, 284, 122821. [Google Scholar] [CrossRef]
- Li, L.; Li, J.P.; Yang, C.Y. Theoretical approach for prediction of service life of RC pipe piles with original incomplete cracks in chloride-contaminated soils. Constr. Build. Mater. 2019, 228, 116717. [Google Scholar] [CrossRef]
- ACI 440.1R-15; Guide for the Design and Construction of Structural Concrete Reinforced with Fiber-Reinforced Polymer (FRP) Bars. ACI Committee 440, American Concrete Institute: Farmington Hills, MI, USA, 2015.
- Bank, L.C.; Gentry, T.R.; Thompson, B.P.; Russell, J.S. A model specification for FRP composites for civil engineering structures. Constr. Build. Mater. 2003, 17, 405–437. [Google Scholar] [CrossRef]
- Altalmas, A.; El Refai, A.; Abed, F. Bond degradation of basalt fiber-reinforced polymer (BFRP) bars exposed to accelerated aging conditions. Constr. Build. Mater. 2015, 81, 162–171. [Google Scholar] [CrossRef]


Disclaimer/Publisher’s Note: The statements, opinions and data contained in all publications are solely those of the individual author(s) and contributor(s) and not of MDPI and/or the editor(s). MDPI and/or the editor(s) disclaim responsibility for any injury to people or property resulting from any ideas, methods, instructions or products referred to in the content. |
© 2023 by the authors. Licensee MDPI, Basel, Switzerland. This article is an open access article distributed under the terms and conditions of the Creative Commons Attribution (CC BY) license (https://creativecommons.org/licenses/by/4.0/).