Abstract
To investigate the seismic behaviors of novel steel-reinforced concrete composite frames prestressed with bonding tendons (PSRCFs), 15 groups of PSRCF specimens were designed with the following main parameters: the cubic compressive strength of high-strength concrete (fcu), the axial compression ratio of frame columns (n), the slenderness ratio of frame columns (β), the steel ratio of angle steel (α), the span–height ratio of frame beams (L/hb), and the prestressing degree (λ). Based on the modified concrete constitutive model proposed by Mander and the prestressing effect applied by the cooling method, the finite element models of PSRCFs were established by using ABAQUS software, the static analysis on the frame structures under the combined actions of axial forces and horizontal loads was carried out, and the monotonic load–displacement curves were explored. By comparing with the skeleton curves obtained by the experimental hysteretic curves, the rationality of the modeling method was verified. The PSRCFs had good mechanisms of strong columns and weak beams. Based on this, the influences of different parameters on the seismic behaviors such as hysteretic curves, skeleton curves, stiffness degradations, energy dissipation capacities, and ductility of the specimens were investigated. The results show that the hysteretic curves of the PSRCFs are full and have no pinch phenomenon. The ultimate load and the stiffness degradation of specimens can be improved significantly by increasing α, and on the contrary, the ultimate load and stiffness degradation decreased by increasing β. The ductility of the specimens decreased gradually with the increasing β and n. The energy dissipation capacity of the specimens decreased with the increasing β. The trilinear model of the skeleton curves and the restoring force model of PSRCFS were established by statistical regression, which agree well with the numerically simulated results. These can provide theoretical support for the elastoplastic analysis on this kind of PSRCF structure.
1. Introduction
With the advancement of building engineering to super high-rise, massive loads, and wide spans [1], building structures not only pursue higher stories but also require a larger span, so conventional reinforced concrete (RC) structures and steel-reinforced concrete (SRC) structures have faced great challenges, because they cannot meet functional needs well. It is well-known that the application of prestressing technology to the frame system can make the structure realize a larger span [2], but it will also lead to many problems in the conventional frame system. If solid-web SRC composite columns [3] or concrete-filled steel tube (CFST) columns [4,5] are used in the frame structures, the prestressing tendons organized in the frame beams definitely pass through the steel or steel tubes in the columns, which greatly weakens the stiffness of the joints for the frames. It is challenging to achieve tensioning and anchoring of the prestressing tendons at the ends of the columns without altering the stiffness of the steel for the joint zone. In order to handle the problem of tensioning and anchoring for prestressing tendons reasonably, a kind of novel frame system consisting of hollow-web angle steel high-strength concrete columns and H-shaped steel high-strength concrete composite beams prestressed with bonding tendons is proposed, as shown in Figure 1 [6]. The angle steels are set as far as possible in the four corners of the columns, replacing the traditional longitudinal steel bars, and the angle steels are welded with steel plate hoops together, forming a spatial steel skeleton and confined concrete to bear the external load of the component. The H-shaped steel sections and prestressing tendons in the frame beams can pass through the gap of the angle steels for frame columns, which can solve the problem of tensioning and anchoring the prestressing tendons well. On the top and lower flanges of the H-shaped steel section in the joint area, a specific length of I-shaped steel is welded. Thus, a strong anti-slip joint can be formed, as shown in Figure 1. This kind of frame system is suitable for the new construction and story-adding reconstruction of existing buildings [7].
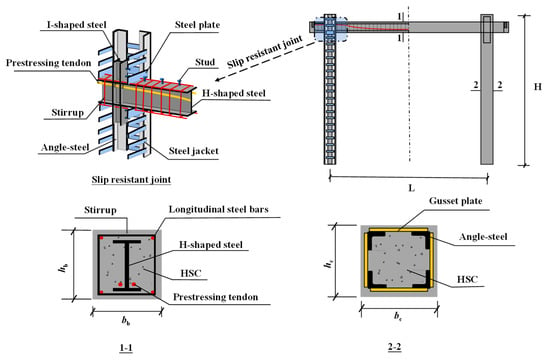
Figure 1.
The schematic diagrams of the PSRCF.
Much research on prestressed RC frames, CFST frames, and SRC frames has been carried out by domestic and overseas researchers. In 2013, under horizontal low cyclic loads, Wang et al. [8] tested the seismic behaviors of two frame structures made of SRC beams and steel-tube-encased concrete columns, and obtained the hysteretic curves, failure modes, and mechanisms of plastic hinges. In 2017, based on the aforementioned test results, Wang et al. [9] performed numerical simulations on this type of composite frame under lateral cyclic stress and examined the effects of various factors on the hysteretic behaviors of the composite frames, and, at last, the restoring force models of composite frames were proposed. In 2018, the experiments and simulations on the effects of earthquakes on the composite frames with seven circular CFST columns and RC beams under lateral cyclic loading were conducted by Ding et al. [10], while the effects of various factors on the load–deformation responses, stiffness degradation, ductility, and energy dissipation capacity were compared and studied. It was discovered that these composite frames had a good seismic performance. In 2019, the experiments on the seismic behaviors of SR ultra-high-strength concrete frames at a one-fourth scale under simulated earthquake stress conditions were carried out by Zhang et al. [11]. The hinge failure mechanisms of frames were obtained, and the results showed that the hinge failure mechanisms of frames were reasonable and conformed to design demand. The theoretical analysis on the seismic performances of two RC frame structures with concentric (CBF) or eccentric (EBF) bracing systems was conducted by Kheyroddin et al. [12], and the bearing capacity and ductility of RC frames with CBF and EBF braces were discovered. By comparison, it could be seen that the ductility of the RC frames with EBF braces was better than that of frames with CBF. In 2020, the experiments and numerical simulation analysis on the seismic performances of post-fire SRC frames under repeated loading were carried out by Wang et al. [13], and the failure modes and hysteresis performances of SRC frames were discovered. The outcomes of a finite element analysis (FEA) show that the deformations, failure modes, and hysteretic curves agree well with the test results. The numerical analyses on pushover behaviors and ductility of RC frames in the case of corrosion were conducted by Behrouz et al. [14], and the investigation considered the influence of corrosion on the ductility and base shear capacity by taking into account the degradation of mechanical properties in both the rebars and concrete. A corrosion damage model was developed, and the results demonstrate the improved seismic performances of the RC frames with the decreasing water-to-cement ratio and increasing cover thickness. In 2021, Li et al. [15] conducted numerical simulations on the seismic behaviors of circular TSRC (tubed steel-reinforced concrete) column and steel beam composite frames, and the values on the maximum applicable height and maximum story drift ratio limits of the structural systems were obtained. The findings indicate that when the steel sectional area increases, the seismic performances of TSRC frames in high-intensity areas improve. In 2022, Li et al. [16] conducted experimental investigations and computer simulations on the seismic behaviors of innovative precast prestressed concrete frames, and the failure process, stiffness degradation, lateral load–displacement responses, energy dissipation ability, and ductility of the precast prestressed concrete frames were analyzed and discussed. Finally, the suggestions for the seismic design optimization of the precast prestressed concrete frames were proposed. The tests on the progressive collapse behaviors of four one-third-scale steel-fiber-reinforced rubberized concrete frames were carried out by Alshaikh et al. [17], and the results show that structural ductility can be enhanced by incorporating crumb rubbers (CRs) and steel fibers (SFs) in normal concrete. At present, although both domestic and international researchers have published many studies on prestressed RC frames, CFST frames, and SRC frames, there are few studies on the seismic behaviors of this particular class of unique PSRCFs, and the mechanical features of PSRCFs still need to be examined.
In order to obtain the seismic behaviors of the novel PSRCFs, the ABAQUS program was used to create the finite element models (FEMs) of PSRCFs, and the hysteretic curves of the frames were obtained. By comparing with the skeleton curves obtained by the experimental hysteretic curves, the logic of the modeling technique may be confirmed. By carrying out the static analysis and quasi-static numerical simulations on the PSRCFs specimens under axial and horizontal loadings, the impacts of various characteristics on seismic behaviors were examined, and the distribution law of plastic hinge was proposed. Based on the investigations on various parameters, the load–displacement (P–Δ) skeleton curves of this kind of novel frame were extracted, and the statistical regression was used to develop the trilinear model of the skeletal curves and the restoring force model of PSRCFs, which can provide theoretical support for the elastoplastic analysis on such innovative composite frames.
2. Specimen Design
To explore the seismic behaviors of unique PSRCFs, 15 groups of PSRCF specimens were designed with the primary characteristics of the cubic compressive strength of high-strength concrete (fcu), the axial compression ratio for frame columns (n), the slenderness ratio of frame column (β), the steel ratio of angle steel (α), the span–height ratio of frame beams (L/hb), and the prestressing degree (λ). All specimens had an calculated span (L) of 4800 mm. The sectional sizes of the beams (bb × hb) were 200 mm × 300 mm, 200 mm × 270 mm, and 200 mm × 240 mm, corresponding to the span–height ratios of 16, 18, and 20, respectively. The sectional sizes of the columns (bc × hc) were 400 mm × 400 mm, and the heights (H) of the frames were 2800 mm, 3600 mm, and 4200 mm, corresponding to the slenderness ratios of 6, 9, and 12, respectively. The strength grades of H-shaped steel and angle steel were Q235 and Q345, respectively. The strength grades of 12 mm dia. longitudinal steel bars and the 10 mm dia. stirrups were HRB335 and HPB300, respectively. Prestressing tendons were symmetrically placed on both sides of the H-shaped steel, and the prestressing degrees (λ) were 0.75, 0.7, and 0.65. Tensioning stress (σcon) was 0.75 times the ultimate tensile strength (fptk). The prestressing tendons consisted of five steel wires with a diameter of 5 mm, and its strength grade was 1670 MPa. In order to achieve strong joints at the intersection of beams and columns, I-shaped steels with the sizes of 160 mm × 88 mm × 6 mm were arranged vertically above and below the H-shaped steel, and the studs were arranged on the top flange. Figure 1 depicts the schematic diagrams of the PSRCFs, and Table 1 lists the particular characteristics for individual frames.

Table 1.
The specific parameters of 15 PSRCF specimens.
3. Finite Element Model
3.1. Constitutive Model for Materials
3.1.1. Steel and Prestressing Tendons
Based on the von Mises yield criterion [18], the ideal double-line elastic–plastic model [19,20] was adopted as the constitutive models of shape steels, angle steels, stirrups, and longitudinal steel bars. The trilinear model was chosen as the constitutive model for prestressing tendons, as shown in Figure 2. The constitutive relation of the prestressing tendons can be described by Equation (1). Table 2 gives the mechanical properties of steel.
where Ep1 is the elastic rigidity of the proportional stage, Ep2 is the elastic rigidity of the unproportional stage, and Ep3 is the post-yield stiffness; fp1 and εp1 are the stress and strain of the limit point of prestressing tendons corresponding to the proportional stage; fp2 and εp2 are the stress and strain at the yield point of prestressing tendons; and fp3 and εp3 are the stress and strain at the limit point of prestressing tendons.
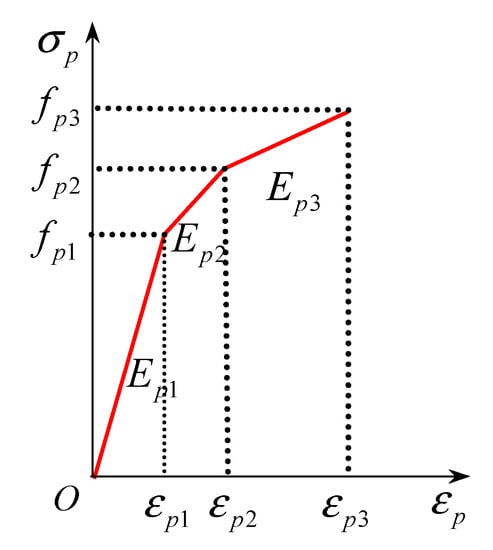
Figure 2.
Constitutive model of prestressing tendons.

Table 2.
The mechanical properties of steel.
3.1.2. Concrete
The constitutive model (CM) of confined concrete was successfully presented by Pagoulatou et al. [21], Teng et al. [22], Mander et al. [23], and Han et al. [24], and the CM of unconfined concrete has been presented in the code for design of concrete structures (GB50010-2010) in China [25]. A comparison between them is shown in Figure 3. Considering the constraint effect of stirrups in frame beams on concrete, the CM proposed by Mander et al. [23] is adopted for the stress–strain relationship of concrete in the stirrup confined zone under axial compression. Since steel plate constraint is slightly different from stirrup constraint, the calculation of effective constraint stress in Mander model is modified, as shown in Equations (2)–(9), and the effective confined zone of the concrete column with steel plates is shown in Figure 4. The two-parameter model given in the code for design of concrete structures (GB50010-2010) [25] is adopted for the stress–strain relationship of core-constrained concrete under axial tension and CM of ordinary concrete, as shown in Equations (10) and (11). The plastic damage model of concrete [26,27,28] was implemented to simulate modeling of cracks and the specific concrete plastic damage definition can be found in Table 3.
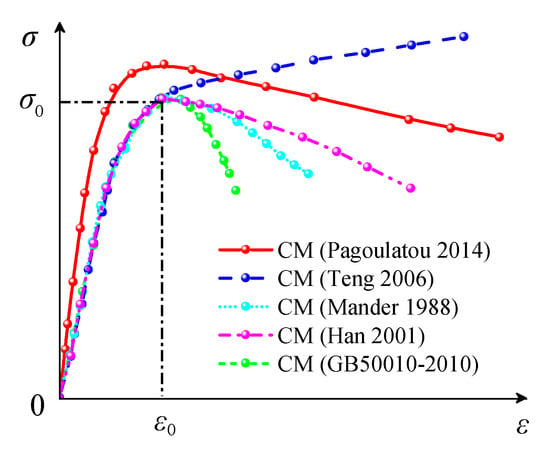
Figure 3.
Constitutive model of concrete [21,22,23,24,25].
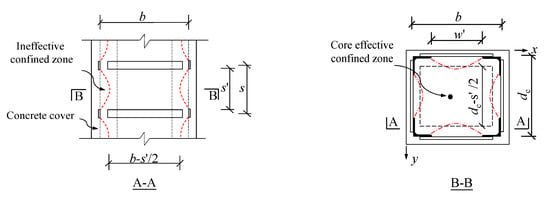
Figure 4.
Effective confined zone of concrete.

Table 3.
The parameters of the concrete plastic damage model.
Equation (2) illustrates the stress–strain relationship for constrained concrete under axial compression.
where , , , , and are the current stress and strain of concrete; is the peak strain of unconfined concrete; is elasticity modulus of concrete; is the secant modulus of the peak strain point of confined concrete; and fco is the compressive strength of unconfined concrete.
- (1)
- Compressive strength of confined concrete (fcc)
- (2)
- Effective confined stress of confined concrete (fr′)
- (3)
- Effective constraint coefficient (ke)
- (4)
- Peak strain of the confined concrete ()
The stress–strain relationship of concrete under axial tension can be seen in Equation (10) as
where , , αt is a parameter in the descending stage on the stress–strain curve under axial tension for concrete, ft,r is the axial tensile strength of concrete, and εt,r is the peak strain corresponding to ft,r.
The stress–strain relationship of concrete under axial compression can be seen in Equation (11) as
where , , , αc is a parameter in the descending stage on the stress–strain curve under axial compression of concrete, fc,r is axial compressive strength of concrete, and εc,r is the peak strain corresponding to fc,r.
3.2. Establishment of Finite Element Model
Figure 5 illustrates how the FE models of PSRCFs were created using ABAQUS6.14 software. Concrete was established by adopting element C3D20R, H-shaped steels, and angle steels were established by element S4R, and the stirrups and prestressing tendons were established by element T3D2. During the process of FE modeling, the angle steel skeleton, H-shaped steels, and prestressing tendons were embedded in the entire model. The three reference points (RP-1, RP-2, and RP-3) were established from one side of the beam ends and two tops of the columns. The bottoms of the columns were completely fixed, and the displacements in the X, Y, and Z directions (U1 = U2 = U3 = 0) and the rotations about three directions (UR1 = UR2 = UR3 = 0) were restricted. The elastic compression of concrete, the stress relaxation of prestressing tendons, the deformation and slip of anchor fixtures for tension, and the friction between the prestressing tendons and surrounding contact would lead to the loss of prestress. Hence, for static analysis, prestressing effect was applied through the cooling method first, and then the vertical load and horizontal load were applied according to the loading rules. During the quasi-static analysis, the first two analysis steps were the same as the static analysis, but in the third step, horizontal cyclic load was applied according to cyclic loading rules, and the loading system is shown in Figure 6.
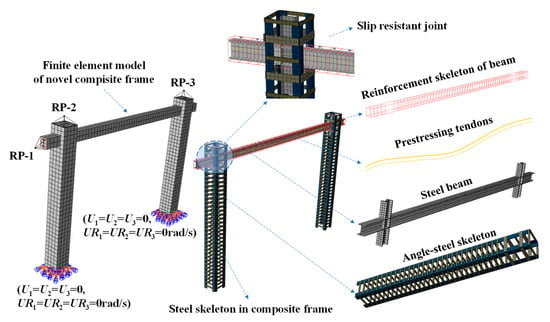
Figure 5.
The finite element model of PSRCFs.
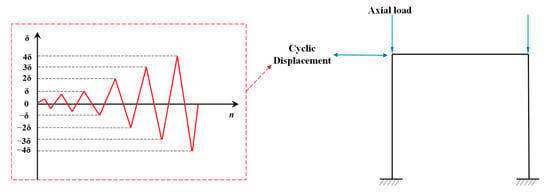
Figure 6.
Loading scheme.
3.3. Verification of Finite Element Model
The quasi-static test on a steel-reinforced concrete frame (SRCF) and a PSRCF was carried out by our research group [30]. The precise specifications of the two test specimens are shown in Table 4. By using the above-mentioned modeling technique, introducing the modified Mander constitutive model and prestressing effects and considering the double nonlinearities simultaneously, the finite element analysis on PSRCFs was carried out. The monotonic load–displacement curves of PSRCF specimens for various mesh size divisions were obtained, as shown in Figure 7. By comparing with the skeleton curves obtained by the experimental hysteretic curves, it can be seen that the mesh size of 100 mm is reasonable. According to Figure 8, the finite element analysis on the two specimens is performed with a constant mesh size. The load–displacement curves produced by numerical simulations are in good agreement with the test findings, as can be seen in Figure 8. Figure 9 and Figure 10 show that there are good agreements between simulation results and experimental results for the overall trends of the skeleton curves and hysteretic curves, indicating that the finite element modeling method proposed in this paper is reasonable.

Table 4.
The specific parameters of two specimens.
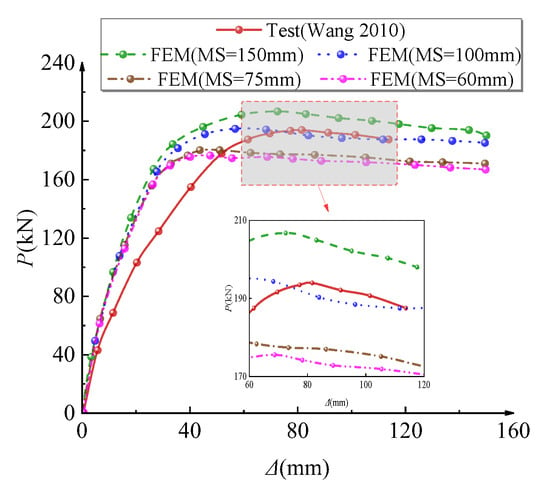
Figure 7.
Comparison of the N-ε curves between the numerical simulations and experimental tests [30].
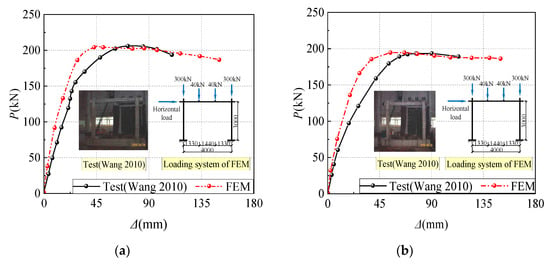
Figure 8.
Comparison of the load–displacement curves: (a) SRCF; (b) PSRCF [30].
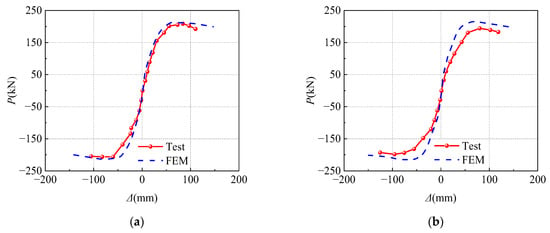
Figure 9.
Comparison of the skeleton curves: (a) SRCF; (b) PSRCF [30].
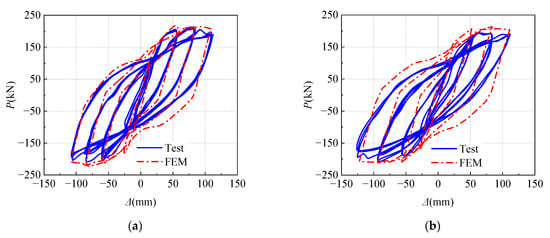
Figure 10.
Comparison of the hysteretic curves: (a) SRCF; (b) PSRCF.
The deformations of the steel skeleton after applying the horizontal loading is shown in Figure 11. It can be seen that the bottom of the frame column and the tensile position of the beam enter the yield state, and a plastic hinge forms at the beam end before the bottom of the column, showing that this type of structure has a strong column and weak beam mechanism [31]. This phenomenon is consistent with the test result, which verifies the rationalities of the modeling method and the modeling process.

Figure 11.
Deformation and order of the plastic hinges of the steel skeleton.
4. Analysis on the Seismic Behaviors
4.1. Hysteretic Curves
Figure 12 illustrates the hysteretic curves of PSRCFs. From Figure 12, the hysteretic curves of 15 PSRCFs display rather full shuttle shapes, indicating that the PSRCFs have superior seismic performances. In the process of applying cyclic loading, the process from the elastic stage to yield and finally to bearing capacity decline can be clearly obtained. It can be seen that both n and β have significant impacts on the hysteretic curves of PSRCFs by looking at the hysteretic curves in Figure 9. With the increasing n, the bearing capacity of the frame degrades obviously. With the increasing β, the peak load of the hysteretic curve decreases as the peak load’s equivalent displacement grows, and the ductility becomes better. This is because when the resistance of the beam or column section remains unchanged, the height of the frame column increases with the increasing β, which makes the lateral stiffness of the frame decrease.
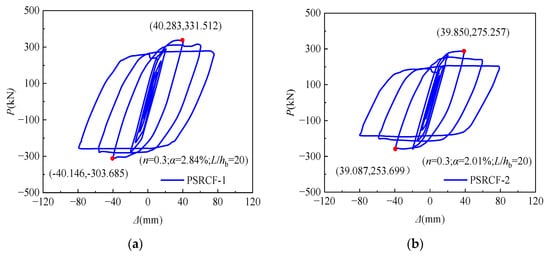
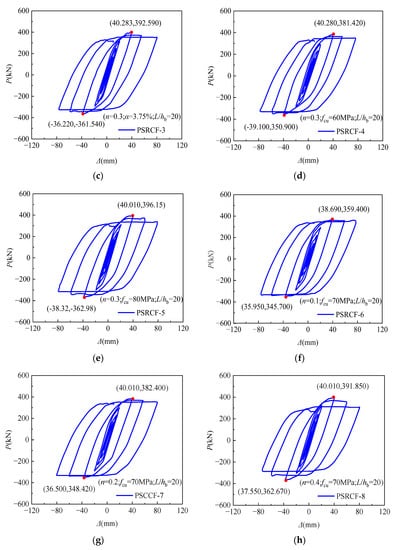
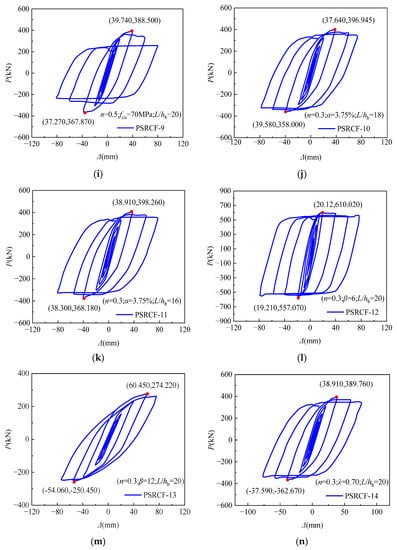
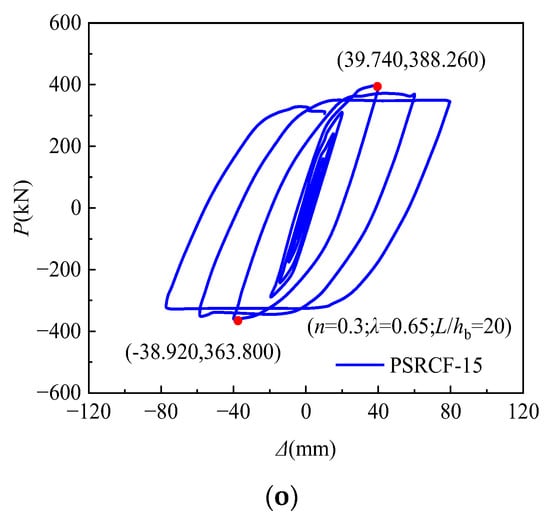
Figure 12.
Load–displacement hysteretic curves of 15 PSRCFs specimens: (a) PSRCF-1; (b) PSRCF-2; (c) PSRCF-3; (d) PSRCF-4; (e) PSRCF-5; (f) PSRCF-6; (g) PSRCF-7; (h) PSRCF-8; (i) PSRCF-9; (j) PSRCF-10; (k) PSRCF-11; (l) PSRCF-12; (m) PSRCF-13; (n) PSRCF-14; (o) PSRCF-15.
4.2. Skeleton Curves
Figure 13 illustrates the load–displacement (P–Δ) skeleton curves of 15 groups of PSRCF specimens, all of which conform to the rule of three broken lines. The ultimate bearing capacity shows a tendency to increase and then decrease as n increases. After the skeleton curve reaches the peak load, the descending section becomes more and more obvious. From Figure 13b, the P–Δ effect is significantly enhanced when n reaches 0.4, indicating that the ductility is reduced, as shown in Figure 13b. From Figure 13c, the initial stiffness of the specimen gradually increases as α increases, and the peak load increases significantly, while the falling section of the skeleton curve tends to be flattened, which is showing excellent load-holding capacity. It can be seen from Figure 13d that with the increasing β, the initial stiffness of the specimen gradually decreases, the peak load greatly decreases, and the skeleton curve declines slowly. Figure 13a,e,f show that the influences of fcu, L/hb, and λ on the peak loads of the skeletal curves for PSRCFs are not obvious.
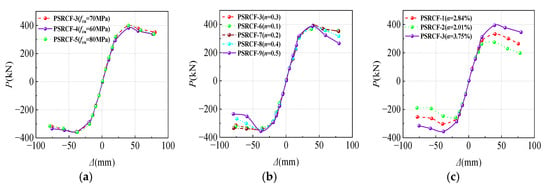
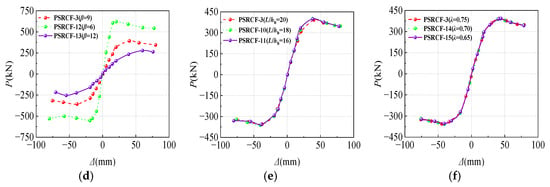
Figure 13.
Skeleton curves of the PSRCFs with different parameters: (a) fcu; (b) n; (c) α; (d) β; (e) L/hb; (f) λ.
4.3. Degradation of Stiffness
During repeated loading of structures, the degradation of stiffness can be expressed by secant stiffness (Ki) [32], which could be expressed by
where Fi stands for the peak horizontal load that is seen during the first cycle while being controlled by the i-th displacement and Δi indicates the corresponding displacement.
The comparisons on the secant stiffnesses of 15 PSRCFs with different parameters are shown in Figure 14. Ki decreases with the increasing horizontal displacement (Δ), and its decreasing range gradually slows down with the increasing Δ. It can be seen from Figure 14 that with the increasing fcu and n, the initial stiffness and the declining degree of the secant stiffness increase gradually. When n reaches 0.4, the deformation resistance decreases seriously, which indicates that n should not exceed 0.4. The parameters of α and β have significant effects on the secant stiffness of specimens. The parameters α and β show more pronounced effects on the secant stiffness of specimens. The initial stiffness and deformation resistance of the specimen gradually increase with α, and the stiffness degradation phenomenon slows down. With the increasing β, the initial stiffness is significantly reduced, and the stiffness degradation phenomenon slows down. The initial stiffness decreases with the increasing L/hb, while the effects of λ on the stiffness degradations of the specimens are not obvious.
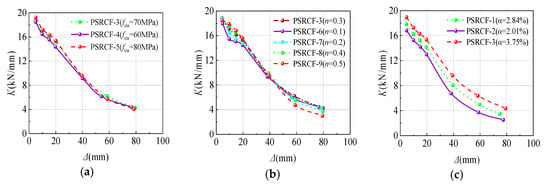
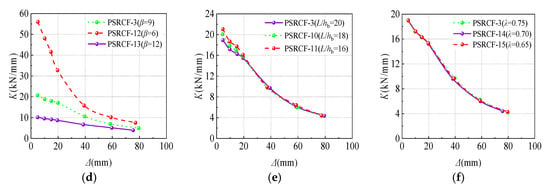
Figure 14.
The relationships between Ki and Δ for PSRCF specimens with different parameters: (a) fcu; (b) n; (c) α; (d) β; (e) L/hb; (f) λ.
4.4. Energy Dissipation Capacity
The hysteretic loop area of the P–Δ curve progressively increases as the repeated displacement increases, showing a gradual increase in the energy consumed by the structure [33]. By comparing the hysteresis loop area of each stage with different parameters, the influence of the hysteresis loop area on the energy dissipation performance of the structure can be investigated. The energy dissipation capacities of 15 PSRCFs with different parameters are compared in Figure 15. From Figure 15, both fcu and λ have positive correlations with the energy dissipation capacity of specimens. However, the dissipation capacities of specimens show a tendency to increase and then decrease with the increasing n. When n exceeds 0.4, the dissipation capacity of the specimen gradually increases with the increasing α, but decreases substantially when β and L/hb also increase. Considering the actual frame column section size, it is suggested that β should be within the range of 9~12.
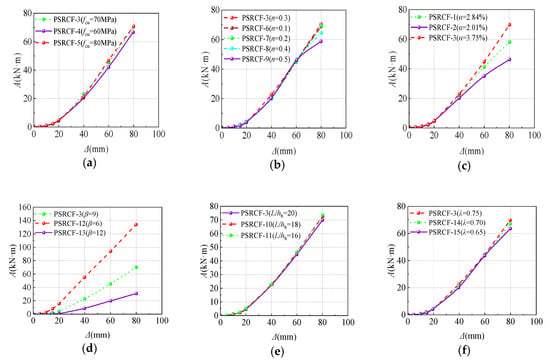
Figure 15.
Comparisons of the energy dissipation capacities for the PSRCF specimens with different parameters: (a) fcu; (b) n; (c) α; (d) β; (e) L/hb; (f) λ.
4.5. Ductility
Researchers often quantify the deformation properties of specimens by using the ductility coefficient (μ) [34]. The calculation formula is shown as follows
where Δu+ and Δy+ refer to the positive limit displacement and yield displacement, respectively, and Δu− and Δy− denote the negative limit displacement and yield displacement, respectively.
As shown in Figure 16, this study determines the yield load (Py) of the frame by using the energy method [29]. According to the P–Δ curve, when 0 < x0 < Δm, a point can be found by the program where SOAO = SOBC, the abscissa of the corresponding point B is the yield displacement, and the displacement when the bearing capacity is reduced by 85% is the ultimate displacement. The relationships of μ with fcu, n, α, β, L/hb, and λ of the PSRCF specimens are depicted in Figure 17. It can be seen that μ of the PSRCFS decreases gradually with the increasing fcu. When fcu changes from 60 MPa to, 70 MPa and 80 MPa, μ decreases from 3.45 to 3.30 and 3.05, respectively. With the increasing n, μ of the PSRCFs decreases gradually. When n changes from 0.1 to 0.2, 0.3, 0.4, and 0.5, μ decreases from 4.31 to 3.75, 3.30, 3.06, and 2.87, respectively. When α changes from 2.01% to 2.84% and 3.75% in turn, μ increases from 3.08 to 3.20 and 3.30, respectively. With the increasing L/hb, μ of the PSRCFs decreases gradually. When L/hb changes from 16 to 18 and 20, μ decreases from 3.33 to 3.31 and 3.30, respectively. With the increasing λ, μ of the PSRCFs decreases gradually. When λ changes from 0.65 to 0.70 and 0.75 in turn, μ decreases from 3.40 to 3.37 and 3.30, respectively. The ductility coefficients of 15 specimens are shown in Table 5. It can be seen from Table 5 that the μ values of PSRCFs vary from 2.98 to 7.21, while the existing research [35,36,37] shows that the μ values of RC frames, prestressed RC frames, SRC frames, and CFST frames vary from 2.96 to 4.09, 2.77 to 3.66, 3.76 to 4.09, and 5.50 to 6.10, respectively. It is demonstrated that the μ values of PSRCFs is better than RC frames, prestressed RC frames, and SRC frames, but, on the whole, is slightly smaller than CFST frames, which indicates that the novel composite frames have good deformation performances.
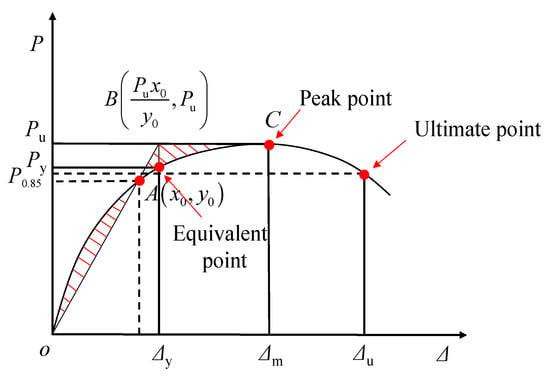
Figure 16.
The yield displacement obtained by the energy method.
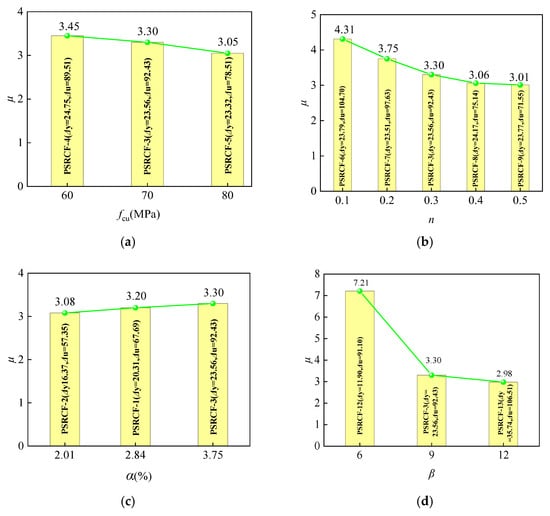
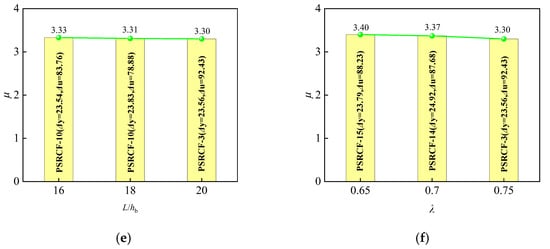
Figure 17.
The relationships of μ with different parameters for PSRCF specimens: (a) fcu; (b) n; (c) α; (d) β; (e) L/hb; (f) λ.

Table 5.
The ductility coefficients of 15 PSRCFs specimens.
5. Plastic Hinge Mechanism
In the post-processing step, the stress contours of the steel skeleton are extracted in Figure 18 at different loading points on the load–displacement curves of the plastic hinge, with PSRCF-3 as an example. When the displacement reaches 21.76 mm, one end of the H-shaped steel in the beam yields, and it is determined that the first plastic hinge of the structure occurs at this position. When the displacement reaches 31.69 mm, the tensile side of the other end of the H-shaped steel in the beam yields, and it is determined that the structure has a second plastic hinge at this position. When the displacement reaches 50.27 mm, the tensile sides of the angle steel sections at the bottoms of the two columns almost reach the yield strength at the same time, and it is determined that the third and fourth plastic hinges appear at the bottoms of the two columns. In the process of subsequent displacement loading, the stress of angle steel at the top of column is small and has not yet yielded, and only the above four plastic hinges are generated. In addition, we can also know that when the horizontal bearing capacity of the structure reaches the maximum, that is when the plastic hinge is generated at the bottom of the column, under the control of the selected parameters, the plastic hinge sequences of all PSRCF models are consistent. The first and second plastic hinges appear at both ends of the beam, and the remaining two plastic hinges are generated at the bottom of the two columns. At this time, the horizontal bearing capacity of the structure reaches its peak. It is determined that this kind of frame has a good mechanism of strong columns and weak beams.
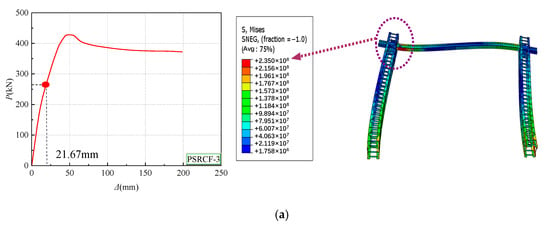
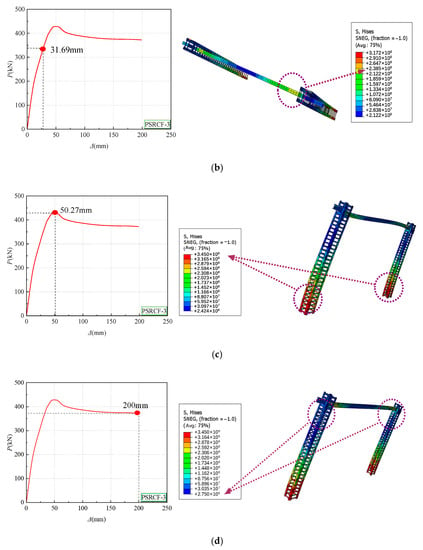
Figure 18.
Stress contours on the load–displacement curve of the plastic hinge for specimen PSRCF-3: (a) stress contour for the first plastic hinge; (b) stress contour for the second plastic hinge; (c) stress contour for the third and four plastic hinges; (d) stress contour for the final loading time.
6. Restoring Force Model
6.1. Trilinear Skeleton Curve Model
The trilinear skeleton curve model for PSRCFs is produced by statistical regression in accordance with the skeleton curve characteristics, as illustrated in Figure 19. The descriptive formula for the trilinear skeleton curve model is shown in Equation (14).
where Py represents the horizontal yielding load, Pm represents the horizontal peak load, Δy represents the displacement corresponding to the yielding load, Δm represents the displacement corresponding to the peak load, and K1 and Kd represent the stiffnesses of the elastic stage and degenerative stage, respectively.
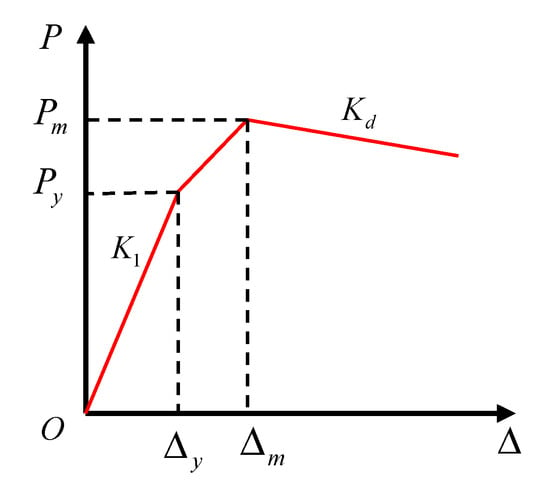
Figure 19.
Trilinear skeleton curve model.
- (1)
- Stiffnesses of the elastic stage for the forward and backward directions (K1, )
According to the load distribution law, the axial compression ratio, the beam–column sectional stiffness, and the stiffnesses of the elastic stage (K1, ) for the trilinear skeleton curve model are obtained by using regression as shown in Equation (15) as:
where n represents the design value of the axial compression ratio, λ represents the prestressing degree, and Ke represents the initial stiffness.
According to the literature [30], the calculation expression of Ke is shown in Equation (16) as:
with
where EIb and EIc stand for the sectional stiffnesses of the column and beam, respectively, H represents the calculated height of the frames, and L represents the calculated span of the frames;
- (2)
- Peak loads for the forward and backward directions (Pm, )
According to the axial compression ratio, steel ratio and prestressing degree, the peak loads (Pm, ) are obtained using linear regression as shown in Equation (18) as:
where m represents the steel ratio of the frame columns, and Pe is calculated according to the literature [29];
- (3)
- The displacements corresponding to the peak loads for the forward and backward directions (Δm, Δ′m)
According to the axial compression ratio, steel ratio and prestressing degree, the displacements corresponding to the peak loads (Δm, Δ′m) are obtained by using linear regression as shown in Equation (19) below:
- (4)
- The stiffness of the degenerative stage (Kd)
The stiffness of the degenerative stage (Kd) is obtained by using linear regression based on the axial compression ratio, steel ratio and slenderness ratio. The expression is as follows:
with
- (5)
- Verification of the trilinear skeleton curve model
The comparisons of the simulated and calculated skeleton curves are shown in Figure 20. It can be found that the two sets of curves have excellent agreements, indicating that the numerical simulations can obtain a more accurate prediction model with certain engineering significance.
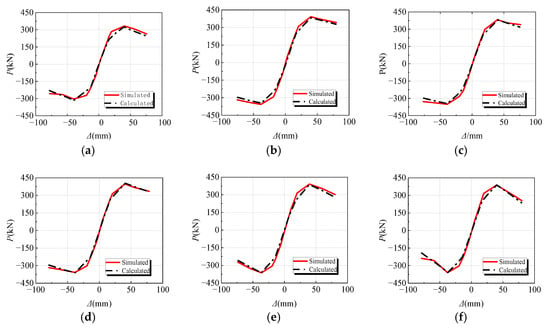
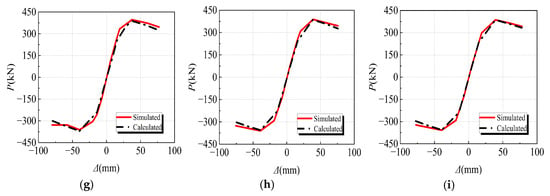
Figure 20.
Comparisons between the simulated and calculated skeleton curves of the PSRCS specimens: (a) PSRCF-1; (b) PSRCF-3; (c) PSRCF-4; (d) PSRCF-5; (e) PSRCF-8; (f) PSRCF-9; (g) PSRCF-11; (h) PSRCF-14; (i) PSRCF-15.
6.2. Hysteretic Rule of the Restoring Force Model
Figure 21 illustrates the resilience modeling (RFM) for PSRCFs through statistical regression, where the numbers 0, 1, 2, …, represent the loading and unloading path of the model [38].
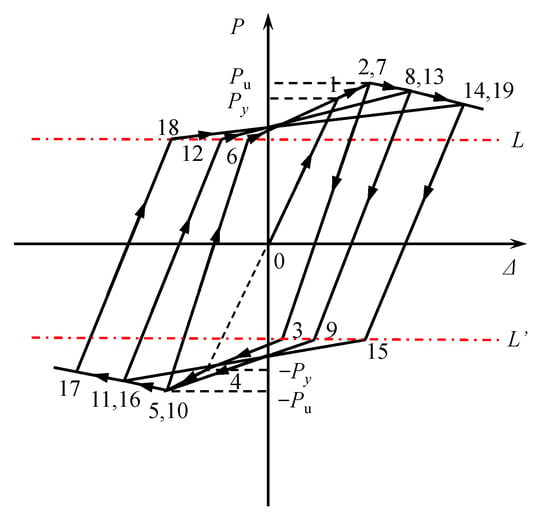
Figure 21.
Restoring force model for PSRCFs.
The following is an expression of the hysteretic rules:
- (1)
- The loading and unloading guidelines for the elastic stagePrior to the restitution force attaining Py, the loading process starts along the skeleton curve. During the unloading phase, the initial stiffness is considered, disregarding any stiffness degradation and residual deformation;
- (2)
- The loading and unloading guidelines for elastoplastic stageWhen the restitution force surpasses the horizontal yielding load Py in either the forward or backward direction, and yet remains below the peak load Pu, loading takes place along the skeleton curve, while unloading adheres to Equation (24), and the unloading stiffness (Kun) is derived through regression analysis aswhere Δy represents the yielding displacement, Δun denotes the displacement at the unloading point, and Ke signifies the initial stiffness;
- (3)
- The loading–unloading rules during the descending segment stageWhen the restitution force surpasses Pu in either the forward or backward direction, the loading stiffness Kd in the descending segment stage of the skeleton curve is employed, while the unloading stiffness is still computed according to Equation (24);
- (4)
- Rules for backward loading and forward reloadingThe trajectory is directed from the point at P = 0.65Pu directly to the yielding point in the backward direction when the backward loading occurs subsequent to the forward unloading, and the maximum displacement in the reverse direction cannot be greater than the yield displacement. Indeed, when the maximum displacement in the backward direction surpasses the yielding displacement, the trajectory proceeds from the point at P = 0.65Pu to the maximum displacement point in the backward direction. Absolutely, for forward reloading after backward unloading, the trajectory leads from the point at P = 0.65Pu to the maximum point in the forward direction.
Figure 22 compares two sets of the hysteretic curves derived by the finite element simulation (FES) and RFM, and it is clear that both of them are in excellent concordance. As a result, the restoring force model for the type of composite frame in this study is reasonable.
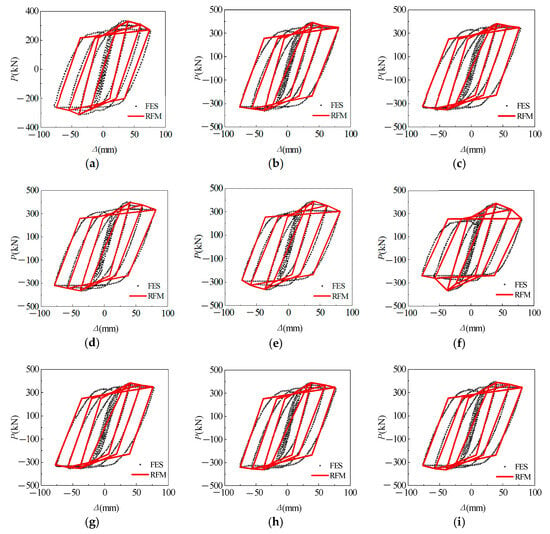
Figure 22.
Comparisons between the hysteretic curves obtained by the FES and RFM. (a) PSRCF-1. (b) PSRCF-3. (c) PSRCF-4. (d) PSRCF-5. (e) PSRCF-8. (f) PSRCF-9. (g) PSRCF-11. (h) PSRCF-14. (i) PSRCF-15.
7. Conclusions
In order to investigate the seismic behaviors of novel PSRCFs under the combined actions of axial and horizontal loadings, 15 groups of PSRCF specimens were designed with varying parameters, including the cubic compressive strength of high-strength concrete (fcu), the axial compression ratio of the frame column (n), the slenderness ratio of the frame column (β), the steel ratio of the angle steel (α), the span–height ratio of the frame beam (L/hb), and the prestressing degree (λ). Then, using ABAQUS software, 15 PSRCF finite element models were created. The following conclusions could be made based on the obtained results on these various parameters in this study:
- (1)
- Using ABAQUS software, 15 finite element models of PSRCFs were created. These models were based on the modified concrete constitutive model presented by Mander, the prestressing effect applied using the temperature reduction approach, and the reasonable FEM method;
- (2)
- The 15 specimens had relatively full pike-shaped hysteresis curves with no pinched corners, indicating that the structure had good seismic behaviors. The skeleton curves of 15 specimens all conform to the rule of three broken lines in the elastic stage, elastic–plastic stage, and descending stage, and all specimens demonstrate exceptional loading capacities and ductilities. The peak loads observed in the skeleton curves show increasing trends with the increasing fcu, α, n, and λ, and decrease with the increasing β and L/hb, while α and β have greater impacts on the peak load of this kind of novel PSRCFs;
- (3)
- The stiffness degradations of PSRCFs are closely related to the coefficients α and β. The stiffness degradations of specimens can be improved significantly by increasing α; on the contrary, the stiffness degradations decrease by increasing β. The energy dissipation capacity of the specimens increases with the increasing α, while as β increases, the energy dissipation capacity gradually decreases. β and n have great influences on the ductility, and the ductility of the specimen decreases gradually with the increasing β and n. When n reaches 0.4, the deformation resistance decreases largely, which indicates that n should not exceed 0.4. Considering the actual frame column section size, it is suggested that β should be within the range of 9~12;
- (4)
- Based on the stress contours of the steel skeleton with the changes of loading obtained by the post-processing, the hinge law of this kind of frame is consistent, and the plastic hinges develop from the beam ends on both sides to the column bottom on both sides. There is no plastic hinge on the top of the column, indicating that the PSRCFs have good mechanisms of strong columns and weak beams;
- (5)
- On the basis of the hysteresis curves acquired through the quasi-static analysis, the restoring force model and the trilinear skeleton curve model were developed, and the hysteresis rules were proposed, correspondingly. The findings of the numerical simulation results are in good agreement with the skeleton curves and hysteretic curves obtained by equation, indicating that the restoring force model is reasonable and feasible.
Author Contributions
Conceptualization, J.J.; software, J.J. and H.Z.; validation, L.J. and Y.Z.; writing—original draft, J.J., H.Z. and L.J.; writing—review and editing, Z.Y. and Z.Z.; resources, J.J. and B.L.; data curation, X.C.; supervision, J.J.; project administration, J.J.; funding acquisition, J.J. All authors have read and agreed to the published version of the manuscript.
Funding
This work is supported by Joint Guidance Project of Natural Science Foundation of Heilongjiang Province (grant no. LH2020E018), Scientific Research Fund of Institute of Engineering Mechanics of China Earthquake Administration (grant no. 2020D07), China–Pakistan Belt and Road Joint Laboratory on Smart Disaster Prevention of Major Infrastructures (grant no. 2022CPBRJL-05), Northeast Petroleum University Guided Innovation Fund (grant no. 2020YDL-02), and Guiding Science and Technology Project of Daqing City (grant no. zd-2021-40).
Data Availability Statement
The data used to support the findings of this study are included within the article.
Conflicts of Interest
The authors declare no conflict of interest.
References
- Xiong, X.; Yao, G.; Su, X. Experimental and numerical studies on seismic behavior of bonded and unbonded prestressed steel reinforced concrete frame beam. Eng. Struct. 2018, 167, 567–581. [Google Scholar]
- Vollmer, M.; Bauer, A.; Frenck, J.-M.; Krooß, P.; Wetzel, A.; Middendorf, B.; Fehling, E.; Niendorf, T. Novel prestressing applications in civil engineering structures enabled by Fe-Mn-Al-Ni shape memory alloys. Eng. Struct. 2021, 241, 112430. [Google Scholar] [CrossRef]
- Hassan, W.; Reyes, J.; González, C.; Pallarés, F.; Spinel, J. Seismic vulnerability and resilience of steel-reinforced concrete (SRC) composite column buildings with non-seismic details. Eng. Struct. 2021, 244, 112810. [Google Scholar] [CrossRef]
- Ji, J.; Wang, W.; Jiang, L.; Ren, H.; Wang, Q.; Xuan, W.; Liu, Y. Bearing capacity of UHPC-filled high-strength elliptical steel tube composite columns with encased high-strength h-shape steel subjected to eccentrical load. Buildings 2022, 12, 1272. [Google Scholar] [CrossRef]
- Wu, S.; Liu, W.; Zhang, J.; He, W.; Guo, Y. Experimental and analytical investigation of square-shaped concrete-filled steel tube columns. J. Constr. Steel Res. 2023, 201, 107737. [Google Scholar] [CrossRef]
- Luo, H.; Wang, K. Research on hysteretic models for prestressed and non-prestressed steel reinforced concrete frames. Adv. Civ. Eng. 2021, 2021, 9442180. [Google Scholar] [CrossRef]
- Ji, J.; Xu, Z.; Jiang, L.; Yuan, C.; Zhang, Y.; Zhou, L.; Zhang, S. Nonlinear buckling analysis of h-type honeycombed composite column with rectangular concrete-filled steel tube flanges. Int. J. Steel Struct. 2018, 18, 1153–1166. [Google Scholar] [CrossRef]
- Wang, K.; Yuan, S.F.; Cao, D.F. Test on seismic performance of frame structure of steel reinforced concrete beam and steel-tube encased concrete column. J. Build. Struct. 2013, 34, 103–112. [Google Scholar]
- Wang, K.; Lu, X.-F.; Yuan, S.-F.; Cao, D.-F.; Chen, Z.-X. Analysis on hysteretic behavior of composite frames with concrete-encased CFST columns. J. Constr. Steel Res. 2017, 135, 176–186. [Google Scholar] [CrossRef]
- Ding, F.-X.; Yin, G.-A.; Jiang, L.-Z.; Bai, Y. Composite frame of circular CFST column to steel-concrete composite beam under lateral cyclic loading. Thin-Walled Struct. 2018, 122, 137–146. [Google Scholar] [CrossRef]
- Zhang, J.; Jia, J.; Yu, J.; Sun, Z. Seismic behaviour of steel-reinforced ultra-high-strength concrete composite frame: Experimental study. Adv. Struct. Eng. 2019, 22, 2179–2191. [Google Scholar] [CrossRef]
- Kheyroddin, A.; Gholhaki, M.; Pachideh, G. Seismic evaluation of reinforced concrete moment frames retrofitted with steel braces using IDA and Pushover methods in the near-fault field. Seism. Retrofit. 2019, 7, 159–173. [Google Scholar]
- Wang, G.; Sun, X.; Zhao, W.; Zhang, D. A finite element analysis model for post-fire seismic performance of steel reinforced concrete frame structures. J. Build. Struct. 2020, 41, 92–101. [Google Scholar]
- Behrouz, K.; Mehdi, D. Effect of corrosion in reinforced concrete frame components on pushover behavior and ductility of frame. Struct. Concr. Vol. 2020, 22, 2665–2687. [Google Scholar]
- Li, X.; Zhou, X.; Liu, J.; Wang, X. Analysis of circular tubed steel reinforced concrete column to steel beam frame structure system. J. Build. Struct. 2021, 42, 31–40. [Google Scholar]
- Li, D.-B.; Chai, Y.-K.; Li, W.-L.; Xiang, R. Experimental study and finite element analysis of seismic behaviour of novel precast prestressed concrete frames. Structures 2022, 38, 402–415. [Google Scholar] [CrossRef]
- Alshaikh, I.M.; Abu Bakar, B.; Alwesabi, E.A.; Abadel, A.A.; Alghamdi, H.; Altheeb, A.; Tuladhar, R. Progressive collapse behavior of steel fiber-reinforced rubberized concrete frames. J. Build. Eng. 2022, 57, 104920. [Google Scholar] [CrossRef]
- Aleksandrova, N. Application of Mises yield criterion to rotating solid disk problem. Int. J. Eng. Sci. 2012, 51, 333–337. [Google Scholar] [CrossRef]
- Ji, J.; Li, Y.H.; Jiang, L.Q.; Zhang, Y.F.; Liu, Y.C.; He, L.J.; Zhang, Z.B.; Wang, Y. Axial compression behavior of strength-gradient composite stub columns encased CFST with small diameter: Experimental and numerical investigation. Structures 2023, 47, 282–298. [Google Scholar] [CrossRef]
- Ji, J.; He, L.; Jiang, L.; Zhang, Y.; Liu, Y.; Li, Y.; Zhang, Z. Numerical study on the axial compression behavior of composite columns with steel tube SHCC flanges and honeycombed steel web. Eng. Struct. 2023, 283, 115883. [Google Scholar] [CrossRef]
- Pagoulatou, M.; Sheehan, T.; Dai, X.; Lam, D. Finite element analysis on the capacity of circular concrete-filled double-skin steel tubular (CFDST) stub columns. Eng. Struct. 2014, 72, 102–112. [Google Scholar] [CrossRef]
- Teng, J.; Yu, T.; Wong, Y.; Dong, S. Hybrid FRP–concrete–steel tubular columns: Concept and behavior. Constr. Build. Mater. 2006, 21, 846–854. [Google Scholar] [CrossRef]
- Mander, J.B.; Priestley, M.J.N.; Park, R. Theoretical stress-strain model for confined concrete. J. Struct. Eng. 1988, 114, 1804–1826. [Google Scholar] [CrossRef]
- Han, L.H.; Tao, Z.; Liu, W. Concrete filled steel tubular structures: Theory and practice. J. Fuzhou Univ. Nat. Sci. 2001, 29, 24–34. [Google Scholar]
- GB50010-2010; National Standard of the People’s Republic of China Code for Design of Concrete Structures. China Architecture & Building Press: Beijing, China, 2010.
- Zhou, X.; Lu, D.; Du, X.; Wang, G.; Meng, F. A 3D non-orthogonal plastic damage model for concrete. Comput. Methods Appl. Mech. Eng. 2020, 360, 112716. [Google Scholar] [CrossRef]
- Luca, P.; Daniela, A.; Enrico, S. A fiber beam element based on plastic and damage models for prestressed concrete structures. Eng. Struct. 2023, 292, 116501. [Google Scholar]
- Javanmardi, M.; Maheri, R.M. Anisotropic damage plasticity model for concrete and its use in plastic hinge relocation in RC frames with FRP. Structures 2017, 12, 212–226. [Google Scholar] [CrossRef]
- Ji, J. Research on Seismic Performance and Design Method of Jacketing Steel Reinforced Concrete Frame Prestressed with Bonded Tendons. Ph.D. Thesis, Harbin Institute of Technology, Harbin, China, 2008. [Google Scholar]
- Wang, K. Test and Analysis on Seismic Performance of Jacketing Prestressed Steel Reinforced Concrete Frame. Ph.D. Thesis, Harbin Institute of Technology, Harbin, China, 2010. [Google Scholar]
- Luo, L.; Qin, J.; Zhao, D.; Wu, Z. Seismic behavior of extended end-plate connections subjected to cyclic loading on the top-side of the column. Materials 2020, 13, 3724. [Google Scholar] [CrossRef]
- Ji, J.; He, L.; Jiang, L.; Ren, H.; Ni, S.; Wang, Z.; Li, Y.; Yu, C.; Lin, Y. Seismic behavior of GFRP tube reactive powder concrete composite columns with encased steel. Front. Mater. 2021, 08, 793392. [Google Scholar] [CrossRef]
- Cai, Z.; Liu, F.; Yu, J.; Yu, K.; Tian, L. Development of ultra-high ductility engineered cementitious composites as a novel and resilient fireproof coating. Constr. Build. Mater. 2021, 288, 123090. [Google Scholar] [CrossRef]
- Ji, J.; Yang, M.; Xu, Z.; Jiang, L.; Song, H. Experimental study of H-shaped honeycombed stub columns with rectangular concrete-filled steel tube flanges subjected to axial load. Adv. Civ. Eng. 2021, 2021, 6678623. [Google Scholar] [CrossRef]
- Yu, Z.W.; Jian, J.G.; Zhou, L.Y. Ductility analysis of RC frame and prestressed RC frame structures. Build. Struct. 1997, 2, 41–45. [Google Scholar]
- Fu, C.; Li, Y.; Sun, X.; Xu, J. Experimental study on seismic performance of prestressed and non-prestressed steel reinforced concrete frames. J. Build. Struct. 2010, 31, 15–21. [Google Scholar]
- Wang, K.; Yuan, S.-F.; Chen, Z.-X.; Zhi, H.-X.; Shi, G.-L.; Cao, D.-F. Experimental study on hysteretic behavior of composite frames with concrete-encased CFST columns. J. Constr. Steel Res. 2016, 123, 110–120. [Google Scholar] [CrossRef]
- Ji, J.; Lin, Y.B.; Jiang, L.Q. Hysteretic behavior of h-shaped honeycombed steel web composite columns with rectangular concrete-filled steel tube flanges. Adv. Civ. Eng. 2022, 2022, 1546263. [Google Scholar] [CrossRef]
Disclaimer/Publisher’s Note: The statements, opinions and data contained in all publications are solely those of the individual author(s) and contributor(s) and not of MDPI and/or the editor(s). MDPI and/or the editor(s) disclaim responsibility for any injury to people or property resulting from any ideas, methods, instructions or products referred to in the content. |
© 2023 by the authors. Licensee MDPI, Basel, Switzerland. This article is an open access article distributed under the terms and conditions of the Creative Commons Attribution (CC BY) license (https://creativecommons.org/licenses/by/4.0/).