Abstract
The COVID-19 pandemic has led to a surge in the use of self-service facilities (SSFs) in residential areas worldwide. Previous studies on SSFs mainly focused on their application in commercial or other scenarios. However, SSFs in residential areas have not been thoroughly studied. This study develops an analytical framework for assessing both the supply and demand for SSFs in residential areas. The study evaluates 2693 residential communities and 479 smart parcel lockers (SPLs) in Tianjin, China. The results show that the high-demand area for SPLs is within 300 m of home, while the high-supply area is 300–600 m from home. Further analysis using the Gini coefficient and location quotient shows that the top 20% of the population have access to 80% of SPLs, and most residential communities experience an oversupply. Our study suggests that a mismatch between the supply and demand of SPLs may result in massive public space waste, resource waste, and inequity. Given the many uncertainties of the future, this study highlights the need to consider the dynamic supply–demand relationship of SSFs. This may encourage urban planners, policymakers, and experts in other related disciplines to work towards a more service-efficient and equitable utilization of SSFs in residential areas.
1. Introduction
The COVID-19 pandemic has had a significant impact on people’s lifestyles in two ways [1,2]. First, the lockdown policy has indirectly limited people’s lives to their living space, which has encouraged a shift from offline to online shopping. Second, the no-contact policy has made self-service facilities (SSFs) an effective COVID-19 prevention and control measure, as well as an unavoidable choice for people’s physical and mental health. As a result of these changes, the rapid expansion of SSFs in residential areas has become a concern.
SSFs are pioneering the shift of traditional manual services from “high-touch” to “high-tech” [3,4]. With the advantage of reducing or eliminating human interaction, SSFs have been widely used in the service industry since the pandemic’s outbreak [5]. Smart parcel lockers (SPLs) are one of the most widely used self-service solutions in recent years. They are created to enable contactless deliveries in response to e-commerce orders [4,6,7]. SPLs are typically designed as collection-and-delivery machines that can be easily placed in a wide variety of living and commercial environments, such as transportation hubs, office buildings, shopping malls, and residential communities [8]. Unlike traditional home delivery services and collection-and-delivery service points, SPLs provide consumers with the ease of 24 h access. They also significantly minimize delivery failures and are considered beneficial from both sociological and operational perspectives [9,10,11].
As both supply and demand are increasing, SPLs are applied worldwide. Prominent examples include ByBox in the UK, PackStation in Germany, InPost in Poland, SingPost and Ninjia Van in Singapore, and Hive Box in China [8,10,12,13,14]. While most studies have focused on techniques to refine the model or increase the accuracy of the algorithm to optimize logistical performance and better understand consumer demands, some researchers have recognized the significance of SPL location selection. They have summarized a variety of SPL location issues, such as accessibility, availability, security, environmental impact/land occupation, costs, methods of use, and regulations [15,16,17,18]. In fact, the location of SPLs is where the conflict between supply and demand occurs. Addressing location issues is critical to long-term supply and demand for SPLs. It is important to investigate a balanced path for the development of SPLs under the new type of supply–demand interaction between logistics businesses, customers, and governments. In this regard, SPLs could be more service-efficient and sustainable.
In this paper, we conduct a case study on the assessment of the supply–demand match of SPLs on a residential community level in the central metropolitan region of Tianjin, China. Most urban residential communities in China have distinct physical boundaries [19], which divide the inside from the outside. This means that residents are more likely to use SPLs in their own community, rather than in another community. As a result, the acceptable distance for Chinese residents to use SPLs may be shorter than in other countries. Tianjin is one of China’s four municipalities, and it is also a notable e-commerce powerhouse. The express delivery sector in Tianjin has witnessed tremendous growth, and it consistently outpaced the national average growth [8]. In 2016, there were only five SPLs in Tianjin. From 2019 to 2022, the number of SPLs climbed from 51 to 479, reflecting an average annual growth rate of roughly 279.74% during the pandemic period [8]. The increase in supply has led to an increase in complaints from residents. This may be because the policy lacks limits on where to install and where not to place SPLs. As a result, some SPLs are located in inconvenient locations, such as in residential buildings, in a remote corner of a community, or in the middle of a busy street outside the boundary of the community. The government of Tianjin intends to raise the number of SPLs to 5000 [20]. However, installing SPLs blindly may result in a massive waste of resources. Therefore, research on the supply and demand matching of SPLs can provide valuable reference for policy formulation, urban planning and management, and city logistics layout.
We first obtained basic data of 2693 residential communities and 479 SPLs in the study area from open access websites. Using the analytical framework we developed, we examined the supply and demand of SPLs. We found that both supply and demand of SPLs are positively correlated with road density, population density, and per capita income. We then assessed the supply–demand matching state of SPLs. The results showed that the supply of SPLs is concentrated in the central urban area, and the top 20% of the population has access to 80% of the SPLs. This could lead to significant improper use of public spaces, resource waste, and inequity. Our extensive analysis indicates the critical importance of research on the supply–demand matching of new emergent facilities such as SPLs. To the best of our knowledge, this is the first study to address location difficulties by integrating both supply and demand for SPLs. Our findings indicate that location, particularly the area within 600 m of home, is critical to balancing supply and demand for SPLs. Future research may consider the dynamic planning of SPLs to adjust the location to satisfy both the profit of logistics businesses and the satisfaction of residents in order to improve resilience to future uncertainties.
2. Literature Review
To date, research on the location issues of SPLs appears to be scarce. The research field of SPLs is not highly established, with only 42 research documents in the Web of Science Core Collection Database (as of August 2023, when this manuscript was written). The first study related to SPLs was published in 2014 [21]. Lemke et al. (2016) [12] and Iwan et al. (2016) [14] were among the first scholars to introduce the concept of SPLs and present descriptive evidence of benefits from both the operators’ and consumers’ perspectives. To the best of our knowledge, Deutsch and Golany (2018) [22] developed the first quantitative approach to determine the optimal locker location. Just as an SPL is a newly implemented delivery method, the retrieval results indicate that the research topic of SPLs is also a newly emerging field. Based on the search results, we discuss related work along two aspects: (1) SPL preference under COVID-19 and (2) the location issues of SPLs.
2.1. SPL Preference under COVID-19
The rise of online shopping has led to a significant increase in demand for dedicated delivery services to the end consumer. However, traditional home delivery has several disadvantages, including a high number of missed deliveries, which can lead to more kilometers traveled, higher pollution emissions, and additional costs [21,23]. As a self-service tool, an SPL is considered an efficient way to solve the last-mile problem in delivery, enhance the delivery network system quality, and increase customer satisfaction [24]. As a result, SPLs are growing quickly, especially in metropolitan areas [21].
The COVID-19 pandemic has led to a surge in e-commerce sales and has also changed customer behavior [4,25]. During the pandemic, the e-commerce sector in Pakistan increased by 10% in daily records [26]; the volume of parcels increased by 37% in the UK from April to May 2020 [27]; and retail e-commerce sales in Canada experienced a 99.3% increase from February to May 2020 [28]. The surge in e-commerce has further strained the last-mile delivery process, which has long been recognized in the literature as the most costly, inefficient, and environmentally burdensome component of the supply chain [25]. In the shock of COVID-19, among the delivery alternatives, those characterized by a contactless or unattended nature stand out as the favored options by consumers under the pandemic context [29]. To this end, the pandemic represents a unique disruptive factor that drives a much faster diffusion of alternative delivery methods and shapes consumers’ preferences towards contactless or self-service-based options [30]. Extensive research has been conducted to investigate customer preferences, revealing a strong inclination towards simplified and self-service options [31,32]. Customers who have grown accustomed to online services may feel uneasy when faced with in-person interactions and may avoid social situations [31,33]. Consequently, the adoption of SPLs becomes not only a matter of convenience but also a health-related choice [34].
2.2. Location Issues of SPLs
The worldwide application of SPLs has exhibited remarkable exponential growth in the short term after the breakout of the pandemic. For example, in Poland, the number of SPLs surged from 7000 to 13,000 during the pandemic [10]. While the supply and demand for SPLs are both expanding, complaints from consumers and negative profits of enterprises continue. This has focused the attention of the academy on SPL location issues [22].
SPLs can be located in places where consumers can access them easily. Even though the literature shows that the spatial distribution of SPLs is concentrated in central cities, SPL location preferences vary in different countries [16]. For example, in Sweden and France, commercial areas and public transport stops were preferred locations [21,35], while in Poland, these places were identified as the worst locations [12,14]. In South Korea and Australia, high-population-density areas with public transport stops were the most preferred locations for SPLs [17,36]. In Tianjin, China, residential communities are the most preferred location for SPLs. In 2019, 92.2% of SPLs were installed in residential communities, and this percentage increased to 97.7% in 2022 [8]. Many researchers believe that SPL networks can help solve the last-mile problem, and they emphasize the importance of determining the locations of SPLs [18,22,37].
Previous studies have used a variety of methods to optimize the location of SPLs, including the Spherical Fuzzy Analytic Hierarchy Process [38], bilevel programming approach [39], cluster analysis [40], multi-criteria methods [41], and integrated algorithms [42]. However, most of these studies have focused on optimizing the algorithm or model, rather than considering the demand for SPLs [43]. This has led to a fundamental mismatch between supply and demand. The SPL system is complex and involves a variety of stakeholders, including public authorities, urban planners, users, and private companies [44]. This makes it difficult to optimize SPL locations using a single approach. Therefore, this study will fill the major gap in the literature by developing a framework to address SPL location issues in consideration of both supply and demand aspects. The framework is based on a combination of the spatial analysis of SPL accessibility and the resident purchase power of residential communities. The results of the study could provide valuable insights for urban planners and policymakers who are responsible for the distribution of SPLs.
3. Materials and Methods
3.1. Study Area
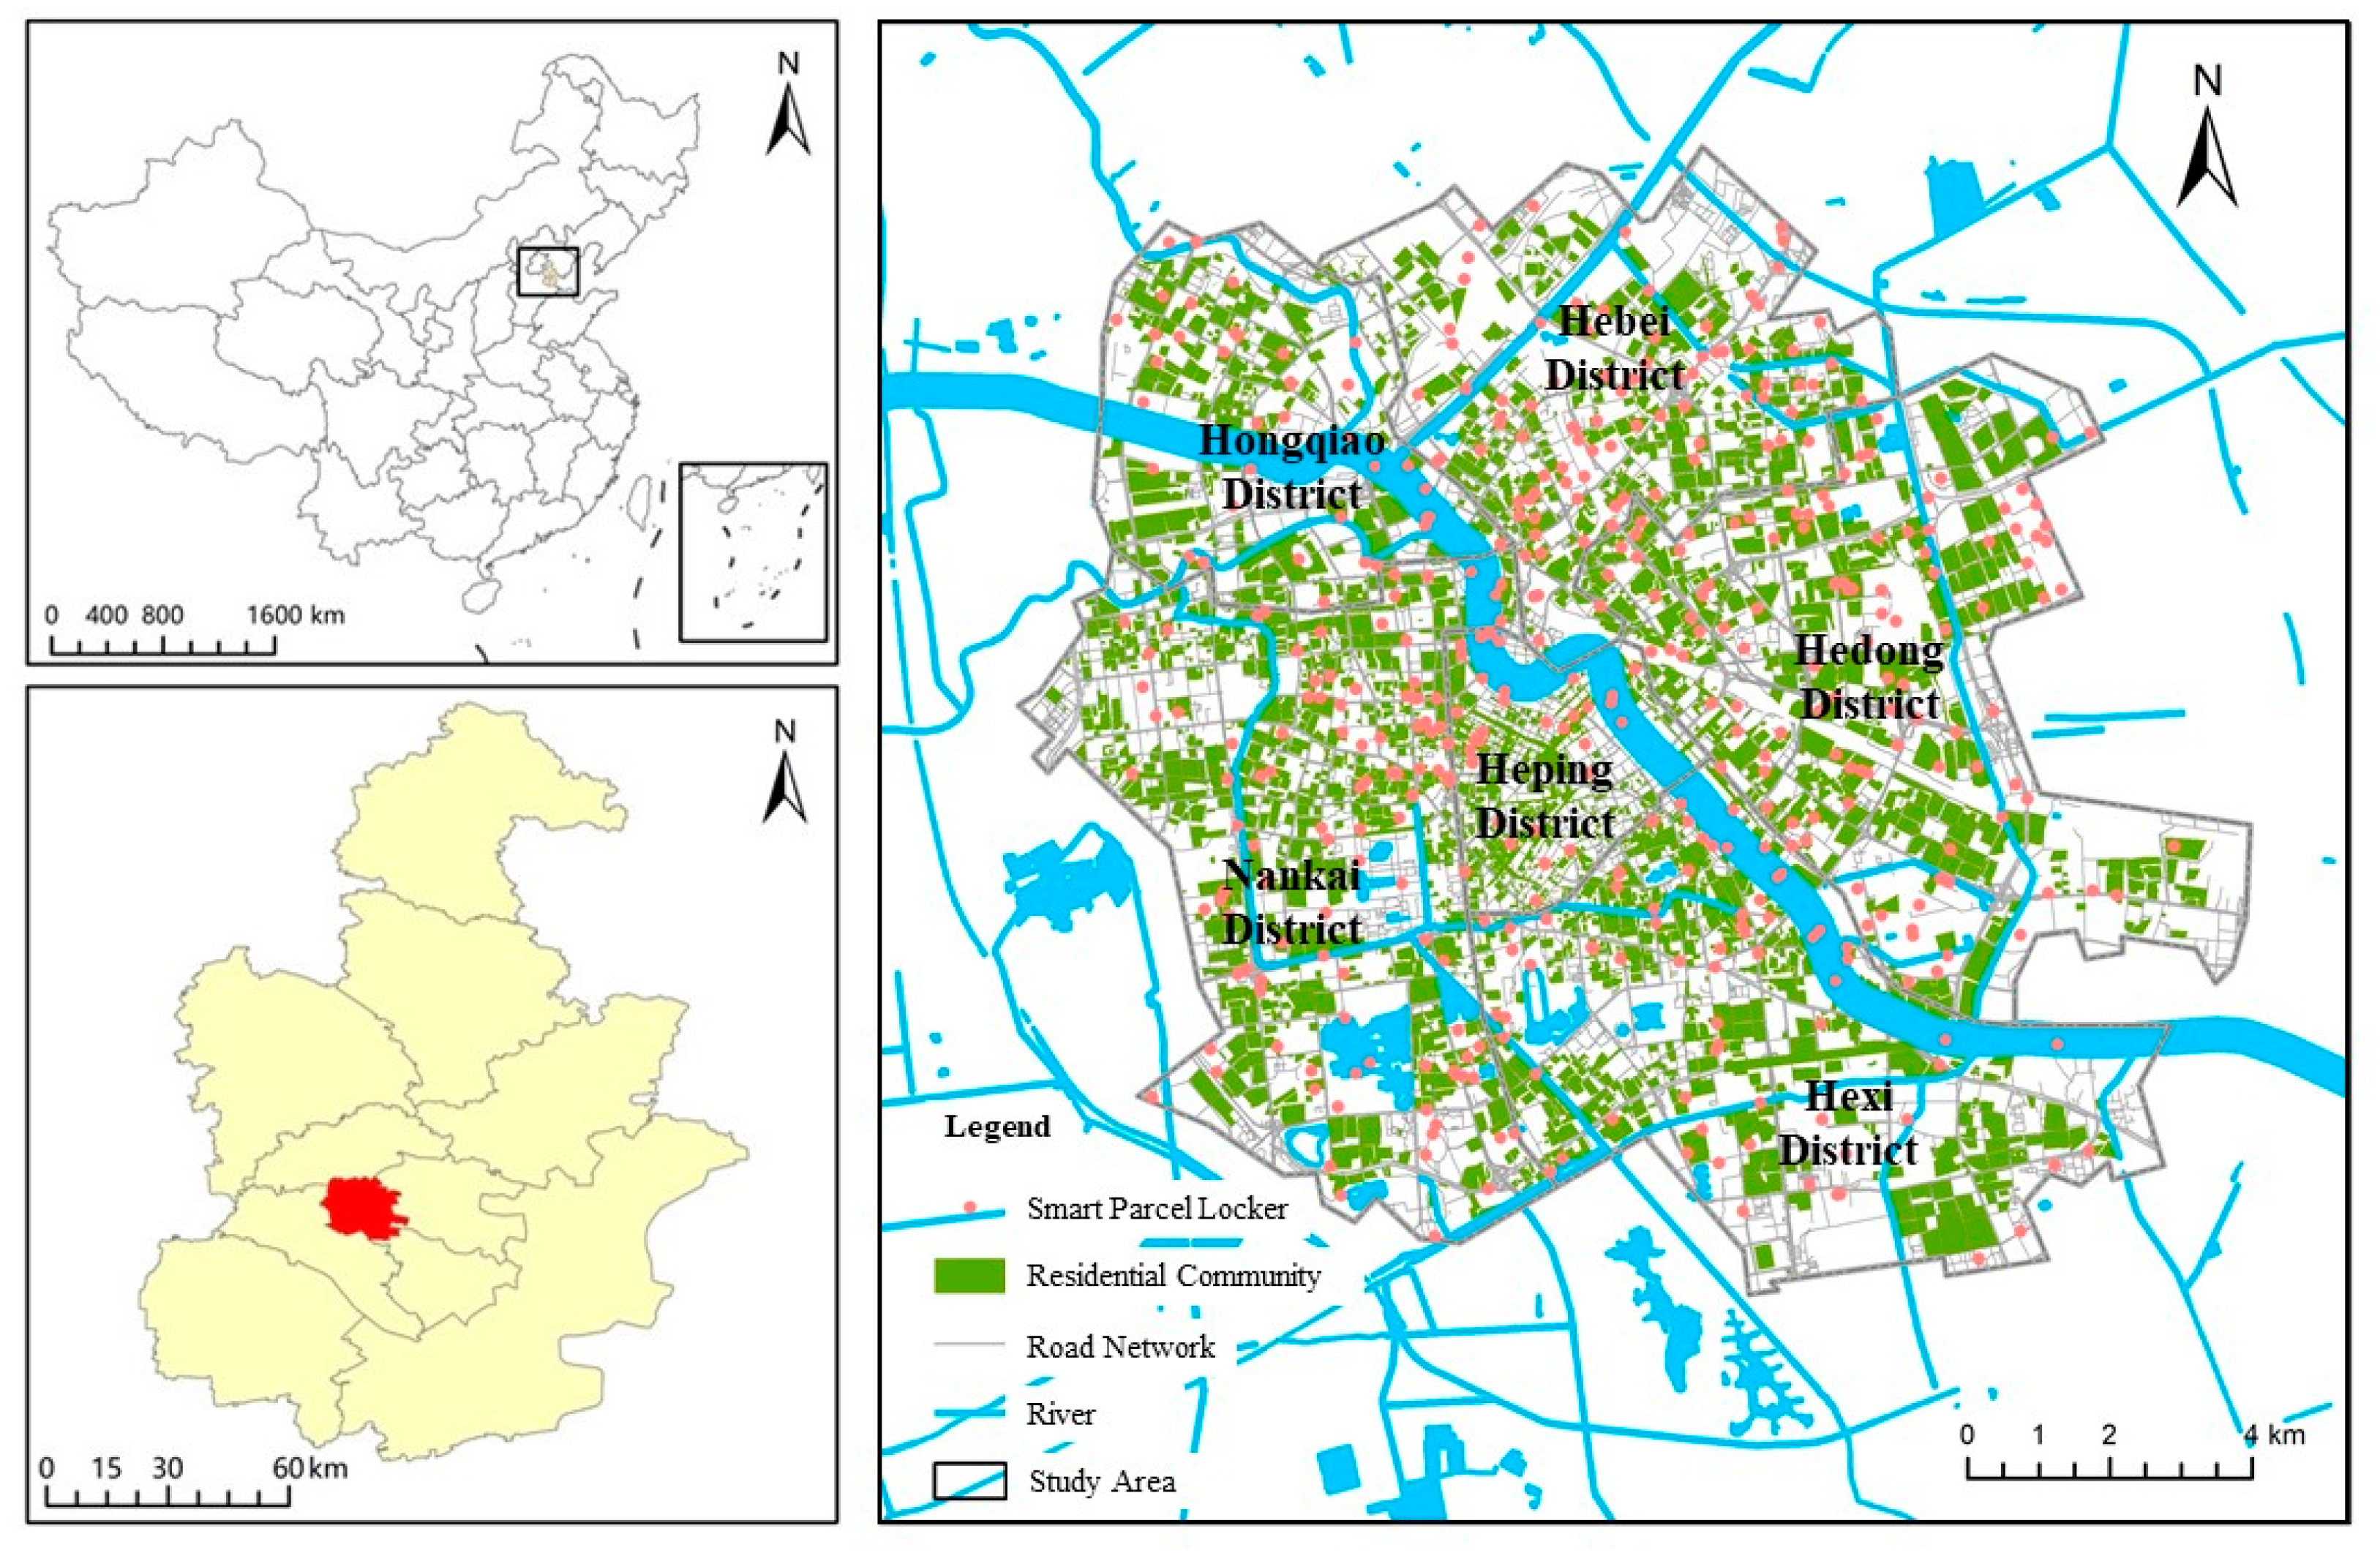
The central Tianjin region was selected for this study (Figure 1). Tianjin has 16 districts, a population of more than 13.73 million people, and a land area of 11,916.85 km2 [45]. The study area includes six districts: Heping District, Hedong District, Hexi District, Hebei District, Nankai District, and Hongqiao District. It is the city’s central urban area for political, cultural, and economic activities, with a land area of 576.160 km2 (13.29% of Tianjin) and a population of 4.06 million people (29.26% of Tianjin, according to the People’s Republic of China’s Seventh Census) [45]. And the urbanization rate of the study area is 100% [30]. The central Tianjin region accounts for the majority of online shopping and express delivery services of Tianjin city due to its high population and road network density. As a result, a considerable number of SPLs have been placed in the area [8]. This makes it an ideal location for studying the supply and demand of SPLs.
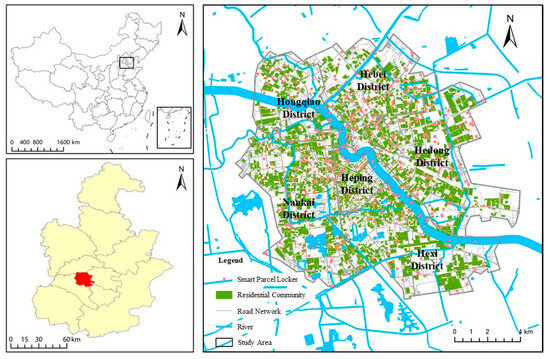
Figure 1.
Study area.
3.2. Data
Three datasets were used in this study:
- Area of interest (AOI) data on 2693 residential communities in the study area. Compared with point of interest (POI) data, which have been commonly used in prior studies on residential communities and service facilities [46], AOI data provide information about the shape of a region and can more accurately present the boundaries of residential communities [47]. The AOI data were obtained from Lianjia.com (accessed on 10 May 2023), one of China’s major real estate transaction service platforms.
- The geographical data for SPLs. The data were obtained via open access electronic map using Python (accessed on 19 December 2022) and includes the name, address, longitude, and latitude of each SPL. By the end of 2022, there were 479 SPLs in the study area, with the vast majority (97.7%) installed within residential communities [8].
- The attribute information of the residential communities, including the area of the community, the number of households of the community, and the average house price of the community. The method of data collection for this dataset was the same as for the AOI data.
3.3. Pre-Experiment
We conducted a pre-experiment questionnaire survey in Tianjin in May 2022 to gain a better understanding of residents’ opinions and usage habits regarding SPLs. The questionnaire survey was administered online, and the survey link is available at https://www.wenjuan.com/s/UZBZJvi7EWm/ (accessed on 31 May 2022). A total of 350 participants completed the survey, with a male-to-female participant ratio of 1:1.5. The preliminary results are summarized as follows (Table 1) [48]:

Table 1.
Pre-experiment questionnaire survey questions and answers.
- SPLs are the most popular choice for residents among various types of SSFs.
- Residents expressed dissatisfaction with the current spatial layout of SPLs. They would like SPLs to be located within a 5 min walking distance of their homes.
- Residents rely heavily on SPLs for their parcel collection and delivery needs. This suggests that it may be challenging to replace SPLs with other types of facilities in the short term.
The findings from the pre-experiment survey serve as a foundation for the next step, which involves developing the framework for supply and demand assessment.
3.4. Methods
To assess the supply and demand for SPLs in residential communities, an integrated framework was designed. The framework consists of three main modules:
- SPL supply assessment: This module evaluates the accessibility of SPLs on a residential community level.
- SPL demand estimation: This module estimates the demand for SPLs based on the purchase capacity of each residential community.
- Supply–demand matching analysis of SPLs: This module evaluates the supply and demand for SPLs and identifies where and how they become mismatched. The evaluation is carried out at both the macro-regional level and the micro-community level, with the former focusing on the overall supply and demand for SPLs and the latter focusing on the supply and demand for SPLs in individual residential communities.
The framework is illustrated in Figure 2.
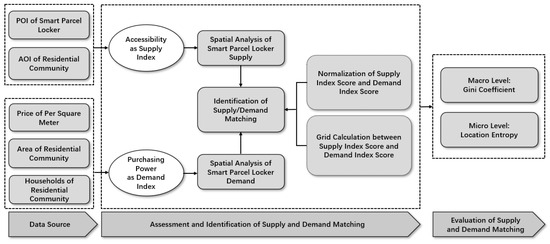
Figure 2.
The framework for the assessment of supply and demand of SPLs.
3.4.1. Supply Assessment
The supply of smart parcel lockers (SPLs) includes the number, location, and size of SPLs [22]. However, the accessibility of SPLs is also a key consideration when optimizing their locations and layouts [49,50]. Therefore, this study used the walking accessibility of residential communities to SPLs as the indicator of supply. Walking accessibility was measured using walking time and distance [51]. Previous research has shown that people are less willing to walk as the distance increases, a phenomenon known as the distance attenuation law [52]. Based on these findings, this study categorized the straight-line distance from home to SPL into six grades: within 300 m, 300–600 m, 600–900 m, 900–1200 m, 1200–1500 m, and over 1500 m. The corresponding path distance for each walking time was calculated assuming a walking speed of 80 m/min [53]. Accessibility is presented as a supply index. In order to correspond to the demand index in the next step, an item of the demand index score is added (Table 2). The pre-experiment results indicated that residents generally do not prefer SPLs that are more than 1500 m away from their residences. Therefore, the category of over 1500 m was excluded from the assessment of SPL supply.
Table 2.
Supply index score measuring standard.
The specific operational steps for assessing the supply of SPLs are as follows: First, take the demand point of each residential community in the study area as the center and the path distance as the search threshold range. Next, find the distance interval where the nearest SPL is located using ArcGIS. Finally, refer to the indicators provided in Table 2 to determine the supply index and its corresponding supply index score.
3.4.2. Demand Estimation
As previously stated, SPLs are market-driven commodities that are closely related to e-commerce. According to the e-commerce literature, household income and internet usage are important factors influencing online purchases [40]. During the pandemic, high rates of last-mile deliveries were connected with higher income, higher education levels, more internet access, and larger households [17,54]. In this case, this study considers the residential community’s purchasing capacity to be an indicator of demand for SPLs. The demand index for residential community i is calculated as follows:
where Di represents the demand index of residential community i; Ti represents the total population of residential community i; Pi represents the average property price in the residential community i; and Ai represents the area of residential community i. We have assumed that all residents of the study area have access to the internet, so the item of internet access has been deleted from the formula. In addition, since the dataset we obtained from the real estate website provides the total number of households in the residential community instead of the entire population, the value of Ti needs to be determined indirectly. The average household size in Tianjin, based on the 2022 census data, is 2.70 people per household [55]. Therefore, the formula for calculating Ti is as follows:
where Hi represents the number of households in the residential community i.
Furthermore, the supply index falls within the range of [0, 1], as mentioned in the preceding subsection. To ensure consistency between the supply index and demand index results, the demand index value is linearly and proportionally scaled to the [0, 1] interval. The formula for this scaling process is as follows:
where is the demand index value after being scaled to the [0, 1] interval; Dmin is the minimum value of the demand index; and Dmax is the maximum value of the demand index. The community with the highest purchasing capability is assigned a value of 1, while the community with the lowest purchasing capability is assigned a value of 0. To be consistent with the supply index for the next step of matching assessment, the demand index score and supply index score are each set to five values from 1 to 5 (Table 3).
Table 3.
Demand index and demand index score.
3.4.3. Spatial Matching Identification and Evaluation
To examine the spatial distribution of SPLs at the residential community level, we assessed the correlations between the supply index score and the demand index score. The supply index score and the demand index score both have five grades and are assigned from high to low. As a result, there are 25 possible matching outcomes, which are further classified into three groups (Table 4). This matching process was performed using ArcGIS.
Table 4.
Matching outcomes of supply–demand.
The matching evaluation was conducted at both macro and micro levels. At the macro level, the entire study area was used as the assessment area, and the degree of supply and demand matching was assessed using the Gini coefficient and Lorenz Curve methods. The Gini coefficient is a widely used indicator in economics to measure the inequality in the distribution of social wealth within an economy [56]. It can also be used to analyze broader distributional equity aspects, including those in urban planning [57]. Given that the matching of supply and demand for SPLs is fundamentally rooted in the concept of the equitable allocation of social resources, this analysis approach is applicable. The formula for computing the Gini coefficient is as follows [58]:
Above, the cumulative value of the demand index score is denoted as , where k = 1, 2, …, n, = 0, = 1; the cumulative value of the supply index score is denoted as , where k = 1, 2, …, n, = 0, = 1. In this case, the Gini coefficient is the metric that measures the balance between the supply and demand for SPLs. The closer the Gini coefficient is to 0, the higher the matching degree between the supply and demand of SPLs and the more balanced the supply and demand relationship; conversely, the closer the Gini coefficient is to 1, the more imbalanced the supply and demand of SPLs are.
At the micro level, this study uses the location quotient (LQ) to express the ratio of supply and demand in each residential community. The LQ is a ratio that can be easily used to estimate economic impact multipliers from the regional level to the local level [59]. We use the LQ to calculate how each residential community’s supply–demand ratio compares to that of the overall study area. The LQ is calculated as follows [60]:
where is the location quotient of the residential community i, is the supply index score of the residential community i, is the demand index score of the residential community i, is the average supply index score of all residential communities in the study area, and refers to the average demand index score of all residential communities in the study area. If the LQ value of a residential community is greater than 1, it implies that the supply–demand ratio of SPLs in this residential community is higher than the overall level in the study area.
4. Results
4.1. Supply Assessment of SPLs
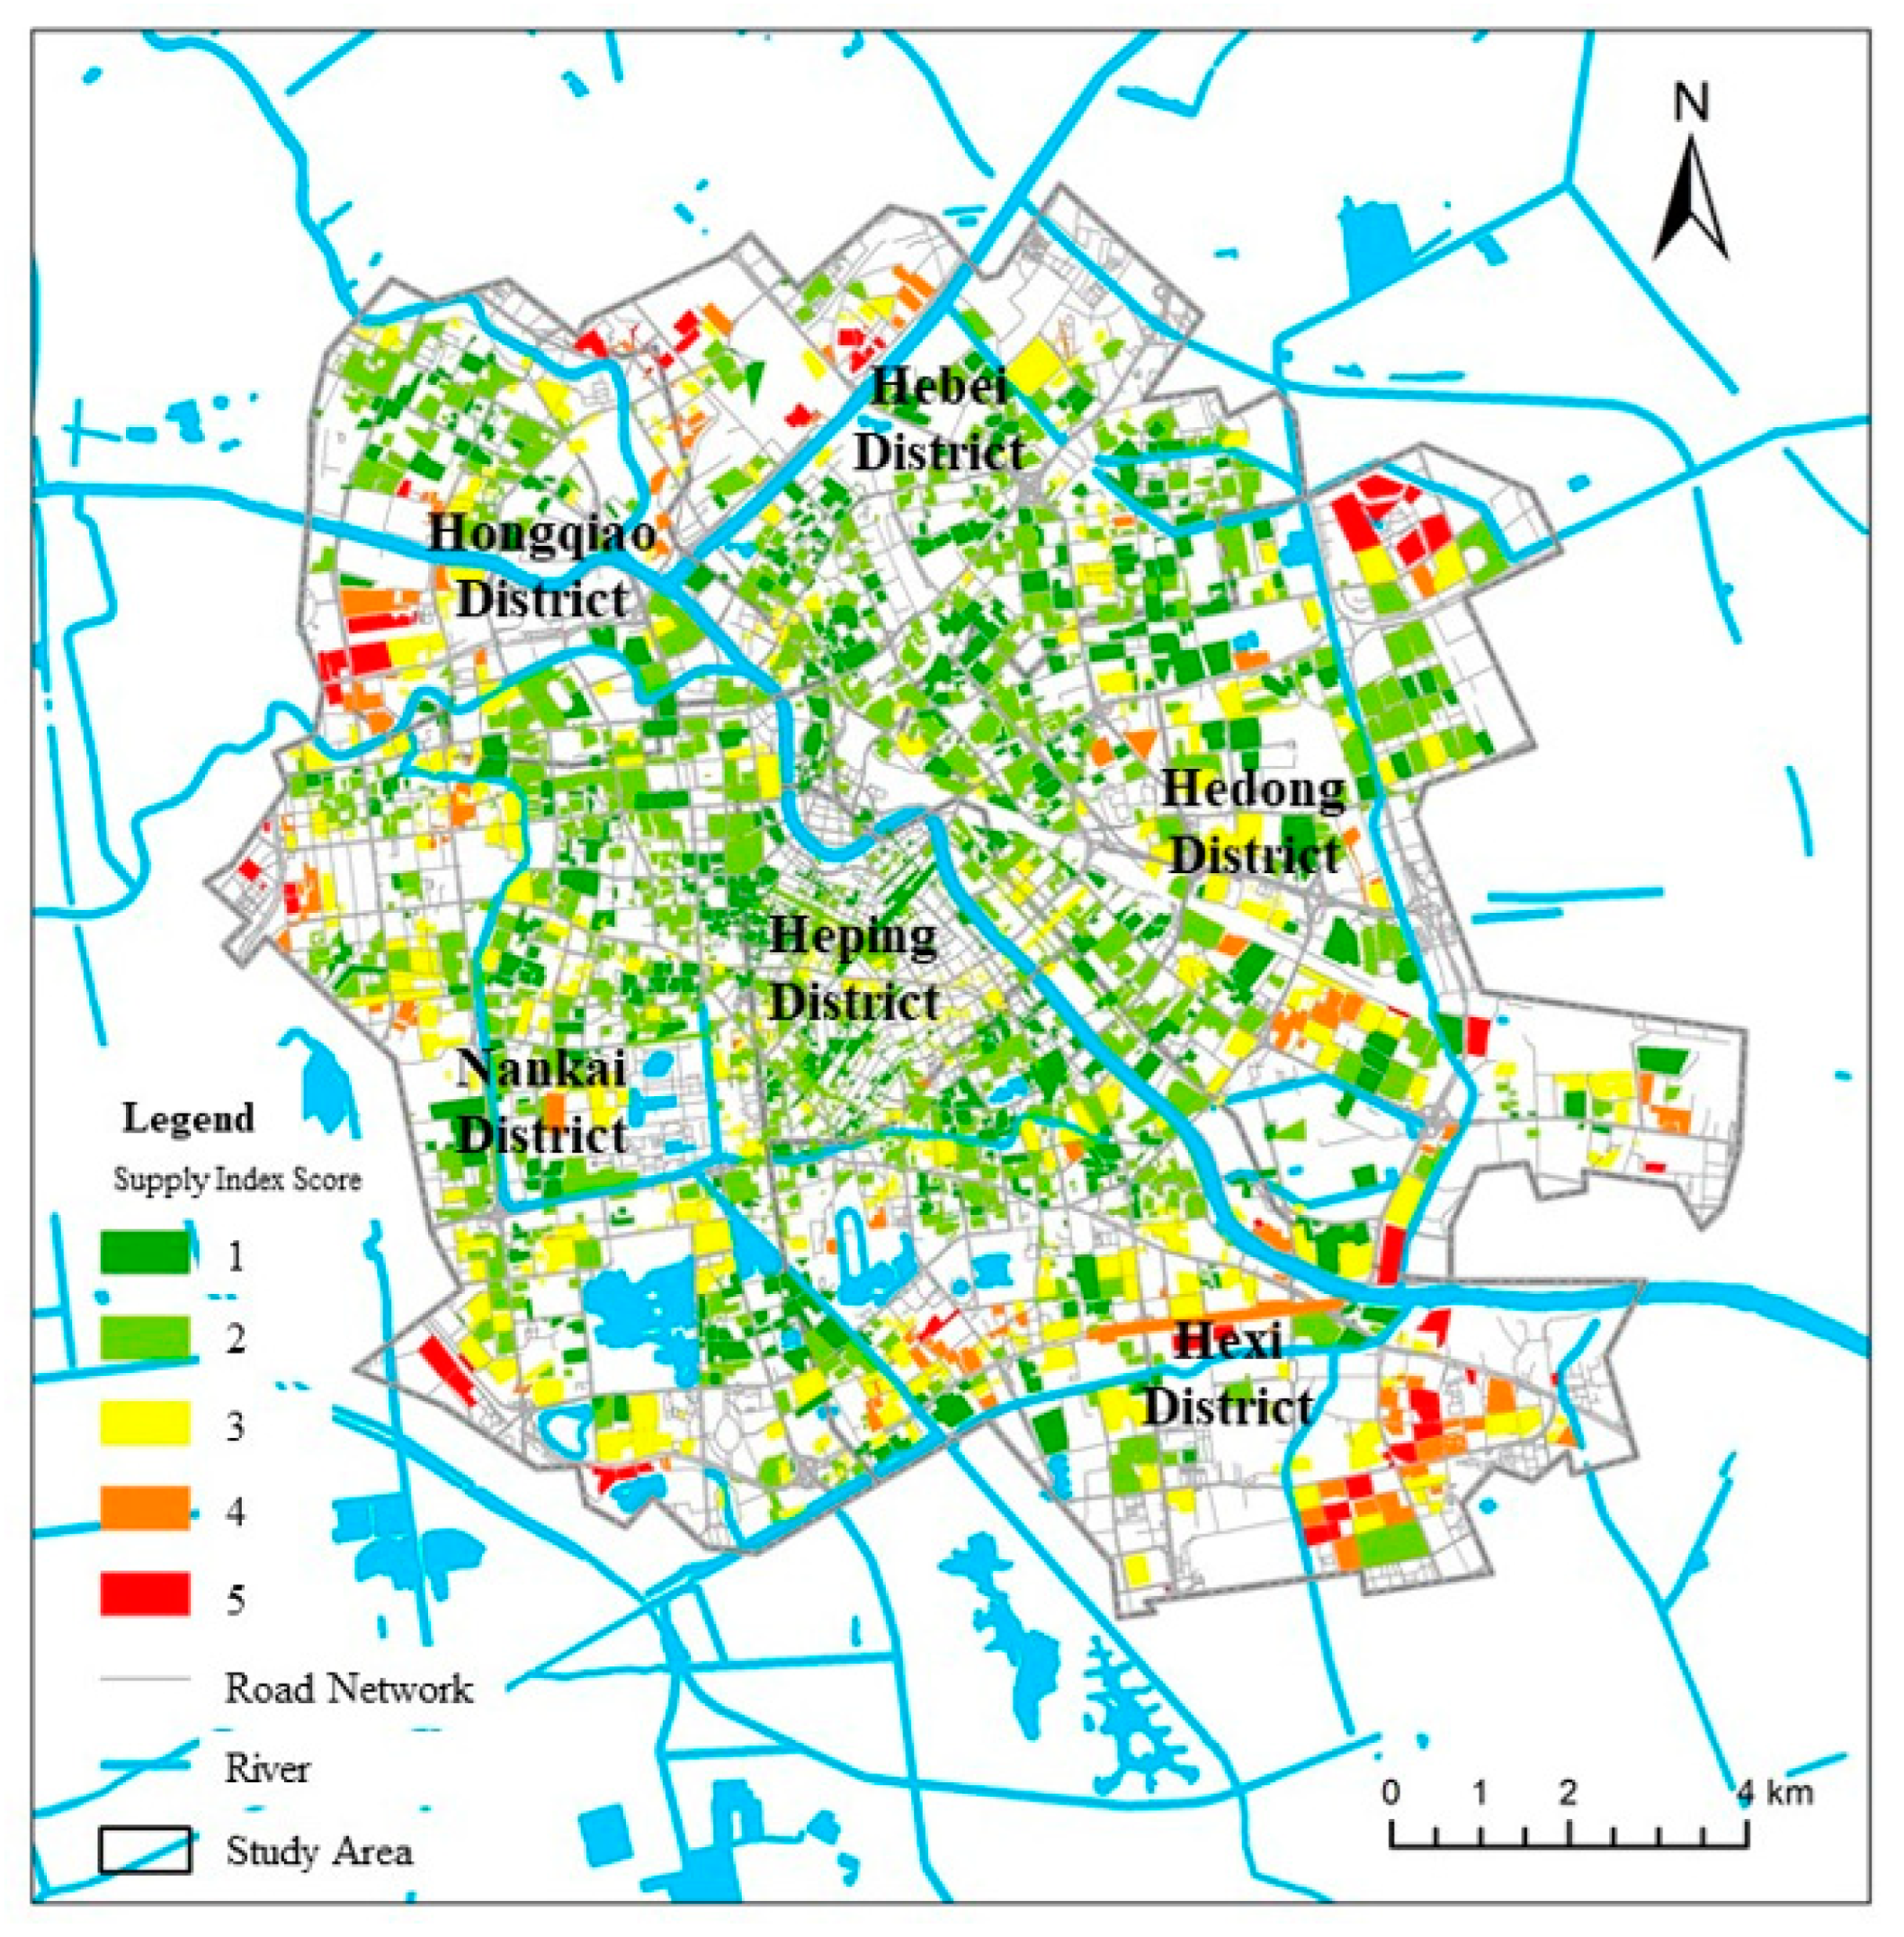
The spatial patterns of the supply for SPLs are illustrated in Figure 3. The figure shows a gradual increase in SPL supply index scores from the center towards the periphery. Residential communities in proximity to the city center tend to have lower supply index scores, indicating a higher availability of SPLs. Conversely, suburban residential communities are predominantly characterized by higher supply index scores, indicating a relatively lower supply of SPLs in those areas.

Figure 3.
The spatial characteristics of supply index score.
High-supply communities (with supply index scores of 1 and 2) accounted for 72.30% of the total and were concentrated in the districts of Heping, Nankai, and Hexi. These districts each contributed 15.74%, 13.59%, and 13.18%, respectively. Medium-supply residential communities (with a supply index score of 3) were concentrated around urban centers and suburban areas, accounting for 20.01% of all residential communities. These communities were primarily located in east Hexi (24.95%), south Nankai (23.65%), and east Hedong (17.88%). Low-supply communities (with supply index scores of 4 and 5) were primarily located in further-flung areas, such as east Hexi (32.86%), north Hebei (19.05%), southwest Nankai (19.05%), and northeast Hedong (18.10%). These communities accounted for 7.69% of the total.
4.2. Demand Assessment of SPLs
Multiple high-demand areas have been identified in the study area. As shown in Figure 4, the demand index score for SPLs in residential communities generally increases from the center towards the periphery, indicating a concentration of high-demand communities in the central region. However, the high-demand areas are also expanding towards the western and southern parts of the study area.
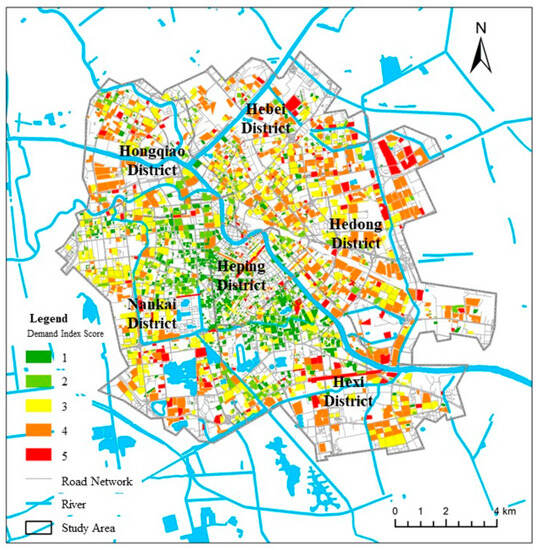
Figure 4.
The spatial characteristics of demand index score.
The demand for SPLs in the study area is unevenly distributed. High-demand communities (with demand index scores of 1 or 2) account for 49.57% of the total and are primarily located in the Heping, west Hexi, and east Nankai districts. These communities are concentrated in densely populated areas with a well-connected road network. Low-demand communities (with demand index scores of 4 or 5) account for 25.99% of the total and are widely dispersed in the outskirts characterized by relatively lower population density and less developed road networks. These communities are found in 44.25% of Hedong’s residential communities, 40.09% of Hongqiao’s residential communities, and 35.97% of Hebei’s residential communities. Medium-demand communities (with a demand index score of 3) account for 24.43% of the total and are primarily located on the outskirts of high-demand areas.
4.3. Identification of Supply and Demand Matching
The spatial distribution of supply–demand matching for SPLs is illustrated in Figure 5. Balanced communities (S = D) (25.21%) are primarily located on the densely populated left bank of the Haihe River, which also hosts the city center and a well-connected road network. Oversupplied communities (S > D) (44.78%) are mainly concentrated on the right bank of the Haihe River and in the southwest suburbs. Short-supplied communities (S < D) (30.01%) are concentrated in the west Hexi and east Nankai areas, as well as some residential communities in the suburbs of each district.
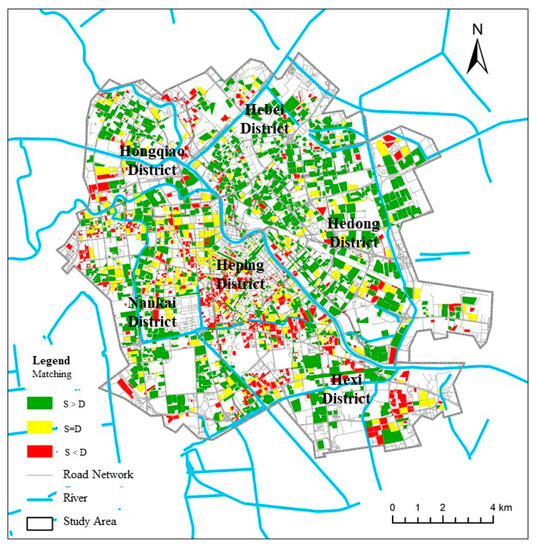
Figure 5.
The spatial characteristic of supply–demand matching.
The evaluation of supply–demand matching based on straight-line distance reveals an interesting pattern (Figure 6). Only the supply within the 300–600 m range significantly surpasses the demand, while the sections below 300 m, 600–900 m, 900–1200 m, and 1200–1500 m all experience a shortage. This finding helps explain why residents participating in the pre-experiment perceive SPLs to be too far from their homes and express a desire for closer proximity. It indicates that residents generally find SPLs acceptable if they are within a distance of 300 m.
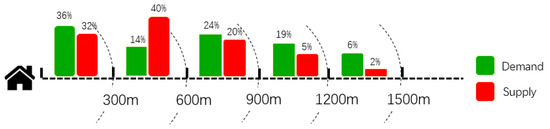
Figure 6.
Supply and demand matching analysis for different distance sections.
4.4. Evaluation of Supply and Demand Matching
4.4.1. Evaluation at the Macro Level
According to the United Nations Gini System for Income Distribution Segmentation, a Gini coefficient of 0.5 or greater implies a significant difference between the wealthy and the poor [61]. Based on the evaluation results, the Gini coefficient is 0.61, indicating a severe mismatch between the supply and demand for SPLs.
According to the graphical representation of the Lorenz curve (Figure 7), the top 10% of residents’ demand for SPLs accounts for 68% of the supply, while the top 20% of residents’ demand account for more than 80% of the supply (Figure 7). These findings clearly indicate an irrational and unfair spatial distribution of SPLs within residential communities.
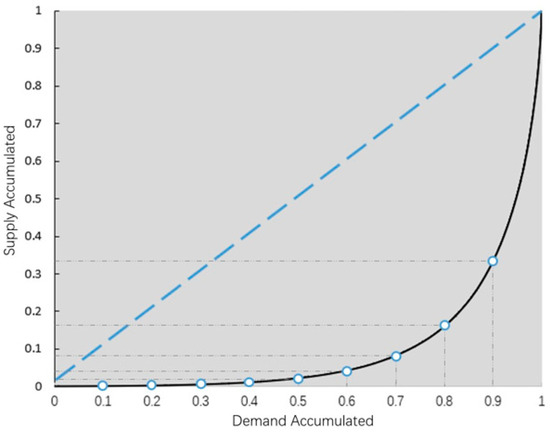
Figure 7.
Lorenz Curve of the Gini coefficient.
4.4.2. Evaluation at the Micro Level
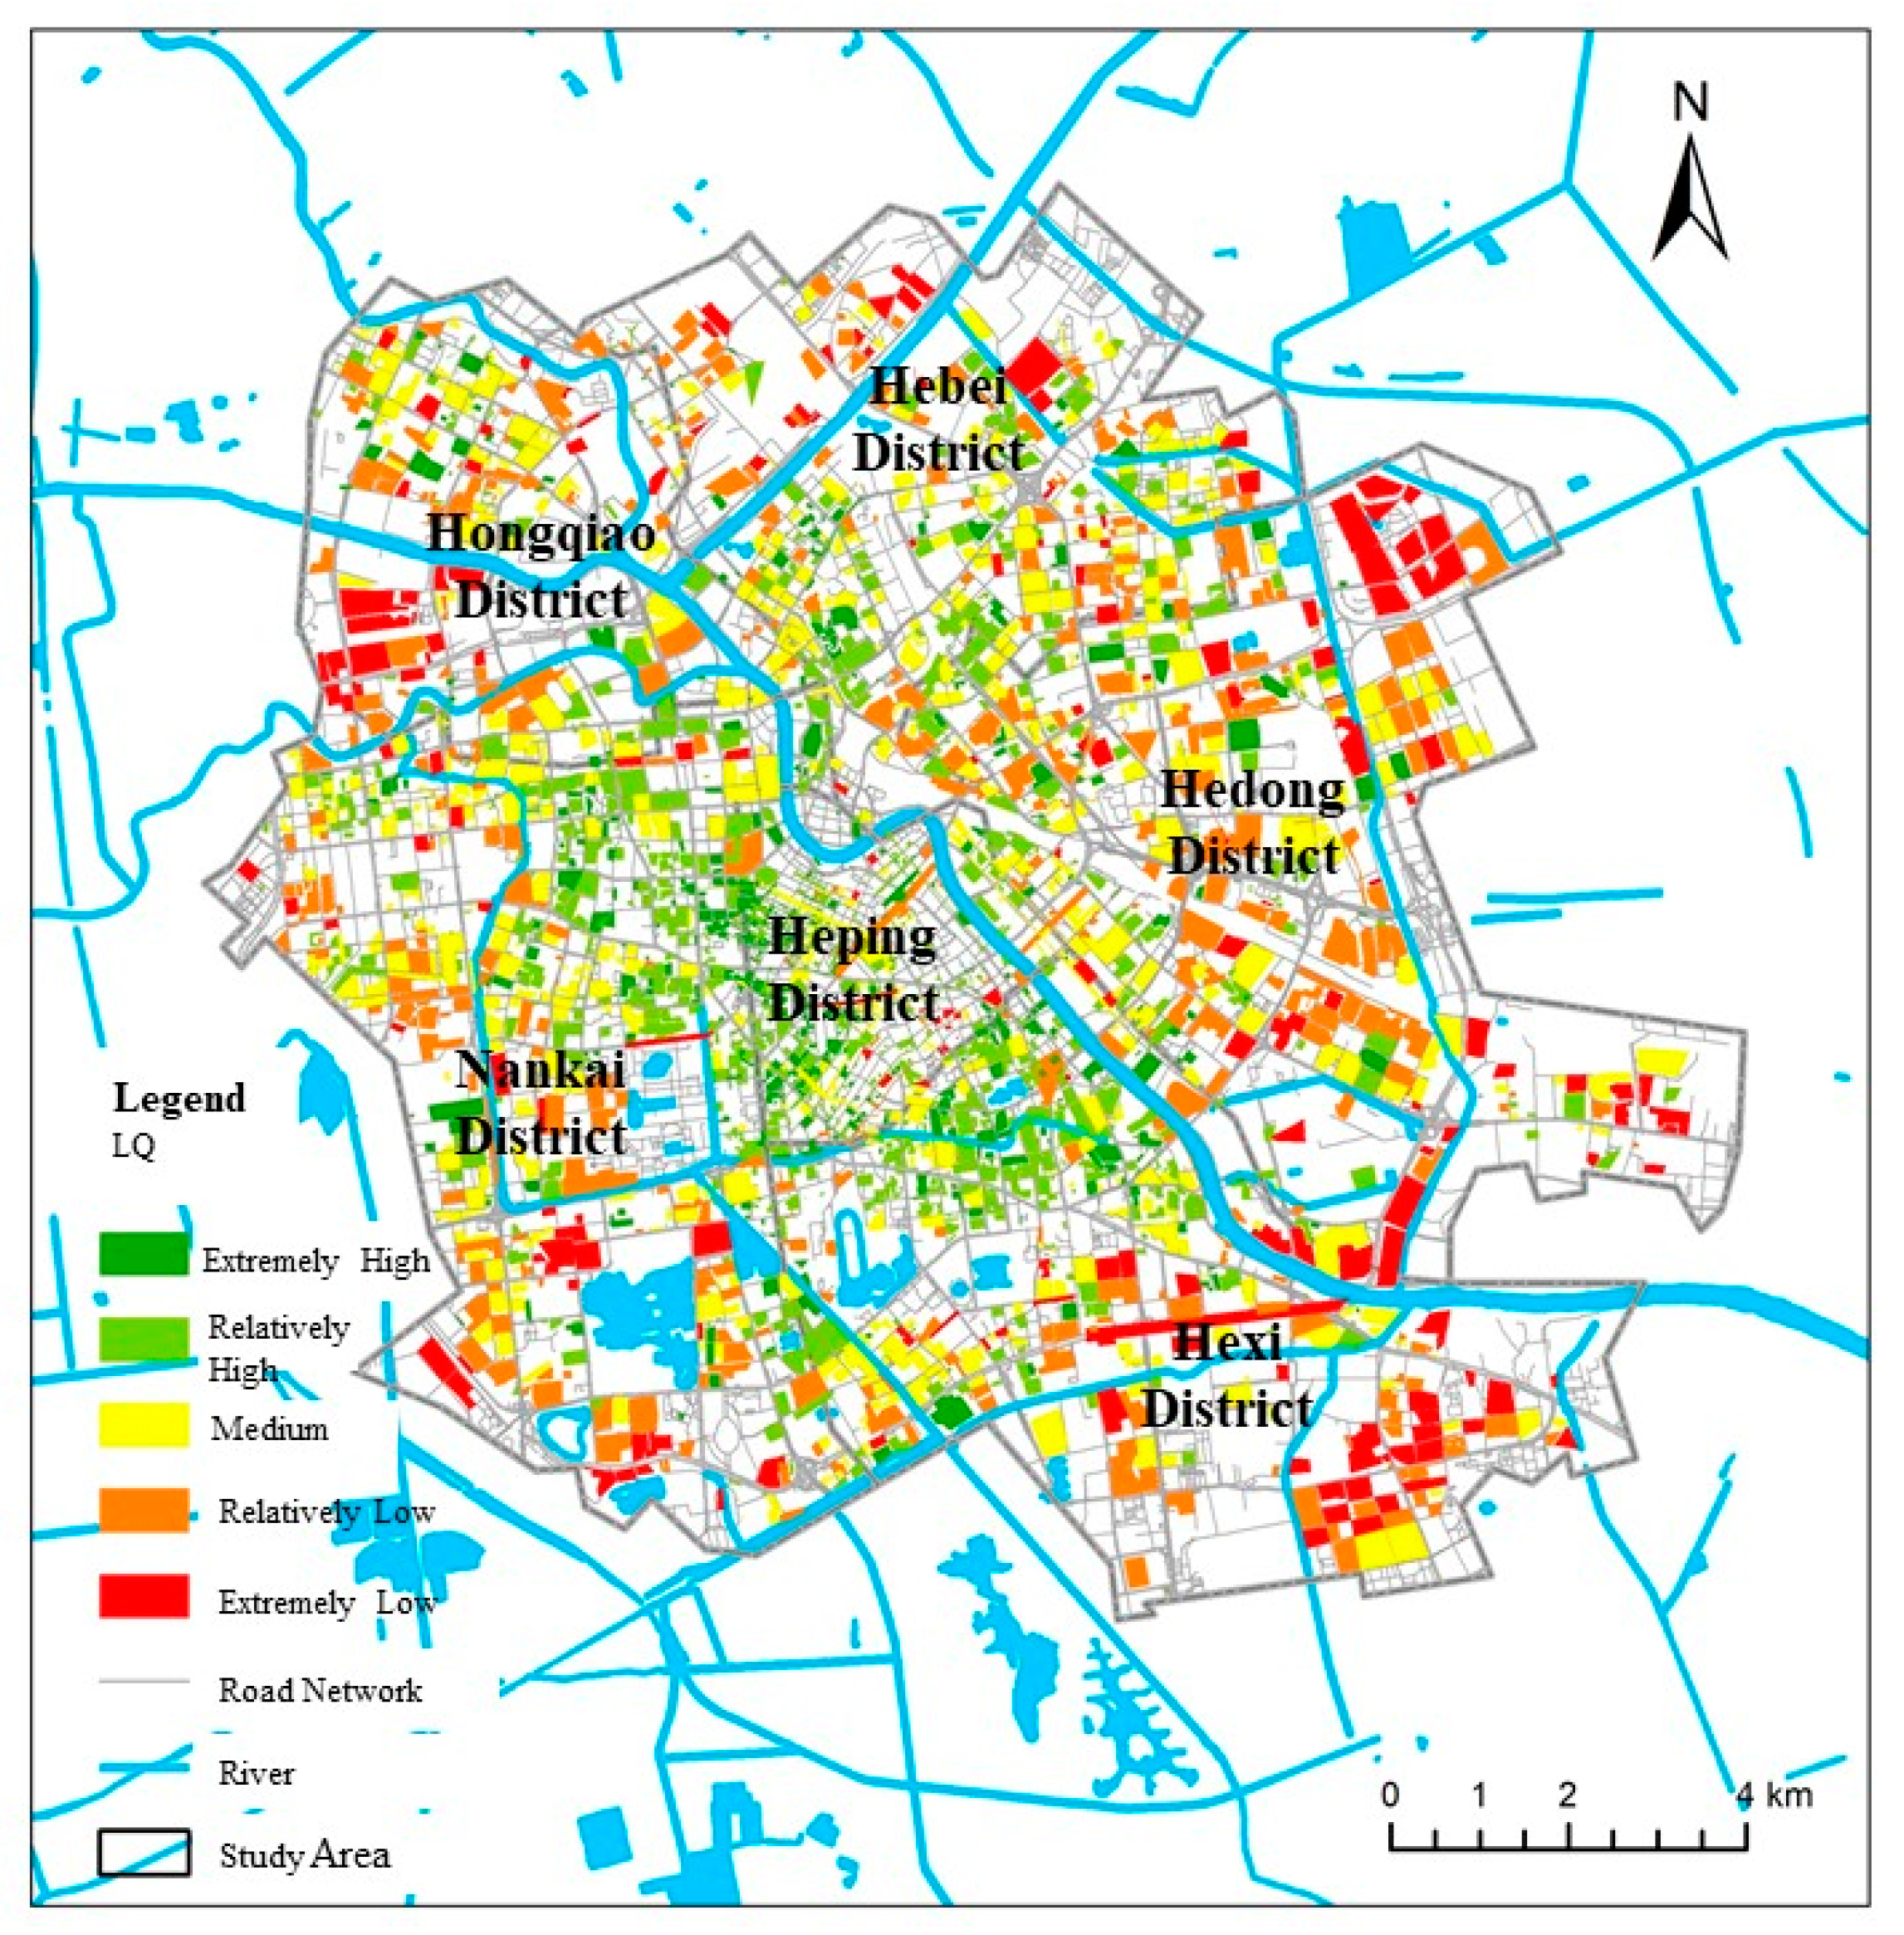
To assist the analysis of the supply–demand ratio at the community level, the value of LQ was categorized into five groups (Table 5). From the perspective of spatial distribution, the LQ of SPL supply–demand matching generally presents a circular spatial pattern (Figure 8). Extremely high and relatively high supply–demand ratios are predominantly concentrated in the central part of the study area, encompassing Heping, east Nankai, and west Hexi. Medium, relatively low, and extremely low supply–demand ratios are dispersed across each district, particularly towards the outskirts nearing the suburban boundaries.
Table 5.
Classification standard of location entropy value.
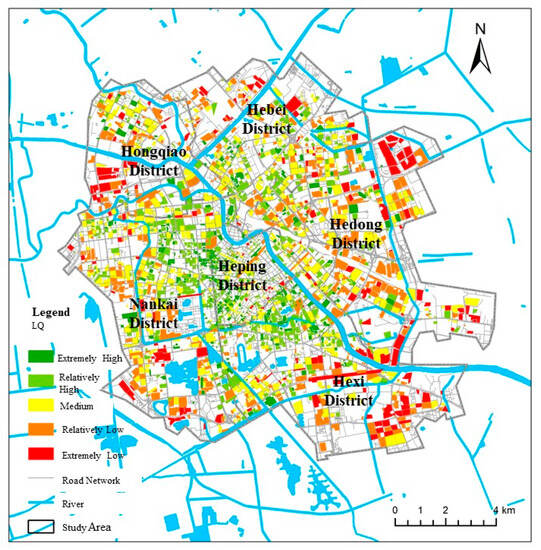
Figure 8.
Location quotient of supply–demand matching.
The LQ values of residential communities in the study area are unevenly distributed. High-LQ communities (with LQ values greater than 1) account for 77.23% of the total and are predominantly located in Nankai (21.96%), Hexi (20.71%), and Hedong (19.91%). These communities are concentrated in the central part of the study area. Low-LQ communities (with LQ values less than 1) account for 25.77% of the total and are primarily located in Heping (39.63%), Hexi (20.32%), and Nankai (13.55%). These communities are dispersed across the study area, particularly towards the outskirts. The highest LQ value recorded was 3329.9, which is significantly higher than the average level in the study area. This suggests a possibility of significant waste in public resources.
5. Discussion
5.1. Supply and Demand Assessment of SPLs
SPLs are a newly emerging type of self-service facility that provide convenient contactless services and are associated with the digital life of smart cities [13,33,62]. However, assessing and planning SPLs remains challenging. Previous studies have mainly focused on either the supply or demand of SPLs [12,63], and this study is the first to explore the connection between SPL supply and demand at the residential community level from a city planning perspective.
We developed an analytical framework for assessing the supply and demand of SPLs, with the supply situation measured by accessibility and the demand situation measured by purchasing capacity of the residential community. In addition, we employed the Gini coefficient and location quotient to further evaluate the supply–demand matching status on the macro and micro level. This approach provides comprehensive coverage of all communities and is highly efficient, representing a novel contribution to SPL research. However, the framework only includes a few measurement indicators, and there is a lack of subjective indicators. This may cause the results to differ from the actual to some extent. Future research could expand the measurement indicator system and incorporate subjective indicators.
The assessment results of supply show that SPLs are highly accessible, especially in urban centers, where population density and road networks are more developed. Meanwhile, the assessment results of demand show that SPLs are highly needed in residential communities with relatively high incomes, which are also generally located in urban centers. These findings are supported by previous literature [17,64], such as a study of Amazon lockers in Portland, which found that they tend to be located in areas with high population density, employment density, and proximity to arterial roads [40]. Even though both the supply and demand for SPLs are high in Tianjin, there is a considerable imbalance between the two. This imbalance is due to the fact that the locations of SPLs are different from what consumers expected and what SPL providers provided. This imbalance could lead to the inefficient utilization of SPLs, waste of public spaces in residential communities, and even inequity in the city [40,65,66]. This case emphasizes the significance of taking into account the spatial distribution and layout of SPLs in city planning. A substantial quantity of low-demand SPLs and public areas could be saved for resilient utilization by properly planning the location of SPLs.
5.2. Residential Community Level Policy Initiatives
In Tianjin, the government set ambitious goals for the installation of SPLs in 2015 and 2016. However, the first five pilot SPLs were installed in 2016, and there were only 479 SPLs until the end of 2022 [8,20]. This is a significant discrepancy between the government’s goals and the actual number of SPLs installed. One of the main reasons for this discrepancy is the lack of planning and guidance on the installation location and management organization of SPLs. On the one hand, SPLs are essentially profit-driven commodities for businesses, and during the initial stages of promoting and implementing SPLs, the primary focus of SPL providers is often on large-scale market penetration and the establishment of consumer habits [40]. On the other hand, SPLs have also become an important aspect of national and local policies as effective measures for contactless delivery during the pandemic [63,67]. As a result, there is a need for clear policies on the planning and management of SPLs, including where to install them and where not to and which department of the government is responsible for the planning and management of SPLs.
Without clear planning and guidance, SPLs could occupy a significant amount of public space. According to the Hive Box official website, the size of one standard SPL is 250 cm (H) × 450 cm (L) × 55 cm (W) [68]. Assume that there is a one-meter distance in front of the SPLs for the courier to drop off and the consumer to pick up. To achieve the government’s goal of 5000 SPLs, 3786 m2 of residential communities’ public space will be occupied by SPLs. To avoid future unmanageable circumstances, it is crucial to set clear policies on the planning and management of SPLs during their early stage of growth. This will help to ensure that SPLs are installed in a way that is beneficial to both businesses and residents and that SPL development does not become a social problem due to their encroachment on public spaces.
5.3. Incentives for Dynamic Approach
It is important to note that both the supply and demand for SPLs are dynamic. The supply and demand are interdependent and are influenced by technological innovation, public emergencies such as COVID-19, and urbanization. As the external environment changes and becomes more uncertain, the internal supply–demand relationship also changes [16,34]. This suggests that there may not be a single optimal solution for planning SPLs, and a more flexible and dynamic approach to the planning of SPLs could be the future direction of research [43,50,68].
Policymakers should implement full life-cycle policies that guide and govern the layout of SPLs. In this study, the majority (97.7%) of SPLs were in residential communities. The government of Tianjin should focus on coming up with effective ways to guide the sustainable development of SPLs in residential communities. Residential communities with an oversupply of SPLs should consider removing them and exploring ways to repurpose the public space left vacant. Conversely, in residential communities where the demand for SPLs exceeds the supply, careful consideration should be given to determining the precise quantity, size, and location of SPLs to be installed [22,25].
In addition, SPL providers and researchers should pay more attention to dynamic changes in consumer demand. As highlighted earlier, the pandemic has caused a surge in both the supply of and demand for SPLs worldwide. Even in the absence of a pandemic, the supply of and consumer demand for SPLs will change dynamically. In other words, the environment, consumer demand, and the supply of SPLs are all uncertain. Therefore, tracking dynamic changes in customer demand and incorporating dynamic layouts of SPLs becomes crucial. For example, dynamic planning is an efficient strategy for addressing uncertain conditions [69]. It differs from traditional static planning by dividing the process into short-term stages, estimating demand for each stage, and making necessary adjustments accordingly [70]. If all stages are adequately planned, dynamic planning can mitigate encroachment on public areas and reduce resource waste caused by SPLs, thus serving as an effective approach.
6. Conclusions
In this section, the main conclusions of the study, its contributions, and recommendations for future research studies will be provided.
This paper examines the spatial pattern of the supply–demand matching of SPLs at the residential community level in central Tianjin, China. The analysis reveals spatial disparities in SPL supply and demand, as well as SPL location issues. The main conclusions can be summarized into four aspects: (1) The supply index of SPLs is determined by accessibility. In general, the residential communities in the study area are easily accessible to SPLs. The coverage rate within a 5 min walk is 31.82%, and the coverage rate within a 10 min walk is 72.30%. The areas with low accessibility are mainly distributed on the outskirts of the study area. (2) Residential communities with high demand for SPLs (49.57%) are concentrated in the urban center. This is compatible with high populations, high per capita income, and well-developed road networks. Medium- and low-demand areas are distributed in the outskirts. (3) There is a significant disparity observed between the supply and demand matching of SPLs. Among all the residential communities in the study area, only 25.21% achieve a balance between supply and demand for SPLs. Communities experiencing oversupply are located on the right bank of the Haihe River and in the southwestern suburbs, accounting for 44.78% of the total. Furthermore, communities facing insufficient supply are situated in west Hexi, east Nankai, and the outskirts of each district, accounting for 30.01%. (4) From a macro perspective, the Gini coefficient of SPL distribution in the study area’s residential communities is 0.61, and the top 20% of residents have access to 80% of the SPLs. On a micro level, 77.23% of residential communities have a supply–demand ratio for SPLs that exceeds the average level in the study area. Notably, the residential community with the highest supply–demand ratio reaches an astonishing 3330 times the average level in the study area, highlighting the extreme imbalance in SPL spatial distribution.
This study proposes the following implications and recommendations for SPL providers, urban planners, and policymakers. First, SPL providers should focus on meeting the needs of consumers, rather than simply providing a high supply. The findings of this study show that even when the supply of and demand for SPLs are both high, residents may still be dissatisfied with SPL locations if there is a mismatch between supply and demand. Therefore, it is important for SPL providers to accurately assess demand and to tailor their offerings accordingly. Second, urban planners should play a more active role in SPL location issues. This is because SPLs are closely related to public spaces, facility layout, and consumer behavior. The absence of urban planning in SPL location issues is one of the main reasons for the confusion of the layout of SPLs and the ambiguity of related policies. Urban planners should work with SPL providers to ensure that SPLs are located in places that are convenient for consumers and that they do not unduly encroach on public space. Lastly, policymakers should consider both supply and demand when formulating policies for SPLs. In the case study of Tianjin, the city government set too-ambitious goals for the number of SPLs, without considering the actual supply capacity and demand situation. This led to a mismatch between supply and demand, which in turn created confusion and dissatisfaction among residents. Policymakers should work with urban planners and SPL providers to develop more realistic and sustainable policies for SPLs. Moreover, it is important to note that customer demand and the supply of SPLs are dynamic. The location planning of SPLs based on previous data is likely to lag behind the actual situation. Therefore, it is necessary for stakeholders to monitor supply and demand on a regular basis. In addition, we propose to implement dynamic planning for SSFs such as SPLs. This would allow for more flexibility in the location of SPLs and would help to ensure that they are always located in places where they are needed most.
The main contributions of this study are as follows: First, it provides the first attempt to provide an analytical framework and assess the supply–demand situation of SPLs. This is a significant contribution because the existing literature has largely focused on either supply of or demand for SPLs, ignoring the interdependence between the two. This study’s new perspective of investigating the supply–demand matching of SPLs enriches the literature and provides a more comprehensive understanding of this issue. Second, this study advances the existing research by representing supply and demand status in a spatially explicit way from an urban planning perspective. This is important because it allows for a more nuanced understanding of the spatial distribution of SPLs and the factors that influence supply and demand. Third, the current study provides the breakthrough discovery that SPL location issues and consumer dissatisfaction are not due to short supply but due to oversupply and a mismatch between supply and demand. This finding has important implications for urban planning and the management of SPLs.
Despite the contributions of this study, there are some limitations that require future development. First, the case study was conducted in Tianjin, which is an e-commerce and express delivery hub in northern China. This means that the population may have a higher supply and demand for alternative delivery modes than in other cities. Future research should cross-validate the results by surveying other SSFs in other countries and cities. Second, the assessment of SPL supply and demand relies on various indicators. The assessment of supply was based solely on accessibility, and the assessment of demand was simplified to purchasing capability. Future research could consider developing a comprehensive indicator system to enhance the accuracy of assessing SPL supply and demand.
Author Contributions
Conceptualization, M.D., Y.S. and Y.H.; methodology, M.D. and Y.S.; software, M.D.; validation, M.D., Y.S. and Y.H.; formal analysis, M.D.; investigation, M.D.; resources, M.D.; data curation, M.D.; writing—original draft preparation, M.D.; writing—review and editing, M.D., Y.S. and Y.H.; visualization, M.D.; supervision, Y.S. and Y.H.; project administration, Y.S. and Y.H.; funding acquisition, Y.H. All authors have read and agreed to the published version of the manuscript.
Funding
This research was funded by Reconstructing the Architecture System based on the Coherence Mechanism of “Architecture-human-environment” in the Chinese Context, Key Project of National Natural Science Foundation of China, grant number 52038007.
Data Availability Statement
The data used to support the findings of this study are available from the authors upon request.
Acknowledgments
The authors wish to express their appreciation and gratitude to the anonymous reviewers and editors for their insightful comments and suggestions to improve the paper’s quality.
Conflicts of Interest
The authors declare no conflict of interest.
References
- de Palma, A.; Vosough, S.; Liao, F. An overview of effects of COVID-19 on mobility and lifestyle: 18 months since the outbreak. Transp. Res. Part A Policy Pract. 2022, 159, 372–397. [Google Scholar] [CrossRef] [PubMed]
- Wang, X.; Wong, Y.D.; Sun, S.; Yuen, K.F. An investigation of self-service technology usage during the COVID-19 pandemic: The changing perceptions of ‘self’ and technologies. Technol. Soc. 2022, 70, 102032. [Google Scholar] [CrossRef]
- Wang, X.; Wong, Y.D.; Chen, T.; Yuen, K.F. Consumer logistics in contemporary shopping: A synthesised review. Transp. Rev. 2022, 43, 502–532. [Google Scholar] [CrossRef]
- Wang, X.; Wong, Y.D.; Yuen, K.F. Does COVID-19 promote self-service usage among modern shoppers? An exploration of pandemic-driven behavioural changes in self-collection users. Int. J. Environ. Res. Public Health 2021, 18, 8574. [Google Scholar] [CrossRef] [PubMed]
- Narayanan, S.; Chaniotakis, E.; Antoniou, C. Shared autonomous vehicle services: A comprehensive review. Transp. Res. Part C Emerg. Technol. 2020, 111, 255–293. [Google Scholar] [CrossRef]
- Tsai, Y.-T.; Tiwasing, P. Customers’ intention to adopt smart lockers in last-mile delivery service: A multi-theory perspective. J. Retail. Consum. Serv. 2021, 61, 102514. [Google Scholar] [CrossRef]
- Yuen, K.F.; Wang, X.; Ma, F.; Wong, Y.D. The determinants of customers’ intention to use smart lockers for last-mile deliveries. J. Retail. Consum. Serv. 2019, 49, 316–326. [Google Scholar] [CrossRef]
- Ding, M.; Ullah, N.; Grigoryan, S.; Hu, Y.; Song, Y. Variations in the Spatial Distribution of Smart Parcel Lockers in the Central Metropolitan Region of Tianjin, China: A Comparative Analysis before and after COVID-19. ISPRS Int. J. Geo-Inf. 2023, 12, 203. [Google Scholar] [CrossRef]
- Carotenuto, P.; Gastaldi, M.; Giordani, S.; Rossi, R.; Rabachin, A.; Salvatore, A. Comparison of various urban distribution systems supporting e-commerce. Point-to-point vs. collection-point-based deliveries. Transp. Res. Rec. 2018, 30, 188–196. [Google Scholar] [CrossRef]
- Milewski, D.; Milewska, B. The energy efficiency of the last mile in the e-commerce distribution in the context the COVID-19 pandemic. Energies 2021, 14, 7863. [Google Scholar]
- Seghezzi, A.; Siragusa, C.; Mangiaracina, R. Parcel lockers vs. home delivery: A model to compare last-mile delivery cost in urban and rural areas. Int. J. Phys. Distrib. 2022, 52, 213–237. [Google Scholar] [CrossRef]
- Lemke, J.; Iwan, S.; Korczak, J. Usability of the parcel lockers from the customer perspective–the research in Polish Cities. Transp. Res. Procedia 2016, 16, 272–287. [Google Scholar] [CrossRef]
- Hasija, S.; Shen, Z.-J.M.; Teo, C.-P. Smart city operations: Modeling challenges and opportunities. Manuf. Serv. Oper. Manag. 2020, 22, 203–213. [Google Scholar] [CrossRef]
- Iwan, S.; Kijewska, K.; Lemke, J. Analysis of parcel lockers’ efficiency as the last mile delivery solution–the results of the research in Poland. Transp. Res. Rec. 2016, 12, 644–655. [Google Scholar] [CrossRef]
- Lagorio, A.; Pinto, R. The parcel locker location issues: An overview of factors affecting their location. In Proceedings of the 8th International Conference on Information Systems, Logistics and Supply Chain: Interconnected Supply Chains in an Era of Innovation, Austin, TX, USA, 22–24 April 2020. [Google Scholar]
- Leung, A.; Lachapelle, U.; Burke, M. Spatio-temporal analysis of Australia Post parcel locker use during the initial system growth phase in Queensland (2013–2017). J. Transp. Geogr. 2023, 110, 103634. [Google Scholar] [CrossRef]
- Lachapelle, U.; Burke, M.; Brotherton, A.; Leung, A. Parcel locker systems in a car dominant city: Location, characterisation and potential impacts on city planning and consumer travel access. J. Transp. Geogr. 2018, 71, 1–14. [Google Scholar] [CrossRef]
- Moslem, S.; Stević, Ž.; Tanackov, I.; Pilla, F. Sustainable development solutions of public transportation: An integrated IMF SWARA and Fuzzy Bonferroni operator. Sustain. Cities Soc. 2023, 93, 104530. [Google Scholar] [CrossRef]
- Breitung, W. Enclave urbanism in China: Attitudes towards gated communities in Guangzhou. Urban Geogr. 2012, 33, 278–294. [Google Scholar] [CrossRef]
- Tianjin Municipal People’s Government. Available online: https://www.tj.gov.cn/zwgk/szfwj/tjsrmzfbgt/202005/t20200519_2370240.html (accessed on 25 April 2023).
- Morganti, E.; Seidel, S.; Blanquart, C.; Dablanc, L.; Lenz, B. The impact of e-commerce on final deliveries: Alternative parcel delivery services in France and Germany. Transp. Res. Procedia 2014, 4, 178–190. [Google Scholar] [CrossRef]
- Deutsch, Y.; Golany, B. A parcel locker network as a solution to the logistics last mile problem. Int. J. Prod. Res. 2018, 56, 251–261. [Google Scholar] [CrossRef]
- Van Duin, J.H.R.; de Goffau, W.; Wiegmans, B.; Tavasszy, L.A.; Saes, M. Improving home delivery efficiency by using principles of address intelligence for B2C deliveries. Transp. Res. Procedia 2016, 12, 14–25. [Google Scholar] [CrossRef]
- Viu-Roig, M.; Alvarez-Palau, E.J. The impact of E-Commerce-related last-mile logistics on cities: A systematic literature review. Sustainability 2020, 12, 6492. [Google Scholar] [CrossRef]
- Olsson, J.; Hellström, D.; Pålsson, H. Framework of last mile logistics research: A systematic review of the literature. Sustainability 2019, 11, 7131. [Google Scholar] [CrossRef]
- Bhatti, A.; Akram, H.; Basit, H.M.; Khan, A.U.; Raza, S.M.; Naqvi, M.B. E-commerce trends during COVID-19 Pandemic. Int. J. Futur. Gener. Commun. 2020, 13, 1449–1452. [Google Scholar]
- Meiksin, A. Dynamics of COVID-19 transmission including indirect transmission mechanisms: A mathematical analysis. Epidemiol. Infect. 2020, 148, E257. [Google Scholar] [CrossRef]
- Aston, J.; Vipond, O.; Virgin, K.; Youssouf, O. Retail E-Commerce and COVID-19: How Online Shopping Opened Doors While Many Were Closing. Available online: https://www150.statcan.gc.ca/n1/pub/45-28-0001/2020001/article/00064-eng.htm (accessed on 3 June 2023).
- Yaprak, Ü.; Kılıç, F.; Okumuş, A. Is the COVID-19 pandemic strong enough to change the online order delivery methods? Changes in the relationship between attitude and behavior towards order delivery by drone. Technol. Forecast. Social Chang. 2021, 169, 120829. [Google Scholar] [CrossRef]
- Wang, X.; Wong, Y.D.; Qi, G.; Yuen, K.F. Contactless channel for shopping and delivery in the context of social distancing in response to COVID-19 pandemic. Electron. Commer. Res. Appl. 2021, 48, 101075. [Google Scholar] [CrossRef]
- Wang, X.; Wong, Y.D.; Yuen, K.F. Rise of ‘lonely’consumers in the post-COVID-19 era: A synthesised review on psychological, commercial and social implications. Int. J. Environ. Res. Public Health 2021, 18, 404. [Google Scholar]
- Kim, A.; Sung, Y. My privacy and control matter: Understanding motivations for using untact services. Cyberpsychol. Behav. Soc. Netw. 2021, 24, 426–431. [Google Scholar] [CrossRef]
- Lee, S.M.; Lee, D. “Untact”: A new customer service strategy in the digital age. Serv. Bus. 2020, 14, 1–22. [Google Scholar] [CrossRef]
- Wang, X.; Wong, Y.D.; Kim, T.Y.; Yuen, K.F. Does COVID-19 change consumers’ involvement in e-commerce last-mile delivery? An investigation on behavioural change, maintenance and habit formation. Electron. Commer. Res. Appl. 2023, 60, 101273. [Google Scholar] [CrossRef]
- Bengtsson, C.; Vikingson, A. Exploring and Evaluating the Parcel Locker—A Swedish Consumer Perspective. Mech. Eng. 2015, 10, I10. [Google Scholar]
- Lee, H.; Chen, M.; Pham, H.T.; Choo, S. Development of a decision making system for installing unmanned parcel lockers: Focusing on residential complexes in Korea. KSCE J. Civ. Eng. 2019, 23, 2713–2722. [Google Scholar] [CrossRef]
- de Oliveira, L.K.; Morganti, E.; Dablanc, L.; de Oliveira, R.L.M. Analysis of the potential demand of automated delivery stations for e-commerce deliveries in Belo Horizonte, Brazil. Res. Transp. Econ. 2017, 65, 34–43. [Google Scholar] [CrossRef]
- Yang, G.; Huang, Y.; Fu, Y.; Huang, B.; Sheng, S.; Mao, L.; Huang, S.; Xu, Y.; Le, J.; Ouyang, Y.; et al. Parcel locker location based on a bilevel programming model. Math. Probl. Eng. 2020, 2020, 5263689. [Google Scholar] [CrossRef]
- Schaefer, J.S.; Figliozzi, M.A. Spatial accessibility and equity analysis of Amazon parcel lockers facilities. J. Transp. Geogr. 2021, 97, 103212. [Google Scholar] [CrossRef] [PubMed]
- Keeling, K.L.; Schaefer, J.S.; Figliozzi, M.A. Accessibility and equity analysis of transit facility sites for common carrier parcel lockers. Transp. Res. Rec. 2021, 2675, 1075–1087. [Google Scholar] [CrossRef]
- Ghaderi, H.; Zhang, L.; Tsai, P.W.; Woo, J. Crowdsourced last-mile delivery with parcel lockers. Int. J. Prod. Econ. 2022, 251, 108549. [Google Scholar] [CrossRef]
- Che, Z.-H.; Chiang, T.-A.; Luo, Y.-J. Multiobjective optimization for planning the service areas of smart parcel locker facilities in logistics last mile delivery. Mathematics 2022, 10, 422. [Google Scholar] [CrossRef]
- Molin, E.; Kosicki, M.; van Duin, R. Consumer preferences for parcel delivery methods: The potential of parcel locker use in the Netherlands. Eur. J. Transp. Infrastruct. Res. 2022, 22, 183–200. [Google Scholar]
- Tianjin Municipal Bureau of Statistics & Survey Office of the Nation–Bureau of Statistics in Tianjin. Available online: https://stats.tj.gov.cn/nianjian/2022nj/zk/indexch.htm (accessed on 22 February 2023).
- Zhou, X.; Ding, Y.; Wu, C.; Huang, J.; Hu, C. Measuring the spatial allocation rationality of service facilities of residential areas based on internet map and location-based service data. Sustainability 2019, 11, 1337. [Google Scholar] [CrossRef]
- Hu, Y.; Gao, S.; Janowicz, K.; Yu, B.; Li, W.; Prasad, S. Extracting and understanding urban areas of interest using geotagged photos. Comput. Environ. Urban Syst. 2015, 54, 240–254. [Google Scholar] [CrossRef]
- Ding, M.; Hu, Y.; Du, Y. Characteristics of Supply-demand and Planning of Self-service Facilities in Urban Residential Areas: An Empirical Analysis Based on the Investigation in Tianjin. Urban Dev. Stud. 2023, 30, 3–8. [Google Scholar]
- Luo, R.; Ji, S.; Ji, Y. An active-learning Pareto evolutionary algorithm for parcel locker network design considering accessibility of customers. Comput. Oper. Res. 2022, 141, 105677. [Google Scholar]
- Kahr, M. Determining locations and layouts for parcel lockers to support supply chain viability at the last mile. Omega 2022, 113, 102721. [Google Scholar] [CrossRef]
- Páez, A.; Scott, D.M.; Morency, C. Measuring accessibility: Positive and normative implementations of various accessibility indicators. J. Transp. Geogr. 2012, 25, 141–153. [Google Scholar] [CrossRef]
- Zhang, Y.; Zou, Y.; Zhu, Z.; Guo, X.; Feng, X. Evaluating Pedestrian Environment Using DeepLab Models Based on Street Walkability in Small and Medium-Sized Cities: Case Study in Gaoping, China. Sustainability 2022, 14, 15472. [Google Scholar] [CrossRef]
- Bohannon, R.W.; Andrews, A.W. Normal walking speed: A descriptive meta-analysis. Physiotherapy 2011, 97, 182–189. [Google Scholar]
- Figliozzi, M.; Unnikrishnan, A. Home-deliveries before-during COVID-19 lockdown: Accessibility, environmental justice, equity, and policy implications. Transp. Res. Part D Transp. Environ. 2021, 93, 102760. [Google Scholar] [CrossRef]
- Tianjin Municipal People’s Government. Statistical Bulletin of National Economic and Social Development of Tianjin in 2022. Available online: https://www.tj.gov.cn/sq/tjgb/202203/t20220314_5828933.html (accessed on 6 June 2023).
- Shu, H.; Xiong, P. The Gini coefficient structure and its application for the evaluation of regional balance development in China. J. Clean. Prod. 2018, 199, 668–686. [Google Scholar]
- Wang, D.; Liang, Y.; Peng, S.; Yin, Z.; Huang, J. Integrated assessment of the supply–demand relationship of ecosystem services in the Loess Plateau during 1992–2015. Ecosyst. Health Sustain. 2022, 8, 2130093. [Google Scholar] [CrossRef]
- Teng, F.; He, J.; Pan, X.; Zhang, C. Metric of carbon equity: Carbon Gini index based on historical cumulative emission per capita. Adv. Clim. Chang. Res. 2011, 2, 134–140. [Google Scholar] [CrossRef]
- Miller, M.M.; Gibson, L.J.; Wright, N.G. Location quotient: A basic tool for economic development analysis. Econ. Dev. Rev. 1991, 9, 65. [Google Scholar]
- Isserman, A.M. The location quotient approach to estimating regional economic impacts. J. Am. Inst. Plann. 1977, 43, 33–41. [Google Scholar] [CrossRef]
- Daioglou, V.; Doelman, J.C.; Wicke, B.; Faaij, A.; van Vuuren, D.P. Integrated assessment of biomass supply and demand in climate change mitigation scenarios. Glob. Environ. Chang. 2019, 54, 88–101. [Google Scholar] [CrossRef]
- Mokhsin, M.; Ludin, M.Z.M.; Suhaimi, A.I.H.; Zainol, A.S.; Som, M.H.M.; Halim, H.A. ParcelRestBox: IoT-Based Parcel Receiving Box System Design for Smart City in Malaysia. In Proceedings of the 2021 IEEE International Conference on Computing (ICOCO), Kota Kinabalu, Malaysia, 14–16 November 2022; pp. 180–185. [Google Scholar]
- Tang, Y.M.; Chau, K.Y.; Xu, D.; Liu, X. Consumer perceptions to support IoT based smart parcel locker logistics in China. J. Retail. Consum. Serv. 2021, 62, 102659. [Google Scholar] [CrossRef]
- Morganti, E.; Dablanc, L.; Fortin, F. Final deliveries for online shopping: The deployment of pickup point networks in urban and suburban areas. Res. Transp. Bus. Manag. 2014, 11, 23–31. [Google Scholar] [CrossRef]
- Yalcin Kavus, B.; Ayyildiz, E.; Gulum Tas, P.; Taskin, A. A hybrid Bayesian BWM and Pythagorean fuzzy WASPAS-based decision-making framework for parcel locker location selection problem. Environ. Sci. Pollut. Res. 2022, 1–18. [Google Scholar] [CrossRef]
- Ambrosini, X.; Bermont-Vialatte, A.; Lefort, M. Do We Need Regulation for Parcel Lockers? In Postal Strategies: Logistics, Access, and the Environment; Springer Nature Switzerland AG: Cham, Switzerland, 2023; pp. 101–113. [Google Scholar]
- Liu, W.; Liang, Y.; Bao, X.; Qin, J.; Lim, M.K. China’s logistics development trends in the post COVID-19 era. Int. J. Logist. Res. Appl. 2022, 25, 965–976. [Google Scholar] [CrossRef]
- Hive Box. Available online: https://fcbox.com/index.html (accessed on 20 February 2023).
- Schwerdfeger, S.; Boysen, N. Optimizing the changing locations of mobile parcel lockers in last-mile distribution. Eur. J. Oper. Res. 2020, 285, 1077–1094. [Google Scholar] [CrossRef]
- Ssa, B.; Nb, A. Who moves the locker? A benchmark study of alternative mobile parcel locker concepts. Transp. Res. Part C Emerg. Technol. 2022, 142, 103780. [Google Scholar]
- Bocewicz, G.; Nielsen, P.; Jasiulewicz-Kaczmarek, M.; Banaszak, Z. Dynamic planning of mobile service teams’ mission subject to orders uncertainty constraints. Appl. Sci. 2020, 10, 8872. [Google Scholar] [CrossRef]


Disclaimer/Publisher’s Note: The statements, opinions and data contained in all publications are solely those of the individual author(s) and contributor(s) and not of MDPI and/or the editor(s). MDPI and/or the editor(s) disclaim responsibility for any injury to people or property resulting from any ideas, methods, instructions or products referred to in the content. |
© 2023 by the authors. Licensee MDPI, Basel, Switzerland. This article is an open access article distributed under the terms and conditions of the Creative Commons Attribution (CC BY) license (https://creativecommons.org/licenses/by/4.0/).