Article

Effects of Graphene Oxide on the Properties of Engineered Cementitious Composites: Multi-Objective Optimization Technique Using RSM

by
Naraindas Bheel
1,
Bashar S. Mohammed
1,*,
Isyaka Abdulkadir
2,
M. S. Liew
1 and
Noor Amila Wan Abdullah Zawawi
1
1
Civil and Environmental Engineering Department, Universiti Teknologi PETRONAS, Bandar Seri Iskandar 32610, Perak, Malaysia
2
Institute of Energy Infrastructure, Universiti Tenaga Nasional, Putrajaya Campus, Jalan Kajang-Puchong, Kajang 43000, Selangor, Malaysia
*
Author to whom correspondence should be addressed.
Buildings 2023, 13(8), 2018; https://doi.org/10.3390/buildings13082018
Submission received: 29 May 2023 / Revised: 26 June 2023 / Accepted: 30 June 2023 / Published: 8 August 2023
(This article belongs to the Section Building Materials, and Repair & Renovation)

Abstract

:
Despite the excellent ductility and energy absorption properties of engineered cementitious composites (ECCs), a low modulus of elasticity and excessive drying shrinkage remain some of its major disadvantages. With the current trend in the application of nanotechnology in cementitious composites research, the effect of graphene oxide (GO) on the properties of ECCs is yet to be fully investigated, despite its promising results in ordinary cement paste, mortar, and concrete. ECCs need extensive material tailoring to provide the required mechanical characteristics and controlled fracture size with strain-hardening behavior. Striking a balance between these crucial hardened aspects of ECC without compromising any desired properties is a challenge. Hence, the main aim of the study reported in this paper is to use the response surface methodology (RSM) multi-objective optimization technique to identify an appropriate GO content via the weight of cement and also the volume fraction of polyvinyl alcohol (PVA) fiber as input variables that positively impact ECCs’ properties. Using RSM’s central composite design (CCD), 13 mixtures of various combinations of the variables (GO: 0.05%, 0.065%, 0.08%; PVA: 1%, 1.5%, 2%) were developed. Six responses were studied, including compressive strength, direct tensile strength, tensile capacity, flexural strength, modulus of elasticity, Poisson’s ratio, and drying shrinkage. Moreover, the microstructural properties of the composites were assessed using field-emission scanning electron microscopy (FESEM) and mercury intrusion porosimetry (MIP). The outcomes revealed that all the properties of ECCs were significantly enhanced by adding an optimum amount of 0.05% GO and 1–1.5% PVA fiber volume fractions. A maximum increase in 30%, 35%, 49%, and 33.9% in the compressive strength, direct tensile strength, flexural strength, and modulus of elasticity, respectively, of the mixes with 0.05% GO addition was recorded. It is demonstrated that the use of 0.05% GO as a nanoscale particle can provide good outputs for the construction industry.

1. Introduction

The world is experiencing a drastic increase in the development of infrastructure due to rapid urbanization. Consequently, there is an increase in the quest for more effective construction materials to meet the rising demand for efficient, sustainable, and smart structures [1]. Concrete, as the most popular building material, has been the focus of extensive research to enhance its performance and make it a more efficient and sustainable building material that is in sync with current requirements. Through these efforts, engineered cementitious composites (ECCs) were developed to overcome both the inherent weakness of concrete in resisting tensile stresses and concrete’s high susceptibility to cracking under loading [2,3,4]. However, ECCs are a type of high-performance fiber-reinforced composite (HPFRC) developed through the systematic tailoring of ingredients using micromechanics and fracture mechanics principles [5]. The composite has a strain-hardening ability, sustaining more load beyond the first crack without exhibiting any strain-softening behavior like conventional or steel fiber-reinforced concrete [6]. The formation of numerous microscopic cracks with widths less than 100 µm results in the strain hardening of ECCs [5,7]. This steady-state crack propagation is achieved using a polymeric fiber, usually polyvinyl alcohol (PVA) fiber, at a volume fraction not exceeding 2% [5,8]. Thus, ECCs have a strain capacity of 3–7% (300–700 times more ductile than conventional concrete). These properties enable ECC to have superior energy absorption and dissipation abilities, making them suitable for many applications, such as seismic structures, bridge deck link slabs, coupling beams, and many repair and retrofitting uses [9]. According to the design work, ECCs’ compressive strength ranges from 30 to 90 MPa [10]. A few research investigations in the literature have also demonstrated its much greater compressive strength, even exceeding 100 MPa [11]. ECCs have the ability to prevent unpredicted structural failures, fractures, and the entrance of harmful elements [12,13]. Even though ECCs have outstanding strain-hardening, toughness, high resistance to strain, and long-term stability characteristics, their uses in large-scale construction are still subject to certain restrictions [14]. The major challenges regarding the utilization of ECCs are as follows:
  • A low modulus of elasticity compared to conventional concrete because coarse aggregate particles are absent [15,16,17].
  • A greater cost of manufacture as a result of the inclusion of a higher amount of cement and polymeric fiber [14].
  • Higher cementitious material contents are used in ECC production than those required for normal concrete. It is reported that ECCs consume about four times as much cement as conventional concrete [18,19]. The high cement content increases the drying shrinkage of ECCs.
ECCs use a large number of cementitious materials and have a high level of carbon emissions. There is a need to take relevant measures to reduce carbon emissions, such as developing low-carbon cement [20] and improving the mechanical and durability properties of concrete. Moreover, to minimize the cement content, high-volume fly ash (HVFA) is used to lower the cost and reduce the drying shrinkage problems, in addition to an improvement in the workability properties and the potential for enhanced mechanical strength with the aging of composites [21,22]. In the same manner, other researchers tried to enhance the modulus of elasticity of ECCs by using hybrid fibers in the mix [8]. Khed et al. [23] investigated the effect of combining a low modulus PVA fiber and a high-modulus recycled tire wire fiber on the modulus of elasticity of ECCs. They reported an improvement in the modulus of elasticity attributed to the addition of the high-modulus recycled tire wire fiber. However, Wang et al. [24] reported that an increase in the steel fibers in a hybrid-fiber ECC leads to a slight decrease in the elastic modulus due to an increase in the defects or pores with the incorporation of the steel fibers. However, they noted that stronger bonds between the steel fibers and matrix might result in a composite with a higher elastic modulus. Similar research unanimously reported that incorporating higher-modulus fibers, such as steel fiber, into a hybrid-fiber ECC enhanced the toughness, which translated to the increased elastic modulus of the composite [21,25,26,27]. However, these high-modulus fibers significantly affect the strain capacity and, consequently, ECCs’ strain-hardening performance.
It is necessary to include the role of nanomaterials, which needs to be elaborated upon, namely carbon nanotubes (CNTs) [28], graphene, calcium carbonate, and graphene oxide (GO) in ECCs. The fact that cement-based composites are vulnerable to developing fractures, which might compromise their structural stability and longevity characteristics, is one of the major challenges encountered in the development sector. In order to halt crack formation at its beginning and stop it from spreading and developing into small-scale and large-scale fractures, cementitious composites utilize nanoparticles as aids on the nanoscale. Nevertheless, considering their limits, using 0D (like nanosilica) and 1D (like CNTs) does not solve the issue. A 2D nanoscale called GO works much more effectively as a filler, crack-arresting substance, and cement hydration compound in cement-based composites [29]. Due to its spherical form, nanosilica possesses a smaller aspect ratio, with elements of less than 30 nm in diameter and 300 m2/g of specific surface area [30]. The enhanced mechanical characteristics of the matrix made from cement are primarily due to two factors. The primary mechanism is that the nanoparticles’ large specific surface area acts as the mortar paste’s nucleus, increasing cement hydration [30]. Secondly, since they are smaller than C-S-H elements and act as a form of filler, nanosilica particles aid in densifying the Portland cement matrix’s microscopic structures [30]. However, owing to its small aspect ratio and inability to prevent small cracks created by nano-sized cracks, nanosilica has little post-peak endurance improvement [31]. Due to their enormous aspect ratio (greater than 1000), extremely strong properties, extraordinarily significant moduli of elasticity, and tensile properties, CNTs have been observed to significantly increase the durability and resilience of a cement-based composite superior to nanosilica, although they may have lower mechanical strengths because of their poor contact with a matrix made of cement and restricted dispersion, which causes the particles to clump together due to strong Van der Waal forces [30,31]. Therefore, utilizing GO instead of different nanomaterials such as nanosilica and CNTs to reinforce cement-based composites appears to have proved to be more successful. This prevents microcracks from forming by controlling fractures at the nanoscale [30]. Strong oxidizers such as sulfuric acid are used to treat graphite to create GO, a sort of nanomaterial. These oxidizers function by interacting with graphite and taking one electron out of the equation. In the recognition of functional groups that include oxygen in their outer layers, GO is extensively diffused in solution and effectively interacts with cement hydration products [32]. In light of the above-mentioned factors, the main aim of this paper is to use graphene oxide (GO) to overcome these challenges and remedy the low elastic modulus and high drying shrinkage concerns, in addition to enhancing the other mechanical properties of ECC.
GO is a two-dimensional nanoplatelet derived from graphene. The intrinsic properties of GO are similar to those of graphene, including an atom-thick sp2 bond 2D structure, a good Young’s modulus (1100 GPa), high thermal conductivity (3000 W m−1 K−1), greater specific surface (2600 m2/g), and good tensile strength (125 GPa) and stiffness [33,34,35]. In addition, GO possesses a diverse spectrum of oxygen functional groups on both the basal planes and the edges, including epoxides, ketones, carbonyls, hydroxyls, and carboxylic groups. The advantages of GO over other nanomaterials include halting crack formation at the nano level, its ability to speed up the hydration reaction, and its easy dispersion in water due to the hydrophilic functional groups present on its basal planes. Today, most scholars focus on the impact of GO on the performance of cementitious materials, specifically on hardened concrete, bond strength, durability, hydration, and the dispersion impact of the material. According to Wang et al. [36], GO played a role in cement hydration by speeding up the formation, development, and separation of hydrated products. This aides in the hydration process and increased crystal organization, resulting in a 90.50% and 52.40% rise in the cement paste’s flexural and compressive strengths, respectively. Mohammed et al. [37] reported that GO could be used to improve cement pore structure, significantly increasing durability, with investigational findings also demonstrating that GO can change the cement matrix to possess excellent freeze–thaw resistance. Through filling impact, bending impact, pulling out force, and bridging consequences, multilayer graphene limited the growth of microcracks and altered the route along which they developed [38]. Graphene oxide (GO), which has the ability to improve the characteristics and functionality of engineered cementitious composites (ECCs), has attracted a lot of interest in the field of research and development. The significance of GO in the investigation of ECCs is shown through numerous articles in the scientific community. There are certain major themes from the available research that highlight the importance of GO in ECCs, for instance, (i) by serving as a reinforcement component inside the cementitious matrix, GO may enhance mechanical qualities, such as tensile strength, flexural strength, and strain capacity, which is a result of its high modulus and tensile strength [39,40,41]; (ii) by minimizing fracture width and preventing the proliferation of cracks, GO addition to ECCs enhances longevity and fracture management, resulting in increased resilience to environmental influences [42,43]; and (iii) because of GO’s distinctive electrical characteristics, ECCs can self-sense, which enables them to keep track of structural health and spot early signs of degradation. Conductivity fluctuations may be used to monitor the overall strength of ECCs in real time by correlating them to fracture development or strain [44,45,46].
Despite the numerous advantages of GO in cementitious composites reported in the literature, its effect on ECC properties has not been adequately and properly reported. Thus, this study investigates the effect of GO and PVA fiber volume fractions on ECCs’ mechanical, deformation, drying shrinkage, and microstructural properties. The aim will be achieved through the use of response surface methodology (RSM) in order to develop mixes using GO and PVA fiber as variables (input factors) and develop RS-based predictive models using the empirical data generated, which will be subjected to an analysis of variance (ANOVA) and finally perform a multi-objective optimization and experimental validation, accordingly.

2. Materials and Methods

2.1. Materials

The binder used is a mixture of ordinary Portland cement (OPC), conforming to ASTM C150 and fly ash (FA) with low calcium content and classified as class F by ASTM C618 based on the total oxide (Al2O3 + Fe2O3 + SiO2) content of more than 70%, as shown in Table 1. The sand used as fine aggregate has an average size of 400 µm. An oil-coated polyvinyl alcohol (PVA) fiber with various proportions, such as 1%, 1.5%, and 2% of the volume fraction of ECC mixture and the properties of PVA fiber shown in Table 2, was used as one of the variables. The oil coating is designed to facilitate the fiber/matrix interfacial characteristics, as it guards against the strong chemical connection between the mixture and fiber that may cause fiber rupture. However, graphene oxide (GO) is used as a nanomaterial with 0.05%, 0.065%, and 0.08% of the cement weight in the investigation. A slurry of GO–water dispersion with 2.5 wt.% concentration was used in the research. A modified polycarboxylate-based high-range water reducer was used as the plasticizer, with a specific gravity of 1.08 and a pH value of 6.20. All the mixes were prepared using portable tap water that satisfied the requirements of ASTM C1602.

2.2. Design of RSM Mixes and Material Proportions

The RSM combines mathematical and statistical methods for experiment design and analysis. It uses an output parameter referred to as the dependent variable (the response) and input parameters known as the independent variables. The RSM assesses the effect of the independent variables and the influence of the variables’ interactions on the response of interest. It is employed in several disciplines, including cementitious composites’ design, modeling, and optimization. The input factors for the RSM in this research were the GO addition at 0.05%, 0.065%, and 0.08% of cement weight and PVA fiber volume fraction at 1%, 1.5%, and 2%. Based on the core composite design configuration, thirteen mixes were developed using eight mixtures of the input elements and five replications of the center points. The proportion of fly ash to cement, the water/binder ratio, and the sand binder ratio used in all mixes were 1.2, 0.3, and 0.36, respectively, based on the proportions for the most popular ECC used in most research (ECC-M45) [47]. As a starting dose for each mix, 1% of cement content was used as the superplasticizer (SP) quantity. However, because the GO reduces the flowability of cementitious mixes, its content was adjusted based on each mix’s demand to attain an adequately workable mix. Table 3 shows the RSM developed mixtures as well as the amounts of ingredients utilized.

2.3. Mixing and Sample Testing Procedures

2.3.1. Mixing

The mixing was carried out using a pan-type concrete mixer at varying speeds based on the ingredients being mixed at each particular time. The mixing sequence began by adding the dry ingredients, including the OPC, FA ash, and sand, and mixing at low speed at a rate of 30 RPM for 2 min. Then, water mixed with GO and 1% SP was added, and the mixture was allowed to mix for three minutes at a high speed of 60 RPM. As suggested by earlier research [48], the GO was combined with the polycarboxylate-based SP to help the nanoplatelets disperse without the need for sonication. The PVA fiber was then sprinkled from the top of the mixer through the wire openings at a speed of 30 to 60 RPM to ensure adequate dispersion and avoid fiber clumping. The SP was added to mixes with higher GO content to compensate for the loss in fluidity and attain a workable mix. The fresh mix was cast into various samples for the mechanical, deformation, and microstructural tests.

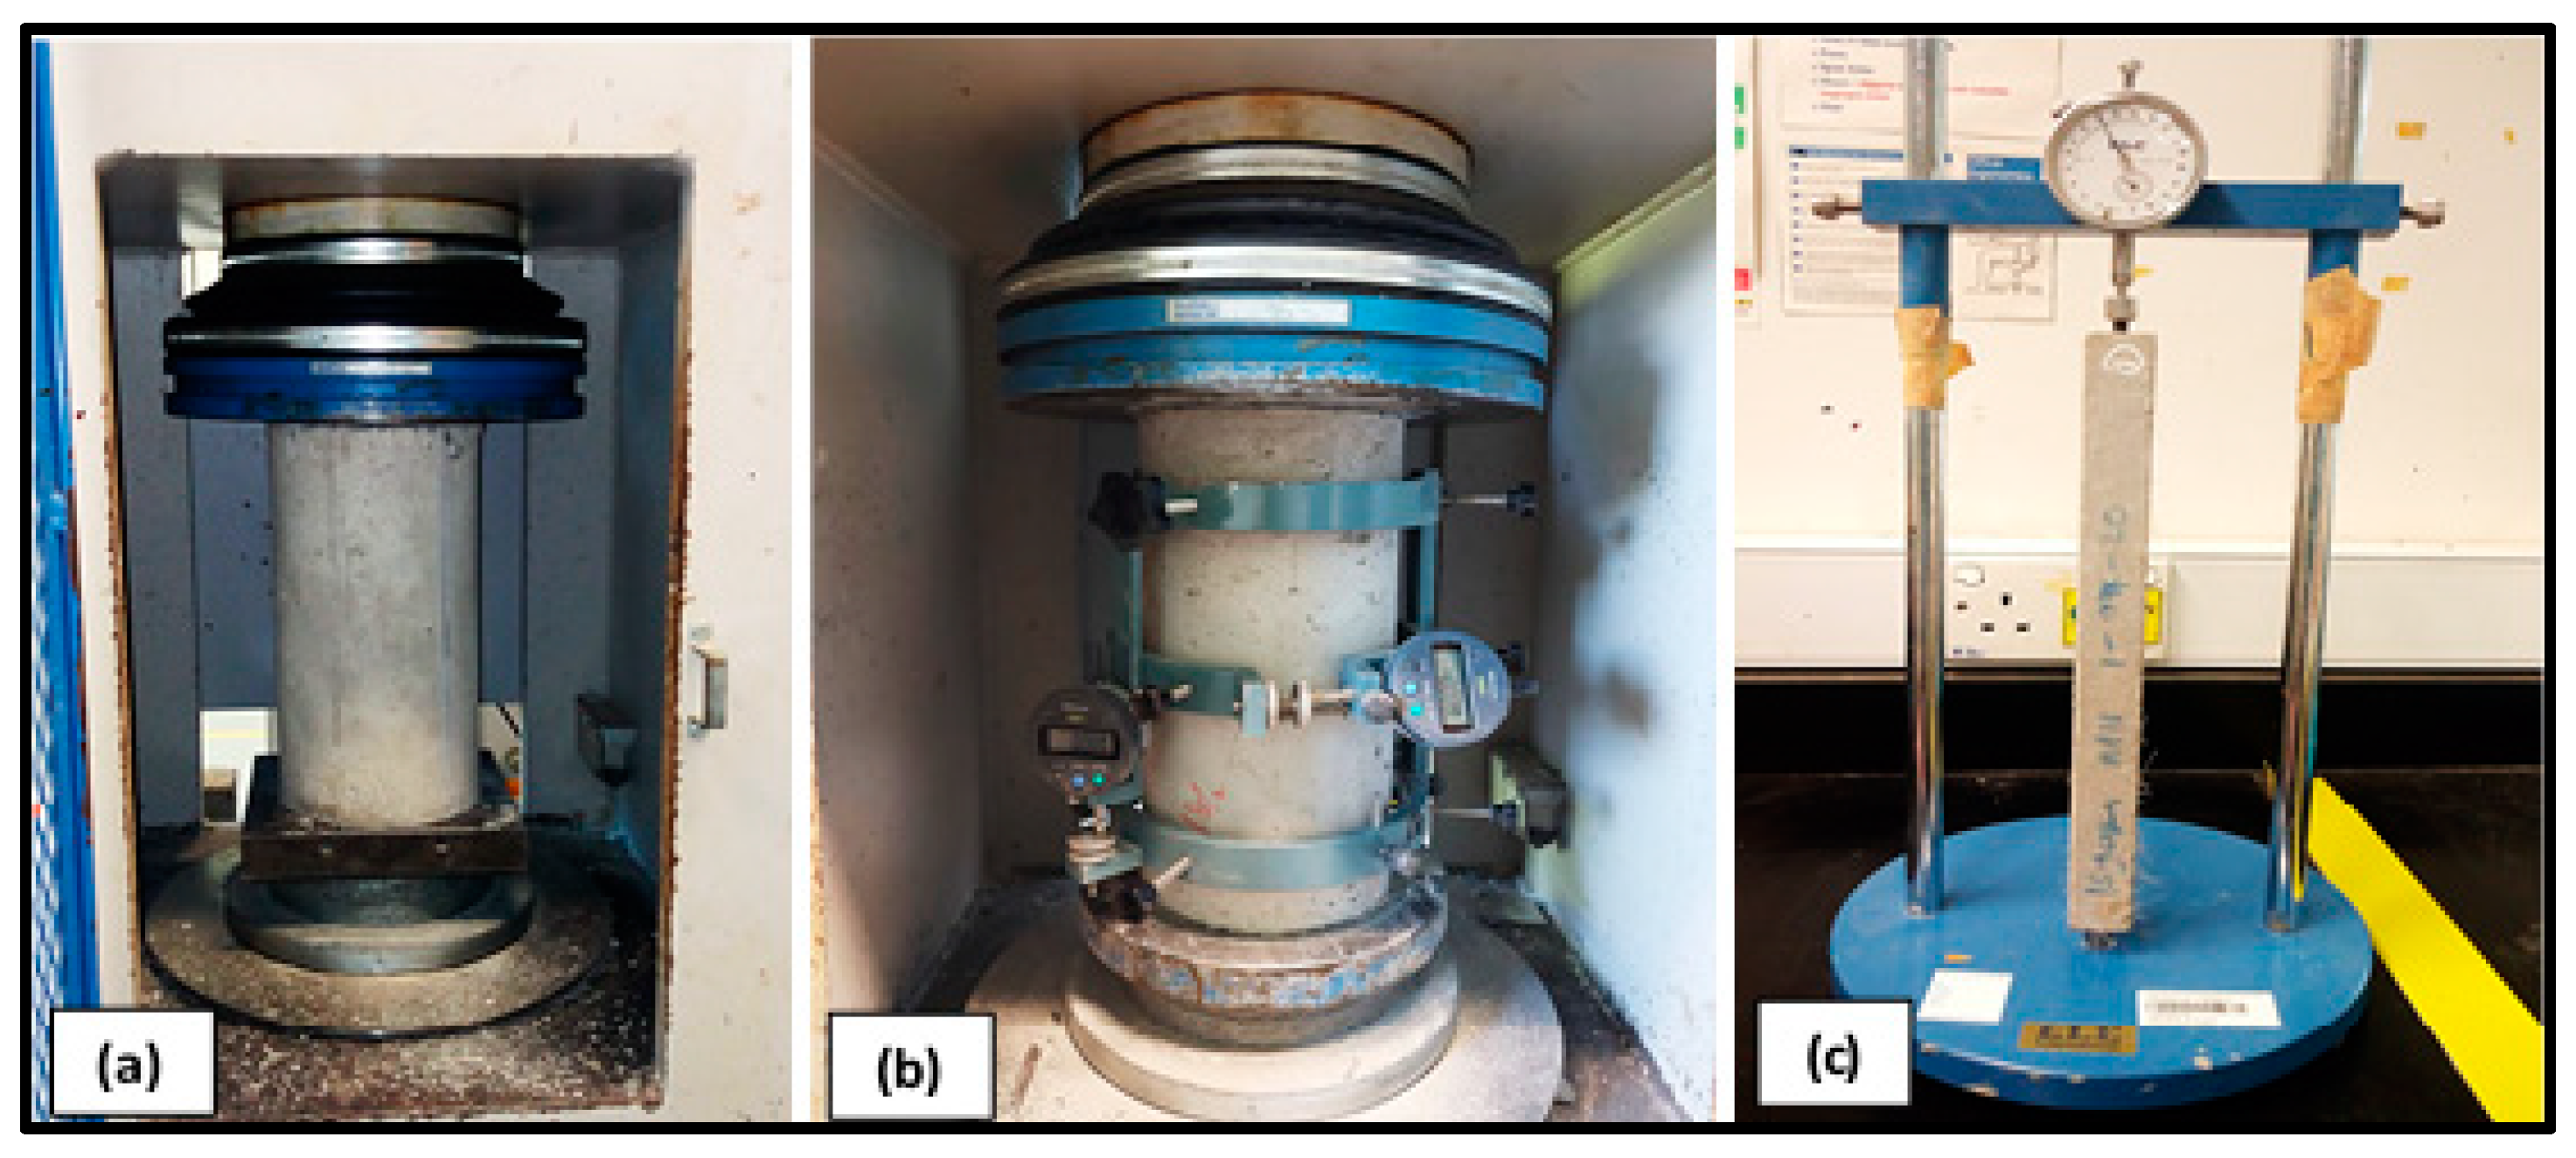
2.3.2. Mechanical Properties Tests

Except for compressive strength, all the tests were performed on the samples after curing them in water for 28 days. The compressive strength test was performed on three cubical specimens of 50 mm × 50 mm × 50 mm for each mix at 3, 7, 14, and 28 days of curing. The test was performed using a universal testing machine (UTM) of 3000 kN capacity (Figure 1a) as per BS EN 12390-3 specifications. The tensile test was performed on dog bone-shaped samples (420 mm × 120 mm × 30 mm) based on the procedure developed by the Japanese Society of civil engineers (JSCE) [49]. The test was conducted at a loading rate of 0.15 mm/min using a UTM of 200 kN capacity equipped with built-in LVDTs and a data logger that fed the test data to a computer that processed and displayed the readings in real-time, as shown in Figure 1b. In the same vein, using the same UTM at a loading rate of 0.05 kN/s, the flexural test was performed on 500 mm × 100 mm × 25 mm beam specimens, as indicated in Figure 1c. Three samples were tested for each mix, and each flexural property’s average value was presented.

2.3.3. Deformation Properties Tests

The modulus of elasticity (ME) and Poisson’s ratio (PR) were determined using the static method following the requirements of ASTM C469 [50]. For each mix, the test was conducted on four cylinders, with heights of 300 mm and diameters of 150 mm. As shown in Figure 2a,b, two of the cylinders were used to determine the compressive strength of the mix (ultimate load and stress), while the other two were used to determine the ME and PR. As shown in Figure 2c, the set-up consisted of a compressormeter equipped with dial gauges attached to the sample to measure the longitudinal and lateral deformations when loaded with 40% of the ultimate load determined from the compressive tests. The ME and PR were calculated using Equations (1) and (2), respectively.
E = ( σ 2 σ 1 ) ( ε 2 0.000050 )
ν = ε σ 2 ε σ 1 ε 2 0.000050
where
  • E is Young’s modulus of elasticity, MPa;
  • σ2 is the Stress corresponding to 40% of the ultimate load or ultimate Stress, MPa;
  • σ1 is the Stress corresponding to a longitudinal strain of 0.000050, MPa;
  • ν is Poisson’s ratio;
  • ε σ 2 is the lateral strain at mid-height of the specimen at a Stress, σ2;
  • ε σ 1 is the lateral strain at mid-height of the specimens under Stress, σ1.
Figure 2. (a) Determining the ultimate load/stress; (b) ME and PE tests at 40% ultimate load; (c) drying shrinkage measurement.
Buildings 13 02018 g002
The shrinkage of GO–ECC mixes was determined using samples of 285 × 25 × 25 mm dimensions following ASTM C157/C157M [51]. As shown in Figure 3, two samples of each GO–ECC mix were cast, cured under ambient conditions in the lab, and measured for length change every week for 90 days using the length comparator. Changes in the samples’ densities were monitored until the difference between two consecutive measurements was less than 0.5%.

2.3.4. Microstructural Tests

Field mission electron microscopy (FESEM) and Mercury intrusion porosimetry (MIP) were performed on designated specimens to assess the GO-mixes’ microstructure. Samples cured for 28 days were used to create specimens for the FESEM analysis. A water-cooled diamond-bladed saw was used to cut slices of specimens from the midpoint of cubical (50 mm) specimens that were 5 mm long and 3 mm thick. In order to obtain more precise and accurate surface imaging of the microstructure, the specimens were coated with the gold sputter coater. Afterward, the surface morphology and microstructure characteristics were evaluated using FESEM images acquired using a Supra 55VP microscope.
MIP has been conducted to assess the distribution of pore dimensions, porosity, and volume of pores of various solid and powdered substances, carried out in line with the ASTM D 4284-03 requirements. Specimens of 10 mm × 5 mm thickness cut out from a cube sample that had been cured for 28 days were used in the test. The samples were prepared by outgassing for 8 h at 105 °C in a low-pressure vacuum of 1.3 Pa. This process removed impurities from the pores and pore walls. Each sample was run for around 8 h before the results were obtained using the data logger attached to the equipment.

3. Results and Discussions

3.1. Mechanical Properties

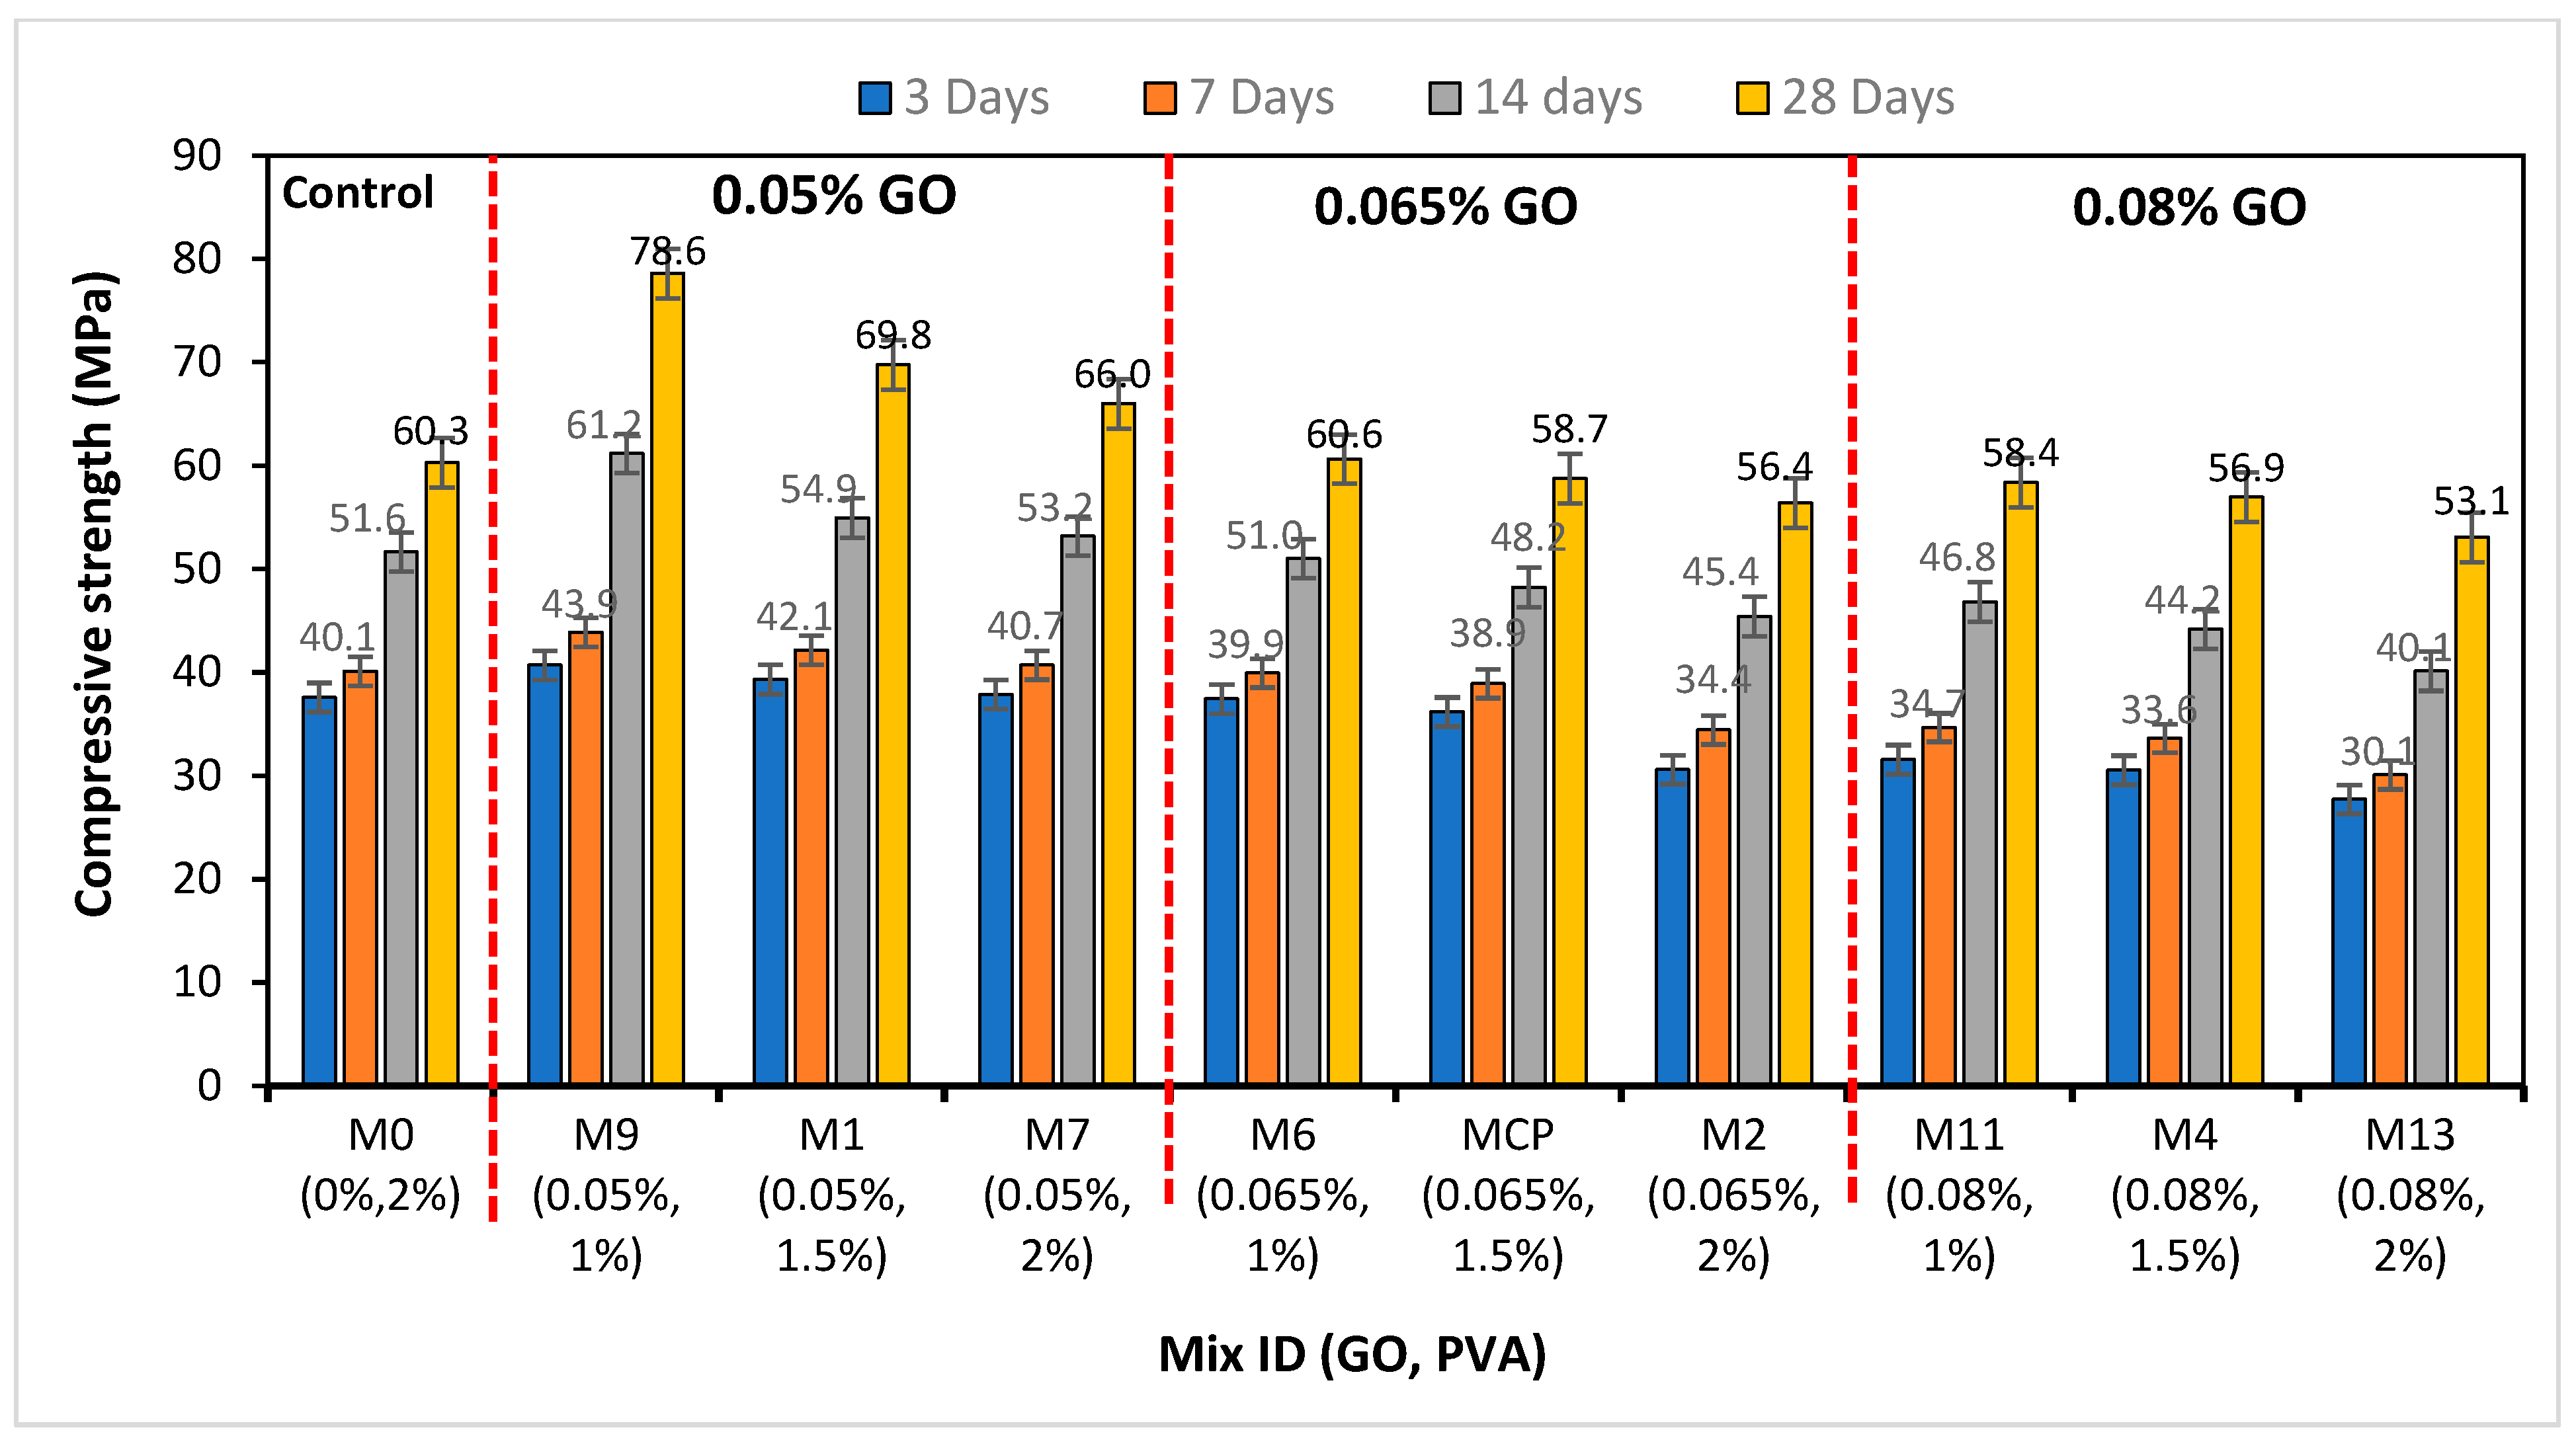
3.1.1. Compressive Strength

The compressive strength results of the GO–ECC mixes at different curing durations (3, 7, 14, and 28 days) are shown in Table 4 and Figure 3. The graph is plotted by grouping the mixes with the same GO content in ascending order of the PVA fiber addition for each group. The results for the five repetitive combinations of the CCD central facts (0.065% GO and 1.5% PVA) are represented by their average and identified as MCP in the bar graph for clarity. As can be observed, the compressive strength increased with curing age at all GO and PVA fiber additions. This is explained by the continuous hydration reaction, which generates more C-S-H gel, instigating an upward trend [52]. As the GO increased from 0 (control) to 0.05%, the strength increased significantly at all the fiber volume fractions. For example, an increase of 30% is observed between control M0 (control) and M9 (0.05% and 1%) at 28 days. The enhancement in the compressive strength with GO is attributed to the physical and chemical effects of the nanomaterial. Physically, the strong mechanical characteristics of the GO significantly contribute to the cement paste’s strengthening. The wrinkled GO nanosheets may connect to various reaction products in the matrix at different stages, boosting its fracture toughness and strength. Moreover, as a nanoscale substance, GO readily fills the pores of the cement matrix, resulting in greater densification, which improves mechanical characteristics [53,54]. Chemically, the GO’s large surface area acts as a nucleation site for forming hydration products. The GO’s oxygen functional groups are believed to interact with the cement’s chemicals to form flower-like crystals inside the composite, which enhance its strength [55].
However, as the GO increased to 0.65% and 0.08%, the compressive strength rise recorded at 0.05% gradually diminished, especially at higher PVA fiber contents. Despite having a slightly higher strength than the control at all curing periods, M6 (0.065%, 1%) is lower than M9 (0.05%, 1%), which has less GO content but the same PVA fiber. All the remaining mixes in the 0.065% and 0.08% GO groups exhibited a lower strength than the control, with the severity of the strength loss increasing with an increase in the PVA fiber volume fraction. Two causes are attributable to these findings: the first is the negative effects of a higher GO dosage, which causes dispersion problems and the agglomeration of the nanoplatelets, which is shown to hinder the proper action of the nanomaterial in enhancing the strength of cementitious composites [56]. Other studies have shown that agglomerated GO sheets are less effective in enhancing the mechanical properties of cement composites than well-dispersed GO sheets due to the latter’s utilization of the large surface area in enhancing cement hydration through the nuclei action [57]. The second is the insufficient PVA fiber dispersion due to its tendency to clump together at higher loadings. When that happens, the clumped fibers constitute weak spots within the hardened matrix due to the lack of cement paste to ensure adequate bonding and stress transfer at the interface; thus, the strength is affected negatively [58]. The aforementioned findings are consistent with those of Wang et al. [36] and Kang et al. [59].

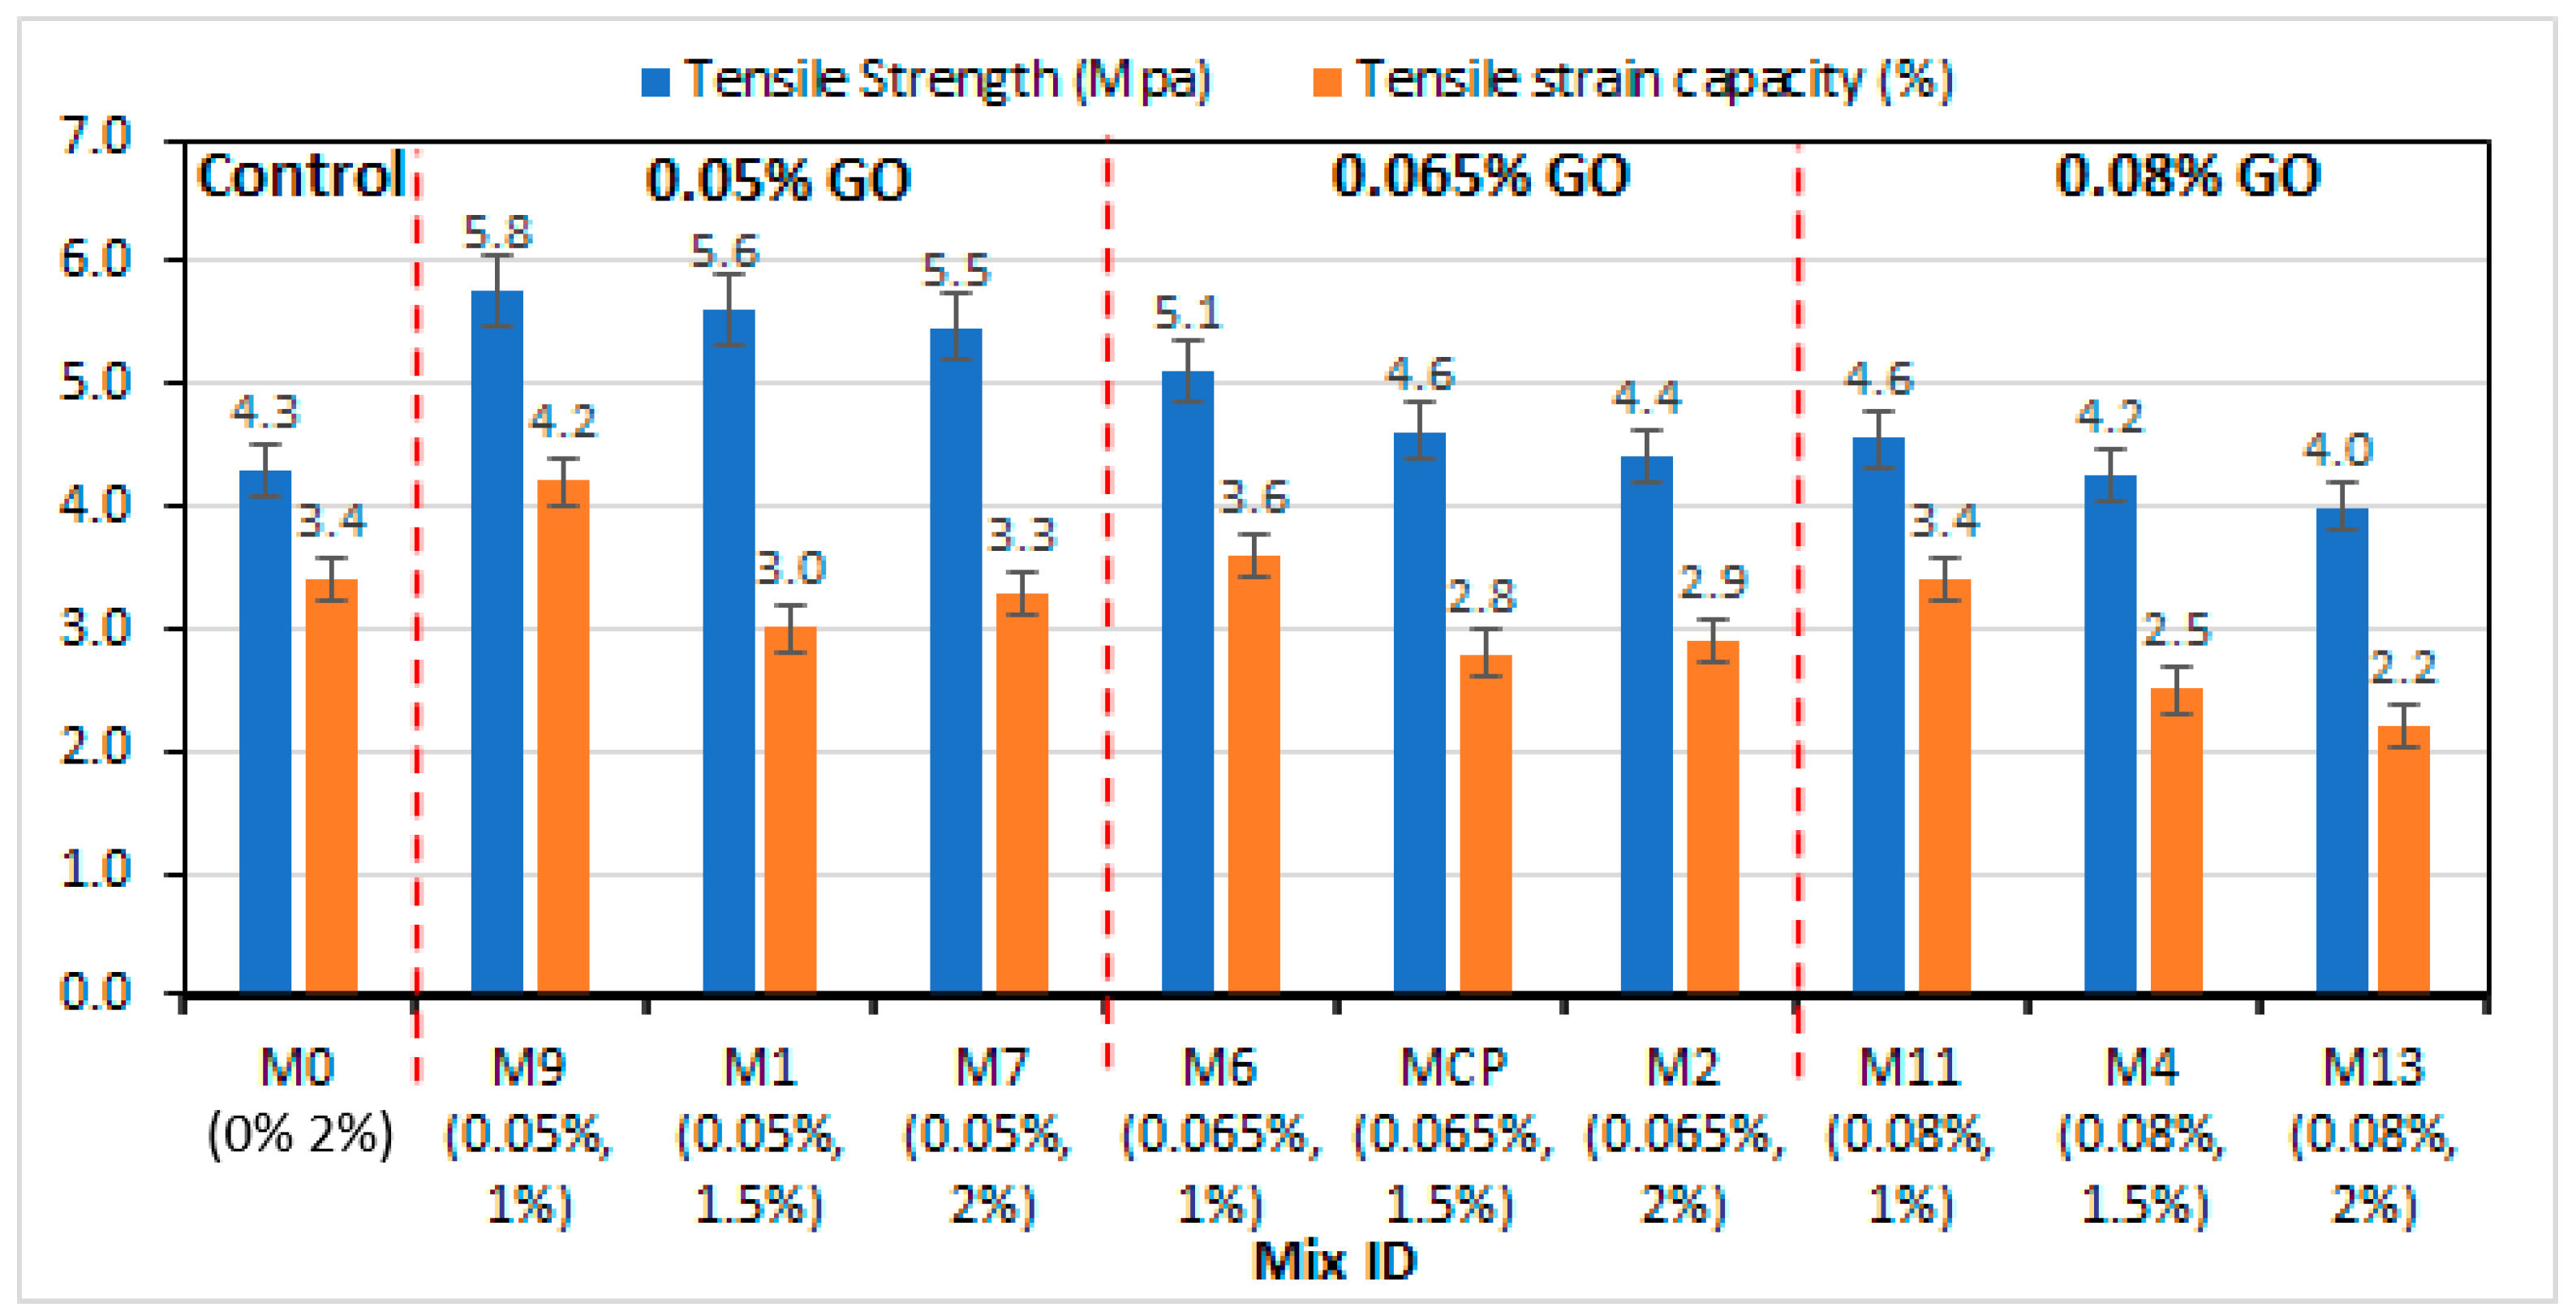
3.1.2. Tensile Properties

The uniaxial direct tensile test on dog bone-shaped specimens is used to determine the tensile properties of the GO–ECC mixes. In this research, the tensile properties assessed were the ultimate tensile strength (TS), which is defined as the maximum tensile strength of the specimen at the point of failure, and the measure of strain equal to the maximal tensile strength, known as the tensile strain capacity (TC). The average TS and TC values obtained from three samples for each GO–ECC mix are revealed in Figure 4. The stress–strain curves of some selected samples from which the TS and TC were determined as displayed in Figure 5. The results show a significant increase in the tensile strength of 35% between the control (M0) and the mix with 0.05% GO at 1% PVA fiber volume fraction. The increase in the strength at lower GO and PVA fiber contents is linked to the nanoplatelets’ capacity to fill pores and their ability to speed up the hydration reaction, which causes more C-S-H gel to develop, and also to the development in the attachment between the PVA fiber and the matrix, which improved the fiber-bridging effect [60]. Although the strength rise is not as high as in the case of M9, it remains higher than the control at both 1.5 and 2% PVA fiber additions in the 0.05% GO group, indicating a reduction in strength with the growth in the PVA fiber ascribed to the increased porosity owing to the fiber clumping, which affected proper compaction, and also due to the increased air during mixing attributed to the PVA fibers, which increased the porosity [61]. The trend continues to drop with increasing GO and PVA fiber due to the reasons above. In the 0.065% GO addition group, the tensile strength increased by 17% compared to the control, especially at 1% PVA. However, the increase is insignificant at 1.5 and 2% PVA additions (MCP and M2). Further increases in the GO to 0.08 resulted in only a slight increase (7%) in the strength at 1% PVA fiber (M11) compared to the control. On the other hand, the strength became lower than the control at M4 and M13, with 1.5 and 2% PVA fiber additions, respectively.
On the other hand, it has been established that the tensile strain capacity of ECC is attained when the crack tip toughness is less than the fiber-bridging capacity, which ensures the development and propagation of multiple microcracks responsible for the strain-hardening behavior [62,63,64,65,66]. At 0.05%, the amount of GO was perfect to balance the matrix fracture toughness and enhance the bonding between the PVA fiber and the cement paste so that the fiber-bridging effect could be attained without fiber rupture or slippage. This resulted in the composite being more ductile, as seen by the increase in tensile strain capacity (Figure 4) and the samples’ strain-hardening behavior, as illustrated in Figure 5a–c. The strain hardening is described as the rise in the curve beyond the first crack strength, which shows the ability of the composite to sustain more load after the first crack by propagating steady-state controlled-width microcracks, unlike the typical strain-softening behavior exhibited by concrete, in which the sample fails due to the widening of the first crack (Griffith crack).
As shown in Figure 5, all the samples displayed the typical ECC strain-hardening behavior, which is evident from the rising trend of the curves in terms of sustaining increased loads after the first crack. Additionally, the little rises and falls along the curves reveal the formation of cracks on the test samples under stress, with the magnitude of fall along the curves indicating the depth of each crack. Mixes with 0.05% GO showed the highest tensile strength and strain capacity in all three cases. As the GO and PVA fiber additions increase, two things could be responsible for the declining strength and strain capacity. The first is the possibility of the GO to increase the strong chemical bonding between the PVA fiber and the cement matrix, which results in fiber rupture under load, leading to a reduced tensile capacity [67]. It has been established that for strain hardening to occur, steady-state cracks must be developed under the condition that the crack tip toughness must be less than the complimentary energy of the fibers bridging the cracks. However, the excess GO additions (0.065 to 0.08) upset this balance, increasing the crack tip toughness and the excessive chemical bond, leading to the fiber rupture [68]. Secondly, the excess fiber makes ECC fibrous and porous, leading to reduced matrix strength, affecting the needed balance for attaining strain-hardening behavior and enhanced tensile capacity.

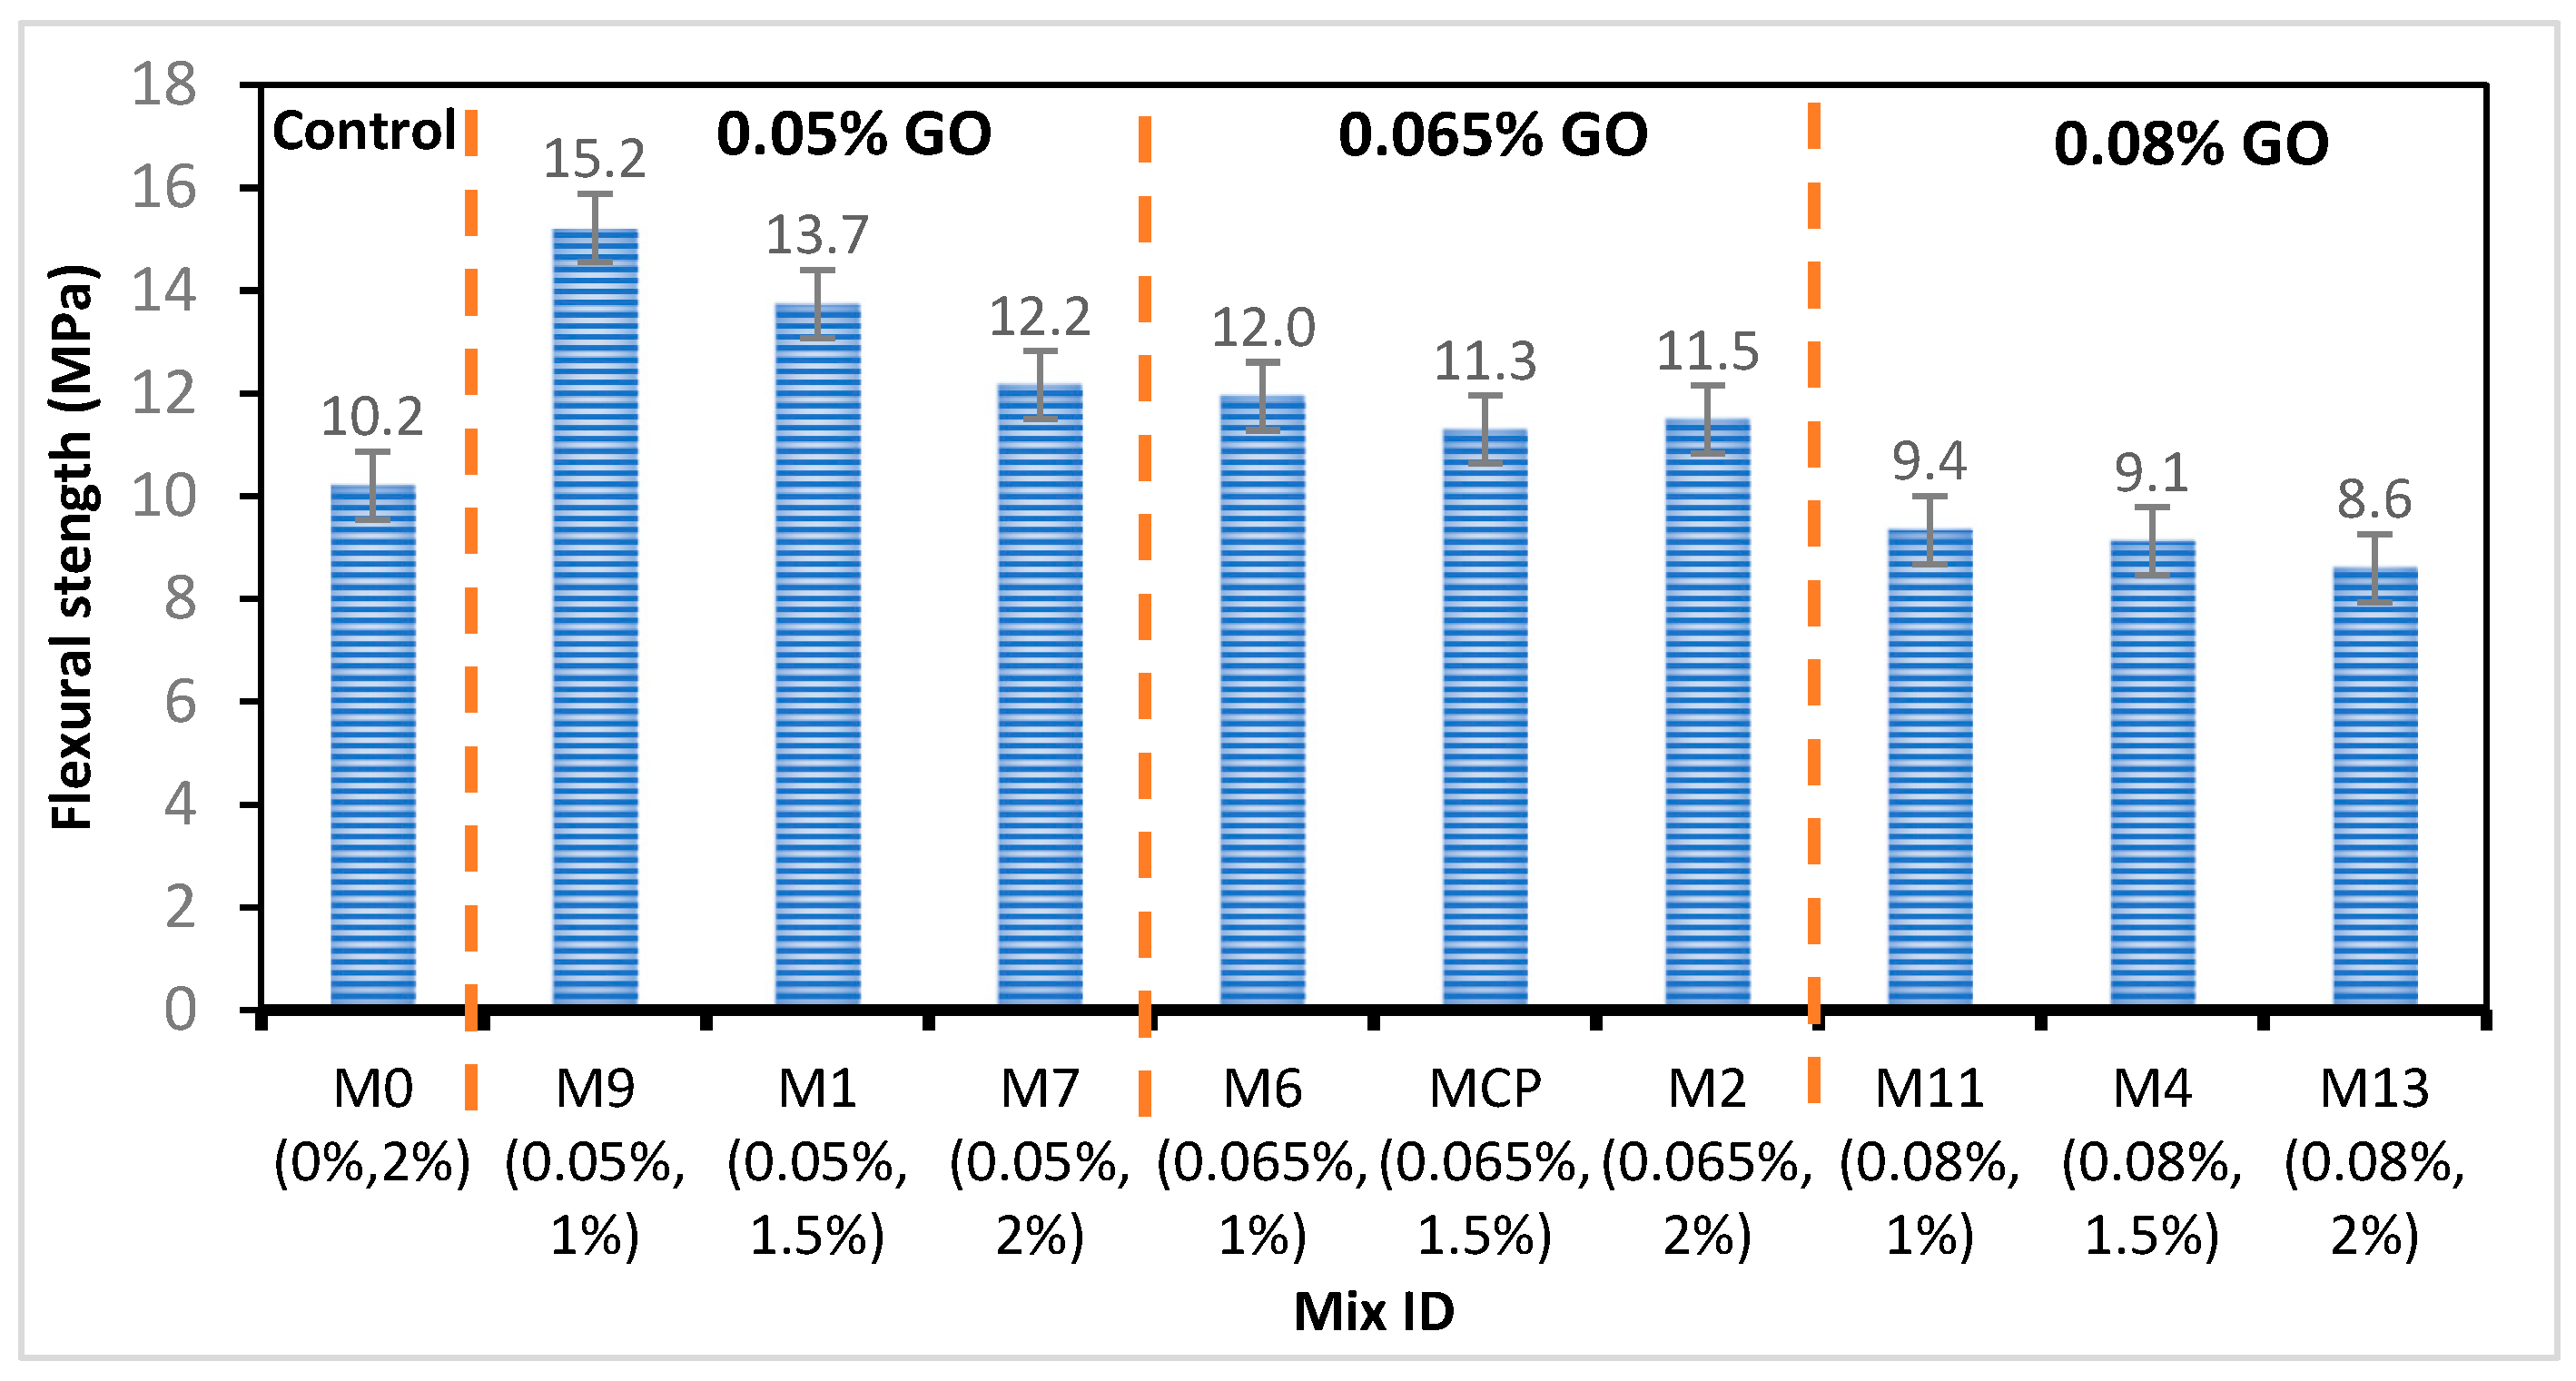
3.1.3. Flexural Properties

The result of the flexural strength of GO–ECC combinations is illustrated in Figure 6. The flexural strength of the GO–ECC ranges between 8.6 to 15.2 MPa. The trend shows a maximum 49% increase in the flexural strength with the addition of 0.05% GO compared to the control. The flexural strength increase with GO is higher than those recorded for the compressive and tensile strengths, agreeing with previous studies. The nano-reinforcing effect of the GO platelets translates into the macromechanical properties. At the nano level, the 2D nanoparticles intercept and bridge the nanocracks, preventing them from propagating. This effect enhances the flexural stress transfer at the ITZ between the GO and the cement matrix and across the nanocracks, as pointed out by Li et al. [69], who mentioned that effective matrix-to-filler stress transfer is crucial for the reinforcing effect, which the slender platelet-like shape of the GO and good bonding with the cement matrix provides. This is in addition to the filling effect and the enhancement of hydration reaction through the nuclei and template effects of the GO nanosheets [70].
However, the rate of increase becomes smaller with any increases in the PVA fiber and GO additions. As stated earlier, higher GO additions are counterproductive due to agglomeration and their sliding over each other. Excess GO negatively affects the fluidity and compaction of cementitious mixes due to the self-curing effect of the large surface area GO nanosheets and their enhancement of cement flocculation, which traps free water. On the other hand, the decline of the strength with PVA fiber in all the GO addition groups is attributed to the fiber balling effect, especially at higher GO dosages, due to the difficulty in the mixing and compaction of the mixes [71]. Thus, it is recommended that the GO and fiber volume fraction be kept at 0.05% and no more than 1.5%, respectively.
As shown in Figure 7, the deformation behavior of all the mixes, which is typical of ECCs, was concrete-like up to the first-cracking strength. At that point, further deformation resulted in a dramatic increase in deformation along with a boost in load-carrying capacity due to the multiple cracking plastic deformations of the composite. This is known as strain-hardening behavior, which earned ECC the name “bendable concrete” [71]. The superior performance of M9, which has a 1% PVA fiber volume fraction, is attributed to the better fiber distribution than that achieved in mixes with higher fiber contents. Better fiber spatial dispersion and low fiber clumping can improve the capacity of the fibers to bridge cracks and transfer the load to other areas of the composite [72], which can be observed through the curves. Similarly, the GO addition of 0.05% has optimally enhanced the bonding between the fibers and the composite, which enhanced the fiber-bridging effect that translated into the multiple microcracks and observed strain hardening.

3.2. Deformation Properties

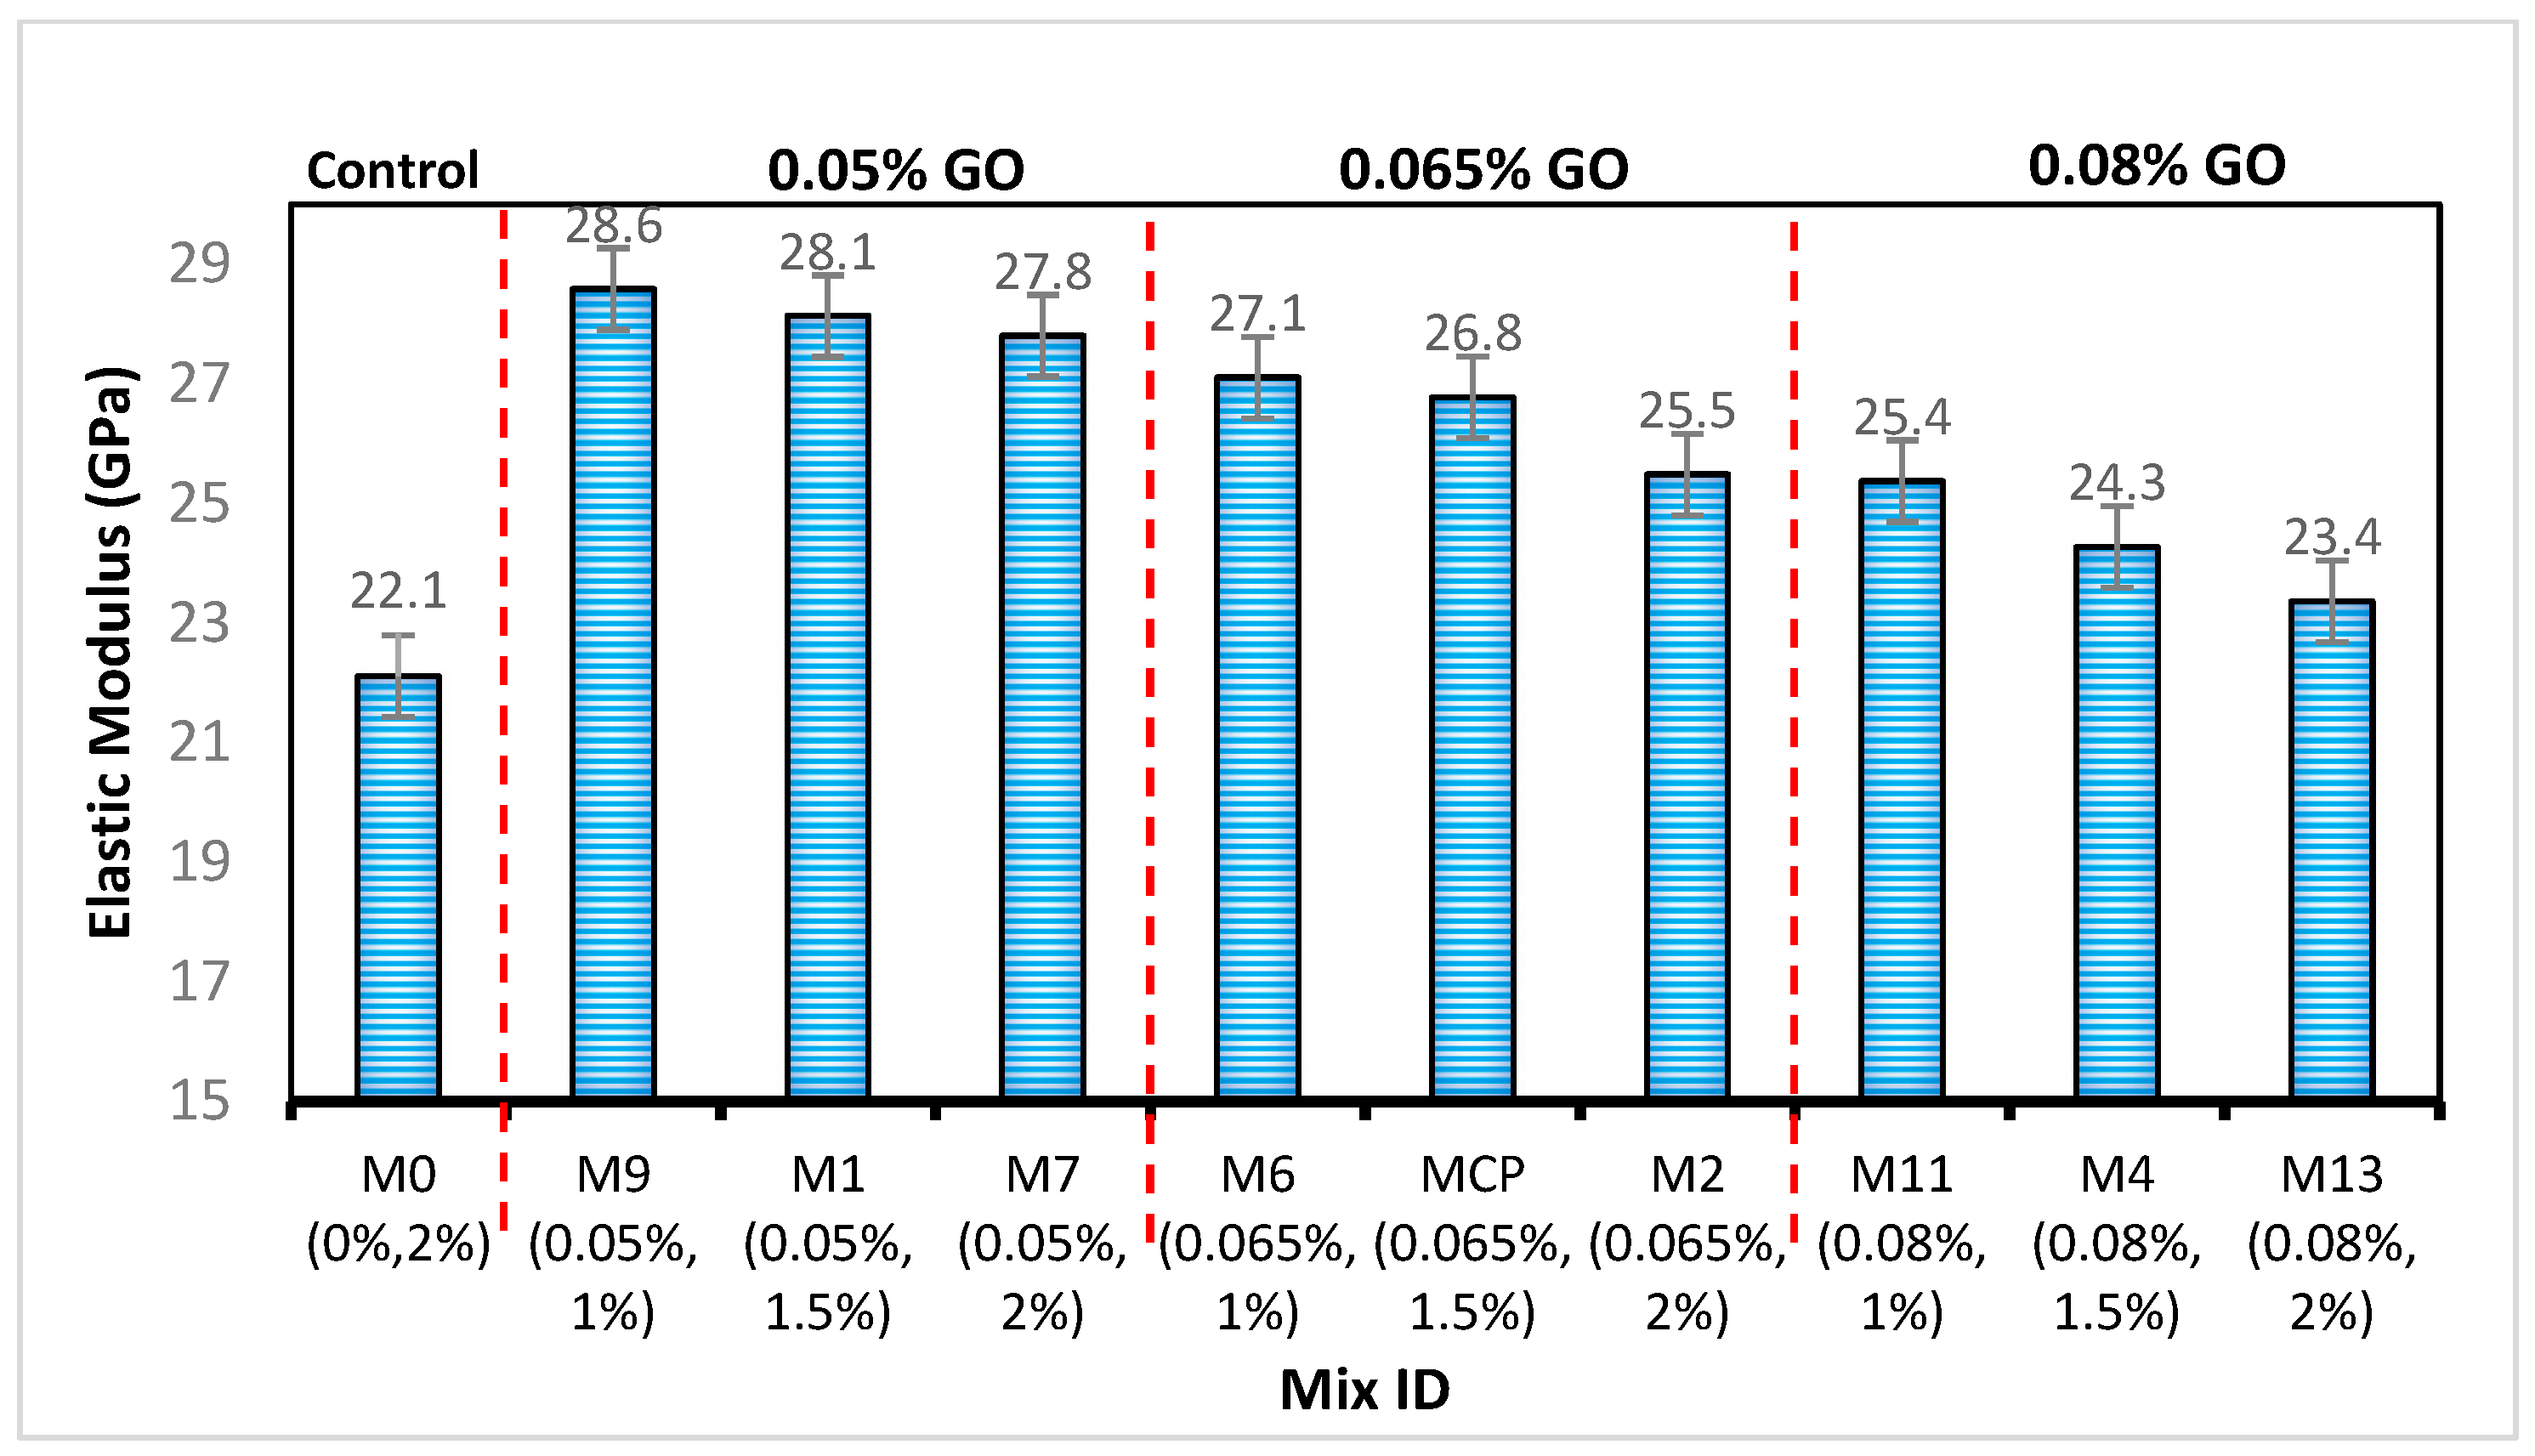
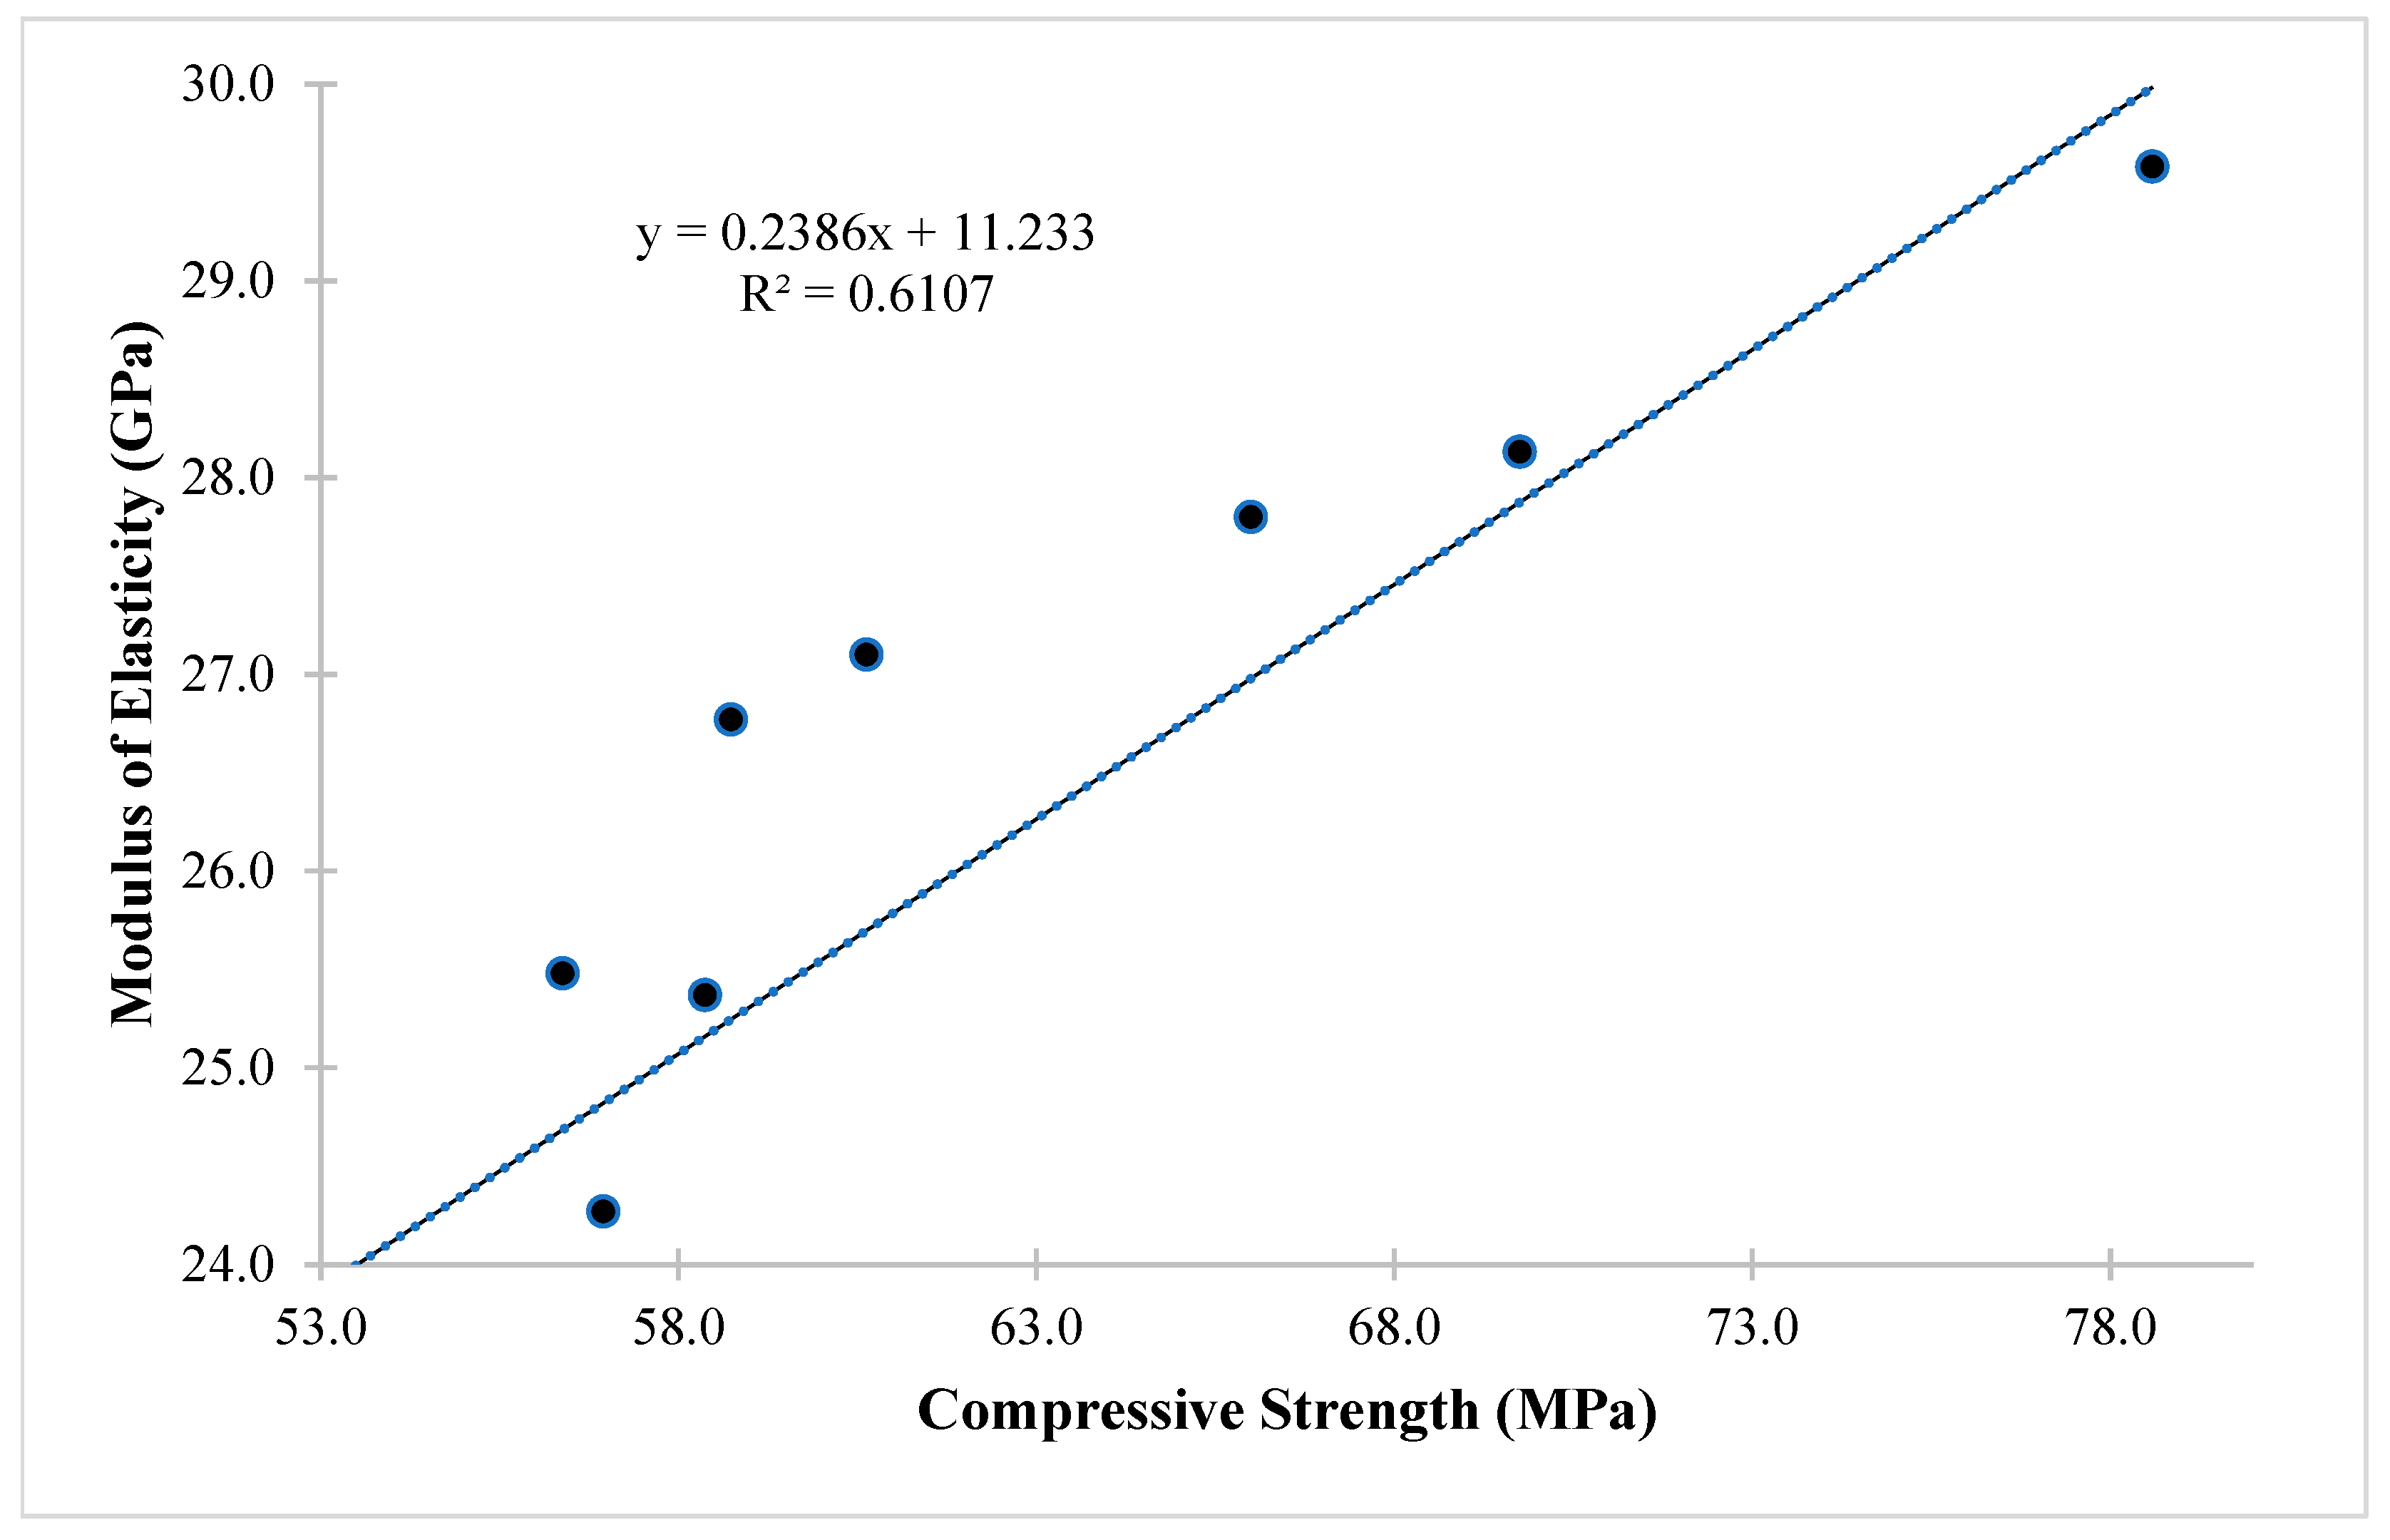
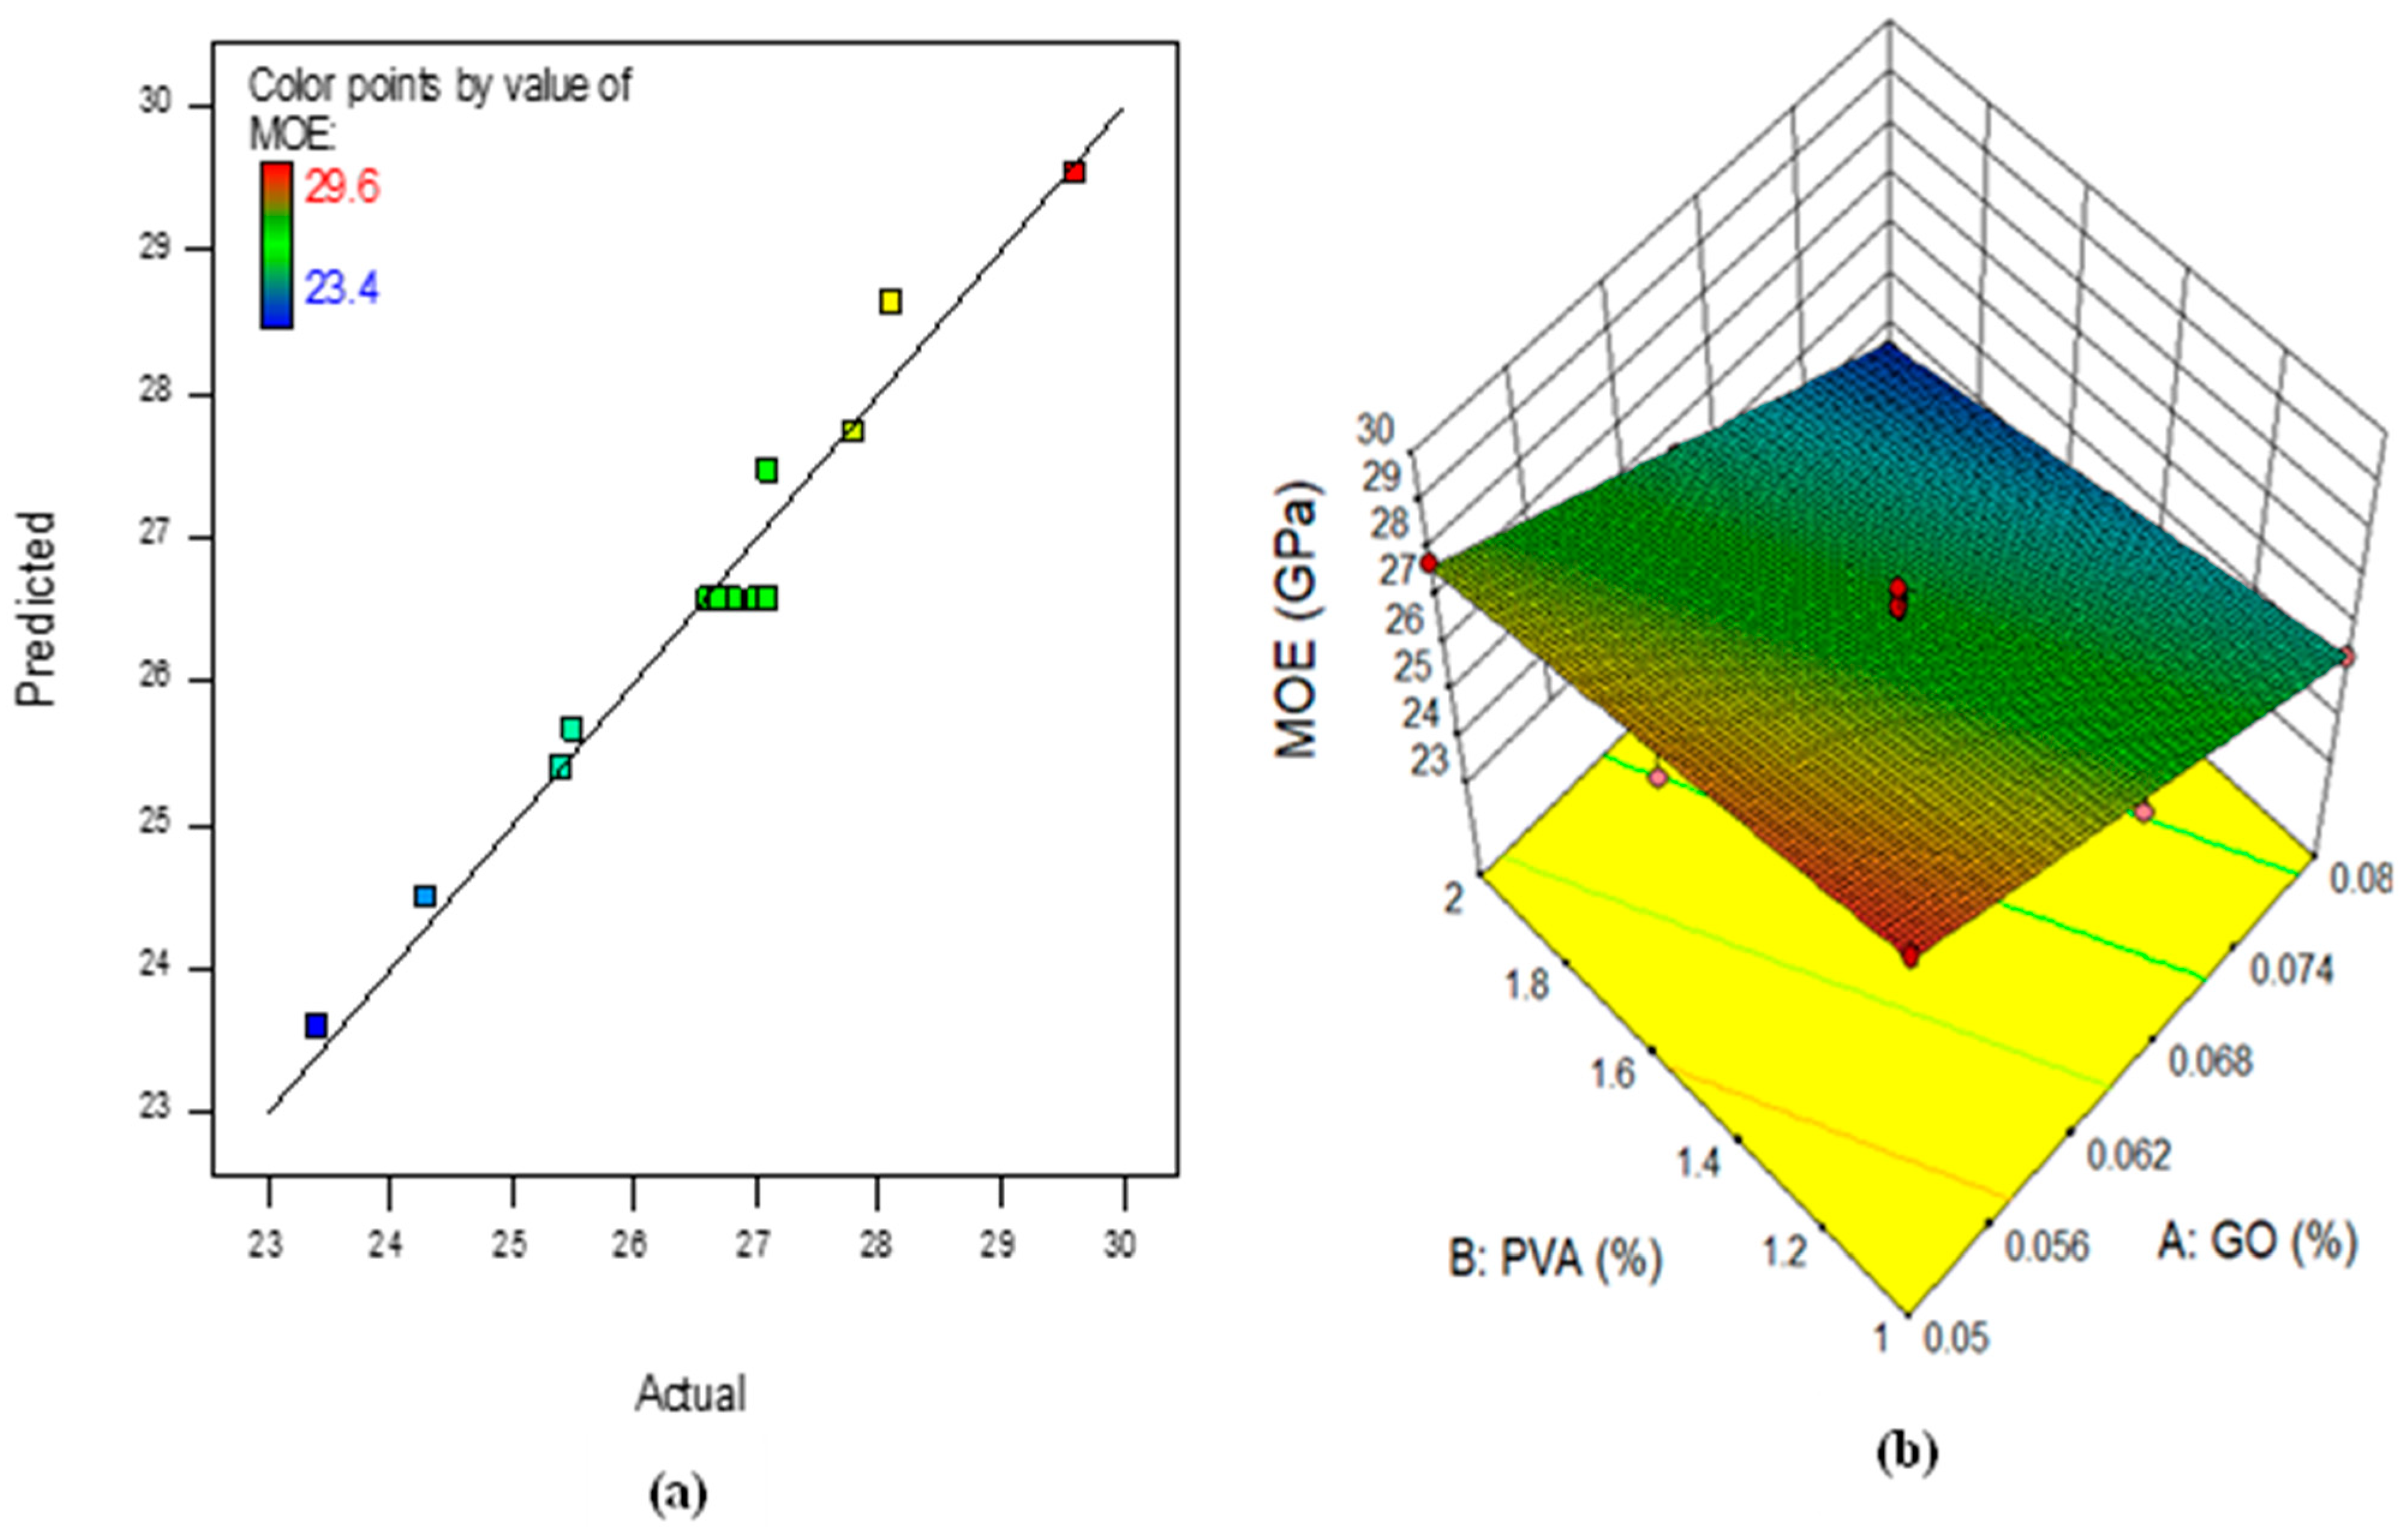
3.2.1. Modulus of Elasticity (ME) and Poisson’s ratio (PR)

The results for the modulus of elasticity of the GO–ECC mixes are shown in Figure 8. It can be seen that the ME values of the mixes range between 23.4 to 28.6 GPa. There was a maximum increase of 33.9% in the ME of the composite when compared to the control mix of 21.4 GPa. The rise in the ME value is more than the 28.6% increase reported by Mohammed et al. [8], who modified ECCs with nanosilica. Generally speaking, the compressive strength of cementitious composites is associated with their MEs [73]. Thus, a correlation between the ME and compressive strength of the GO–ECC mixes containing different amounts of GO and PVA fiber was established, as shown in Figure 9. The coefficient of determination (R2) value of 61% shows a good agreement between the two parameters, as obtained from previous studies [8,73,74]. The ME of cementitious composite is affected by the aggregates’ size, shape, volume, and ME, the interfacial transition zones between the aggregates, the fiber, and the binding material. In this case, the addition of GO made the hardened cementitious matrix more tough and compact, which led to better stress transfer at the ITZ, between the PVA and hardened cementitious matrix, which translates to the improved ME values, especially at moderate PVA fiber content. The decline in the ME values with PVA can be attributed to the fiber-balling effect, which increases the composite’s porosity and hinders proper attachment between the fibers and the PC composites. However, the values of the ME obtained in all GO addition groups are very good compared to the control and ME results of ECC mixes from previous studies [47,75]. Hence, this shows the potential of GO modification in addressing the issue of the low ME of ECC due to the absence of coarse aggregates and the use of high-volume fly ash.
Moreover, the PR of the GO–ECC combinations rises as the GO and PVA fibers grow. As illustrated in Figure 10. The Poisson’s ratio values of regular concrete range from 0.15 to 0.2. However, in this case, the PR values ranged between 0.15 and 0.25. The increase in the PR indicates the ease with which the composites deform laterally under load. At the lowest GO and PVA fiber levels (M9 and M1), due to the toughening effect of the GO on the composite and the optimal performance of the PVA fiber at these levels (attributed to better dispersion and enhanced bonding with the cement paste), the samples’ lateral deformation was minimal compared to the control sample. However, when the amount of GO and PVA fibers increased, the sample’s toughness decreased, making it easier for strains to develop under load, which caused the PR values to increase.

3.2.2. Drying Shrinkage

The water loss inside the capillary pores of the composite leads to the volume change associated with the shrinkage strain called the drying shrinkage. As shown in Figure 11, it was observed that the shrinkage decreased drastically with an increase in the GO addition. The GO–ECC shrinkage values range between 0.00043 mm to 0.0009 mm, much lower than the control sample shrinkage value (0.00122) and the reported range of ECC shrinkage values (1200 × 10−6 to 1800 × 10−6) [76]. There is a 66.4% decrease in the drying shrinkage between the control (M0) and the GO–ECC mix with the lowest drying shrinkage value (M11). The decreased drying shrinkage results from the matrix’s pore structure being reduced and refined due to the GO’s densification effect [77]. Furthermore, the many reactive functional groups on the GO surface improved cement hydration, increasing cement paste density, and volume stability, while lowering drying shrinkage. Moreover, the hydrophilicity of the GO particles and their large surface area allow them to absorb water during mixing to wet their surface, which is then released back into the mixture to improve the cement’s later hydration by increasing the production of hydration products, densifying the matrix, and lowering drying shrinkage.
On the other hand, at a PVA fiber volume fraction above 1.5%, there was a significant increase in the drying shrinkage associated with the increased porosity of the composite owing to improper fiber dispersion [78]. The clumped fibers reduce the stiffness of the composites owing to their compressible nature, allowing for increased volume instability as the pore water escapes, leading to higher shrinkage strains. However, all GO–ECC mixes’ drying shrinkages are lower than the control ECCs at all GO and PVA fiber additions. This shows the efficacy of GO in addressing the issue of the excessive drying shrinkage of ECC.

3.3. Microstructural Properties

3.3.1. FESEM Analysis

Four representative samples from the GO–ECC mixes were subjected to FESEM to evaluate the impact of the GO on the microstructural properties of the GO–ECC and gain insight into how it affects the macrostructural properties. Figure 12 depicts the findings. Figure 12a displays the microstructural morphology of the control sample without GO. It can be observed that the cement matrix contains many nanopores, which can lead to reduced strength under load. Moreover, the crystallization of the cement products is not visible. The inclusion of GO served as a template to control the formation of cement hydration crystal products, refine and compact the structure of the hardened cement paste, and boost its strength [79,80]. However, adding the 0.05% GO significantly reduced the microstructure’s porosity, as seen in Figure 12b for M9. From the inset, the decreased porosity derives from the GO’s ability to fill spaces and speed up the hydration reaction, which enhances the formation of several layers of hydration product crystals similar to those reported by Chintalapudi et al. [81].
The agglomeration effect of the nanoparticles resulted in a counterproductive increase in the GO of 0.05%, as the mechanical characteristics revealed. This is proven via the FESEM image of M4 (0.08% GO and 1.5% PVA), shown in Figure 12c, which depicts clusters of poorly dispersed GO sheets that did not effectively enhance the densification of the surrounding cement hydration products through the pore filling and the template effects. On the contrary, Figure 12d shows the morphology of M7 (0.05%GO, 2% PV) with relatively well-dispersed GO nanosheets surrounded by hydrated cement product crystals. Hence, the FESEM results support the results of the mechanical and deformation properties of the GO–ECC mixes discussed earlier.

3.3.2. MIP Analysis

The MIP test was carried out on selected samples to study the pore properties and how the input variables affected the pore distribution and structure. The easiest way to understand the pore size distribution is through the pore size distribution curve (PSDC), as shown in Figure 13a,d. The PSDC for M0 (the control) in Figure 13a shows that the sample has a total pore volume of 122.3 mm3/g. In addition, there is a fair distribution of all the types of different-sized pores within the composite. However, at 0.05% GO and 1% PVA fiber additions (M9), the GO decreased the total pore volume to 105.76 mm3/g. Moreover, the GO reduced the number of pores with a size range between 100–1000 nm, thereby increasing the number of smaller pores with a size of less than 100 nm, as shown in Figure 13b. This demonstrates the GO’s ability to refine pores by enhancing hydration reactions and nanofiller actions.
Furthermore, increasing the PVA fiber increased the total pore volume of the composite, as can be observed in Figure 13c for M7, which has a total pore volume of 111.3 mm3/g. This is consistent with the findings of Long et al. [33], who reported that incorporating PVA fiber significantly increased the air content during mixing, which leads to an increased porosity of the composite. At the maximum GO addition level of 0.08, there seems to be a drastic reduction in the total pore volume at both 1.5 and 2% PVA fiber additions. This could be attributed to the GO’s nano-filling effect. However, at this high dose, it was seen that the mechanical and deformation properties of the composite were compromised, and this could be attributed to the extra GO nanosheets clump and slide over each other under stress, negating any benefits that the lower pore volume would have had. Moreover, even at these higher GO dosages, the influence of the increased porosity of the composite with PVA addition can be seen when the PVA fiber increased to 2% at 0.08% GO (M13), as shown in Figure 13e.

4. Response Surface Methodology (RSM) Analysis

The variables and their corresponding responses for all the 13 GO–ECC-developed mixes are shown in Table 4. The empirical data were used to generate response surface-based predictive approaches. The generated models were analyzed, and a multi-objective optimization was performed, as discussed in the following sections.

4.1. Response Surface Model Development and ANOVA

Empirical response-predictive models were created and validated using the experimental data. The model can assume any of the two forms given in Equations (3) and (4) for a linear or quadratic relationship, respectively, based on the interaction between the input aspects and their consequences on the desired response.
y = β 0 + β 1 x 2 + β 2 x 2 + β n x n + ϵ
y = β 0 + i = 1 k β i x i + i = 1 k β i i x i 2 + j = 2 k i = 1 j = 1 β i j x i x j + ϵ
The models developed are presented in Equations (5)–(10). For compressive strength (CS), tensile strength (TS), tensile capacity (TC), and flexural strength (FS) of the GO–ECC mixes, quadratic models were found to be more suitable based on the preferred sequential model sum of squares (SMSS), which has more of the additional terms as significant and the model was not aliased. On the other hand, the linear model was developed for the MOE and PR based on the SMMS. The models are presented in coded factors where the input factors’ lowest, intermediate, and highest values are represented by −1, 0, and +1, respectively.
C S = + 58.61 7.66 × A 3.69 × B + 1.82 × A B + 5.04 × A 2 + 0.2 × B 2
T S = + 4.68 0.68 × A 0.27 × B 0.075 × A B + 0.22 × A 2 + 0.072 × B 2
T C = + 2.76 0.40 × A 0.47 × B 0.075 × A B + 6.897 × 10 3 × A 2 + 0.51 × B 2
F S = + 11.44 2.33 × A 0.72 × B + 0.55 × A B 0.18 × A 2 + 0.17 × B 2
M O E = + 26.57 2.07 × A 0.90 × B
P R = + 0.19 + 0.021 × A + 0.018 × B
where A is the GO addition by weight of cement and B is the PVA fiber volume fraction.
The models were subjected to ANOVA performed at a 95% confidence interval. Thus, models and terms with less than 5% probability were considered significant. The result of the ANOVA is summarized in Table 5. All of the mathematical models created are important in terms of having a probability rating (p-value > F) of less than 0.005. The model terms are designated as significant or not significant based on whether the p-value > F of the term is less than or greater than 5% accordingly, as shown in Table 5. Conversely, it is important that the p-value for the “lack of fit” be “not significant” (>5%) for the model to fit. Hence, for all the developed models, only the FS has a significant lack of fit. However, considering other models’ diagnostic tools, even the FS model was found to be adequately strong for the intended purpose.
Furthermore, other model validation parameters considered in the analysis are presented in Table 6. As can be observed, all the models have a reasonably high coefficient of determination (R2), which measures how well the developed model fits the empirical data. R2 has a value of 0 to 1 (or 0 to 100%), with a value of 1 or close to 1 being the most desirable. The R2 for all the models ranged between 70 to 98%, indicating that the chosen models fit the data appropriately. Moreover, for the model to predict the response with high accuracy, the adjusted R2 and predicted R2 should not differ by more than 0.2. Looking at the values of the Adj. R2 and Pred. R2 for all the models, it can be seen that this condition is satisfied. Furthermore, adequate precision (Adeq. Precision) of more than four is required for a developed model, and in this case, all the developed models have an Adeq. precision of more than 10, which shows that the models are strong and can accurately predict the responses.

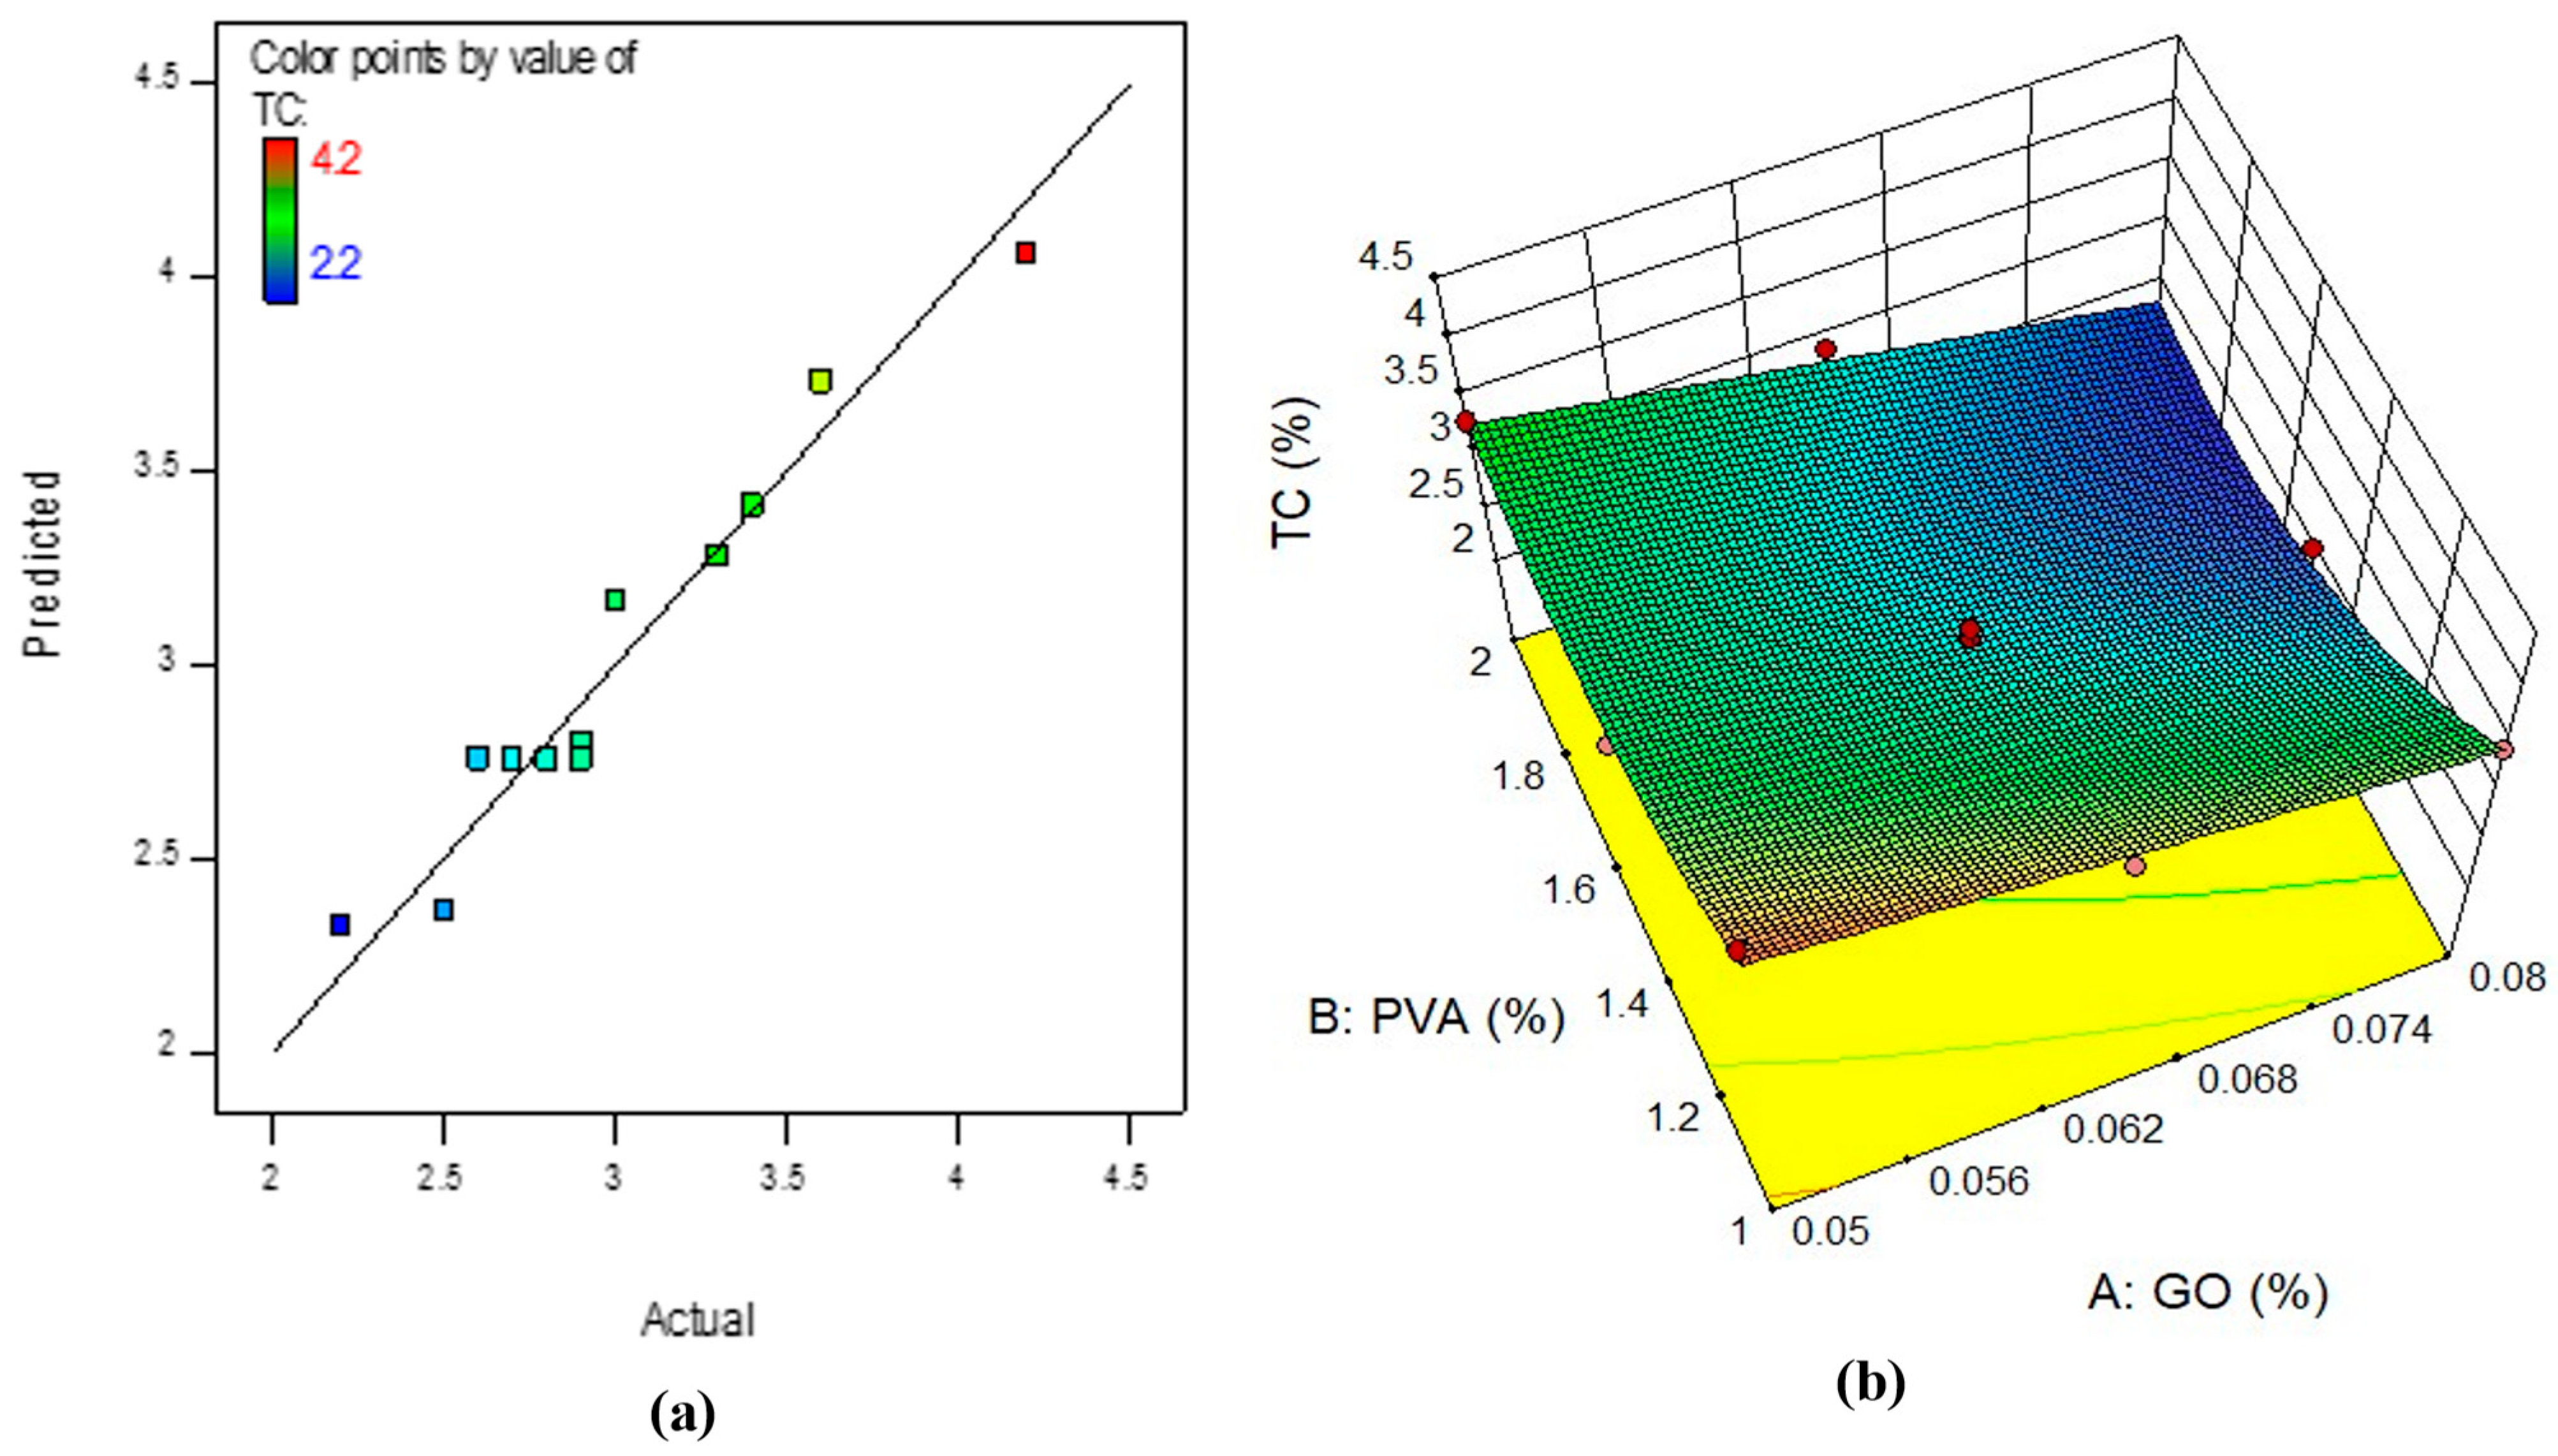
4.2. Model Diagnostics and Response Surface Plots

One of the model analytical apparatuses applied in RSM to check the worth of the developed model is the “actual” versus “predicted” graph, which displays the model’s effectiveness and compares it with the null model. The datapoints should align with the 45° fitting line, with narrow confidence bands for a good fit. On the other hand, the result of the interaction of the variables on the response can be visualized more clearly using either a 2D contour plot or a 3D response surface plot. The 3D response surface plot (RSP) expresses the same information as the 2D contour plot but from a 3D perspective. In this research, the actual vs. predicted diagnostic plot and the 3D RSP of all the created response predictive approaches are shown in Figure 14, Figure 15, Figure 16, Figure 17, Figure 18 and Figure 19. As can be observed, for every prototype that has been created, the datapoints are perfectly aligned to the line of fit in the actual vs. predicted plots, which shows a good correlation between the experimental data and the predicted response data from the models.
Regarding the 3D response surface diagrams, color coding indicates areas on the surface diagram that represent different intensities of the response that can be obtained through the interaction of the input variables. The red zones indicate the regions with the highest response magnitudes, while the blue regions represent the lowest response intensities. The interactions of the input aspects and their impact on the responses are completely consistent with the earlier discussions on the effect of the variables on the GO–ECC mixes’ mechanical and deformation properties, as observed in the plots.

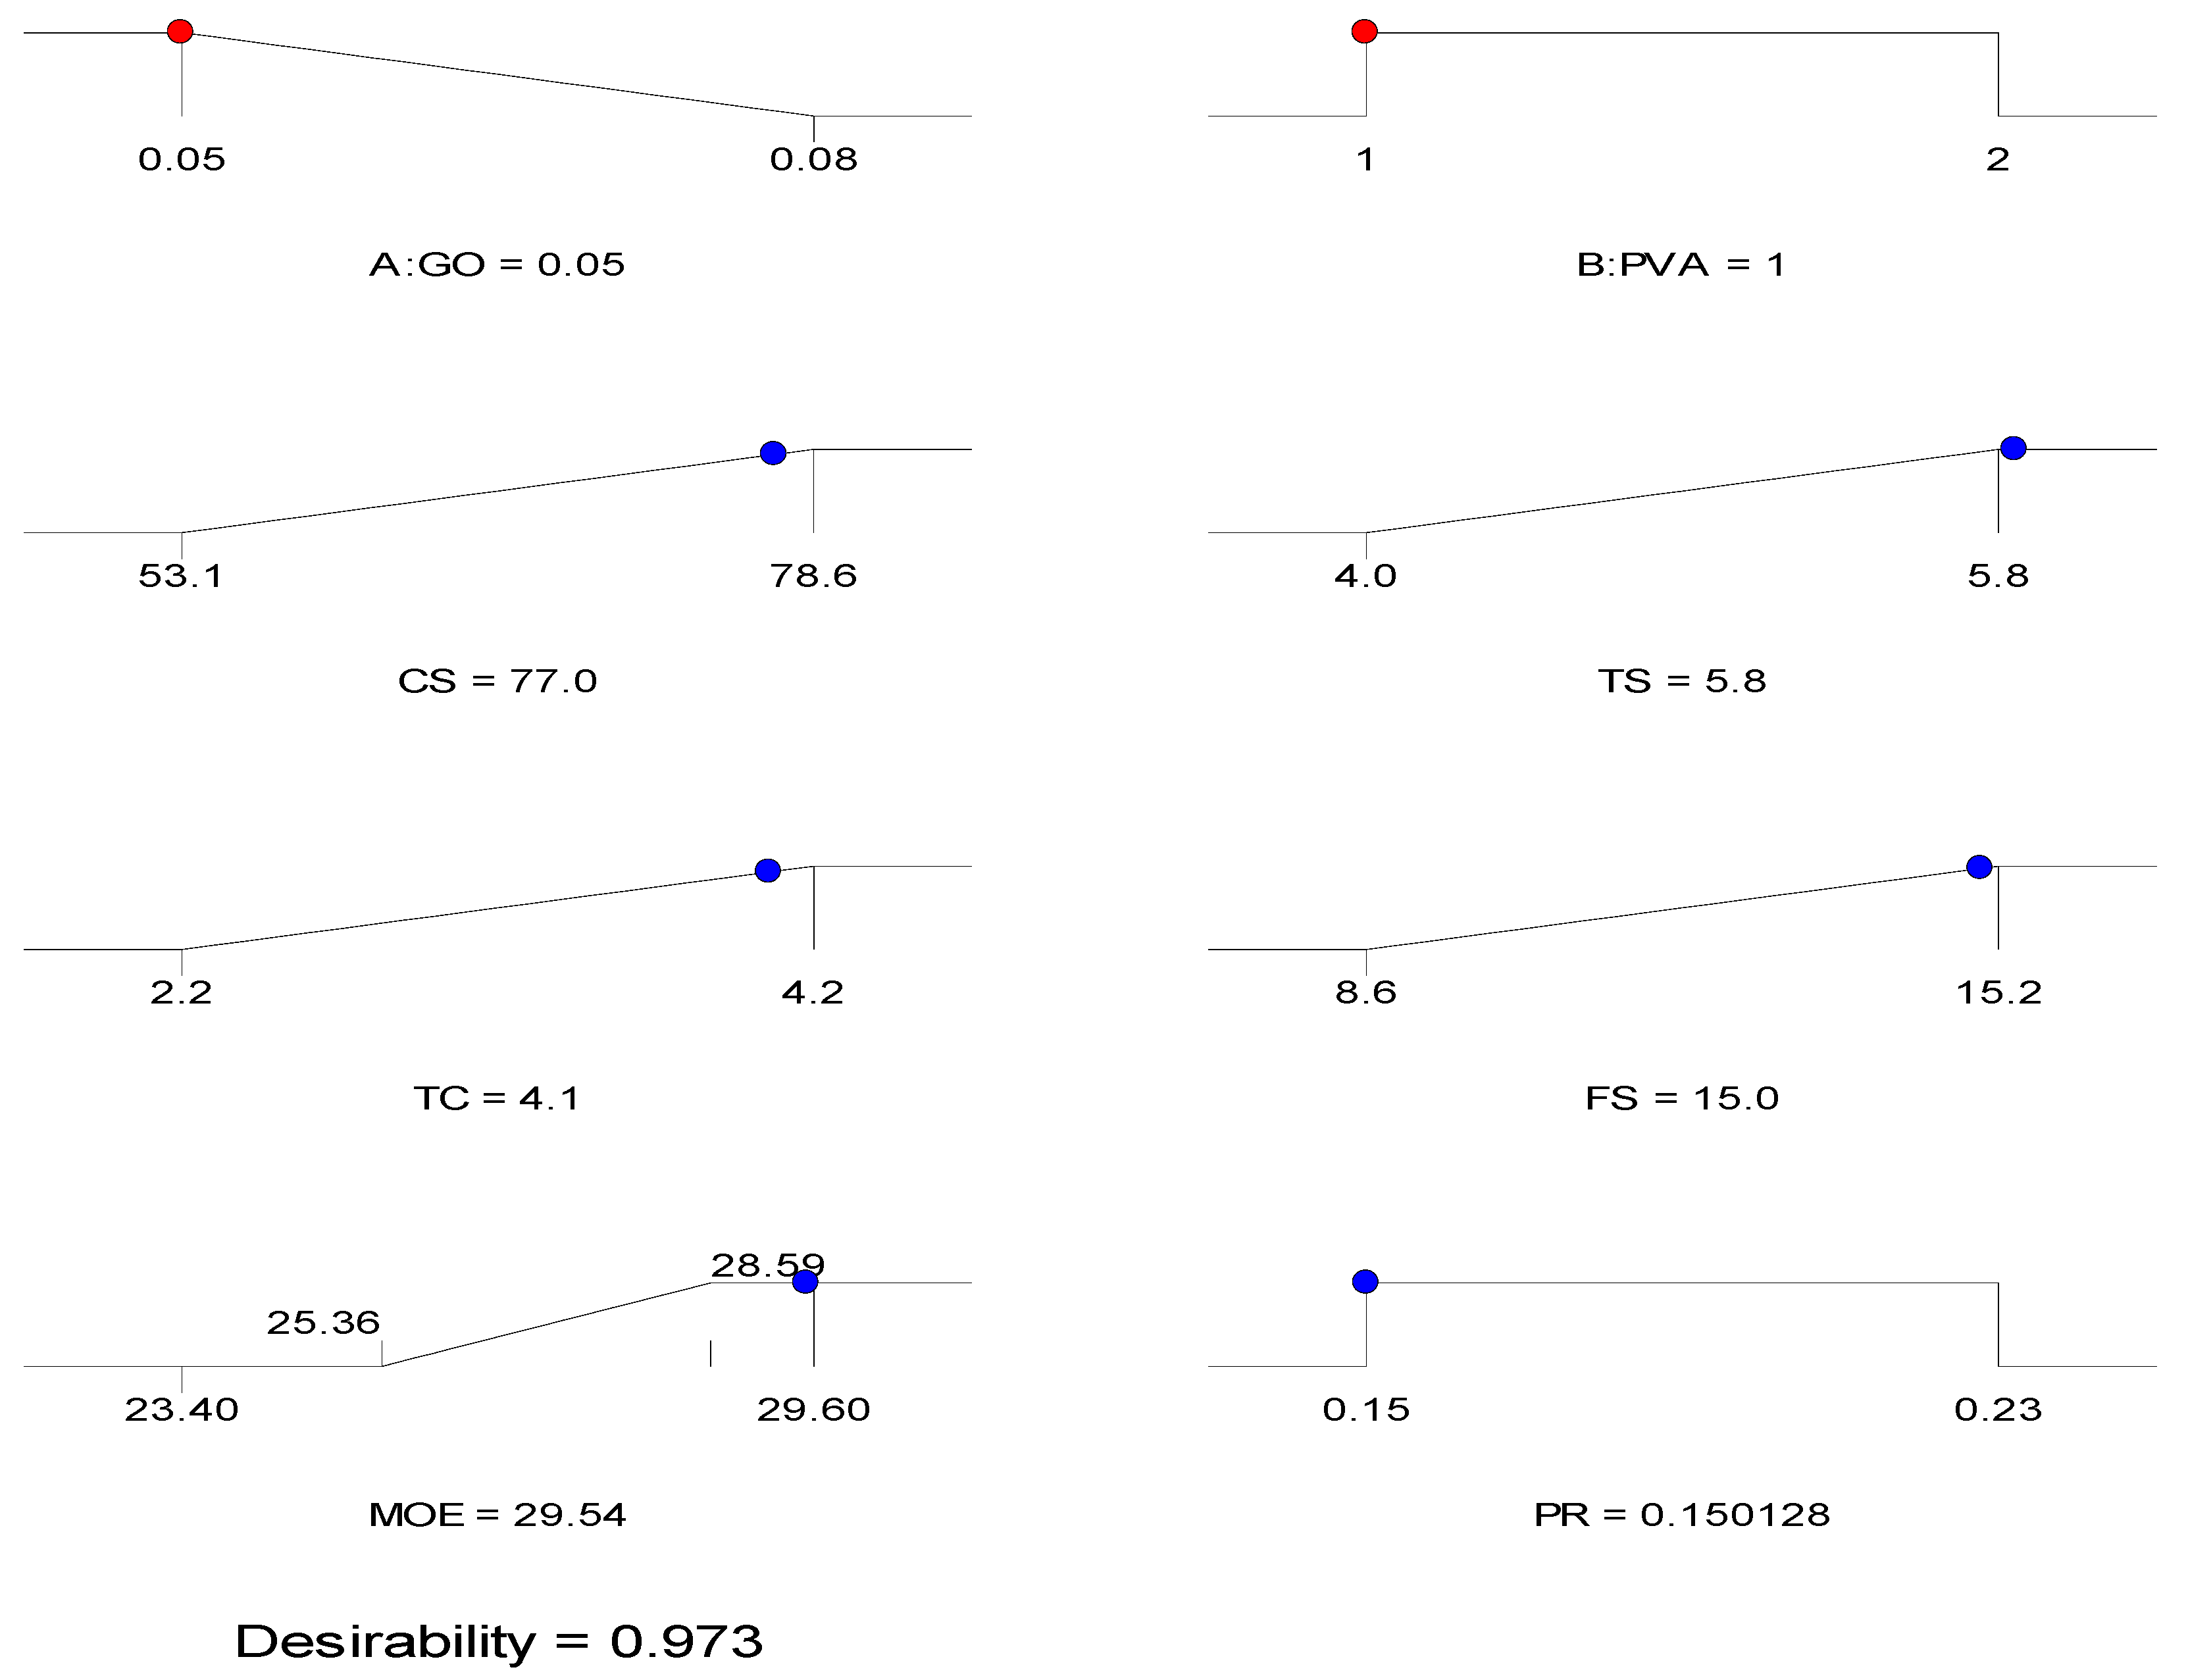
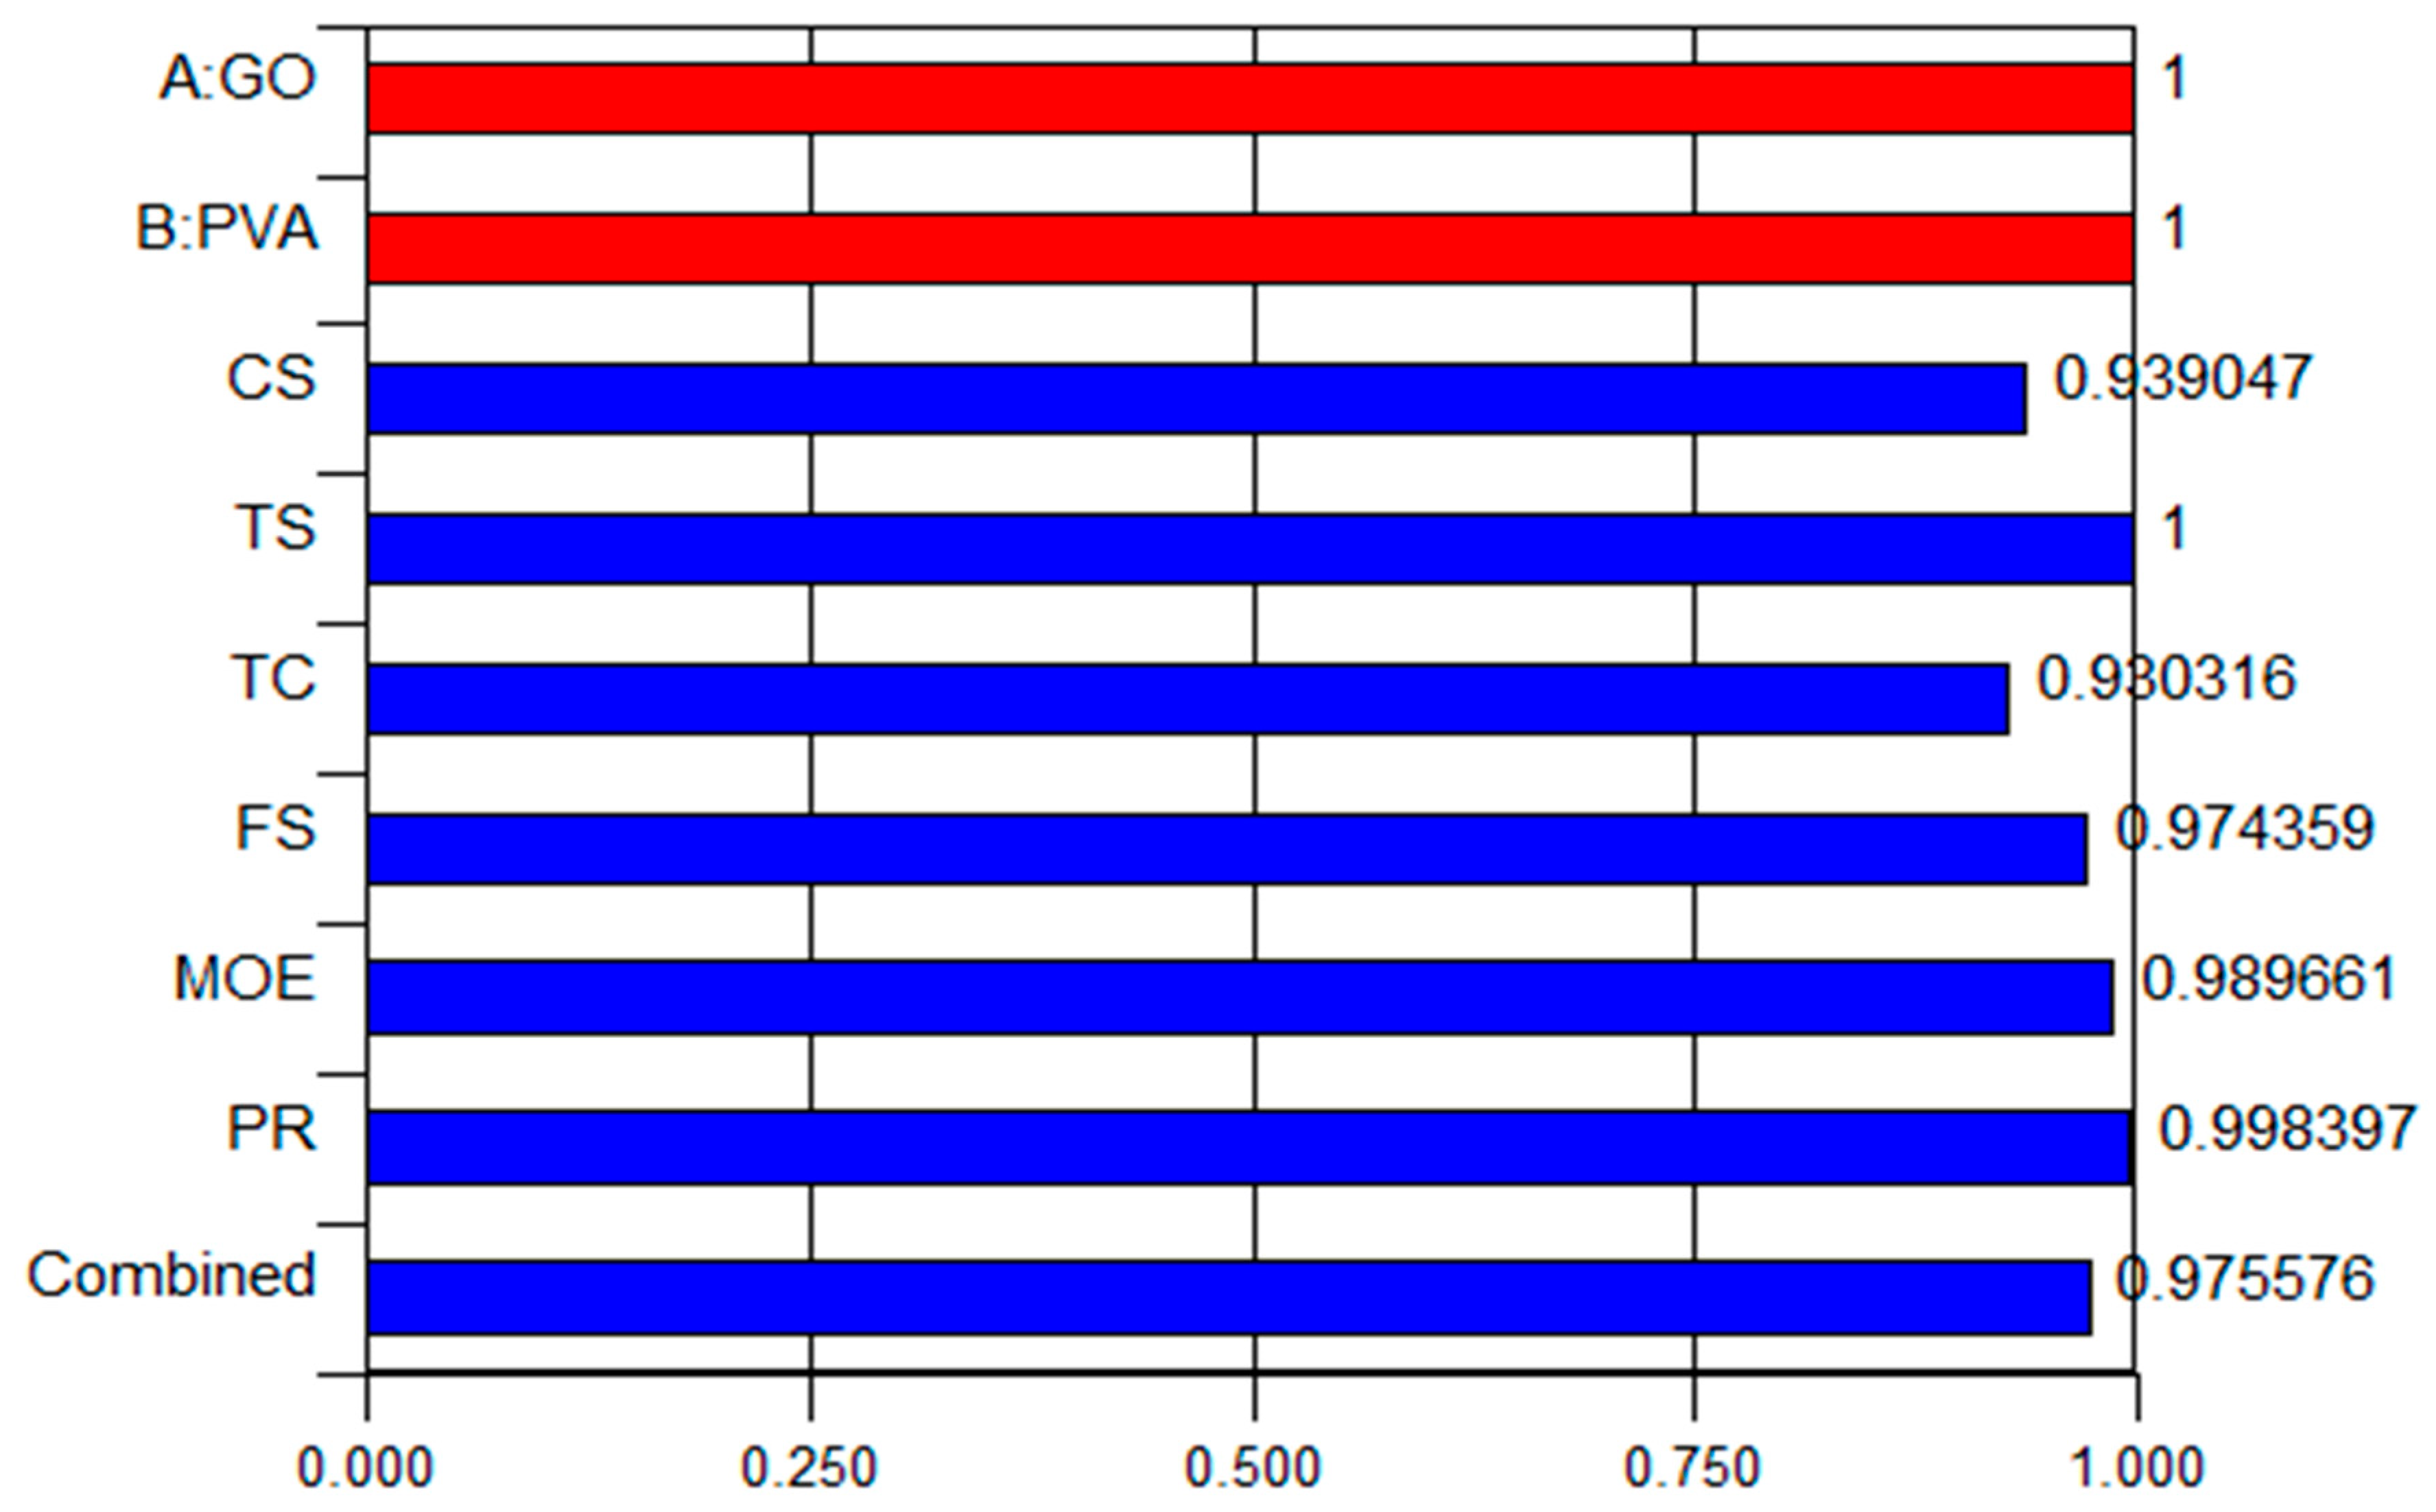
4.3. Multi-Objective Optimization

Optimization aims to produce the desired output at the most optimal levels of the variables. In order to achieve the desired function, objectives are set for the variables (input and output factors), with varying criteria and degrees of importance. The desirability rating (0 ≤ dj ≤ 1) is applied to assess the optimization. The better the outcome, the closer the value is to 1.
In this instance, the optimization’s goal functions were established, as indicated in Table 7, which also shows the results. The result reveals that at optimum input factors levels of 0.05% and 1.0% GO and PVA fiber additions, an optimum CS, TS, TC, FS, MOE, and PR of 77 MPa, 5.8 MPa, 4.1%, 15 MPa, 29.54 GPa, and 0.15 can be produced at a high desirability value of 97%. Figure 20 and Figure 21 show the optimization solution ramps and the desirability results, respectively.

4.4. Experimental Validation

The last phase of the RSM investigation involves the investigational validation of the developed models and the optimization solutions by producing samples using the proposed optimized input variables. For 28 days, the specimens were tested, and the experimental results were compared with the predicted results obtained through the optimization. The experimental error was calculated using Equation (11), and the results are shown in Table 8. It can be observed that the experimental results corresponded very well with the predicted results at a percentage error of less than 10% for all the responses. Thus, the developed Equations (5)–(10) can be used to predict the responses with high accuracy.
δ = ϑ E ϑ P ϑ P × 100 %

5. Conclusions

This study’s goal was to find out how the nanoscale substance graphene oxide, when added to engineered cementitious composites (ECC) containing 1% to 2% PVA fiber, influences the materials’ mechanical characteristics. Several important conclusions from this study were drawn, including:
  • The mechanical characteristics of ECCs, including compressive, tensile, flexural, and tensile capacity, are greatly improved with a 0.05% and 1% addition of GO and PVA fibers, respectively. When 0.05% and 1% PVA fiber additions were used, the compressive, tensile, and flexural strengths increased by 30%, 35%, and 49%, respectively, when compared to the control. However, boosting the GO and PVA fiber fractions over the ideal levels severely harmed the characteristics. Furthermore, all of the mixes demonstrated normal strain-hardening behavior, with tensile capacities ranging from 2.2 to 4.2%.
  • Incorporating 0.05% GO and 1% to 1.5% PVA fiber volume fraction increased the modulus of elasticity and the PR of GO–ECC combinations. With a maximum value of 29.4 GPa, the obtained MOE values were extremely high. The PR values were kept between 0.15 and 0.23, which is a desirable range.
  • With a greater addition of GO, the rate of shrinkage decreased dramatically. The shrinkage values for GO–ECC range from 0.00043 mm to 0.0009 mm, which is significantly less than the shrinkage value for the control sample (0.00122 mm). The drying shrinkage decreases by 66.4% between the control (M0) and the GO–ECC mixture with the smallest drying shrinkage value (M11). Due to the GO’s effect of densification, the matrix’s pore structure is diminished and refined, resulting in a decrease in drying shrinkage.
  • The microstructural properties of the GO–ECC mixes investigated through FESEM and MIP analyses showed an improved and refined microstructure with an increase in the GO. The pore-refining effect through the pore filling and crystallization of hydration products by the GO was attributed to this. However, the MIP results show the growth in the porosity of the mixtures, with a rise in the PVA fiber attributed to the clumping effect and the ITZ openings.
  • The development and validation of response-predictive models applying ANOVA and experimentation. The developed models have a coefficient of determination (R2) values between 70 and 99 percent. Multi-objective optimization determined the optimal input variables for the GO and PVA fibers to be 0.05% and 1%, respectively, with a 97% desirability value.
  • Due to the 2D planar nature of the GO nanosheets, which behave like nanofibers in the composite, a comparatively low content of PVA fiber is required to obtain the optimal GO–ECC properties. This reduces the need for higher fiber content in mixtures.

6. Future Recommendations

  • It has been recommended that the addition of 0.05% of GO as a nanoscale material provides good outcomes for structural applications in the field of civil engineering.
  • The impact of GO on the long-term durability behavior and time-dependent deformations, such as fatigue and the creep behavior of ECCs, must thus be studied.
  • It is also feasible to carry out studies on the chemical interactions and behavior of GO when combined with other additives, such as metakaolin, coconut shell ash, groundnut shell ash, wheat straw ash, and other nanoparticles.

Author Contributions

N.B.: software, validation, investigation, data curation, writing—original draft preparation, and writing—review and editing; B.S.M.: conceptualization, methodology, supervision, funding acquisition, validation, and writing—review and editing; I.A.: methodology, data curing, software, and writing—review and editing; M.S.L.: conceptualization, methodology, supervision, and funding acquisition; N.A.W.A.Z.: conceptualization, supervision, funding acquisition, and validation. All authors have read and agreed to the published version of the manuscript.

Funding

Authors are thankful to Universiti Teknologi Petronas Malaysia for providing the funds for performing this research work under project numbers 015PBC-009 and 015LC0-391.

Data Availability Statement

Not applicable.

Acknowledgments

The authors wish to acknowledge the support of Universiti Teknologi PETRONAS (UTP) Malaysia for funding this work under grant numbers 015PBC-009 and 015LC0-391.

Conflicts of Interest

The authors declare no conflict of interest.

References

  1. Thacker, S.; Adshead, D.; Fay, M.; Hallegatte, S.; Harvey, M.; Meller, H.; O’Regan, N.; Rozenberg, J.; Watkins, G.; Hall, J.W. Infrastructure for Sustainable Development. Nat. Sustain. 2019, 2, 324–331. [Google Scholar] [CrossRef]
  2. Li, V.C. Introduction to Engineered Cementitious Composites (ECC). In Engineered Cementitious Composites (ECC); Springer: Berlin/Heidelberg, Germany, 2019; pp. 1–10. [Google Scholar] [CrossRef]
  3. Ma, H.; Yi, C.; Wu, C. Review and Outlook on Durability of Engineered Cementitious Composite (ECC). Constr. Build. Mater. 2021, 287, 122719. [Google Scholar] [CrossRef]
  4. Singh, S.B.; Munjal, P. Engineered Cementitious Composite and Its Applications. Mater. Today Proc. 2020, 32, 797–802. [Google Scholar] [CrossRef]
  5. Li, V.C. Advancesin ECCresearch. In ACI Special Publication on Concrete; Material Science to Applications: SP 206–23, Ed; American Concrete Institute: Farmington Hills, MI, USA, 2002; pp. 373–400. [Google Scholar]
  6. Li, V.C. On Engineered Cementitious Composites (ECC). A Review of the Material and Its Applications. J. Adv. Concr. Technol. 2003, 1, 215–230. [Google Scholar] [CrossRef] [Green Version]
  7. Wang, Y.; Zhang, Z.; Yu, J.; Xiao, J.; Xu, Q. Using Green Supplementary Materials to Achieve More Ductile ECC. Materials 2019, 12, 858. [Google Scholar] [CrossRef] [Green Version]
  8. Mohammed, B.S.; Achara, B.E.; Nuruddin, M.F.; Yaw, M.; Zulkefli, M.Z. Properties of Nano-Silica-Modified Self-Compacting Engineered Cementitious Composites. J. Clean. Prod. 2017, 162, 1225–1238. [Google Scholar] [CrossRef]
  9. Achara, B.E. Modeling of Properties of Nano-Silica-Modified Self-Consolidating Engineered Cementitious Composites (ECC) Using Response Surface Methodology (RSM). Ph.D. Thesis, Universiti Teknologi PETRONAS (UTP), Seri Iskandar, Malaysia, 2018. [Google Scholar]
  10. Huang, B.T.; Zhu, J.X.; Weng, K.F.; Li, V.C.; Dai, J.G. Ultra-High-Strength Engineered/Strain-Hardening Cementitious Composites (ECC/SHCC): Material Design and Effect of Fiber Hybridization. Cem. Concr. Compos. 2022, 129, 104464. [Google Scholar] [CrossRef]
  11. Yu, J.; Leung, C.K.Y. Strength Improvement of Strain-Hardening Cementitious Composites with Ultrahigh-Volume Fly Ash. J. Mater. Civ. Eng. 2017, 29, 104464. [Google Scholar] [CrossRef]
  12. Mohammed, A.; Al-Saadi, N.T.K.; Sanjayan, J. Inclusion of Graphene Oxide in Cementitious Composites: State-of-the-Art Review. Aust. J. Civ. Eng. 2018, 16, 81–95. [Google Scholar] [CrossRef]
  13. Anwar, A. The Influence of Waste Glass Powder as a Pozzolanic Material in Concrete. Int. J. Civ. Eng. Technol. 2016, 7, 131–148. [Google Scholar]
  14. Siad, H.; Lachemi, M.; Sahmaran, M.; Mesbah, H.A.; Hossain, K.A. Advanced Engineered Cementitious Composites with Combined Self-Sensing and Self-Healing Functionalities. Constr. Build. Mater. 2018, 176, 313–322. [Google Scholar] [CrossRef]
  15. Khan, S.W.; Kamal, M.; Khan, F.A.; Gul, A.; Alam, M.; Shah, F.; Shahzada, K. Performance Evaluation of the Fresh and Hardened Properties of Different PVA-ECC Mixes: An Experimental Approach. Case Stud. Constr. Mater. 2023, 18, e01764. [Google Scholar] [CrossRef]
  16. Dong, Z.; Tan, H.; Yu, J.; Liu, F. A Feasibility Study on Engineered Cementitious Composites Mixed with Coarse Aggregate. Constr. Build. Mater. 2022, 350, 128587. [Google Scholar] [CrossRef]
  17. Fischer, G.; Li, V.C. Deformation Behavior of Fiber-Reinforced Polymer Reinforced Engineered Cementitious Composite (ECC) Flexural Members under Reversed Cyclic Loading Conditions. ACI Struct. J. 2003, 100, 25–35. [Google Scholar] [CrossRef] [Green Version]
  18. Wang, S.; Li, V.C. Engineered Cementitious Composites with High-Volume Fly Ash. ACI Mater. J. 2007, 104, 233–241. [Google Scholar] [CrossRef]
  19. Zahid, M. Development and Mix Design Optimization of Fly Ash Based High Strength Engineered Geopolymer Composite. Ph.D. Thesis, Universiti Teknologi PETRONAS, Seri Iskandar, Malaysia, 2019. [Google Scholar]
  20. Jiang, T.; Cui, K.; Chang, J. Development of Low-Carbon Cement: Carbonation of Compounded C2S by β-C2S and γ-C2S. Cem. Concr. Compos. 2023, 139, 105071. [Google Scholar] [CrossRef]
  21. Wang, Q.; Yi, Y.; Ma, G.; Luo, H. Hybrid Effects of Steel Fibers, Basalt Fibers and Calcium Sulfate on Mechanical Performance of PVA-ECC Containing High-Volume Fly Ash. Cem. Concr. Compos. 2019, 97, 357–368. [Google Scholar] [CrossRef]
  22. Turk, K.; Nehdi, M.L. Coupled Effects of Limestone Powder and High-Volume Fly Ash on Mechanical Properties of ECC. Constr. Build. Mater. 2018, 164, 185–192. [Google Scholar] [CrossRef]
  23. Khed, V.C.; Mohammed, B.S.; Shahir Liew, M.; Alaloul, W.S.; Adamu, M. Hybrid Fibre Rubberized ECC Optimization for Modulus of Elasticity. Int. J. Civ. Eng. Technol. 2018, 9, 918–928. [Google Scholar]
  24. Wang, Z.; Zuo, J.; Zhang, X.; Jiang, G.; Feng, L. Stress-Strain Behaviour of Hybrid-Fibre Engineered Cementitious Composite in Compression. Adv. Cem. Res. 2020, 32, 53–65. [Google Scholar] [CrossRef] [Green Version]
  25. Sridhar, R.; Prasad, R. Study on Mechanical Properties of Hybrid Fiber Reinforced Engineered Cementitious Composites. Rev. Rom. Mater. Rom. J. Mater. 2019, 49, 424–433. [Google Scholar]
  26. Singh, M.; Saini, B.; Chalak, H.D. Appraisal of Hybrid Fiber Reinforced Engineered Cementitious Composite. In Proceedings of the International Conference on Civil, Structural and Transportation Engineering, Ottawa, ON, Canada, 11 June 2019. [Google Scholar]
  27. Liu, W.; Han, J. Experimental Investigation on Compressive Toughness of the PVA-Steel Hybrid Fiber Reinforced Cementitious Composites. Front. Mater. 2019, 6, 108. [Google Scholar] [CrossRef]
  28. Cui, K.; Lu, D.; Jiang, T.; Zhang, J.; Jiang, Z.; Zhang, G.; Chang, J.; Lau, D. Understanding the Role of Carbon Nanotubes in Low Carbon Sulfoaluminate Cement-Based Composite. J. Clean. Prod. 2023, 416, 137843. [Google Scholar] [CrossRef]
  29. Chuah, S.; Pan, Z.; Sanjayan, J.G.; Wang, C.M.; Duan, W.H. Nano Reinforced Cement and Concrete Composites and New Perspective from Graphene Oxide. Constr. Build. Mater. 2014, 73, 113–124. [Google Scholar] [CrossRef]
  30. Pan, Z.; Duan, W.; Li, D.; Collins, F. Graphene Oxide Reinforced Cement and Concrete. WO Patent Application PCT/AU2012/001582, 21 December 2012. [Google Scholar]
  31. Yang, H.; Monasterio, M.; Cui, H.; Han, N. Experimental Study of the Effects of Graphene Oxide on Microstructure and Properties of Cement Paste Composite. Compos. Part A Appl. Sci. Manuf. 2017, 102, 263–272. [Google Scholar] [CrossRef]
  32. Yang, H.; Cui, H.; Tang, W.; Li, Z.; Han, N.; Xing, F. A Critical Review on Research Progress of Graphene/Cement Based Composites. Compos. Part A Appl. Sci. Manuf. 2017, 102, 273–296. [Google Scholar] [CrossRef]
  33. Dong, L.-L.; Chen, W.-G.; Deng, N.; Zheng, C.-H. A Novel Fabrication of Graphene by Chemical Reaction with a Green Reductant. Chem. Eng. J. 2016, 306, 754–762. [Google Scholar] [CrossRef]
  34. Horszczaruk, E.; Mijowska, E.; Kalenczuk, R.J.; Aleksandrzak, M.; Mijowska, S. Nanocomposite of Cement/Graphene Oxide—Impact on Hydration Kinetics and Young’s Modulus. Constr. Build. Mater. 2015, 78, 234–242. [Google Scholar] [CrossRef]
  35. Kuilla, T.; Bhadra, S.; Yao, D.; Kim, N.H.; Bose, S.; Lee, J.H. Recent Advances in Graphene Based Polymer Composites. Prog. Polym. Sci. 2010, 35, 1350–1375. [Google Scholar] [CrossRef]
  36. Wang, Q.; Wang, J.; Lu, C.; Liu, B.; Zhang, K.; Li, C. Influence of Graphene Oxide Additions on the Microstructure and Mechanical Strength of Cement. Carbon N. Y. 2015, 95, 1083–1084. [Google Scholar] [CrossRef]
  37. Mohammed, A.; Sanjayan, J.G.; Duan, W.H.; Nazari, A. Graphene Oxide Impact on Hardened Cement Expressed in Enhanced Freeze–Thaw Resistance. J. Mater. Civ. Eng. 2016, 28, 04016072. [Google Scholar] [CrossRef]
  38. Cui, K.; Chang, J. Hydration, Reinforcing Mechanism, and Macro Performance of Multi-Layer Graphene-Modified Cement Composites. J. Build. Eng. 2022, 57, 104880. [Google Scholar] [CrossRef]
  39. Pathak, A.K.; Borah, M.; Gupta, A.; Yokozeki, T.; Dhakate, S.R. Improved Mechanical Properties of Carbon Fiber/Graphene Oxide-Epoxy Hybrid Composites. Compos. Sci. Technol. 2016, 135, 28–38. [Google Scholar] [CrossRef]
  40. Bagheri, A.; Negahban, E.; Asad, A.; Abbasi, H.A.; Raza, S.M. Graphene Oxide-Incorporated Cementitious Composites: A Thorough Investigation. Mater. Adv. 2022, 3, 9040–9051. [Google Scholar] [CrossRef]
  41. Pu, Y.; Yang, S.; Qi, M.; Sheng, K.; Bi, J.; Fan, F.; Yuan, X. Synergistic Effect of Graphene Oxide and Hydroxylated Graphene on the Enhanced Properties of Cement Composites. RSC Adv. 2022, 12, 26733–26743. [Google Scholar] [CrossRef]
  42. Zheng, Q.; Han, B.; Cui, X.; Yu, X.; Ou, J. Graphene-Engineered Cementitious Composites: Small Makes a Big Impact. Nanomater. Nanotechnol. 2017, 7, 1847980417742304. [Google Scholar] [CrossRef]
  43. Verma, P.; Chowdhury, R.; Chakrabarti, A. Role of Graphene-Based Materials (GO) in Improving Physicochemical Properties of Cementitious Nano-Composites: A Review. J. Mater. Sci. 2021, 56, 19329–19358. [Google Scholar] [CrossRef]
  44. Li, W.; Qu, F.; Dong, W.; Mishra, G.; Shah, S.P. A Comprehensive Review on Self-Sensing Graphene/Cementitious Composites: A Pathway toward next-Generation Smart Concrete. Constr. Build. Mater. 2022, 331, 127284. [Google Scholar] [CrossRef]
  45. Ozbulut, O.E.; Jiang, Z.; Harris, D.K. Exploring Scalable Fabrication of Self-Sensing Cementitious Composites with Graphene Nanoplatelets. Smart Mater. Struct. 2018, 27, 115029. [Google Scholar] [CrossRef]
  46. Hu, Y.G.; Awol, J.F.; Chen, S.; Jiang, J.N.; Pu, X.; Jia, X.; Xu, X.Q. Experimental Study of the Electrical Resistance of Graphene Oxide-Reinforced Cement-Based Composites with Notch or Rebar. J. Build. Eng. 2022, 51, 104331. [Google Scholar] [CrossRef]
  47. Zhang, Z.; Yuvaraj, A.; Di, J.; Qian, S. Matrix Design of Light Weight, High Strength, High Ductility ECC. Constr. Build. Mater. 2019, 210, 188–197. [Google Scholar] [CrossRef]
  48. Abdulkadir, I.; Mohammed, B.S.; Ali, M.O.A.; Liew, M.S. Effects of Graphene Oxide and Crumb Rubber on the Fresh Properties of Self-Compacting Engineered Cementitious Composite Using Response Surface Methodology. Materials 2022, 15, 2519. [Google Scholar] [CrossRef]
  49. Japan Society of Civil Engineers Recommendations for Design and Construction of High Performance Fiber Reinforced Cement Composites with Multiple Fine Cracks (HPFRCC). Concr. Eng. Ser. 2008, 82. Available online: https://books.google.com.my/books?id=3eWRYgEACAAJ (accessed on 28 May 2023).
  50. ASTM C469 Standard Test Method for Static Modulus of Elasticity and Poisson’s Ratio of Concrete in Compression. ASTM Stand. B 2002, 04, 469.
  51. ASTM C157/C157M-08. Standard Test Method for Length Change of Hardened Hydraulic-Cement Mortar and Concrete. ASTM International: West Conshohocken, PA, USA, 2008.
  52. Abdulkadir, I.; Mohammed, B.S.; Liew, M.S.; Wahab, M.M.A. Modelling and Optimization of the Impact Resistance of Graphene Oxide Modified Crumb Rubber-ECC Using Response Surface Methodology. In Proceedings of the IOP Conference Series: Materials Science and Engineering, Guntur, India, 25–26 June 2021; Volume 1197, p. 012043. [Google Scholar]
  53. Nguyen, H.D.; Zhang, Q.; Sagoe-Crentsil, K.; Duan, W. Graphene Oxide-Coated Sand for Improving Performance of Cement Composites. Cem. Concr. Compos. 2021, 124, 104279. [Google Scholar] [CrossRef]
  54. Mowlaei, R.; Lin, J.; Basquiroto de Souza, F.; Fouladi, A.; Habibnejad Korayem, A.; Shamsaei, E.; Duan, W. The Effects of Graphene Oxide-Silica Nanohybrids on the Workability, Hydration, and Mechanical Properties of Portland Cement Paste. Constr. Build. Mater. 2021, 266, 121016. [Google Scholar] [CrossRef]
  55. Shamsaei, E.; de Souza, F.B.; Yao, X.; Benhelal, E.; Akbari, A.; Duan, W. Graphene-Based Nanosheets for Stronger and More Durable Concrete: A Review. Constr. Build. Mater. 2018, 183, 642–660. [Google Scholar] [CrossRef]
  56. Young, R.J.; Liu, M.; Kinloch, I.A.; Li, S.; Zhao, X.; Vallés, C.; Papageorgiou, D.G. The Mechanics of Reinforcement of Polymers by Graphene Nanoplatelets. Compos. Sci. Technol. 2018, 154, 110–116. [Google Scholar] [CrossRef]
  57. Zhao, L.; Guo, X.; Song, L.; Song, Y.; Dai, G.; Liu, J. An Intensive Review on the Role of Graphene Oxide in Cement-Based Materials. Constr. Build. Mater. 2020, 241, 117939. [Google Scholar] [CrossRef]
  58. Abdulkadir, I.; Mohammed, B.S.; Liew, M.S.; Wahab, M.M.A. Modelling and Multi-Objective Optimization of the Fresh and Mechanical Properties of Self-Compacting High Volume Fly Ash ECC (HVFA-ECC) Using Response Surface Methodology (RSM). Case Stud. Constr. Mater. 2021, 14, e00525. [Google Scholar] [CrossRef]
  59. Kang, D.; Seo, K.S.; Lee, H.Y.; Chung, W. Experimental Study on Mechanical Strength of GO-Cement Composites. Constr. Build. Mater. 2017, 131, 303–308. [Google Scholar] [CrossRef]
  60. Devi, S.C.; Khan, R.A. Compressive Strength and Durability Behavior of Graphene Oxide Reinforced Concrete Composites Containing Recycled Concrete Aggregate. J. Build. Eng. 2020, 32, 101800. [Google Scholar] [CrossRef]
  61. Long, W.J.; Li, H.D.; Mei, L.; Li, W.; Xing, F.; Khayat, K.H. Damping Characteristics of PVA Fiber-Reinforced Cementitious Composite Containing High-Volume Fly Ash under Frequency-Temperature Coupling Effects. Cem. Concr. Compos. 2021, 118, 103911. [Google Scholar] [CrossRef]
  62. Li, V.C. Mechanical Properties of Engineered Cementitious Composites (ECC). In Engineered Cementitious Composites (ECC); Springer: Berlin/Heidelberg, Germany, 2019; pp. 101–137. [Google Scholar] [CrossRef]
  63. Yu, K.; Wang, Y.; Yu, J.; Xu, S. A Strain-Hardening Cementitious Composites with the Tensile Capacity up to 8%. Constr. Build. Mater. 2017, 137, 410–419. [Google Scholar] [CrossRef]
  64. Zhu, J.X.; Xu, L.Y.; Huang, B.T.; Weng, K.F.; Dai, J.G. Recent Developments in Engineered/Strain-Hardening Cementitious Composites (ECC/SHCC) with High and Ultra-High Strength. Constr. Build. Mater. 2022, 342, 127956. [Google Scholar] [CrossRef]
  65. Zhu, H.; Yu, K.; Li, V.C. Sprayable Engineered Cementitious Composites (ECC) Using Calcined Clay Limestone Cement (LC3) and PP Fiber. Cem. Concr. Compos. 2021, 115, 103868. [Google Scholar] [CrossRef]
  66. Li, J.; Qiu, J.; Weng, J.; Yang, E.H. Micromechanics of Engineered Cementitious Composites (ECC): A Critical Review and New Insights. Constr. Build. Mater. 2023, 362, 129765. [Google Scholar] [CrossRef]
  67. Lu, C.; Lu, Z.; Li, Z.; Leung, C.K.Y. Effect of Graphene Oxide on the Mechanical Behavior of Strain Hardening Cementitious Composites. Constr. Build. Mater. 2016, 120, 457–464. [Google Scholar] [CrossRef]
  68. Zhang, Z.; Qin, F.; Ma, H.; Xu, L. Tailoring an Impact Resistant Engineered Cementitious Composite (ECC) by Incorporation of Crumb Rubber. Constr. Build. Mater. 2020, 262, 120116. [Google Scholar] [CrossRef]
  69. Li, X.; Wang, L.; Liu, Y.; Li, W.; Dong, B.; Duan, W.H. Dispersion of Graphene Oxide Agglomerates in Cement Paste and Its Effects on Electrical Resistivity and Flexural Strength. Cem. Concr. Compos. 2018, 92, 145–154. [Google Scholar] [CrossRef]
  70. Li, X.; Liu, Y.M.; Li, W.G.; Li, C.Y.; Sanjayan, J.G.; Duan, W.H.; Li, Z. Effects of Graphene Oxide Agglomerates on Workability, Hydration, Microstructure and Compressive Strength of Cement Paste. Constr. Build. Mater. 2017, 145, 402–410. [Google Scholar] [CrossRef]
  71. Zhou, J.; Qian, S.; Ye, G.; Copuroglu, O.; Van Breugel, K.; Li, V.C. Improved Fiber Distribution and Mechanical Properties of Engineered Cementitious Composites by Adjusting the Mixing Sequence. Cem. Concr. Compos. 2012, 34, 342–348. [Google Scholar] [CrossRef]
  72. Ali, M.A.E.M.; Soliman, A.M.; Nehdi, M.L. Hybrid-Fiber Reinforced Engineered Cementitious Composite under Tensile and Impact Loading. Mater. Des. 2017, 117, 139–149. [Google Scholar] [CrossRef]
  73. Khed, V.C.; Mohammed, B.S.; Liew, M.S.; Abdullah Zawawi, N.A.W. Development of Response Surface Models for Self-Compacting Hybrid Fibre Reinforced Rubberized Cementitious Composite. Constr. Build. Mater. 2020, 232, 117191. [Google Scholar] [CrossRef]
  74. Adesina, A.; Das, S. Performance of Engineered Cementitious Composites Incorporating Crumb Rubber as Aggregate. Constr. Build. Mater. 2021, 274, 122033. [Google Scholar] [CrossRef]
  75. Zhang, Z.; Zhang, Q. Matrix Tailoring of Engineered Cementitious Composites (ECC) with Non-Oil-Coated, Low Tensile Strength PVA Fiber. Constr. Build. Mater. 2018, 161, 420–431. [Google Scholar] [CrossRef]
  76. Zhang, J.; Gong, C.; Guo, Z.; Zhang, M. Engineered Cementitious Composite with Characteristic of Low Drying Shrinkage. Cem. Concr. Res. 2009, 39, 303–312. [Google Scholar] [CrossRef]
  77. Li, G.; Zhang, L.W. Microstructure and Phase Transformation of Graphene-Cement Composites under High Temperature. Compos. Part B Eng. 2019, 166, 86–94. [Google Scholar] [CrossRef]
  78. Yu, K.; Li, L.; Yu, J.; Wang, Y.; Ye, J.; Xu, Q.F. Direct Tensile Properties of Engineered Cementitious Composites: A Review. Constr. Build. Mater. 2018, 165, 346–362. [Google Scholar] [CrossRef]
  79. Wei, Z.; Wang, Y.; Qi, M.; Bi, J.; Yang, S.; Yuan, X. The Role of Sucrose on Enhancing Properties of Graphene Oxide Reinforced Cement Composites Containing Fly Ash. Constr. Build. Mater. 2021, 293, 123507. [Google Scholar] [CrossRef]
  80. Manikanta, D.; Ravella, D.P. Mechanical and Durability Characteristics of High Performance Self-Compacting Concrete Containing Flyash, Silica Fume and Graphene Oxide. Mater. Today Proc. 2020, 43, 2361–2367. [Google Scholar] [CrossRef]
  81. Chintalapudi, K.; Pannem, R.M.R. Strength Properties of Graphene Oxide Cement Composites. Mater. Today Proc. 2019, 45, 3971–3975. [Google Scholar] [CrossRef]
Figure 1. (a) Compressive strength test; (b) direct tensile test; (c) flexural properties test.
Buildings 13 02018 g001
Figure 3. Compressive strength of GO–ECC mixes.
Buildings 13 02018 g003
Figure 4. Tensile strength and strain capacity of the GO–ECC mixes.
Buildings 13 02018 g004
Figure 5. Tensile stress–strain curves of some GO–ECC mixes: (a) 1% of PVA fiber; (b) 1.5% of PVA fiber; (c) 2% of PVA fiber.
Buildings 13 02018 g005aBuildings 13 02018 g005b
Figure 6. Flexural strength of GO–ECC mixes.
Buildings 13 02018 g006
Figure 7. Stress-deflection curves for the GO–ECC mixes.
Buildings 13 02018 g007
Figure 8. Modulus of elasticity of GO–ECC mixes.
Buildings 13 02018 g008
Figure 9. Correlation between ME and compressive strength of GO–ECC mixes at 28 days.
Buildings 13 02018 g009
Figure 10. Poisson’s ratio of GO–ECC mixes.
Buildings 13 02018 g010
Figure 11. Drying shrinkage of GO–ECC mixes.
Buildings 13 02018 g011
Figure 12. FESEM images showing the effect of GO on the microstructure of certain selected GO–ECC mixes: (a) M0 (0%GO, 2%PVA); (b) M1 (0.5% GO, 1% PVA); (c) M4 (0.08%GO, 1.5% PVA); (d) M7 (0.05% GO, 2% PVA).
Buildings 13 02018 g012
Figure 13. Pore size distribution curves for GO–ECC mixes for (a) M0, (b) M9, (c) M7, (d) M4, and (e) M13.
Buildings 13 02018 g013aBuildings 13 02018 g013b
Figure 14. (a) Actual vs. predicted plot; (b) 3D contour plot for CS of GO–ECC at 28 days.
Buildings 13 02018 g014
Figure 15. (a) Actual vs. predicted plot; (b) 3D contour plot for TS of GO–ECC at 28 days.
Buildings 13 02018 g015
Figure 16. (a) Actual vs. predicted plot; (b) 3D contour plot for TC of GO–ECC at 28 days.
Buildings 13 02018 g016
Figure 17. (a) Actual vs. predicted plot; (b) 3D contour plot for FS of GO–ECC at 28 days.
Buildings 13 02018 g017
Figure 18. (a) Actual vs. predicted plot; (b) 3D contour plot for MOE of GO–ECC at 28 days.
Buildings 13 02018 g018
Figure 19. (a) Actual vs. predicted plot; (b) 3D contour plot for PR of GO–ECC at 28 days.
Buildings 13 02018 g019
Figure 20. Optimization solution ramps.
Buildings 13 02018 g020
Figure 21. Desirability results of GO–ECC.
Buildings 13 02018 g021
Table 1. Properties of OPC and FA.
MaterialsCompound (%)Specific GravityBlaine Fineness (m2/Kg)Loss on Ignition
SiO2Al2O3Fe2O3MnOCaOMgONa2OK2OT2O
FA57.0120.964.150.0339.791.752.231.530.682.382901.25
Cement20.765.543.35-61.42.480.190.78-3.153252.20
Table 2. Properties of PVA fiber.
TypeGradeLengthDiameterAspect Ratio (l/d)Tensile StrengthModulus of ElasticitySpecific Gravity
PVAREC S-1512 mm40 µm4621600 MPa41 GPa1.3
Table 3. RSM produced mixtures and quantities of ingredients.
Mix IDMaterials (%)Quantity of Materials Used in ECC Mixture (kg/m3)
GOPVAPCFly AshSandWater
M00.002583700467385
M10.051.5583700467385
M20.0652583700467385
M30.0651.5583700467385
M40.081.5583700467385
M50.0651.5583700467385
M60.0651583700467385
M70.052583700467385
M80.0651.5583700467385
M90.051583700467385
M100.0651.5583700467385
M110.081583700467385
M120.0651.5583700467385
M130.082583700467385
Table 4. RSM input factors and responses.
Mix IDInput Factors (%)Responses
A: GOB: PVACS
(MPa)
TS
(MPa)
TC (%)FS
(MPa)
MOE
(GPa)
PR
90.05178.65.84.215.229.60.17
10.051.569.85.6313.728.10.15
70.05266.05.53.312.227.80.2
60.065160.65.13.61227.10.17
30.0651.557.54.72.811.526.70.17
50.0651.559.54.62.711.4270.2
80.0651.557.54.62.811.326.80.19
100.0651.558.54.72.611.326.60.18
120.0651.560.64.82.911.427.10.17
20.065256.44.42.911.525.50.21
110.08158.44.63.49.425.40.19
40.081.556.94.22.59.124.30.22
130.08253.142.28.623.40.23
Table 5. Analysis of variance (ANOVA) results.
ResponseSourceSum of SquaresDfMean SquareF-Valuep-Value > FSignificance
CSModel531.605106.3237.94<0.0001significant
A-GO351.821351.82125.53<0.0001significant
B-PVA81.69181.6929.150.0010significant
AB13.30113.304.750.0658not significant
A270.25170.2525.070.0016significant
B20.1110.110.0390.8487not significant
Residual19.6272.80
Lack of Fit12.6534.222.420.2062not significant
Pure Error6.9741.74
Cor Total551.2212
TSModel3.4750.6997.70<0.0001significant
A-GO2.8012.80394.73<0.0001significant
B-PVA0.4310.4360.110.0001significant
AB0.02210.0223.170.1182not significant
A20.1410.1419.250.0032significant
B20.01410.0142.040.1962not significant
Residual0.05077.098 × 10−3
Lack of Fit0.02237.228 × 10−31.030.4679not significant
Pure Error0.02847.000 × 10−3
Cor Total3.5212
TCModel3.1350.6327.170.0002significant
A-GO0.9610.9641.690.0003significant
B-PVA1.3111.3156.750.0001significant
AB0.02210.0220.980.3558not significant
A21.314 × 10−411.314 × 10−45.705 × 10−30.9419not significant
B20.7110.7130.820.0009significant
Residual0.1670.023
Lack of Fit0.1130.0362.800.1727not significant
Pure Error0.05240.013
Cor Total3.2912
FSModel37.0857.4264.38<0.0001significant
A-GO32.67132.67283.59<0.0001significant
B-PVA3.0813.0826.750.0013significant
AB1.2111.2110.500.0142significant
A20.09210.0920.800.4006not significant
B20.07710.0770.670.4398not significant
Residual0.8170.12
Lack of Fit0.7830.2637.060.0022significant
Pure Error0.02847.0 × 10−3
Cor Total37.8912
MOEModel30.49215.24141.01<0.0001significant
A-GO25.63125.63237.06<0.0001significant
B-PVA4.8614.8644.96<0.0001significant
Residual1.08100.11
Lack of Fit0.9160.153.520.1216not significant
Pure Error0.1740.043
Cor Total31.5712
PRModel4.417 × 10−322.208 × 10−311.310.0027significant
A-GO2.400 × 10−312.40 × 10−312.290.0057significant
B-PVA2.017 × 10−312.017 × 10−310.330.0093significant
Residual1.953 × 10−3101.953 × 10−4
Lack of Fit1.273 × 10−362.121 × 10−41.250.4339not significant
Pure Error6.800 × 10−441.70 × 10⁻⁴
Cor Total6.369 × 10−312
Table 6. Variables for assessment.
Model Verification ConstraintsCSTSTCFSMOEPR
Std. Dev.1.670.0840.150.340.330.014
Mean61.034.822.9911.4326.570.19
C.V. %2.741.755.072.971.247.41
PRESS137.190.261.187.561.643.556 × 10−3
−2 Log Likelihood42.24−35.48−20.180.754.56−77.55
R-Squared0.96440.98590.95100.97870.96580.6934
Adj R-Squared0.93900.97580.91600.96350.95890.6321
Pred R-Squared0.75110.92560.63980.80060.94820.4417
Adeq Precision19.95433.19616.81426.45837.56611.421
BIC57.63−20.09−4.7916.1412.26−69.86
AICc68.24−9.485.8226.7513.23−68.89
Table 7. Multi-objective optimization criteria and solutions.
FactorsInput Factors (%)Responses (Output Factors)
GO (%) PVA (%) CS
(MPa)
TS
(MPa)
TC
(%)
FS
(MPa)
MOE
(GPa)
PR
ValueMin. 0.05 1 53.1 4.0 2.2 8.61 23.36 0.15
Max 0.08 2 78.6 5.8 4.2 15.20 29.59 0.23
Goal Min. In range Max. Max. Max. Max. Max. Min.
Results 0.05 1.0 77.0 5.8 4.1 15 29.54 0.15
Desirability 0.973 (97%)
Table 8. Experimental validation.
ResponseExperimental ResultPredicted ResultPercentage Error (%)
CS (MPa)80.1177.04.0
TS (MPa)6.015.83.6
TC (%)3.84.17.3
FS (MPa)16.215.08.0
MOE (GPa)31.529.47.1
PR0.160.156.6
Disclaimer/Publisher’s Note: The statements, opinions and data contained in all publications are solely those of the individual author(s) and contributor(s) and not of MDPI and/or the editor(s). MDPI and/or the editor(s) disclaim responsibility for any injury to people or property resulting from any ideas, methods, instructions or products referred to in the content.

