Abstract
This paper reports the results of three thin wythe precast sandwich panels tested under axial load. Panel reinforcements and shear connectors in the current state of precast sandwich panels in the civil construction context are evaluated. The authors measured displacement at two distinct panel heights as well as along the panel width to provide load–displacement behavior at the cross-section level and broaden the experimental data on the subject. The test results developed in this research showed good agreement with the results available in the literature. In addition, as concrete-wall panel strength equations have been linked to the compressive behavior of precast sandwich panels, a brief review of empirical formulae is also offered in this paper. Moreover, empirical data since 2005, on both concentrical and eccentrical load testing available in the literature, are also reported.
1. Introduction
Precast concrete sandwich panels (PCSPs) are insulating cladding systems made up of two layers of external concrete wythes and an insulating core material, kept together by concrete webs and connectors. PCSPs are intended to retain, in whole or in part, the mechanical behavior of the layers. Gleich [1] summarizes the progress of the design process of PCPS since the 1960s. The design originally consisted of double-tee sandwich wall panels, fully composite with solid zones. The panels later incorporated metal trusses as connectors, improving conductivity and thermal efficiency with fully composite behavior. Thermal performance was further enhanced by means of non-metallic links in the late 1980s. He [1] stated in 2003 that equilibrium between mechanical and thermal characteristics was first reached through a PCSP developed by the national partnership called AltusGroup. It was not possible to determine when sandwich panels were initially used in the United States, but it has been stated [2] that they have been manufactured in North America for more than 50 years. A Precast/Prestressed Concrete Institute (PCI) state-of-the-art article published in 1991 is acknowledged to have made known and spread the new technology [3]. An initial prototype that influenced the development of the PCSPs is referred to as “tilt-up” panel, which has been used since 1906 by American civil engineers and constructors [4].
The term “sandwich panel” is not exclusive to concrete material associated with insulation cores. The use of sandwich panel technology dates prior to 1960. Such technology was almost entirely limited to aerospace applications, and also found in variations with other materials [5]. There are also structural insulated panels (SIPs) developed and created in the United Kingdom in the 1930s, as well as a manufactured version from 1947 that uses plywood as load-bearing wythes sandwiched with paperboard. There are other SIPs, but PCSPs are now being researched and employed in the civil construction industry due to their benefits, particularly their light weight, manufacturing speed, and load transfer capability [6].
The prefabricated sandwich system has gained interest because of its inherent speed and low cost of construction compared to other systems [7]. As innovative manufacturing methods continue to develop, most academic work has focused on reducing the size and weight of PCSPs, benefiting transportation, installation, and cost. However, the design of thin sandwich panels is complicated by several structural and thermal challenges and future questions, such as steel bridging, optimization of geometry, combined thermal performance of insulations, and maintenance of the composite action of the wythes [8]. From the mechanical point of view, regarding the compressive behavior of the PCSPs, the experimental investigations carried out in the literature have been restricted to the evaluation of panels with wythe thicknesses greater than 35 mm so far. This limit is present in some specimens tested in refs. [9,10]. Another element lacking in the literature is the influence of the aspect ratio of real-scale panels on the mechanical behavior of the PCSPs and the experimental analysis of displacements along the cross-section, as the results obtained to this point have limited themselves to the displacement at one single point in each cross-section. Therefore, it will be fundamental that experimental and numerical models validate the behavior of the sandwich panels under such unfavorable and extreme conditions, both mechanically and physically.
In the context of modeling the mechanical behavior of the PCSPs subjected to axial loads, Benayoune et al. (2005) analyzed six full-scale reinforced PCSPs with different slenderness ratios. In the models, the PCSPs were fixed at the bottom and pinned at the top. The PCCSRs were constructed with steel trusses as shear connectors and modeled using 2D isoparametric finite elements. The results showed at least a 7% difference between experimental and FEM results. The same work demonstrates that general solid concrete wall design formulae are conservative regarding the experimental results obtained [11]. For the same experimental program, other panels with the same geometrical and mechanical properties were tested to evaluate the effect of eccentricity on compressive behavior, for which FEM was able to reach a better agreement than analytical formulae [12]. PCSPs reinforced with steel wire meshes assembled using steel connectors were tested both axially and eccentrically. In addition, empirical evaluation of the diagonal compressive strength of prestressed and transversely stiffened panels was considered to simulate the influence of vertical load and the orthogonal contribution of walls [9]. Foamed concrete (FC), which is a light cellular concrete consisting of either cement paste or mortar, was used as a wythe material in PCSPs. They consisted of polystyrene insulation and were connected to the wythes by inclined, continuous steel truss–shear connectors. The use of FC is justified as an attempt to fulfill modern structural and foundation engineering concerns regarding weight reduction. Isoparametric plane stress elements were used in the FEM model of the wythes, and a total Lagrangian formulation with the Newton–Raphson procedure was used for the nonlinear solutions [13]. Other papers have also evaluated PCSPs built with FC in the wythes under axial load, among other experimental tests. They consisted of orthogonal shear connectors and a welded wire mesh. The results of their experimental tests showed that for both tests carried out, the thickness of the wythes was not critical to failure mode and that a major portion of the axial load was resisted by the wythes. Therefore, the specimens have lost strength right after the formation of cracks [14]. To assess local compressive strength, Carbonari et al. [10] have executed axial compressive tests on small-scale PCSPs composed of varying mortar layers, two of them containing glass fibers and one containing plastic fibers. The first is caused by a combination of compression and bending, and the second by lateral instability when the buckling of connectors takes place. A three-dimensional nonlinear finite element model for precast lightweight foamed concrete sandwich panels (PFLPs) subjected to axial compression using ABAQUS has been proposed by Goh et al. [15]. Each component of the panels was initially independently analyzed and then all layers were assembled. They analyzed concrete damage plasticity of the foamed concrete used as wythes. The work overlooks the role of the insulation layer composed of expanded polystyrene in sustaining load and the authors did not perform any experimental investigation of such material. A 210 mm thick load-bearing panel under eccentric load was tested and modeled three-dimensionally by Alchaar and Abed. The concrete layers were vertically and horizontally reinforced with 8 mm diameter steel wires spaced at 200 mm. A truss-shaped steel connector of 6 mm diameter was used to connect the insulation. The authors have performed a mesh refinement to evaluate the mesh sensitivity of the model [16]. The main objective of this paper is to contribute to the state of the art regarding PCSPs tested in a large scale considering the analysis of displacements along the cross-section.
2. Theory and State of the Art of the Construction Process and Compressive Behavior of PCSPs
2.1. Construction Process of the PCSPs
In practice, a PCSP panel is usually built with an overall thickness of around 300 mm and the weight of the panel area is, approximately, 500 kg/m2. The manufacturing process begins with the construction of a wood or steel formwork, which is then followed by the assembly of a steel reinforcement and concrete casting. Insulation and shear connectors are then placed after the concrete is cast and while the concrete is still fresh [17]. The traditional precast process, although helpful for the quality and speed of construction, poses some challenging issues in terms of the alignment and connection of the PCSPs, as they need to be appropriately erected and connected [7] for the tests.
For small construction sites, it is usual to mark and align the position of the walls and foundations with a system of wood stakes. The central axes of the panels are delimited by a drawn line on top of the load-bearing beam and by the placement of steel bars anchored on them, with bars of 8 mm diameter uniformly spaced throughout the extension of the locations where the walls are placed [18].
Insulation in the sandwich panels is achieved using insulation materials (defined as having a thermal conductivity λ < 0.065 m2/mW). A great part of those materials is filled with air because the base material only occupies a small volume fraction. This fact, along with the characteristic restraint on pores, leads to a poor heat convective process inside the material and low conductivity values [19]. Expanded polystyrene (EPS) is commonly used in panel applications and has properties such as a vapor barrier, thermal insulation, and high impact resistance [20]. The most common insulation types are cellular insulations, as described above, and the gases can be air, chlorofluorocarbon (CFC), and carbon dioxide, amongst others, whereas the insulations themselves are usually expanded polystyrene (EPS), polyurethane, and polyisocyanurate. Regarding the varieties of shear connectors, they are subdivided according to the mechanical behavior reached and whether they transmit shear to the wythes in one or two directions of the panels. When acting over one-way shear, they normally fall into two categories: (1) concentrating on one-way shear connectors, made of small-sized bent bars crossing the insulation layer and are anchored in the wythes; (2) continuous one-way connectors, which can be steel trusses, continuous bent bars, or expanded perforated plate connectors. For two-way shear, which is commonly used, shear connectors can be: (1) crown anchors (bars bent to create a three-dimensional connection); (2) concrete blocks (bridges among the wythes through the concrete material); (3) cylindrical sleeves. Non-composite connectors are considered incapable of transferring shear between wythes. They are usually plastic pins, fiber composite connectors, metal C-ties, continuous welded ladders, and hairpins [2]. Thermal issues have been associated with metal bridging through the shear connectors. Another problem faced is the possible bowing, due to the repeated thermal cycles that take place every day. This can affect mechanical behavior and diminish panel stiffness over time [21]. A validated FE model accounted for thermal bridging as responsible for 71% of the overall heat transfer for thin sample panels. The validation was performed by analyzing panels composed of 20 and 40 mm wythes of fiber-reinforced concrete with embedded vacuum insulation panels (VIPs) and rigid foam insulation elsewhere connected with fiber-reinforced polymer (FRP) connectors. The usual thermal bridging value is around 20% for standard PCPs [22]. Regarding the environmental cost, 38 construction projects in Hong Kong were analyzed over a period of twenty years, with respect to their sustainability performance compared to other constructive processes. The study finds significant positive correlations between the percentage of prefabrication applied onsite and the sustainability attributes [23].
2.2. Concrete Wall Formulae Review
The concrete-wall empirical formulae have been associated with the analysis of the PCSPs since yearly research on the subject began. In this paper, a description of the evolution of the empirical works that have proposed empirical provisions and equations is presented. Concrete wall provisions have been created since the first codes for concrete were published. In fact, incompatibility between theoretical and experimental investigation of concrete structural elements led to one of the first reinforced concrete building code design equations in 1916. Its content is a precursor to modern concrete design. Since those first codes, for example the 1928 ACI Building Code, provisions have been made on the design and limitations of concrete walls. One can mention the upper boundary of the compressive stress allowed in the codes as 0.25 for walls with a height-to-thickness ratio of 10 or less. The evolution of experimental and theoretical investigations in the first works published and the evolution of experimental and theoretical investigations towards the determination of the influence of several factors influencing the one-way resistance of concrete walls are described by Doh et al. [24]. According to him, Seddon (1959) investigated the strength of single and double reinforced walls for small eccentricity (limited to one-third of wall thickness) with slenderness ratios varying from 18 to 54 and a constant aspect ratio (panel height over panel width) of 1.5. Obelender (1973) conducted tests on walls with single and double reinforcement with slenderness ratios from 8 to 28 and varying aspect ratios (1 to 3.5). On the other hand, Pillai and Parthasarathy [25] focused, in 1977, on panels with single-layer reinforcement, also with varying aspect and slenderness ratios (16 to 31.5 and 5 to 30, respectively). All those works included tests with different but normal concrete strengths. In 1977 [26], Kripanarayanan showed that the 1971 ACI Building Code, Equation (1), for the strength design method could be divided into two parts, the first being a function of eccentricity (0.55φ) and the second part a function of slenderness.
Here is the ultimate load in kN, and is the concrete compressive strength in kN/cm2; is the gross cross-sectional area in cm2; H is the wall height in cm; is the wall thickness in cm; and is a dimensionless safety coefficient equal to 0.7 for compression members.
Kripanarayanan [26] observed that the current code equation was a reasonable approximation for slenderness values of less than 12, but overestimated resistance to larger slenderness ratios. A new equation was proposed, suggesting the addition of a factor k representing the influence of support conditions, which is represented in Equation (2) [24,26]. Such an equation is the foundation for the standard modern equation for wall design, presented in ACI-318 [27]. is the ultimate load in kN; is the concrete compressive strength in kN/cm2; is the gross cross-sectional area in cm2; k is a coefficient equal to 0.8 for walls restrained against rotation, and equal to 1 for walls not restrained against rotation; H is the wall clear height in cm; is the length of the compression member, measured center-to-center of the joints, in cm; and is a dimensionless safety coefficient equal to 0.7 for compression members.
The other two equations are presented as formulations proposed for concrete walls and presented in [11], as they are applied to the panels tested in this work in further sections, where H is the wall height in cm; t is the wall thickness in cm; is the characteristic cube strength of concrete in kN/cm2; is the gross concrete area in cm2; and, finally, is the ultimate resistant load in kN. This equation is attributed to Leabu.
The equation proposed by Saheb and Desayi (shown below) suggests two different expressions, depending on the value of the aspect ratio (H/L), with the first one for aspect ratios smaller than 2 and the second one for aspect ratios greater than or equal to 2. The use of the equation is limited to eccentricities smaller than or equal to one-sixth of the wall thickness and slenderness ratio (H/t) ≤ 32. H is the wall height in cm; t is the wall thickness in cm; L is the wall width in cmis a dimensionless safety coefficient equal to 0.7 for compression members; is the characteristic cube strength of concrete in kN/cm2; is the yield strength of steel reinforcement in kN/cm2; is the gross concrete area in cm2; is the area of compression steel in cm2; k is a coefficient associated to the support conditions and equal to l for walls unrestrained against rotation and equal to 0.8 to walls restrained against rotation; and, finally, is the ultimate resistant load in kN.
2.3. Mechanical Compressive Behavior of PCSPs
Regarding the resistance of PCSPs under axial load, the experimental analyses developed so far dealt with a wide range of parameters, such as the type of shear connector reinforcement, wythe reinforcement, concrete strength, geometrical properties (slenderness ratio, aspect ratio), and condition of load application (with or without eccentricity). A graphical compilation of the experimental data does not necessarily show the information gathered thoroughly. However, associated with a further description of the results, it is a powerful analysis tool. Therefore, in Figure 1, a set of points represents the results compiled from [9,10,12,13,14,28,29]. In that Figure, the mortar compressive strength used in [12] was obtained by testing cube specimens, resulting in a 31.8 MPa concrete strength. For the results in [10], the micro-concrete compressive strength was also obtained from a test on cube specimens (70 mm of edge), and the average concrete strength, at 28 days of cure, was found to be 44 MPa. The mortar used in the wythes had a compressive strength of 25 MPa. In [9], concrete resistance was obtained through both prismatic specimens as well as specimens extracted after concrete casting of the wythes (cored ones). The average resistances obtained were 21.95 MPa (prismatic specimens) and 25.10 MPa (cored specimens). In [13], foamed concrete was used in the wythes, with a mean compressive resistance of 24.83 MPa, while the reference panels, built with normal concrete in order to compare both panel results, had a compressive strength equal to 26.66 MPa. In [28,29], the same experimental data was used; therefore only [28] is presented in Figure 1. The sandwich panels tested in those works had foamed concrete strength of the same strength as the one used in [13], but different geometrical configurations. Figure 1 shows the influence of the slenderness ratio on the ultimate load. The ultimate load of the panels is shown per unit of width meter of the panel to better represent the data, as the different experimental analyses built panels with various widths. Small-scale panels tested in [10] are considered in the figure because of the wide variation in the mortar, EPS (expanded polystyrene), and wythe thickness and the consequent large scatter of that data. The results that investigated the influence of the eccentricity of the applied load on compressive behavior are displayed separately in Figure 2.
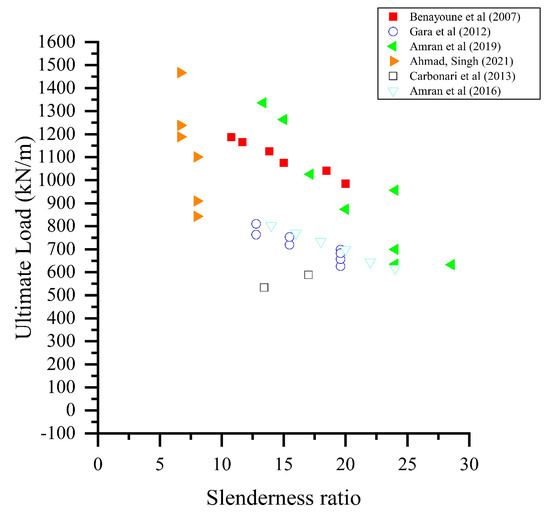
Figure 1.
Experimental data compilation on axially loaded PCSPs [9,10,11,13,14,29].
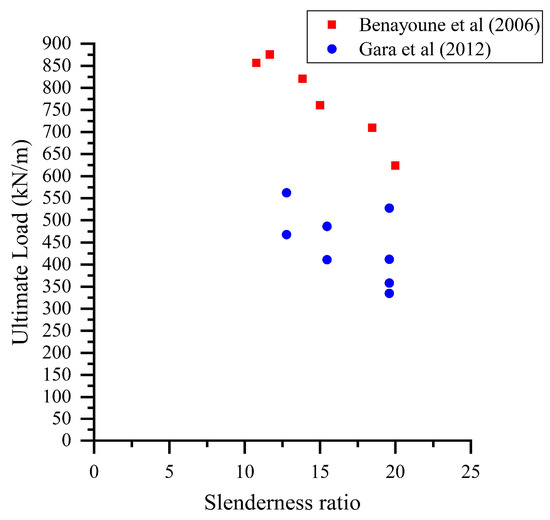
Figure 2.
Experimental data compilation on eccentrically loaded PCSPs [9,12].
Even though not presented in Figure 1, the data from small-scale panels tested by Carbonari et al. [10] observed that the strength of those panels increases with the increase in mortar strength and with a decrease in panel thickness [10]. In the case of axially loaded panels, there is evidence [11,28] that both wythes behaved in a fully or nearly fully composite way until significant cracking occurred. This observation is made due to the presence of small discontinuities in strain in measurements of extensometers for the panels with slenderness ratios greater than 10. For the panels with smaller slenderness ratios, the authors [12,14] claim that visual inspection showed no gaps between wythes and insulation core.
Comparatively, it is interesting to note that the use of steel shear connectors is less efficient than reinforced polymer fiber trusses from the point of view of the degree of composition generated between the layers of the panels. As for the use of the insulating material, a higher shear flow has been observed with the use of EPS, such as extruded polystyrene (XPS—extruded polystyrene insulation). In trials to assess the grade of composition in panels with fiberglass connectors with loadings simulating wind suction [30], the cracking loads ranged from approximately 43.6% of the ultimate load to 81.3% of the ultimate load [12,28,29].
In the case of the eccentrically loaded panels, two studies present comparisons between panels of the same dimensions, reinforcements, and mortar strength, but loaded under axial and eccentric loads. The results show that the failure load decreased by approximately 30% for slenderness ratios from 10.8 to 20, for eccentrically loaded panels compared to axially loaded panels [11,12]. Another study shows a decrease in ultimate load ranging from approximately 33% to 49%, for panels loaded eccentrically compared to panels loaded axially [9]. The data presented in Figure 2 are of the eccentric panels tested in [9,12]. They had respective concrete strengths of 31.8 MPa and 21.95 MPa.
As some experimental tests of PCSPs started to be carried out and presented in the literature, some empirical equations were proposed. Here, two of those equations are shown, which are then applied to the geometrical and mechanical characteristics of the panels tested in this work, as a way to compare the validity of them to the experimental data obtained here. The first one is found in the work of Benayoune et al. [11], and the second one is extracted from [14], Equation (3), where H is the wall height in cm; t is the wall thickness in cm; is the characteristic cube strength of concrete in kN/cm2; is the yield strength of steel reinforcement in kN/cm2; is the gross concrete area in cm2; is the area of compression steel in cm2; k is a coefficient associated to the support conditions and equal to 1 for walls unrestrained against rotation and equal to 0.8 to walls restrained against rotation; and, finally, is the ultimate resistant load in kN.
3. Experimental Analyses and Methods
3.1. Materials
A welded galvanized steel wire mesh of 3.6 mm diameter wires in squared mesh of 15 by 15 mm spacing was used as the longitudinal and transverse reinforcement of both wythes. The wire mesh described was connected to the insulation core by means of steel connectors made of steel with different mechanical properties as the wire mesh. They were 5.0 mm in diameter anchored at the ends in the steel wire mesh and spaced by 30 cm in both directions. A total number of 16 steel shear connectors were used for each square meter of the panel. The insulation core material was EPS with 0.14 kN/m3 of nominal density. The wythes were composed of mortar with a 1:2 cement-to-sand ratio. The cement used was a Portland cement named CPII-Z32, according to the classification and the criteria presented in the Brazilian standard [31]. The mortar was produced in concrete mixers, and the panels were cast in place. Six cylindrical mortar specimens were collected and subjected to cure in order to determine the mortar compressive strength of the wythes. No additive was used in the mortars. The panels were built in the following steps: (1) positioning and distribution of the steel wire mesh; (2) placement of the steel shear connector bars, maintaining the proper concrete cover; (3) mortar cast of inner wythe, and further cast of the mortar in the outer wythe; (4) transportation of the panels to the loading lab frame with an overhead crane, after the mortar of the wythes has been cured for 28 days.
At the age of 28 days, tests showed that the mortar compression strength was 25.10 MPa. The material properties of the concrete used in the wythes were also tested at an age of 28 days. The engineering properties of the wire square grid made of welded galvanized steel are presented in Table 1.

Table 1.
Welded steel wire mesh mechanical properties.
Two concrete beams were cast, one at the bottom and the other at the top of the panel. Such beams were conceived to provide better distribution of the loads, in conformity with previous experimental works [9,11,12]. Both concrete beams were reinforced longitudinally with 4 steel bars of 10 mm diameter, and a total of 11 stirrups of 5 mm diameter steel bars. The mechanical properties of the reinforcements are presented in Table 2.

Table 2.
Mechanical properties of the bars for the longitudinal reinforcement and stirrups.
3.2. Panel Geometry
A series of three full-scale precast sandwich panel specimens were built and tested under axial load. The panels tested had a single geometrical configuration, as presented in detail in Table 3. For the experimental tests, a centered axial load was applied at the top of the three panels (named PA1, PA2, PA3).

Table 3.
Specimens tested.
In Table 3, H is the panel height; B the width; t the overall thickness; the thickness of each concrete wythe; the thickness of the insulation layer; c the concrete cover; (H/B) the aspect ratio; and (H/t) the slenderness ratio.
3.3. Experimental Setup
The instrumentation made use of 5 LVDTs (linear variable differential transformer) at each wythe, connected to the software Catman version 5.6.1 from HBM. The details on the capping beam at both ends of each panel, as well as the details on the reinforcement of the panels, are shown in Figure 3. All LVDTs are designated according to their position as shown in Figure 4a and by a letter, which stands for whether the designated LVDT was positioned in the inner or outer wythe (letter I and O, respectively). After manufacturing the PCSPs, they were transported to and assembled under the reaction frame, Figure 4b. At the reaction frame site, the foundations were solid built, and the ground carefully leveled. The specimens tested were restrained to horizontal displacement and unrestrained to rotation at the height of the base at the top cap beam, by the positioning of two hinges, as shown in Figure 4c, and unrestrained to rotation at the bottom. The bottom of the specimens was placed over a strong floor and on a 2 cm plaster layer. Figure 4b shows a front view of the experimental setup.
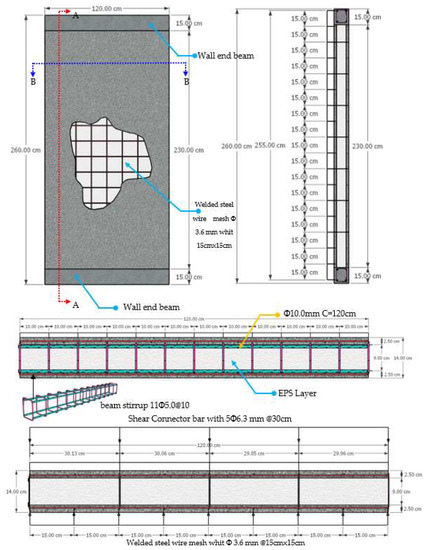
Figure 3.
Details of reinforcement of the panels tested. Visualization of the wall with steel wires, with all measurements in centimeters.
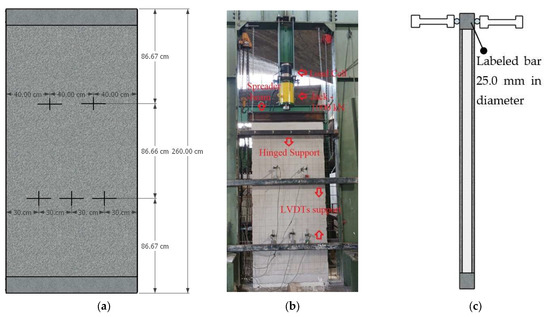
Figure 4.
Experimental setup of the panel: (a) Position of the LVDTs. (b) Reaction frame front-view with transverse bars holding the LVDTs. (c) Detail on the hinged supports at the top of the experimental panel.
4. Results and Discussion
4.1. Load–Displacement Curves for Panels’ LVDTs
Figure 5, Figure 6, Figure 7, Figure 8 and Figure 9 present the load deflection curves for the specimens PA1 through PA3 for data acquired using the LVDTs at the positions shown in Figure 4a. Those measured displacements regard the horizontal movement of each panel, being presented versus load for each LVDT. The nomenclature in the legend of the figures was created to designate the position of the displacement measured, the panel tested, and the given wythe for which the displacement was recorded. These are represented, respectively, by the number from 1 to 5, the letter O (for outer wythe) or I (for inner wythe), and panel PA plus the number of the specimen tested. The largest displacements observed for the LVDTs at 1/3 of panel 2 height differ in the order of 4 mm, as the displacements registered in the inner wythe extend to 10 mm, while only reaching 6 mm at the outer wythes. The load response for panel 2 is noticeably linear to approximately 300 kN, which represents about 50% of the panel strength. Then, one notices the presence of a nonlinear response until failure loads. For the outer wythes of panel 2, it is observed that LVDT 3 continues to displace in the negative direction. However, for the same LVDT at the inner wythe, Figure 5 shows that the displacement was kept constant while the load increased in the final part of the response curve until the ultimate load was reached.
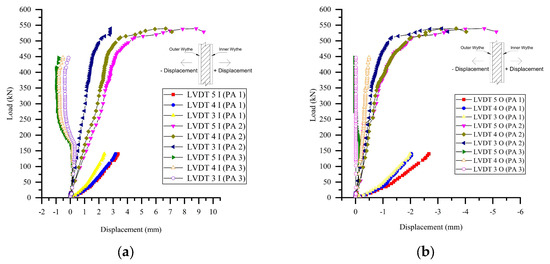
Figure 5.
Load–deflection response of LVDTs at 1/3 of height (LVDTs 3, 4 and 5). (a) Response at inner wythe LVDTs. (b) Response at outer wythe LVDTs.
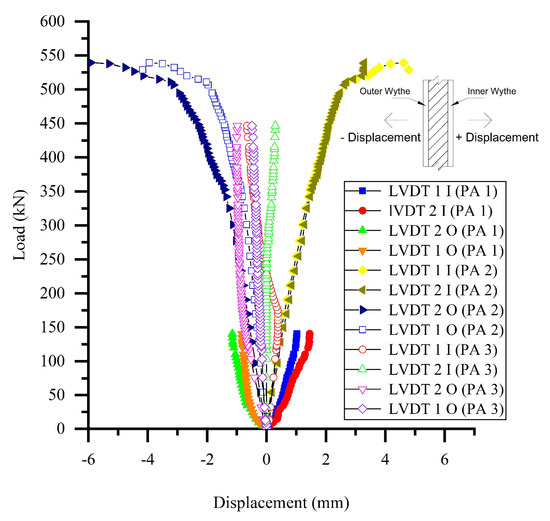
Figure 6.
Load–displacement response for LVDTs at 2/3 of panel height.
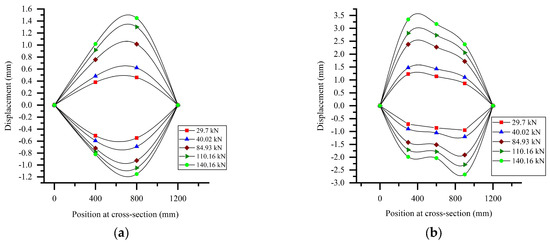
Figure 7.
Cross-section displacements for panel PA1. (a) At the cross-section of 2/3 of panel height (LVDTs 1, 2). (b) At the cross-section of 1/3 of panel height (LVDTs 3, 4 and 5).
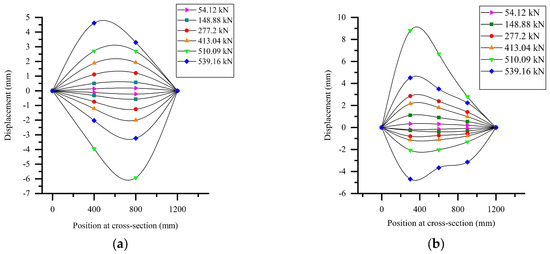
Figure 8.
Cross-section displacements for panel PA2. (a) At the cross-section of 2/3 of panel height (LVDTs 1, 2). (b) At the cross-section of 1/3 of panel height (LVDTs 3, 4 and 5).
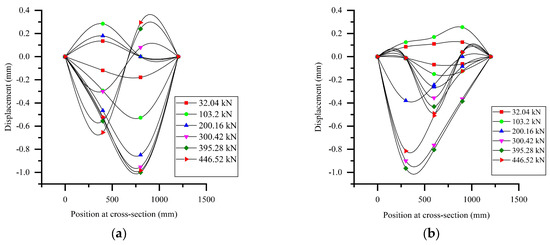
Figure 9.
Cross-section displacements for panel PA3. (a) At the cross-section of 2/3 of panel height (LVDTs 1, 2). (b) At the cross-section of 1/3 of panel height (LVDTs 3, 4 and 5).
Comparing the largest values of displacements in both wythes for panel 2, one notices that the difference between them is not negligible and approaches 4 mm. This tendency has not been seen in the articles in the literature who have made measurements of load–displacement profile. For example, [11] presents, in Figure 7 of that work, a compilation of lateral deflection for several loads. In this figure, the largest displacements (compiled for panel PA5 of this work) reaches approximately 10 mm for both wythes, yet the displacement profile is kept symmetrical. One reason for this may be the fact that, as the wythes were cast one after the other, it was necessary to wait for one wythe to harden, before turning the panel and casting the other wythe. This slight difference in age of wythes may be responsible for the generation of mortar layers with different resistances, which may cause the panels to laterally displace in an uneven way. The uneven propagation of cracks in the wythes may also have played a role in this fact. Another possible cause of this might be the presence of eccentricities in load applications, even though [11,12] tested same experimental analysis under axial and eccentric load and did not observe differences in displacement from one wythe to the other, just an increase in panel displacement, when loaded eccentrically. In [9], the same specimens were used in both loading cases, yet the authors only recorded the displacements in one wythe. The results for mid-height displacement show little difference in total displacements for the panels with 8 mm thickness, but the panels with 12 and 16 mm thickness EPS cores showed about 10 mm more displacements for the panels eccentrically loaded, at mid-height. Interestingly, the panel with a non-ondulated EPS core and the one with half the number of shear connectors also did not show significant differences in displacement for the two cases of load application [9].
For the first panel, the displacements measured have notably increased faster than in the cases of the other two specimens tested. The load–displacement curves for 1/3 of the panel height are observed to be linear and resemble a bilinear curve response, whose second linear part starts at around 25 kN.
At last, the behavior at 1/3 of the panel height is observed to be linear in the outer wythe for the third panel tested, but some nonlinearity is noticed for the displacement curves at this height for the inner wythe. In Figure 6, the inner and outer behavior of all panels shows a high degree of composite action at those sections, as the displacements observed are clearly symmetric.
4.2. Load–Deflection Response at Cross-Section Level
The results in Figure 7, Figure 8 and Figure 9 are assembled in a more appropriate manner to illustrate displacements at the cross-sectional level. The figures are presented here as a way to determine the level of displacement and rotation of the cross-sections of the panels tested at different loads. One can observe the difference in the shape of deformation in general at 2/3 and 1/3 of the height of the cross-sections. For the first panel, increasing load led to displacements directed outward from the wythes. It can be seen that the displacements in Figure 7a for the right LVDT (at 800 mm) were slightly bigger than those at the left, but for Figure 7b this behavior shifts and the biggest displacements were measured at the left part of the section (at 300 mm), for the positive displacements, but remained bigger at the right side of the section (at 900 mm) for negative displacements. It is also noticed that the displacements in Figure 7b are approximately double compared to Figure 7a.
As the LVDTs were removed just after the first crack due to caution with the experimental material, as it was not known whether the rupture would damage the equipment, the displacements for the first panel were limited to a load far from its ultimate load. However, it is noticeable that the displacements at the first third of the height are larger than the ones at the top third of the height. In [6,13,29] the authors also recorded the load–displacement profile along all the height of the panels tested. For this profile for the panel GA1, in [13], which had slenderness ratio equal to 14, the displacement observed in the bottom third of the height displaced more than the rest of the panel for the initial loads, but this behavior changed for higher loads, that is, the greatest displacements were closer to the top of the panel. This was also the case for the panel PA5 (slenderness ratio of 18.46), in [11]. However, for all other panels in [6,13,29], the load–displacements profile shows that the largest displacements are closer to the top the of panels from the beginning of loading. For the panel PA1, tested in this research, the tendency observed could not be compared to the ones described above. This panel showed that for the initial loads the largest displacements were found in the first third of panel height, close to the bottom of panel. However, as the LVDTs were removed as the first crack appeared, it was not possible to conclude whether the largest displacements continued at the first third of panel height or turned to the third of the height closer to the top of the panel.
In Figure 8, it can be seen that for the load close to failure, as the curves for 510.09 kN and for 539.16 kN display, the positive displacements decrease while the magnitude of the negative displacements keeps increasing. This may be due to the accommodation of the specimen after or close to failure. For the cross-section at 1/3 of the panel height, the positive displacements are larger. However, the negative displacements decrease, compared to the other section in Figure 8a.
The second panel tested, PA2, contradicts the general tendency mentioned above, that the largest displacements are observed closer to the top of the panel (even when they are larger for the bottom third for the initial load, it was noticed that they become large at the top for higher loads). For panel PA2, except for the accommodation described above after rupture, the largest displacements are found in the bottom third of the panel. As observed in those articles, the hinged support is placed at the top of the panels. In this paper, the hinged support at the top was placed at a height corresponding to the base of the top concrete beam used to distribute the load. As the concrete beam is stiffer than the panel, the presence of such concrete beams at top should make the panel displace less close to the top of panel. This explanation seems to correspond to reality, as the panels of [11] did not have concrete beams at the top, therefore followed this tendency (higher displacements close to top of panel) the same way as the panels of [6,13,29], which also did not have concrete beams at top, but the lateral deflection profile presented by [9] shows larger displacements close to the mid-height of the panel, as they were cast with concrete beams at top and bottom of the panel. Therefore, it is reasonable that the largest displacements found in this paper were close to the third of the height close to the bottom of the panels. This is also corroborated by the fact that the tests carried out in the present work did not include steel sections attached to the bottom of panels to create the support below, yet there was a layer of plaster with 2 cm thickness, between the bottom of the panels and the strong floor of the laboratory. This layer of plaster may be less stiff than the other supports used in the other experimental tests in the literature, therefore allowing the sandwich panel to displace more freely close to it.
For the third specimen tested, it is possible to observe, in Figure 9, a rotation at both cross-sections analyzed. Even though this rotation increases with a positive increment of the load, the magnitude of the displacements measured is negligible.
4.3. Crack Pattern and Failure Modes
The crack pattern of the panels tested was marked up with ink along with the application of load. The ink marks for the cracks were added as the cracks appeared. The corresponding load value (in kN) was also annotated just at the beginning of the crack growth, marked next to it. For the first panel, PA1, vertical cracks appeared with an applied load of 158 kN. Until collapse, cracks initiated with 158 kN continued to extend themselves in both vertical directions. This was not noticed for the other panels, as they were visibly cracked only after the collapse. For the first panel, the pattern after failure was formed by a series of vertical and horizontal cracks encountering themselves and forming differently sized rectangular shapes. Before failure, those vertical cracks were the only ones present in panel PA1. The post-failure crack behavior of the other panels was similar to the one described above, even though for the second and third panels tested, PA2 and PA3, the shape, size, and distribution formed by them were not as defined as for the first panel. Figure 10 shows the final aspect of the EPS after crushing of panel PA1.
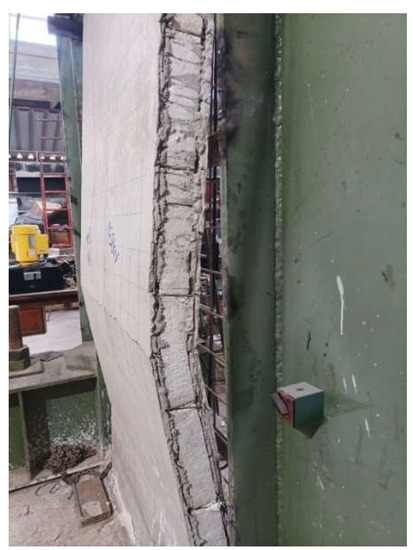
Figure 10.
EPS visual inspection after failure of panel.
The failures observed for all specimens were brittle, sudden, and horizontal cracks that extended through the whole width of the wythes and at two different heights. Regarding the position of the lower cracks, some formed above the cap beam at the panel’s lower bottom, as observed for panels 1 and 3, with no concrete crushing at the cap beam. However, for panel 2, the concrete crushed at the cap beams. Figure 11 displays the right-hand side of the panels after testing, with the top one panel PA1, the middle one panel PA2, and the bottom one panel PA3. On the top surface, none of the panels presented crushing in the wythes or the cap beams. Figure 12 shows the crack pattern at the most cracked wythe for each panel. In Figure 12a, it happened on the inner wythe, while for Figure 12b,c, which represent panels PA2 and PA3 it happened in the outer wythes. Figure 13 shows the aspect of the panels for the wythes not apparent in Figure 12. Therefore, Figure 13a presents the inner wythe of panel PA1, 13b the outer wythe of panel PA2, and Figure 13c shows the outer wythe for panel PA3. Table 4 displays the first crack values for the panels as well as the load values at the appearance of the fracture. Updated results on axially loaded PCSPs in Figure 14 also show data of this paper. At the end of the section, Figure 15 is presented, with the results from Equation (2) to Equation (7) applied to the geometrical and mechanical characteristics of the panels tested in this work and for varying slenderness ratios maintaining the overall thicknesses and the reinforcements displayed in Figure 3. The results show accordance to the fact that Equation (2), from ACI, remains conservative for the experimental results of PCSPs (33.63 percent less than the mean experimental strength), as also concluded in [11]. Equation (4) was also demonstrated to give conservative results (29.87 percent less than mean experimental strength), however the formulations specific for PCSPs found in [11] and [14] have resulted in close agreement to the experimental results obtained (respectively about 8 and 10 percent differences from mean experimental strength).
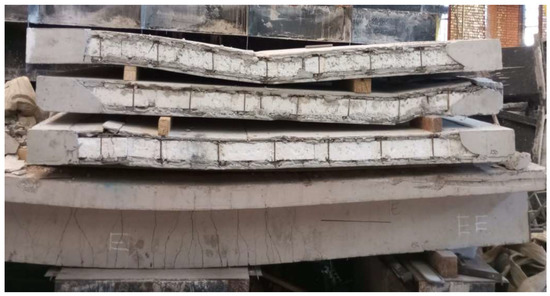
Figure 11.
EPS visual inspection after failure of panel PA1, PA2, and PA3.
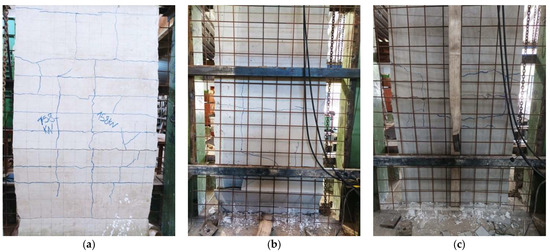
Figure 12.
Crack pattern after failure (a) for panel PA1; (b) for panel PA2; (c) for panel PA3.
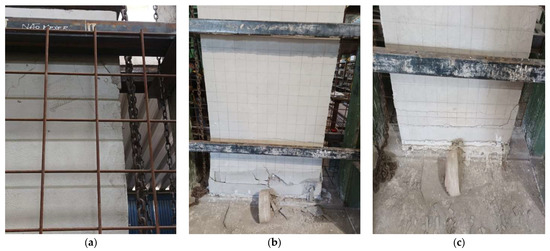
Figure 13.
Crack pattern for different wythes (compared to Figure 12) after panel failure (a) for panel PA1; (b) for panel PA2; (c) for panel PA3.

Table 4.
Cracking and failure loads.
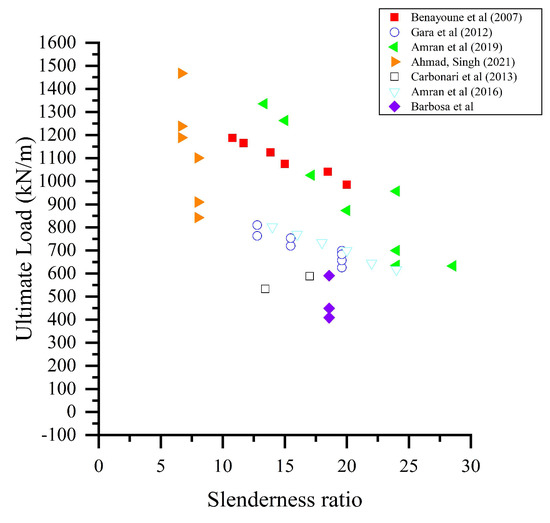
Figure 14.
Representation of the experimental data on axially loaded PCSPs in the literature with results of this paper included [9,10,11,13,14,29].
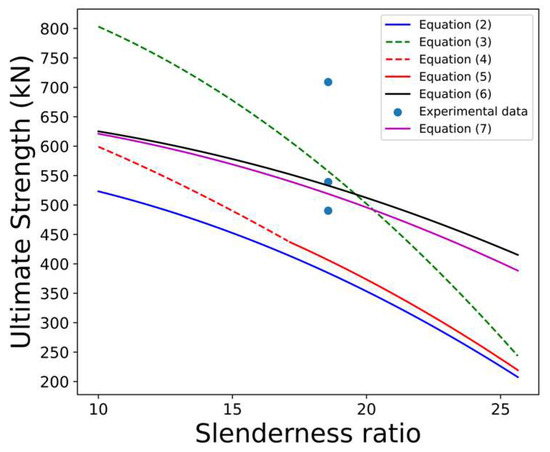
Figure 15.
Compilation of ultimate strength for the experimental results and theoretical strengths calculated using the equations discussed in this work.
5. Conclusions
Over the past two decades, increasing attention has been given to the compressive behavior of PCSPs. This paper described an evaluation of three axially loaded PCSPs with wythes at least 15 mm more slender, compared to the experimental analyses found in the literature. The goal of this work was to analyze the compressive behavior of panels with reduced wythe thickness. In the experimental investigations performed on PCSPs under compressive load, the displacements at the cross-section level were measured and reported. The main conclusions of the work are:
- The experimental analysis provided data showing that the panels performed typically as a composite structure. The visual evaluation of the EPS at the sides of the panels did not show signs of EPS failure. Therefore, the used shear connectors worked well until panel failure.
- The analysis of the displacements at the cross-sectional level showed the rotation of the panels along their longitudinal axis (and throughout their height). This behavior was, however, not associated with a decrease in the panel strength. Such rotations may be due to instabilities generated by small eccentricities in the application of the axial load as well as geometrical imperfections commonly observed in practice. Further investigations are recommended.
- Comparatively, in [10] a panel, named PMR-60 (with 2.55 m height and 150 mm thickness) showed an ultimate strength 8.53% smaller than the mean value strength of the panels tested in this research. Moreover, the slenderness of the PMR-60 panel is 8.45% smaller than the average slenderness of the three panels tested in this research. While panels are similar in slenderness, wythe thickness differs significantly between the two experimental studies. The panels in both studies had similar reinforcements, and mortar strength difference was less than 1%.
- Even though the wythes in Carbonari et al. [10] were thicker than the ones presented here by at least 15 mm, it is not possible to conclude that decreasing the wythe thickness while keeping the overall specimens’ thickness has any influence on panel strength. Moreover, in the two studies, the inner and outer wythes had different values. The wythes of these two experimental studies were both 25 mm thick, which may have played an important role in the strength obtained by Carbonari et al. [10].
- Empirical equations specific for PCSPs found in the literature, have reached less than 10 percent difference from experimental results. Therefore, they reinforce the validity of those equations for PCSPs.
- Finally, it is observed that the experimental results reported in the present research agree well with the other results shown in Figure 14, which is a compilation of experimental data on axially loaded panels available in the literature. Furthermore, it is suggested that more research be performed on precast sandwich panels in order to improve the use of such panels, which are so important in civil construction.
Author Contributions
Conceptualization, K.B., W.T.M.S., R.S., W.V. and L.M.B.; Methodology, K.B., W.T.M.S., R.S., W.V. and L.M.B.; Software, K.B., W.T.M.S., R.S., W.V. and L.M.B.; Validation, K.B., W.T.M.S., R.S., W.V. and L.M.B.; Formal analysis, K.B., W.T.M.S., R.S., W.V. and L.M.B.; Investigation, K.B., W.T.M.S., R.S., W.V. and L.M.B.; Resources, K.B., W.T.M.S., R.S., W.V. and L.M.B.; Data curation, K.B., W.T.M.S., R.S., W.V. and L.M.B.; Writing—original draft, K.B., W.T.M.S., R.S., W.V. and L.M.B.; Writing—review & editing, K.B., W.T.M.S., R.S., W.V. and L.M.B.; Visualization, K.B., W.T.M.S., R.S., W.V. and L.M.B.; Supervision, K.B., W.T.M.S., R.S., W.V. and L.M.B.; Project administration, K.B., W.T.M.S., R.S., W.V. and L.M.B.; Funding acquisition, K.B., W.T.M.S., R.S., W.V. and L.M.B. All authors have read and agreed to the published version of the manuscript.
Funding
This study was funded by CAPES (the Brazilian Coordination for the Improvement of Higher Education Personnel) and CNPq (the National Council for Scientific and Technological Development) which the authors thank for the financial support for this research. The number of the process related is 88887.666765/2022-00.
Institutional Review Board Statement
Not applicable.
Informed Consent Statement
Not applicable.
Data Availability Statement
The data used to support the findings of this study are available from the corresponding author upon request.
Acknowledgments
The authors are also very thankful to the Structures Laboratories of Brasilia for all tests performed for this research study.
Conflicts of Interest
The authors declare no conflict of interest.
References
- Gleich, H. New Carbon Fiber Reinforcement Advances Sandwich Wall Panels. Structure. 2007, pp. 61–63. Available online: http://www.structuremag.org/wp-content/uploads/2014/09/D-ProductWatch-CarbonFiber-Gleich-Apr07.pdf (accessed on 30 July 2023).
- Einea, A.; Salmon, D.C.; Fogarasi, G.J.; Culp, T.D.; Tadros, M.K. State-of-the-Art of Precast/Prestressed Sandwich Panels. PCI J. 1991, 36, 78–98. [Google Scholar] [CrossRef]
- Losch, E.D.; Hynes, P.W.; Andrews, R., Jr.; Browning, R.; Cardone, P.; Devalapura, R.; Donahey, R. State of the art of precast/prestressed concrete sandwich wall panels. PCI J. 2011, 56, 131–176. [Google Scholar]
- Bertoldi, R.H. Caracterização de Sistema Construtivo com Vedações Constituídas por Argamassa Projetada Revestindo Núcleo Composto de Poliestireno Expandido e Telas de Aço: Dois Estudos de Caso em Florianópolis. Masters’ Thesis, Programa de Pós-Graduação em Engenharia Civil UFSC, Florianópolis, Santa Catarina, Brazil, 2007. [Google Scholar]
- Davies, J.M. Lightweight Sandwich Construction; Wiley: Oxford, UK, 2001. [Google Scholar]
- Amran, Y.M.; El-Zeadani, M.; Lee, Y.H.; Lee, Y.Y.; Murali, G.; Feduik, R. Design innovation, efficiency and applications of structural insulated panels: A review. Structures 2020, 27, 1358–1379. [Google Scholar] [CrossRef]
- Pawar, P.; Minde, P.; Kulkarni, M. Analysis of challenges and opportunities of prefabricated sandwich panel system: A solution for affordable housing in India. Mater. Today Proc. 2022, 65, 1946–1955. [Google Scholar] [CrossRef]
- O’Hegarty, R.; Kinnane, O.; Grimes, M.; Newell, J.; Clifford, M.; West, R. Development of thin precast concrete sandwich panels: Challenges and outcomes. Constr. Build. Mater. 2021, 267, 120981. [Google Scholar] [CrossRef]
- Gara, F.; Ragni, L.; Roia, D.; Dezi, L. Experimental tests and numerical modelling of wall sandwich panels. Eng. Struct. 2012, 37, 193–204. [Google Scholar] [CrossRef]
- Cavalaro, S.H.P.; Carbonari, G.; Cansario, M.M.; Aguado, A. Experimental and analytical study about the compressive behavior of eps sandwich panels. Mater. Constr. 2013, 63, 393–402. [Google Scholar] [CrossRef]
- Benayoune, A.; Samad, A.; Ali, A.A.; Trikha, D. Response of pre-cast reinforced composite sandwich panels to axial loading. Constr. Build. Mater. 2007, 21, 677–685. [Google Scholar] [CrossRef]
- Benayoune, A.; Samad, A.A.A.; Trikha, D.; Ali, A.A.A.; Ashrabov, A. Structural behaviour of eccentrically loaded precast sandwich panels. Constr. Build. Mater. 2006, 20, 713–724. [Google Scholar] [CrossRef]
- Amran, Y.M.; Ali, A.A.; Rashid, R.S.; Hejazi, F.; Safiee, N.A. Structural behavior of axially loaded precast foamed concrete sandwich panels. Constr. Build. Mater. 2016, 107, 307–320. [Google Scholar] [CrossRef]
- Ahmad, A.; Singh, Y. In-plane behaviour of expanded polystyrene core reinforced concrete sandwich panels. Constr. Build. Mater. 2021, 269, 121804. [Google Scholar] [CrossRef]
- Goh, W.I.; Mohamad, N.; Abdullah, R.; Samad, A.A.A. Finite Element Analysis of Precast Lightweight Foamed Concrete Sandwich Panel Subjected to Axial Compression. J. Comput. Sci. Comput. Math. 2016, 6, 1–9. [Google Scholar] [CrossRef][Green Version]
- Alchaar, A.; Abed, F. Finite element analysis of a thin-shell concrete sandwich panel under eccentric loading. J. Build. Eng. 2020, 32, 101804. [Google Scholar] [CrossRef]
- O’Hegarty, R.; Kinnane, O. Review of precast concrete sandwich panels and their innovations. Constr. Build. Mater. 2020, 233, 117145. [Google Scholar] [CrossRef]
- Santana, M.R.C.; Soares, R.A.B.; do Espírito Santo Gomes, K.N.A. Estudo de paredes, moldadas no local, constituídas por componentes de poliestireno expandido (EPS), aço e argamassa. Braz. J. Dev. 2020, 6, 16568–16586. [Google Scholar] [CrossRef]
- Casini, M. Building insulating materials. In Smart Buildings: Advanced Materials and Nanotechnology to Improve Energy-Efficiency and Environmental Performance, 1st ed.; Jones, G., Ed.; WP: Cambridge, UK, 2016; pp. 107–114. [Google Scholar]
- Sulong, N.H.R.; Mustapa, S.A.S.; Rashid, M.K.A. Application of expanded polystyrene (EPS) in buildings and constructions: A review. J. Appl. Polym. Sci. 2019, 136, 47529. [Google Scholar] [CrossRef]
- Bush, T.D.; Stine, G.L. Flexural Behavior of Composite Precast Concrete Sandwich Panels with Continuous Truss Connectors. PCI J. 1994, 39, 112–121. [Google Scholar] [CrossRef]
- O’Hegarty, R.; Reilly, A.; West, R.; Kinnane, O. Thermal investigation of thin precast concrete sandwich panels. J. Build. Eng. 2020, 27, 100937. [Google Scholar] [CrossRef]
- Wong, R.W.; Loo, B.P. Sustainability implications of using precast concrete in construction: An in-depth project-level analysis spanning two decades. J. Clean. Prod. 2022, 378, 134486. [Google Scholar] [CrossRef]
- Doh, J.H.; Kim, J.W.; Fragomeni, S. Brief review of studies on concrete wall panels in one- and two-way action. Inter. J. Ocn. Eng. Tech. 2001, 4, 38–43. [Google Scholar]
- Pillai, S.; Parthasarathy, C. Ultimate strength and design of concrete walls. Build. Environ. 1977, 12, 25–29. [Google Scholar] [CrossRef]
- Interesting Aspects of the Empirical Wall Design Equation. ACI J. Proc. 1977, 74, 204–207. [CrossRef]
- ACI Comitte 318-19; Building Code Requirements for Structural Concrete. American Concrete Institute: Farmington Hills, MI, USA, 2019.
- Amran, Y.H.M.; Rashid, R.S.M.; Hejazi, F.; Ali, A.A.A.; Safiee, N.A.; Bida, S.M. Structural Performance of Precast Foamed Concrete Sandwich Panel Subjected to Axial Load. KSCE J. Civ. Eng. 2018, 22, 1179–1192. [Google Scholar] [CrossRef]
- Amran, Y.M.; Alyousef, R.; Alabduljabbar, H.; Alrshoudi, F.; Rashid, R.S. Influence of slenderness ratio on the structural performance of lightweight foam concrete composite panel. Case Stud. Constr. Mater. 2019, 10, e00226. [Google Scholar] [CrossRef]
- Choi, I.; Kim, J.; Kim, H.-R. Composite Behavior of Insulated Concrete Sandwich Wall Panels Subjected to Wind Pressure and Suction. Materials 2015, 8, 1264–1282. [Google Scholar] [CrossRef]
- NBR 16697; Cimento Portland—Requisitos. Associação Brasileira de Normas Técnicas: São Paulo, Brazil, 2019.
Disclaimer/Publisher’s Note: The statements, opinions and data contained in all publications are solely those of the individual author(s) and contributor(s) and not of MDPI and/or the editor(s). MDPI and/or the editor(s) disclaim responsibility for any injury to people or property resulting from any ideas, methods, instructions or products referred to in the content. |
© 2023 by the authors. Licensee MDPI, Basel, Switzerland. This article is an open access article distributed under the terms and conditions of the Creative Commons Attribution (CC BY) license (https://creativecommons.org/licenses/by/4.0/).