Article

Daylighting Assessment of a Heritage Place of Instruction and Office Building in Alice, South Africa

1
Fort Hare Institute of Technology, University of Fort Hare, Alice 5700, South Africa
2
Physics Department, University of Fort Hare, Alice 5700, South Africa
*
Author to whom correspondence should be addressed.
Buildings 2023, 13(8), 1932; https://doi.org/10.3390/buildings13081932
Submission received: 13 June 2023 / Revised: 21 July 2023 / Accepted: 27 July 2023 / Published: 29 July 2023

Abstract

:
Mitigation of post-occupancy building energy consumption has resulted in the change of building design to utilise ambient weather factors for indoor thermal conditioning and lighting. This has increased the construction of new buildings with large glazing façades and reduced adaptive use of heritage buildings as they are considered not designed to meet modern energy use requirements. This paper evaluates the daylighting performance of a heritage place of instruction and office building. A quantitative research approach based on building information simulation tools was adopted. Autodesk Revit 2021 and Integrated Environmental Solutions Virtual Environment (IESVE) 2021 were used in modelling and simulating the building daylighting performances. The building’s annual daylight performance analysed with climate-based daylight modelling shows that points in the analysed spaces were within the UDI300-2000 for more than 50% of the occupied period (07h00 to 17h00) in a year. The sDA300,50% was found to be 100% in most spaces, which is considered a favourable daylit space according to the Illuminance Engineering Society of North America (IESNA). Further, discomfort glare analysis revealed that the building daylight glare is imperceptible, with an average daylight glare probability of 21.2%. The 1:14 window–wall ratio contributes to the building daylighting relative to orientation without constituting visual discomfort. Overall, climate-based daylight modelling revealed that the building’s annual daylight level meets the IESNA requirements with an imperceptible daylight glare.

1. Introduction

Energy use once buildings are occupied has been the focus of many researchers and architects in recent years to minimise their overall life-cycle energy consumption and related CO2 emissions. Bioclimatic building design that utilises ambient weather factors to improve the indoor environment and well-being of occupants is one of the main approaches adopted to achieve this goal [1]. Advancement in lighting technology has also positively contributed to reducing energy consumption in buildings. The use of solar technologies that incorporate natural light in buildings can reduce overall energy consumption by up to 40% due to the reduction in artificial light usage and positively impact occupant well-being and productivity through enhanced visual comfort [1]. Other lighting technological advancements include smart daylight-linked and occupancy-linked sensors that save operational energy by automatically dimming lights in response to daylight illuminance and switching off lights in unoccupied spaces [2]. Flor et al. [3] agree with the Hong Kong Green Building Council Limited [1] as the authors allude that providing sufficient natural lights in buildings is essential for occupants’ visual comfort at minimum energy consumption. The authors [3] further argue that the type and size of fenestration are vital for effective daylighting, and thus, effective daylighting is restricted to new buildings with daylight harvesting features. This is because existing (old) buildings are not suitable for major daylighting retrofit due to structural limitations and related costs. Switchable daylight ethylene-tetrafluoroethylene (ETFE) foil was proposed to address this challenge. Switchable ETFE foil cushions have been used widely in buildings to enhance indoor daylighting, owing to their high transmittance (usually 90 to 97% visible radiation for clear foil) and light weight (0.34 g/m2 density). Advancements in the technology with the introduction of high reflection, absorption, and low-emittance additive materials have enhanced its optical and thermal properties [4]. The proposed device increased the useful daylight illuminance (UDI) from 11% to 69% of an office room simulated under the oceanic Mediterranean and sub-tropical climate. Similarly, Rastegari et al. [5] believe that passive solar office design can reduce electricity consumption, operating costs, and workers’ health using daylighting. The authors [5] argue that atrium design is the key component of sustainable and environmental building designs required for daylighting and natural ventilation. Having assessed the daylighting performance of an office building retrofitted with an atrium structure, the authors [5] found that the average UDI of the building was at the upper limit of 2000 lux. However, the choice of UDI upper limit has varied among researchers over the years, with Li et al. [6] alluding that daylighting above 2000 lux may result in overheating and glare. Brembilla et al. [7] used 3000 lux as the UDI upper limit but obtained the fewest instances with vertical illuminance in this range. On the other hand, Hong et al. [8] found 70.92% and 71.88% UDI300-3000 for a single-glazed window and doubled-glazed window, respectively, in a typical office room in China.
However, earlier studies by Omrany et al. [9] indicate that atrium daylighting is highly climate-sensitive and if local climate conditions are not carefully considered, it may result in visual and thermal discomfort indoors, increasing the building energy consumption. Nevertheless, Omrany et al. [9] and Rastegari et al. [5] believe that the atrium can reduce building energy consumption by adopting ambient weather factors, such as the sun and wind, for natural lighting and ventilation. Omrany et al. [9] further stress that atrium building design should be based on climate-responsive principles and dynamic shading devices for efficient and effective daylighting and cooling. In agreement with Omrany et al. [9], Wu et al. [10] highlight that a significant amount of energy is used to maintain the indoor thermal comfort of atrium buildings due to the contradictory relationship between the optical and thermal properties of top-lighting designing strategy. In other words, daylighting performance of an atrium building is approximately proportional to the glass roof area and inversely proportional to the indoor thermal performance. To optimise the optical and thermal performances of atrium buildings, Wu et al. [10] explore the area ratio and section aspect ratio of the atrium. They found that area ratio has a significant impact on the daylighting of atriums, while section aspect ratio has a negligible impact. The indoor daylighting requirement was met when the area ratio was greater than or equal to 1:5.5. Further, the thermal performance of the atrium building was found to improve as the area ratio decreased, until it was less than 1:5, while an increase in the section ratio improves the thermal performance of the building [10]. According to Wu et al. [10], area ratio represents how much heat from the atrium is received from the sun, and it is expressed as the area ratio of the lighting glass to the roof. On the other hand, the ratio of the atrium is due to the sun; the ratio of the atrium height to the skylight’s width in the north–south direction is expressed by section aspect ratio.
In addition to atriums, large glazing façades (vertical windows) have been used to enhance daylighting in buildings. Kwong [11] evaluates the post-occupancy visual performance and comfort of a highly glazed building in Malaysia. The author [11] argues that excessive lighting and poor light distribution are the common factors that lead to visual discomfort in green buildings. Quantitative and qualitative research methods were employed in the research. The average daylight illuminance at the office tables was 300 to 500 lux, which the author [11] believes is sufficient for office tasks without artificial lights. It was also indicated that several locations in the office were over-illuminated and required curtain blinds during working hours to avoid visual discomfort. Nonetheless, the qualitative aspect of the research, which covers the occupants’ perspective of the office daylight illuminance, reveals that 73% of the occupants find their office space brightness satisfactory. Based on field survey data, the author [11] found that daylighting in the green building can reduce lighting energy consumption by up to 50%, with related cost savings of USD 2236.43.
Integrating passive solar design features in heritage buildings has also become a common approach among researchers to enhance performance to meet current building requirements for adaptive reuse. Al-Sallal et al. [12], who investigated the effect of daylight on exhibitions and artefacts with respect to several architectural designs of a heritage museum in the United Arab Emirates, indicate that in addition to energy savings, daylighting improves the artefacts’ colour appearance (i.e., colour rendition) and creates positive psychological impact, greater satisfaction, and enhanced architectural experience. However, the authors [12] stress that daylight in museums should be carefully considered to avoid photochemical damage to artefacts. Similar to Qiu et al.’s [13] findings, the window–wall ratio was the architectural component that had the most impact on the artefacts and visual comfort of the museum relative to daylight. Window–wall ratio of 5% and low-reflectance surfaces were conducive to highly sensitive artefacts. In contrast, a window–wall ratio of 18% requires a 3 m veranda to avoid glare and damage to the artefact due to direct sunlight penetration. Marzouk et al. [14] reiterate the functional, psychological, and physiological effects of daylighting in heritage buildings. The authors [14] argue that the adaptive reuse of buildings is more sustainable than demolition and reconstruction. Such an approach increases heritage building significance but should be implemented with high constraints and precautions. In light of this argument, the authors [14] aimed to reuse the Omar Tosson heritage palace in Egypt as a museum with an optimised skylight to enhance daylight performance. Daylight control and redirect systems were employed to improve the building’s daylight distribution and quality. DIVA-for-Rhino, which interfaces with a light and energy plugin model and simulation of the building, reveals a 42% daylight performance improvement. Annual sunlight exposure (ASE) and spatial daylight autonomy (sDA), used as daylight quality and quantity indicators, improved by 35.8% and 56.1%, respectively. Also, the calculated visual discomfort was decreased from intolerable to imperceptible.
Furthermore, improving daylighting in adaptively reused heritage buildings was also the focus of Soleimani et al. [15], who believe that many heritage buildings lack new building requirements for the adapted purpose, especially daylighting for educational purposes. Hence, refurbishing, restricted by local cultural and heritage policies, is usually implemented in heritage buildings to meet current building requirements. The authors [15] simulated 57 different daylight retrofit design strategies to optimise the indoor daylighting of a heritage building south-facing below-grade classroom in Tehran. It was reported that a combination of ceiling and exterior side window reflectors generated the most acceptable daylight illuminance in all areas of the classrooms. Other strategies, such as Venetian blinds and vertical fins, had negligible impact on the classrooms’ daylight illuminance. In a more recent study, Ide et al. [16] explore balancing the trade-off between intensive energy retrofits and conservation of heritage values. It was stressed that while making efforts to mitigate anthropogenic impacts by improving performance in new buildings, heritage buildings have substantial untapped energy efficiency. Also, historical (existing) building stock makes up significant portions of cities globally, presenting a greater opportunity to achieve net-zero carbon emissions in the building sector. The retrofits recommended by the authors [16] include the installation of thermal insulation, triple-pane low-E windows, reducing air infiltration by 70%, supplementary air-source heat pump, on-site solar photovoltaics, and daylight sensors and controls. The retrofit resulted in 67% energy savings and 84% annual operating cost reduction with a payback period of 21 and 28 years, depending on the choice of window materials adopted in the retrofit.

Research Gap and Contribution

From the above-appraised studies, building energy efficiency and effective daylighting are associated with passive solar design. As outlined in the studies, the fundamental operating principle of passive solar design is top-lighting (skylight) and large glazing areas to harvest sunlight for indoor daylighting. Hence, building passive heating and daylighting performance are linked to skylight area and window–wall ratio. However, the viability of passive solar design is climate-dependent due to its principle of operation. According to Alrubaih et al. [17], top-lighting or skylight in a hot or prevailing cooling load climate may result in excessive energy consumption due to overheating. Kent et al. [18] also pointed out the potential thermal and visual discomfort associated with vertical windows designed for daylighting without adequate control or overheating-preventive measures. In recent years, many researchers and architects have focused on balancing passive solar design’s thermal and optical aspects. Despite this challenge, heritage buildings with relatively moderate window–wall ratios are still not considered suitable for effective daylighting, irrespective of climate conditions and buildings’ dominant occupancy. As outlined in the appraised studies, many researchers focus on integrating passive solar features in heritage buildings to optimise indoor daylight distribution and quality. Such studies have increased building energy efficiency retrofit as well as the construction of new buildings. According to the United Nations Environmental Programme [19], the construction of new energy-efficient buildings accounted for the most jobs created by capital investment in 2020, followed by existing buildings’ energy efficiency retrofit.
Nevertheless, at a global rate of 1.0% to 3.0% per annum of new building construction, achieving net-zero carbon emissions by 2050 in the building sector, will be implausible if existing buildings are neglected [16]. In addition, the adaptive reuse of heritage buildings promotes compact urbanisation, which is considered a sustainable form of city development due to resource efficiency, reduced pressure on infrastructure, and promotion of the use of public transportation, walking, and cycling, and minimises the cost of infrastructure development, operation, and maintenance, increasing economic efficiency, productivity, livelihood opportunities, and access to facilities [20,21,22]. Said et al. [23] suggest that adaptive reuse of heritage buildings creates a sense of belonging and identity for future generations due to the buildings’ unique social, historical, political, architectural, and aesthetic features. In spite of the outlined benefits associated with heritage buildings, very few studies have evaluated the daylighting performance of heritage buildings based on the original architecture. Such study will preserve the historical and cultural values of heritage buildings while adhering to current building energy demand requirements at minimum retrofit cost, energy consumption, and related greenhouse gas emissions.
This research evaluates the daylighting performance of a heritage place of instruction and office building. In the context of this research, effective daylighting refers to the daylight that meets the building’s visual tasks during occupied periods and does not constitute visual discomfort. In view of the outlined research aim, an overview of the case study building will be used to kick-start the article. After this, the research framework and adopted methods and activities will be highlighted. The obtained results and findings will then be presented and discussed, while the study’s limitations, recommendations, and conclusions will be used to close the article.

2. Overview of the Case Study Building: Livingstone Hall

This research used Livingstone Hall at the University of Fort Hare in Alice town, Eastern Cape, South Africa, as a case study, geographically located at latitude 32°47′13.16″ S and longitude 26°50′45.48″ E. It was built in the mid-1930s and was designed to complement the adjacent Stewart Hall at the University [24,25]. In 1936, the building was dedicated to house Physics, Mathematics, and Geography Departments. Livingstone Hall was commissioned in 1937 by Senator Francos Malan, in strong opposition to the fundamentalism within the Dutch Reformed Church, and the Minister of Education, Jan Hofmeyr, who proclaimed that Universities “should know no distinction of class, wealth, race or creed”. Every fabric of Livingstone Hall forms part of black education history in South Africa and the role of the University of Fort Hare in fighting against the apartheid system of government. Satellite view maps of the University of Fort Hare and Livingstone Hall and a photo of the case study (Physics department) building are presented in Figure 1.
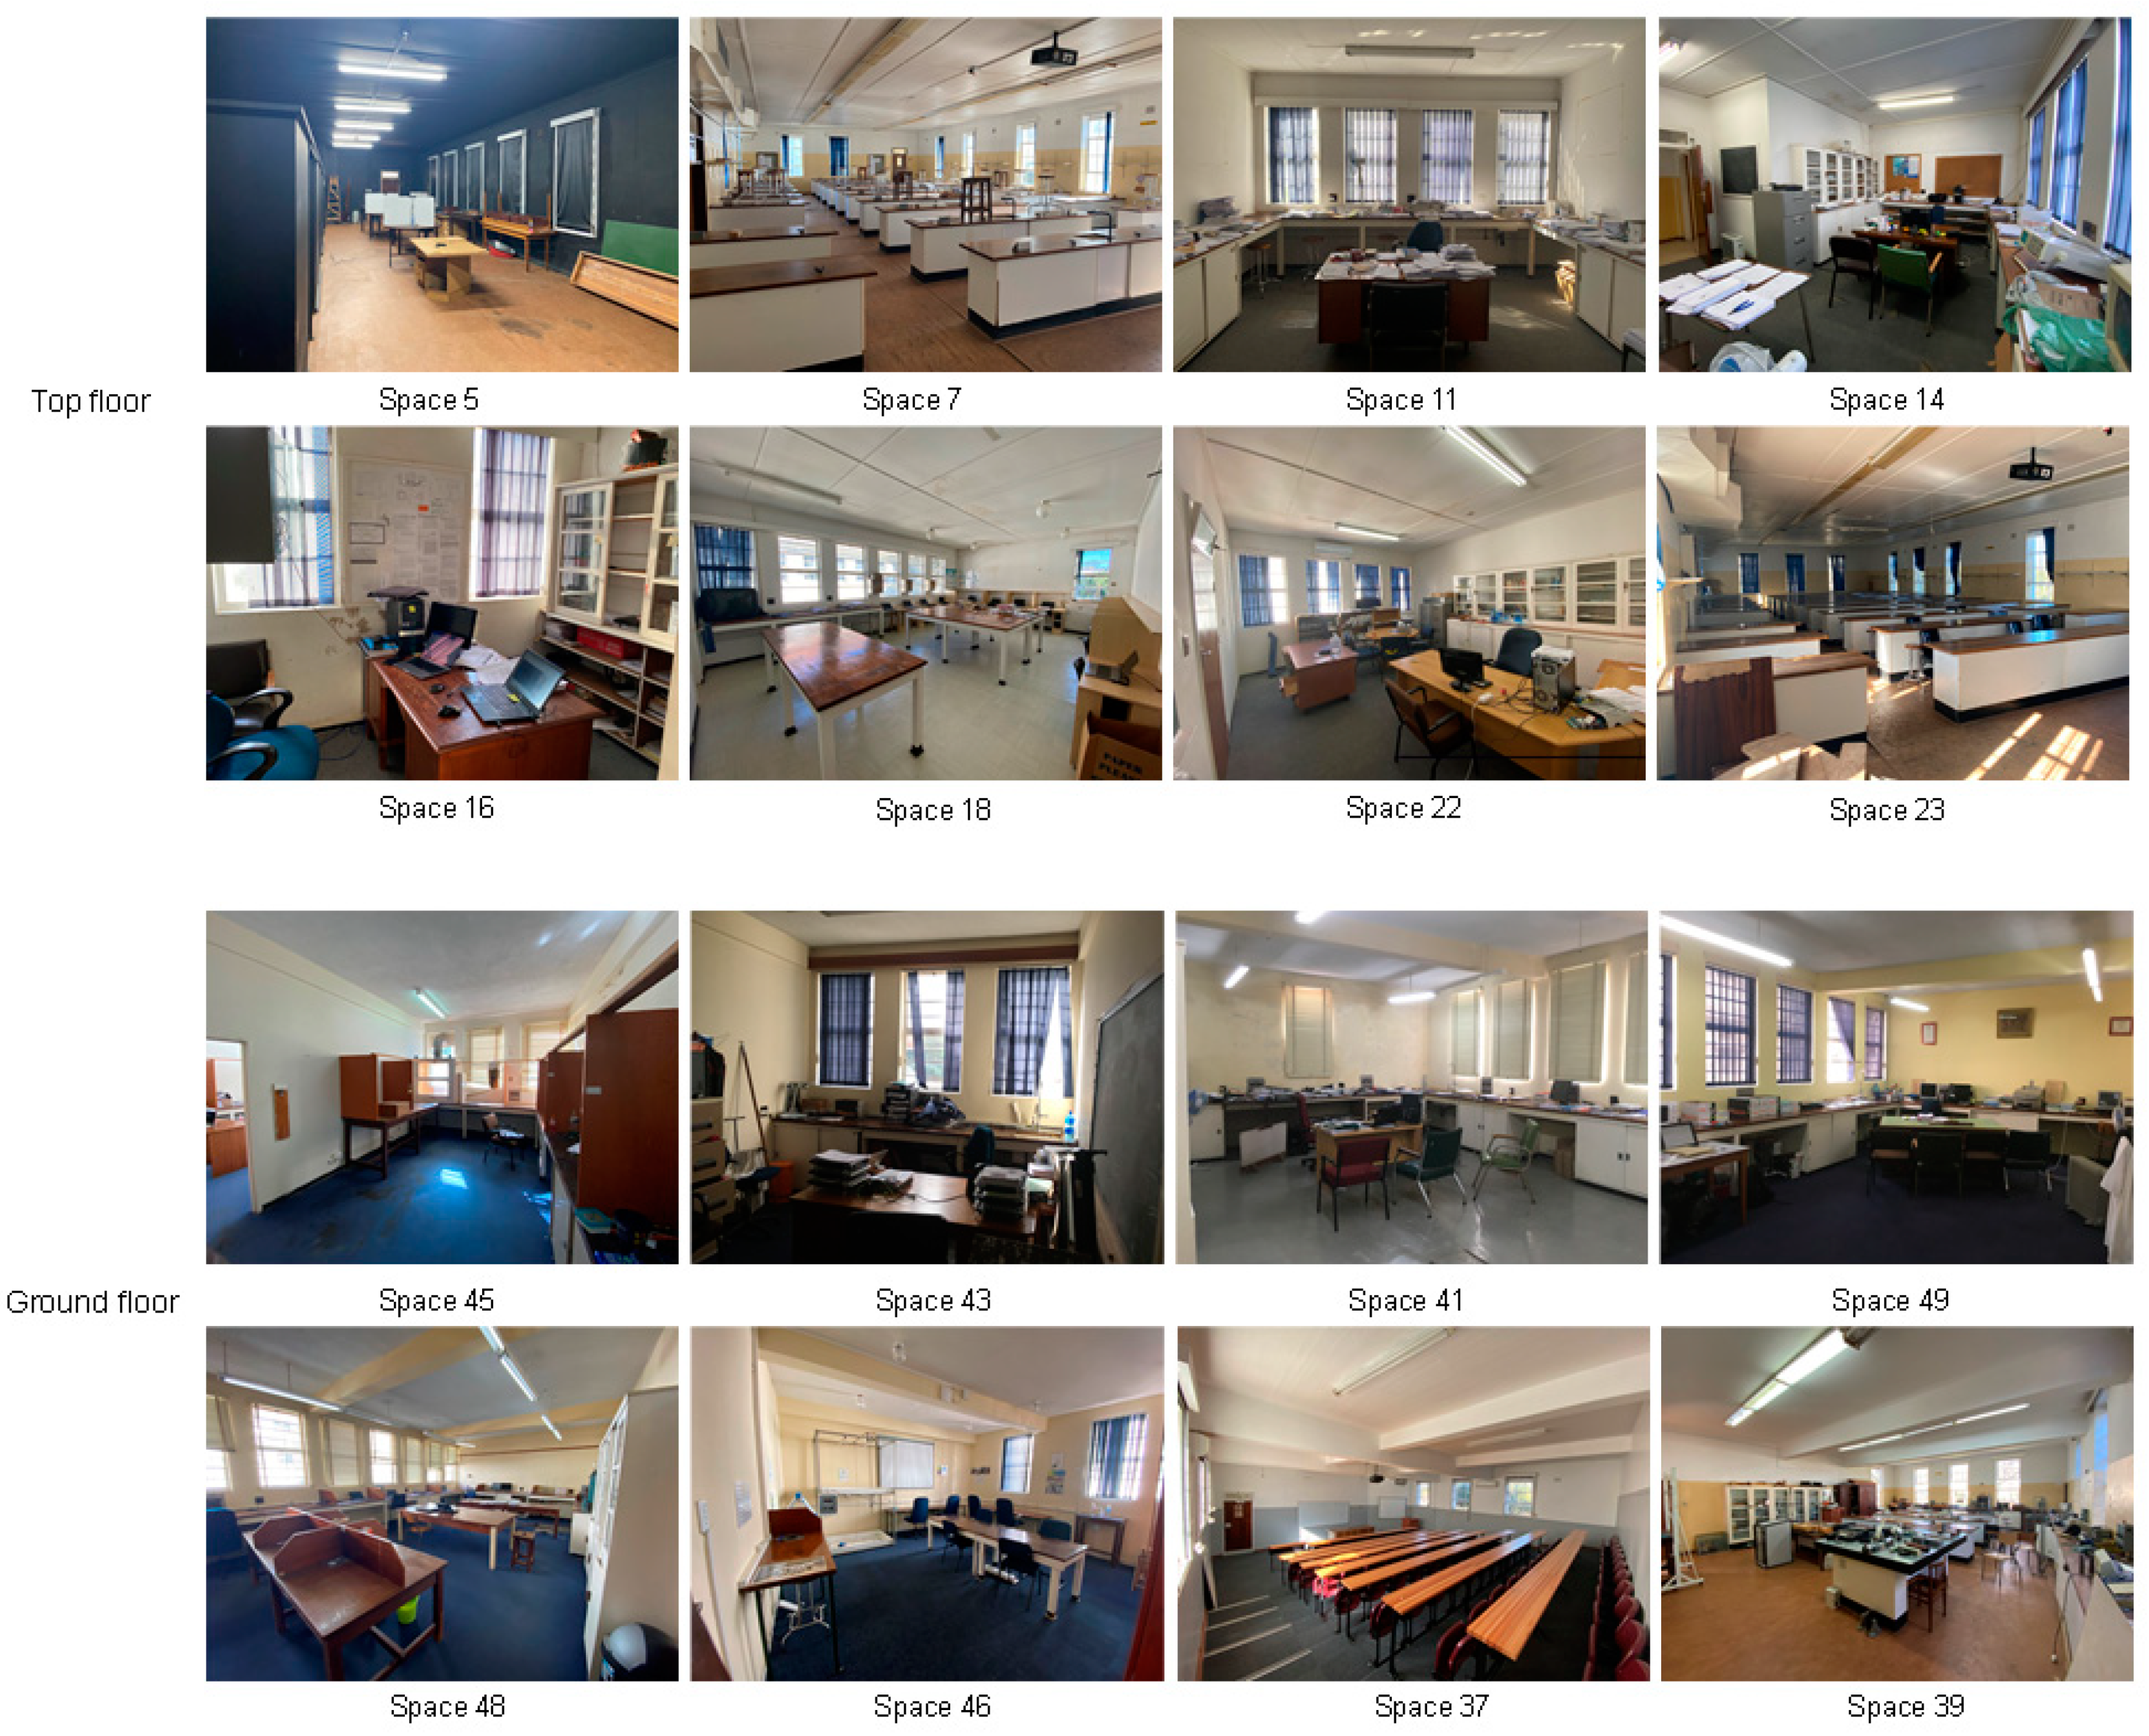
During the research, Livingstone Hall was still hosting the intended departments, in addition to the Computer Science Department, Statistics Department, the University’s research office and the Teaching and Learning Centre (TLC). However, the research focuses only on the Physics department section of the building. In reference to the South African National Standard (SANS) 10400XA [26] and SANS 1544 [27], the case study building falls under A3 (place of instruction) and G1 (office building) classes of occupancy and multiple tenancies for energy performance certificate evaluation. In addition, the building is under the South African Heritage Resource Act [28] since it was built more than 90 years ago. As shown in Figure 1c,d, the Physics Department occupied a two-story portion of the building during this research. The Physics Department consisted of single offices, shared offices, storerooms, lecture halls, bathrooms, and laboratories on both floors. The building’s Autodesk Revit design floor plans are shown in Figure 2 and photos of selected spaces of the building are presented in Figure 3. Due to the vast number of spaces in the building, selected spaces’ photos were used for simplicity and adequately capture the building’s daylight relative to the sun’s daily path. This is discussed further in Section 4.
As shown in Figure 2, the case study building is oriented 164° S and has a net floor area of 1174.14 m2, including the TLC on the ground floor. However, the TLC is outside the scope of the research. The building orientation is not in line with the recommended orientation for buildings in the area, according to SANS 10400XA [29]. But the building orientation was constrained by the history of the three buildings, i.e., Stewart, Livingstone, and Henderson Halls. The floor arrangement, as shown in Figure 2 and Figure 3, indicating that most occupants are situated on the east and west sides of the building, may also justify the orientation relative to the floor plan arrangement.
Furthermore, the various elevations of the building are presented in Figure 4. The spaces’ floor area varies, as shown in Figure 2 and Figure 4, and the average height of the spaces was 3 m on both floors. The window–wall ratio significance in the daylighting performance of a building was highlighted in Section 1 of this article [12,13,15]. Bradshaw [30] also alludes to the significance of the windows’ size, position, and orientation on the daylight level and quality in a building. Thus, the building windows’ sizes and positions at all elevations were duly noted in the research. As shown in Figure 4, only vertical windows were installed in the building during the research. The total window opening areas compared to wall areas in each orientation on both floors of the building are presented in Table 1.
From Table 1, the average window–wall ratio on both floors was 14% (1:14), which is 4% lower than Al-Sallal et al.’s [12] window–wall ratio for a 3 m veranda recommendation for effective daylighting in a heritage museum building in the United Arab Emirates. Further, two main distinctive sizes of the windows were observed in the building, as shown in Figure 4. The large windows’ glazing area is approximately 1 m2 and was dominant in the laboratories and lecture halls at the building’s south elevation. This might negatively impact the thermal performance of the building, according to existing research in the region [31], although the building’s thermal performance was not covered in the study. The small windows, with an average area of 0.80 m2, were mainly used in the offices at the building’s east and west elevations. Table 2 summarises the optical properties of the windows as adopted in the building simulation.
Besides the large and small windows, a set of windows with an approximate 1.5 m2 glazing area were installed on the top floor north-facing hallways. Regardless of the sizes, all the building’s windows were made of white painted steel frames on the inner and outer surfaces with single-pane 6 mm thick clear glass. Also, the building’s external wall thickness was 0.25 m, while the windows’ depth was 0.12 m.

3. Research Method

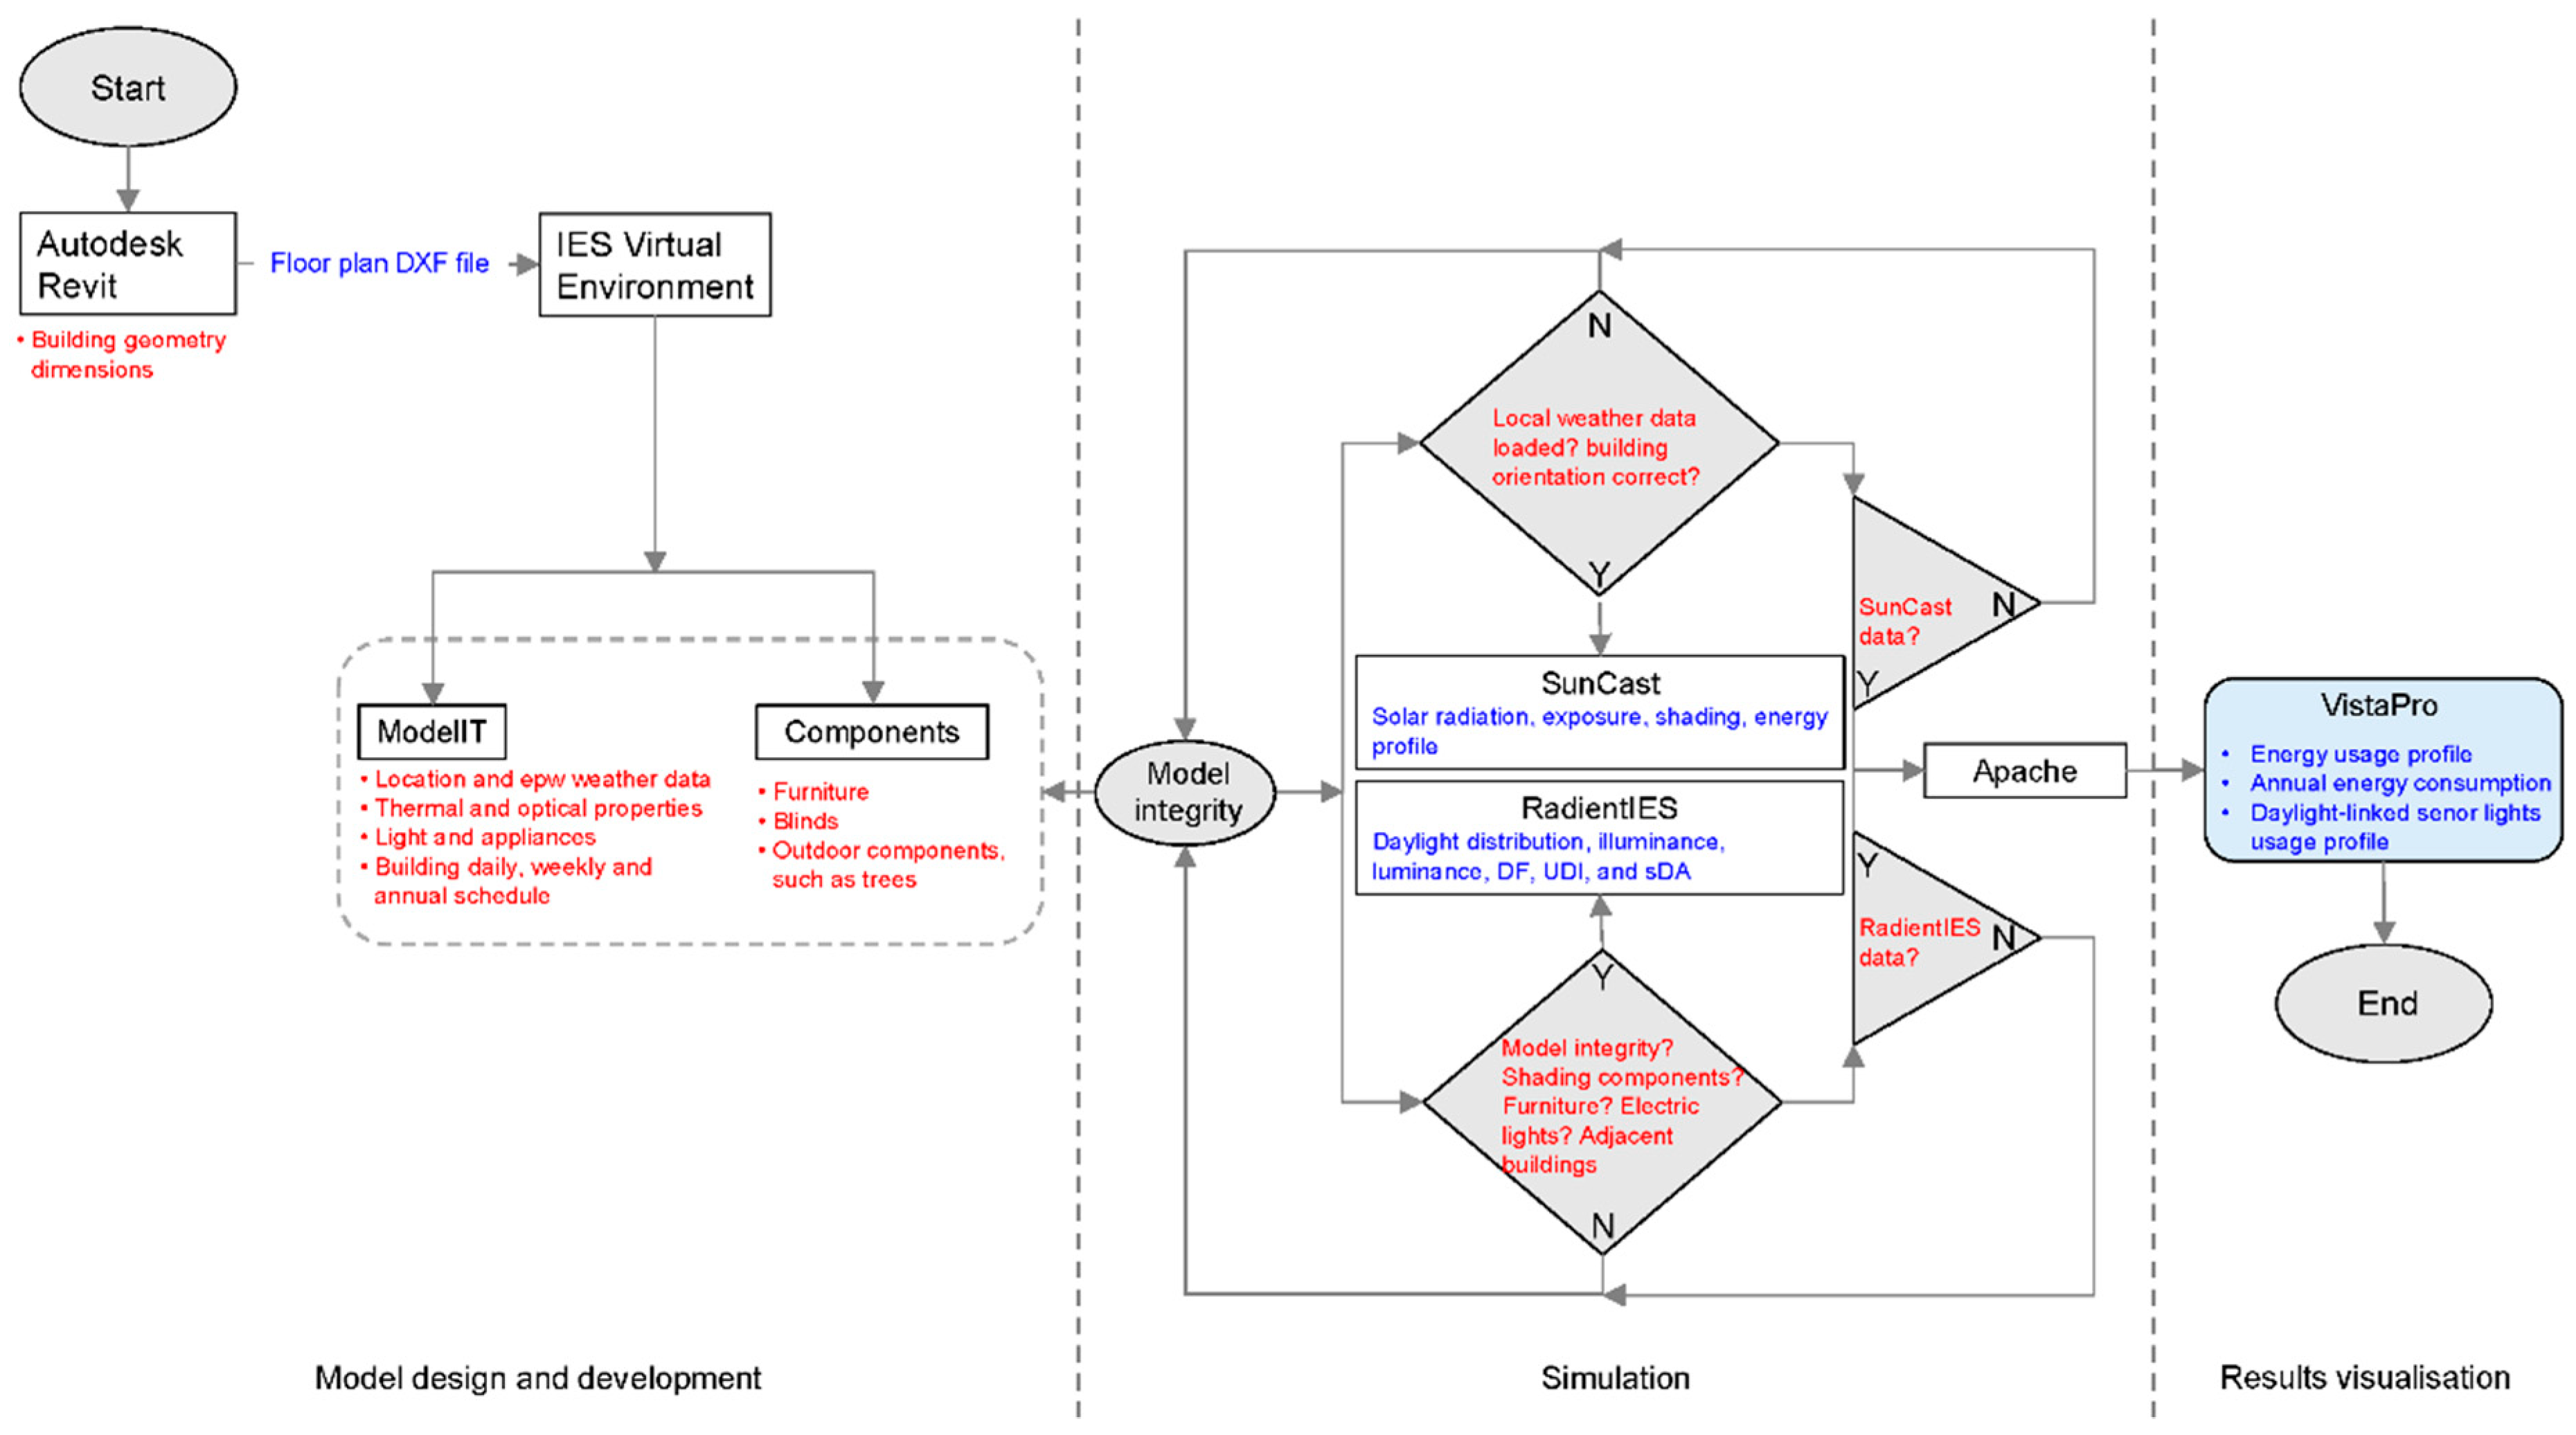
A quantitative research method based on simulation was adopted in the research, using a climate-based daylight model (CBDM) analysis to investigate the building’s daylighting. This approach was selected as it is a conventional approach used in evaluating building daylighting, as shown in the appraised studies. A flowchart highlighting the building model development and simulation processes is presented in Figure 5.
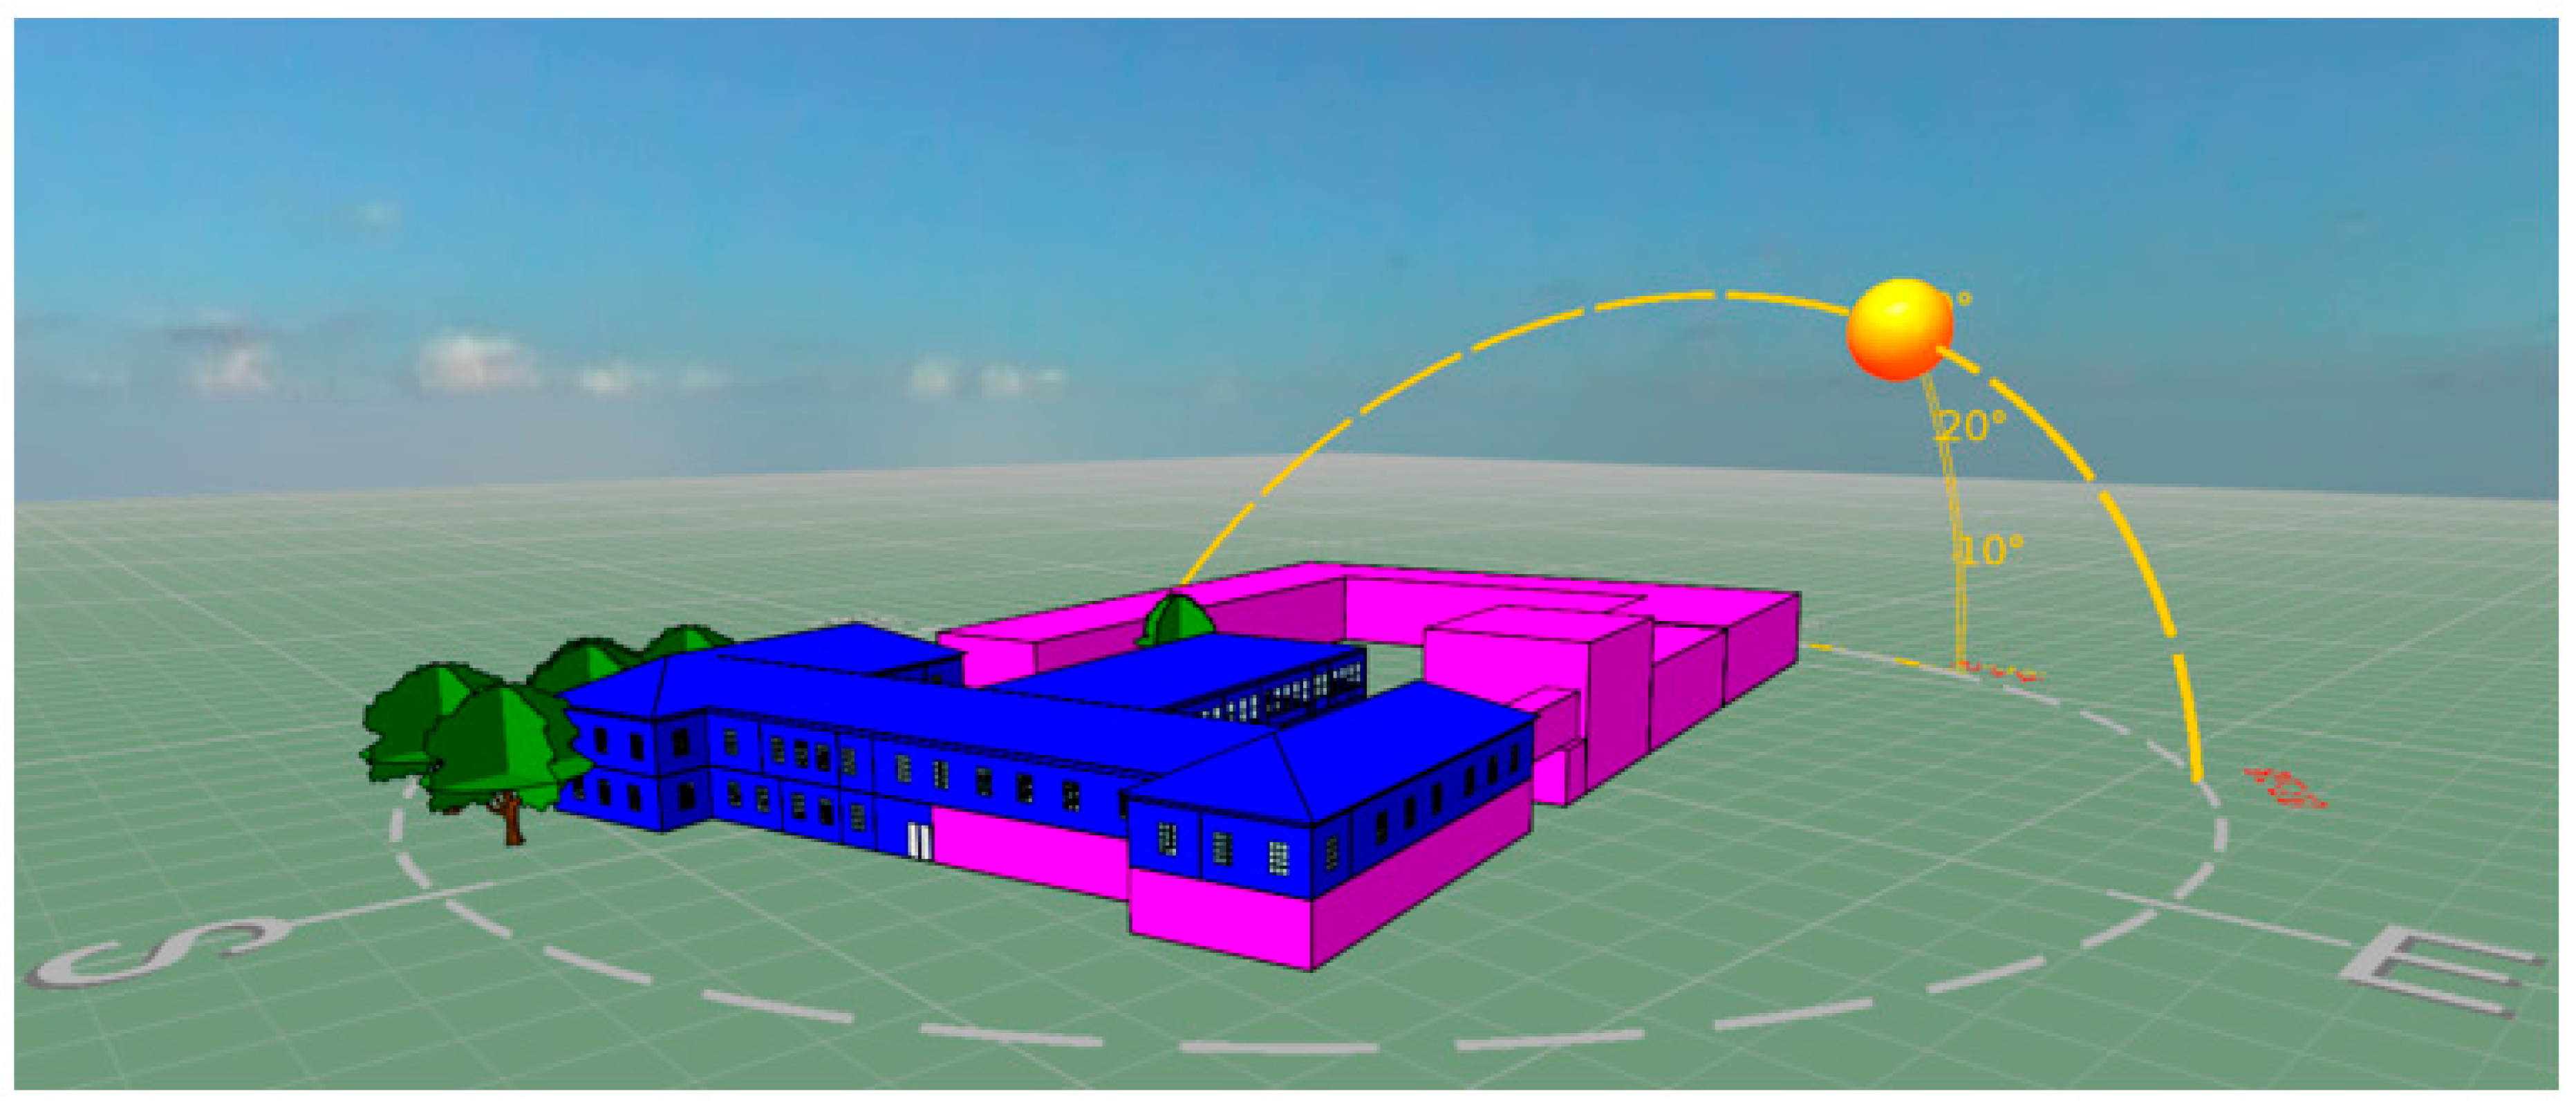
As indicated in Figure 5, Autodesk Revit 2021 21.0.0.383 [32] and Integrated Environmental Solutions Virtual Environment (IESVE) 2021 Pack 4 version 2021.4.0.0 [33] were used in modelling and simulating the building daylighting performance. The building model was initially developed in Autodesk Revit based on the measured building geometry from a walk-through audit. A DXF file of the building floor plan was exported to IESVE ModelTI for 3D model development and performance simulation. The building geometry measurements and features, such as position, number of windows, orientation, and adjacent buildings, obtained from the walk-through audit, were adopted in developing the model in ModelIT. Also, at the ModelIT stage, the local weather file from the IESVE weather database was loaded into the model. The optical properties (refer to Table 2) of the building envelope components were assigned as well. Furniture in the various spaces in the building and trees were added to the model using the Components tool. Before the simulation, the model undergoes an integrity check for intersections between zones, unplanned gaps, and spaces in the geometry that may impede the simulation. The developed 3D model of the building is shown in Figure 6.
In Figure 6, the blue section represents the focus area of the building in this research, while the pink section is adjacent buildings not considered in the research. Nevertheless, they influence the outcome of the simulation due to shading. In addition to ModelIT and Components, IESVE consists of SunCast, RadientIES, Apache, and VistaPro, as employed in this research. The SunCast application uses loaded weather data in ModelT to track the sun’s position in the sky to simulate solar radiation and the shading profile of the building. It also considers the building geometry, shading features, orientation, adjacent buildings, and features.
The simulated solar radiation and shading profiles were exported to RadientIES and Apache to simulate the building’s daylight distribution profile. While SunCast was used to evaluate solar exposure and shading, RadientIES deals with daylight distribution and quality in terms of the building’s illuminance, luminance, glare, and visual comfort. RadientIES was also used to conduct CBDM assessment of the building for annual dynamic analysis such as Useful Daylight Illuminance (UDI), Annual Sunlight Exposure (ASE), and Spatial Daylight Autonomy (sDA). According to Freewan et al. [34], RadientIES uses backward ray tracing, taking into consideration local solar radiation, orientation daylight time, surface optical properties, shading features, adjacent buildings, and sky conditions to generate 3D images that detail the daylight or electric light illuminance and luminance of a building.
As shown in Figure 5, data from SunCast and RadientIES were fed into Apache for annual daylight profile simulation. Apache uses the solar shading data computed in SunCast to integrate the effect of a solar gain or reduced solar gain due to shading in the model. In this regard, Apache takes account of solar radiation that enters the building through the glazing and absorbs solar heating. Similarly, the approach was used to evaluate the daylight entering the building and internal reflection with respect to the surface properties and colour of the building components and furniture. Apache also considered the optical properties of windows’ glazing, such as the transmittance, reflectance, and emittance, in generating the indoor daylighting profile. Apache’s simulated and computed data were exported to VistaPro for analysis and discussion.

Local Solar Weather Conditions

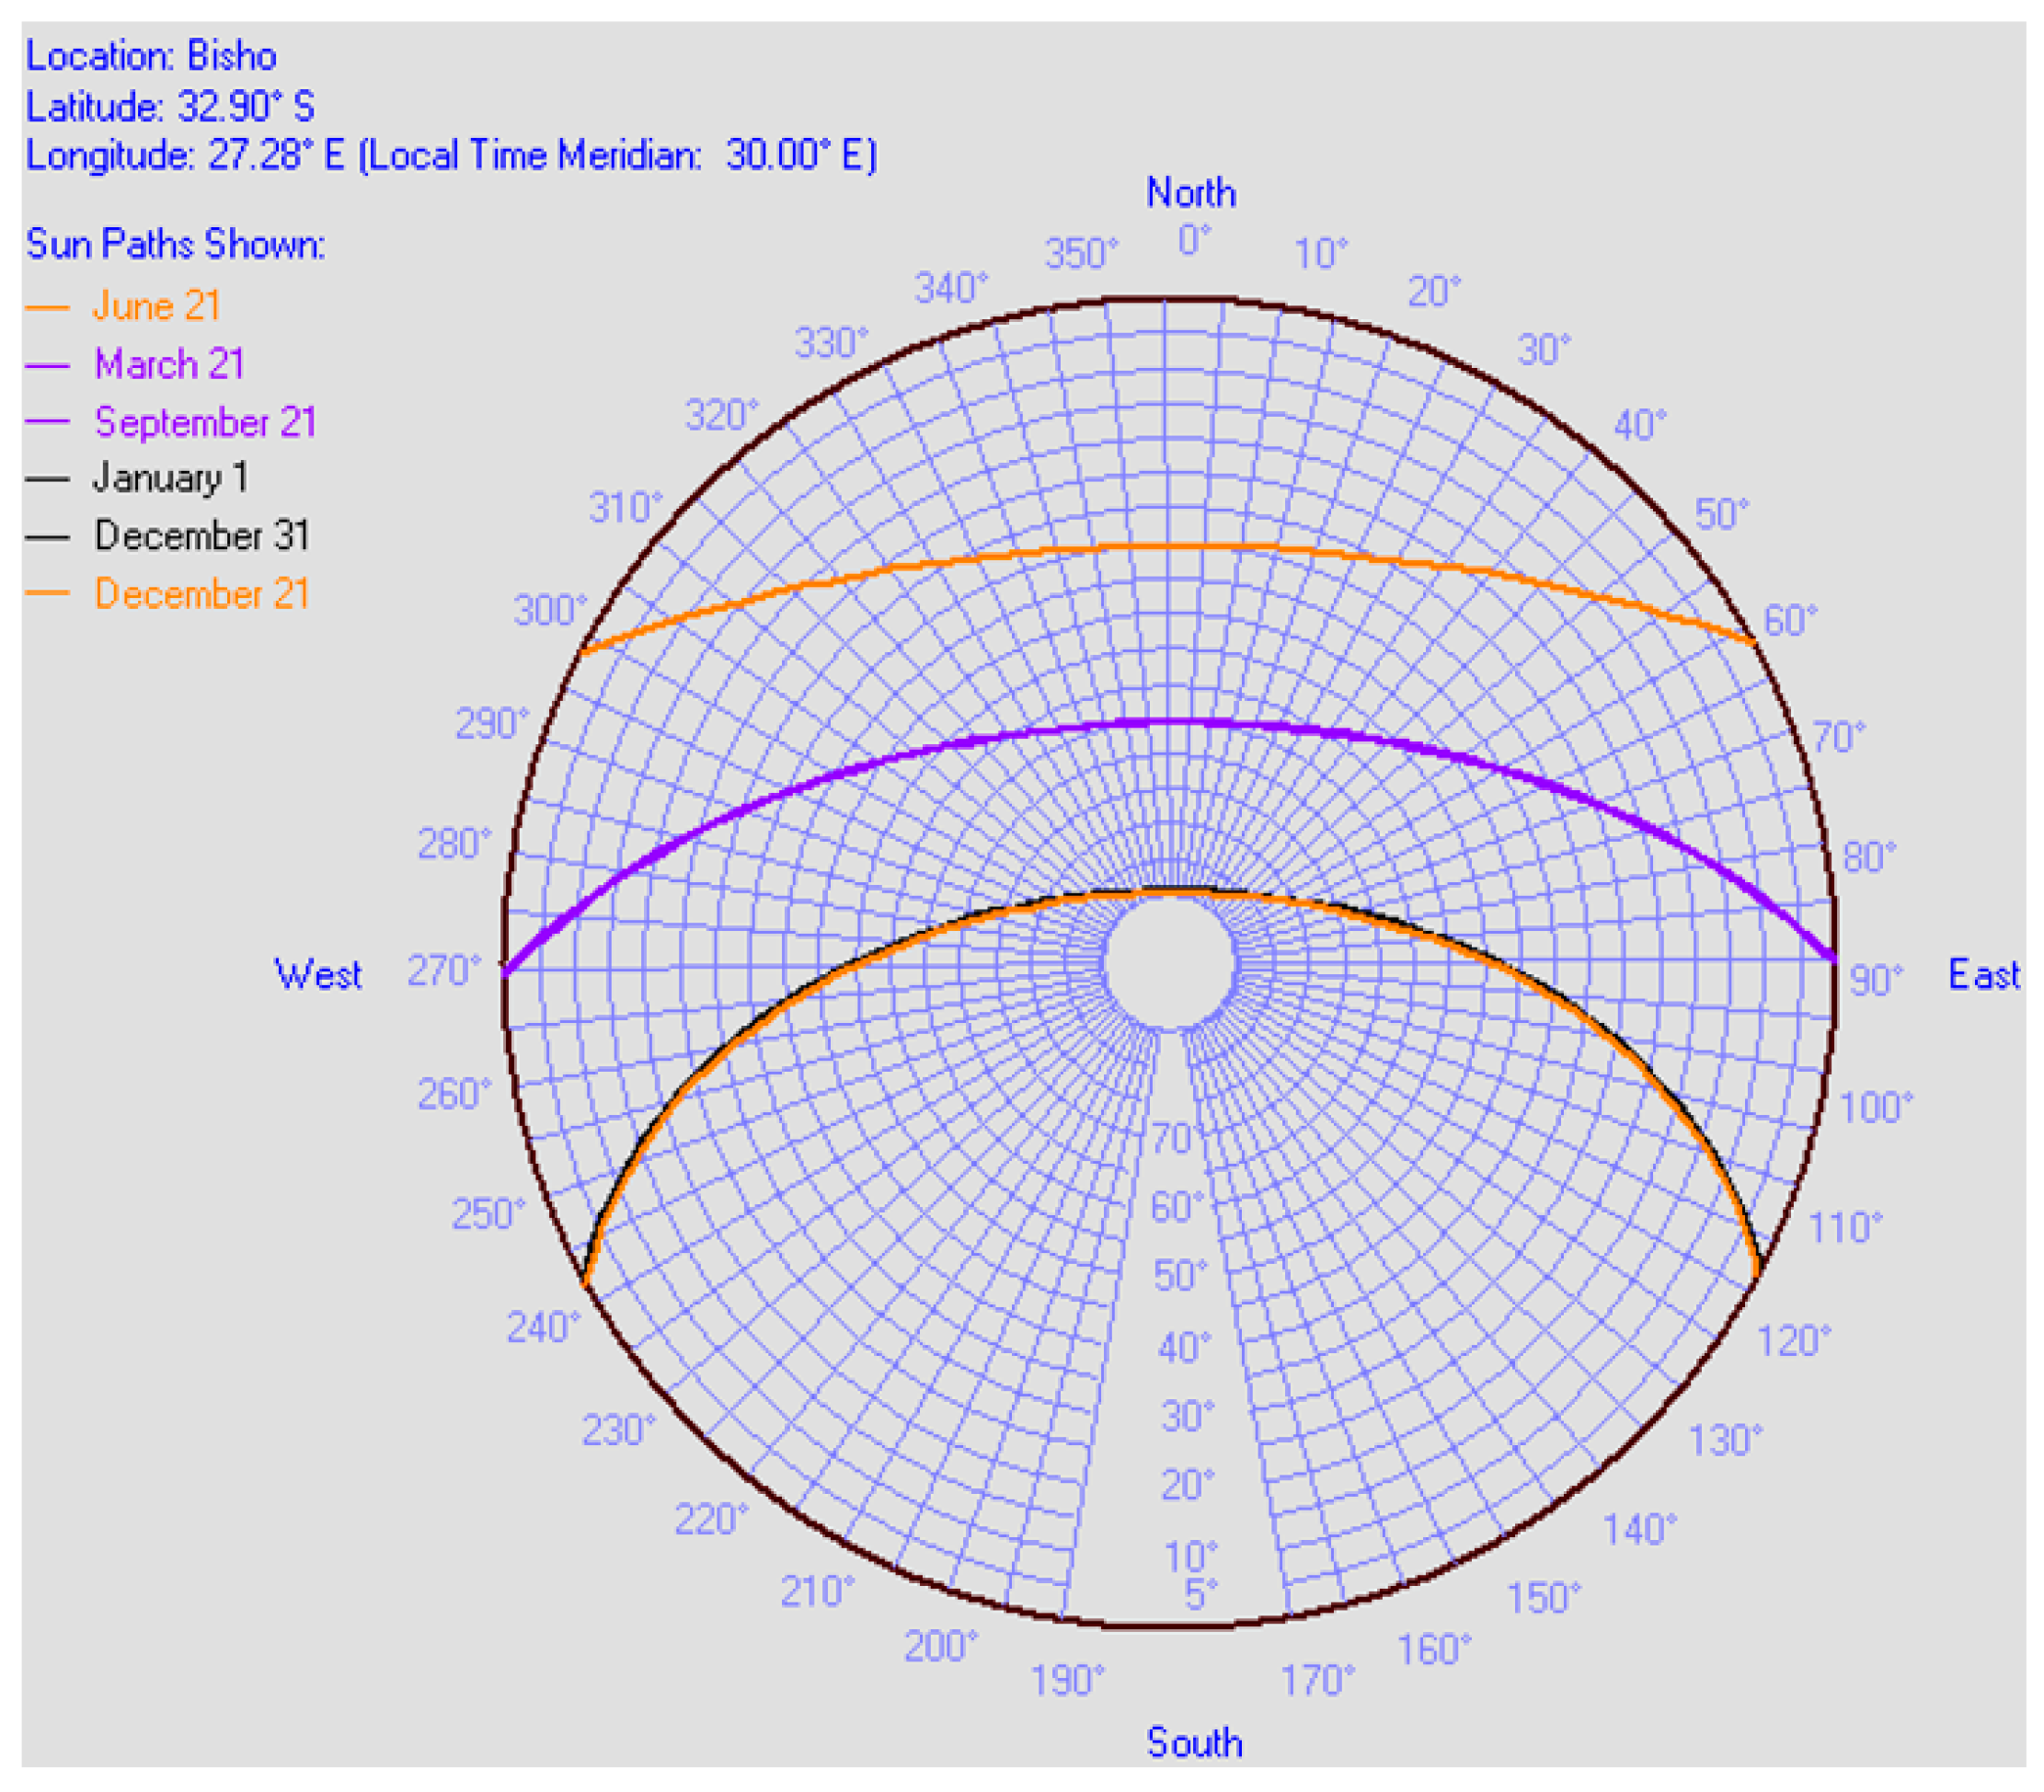
Bisho town, approximately 70 km from Alice, was the nearest weather station in the IESVE database and thus was used in the research. Bisho has a similar rural setting and geographical terrain as Alice. Both towns are classified under the same energy zone in South Africa [26]. A sun path of Bisho town is presented in Figure 7.
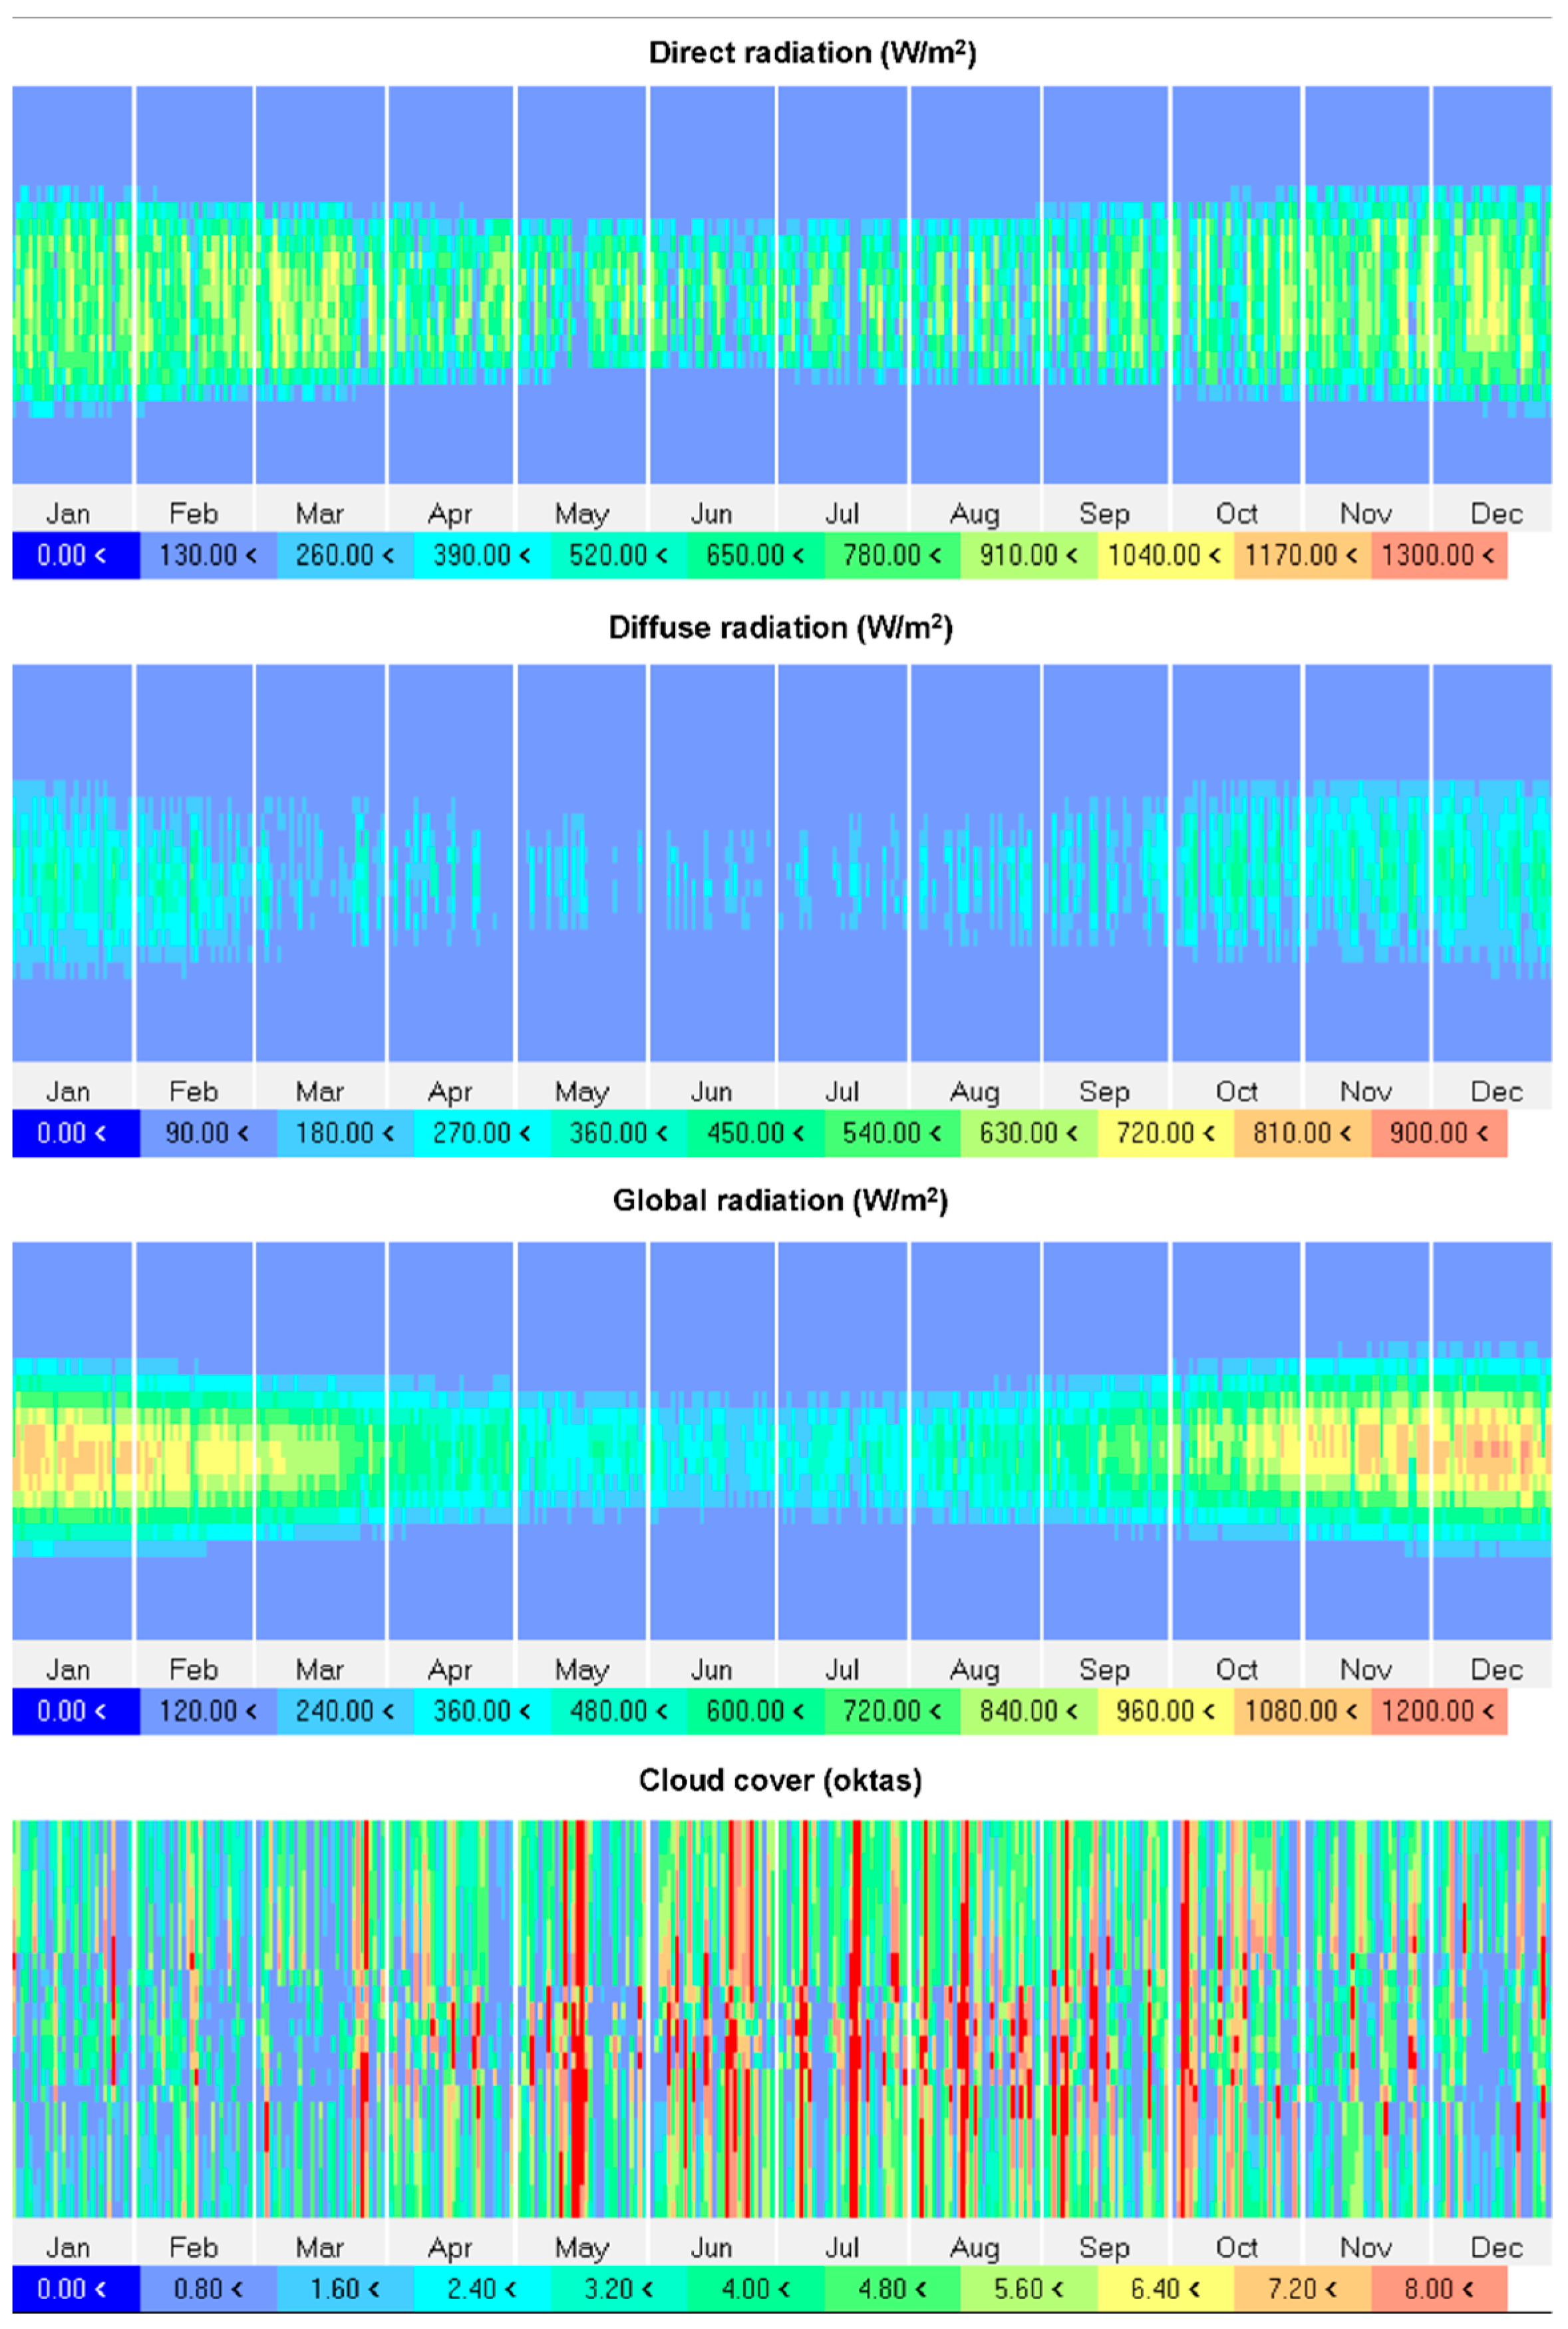
From Figure 7, the building experienced winter and summer solstices on 21 June and 21 December, while equinoxes occurred on 21 March and 21 December. It also experienced a south–east (118.28°) sunrise at 5h00 in the summer solstice, peaking at 12h00, and a south–west (241.70°) sunset at 19h00. A comparatively shorter daytime is observed in the winter solstice, with an approximately 4 h difference. The corresponding solar distribution at the building location is given in Figure 8.
Definitions of the various components of solar radiation and their impact on a building’s thermal performance and daylighting were covered in [31]. The building’s ambient annual average direct, diffuse, and global irradiances were 173.63 W/m2, 38.03 W/m2, and 145.35 W/m2. The corresponding total annual direct irradiation was 2083.51 kWh/m2, while diffuse and global irradiations were 456.40 kWh/m2 and 1744.53 kWh/m2. The simulated seasonal solar radiation trend corresponds with Overen et al. [35]. The author [35] adopted on-site solar radiation data over a year to evaluate the solar photovoltaic power potential of Alice town relative to the various components of solar radiation. Furthermore, in South Africa, June to August is usually considered winter, while September to May serves as summer for scientific and energy performance reporting [36,37].
Cloud clover in IESVE is deduced by the proportion of the sky covered by cloud based on simulated solar radiation from the weather data. The deduced cloud cover is also a key parameter in the CBDM dynamic simulation of the building. Moreover, cloud cover in IESVE aligns with Stull’s [38] sky cover definition.
The author [38], who defined cloud cover as the fraction of the sky covered by cloud, categorised 0 oktas as clear sky, 1 to 3 oktas as few clouds, 4 to 5 oktas as scattered clouds, 6 to 9 oktas as broken clouds, and 10 oktas as an overcast sky. Therefore, the building experiences mostly little clouds cover throughout the year, with an average of 2.98 oktas and scattered clouds during winter.

4. Results and Discussion

The case study building has 47 spaces on both floors, as shown in Figure 2 and Figure 3. The spaces include offices, lecture halls, storage rooms, a staircase, hallways, and bathrooms. For simplicity, selected spaces on both floors that are strategically located to sufficiently illustrate the building’s daylight distribution relative to the sun’s daily transverse were considered in analysing the building’s daylighting performance. As a result, spaces 39, 37, 46, 48, and 49 were used to evaluate the daylight distribution at the building’s ground floor (refer to Figure 2b) west elevation, space 35 was used for south elevation daylight distribution, while spaces 41, 42, 43, and 45 cater to daylighting performance at the building’s east elevation. Only space 41 has a north-facing window on the ground floor, while an abandoned boiler room and storage room occupy the remaining portion of the north elevation. However, the building daylight analysis did not consider the storage and boiler rooms. On the top floor (refer to Figure 2a), daylight performance at the building’s west elevation was analysed with spaces 18, 22, and 23, spaces 3 and 5 were used for the south elevation daylighting analysis, spaces 7, 11, 15, and 14 were used for east elevation daylighting analysis, while daylighting at the north elevation was analysed using space 16.

4.1. Climate-Based Daylight Model Analysis

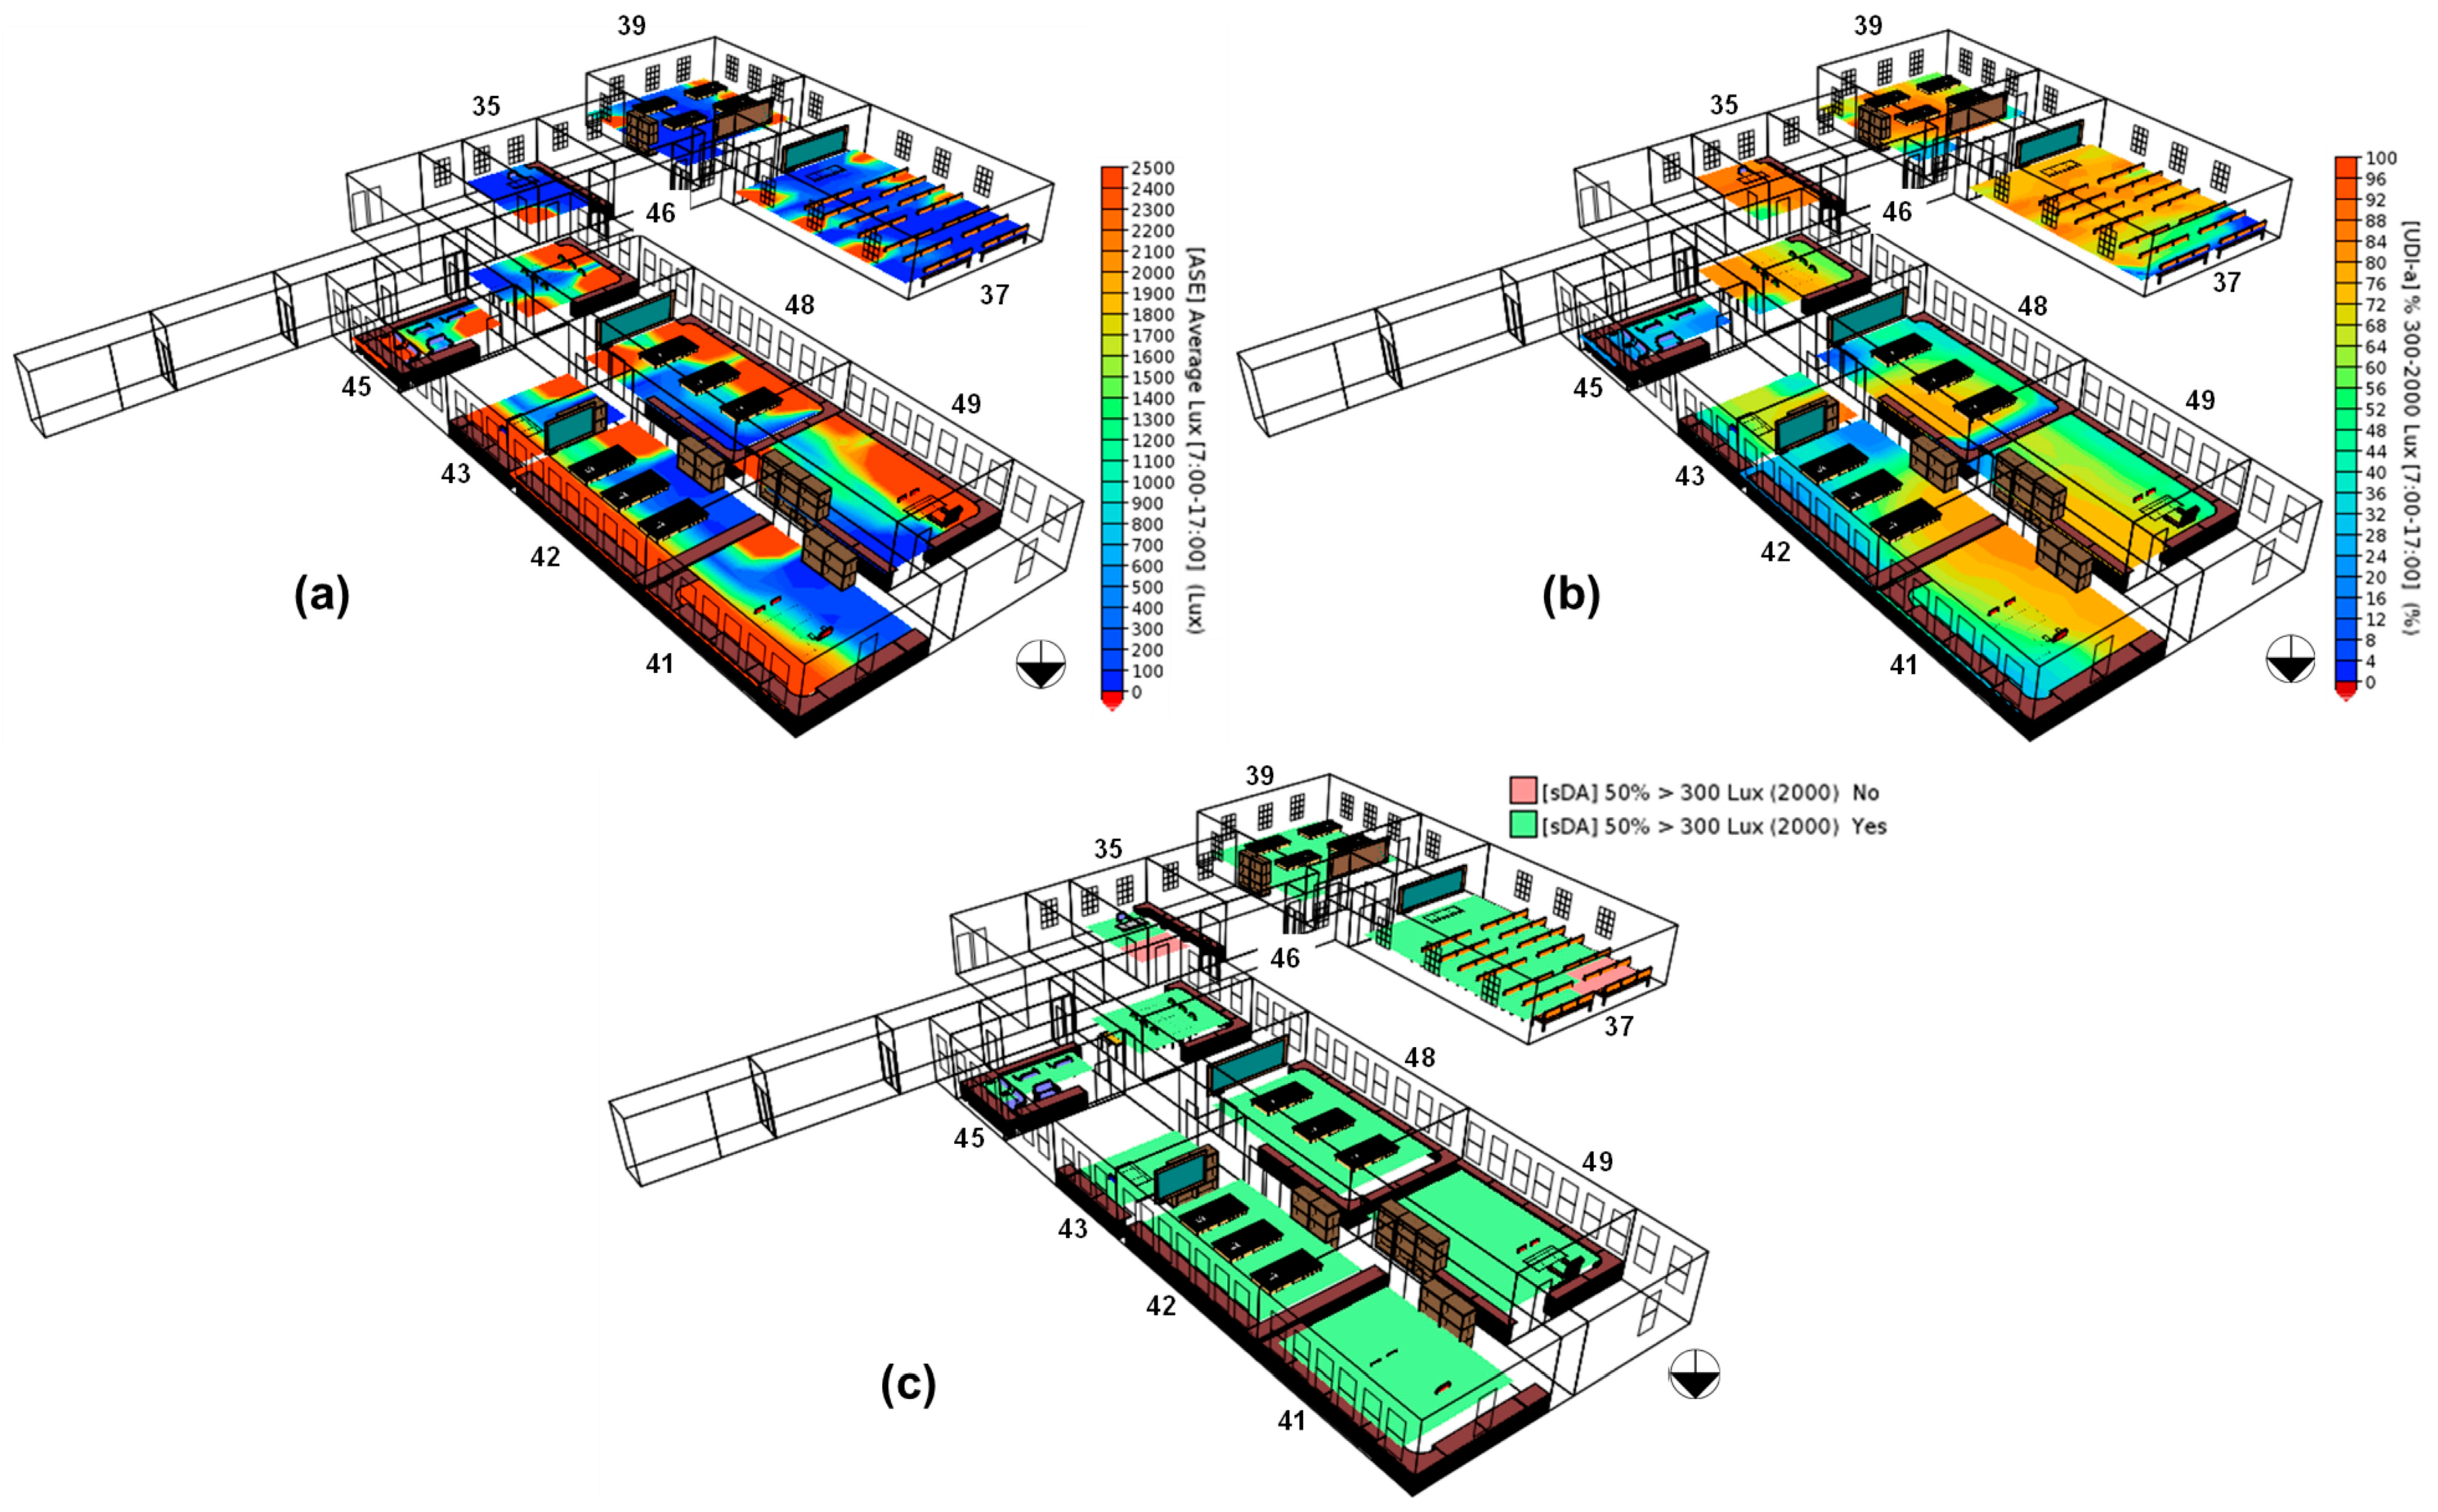
Unlike the absolute analysis, the climate-based daylight model (CBDM) utilises various sky conditions and models based on solar irradiance and illuminance data in weather files to analyse seasonal and annual building daylight performance [7]. CBDM dynamic and long-term analysis made it suitable for assessing building daylighting impact on other crucial aspects of the building, such as energy use intensity and thermal behaviour. It is worth noting that both aspects relative to the building’s daylighting are outside this research’s scope. The CBDM parameters considered in this research are annual sunlight exposure (ASE), useful daylight illuminance (UDI), and spatial daylight autonomy (sDA). The Illuminance Engineering Society of North America (IESNA) [39] describes ASE as the measure of direct sunlight in a given space that poses a risk of glare and visual discomfort. The organisation further indicates that while ASE serves as a vital parameter for daylight glare assessment, sDA is equally crucial in evaluating daylight sufficiency. Thus, sDA is defined as the percentage of floor area that exceeds a minimum daylight illuminance for a specified percentage of hours in a year [39,40]. As proposed by the IESNA [7,39], a 300 lux minimum daylight illuminance (the light level threshold for general office tasks in South Africa) and 50% of hours from 07h00 to 17h00 daily (including weekends and holidays) in a year (sDA300,50%) were adopted in the research. Lastly, UDI is the percentage of occupied time (07h00 to 17h00) in a year that a point in a given space is within a specified illuminance class, usually 100 to 2000 lux [31,41,42]. The CBDM analysis of the building’s ground floor spaces is presented in Figure 9.
All the CBDM metrics in Figure 9 were simulated at the work plane of a 0.75 m and 1 m grid while maintaining a 0.5 m AOI. A whole-year simulation period with occupied hours of 07h00 to 17h00, equivalent to 796 h, was adopted. Figure 9a shows that the building’s average annual direct sunlight is higher at the east and west spaces’ perimeter and decreases towards the inner space. This will result in low indoor horizontal daylight quality due to the difference between the minimum and maximum daylight illuminance, as alluded to by Freewan et al. [34]. Further, the maximum average direct sunlight of 2481.0 lux was observed in space 41 at the east elevation, while space 39 at the southwest had the least direct sunlight of 504.89 lux. Also, direct sunlight in the east spaces was always above zero during the occupied period (07h00 to 17h00) throughout the year, while minimum direct sunlight of zero was observed in spaces 35, 39, 46, 48, and 49.
To analyse the UDI, the generated annual UDI was classified into four bin classes based on existing studies [31,41,43]. Also, according to the South African Department of Labour [44], 300 lux is conducive for general office tasks and conference rooms, while 300 to 2000 lux was considered the daylight threshold. This is in agreement with Rastegari’s [5] CBDM assessment. Therefore, periods with illuminance less than 100 lux fall short of useful illuminance, illuminance between 100 and 300 lux requires supplementary electric lights for visual comfort, illuminance between 300 and 2000 lux does not require electric light for visual comfort, and illuminance above 2000 lux is outside the useful illuminance and may result in glare. The outcome of the UDI classification in the building’s selected spaces is shown in Figure 10.
Comparing Figure 9a,b, spaces with high ASE tend to have low UDI300-2000 due to direct sunlight illuminance outside the bin class. The average ASE of east and west spaces was 2311.29 lux and 1350.64 lux, while their respective UDI300-2000 values were 49.60% and 67.30%. However, space 35 was found to have the highest percentage of UDI300-2000 at 84.09% with an ASE of 518.06 lux, while space 45, with an ASE of 2480.63 lux, had the lowest percentage of UDI300-2000 at 30.34%. As shown in Figure 10, the low percentage of UDI300-2000 observed in space 45 does not necessarily imply that the space’s daylight illuminance fell short of UDI. In this case, the daylight illuminance of the points in space 45 was above 2000 lux for 67.05% of the occupied hours in the year, which poses a risk of glare and visual discomfort. But this is not the case in space 35, with the lowest UDI2000 percentage of 4.74%. Further, space 37 was found to have the most occupied hours with daylight illuminance that fell short of UDI (3.94%), as well as requires electric lights for visual comfort (15.99%).
Furthermore, sDA300,50% was found to be 100% for all the building’s selected spaces except for spaces 35 and 39, with 60.0% and 92.05%, respectively. The IESNA [39] classified spaces with sDA300,50% < 55.0% as having insufficient daylight, 55.0% ≥ SDA300,50% < 75% as acceptable daylit spaces, and sDA300,50% ≥ 75% as favourable. Based on the above classification, the daylighting of the building’s selected spaces is favourable for 50% of the occupied period in a year, while space 35’s daylighting is acceptable.
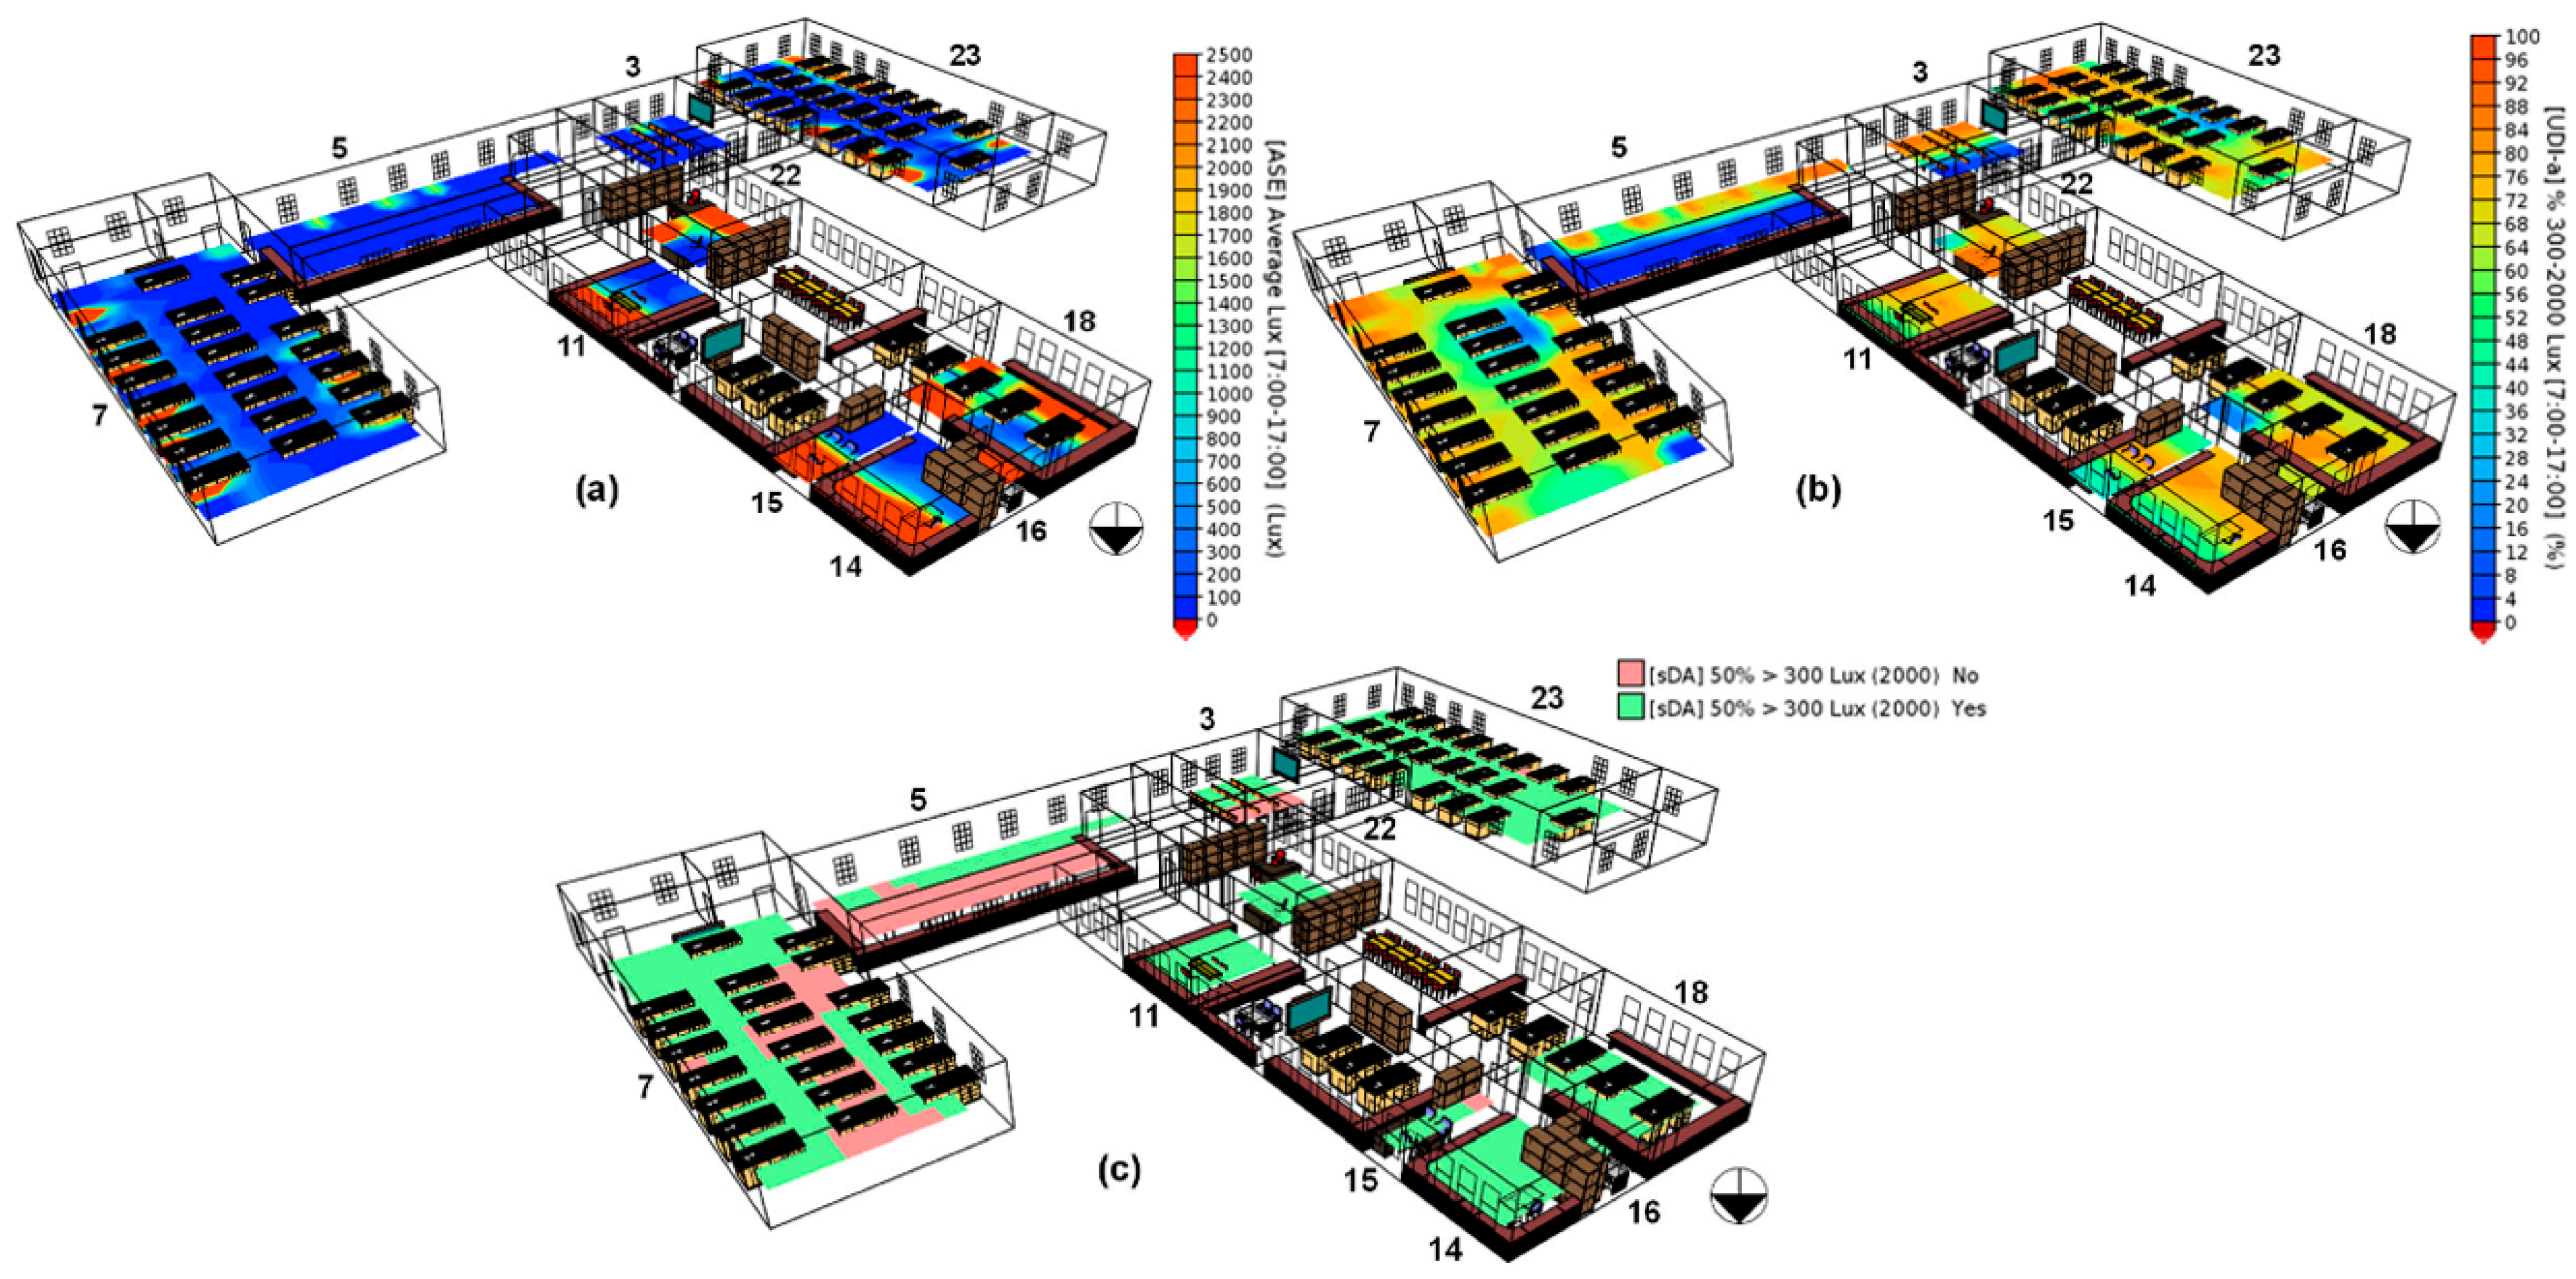
On the building’s top floor spaces, in Figure 11, space 16 in the north was found to have the highest ASE of 2314.25 lux, while space 5 in the south had the lowest ASE of 78.40 lux.
During the research, it was observed that the low winter sun angle penetrates the building’s north-facing windows, resulting in the high direct sunlight in space 16. In contrast, the lack of direct solar radiation at the south elevation resulted in low direct sunlight in the south spaces (5 and 3) throughout the year. This is supported by the building’s location sun path diagram in Figure 7. As observed on the ground floor, the top floor east spaces experienced more direct sunlight, with an average ASE higher by 702.71 lux. Comparing both floors, the ground floor east and west spaces were slightly higher by 702.71 and 20.06 lux. This is not conclusive that buildings’ ground floor spaces received more direct sunlight than top floor spaces. However, the finding illustrates the direct sunlight illuminance of the spaces on both floors due to differences in window-to-wall ratio, floor area, orientation, and adjacent buildings.
Further, the maximum UDI300-2000 observed on the top floor was 74.36% in space 22 at the west, while south-facing space 5 was observed to have the lowest UDI300-2000 of 32.45%. Figure 10b shows that the UDI300-2000 in less than half of space 5 toward the window was between 56.0% and 92.0%, while the UDI300-2000 in the other half ranges from 12% to 0%. The top floor selected spaces’ UDI classification outcome is presented in Figure 12.
As shown in Figure 12, the west and east spaces have the highest percentage of occupied hours with illuminance within the 300 to 2000 lux threshold. The average percentage of UDI300-2000 was 65.59% in the east spaces and 68.44% in the west spaces. Space 5 was found to have the highest-percentage occupied period that required supplementary electric lights for visual comfort as well as daylight that fell short of UDI. The daylighting underperformance of space 5 was also evident in Figure 11c. The space was found to have the lowest sDA300,50% with 35.90%. Based on the IESNA classification, space 5 is insufficiently daylit. However, space 5 is dominantly used as an optic laboratory that requires minimum daylight. During the experimental session, the windows are usually covered with a thick screen to prevent daylight penetration, as shown in Figure 3. Hence, placing the laboratory at the south elevation offsets the space’s poor daylighting performance. Further, space 3, with the second-lowest sDA300,50% at 60%, falls under acceptable daylighting, while all other spaces’ daylighting is favourable.

4.2. Glare and Visual Comfort

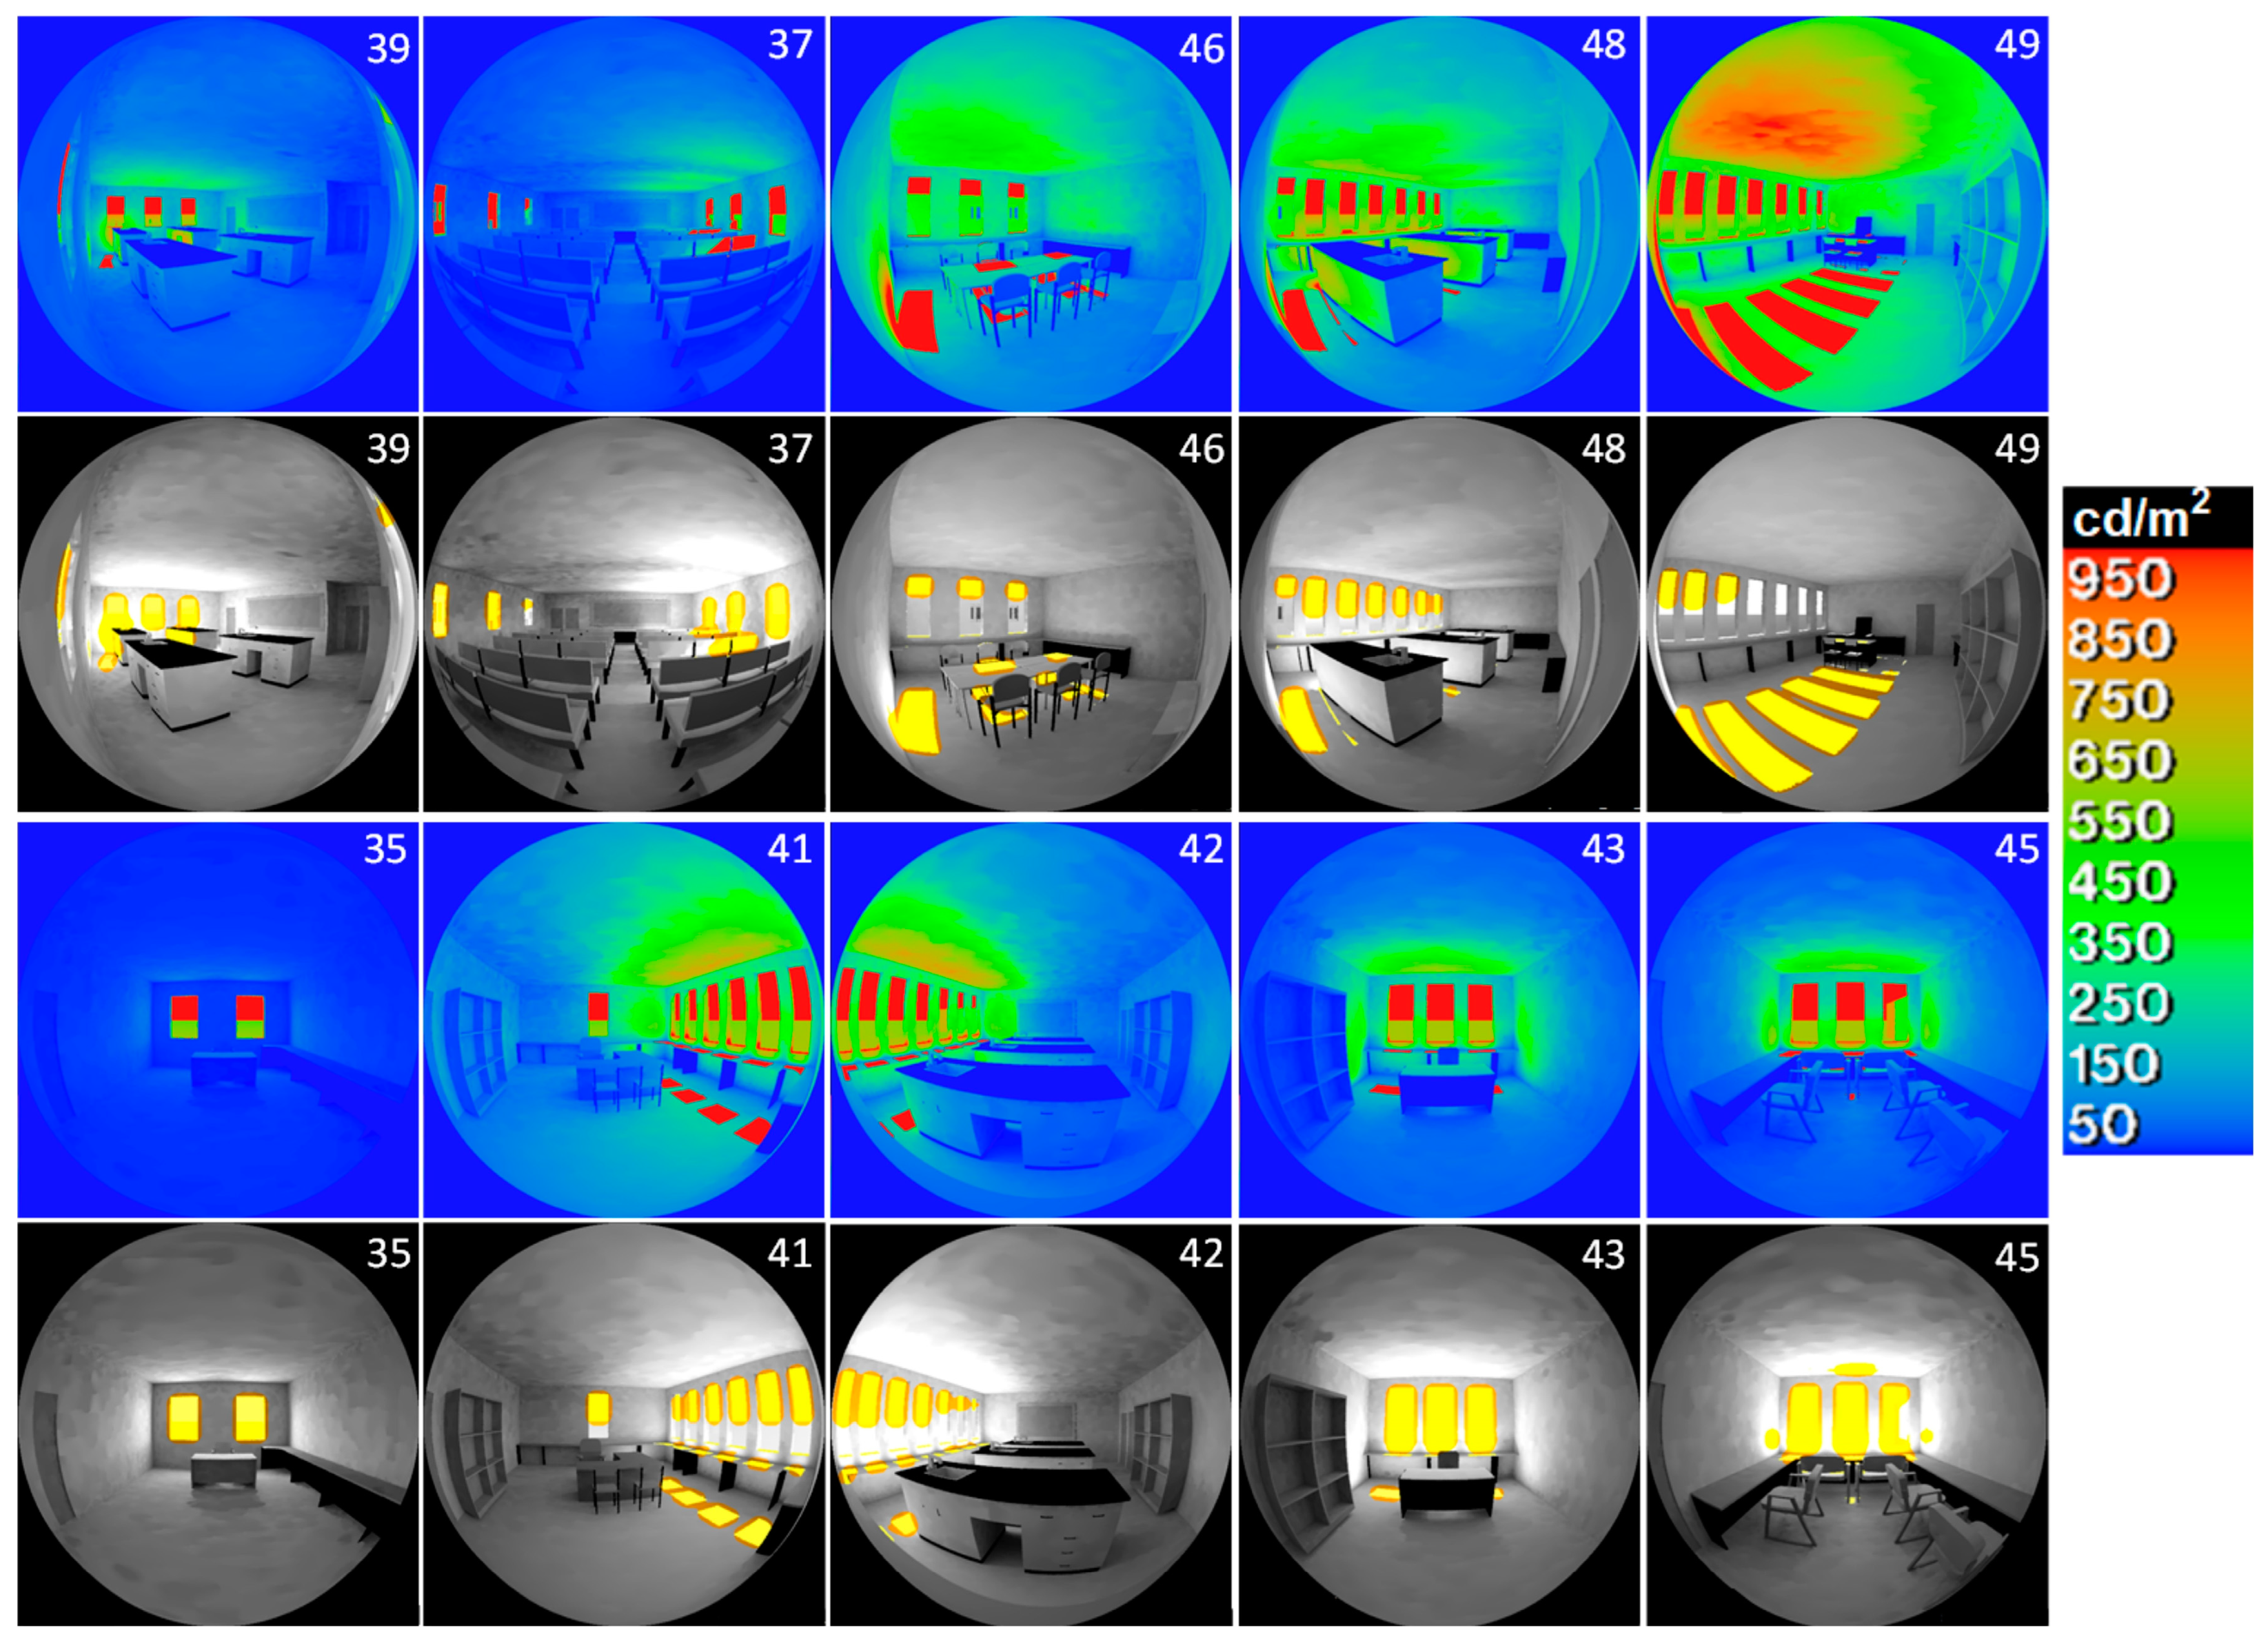
In support of the CBDM assessment, daylight glare and visual comfort analysis were conducted to illustrate the degree of discomfort. Glare analysis deals with the impact and possible perspective of an occupant on the daylight, which determines the effectiveness and energy-saving potential of the building’s daylighting design. According to Paone et al. [45], occupants’ preferences and behaviour bridge the gap between predicted building energy performance at the design stage and operating conditions. Over the years, several metrics have been used to evaluate discomfort glare, and they are classified based on luminous light sources [42]. Glare associated with artificial lighting is quantified using unified glare rating (UGR), CIE glare index (CGI), and visual comfort probability (VCP), while daylight glare probability (DGP) and daylight glare index (DGI) are used to evaluate natural light glare. In addition, discomfort glare which leads to visual irritation is attributed to excessive brightness, where excessive brightness is the difference between extremely bright and dark areas in a given space [46]. They classified glare metrics into contrast effect-based, saturation effect-based, and hybrid effect-based. In view of this classification, DGI, UGR, and CGI are contrast effect-based, while DGP and predicted glare sensation vote (PGSV) are saturated effect-based and hybrid effect-based. However, DGP is the most robust, reliable, and widely used metric [45]. It is widely used and recommended in the EN17037 (daylight in buildings) [46]. Owing to the appraised studies, DGP was adopted to evaluate the building daylighting discomfort glare under CIE Overcast Sky conditions, as shown in Figure 13 and Figure 14.
Spaces 49 and 35 were found to have the maximum and lowest average background luminance of 628 cd/m2 and 25.63 cd/m2, respectively. The corresponding DGP was found to be 34.74% for space 49 and 6.05% for space 35. Further, a direct relationship was observed between the selected spaces’ window-to-wall ratio and DGP, with an R2 value of 0.27. The weak regression between both parameters is due to the spaces’ orientation. Hence, the window-to-wall and DGP regression per orientation resulted in a 0.82 R2 value for east-orientated spaces and 0.83 for spaces in the west. Also, an inverse relationship was observed between spaces (east) 41, 42, 43, and 45 window-to-wall ratios and DGP. Space 41 had the lowest window-to-wall ratio but a north-facing window that increased its brightness, resulting in the highest DGP among the four spaces. In terms of spaces 43 and 45, the amount of daylighting in the spaces and the relatively small floor area resulted in a high DGP in the spaces compared to space 45. In the west elevation spaces, the DGP was found to increase with the window–wall ratio, with space 49 having the highest window-to-wall ratio of 0.33 and the highest DGP of 34.74. However, the building’s daylight glare condition is imperceptible, as summarised in Table 3.
Several studies [47,48,49] have classified DGP lesser than or equal to 0.35 as “Imperceptible glare”, between 0.35 and 0.40 as “Perceptible or Noticeable glare”, from 0.40 to 0.45 as “Disturbing glare”, while DGP greater than or equal to 0.45 is considered “Intolerable glare”. Given the above DGP classification, the building occupants are expected to be visually comfortable with the daylight illuminance. However, the task or work plane colour and the occupants’ age may alter perception and visual comfort. Furthermore, a similar glare analysis was conducted for the top floor spaces, as presented in Figure 12, revealing that space 5 at the south elevation with 24.47 cd/m2 had the lowest luminance and space 22 at the west elevation with 193.93 cd/m2 had the maximum luminance.
Space 5 was also found to have the lowest DGP of 8.72%, but space 22 had the second-highest DGP of 24.74%, while space 15, with the maximum window-to-wall ratio, had the highest DGP of 25.08%. Also, a weak incremental relationship of 0.36 R2 was observed between the window-to-wall ratio and DGP of the building. However, the R2 value increased to 0.62 for spaces at the east elevation and 0.87 for the west elevation spaces. The daylight glare level of the top floor spaces was also imperceptible, as summarised in Table 4.

5. Limitations and Recommendations

The results presented in the study indicate the design stage daylighting performance of the building. Human factors such as the use of window covers (blinds and curtains) or tinted glass were not considered. Daylight glare discomfort analysis was limited to daylight illuminance in the selected space. In other words, the glare analysis, limited to DGP, was determined by the amount of daylight in the spaces (luminance) as a factor of the amount of light entering the space relative (illuminance) to the window-to-wall ratio and orientation. Other factors were not covered, such as work plane colour, walls’ inner surface colour, task, and occupants’ age. The occupants’ level of visual discomfort relative to their view path and daylight sources (windows), as expressed by DGI, is another critical glare parameter associated with vertical daylighting not considered in the study. Regarding accuracy and generalisation of the findings, the research is limited to simulated data based on a satellite weather file, although the adopted approach and software application have been validated by existing studies [34,50]. It is worth noting that simulation, as adopted in this research, is not a replacement for actual data measurement for existing buildings but was chosen due to a lack of instrumentation for whole-building measurements of this magnitude. Nonetheless, results from the simulation were comparable to existing studies where simulation and data measurement have been adopted. This somewhat presents validation for the obtained simulation results in the study. Further, only one heritage building design was considered, and it was limited to selected spaces and a particular climate condition.
In view of the outlined limitations, the choice of window cover plays a crucial role in indoor daylighting and should be carefully considered for effective daylight in heritage buildings. Modern buildings have adopted dynamic photosensors to aid the operation of window covers based on indoor and outdoor daylight illuminance [41,51,52]. Thus, using automatic daylight-linked sensors to dynamically operate the window covers will enhance effective indoor daylighting and reduce overall energy use intensity due to reduced electric light dependency. However, research on the impact of curtain fabric texture and opacity as well as blinds on daylighting is recommended for spaces with sensitive materials and security concerns. From the research findings, floor arrangement can be used to optimise available daylight in heritage buildings. This requires allocating building spaces based on light requirements and period of occupancy. Spaces with UDI300-2000 should be targeted, depending on the task and local lighting requirements.

6. Conclusions

This research evaluated the daylight performance of a heritage place of instruction and office building. The research used a heritage building at the University of Fort Hare in South Africa as a case study. A quantitative research approach based on building information simulation tools was adopted. Autodesk Revit 2021 21.0.0.383 and Integrated Environmental Solutions Virtual Environment (IESVE) 2021 Pack 4 version 2021.4.0.0 were used in modelling and simulating the building daylighting performances. Selected spaces that sufficiently illustrate the building daylighting relative to the sun daily transverse were identified and used to evaluate the building’s daylighting performance. On the building’s ground floor, the south-facing space was found to have the lowest percentage of the day with daylight illuminance within the visual comfort threshold of 300 to 2000 lux. CBDM, adopted to analyse the building’s annual daylight performance, shows that points in the analysed spaces were within the UDI300-2000 for more than 50% of the occupied period (07h00 to 17h00) in a year. According to the IESNA, most of the building spaces analysed were considered favourably daylit spaces due to an sDA300,50% of 100%. In terms of daylight discomfort glare, the building’s selected spaces’ daylight illuminance was found to be imperceptible. Further, the relationship between DGP and window was found to be a factor of the building orientation.
Based on the research findings, heritage buildings have the potential to adopt daylight effectively for daily visual activities, thereby reducing electric light dependency and overall building energy use intensity without invasive daylighting retrofits, meeting modern building energy use requirements without invasive retrofits as a result. For effective daylighting in heritage buildings, floor space should be allocated based on lighting requirements to optimise daylit spaces or points. At the same time, the use of non-invasive dynamic photosensors to aid the operation of window covers based on daylight to mitigate glare and electric light dependency was also recommended.

Author Contributions

Conceptualization, O.K.O.; methodology, O.K.O. and E.L.M.; software, O.K.O.; validation, O.K.O., E.L.M. and G.M.; formal analysis, O.K.O. and E.L.M.; investigation, O.K.O. and G.M.; resources, O.K.O. and G.M.; data curation, G.M.; writing—original draft preparation, O.K.O. and E.L.M.; writing—review and editing, O.K.O., E.L.M. and G.M.; visualization, O.K.O.; funding acquisition, O.K.O. and E.L.M. All authors have read and agreed to the published version of the manuscript.

Funding

This research was funded by the National Research Foundation grant number 129641, Department of Science and Innovation, Eskom, and Govan Mbeki Research and Development Centre.

Data Availability Statement

Not applicable.

Acknowledgments

Special thanks to Daniel Irurah for his technical support and contributions to the research. Also, to all the University of Fort Hare, Physics Department staff members for their cooperation during the research.

Conflicts of Interest

The authors declare no conflict of interest.

References

  1. Hong Kong Green Building Council Limited. Green Building Design Building Design Best Practice Guidebook; Hong Kong Green Building Council Limited: Hong Kong, China, 2021. [Google Scholar]
  2. Kent, M.; Huynh, N.K.; Schiavon, S.; Selkowitz, S. Using support vector machine to detect desk illuminance sensor blockage for closed-loop daylight harvesting. Energy Build. 2022, 274, 112443. [Google Scholar] [CrossRef]
  3. Flor, J.F.; Liu, X.; Sun, Y.; Beccarelli, P.; Chilton, J.; Wu, Y. Switching daylight: Performance prediction of climate adaptive ETFE foil façades. Build. Environ. 2022, 209, 108650. [Google Scholar] [CrossRef]
  4. Flor, J.F.; Liu, D.; Sun, Y.; Beccarelli, P.; Chilton, J.; Wu, Y. Optical aspects and energy performance of switchable ethylene-tetrafluoroethylene (ETFE) foil cushions. Appl. Energy 2018, 229, 335–351. [Google Scholar] [CrossRef]
  5. Rastegari, M.; Pournaseri, S.; Sanaieian, H. Daylight optimization through architectural aspects in an office building atrium in Tehran. J. Build. Eng. 2021, 33, 101718. [Google Scholar] [CrossRef]
  6. Li, S.; Li, D.H.W.; Chen, W.; Lou, S.; Tsang, E.K.W. Simple mathematical models to link climate-based daylight metrics with daylight factor metrics and daylighting design implications. Heliyon 2023, 9, e15786. [Google Scholar] [CrossRef]
  7. Brembilla, E.; Drosou, N.C.; Mardaljevic, J. Assessing daylight performance in use: A comparison between long-term daylight measurements and simulations. Energy Build. 2022, 262, 111989. [Google Scholar] [CrossRef]
  8. Hong, X.; Shi, F.; Wang, S.; Yang, X.; Yang, Y. Multi-objective optimization of thermochromic glazing based on daylight and energy performance evaluation. In Building Simulation; Springer: Berlin/Heidelberg, Germany, 2021; Volume 14, pp. 1685–1695. [Google Scholar]
  9. Omrany, H.; Ghaffarianhoseini, A.; Berardi, U.; Ghaffarianhoseini, A.; Li, D.H.W. Is atrium an ideal form for daylight in buildings? Archit. Sci. Rev. 2020, 63, 47–62. [Google Scholar] [CrossRef]
  10. Wu, P.; Zhou, J.; Li, N. Influences of atrium geometry on the lighting and thermal environments in summer: CFD simulation based on-site measurements for validation. Build. Environ. 2021, 197, 107853. [Google Scholar] [CrossRef]
  11. Kwong, Q.J. Light level, visual comfort and lighting energy savings potential in a green-certified high-rise building. J. Build. Eng. 2020, 29, 101198. [Google Scholar] [CrossRef]
  12. Al-Sallal, K.A.; AbouElhamd, A.R.; Dalmouk, M.B. UAE heritage buildings converted into museums: Evaluation of daylighting effectiveness and potential risks on artifacts and visual comfort. Energy Build. 2018, 176, 333–359. [Google Scholar] [CrossRef]
  13. Qiu, Z.; Wang, J.; Yu, B.; Liao, L.; Li, J. Identification of passive solar design determinants in office building envelopes in hot and humid climates using data mining techniques. Build. Environ. 2021, 196, 107566. [Google Scholar] [CrossRef]
  14. Marzouk, M.; Eissa, A.; ElSharkawy, M. Influence of light redirecting control element on daylight performance: A case of egyptian heritage palace skylight. J. Build. Eng. 2020, 31, 101309. [Google Scholar] [CrossRef]
  15. Soleimani, K.; Abdollahzadeh, N.; Zomorodian, Z.S. Improving daylight availability in heritage buildings: A case study of below-grade classrooms in Tehran. J. Daylighting 2021, 8, 120–133. [Google Scholar] [CrossRef]
  16. Ide, L.; Gutland, M.; Bucking, S.; Santana Quintero, M. Balancing Trade-offs between Deep Energy Retrofits and Heritage Conservation: A Methodology and Case Study. Int. J. Archit. Herit. 2022, 16, 97–116. [Google Scholar] [CrossRef]
  17. Alrubaih, M.S.; Zain, M.F.M.; Alghoul, M.A.; Ibrahim, N.L.N.; Shameri, M.A.; Elayeb, O. Research and development on aspects of daylighting fundamentals. Renew. Sustain. Energy Rev. 2013, 21, 494–505. [Google Scholar] [CrossRef]
  18. Kent, M.G.; Jakubiec, J.A. An examination of range effects when evaluating discomfort due to glare in Singaporean buildings. Light. Res. Technol. 2022, 54, 514–528. [Google Scholar] [CrossRef]
  19. United Nations Environmental Programme. Executive Summary of the 2020 Global Status Report for Buildings and Construction; Global Alliance for Buildings and Construction: Paris, France, 2020. [Google Scholar]
  20. UN-Habitat. World Cities Report 2020: The Value of Sustainable Urbanization; United Nations Human Settlements Programme (UN-Habitat): Nairobi, Kenya, 2020. [Google Scholar]
  21. Todes, A. Densifying Johannesburg: Context, policy and diversity. J. Hous. Built Environ. 2018, 33, 281–299. [Google Scholar] [CrossRef]
  22. Boyko, C.T.; Cooper, R. Clarifying and re-conceptualising density. Prog. Plan. 2011, 76, 1–61. [Google Scholar] [CrossRef]
  23. Said, S.Y.; Zafia, H.; Hamid, A.; Wongso, J. The Users’ Perceptions on Adaptive Reuse of Selected Heritage Shophouses. In Proceedings of the 10th AMER International Conference on Quality of Life, Pulau Pinang, Malaysia, 16–17 March 2022; pp. 249–254. [Google Scholar]
  24. Morrow, S.; Gxabalashe, K. The Records of the University of Fort Hare. Hist. Afr. 2000, 27, 481–497. [Google Scholar] [CrossRef]
  25. University of Fort Hare. University of Fort Hare Centenary—100 years—1916 to 2016; University of Fort Hare: Alice, South Africa, 2017; Available online: http://centenary.ufh.ac.za/ (accessed on 16 April 2022).
  26. SANS 10400-XA; The Application of National Building Regulations. Part X: Environmental Sustainability. Part XA: Energy Usage in Buildings. South African Bureau of Standards: Pretoria, South Africa, 2021.
  27. SANS 1544; Energy Performance Certificate for Building. South African Bureau of Standards: Pretoria, South Africa, 2014.
  28. South Africa Heritage Resources Agency. National Heritage Resources Act (Act 25 of 1999); Government Gazette; South Africa Heritage Resources Agency: Pretoria, South Africa, 1999. [Google Scholar]
  29. SANS 204; Energy Efficiency in Buildings. South African Bureau of Standards: Pretoria, South Africa, 2011; pp. 1–65.
  30. Bradshaw, V. The Building Environment: Active and Passive Control Systems, 3rd ed.; John Wiley & Sons: Hoboken, NJ, USA, 2006; ISBN 978-0-471-68965-2. [Google Scholar]
  31. Overen, O.K.; Meyer, E.L.; Makaka, G. Indoor Daylighting and Thermal Response of a Passive Solar Building to Selective Components of Solar Radiation. Buildings 2021, 11, 34. [Google Scholar] [CrossRef]
  32. Autodesk Inc. Autodesk Revit; Autodesk Inc.: San Rafael, CA, USA, 2021. [Google Scholar]
  33. Integrated Environmental Solution Limited. Integrated Environmental Solution Limited Virtual Environment; Integrated Environmental Solution Limited: London, UK, 2021. [Google Scholar]
  34. Freewan, A.A.Y.; Al Dalala, J.A. Assessment of daylight performance of Advanced Daylighting Strategies in Large University Classrooms; Case Study Classrooms at JUST. Alexandria Eng. J. 2020, 59, 791–802. [Google Scholar] [CrossRef]
  35. Overen, O.K.; Meyer, E.L. Solar Energy Resources and Photovoltaic Power Potential of an Underutilised Region: A Case of Alice, South Africa. Energies 2022, 15, 4646. [Google Scholar] [CrossRef]
  36. South Africa Weather Service. How Are the Dates of the Four Seasons Worked Out? WeatherSA: Pretoria, South Africa, 2012; pp. 1–4. Available online: http://www.weathersa.co.za/learning/weather-questions/82-how-are-the-dates-of-the-four-seasons-worked-out (accessed on 4 May 2013).
  37. Overen, O.K.; Meyer, E.L.; Makaka, G. Thermal, Economic and Environmental Analysis of a Low-Cost House in Alice, South Africa. Sustainability 2017, 9, 425. [Google Scholar]
  38. Stull, R. Practical Meteorology: An Algebra-Based Survey of Atmospheric Science, 1st ed.; University of British Columbia: Vancouver, BC, Canada, 2017; ISBN 9780888652836. [Google Scholar]
  39. IESNA. IES Spatial Daylight Autonomy (sDA) and Annual Sunlight Exposure (ASE), Daylight Metrics Committee. Approved Method IES LM-83-12; Illuminating Engineering Society of North America: New York, NY, USA, 2012. [Google Scholar]
  40. Zhang, W.; Lu, L. Overall energy assessment of semi-transparent photovoltaic insulated glass units for building integration under different climate conditions. Renew. Energy 2019, 134, 818–827. [Google Scholar] [CrossRef]
  41. Kunwar, N.; Cetin, K.S.; Passe, U.; Zhou, X.; Li, Y. Energy savings and daylighting evaluation of dynamic venetian blinds and lighting through full-scale experimental testing. Energy 2020, 197, 117190. [Google Scholar] [CrossRef]
  42. Montaser Koohsari, A.; Heidari, S. Subdivided venetian blind control strategies considering visual satisfaction of occupants, daylight metrics, and energy analyses. Energy Build. 2022, 257, 111767. [Google Scholar] [CrossRef]
  43. Li, N.; Miao, X.; Geng, W.; Li, Z.; Li, L. Energy & Buildings Comprehensive renovation and optimization design of balconies in old residential buildings in Beijing: A study. Energy Build. 2023, 295, 113296. [Google Scholar]
  44. Department of Labour. Environmental Regulations for Workplaces; Government Notice R: 2281; Department of Labour: Pretoria, South Africa, 1993. [Google Scholar]
  45. Paone, A. The Impact of Building Occupant Behavior on Energy Efficiency and Methods to Influence It: A Review of the State of the Art. Energies 2018, 11, 953. [Google Scholar] [CrossRef] [Green Version]
  46. Jain, S.; Karmann, C.; Wienold, J. Behind electrochromic glazing: Assessing user’s perception of glare from the sun in a controlled environment. Energy Build. 2022, 256, 111738. [Google Scholar] [CrossRef]
  47. Suk, J.; Schiler, M. Investigation of Evalglare software, daylight glare probability and high dynamic range imaging for daylight glare analysis. Light. Res. Technol. 2013, 45, 450–463. [Google Scholar] [CrossRef]
  48. Hong, X.; Lin, J.; Yang, X.; Wang, S.; Shi, F. Comparative Analysis of the Daylight and Building-Energy Performance of a Double-Skin Facade System with Multisectional Shading Devices of Different Control Strategies. J. Energy Eng. 2022, 148, 05022001. [Google Scholar] [CrossRef]
  49. Mesloub, A.; Ghosh, A.; Touahmia, M.; Abdullah, G.; Alsolami, B.M.; Ahriz, A. Assessment of the overall energy performance of an SPD smart window in a hot desert climate The International Commission on Illumination. Energy 2022, 252, 124073. [Google Scholar] [CrossRef]
  50. Yang, H.; Guo, B.; Shi, Y.; Jia, C.; Li, X.; Liu, F. Interior daylight environment of an elderly nursing home in Beijing. Build. Environ. 2021, 200, 107915. [Google Scholar] [CrossRef]
  51. Fan, Z.; Liu, M.; Tang, S. A multi-objective optimization design method for gymnasium facade shading ratio integrating energy load and daylight comfort. Build. Environ. 2022, 207, 108527. [Google Scholar] [CrossRef]
  52. Naik, N.S.; Elzeyadi, I.; Cartwright, V. Dynamic solar screens for high-performance buildings—A critical review of perforated external shading systems. Archit. Sci. Rev. 2022, 65, 217–231. [Google Scholar] [CrossRef]
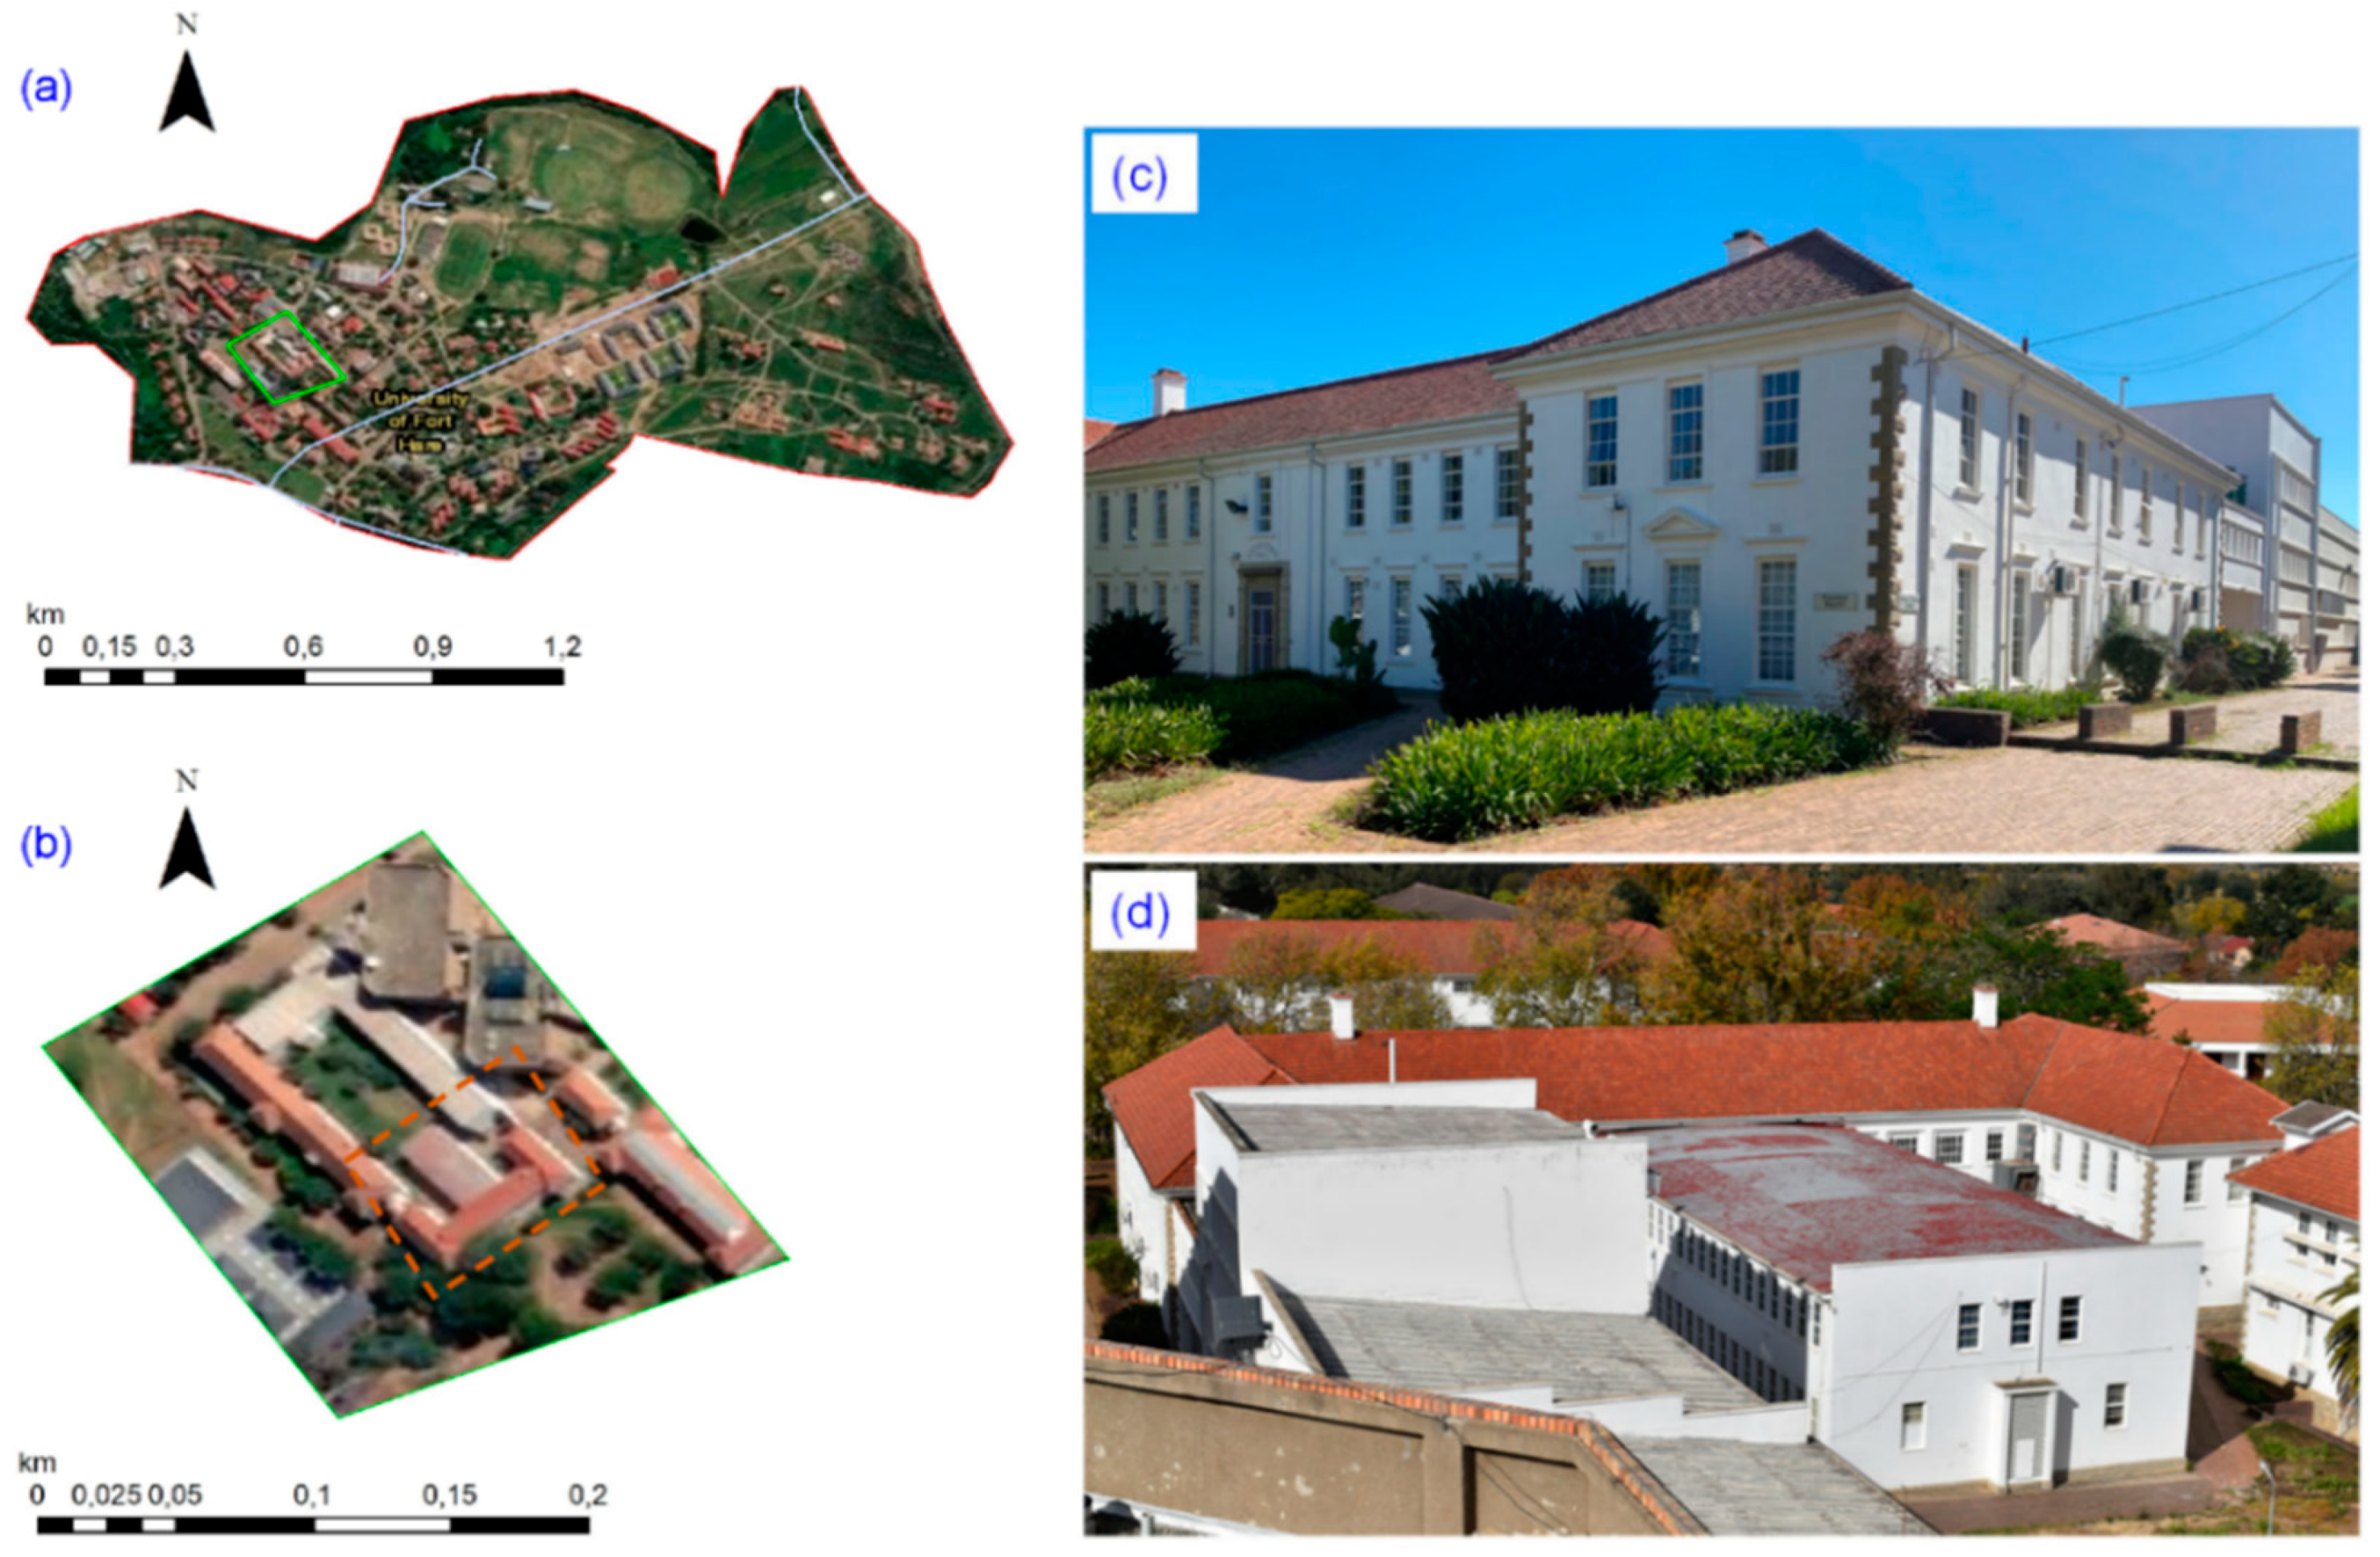
Figure 1. GIS imagery (a) of the University of Fort Hare Alice Campus, (b) Livingstone Hall, photos of the case study (Physics department) building, (c) front view and (d) rear view.
Buildings 13 01932 g001
Figure 2. Floor plan of the case study building: (a) top floor and (b) ground floor.
Buildings 13 01932 g002
Figure 3. Inside images of selected spaces of the building.
Buildings 13 01932 g003
Figure 4. The various elevations of the case study building.
Buildings 13 01932 g004
Figure 5. The building model development and simulation flowchart.
Buildings 13 01932 g005
Figure 6. 3D model of the case study building.
Buildings 13 01932 g006
Figure 7. Sun path diagram of the building.
Buildings 13 01932 g007
Figure 8. Solar radiation (direct, diffuse, and global) and cloud cover of the building location.
Buildings 13 01932 g008
Figure 9. The building ground floor’s (a) annual solar exposure, (b) useful daylight illuminance (UDI300-2000), and (c) spatial daylight autonomy (sDA300,50%).
Buildings 13 01932 g009
Figure 10. Summary of UDI of the building ground floor’s selected spaces.
Buildings 13 01932 g010
Figure 11. The building’s top floor’s (a) annual solar exposure, (b) useful daylight illuminance (UDI300-2000), and (c) spatial daylight autonomy (sDA300,50%).
Buildings 13 01932 g011
Figure 12. Summary of UDI of the building’s top floor selected spaces.
Buildings 13 01932 g012
Figure 13. Luminance and daylight glare possibility of selected ground floor spaces of the building on a typical summer day.
Buildings 13 01932 g013
Figure 14. Luminance and daylight glare possibility of selected top floor spaces of the building on a typical summer day.
Buildings 13 01932 g014
Table 1. The building window opening areas compared to wall opening areas on both floors.
OrientationGlazing Area (m2)Glazing Area (%)
North25.47.9
East75.918.4
South34.212
West77.417.6
Table 2. Optical properties of the building windows.
Window’s ParameterValue
Emissivity (outside)0.84
Emissivity (inside)0.04
Visible light transmittance0.81
Refractive index1.53
Reflection (outside)0.29
Reflection (inside)0.41
Table 3. Summary of daylight glare possibility of the building’s ground floor spaces.
SpaceWindow-to-Wall RatioAverage Luminance (cd/m2)DGP (%)Condition
390.1469.0621.81Imperceptible
370.0769.2119.56
460.22213.9426.15
480.28226.4025.59
490.33628.0234.74
350.1825.636.05
410.20252.4025.73
420.32201.4022.63
430.2796.5124.91
450.2984.8324.42
Table 4. Summary of daylight glare possibility of the building top floor spaces.
SpaceWindow-to-Wall RatioAverage Luminance (cd/m2)DGP (%)Condition
180.17120.1223.49Imperceptible
220.26193.9324.74
30.2151.7710.75
110.2866.8323.17
230.1282.3920.9
50.1324.478.72
70.0946.919.36
140.16159.3123.47
150.3595.6125.08
160.2574.0923.47
Disclaimer/Publisher’s Note: The statements, opinions and data contained in all publications are solely those of the individual author(s) and contributor(s) and not of MDPI and/or the editor(s). MDPI and/or the editor(s) disclaim responsibility for any injury to people or property resulting from any ideas, methods, instructions or products referred to in the content.