1. Introduction
By eliminating beams and columns, the use of a slab–wall system in structural engineering has gained traction due to the benefits of increased unobstructed room height and improved construction efficiency. However, the absence of those elements results in shear walls bearing both vertical and horizontal loads, leading possibly to a significant reduction in the seismic performance of the system. In particular, experiments [
1,
2,
3] have identified that the slab–wall joints in the system are the weakest link. Various solutions have been proposed to enhance the system or shear walls alone. Among them, adding concrete-filled steel tubes (CFSTs) in shear wall piers has emerged as an effective means.
Qian [
4] proposed a shear wall with CFSTs embedded at the wall boundary, which was found to offer excellent energy dissipation capacity. Fang’s group has studied the effects of various loading conditions on shear walls embedded with CFSTs, including axial compression, axial compression plus bending actions, cyclic loads, shearing, and combined tension-shearing [
5,
6,
7,
8,
9]. The results show that in CFST-strengthened shear walls, the steel tubes provide a confinement effect that significantly improves the strength of the shear walls. Furthermore, the embedded CFSTs can delay local failures of the wall by increasing its vertical load-bearing capacity, thus creating a shear wall with higher rigidity and good ductility. Ji and his collaborators [
10] developed a numerical-simulation model of high-strength CFST-strengthened shear walls to examine their behavior when subjected to high axial force and lateral cyclic loading. The results indicate that the walls’ flexural strength increases with the increasing ratio of the cross-sectional area of embedded tubes. Notably, the type of embedded tubes, whether empty or concrete-filled, did not affect the walls’ strength. Wu [
11] proposed a precast composite shear wall with steel tubes embedded at the wall boundary, and found this new kind of component can be applied in a precast building to improve its structural performance. Similarly, Zhou et al. [
12] designed a precast concrete-encased CFST composite wall with twin steel-tube connections, and their work resulted in several calculation methods for evaluating the shear strength of the wall. Zhao et al. [
13] had been studied on a shaking table testing of a 1/8-scale five-story slab–wall structure equipped with CFSTs in walls. Findings indicated that the application of CFSTs was instrumental in resisting the simulated earthquake loads acting upon it, hence the global response limits required by codes of practice were met. Nevertheless, the junctions between the shear walls and floor slabs were found to be the weakest links in the whole system. Consequently, it suggested designers should use proper detailing in those regions to prevent local distress.
These studies indicate that incorporating CFSTs into slab–wall structures has the potential to enhance their seismic performance. However, because the double-layer bidirectional steel bars in the slab are difficult to pass through the steel tubes equidistantly arranged in the shear wall, the steel bars are bent or directly penetrate by drilling holes to make them pass through the steel tubes in the relevant research. Such a method will affect the material properties of steel bars and steel tube at the joint, making it unable to fully play its role.
It can be seen that the use of CFST in a slab–wall system has been limited due to the complexity of the slab-to-shear wall piers connections and the blank of design of anchorage detailing. In addition, there is still a lack of information on CFST connections embedded in wall piers under cyclic loading. Therefore, developing a practical connection to overcome these challenges is crucial.
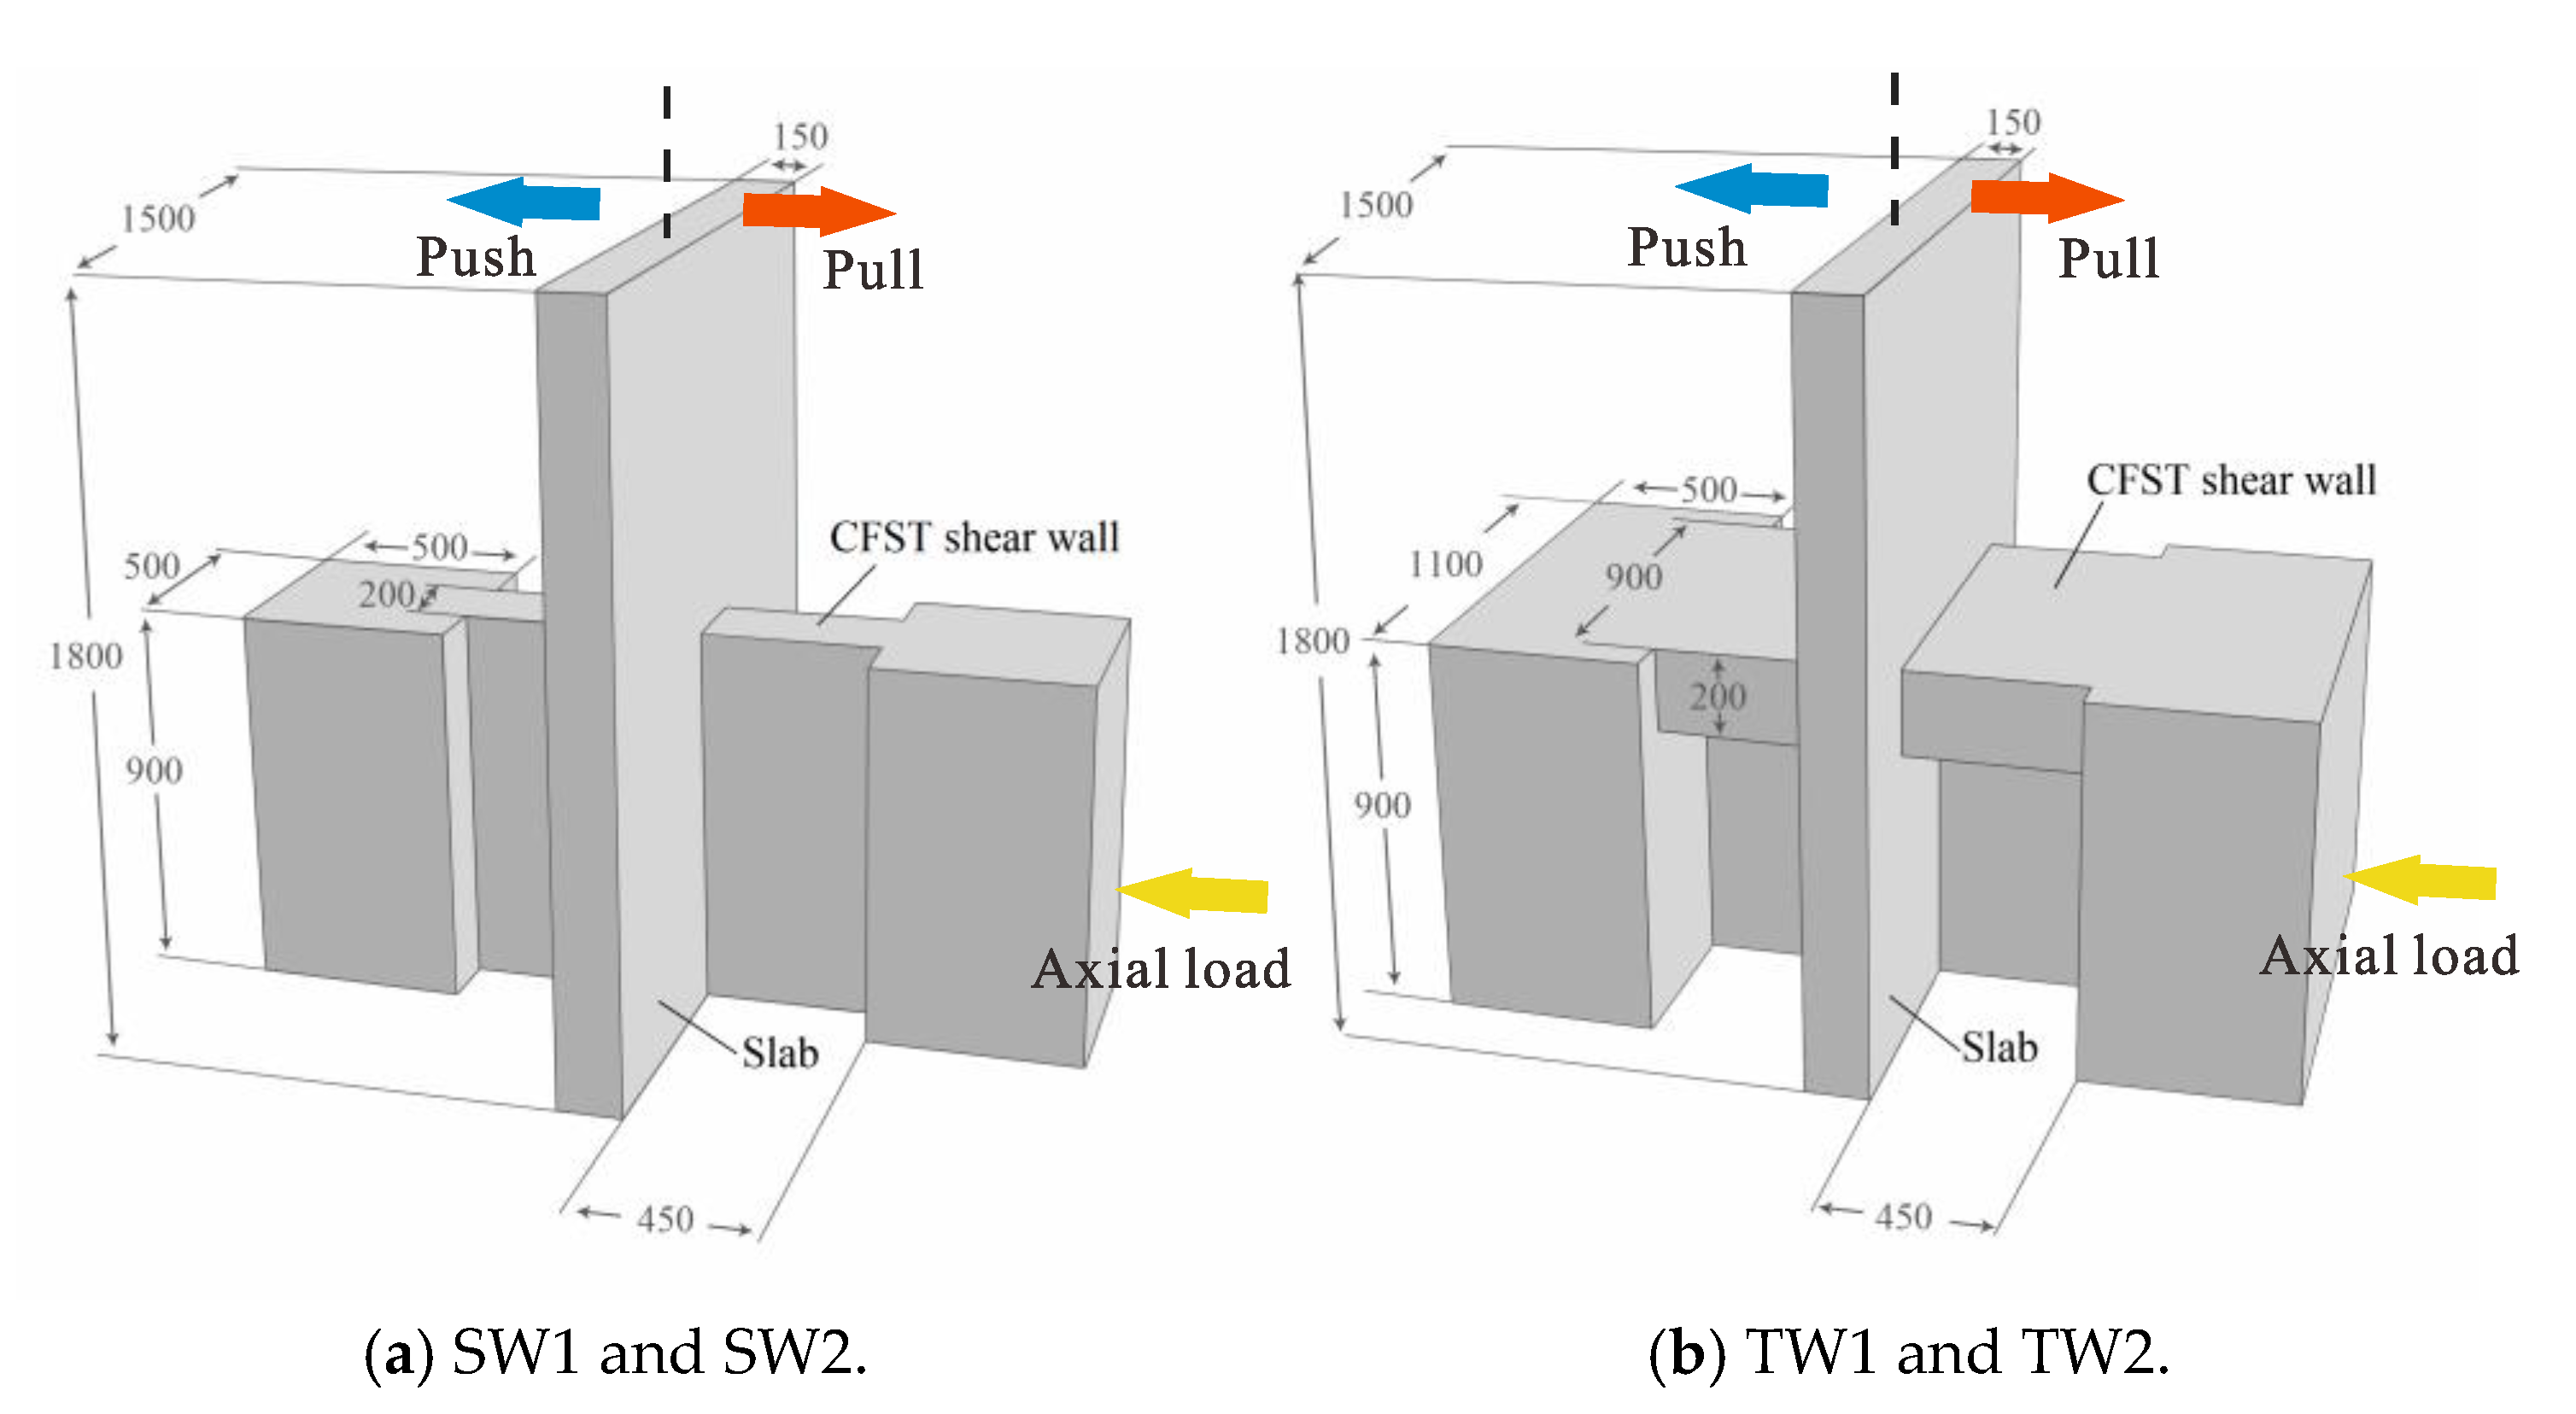
To address these issues, the purpose of the study is to design no-through-tube anchorage detailing for steel bars in slabs that intersect with CFST-strengthened structural walls, and investigate the influence of using this different anchoring detailing in slab–wall joints on strength, ductility, stiffness, and energy dissipation. A higher grade of concrete is used inside the steel tube than the slab to prevent it from failing prematurely due to hooping effect.
It is believed that the outcomes of this work will contribute to the understanding of the overall seismic performance of the slab–wall systems concerned, and, ultimately, promote the application of the highly ductile wall components embedded with CFSTs in the future work.
3. Test result and Analysis
3.1. Experimental Observation
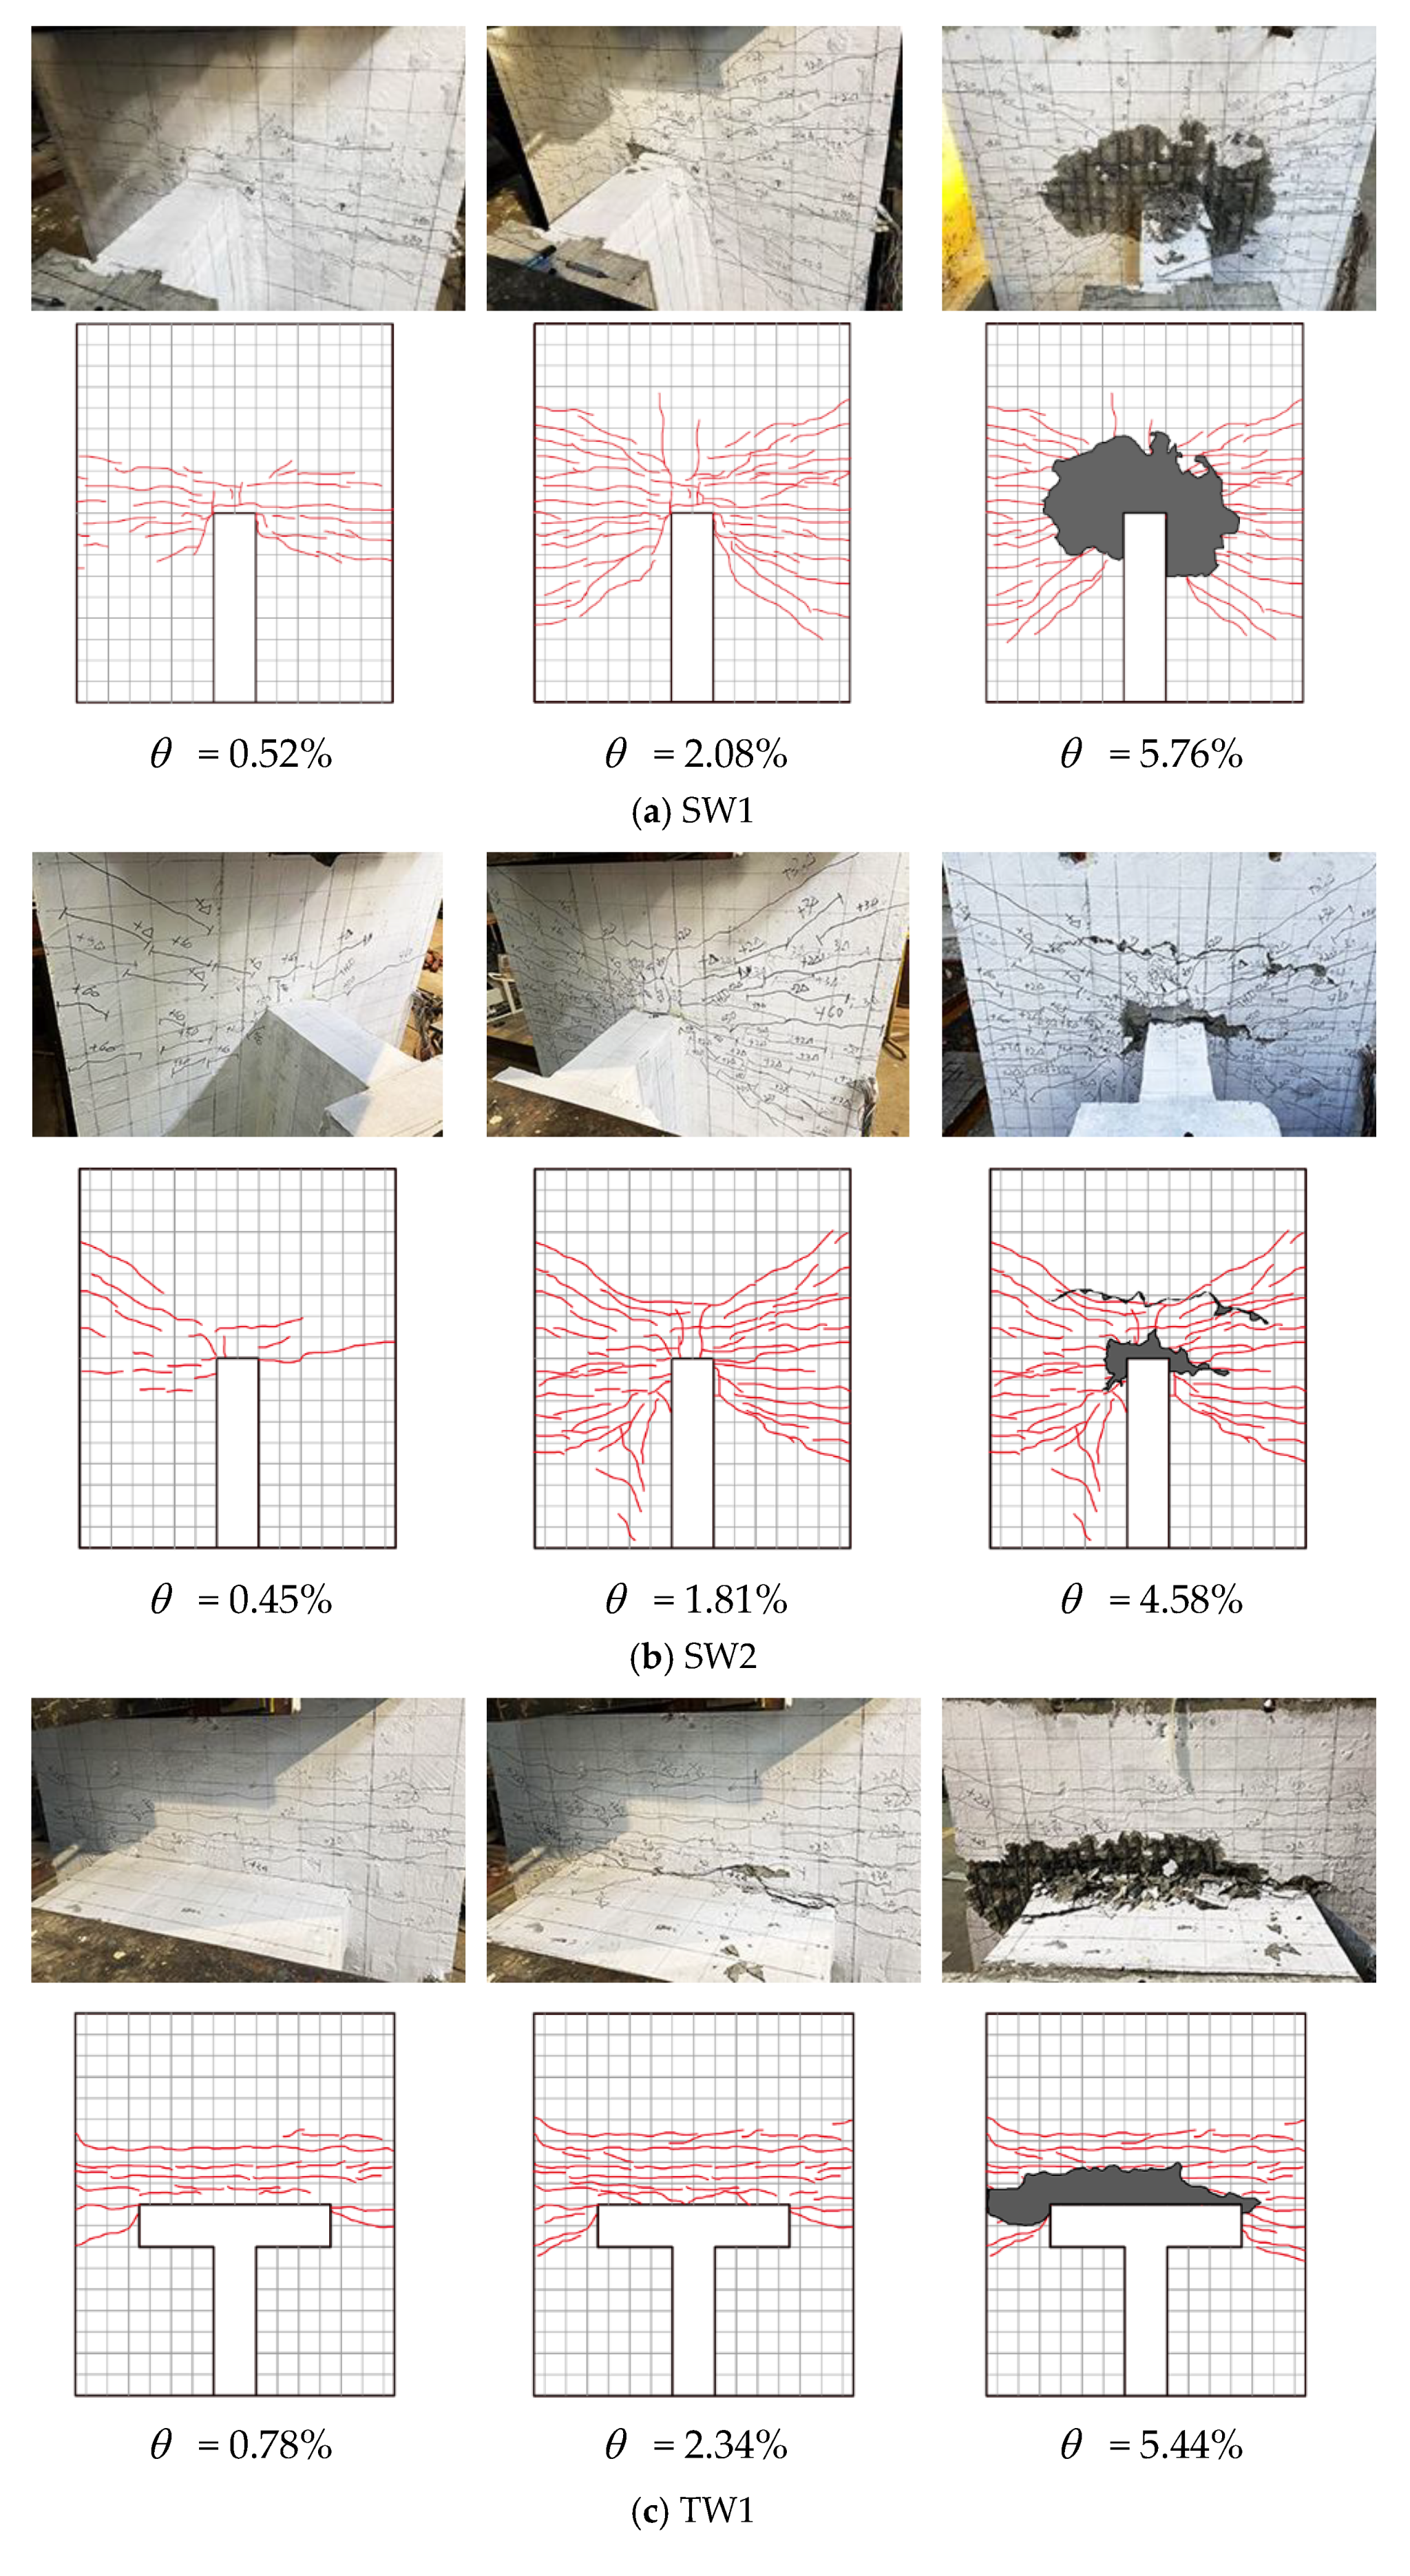
The failure processes of the specimens are shown in
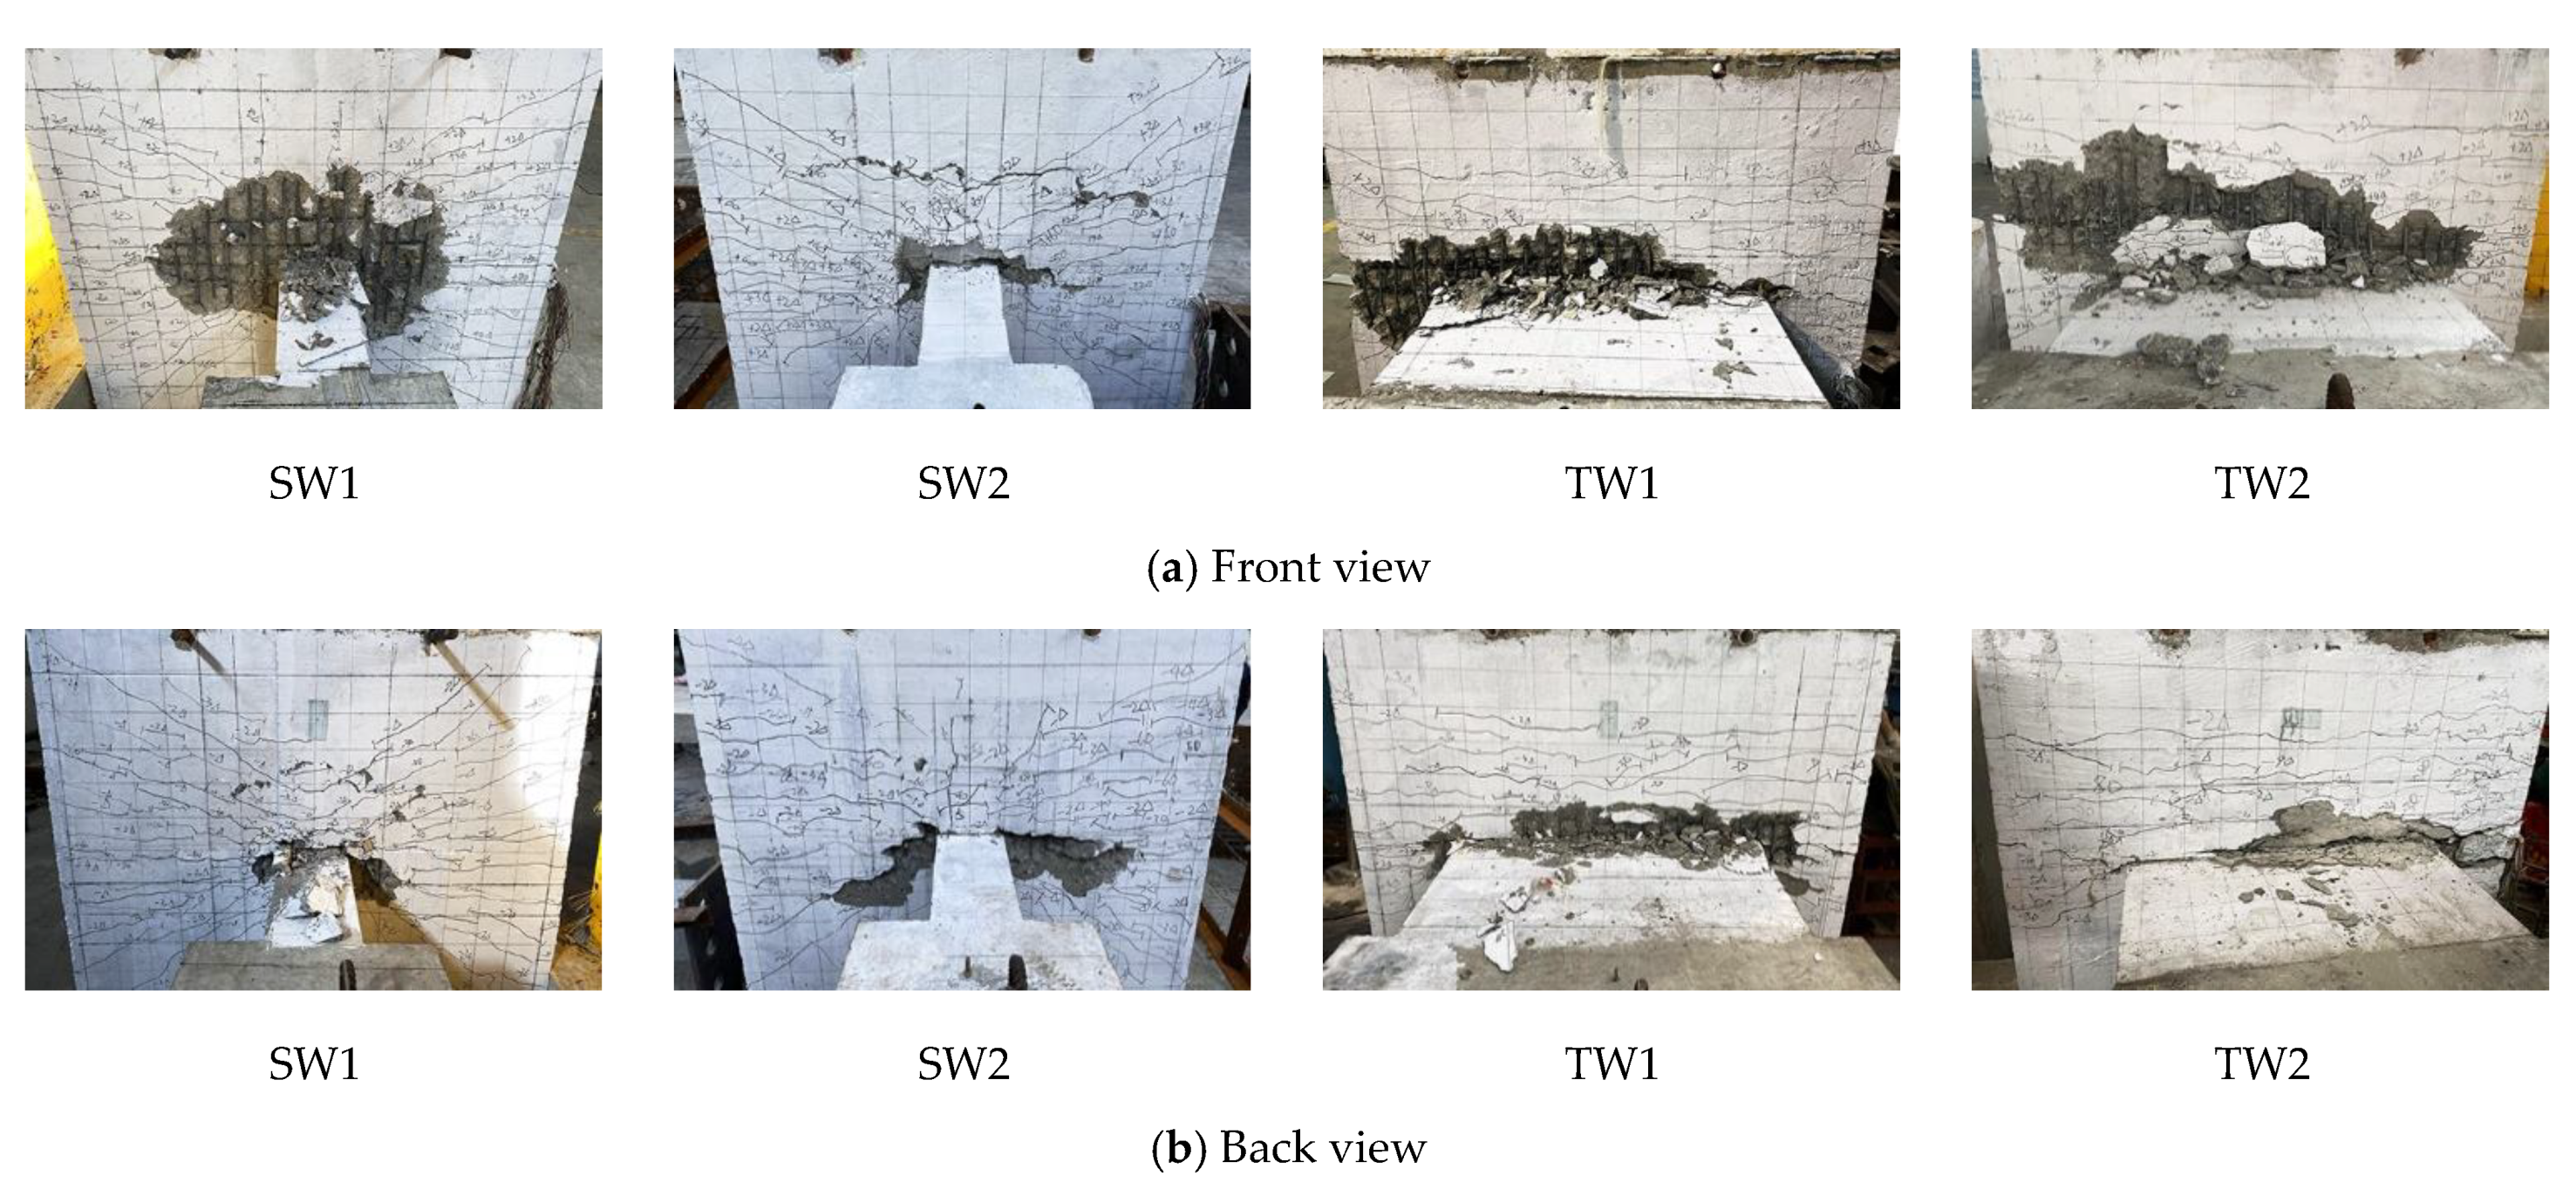
Figure 8a–d. In these drawings, the cracks are represented in red. The final failure modes of the east and west surfaces of the specimens are shown in
Figure 9.
After analyzing the failure process and modes of all specimens (as shown in
Figure 8 and
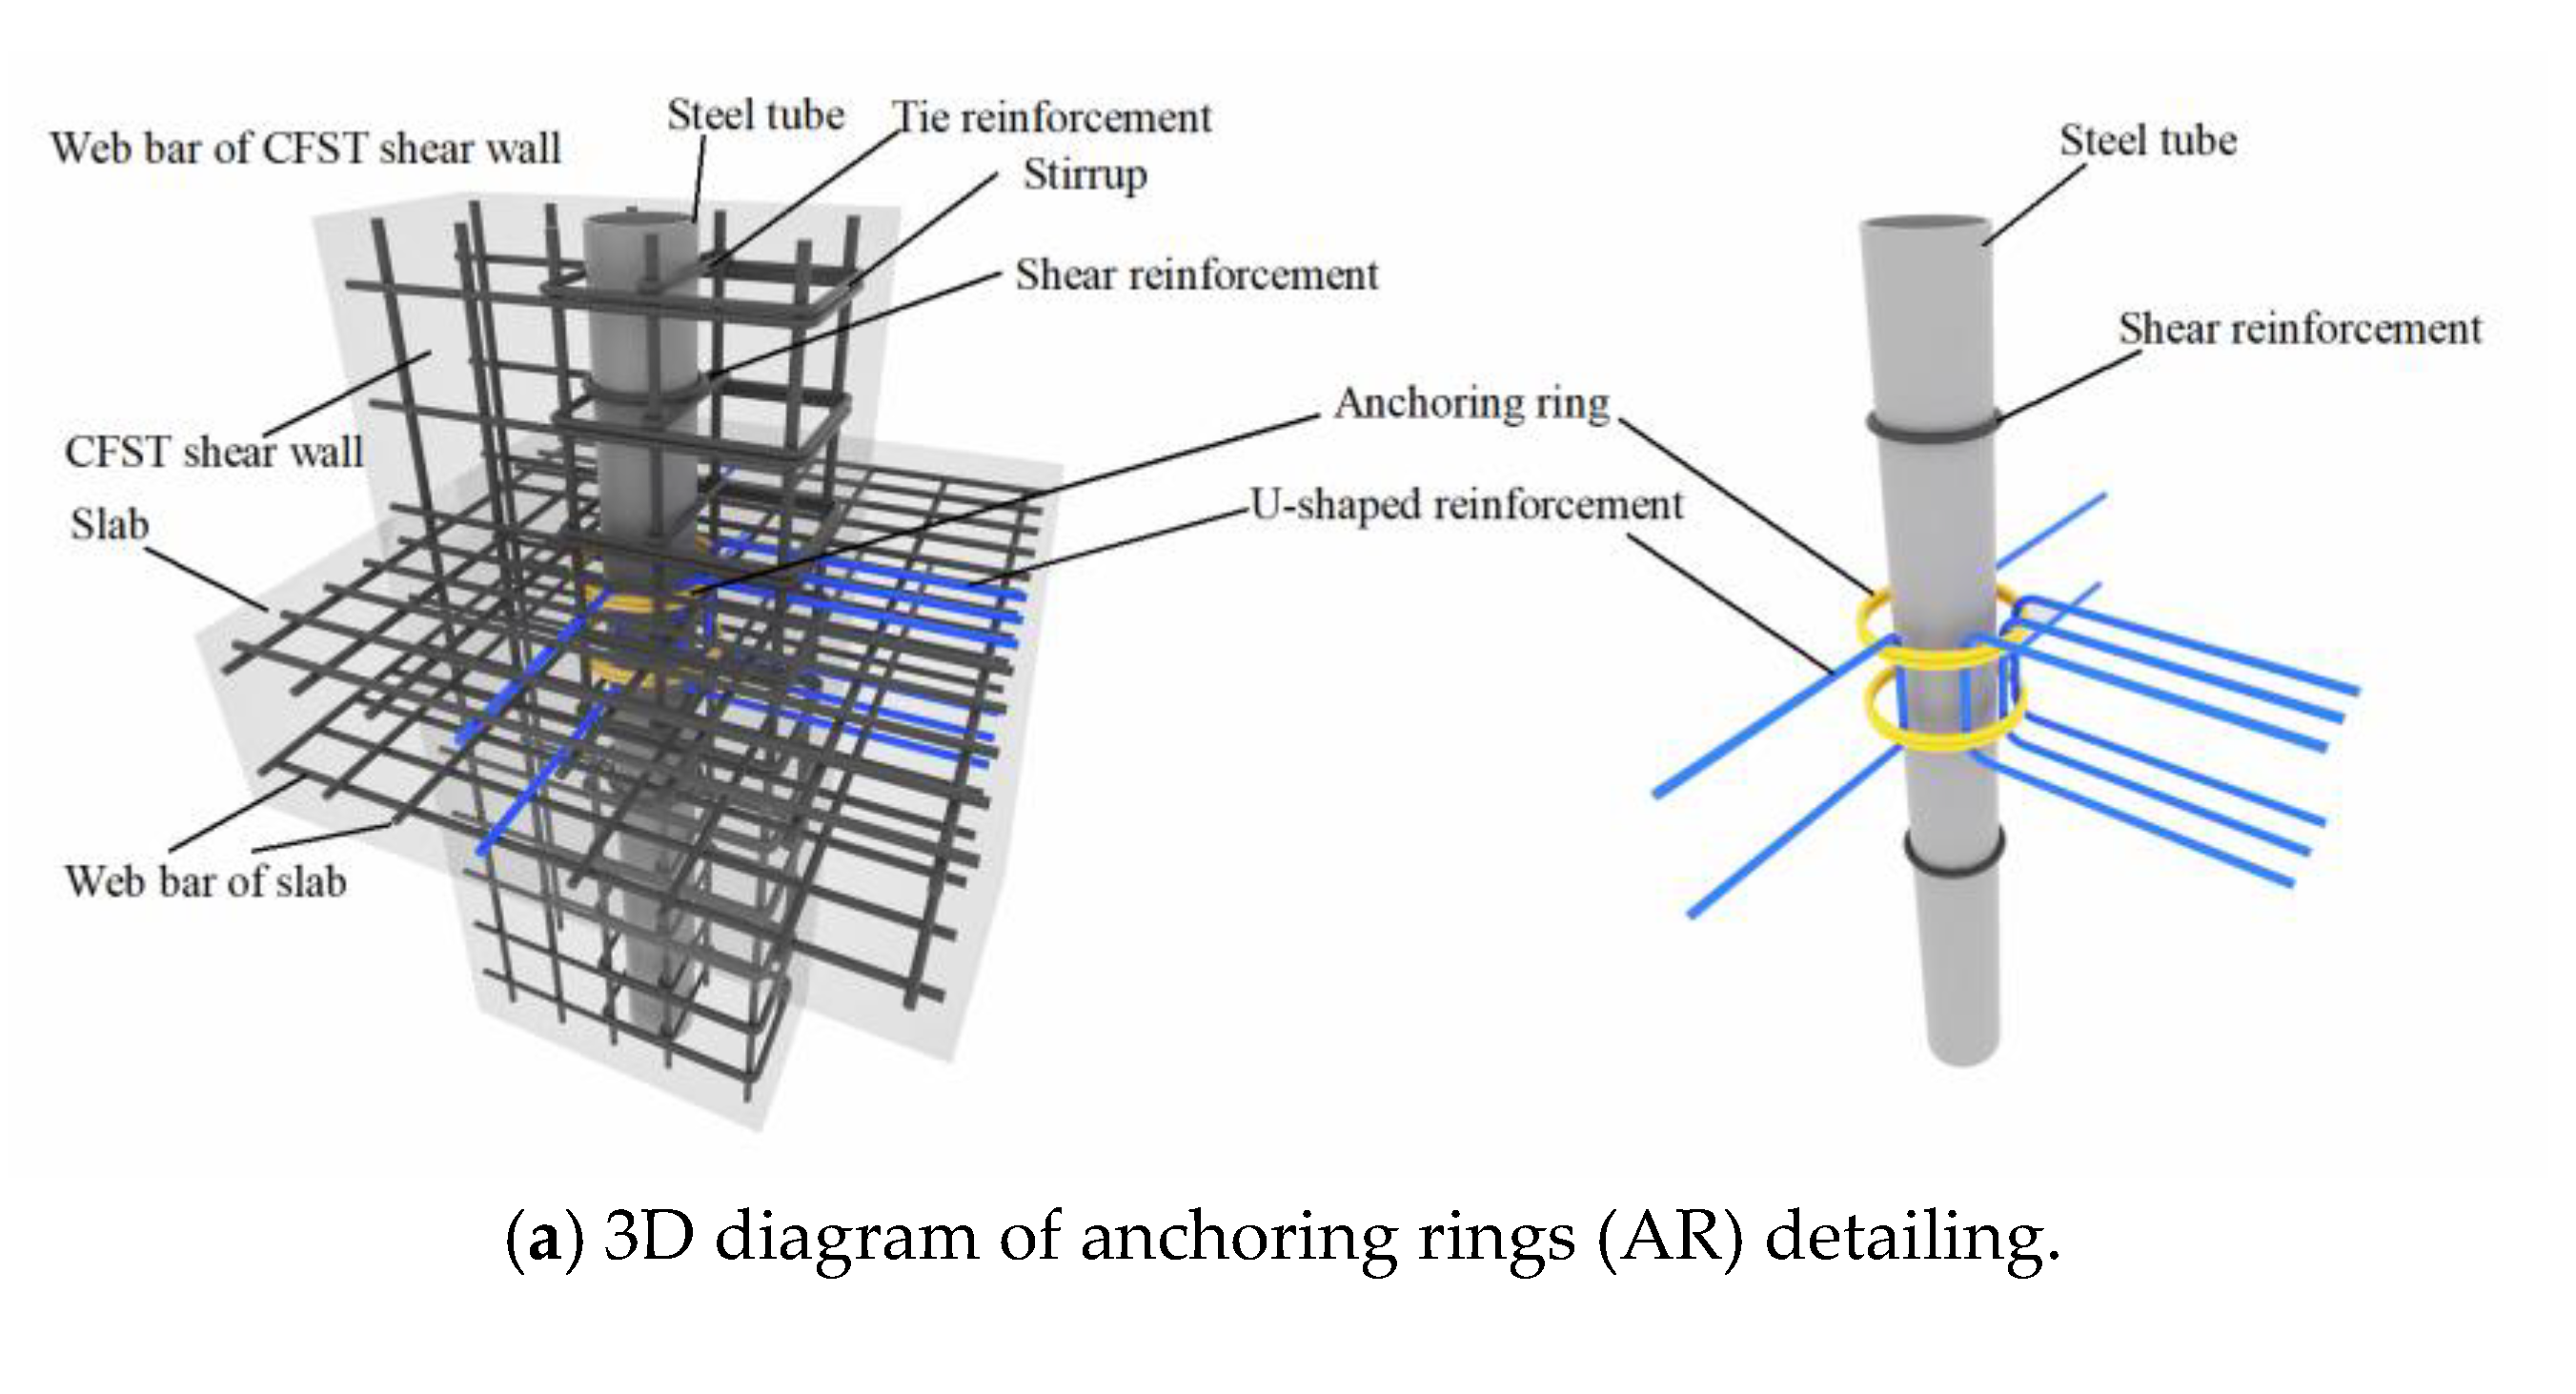
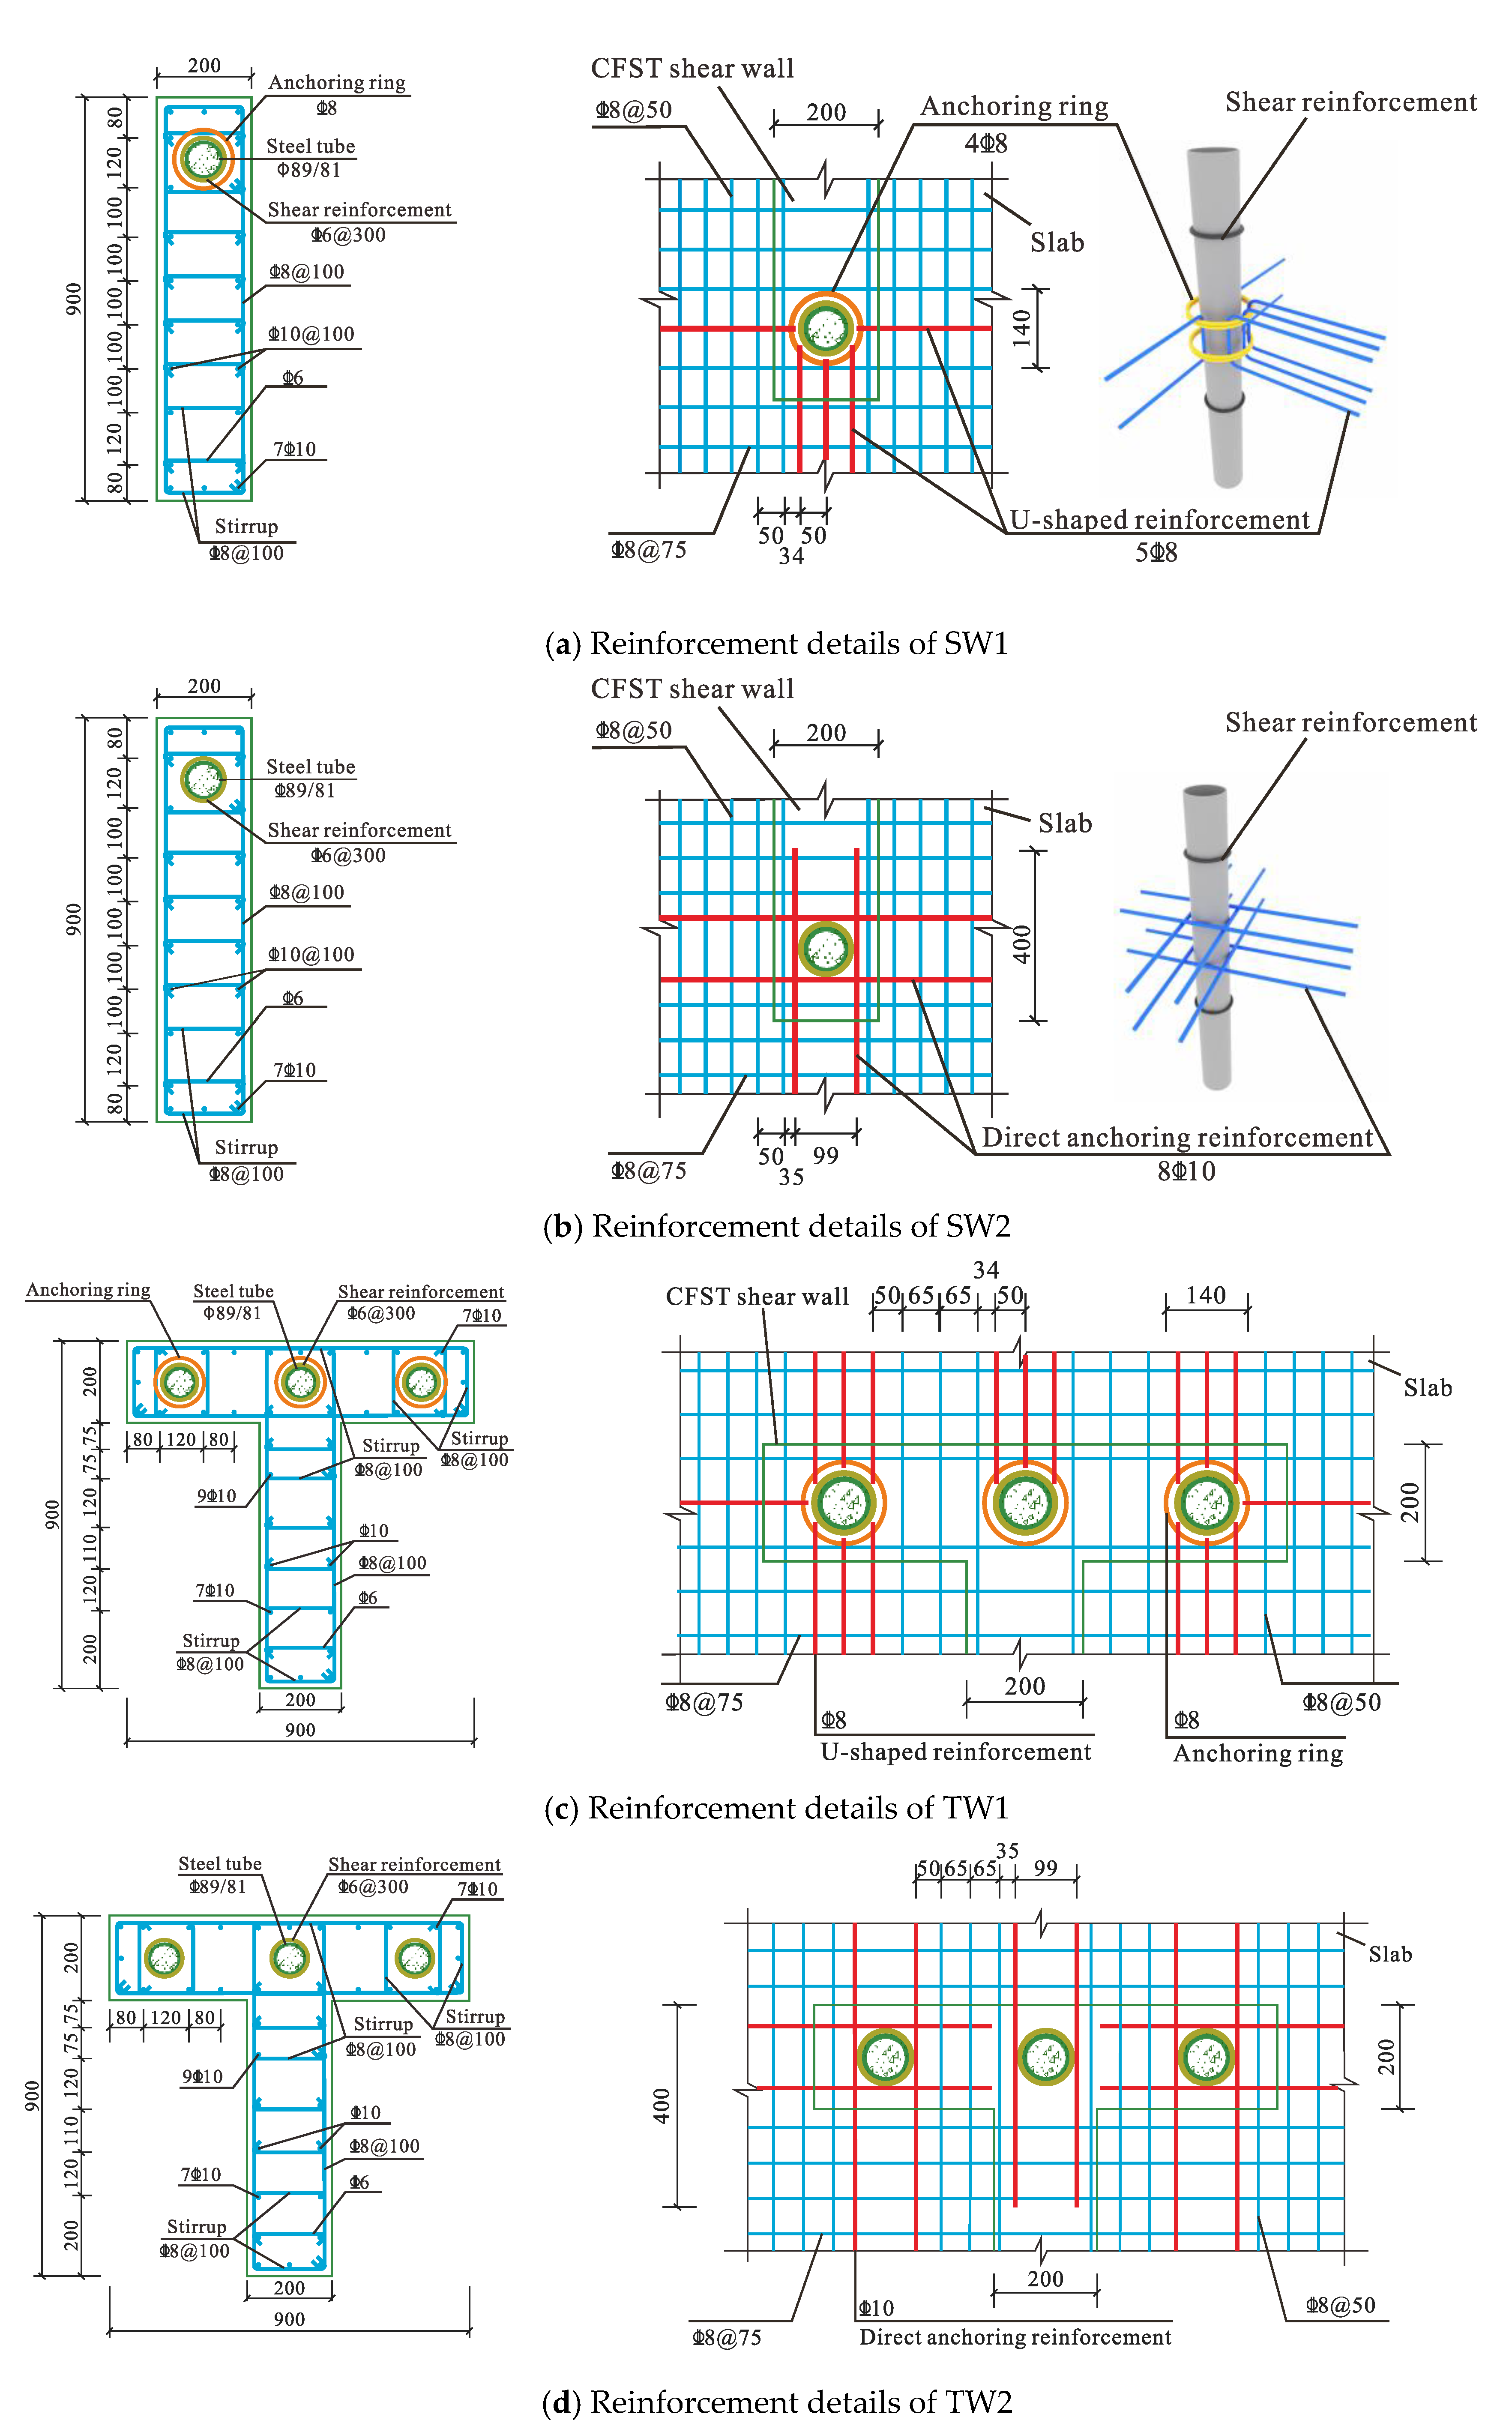
Figure 9), it can be concluded that the onset of floor slab cracking in the specimens with the AR detailing, namely SW1 and TW1, was delayed compared to those with the DA detailing, namely SW2 and TW2. Notably, the onset of slab cracking in TW1 lagged significantly behind that of TW2, demonstrating that the implementation of the AR detailing in the T-shaped shear wall joint postponed the concrete cracking of the slab. The Ars were situated on the force-transmission path, allowing for the efficient transfer of the tensile force of the slab’s steel reinforcing bar to the AR bars, which then conveyed the force to the confined concrete area of the steel tubes. The confined core had substantial rigidity, tensile strength, and pull-out resistance, which the anchoring form of the U-shaped steel bar for the AR detailing could exploit effectively, making the anchoring strength of the AR detailing stronger than that of the DA detailing. Under the influence of the anchoring ring, the joint’s failure area expanded, deepening the failure level of SW1 and TW1 specimens compared to the DA detailing.
Due to the support of the rectangular shear-wall boundary with the floor slab, the stress flowing between the rigid beam and the junction became “O”-shaped. The cracks on the floor surface eventually form a radial distribution starting from the edge of the shear wall, because the direction of the cracks in the concrete was perpendicular to the direction of the stress flow.
Since the slab reinforcement ratio of the specimens was consistent, the change of steel anchorage detailing did not significantly affect the peak load of the four specimens. The cracks in all other areas, except the supporting end of the shear wall, were horizontal, exhibiting an evident bending failure mode.
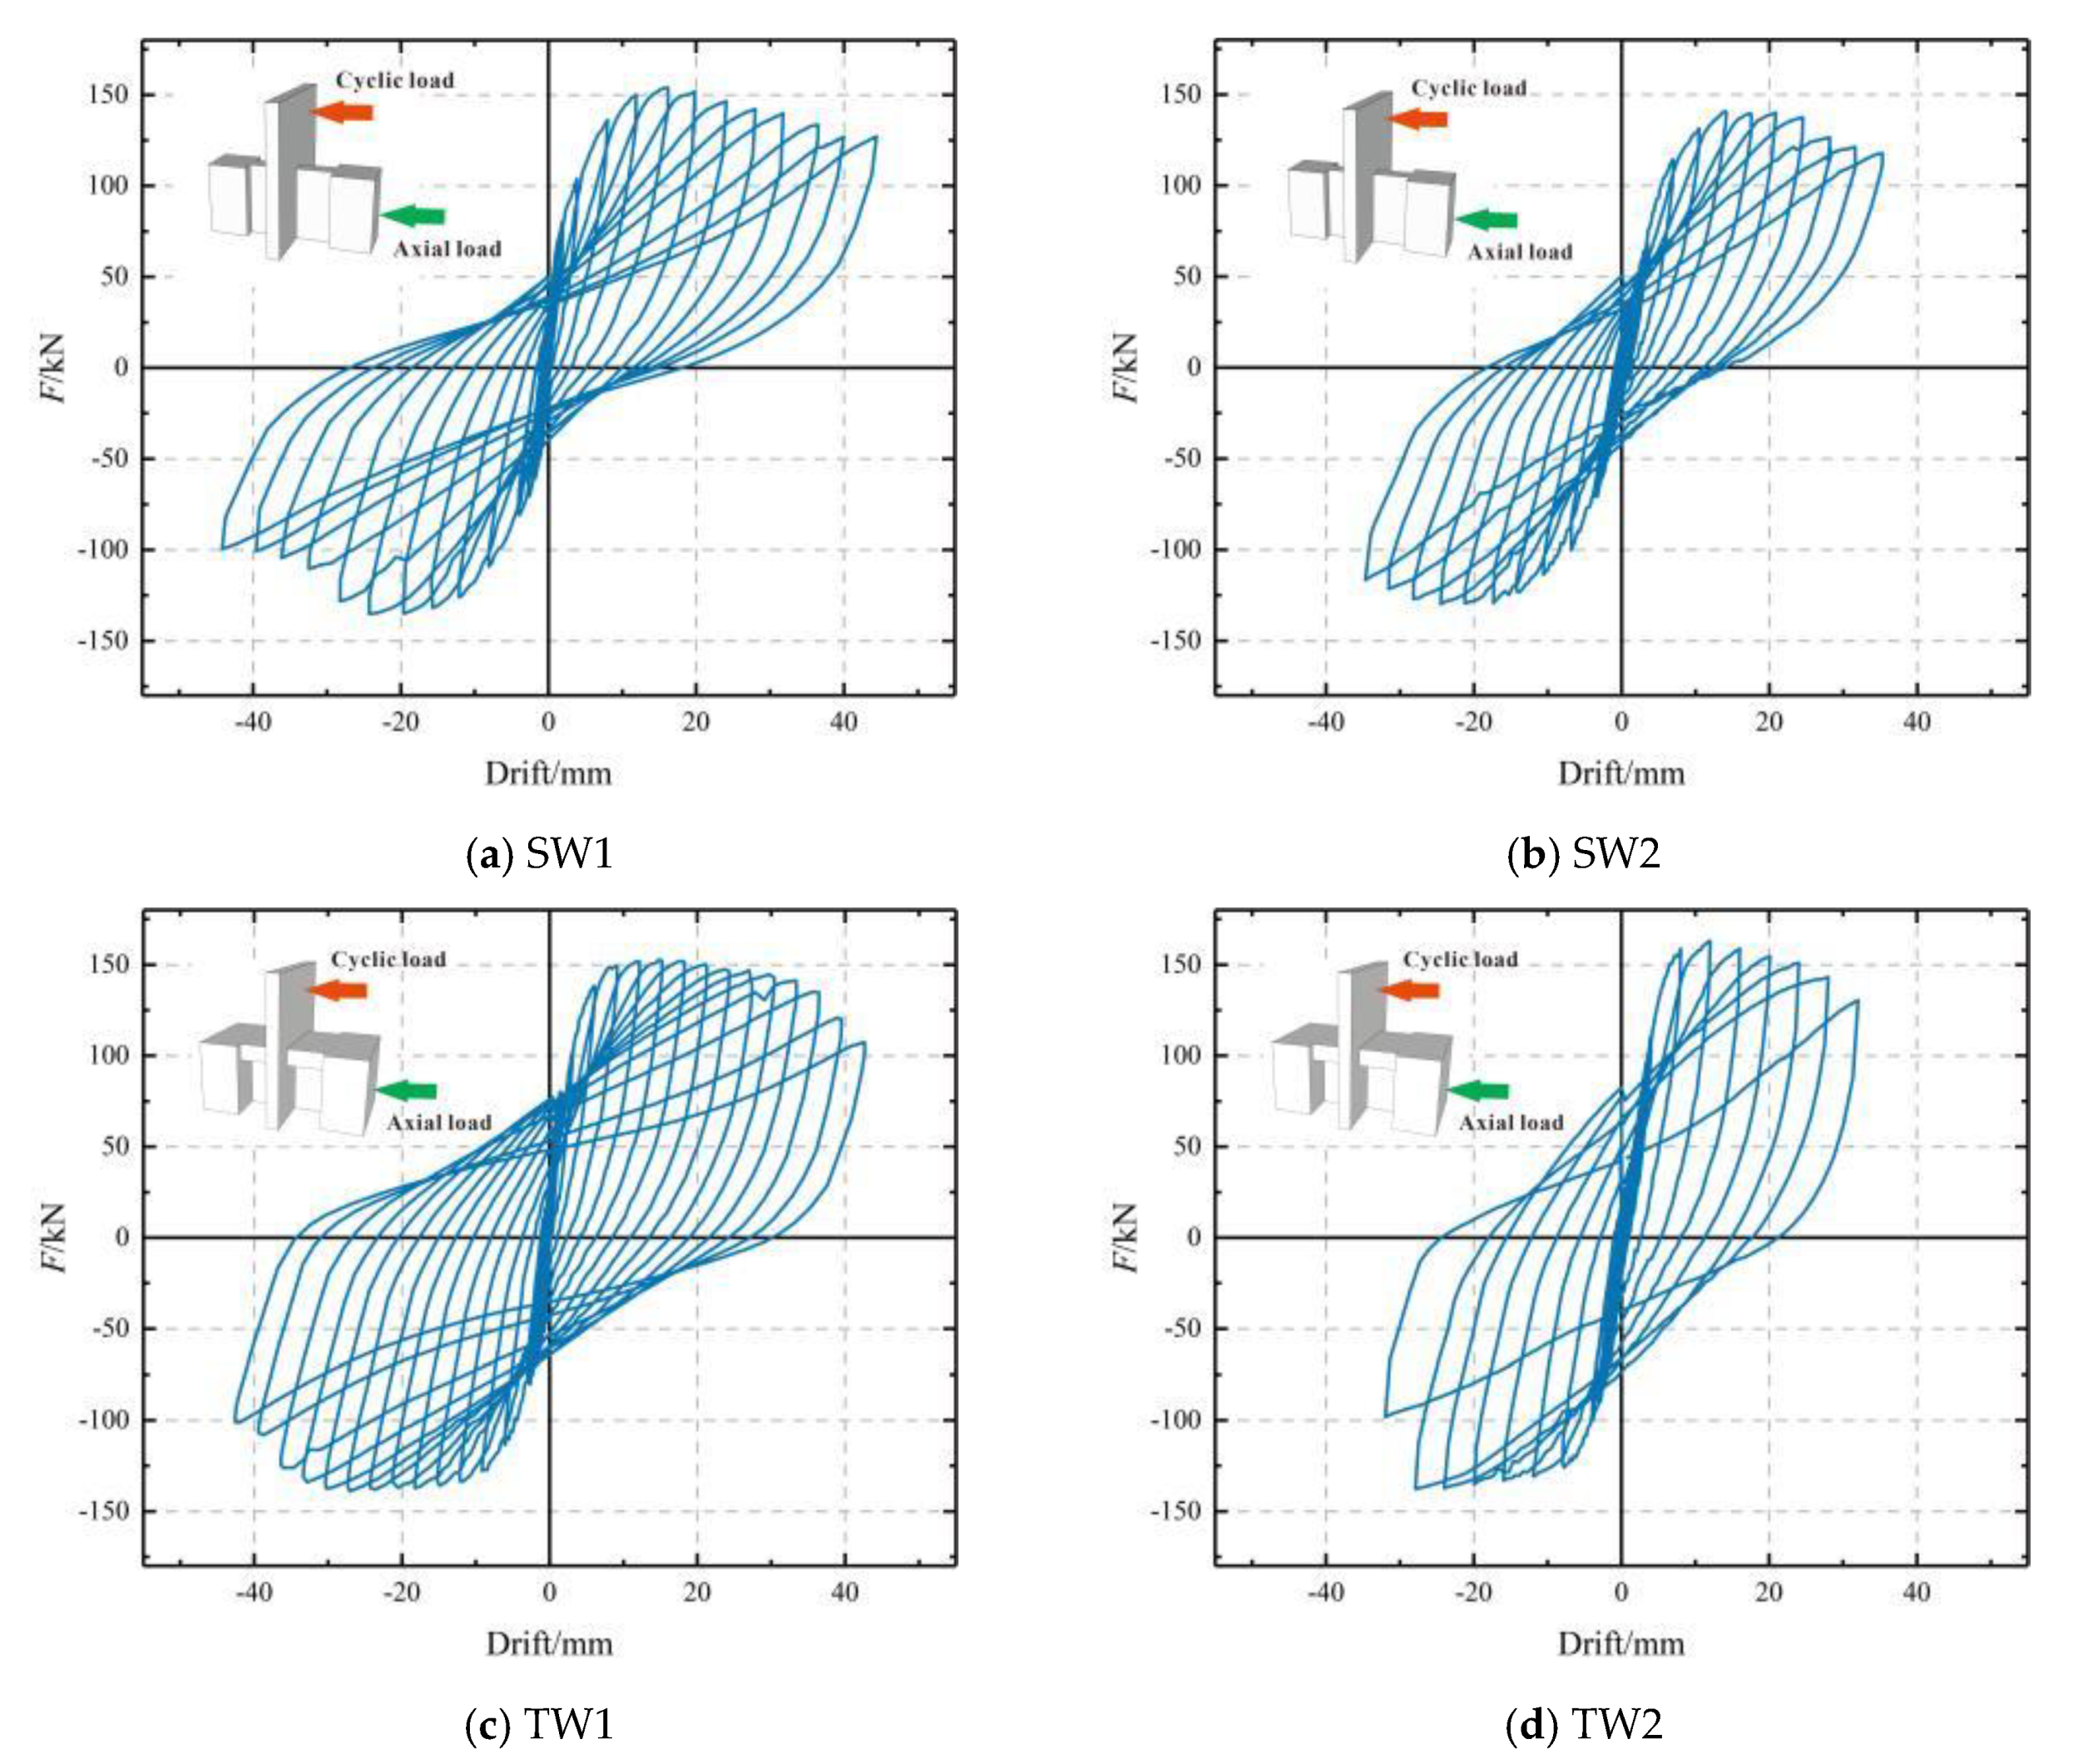
3.2. Load-Displacement Curves
Figure 10 shows the load–drift hysteresis curve of each specimen. It can be observed that all the specimen curves had a gentle falling section after reaching their peak values. In the later stages of loading, all four specimens exhibited a slight degree of pinching due to significant concrete cracking. However, compared to the specimens with the DA detailing (SW2 and TW2), the specimens with the AR detailing (SW1 and TW1) showed a relatively smaller pinching effect and a more complete hysteretic curve.
After yielding, the hysteresis curves of the I-shaped section specimens SW1 and SW2 became narrower, while the curves of the T-shaped section specimens TW1 and TW2 were fuller. This suggests that the energy consumption capacity of the T-shaped sectional shear wall specimens is stronger than that of the I-shaped shear wall specimens.
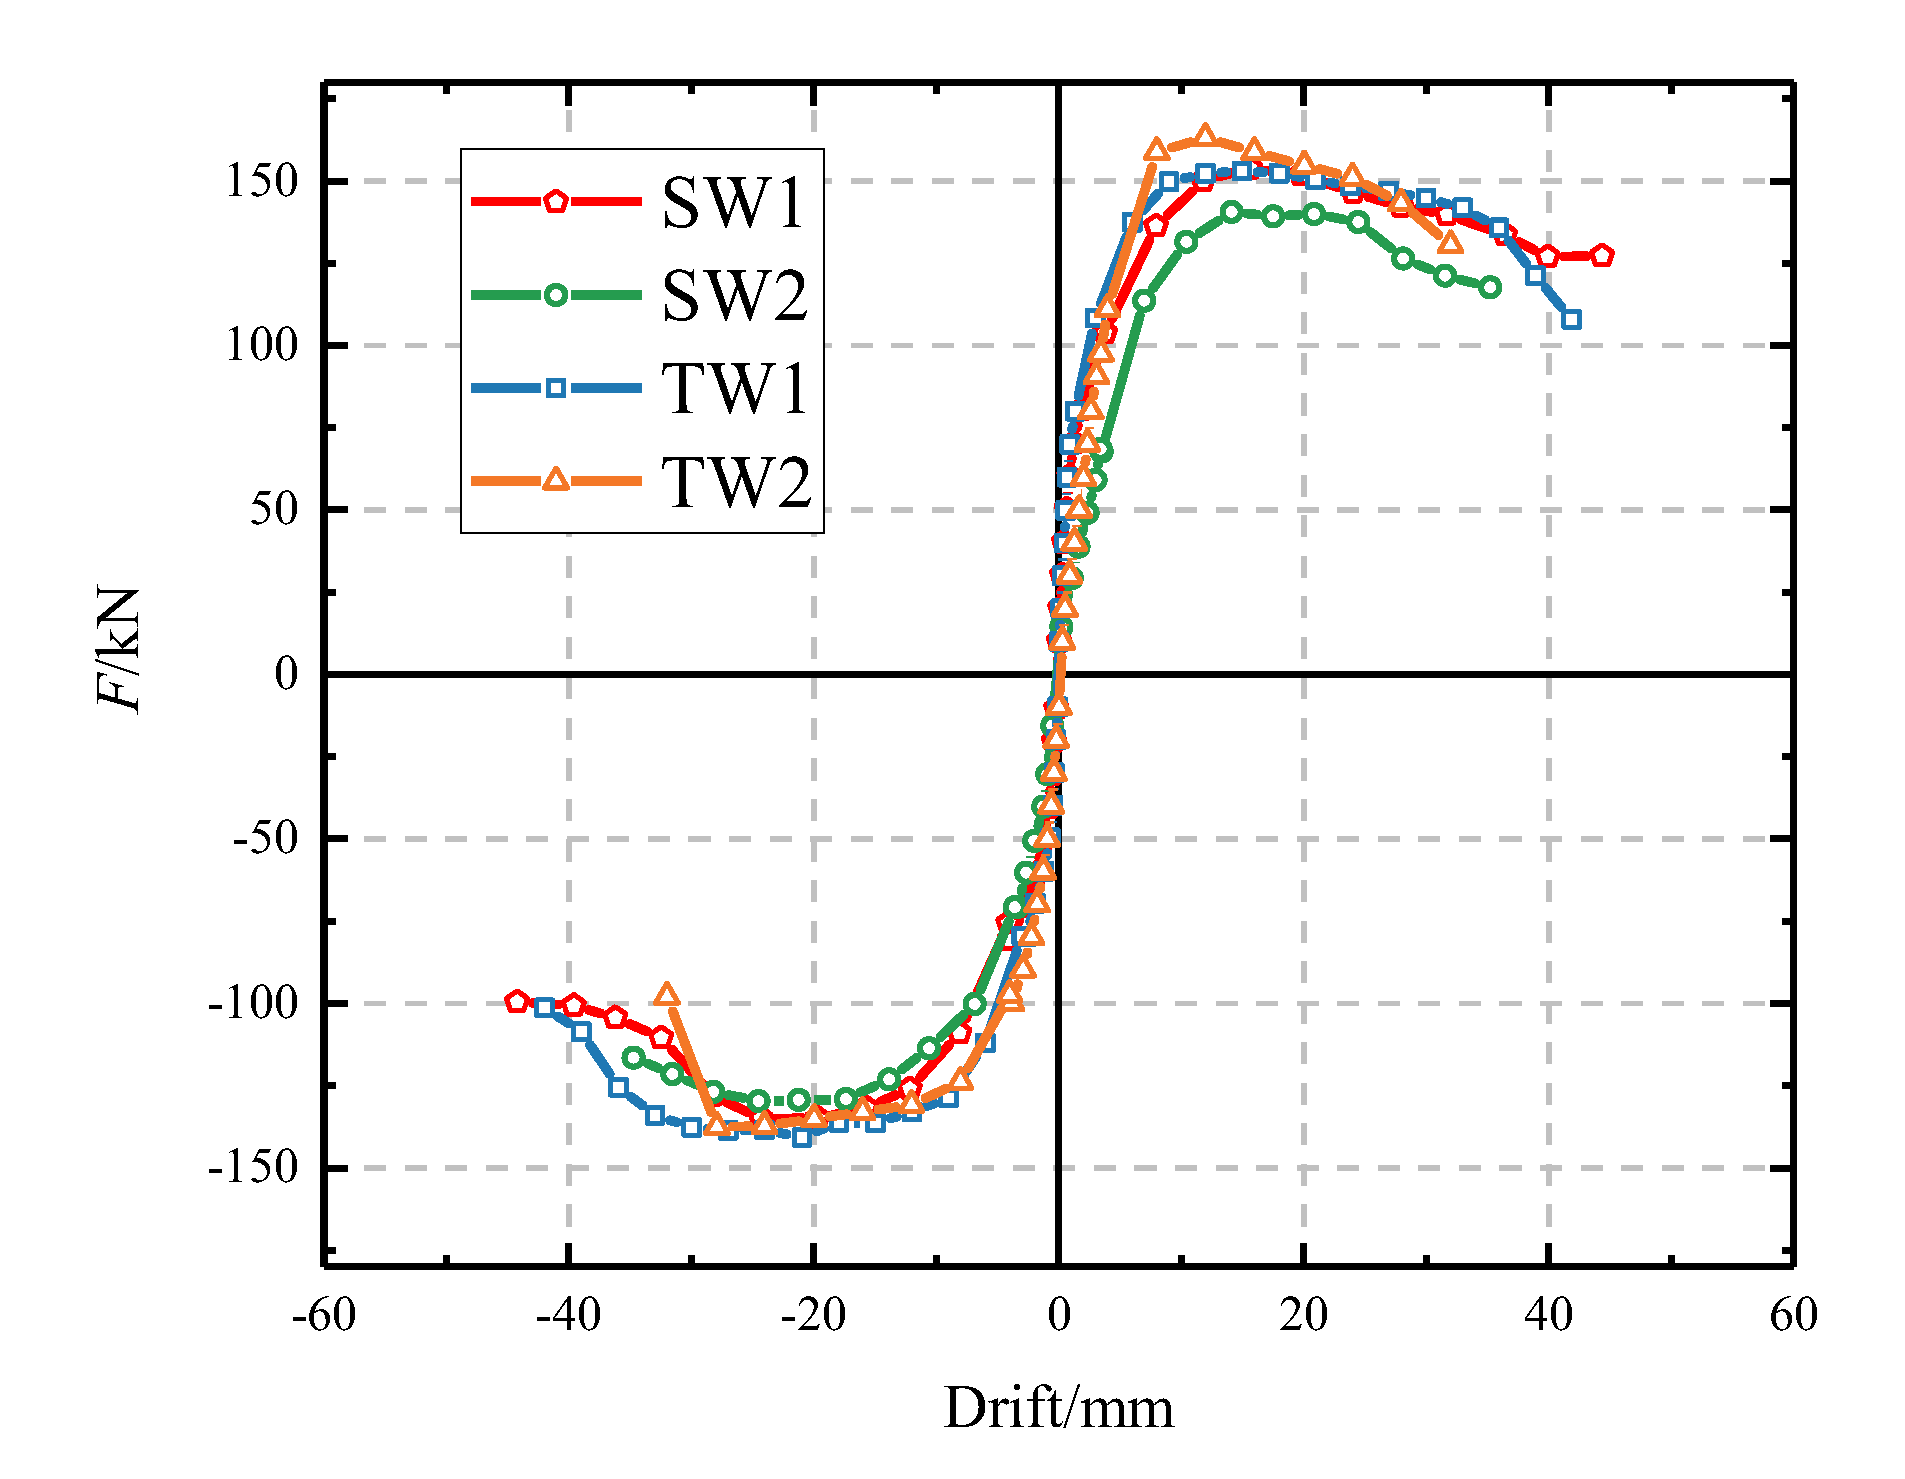
Figure 11 illustrates the skeleton curve of all specimens. As the reinforcement ratio of the specimen floor was the same, the peak load of the four specimens did not show significant changes due to differences in joint structure and supporting conditions of the floor root. When comparing the descending section of the skeleton curve, it was found that although specimens SW1 and TW1 had a gentler decline compared to specimens SW2 and TW2, the bearing capacity and stiffness of all the specimens did not degrade rapidly. During the entire loading process, the AR bars of test pieces SW1 and TW1 remained inside the concrete, while the DA bars of test pieces SW2 and TW2 did not get pulled out.
3.3. Bearing Capacity and Deformation Capacity
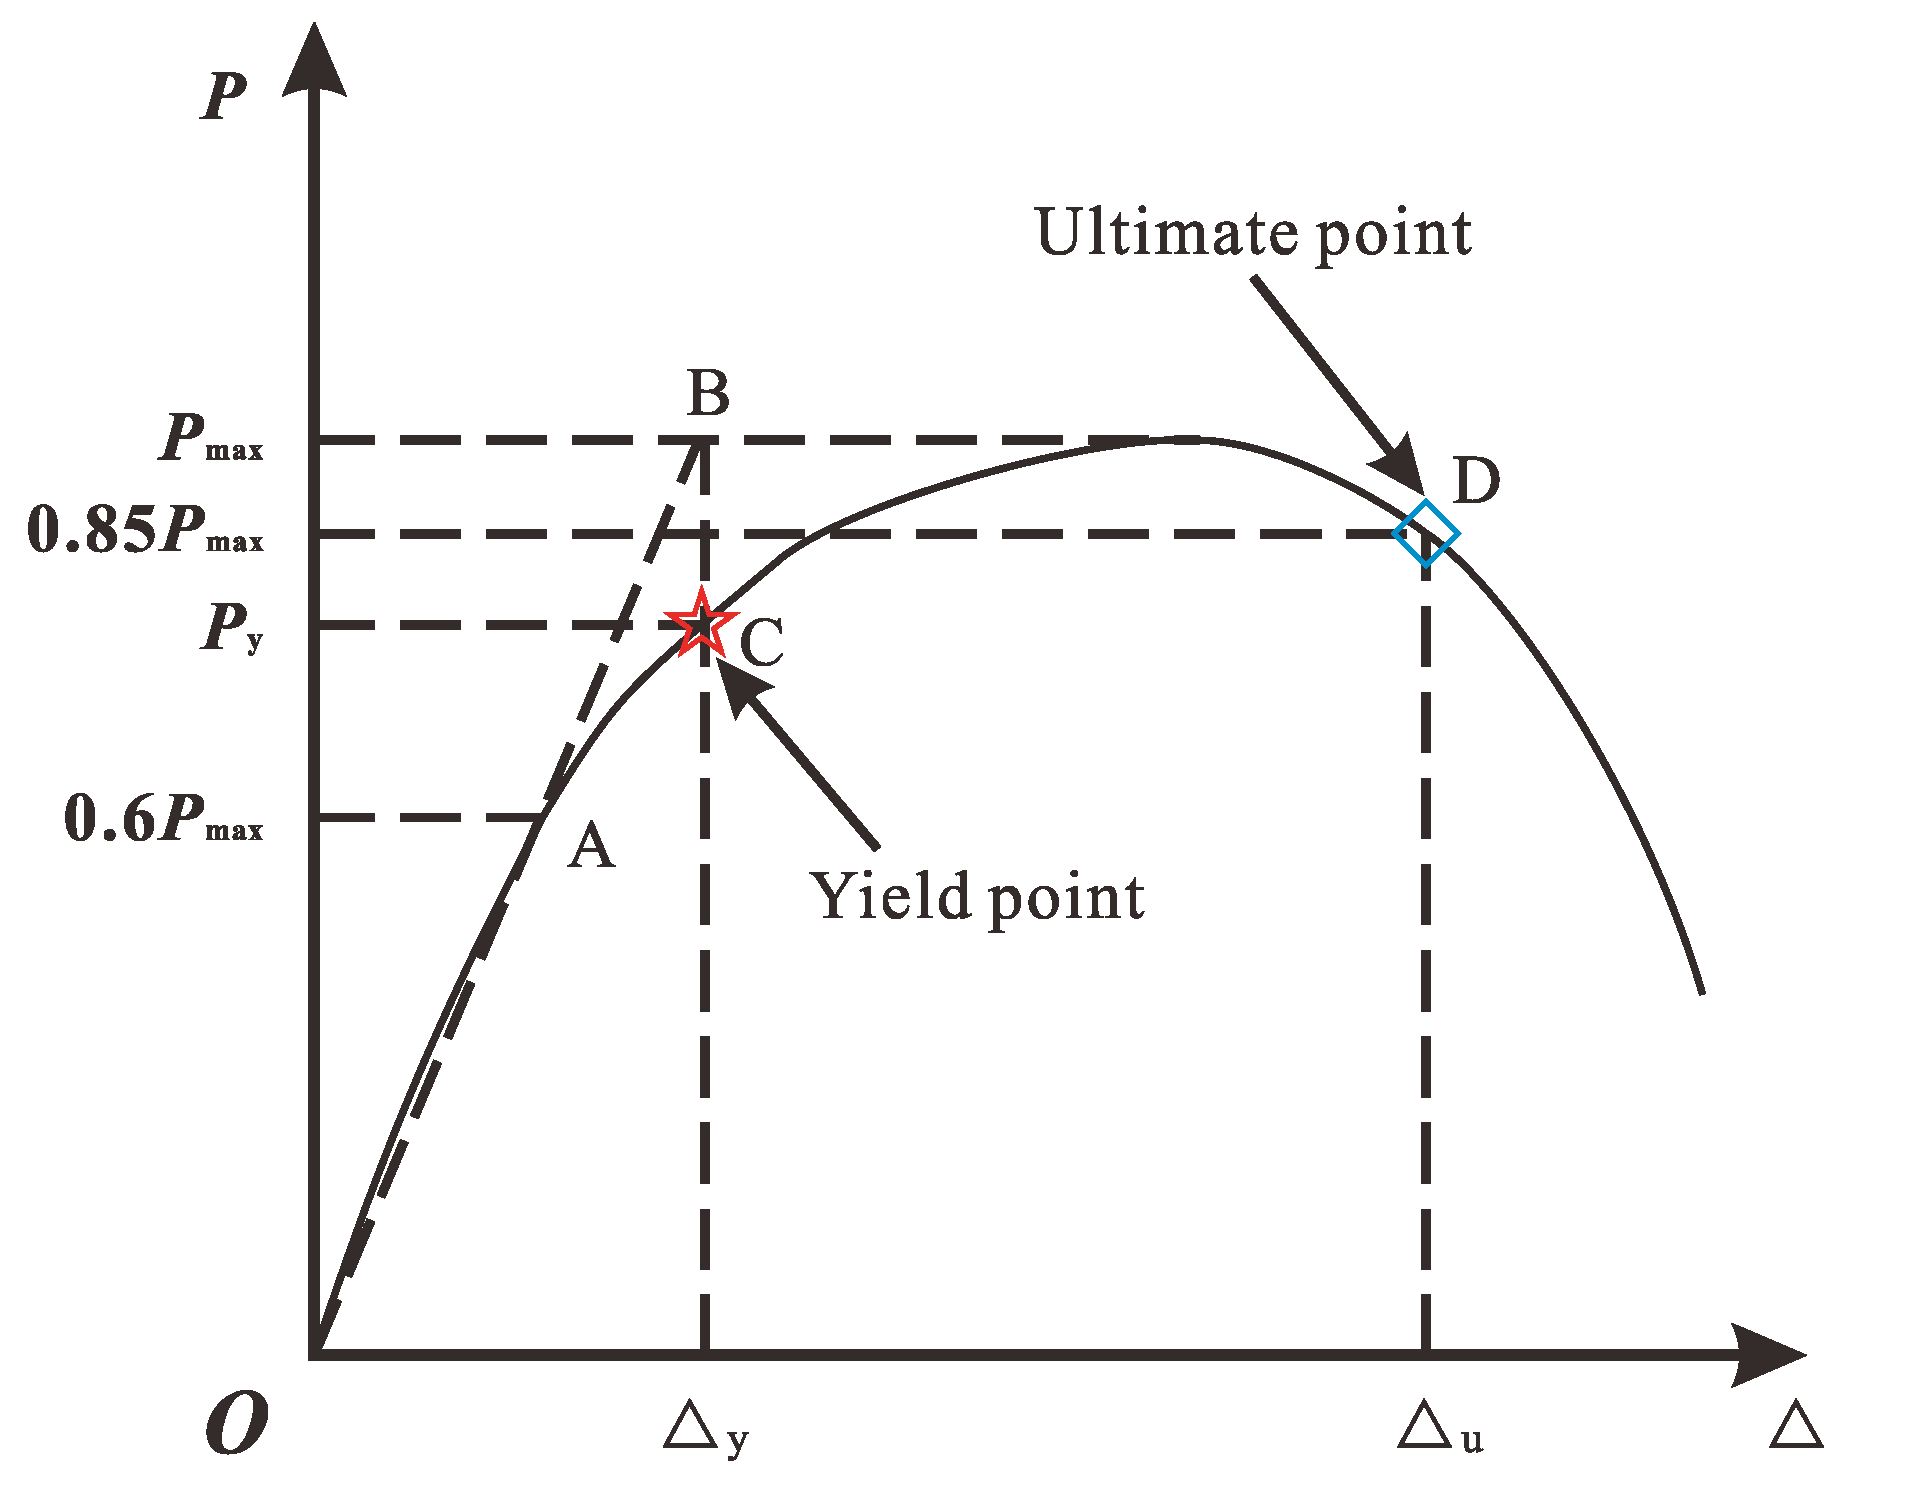
Ductility refers to the ability of a structure or component to maintain sufficient bearing capacity after yielding and possess ample plastic deformation capacity before reaching its ultimate bearing capacity. This is an important parameter for evaluating the deformation capacity and seismic performance of the structure or component. In this study, the ductility coefficient (
μ) is utilized to quantitatively measure the ductility of the joint specimen. A higher value of the ductility coefficient indicates a greater deformation and energy dissipation capacity of the structure or specimen. The ductility coefficient is calculated using the formula provided in references [
18,
19], and is averaged between the forward and backward directions.
where Δ
u is the displacement of the ultimate point corresponding to the load-bearing capacity of the specimen when it falls to 85% of the peak bearing capacity, and Δ
y is the displacement of the yield point, which is calculated by adopting the Park method [
20]. The selection of each feature point is shown in
Figure 12.
Table 4 lists the test results of each characteristic point of the specimen. Among them,
V represents the load of the loading point; Δ represents the displacement of the loading point;
θ represents the drift of the loading point,
θ = Δ/
H; the subscripts
cr,
y,
m,
u respectively represent the characteristic points: cracking, yielding, peak, ultimate.
As can be seen from this table, the drifts at the ultimate points g are from 1/26~1/20. Moreover, the ductility coefficients are from 4.01~7.87, all of which meets the requirement that the ductility coefficient should not be less than 3.0 in the seismic design [
21]. It proves that the two detailing measures proposed in this study have good seismic performance and deformability.
When comparing specimens with different structural details, it is observed that the ductility coefficients of specimens SW1 and TW1 with the AR detailing are higher than those of specimens SW2 and TW2 with the DA detailing. Furthermore, it can be inferred that specimens TW1 and TW2 with a T-shaped shear wall have higher ductility coefficients than those with an I-shaped cross-section.
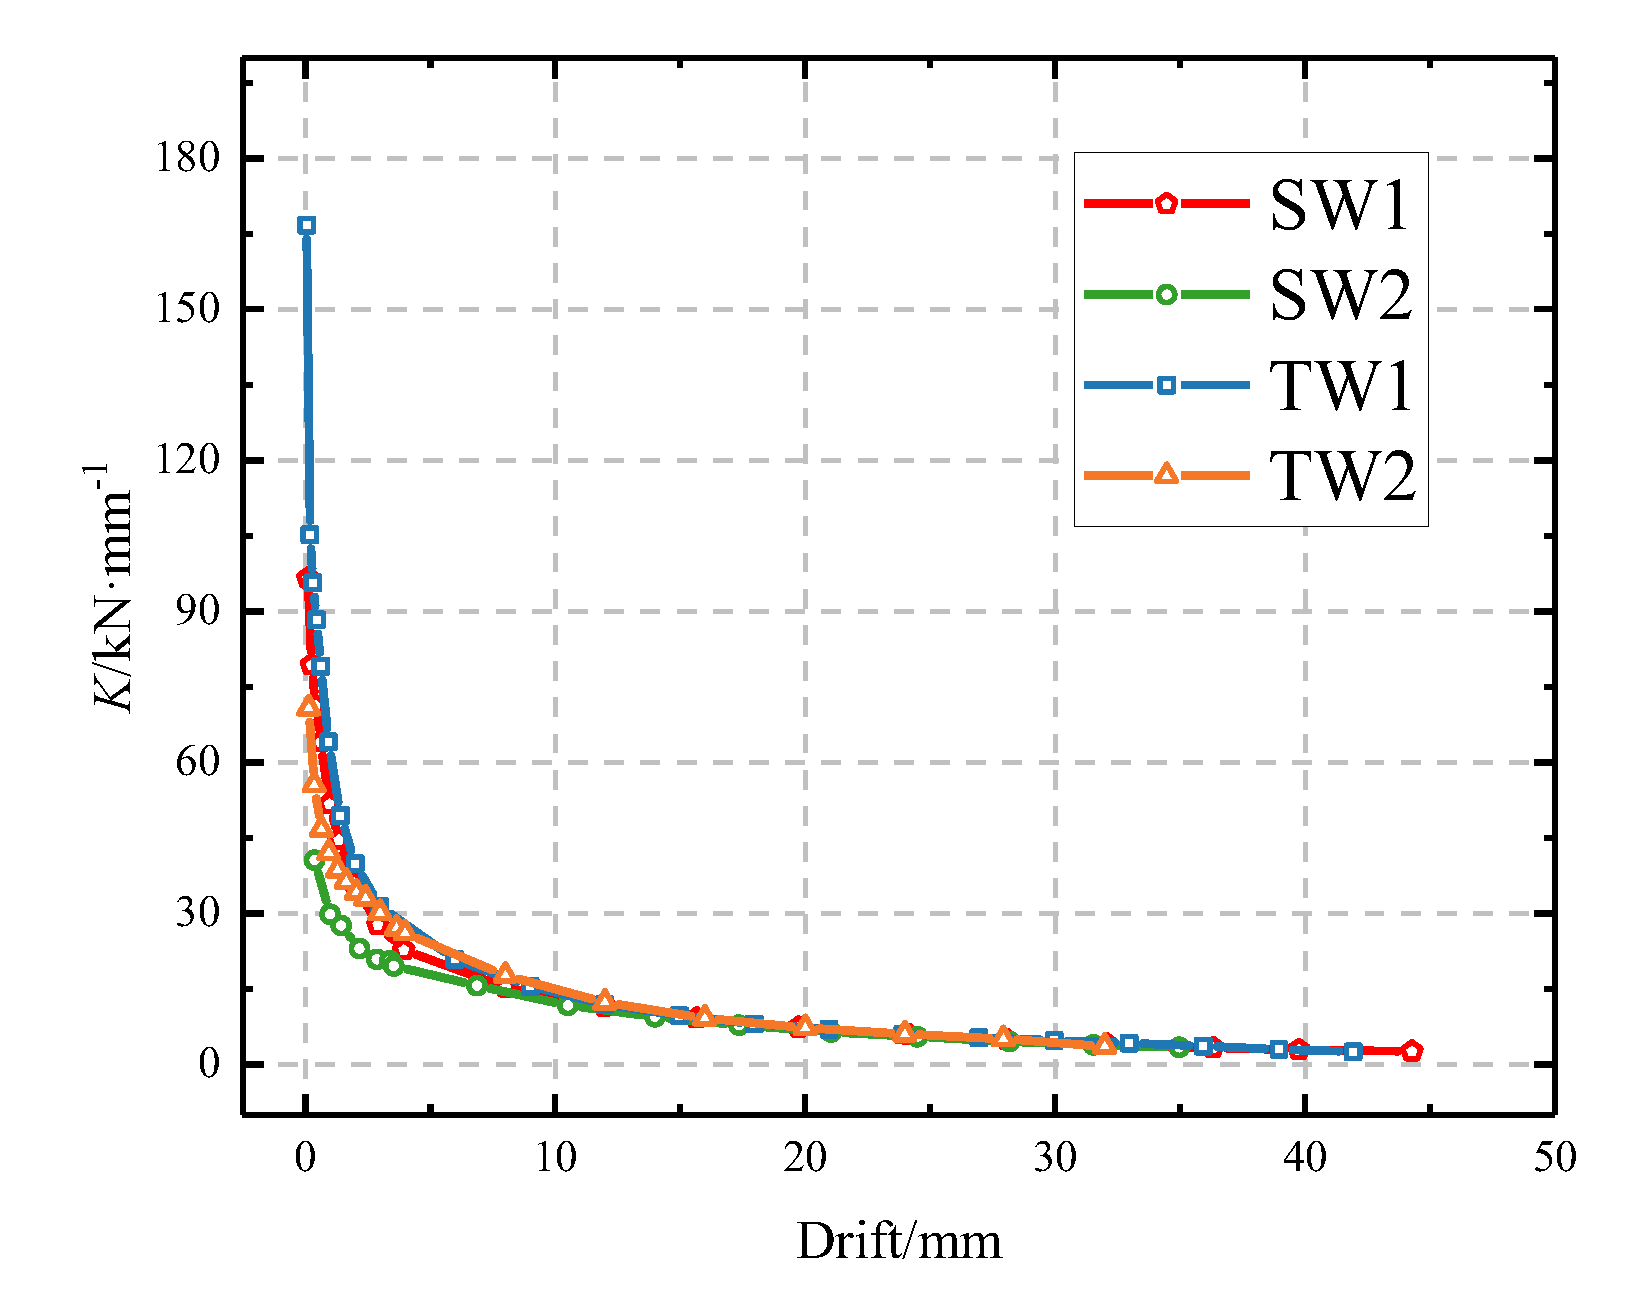
3.4. Stiffness Degradation
The reduction in stiffness in a structure or element as the number of low cyclic loads increases is referred to as stiffness degradation. In this study, the secant stiffness,
K [
22] is employed to assess the stiffness degradation of the specimen during the experiment. The secant stiffness is calculated by dividing the average value of the forward and reverse loads by the average value of the corresponding forward and reverse displacements.
where
and
are the positive peak load and negative peak load of the
ith loading cycle,
and
are the positive peak displacement and negative peak displacement of the ith loading cycle.
Figure 13 presents the test results, showing that the stiffness degradation trends of all four specimens were similar. This implies that the stiffness degradation trend is not significantly influenced by the form of the shear wall or the structural configuration of the joint. Among the specimens, SW2 had the lowest stiffness, while TW2 had the highest stiffness, indicating that the specimen with the AR detailing and the T-shaped shear wall at the bottom plate had a greater stiffness.
Moreover, the stiffness degradation rate of the specimens was positively correlated with the development trend of cracks. As cracks developed faster, the stiffness degradation rate also increased. Numerous cracks appeared and developed rapidly before the specimens yielded, and, during this process, the stiffness of the specimens deteriorated rapidly. However, after the specimens yielded, fewer new cracks appeared, and the stiffness degradation slowed down.
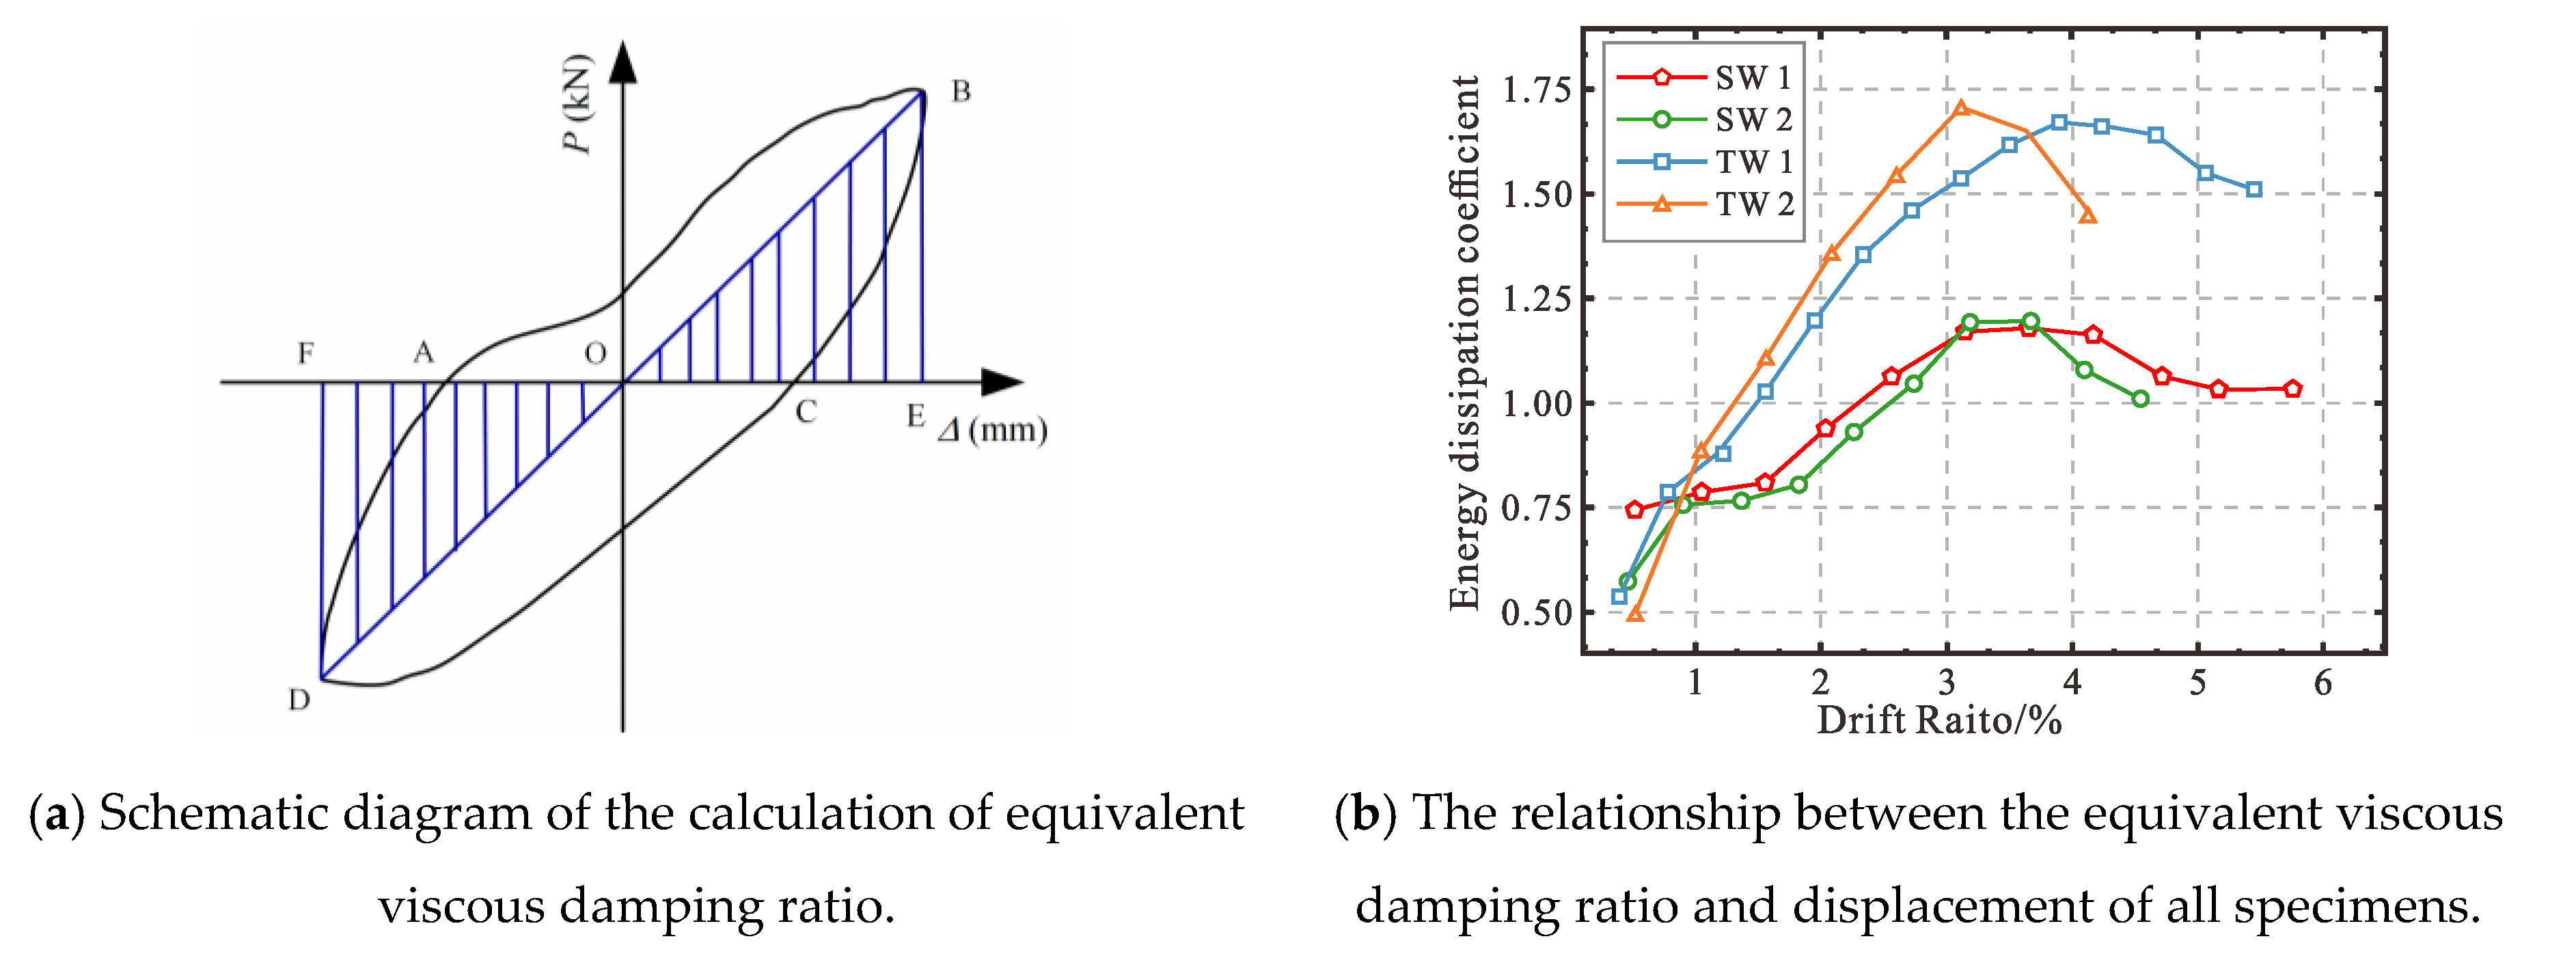
3.5. Cumulative Dissipated Energy
To analyze the energy dissipation performance of the shear-wall specimen, the energy dissipation coefficient,
E, is employed. A larger value of
E indicates a better energy-dissipation capability of the specimen. As shown in
Figure 14a, the following formula is used to calculate the energy dissipation coefficient [
21,
22]:
where
SABC +
SACD was the energy absorbed by the component during this cycle of cyclic loading.
SOBE +
SODF: the total deformation energy of the component during this cycle of cyclic loading.
Figure 14b displays the test results, indicating that the specimens with the AR detailing (SW1 and TW1) had better energy dissipation performance before and after yielding compared to those with the DA detailing (SW2 and TW2) for the same shear wall form. The AR detailing ensured a slow decline in energy consumption capacity after reaching the peak, demonstrating stable energy dissipation performance, while the DA detailing had a weaker ability to delay the decline. In addition, the energy dissipation capacity of specimens TW1 and TW2 was better than that of specimens SW1 and SW2, highlighting that T-shaped shear walls with a larger supporting range exhibit stronger energy dissipation capabilities.
3.6. Strain of the Reinforcements
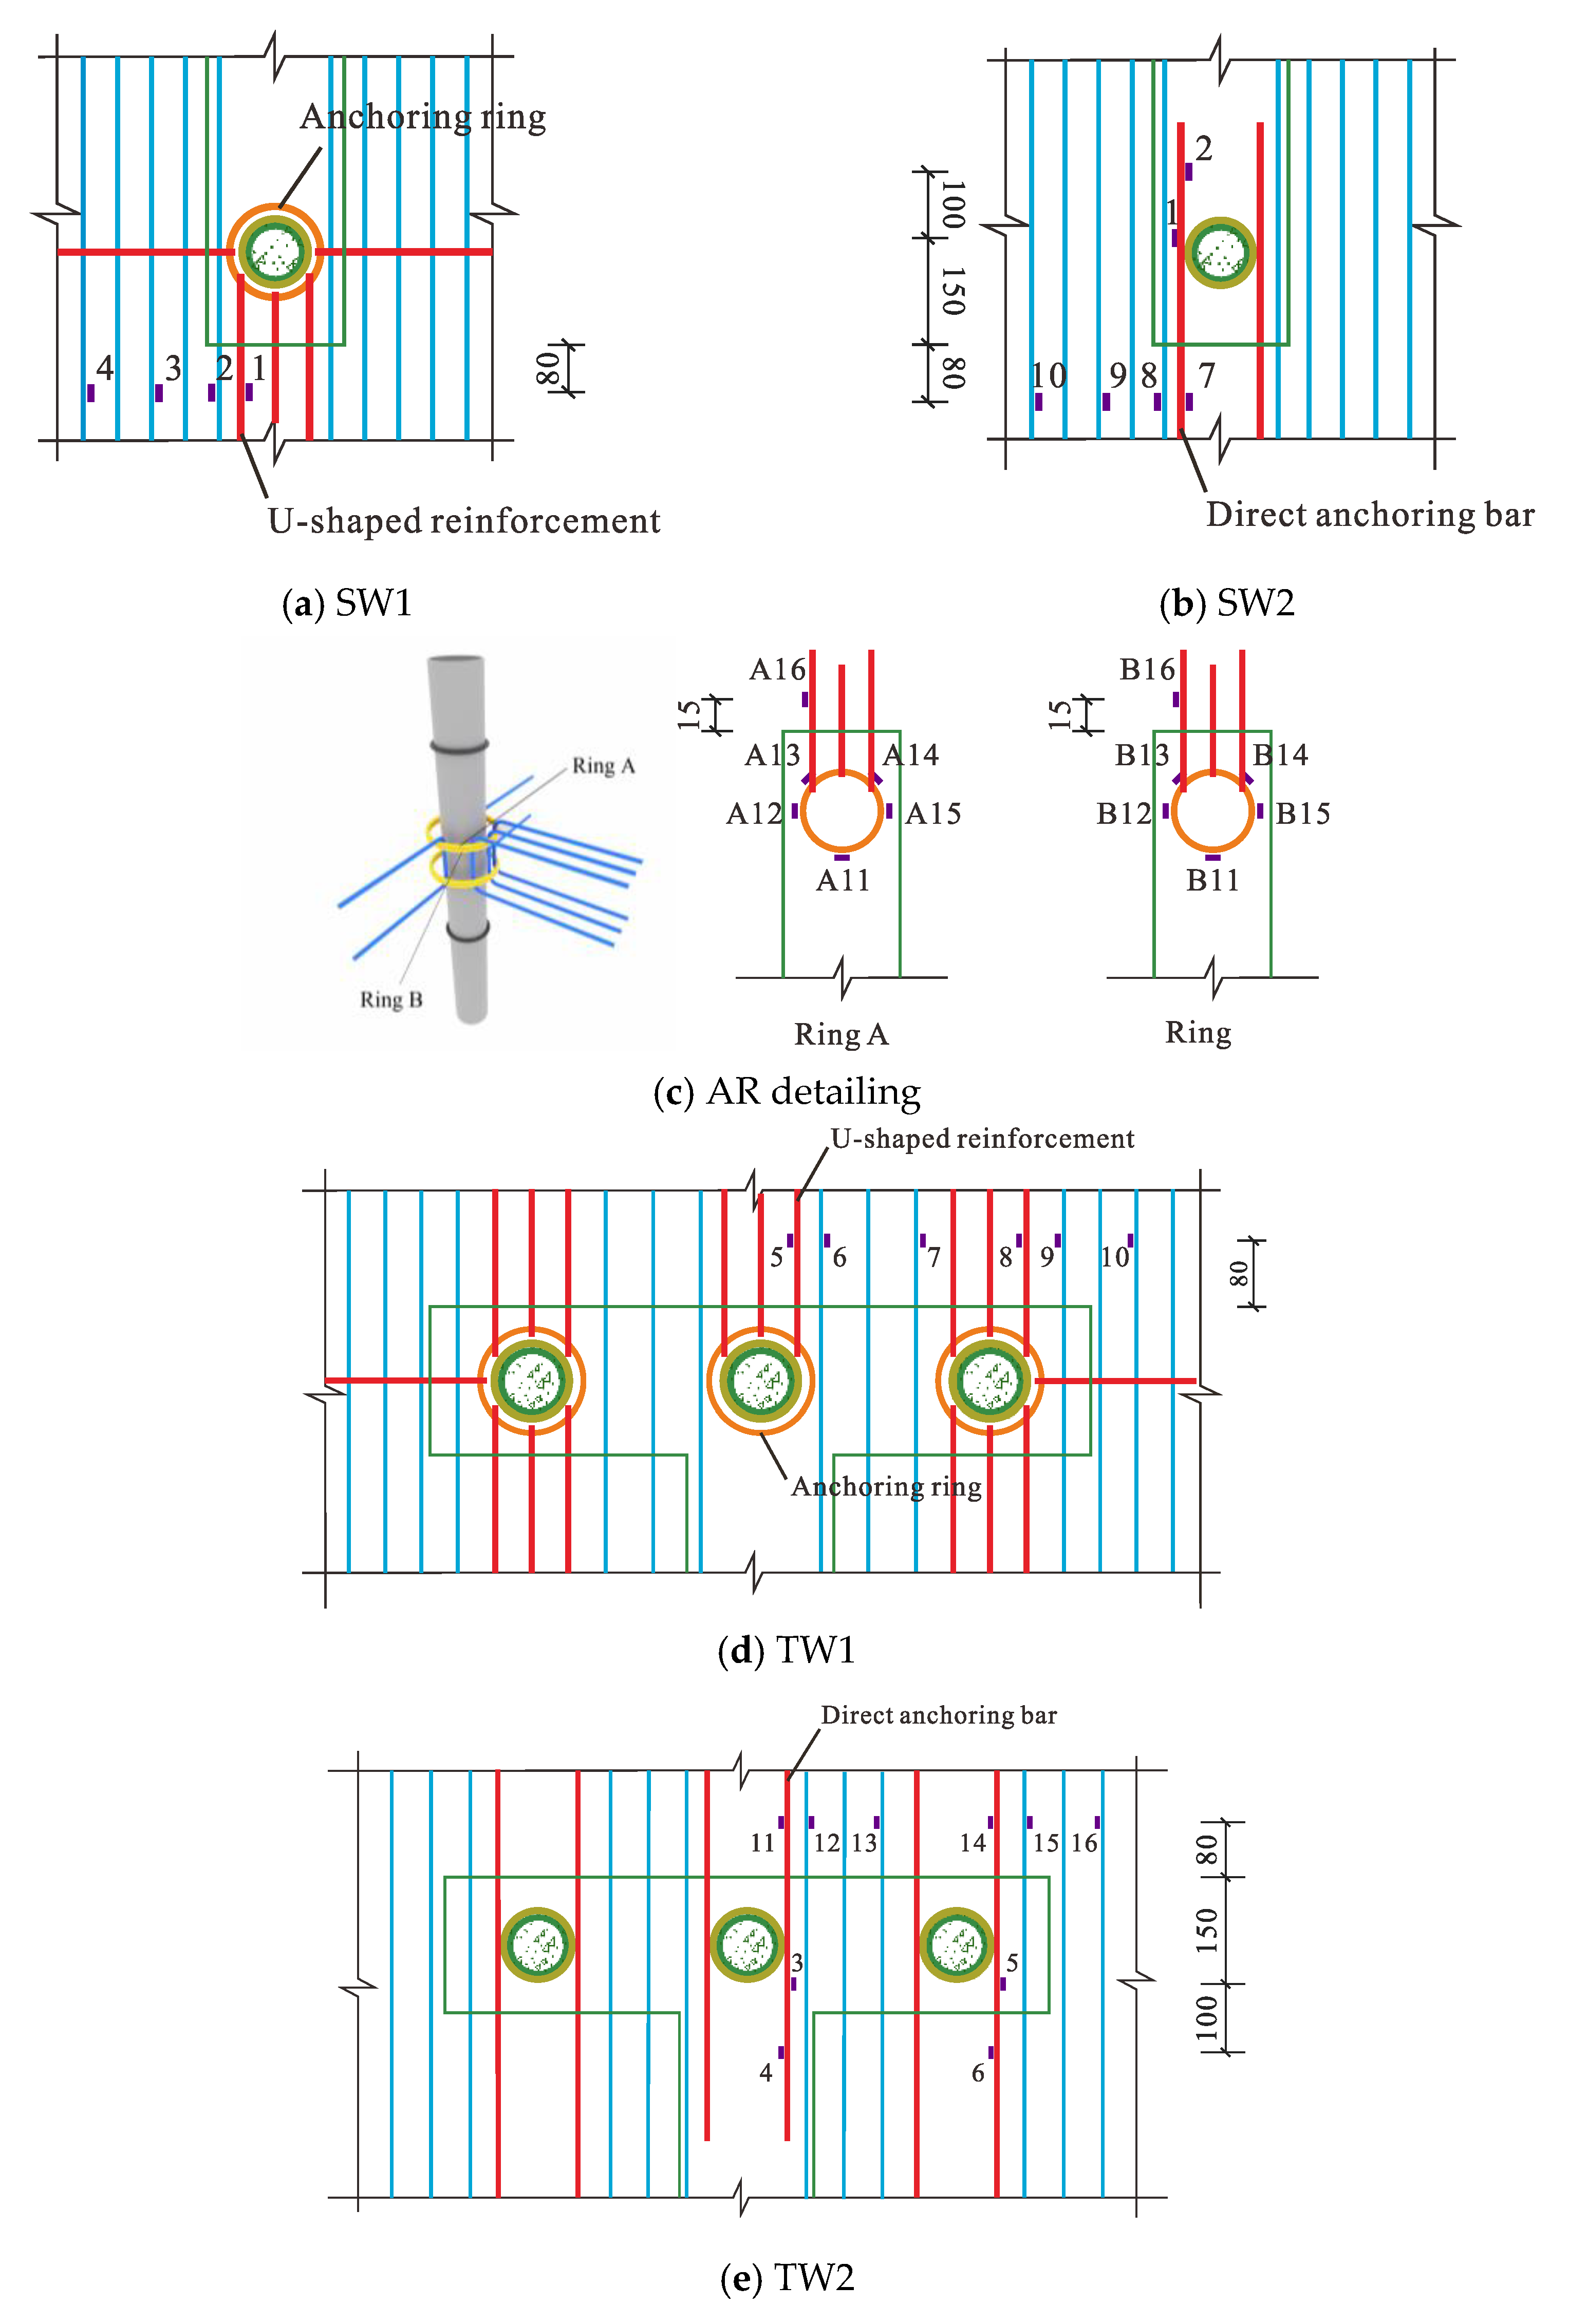
Figure 15 displays the strain measuring points’ arrangement for the 4 specimens. As specimens TW1 and TW2 were symmetric, strain gauges were only placed on the structural area’s middle part and one of the ends of the shear wall (
Figure 15a,b). In each group of the AR detailing, there were 5 measuring points on the anchor ring and 1 measuring point on the U-shaped reinforcement of specimens SW1 and TW1 (
Figure 15c). For the DA detailing, strain gauges were positioned 150 mm and 250 mm away from the shear wall’s outer layer to assess the reliability of the DA steel bar’s force transmission in the concrete of the shear wall.
3.6.1. SW1 and TW1
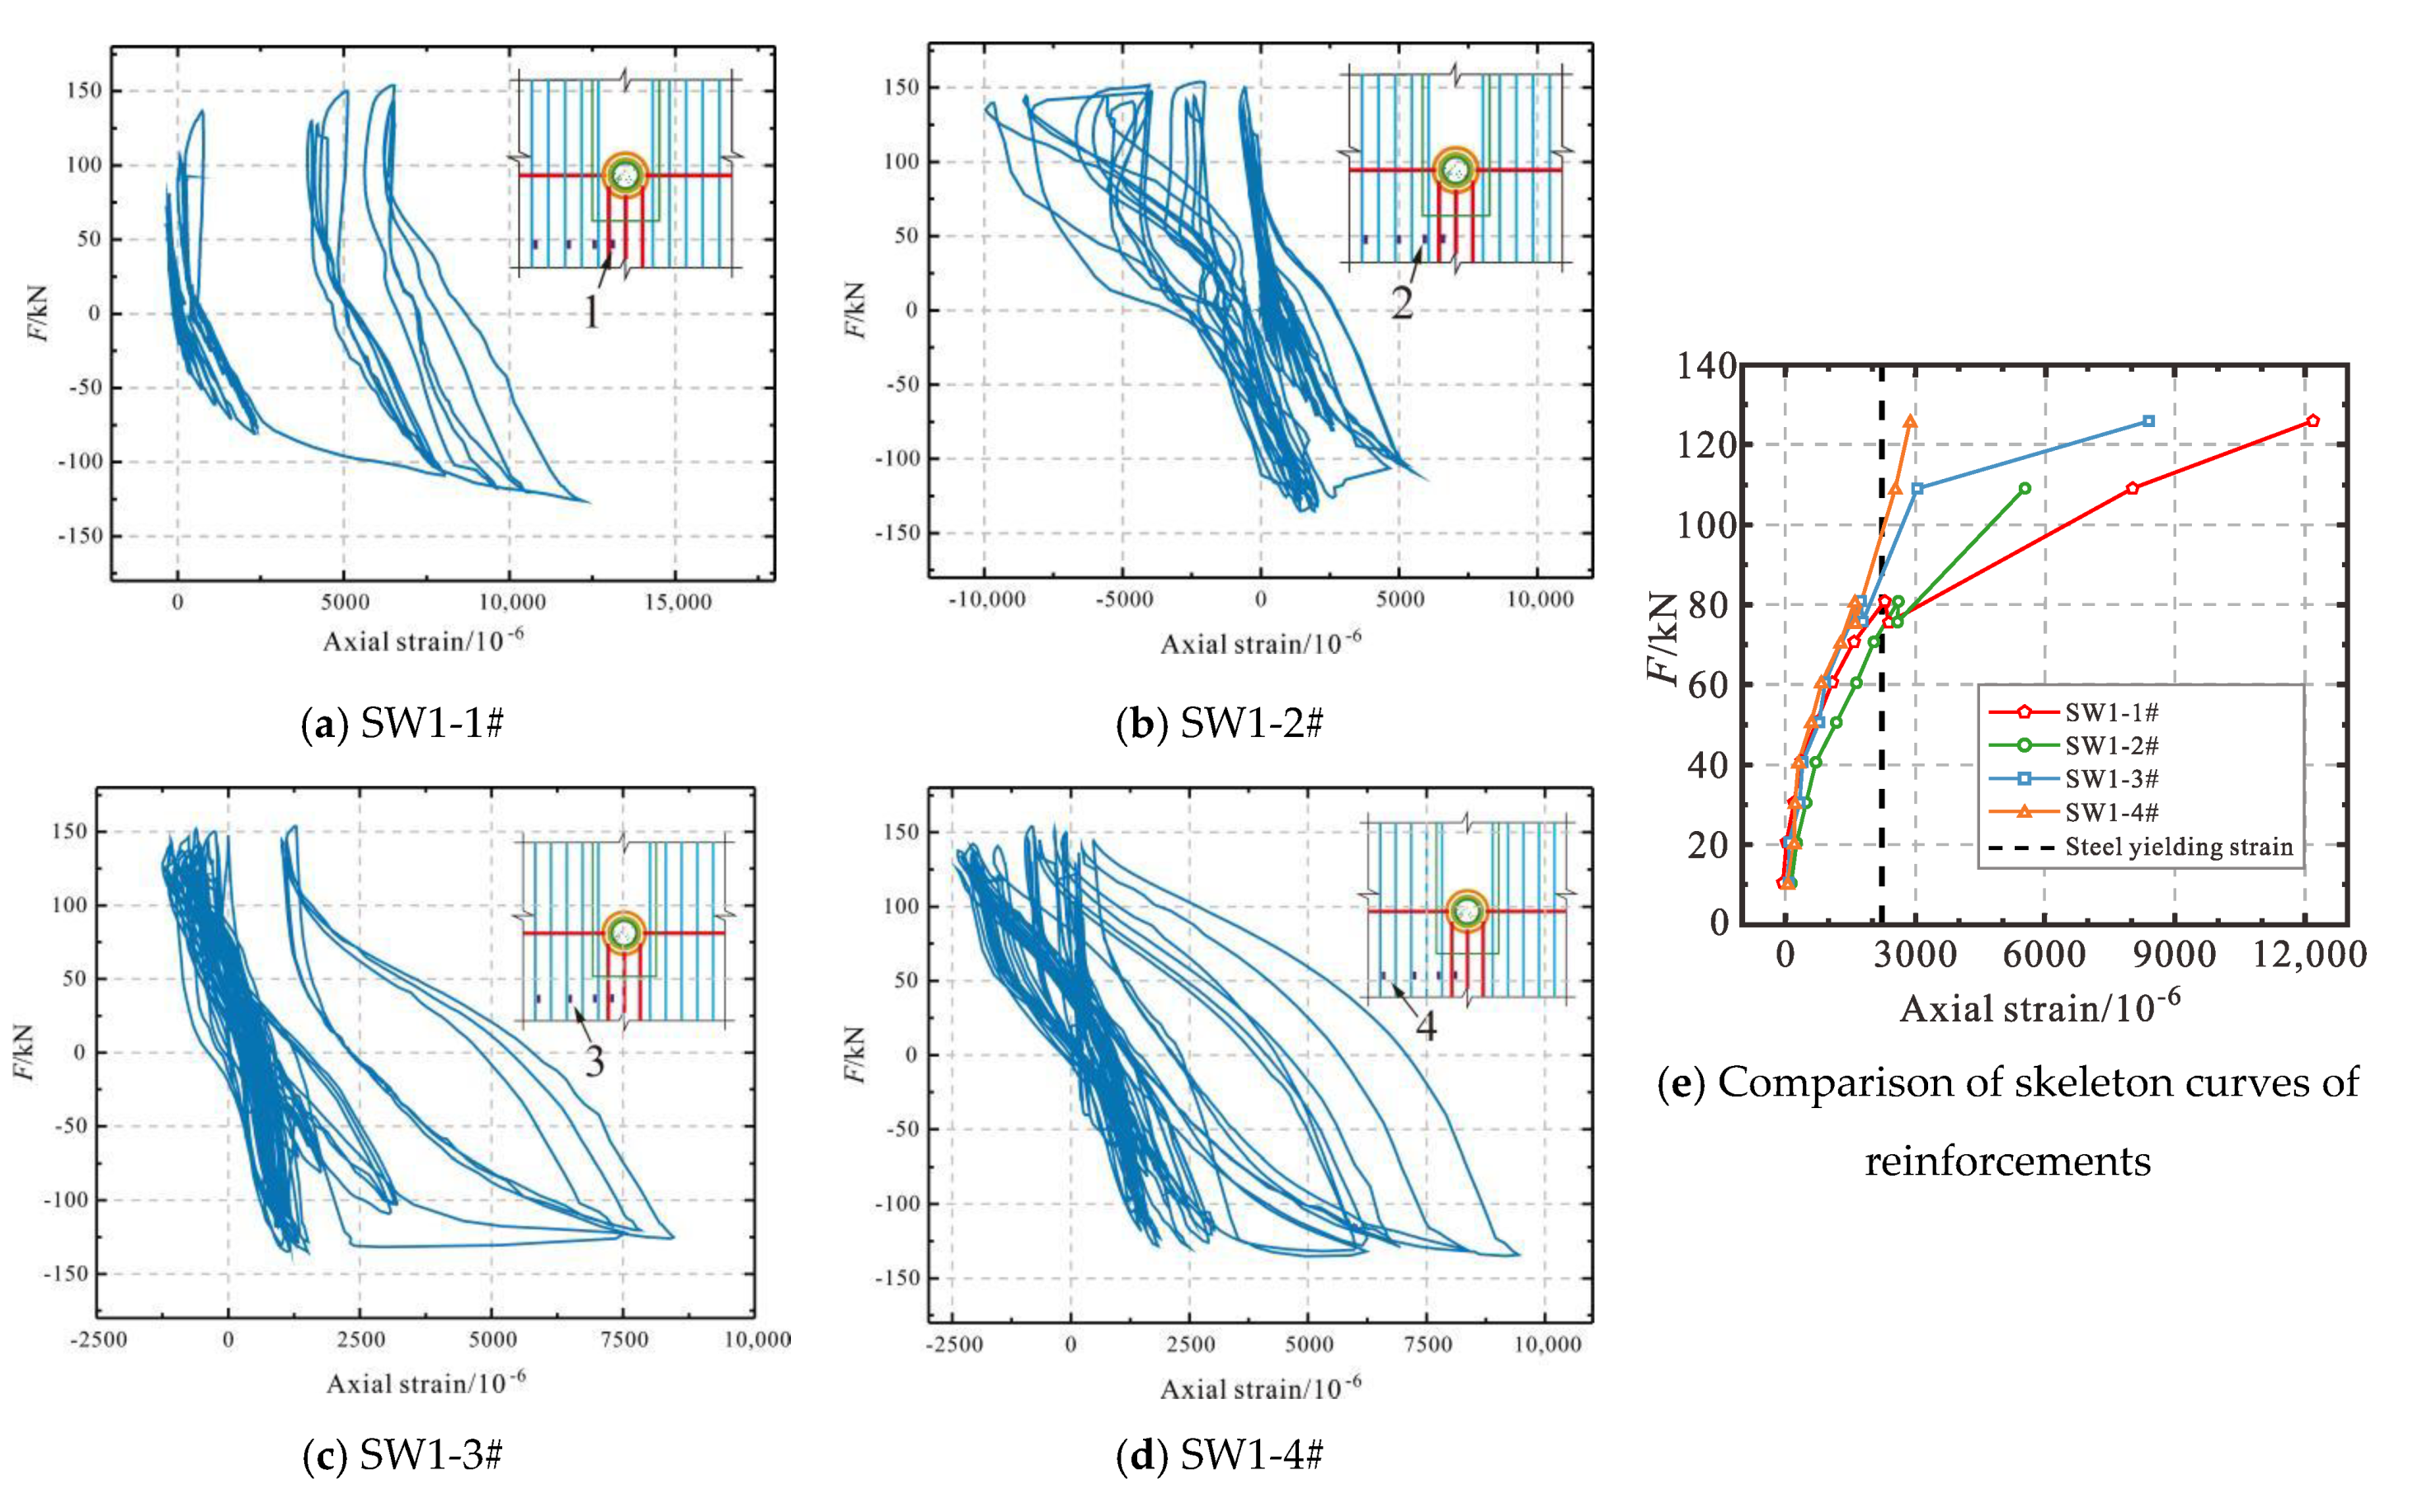
In order to evaluate the viability of the floor AR detailing, the strains of the U-shaped reinforcement on the west side of test specimens SW1 and TW1, along with their adjacent reinforcements, were compared, as depicted in
Figure 16 and
Figure 17.
Figure 16e indicates that, for specimen SW1, the strain of U-shaped steel bar SW1-1# and its adjacent floor steel bar(2#, 3#, 4#) increased steadily at the initial loading stage. However, after the load exceeded 80kN, the strain of SW1-1# started to surpass that of SW1-2#, and it reached yield prior to the negative yield load of 111.70kN, without a sudden drop in strain throughout the process. In contrast,
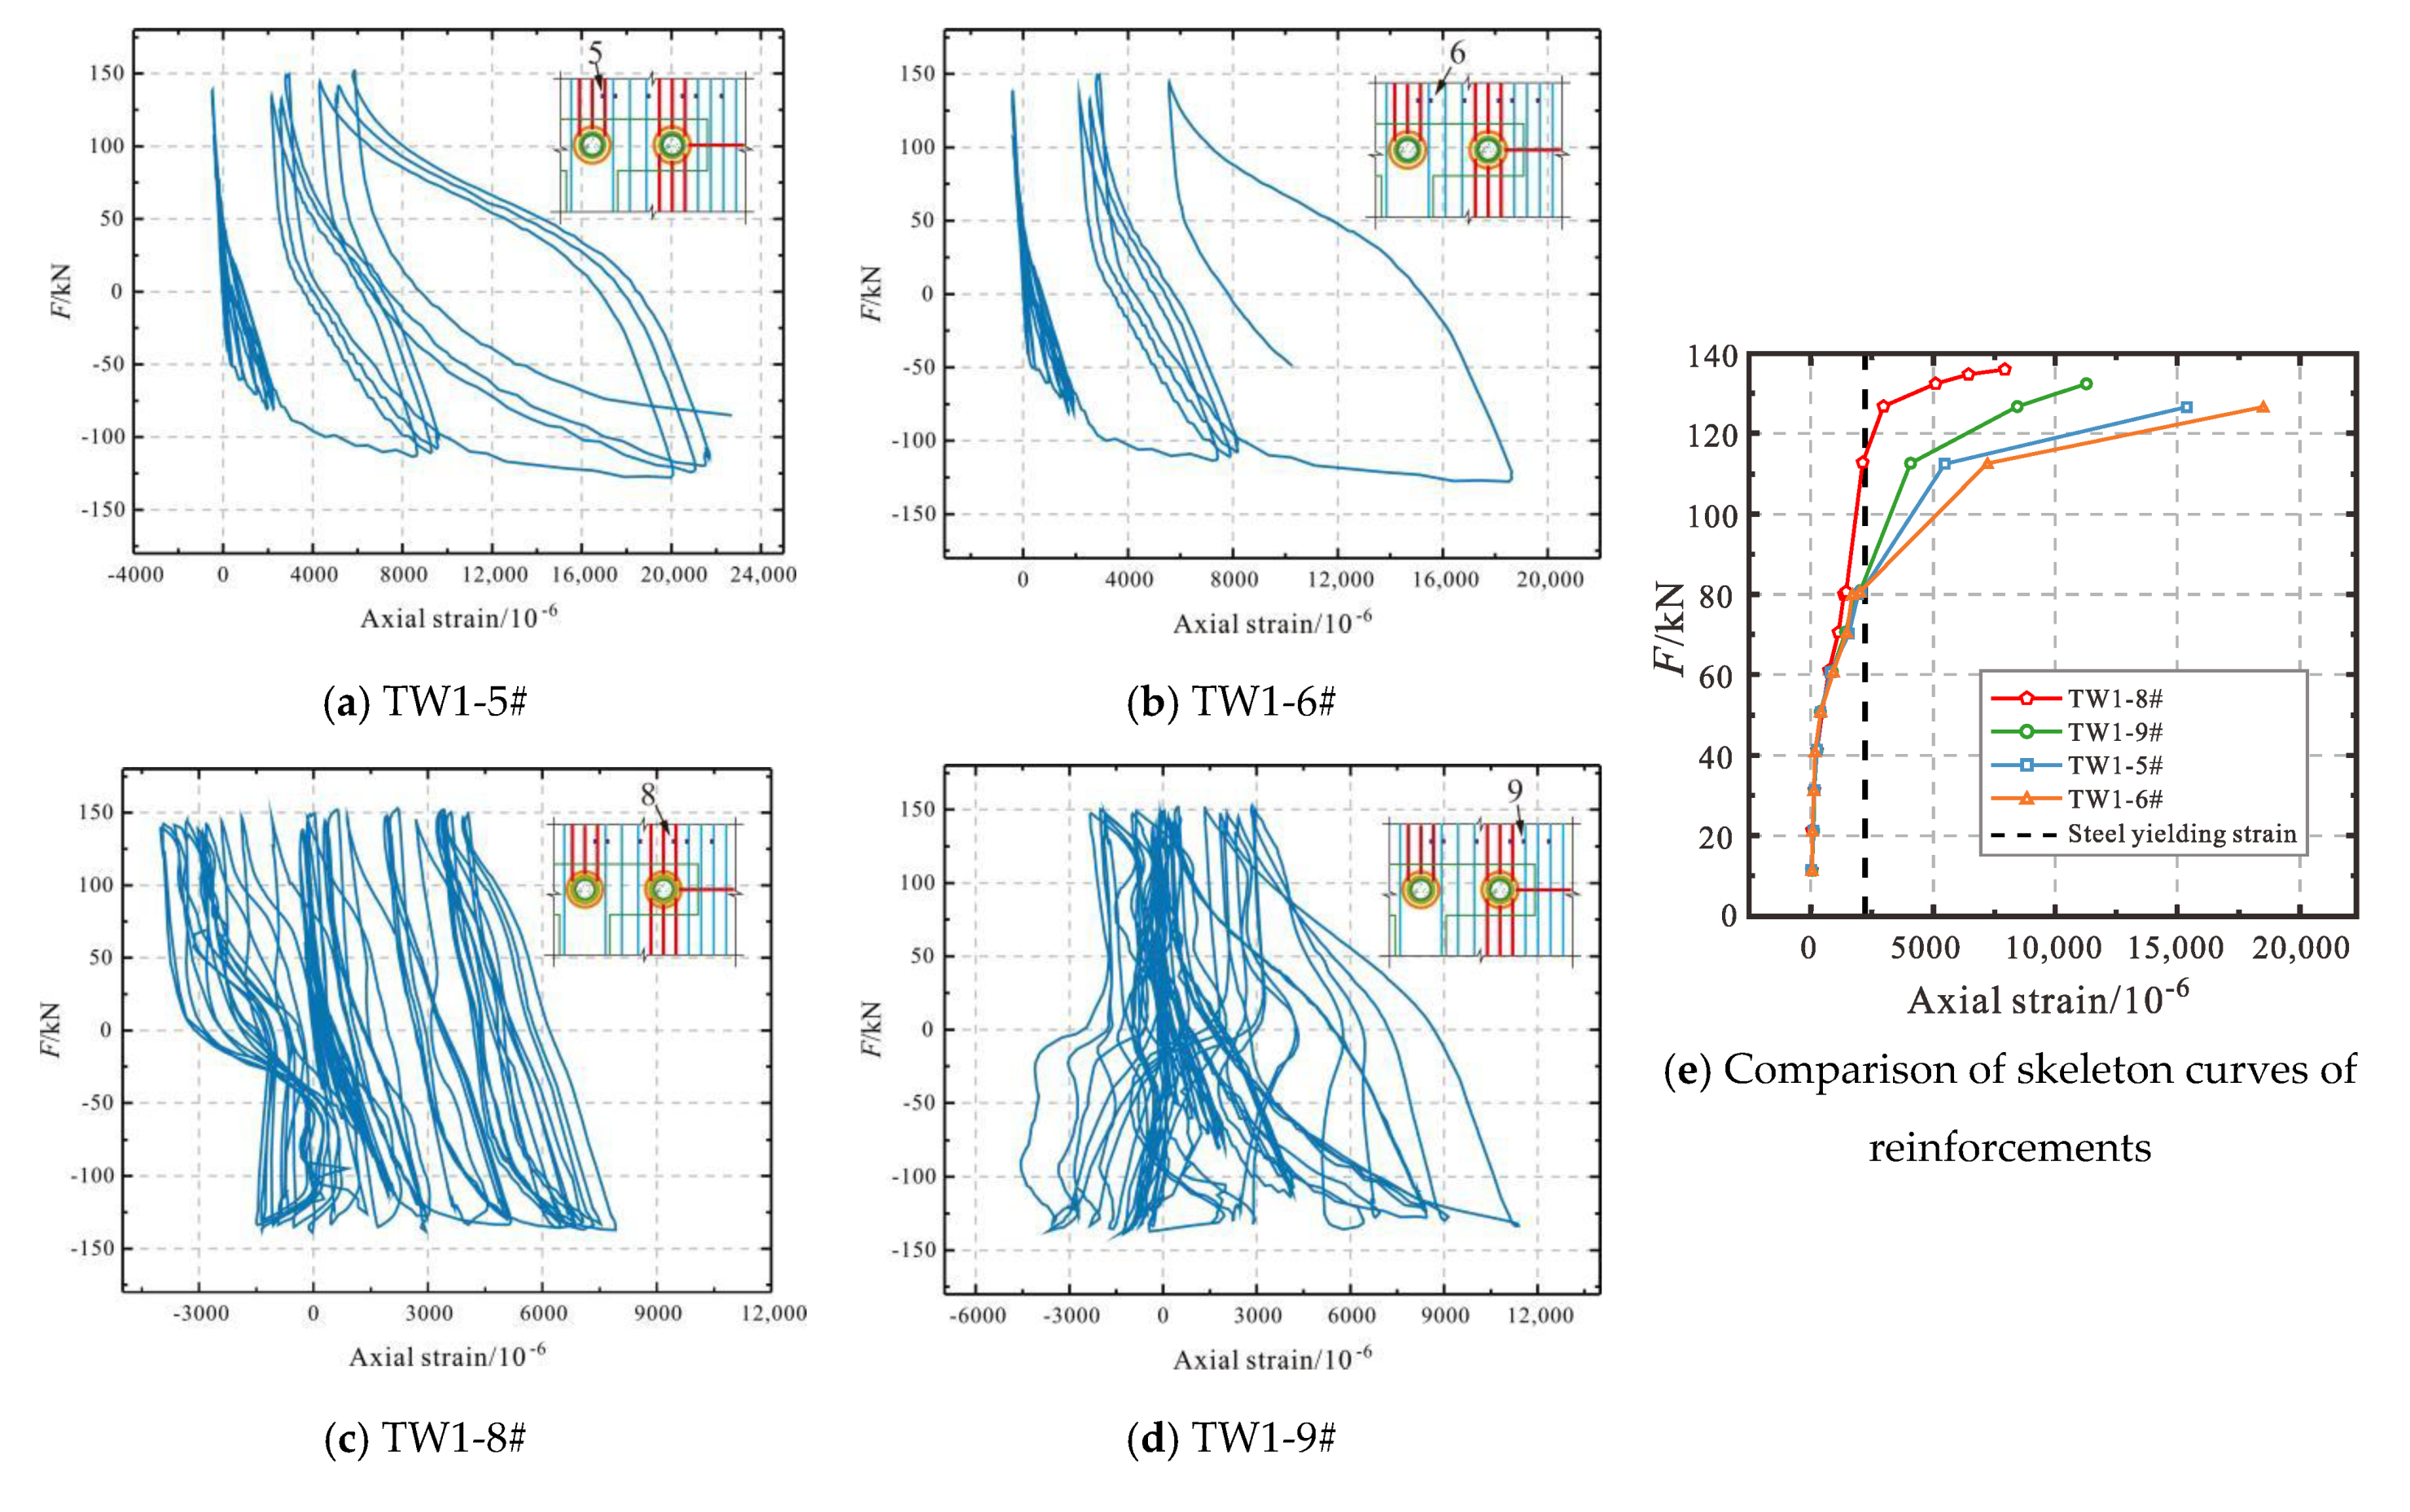
Figure 17 reveals that, unlike test specimen SW1, the strain growth of U-shaped steel bars (5#, 8#) almost coincided with adjacent slab steel bars (6#, 9#) during the initial loading phase. However, after the negative load reached 80 kN, the strain growth of U-shaped steel bars started to lag behind adjacent slab steel bars. Although the U-shaped steel bar of test specimen TW1 exhibited strain hysteresis during the loading process, the strain of U-shaped steel bars in the middle and end structural areas was able to withstand a negative yield load of 114.17 kN. The above strain variation patterns demonstrated that U-shaped bars not only have an anchoring and tensile effect similar to that of adjacent slab bars but also function fully in their own right before the specimen yields.
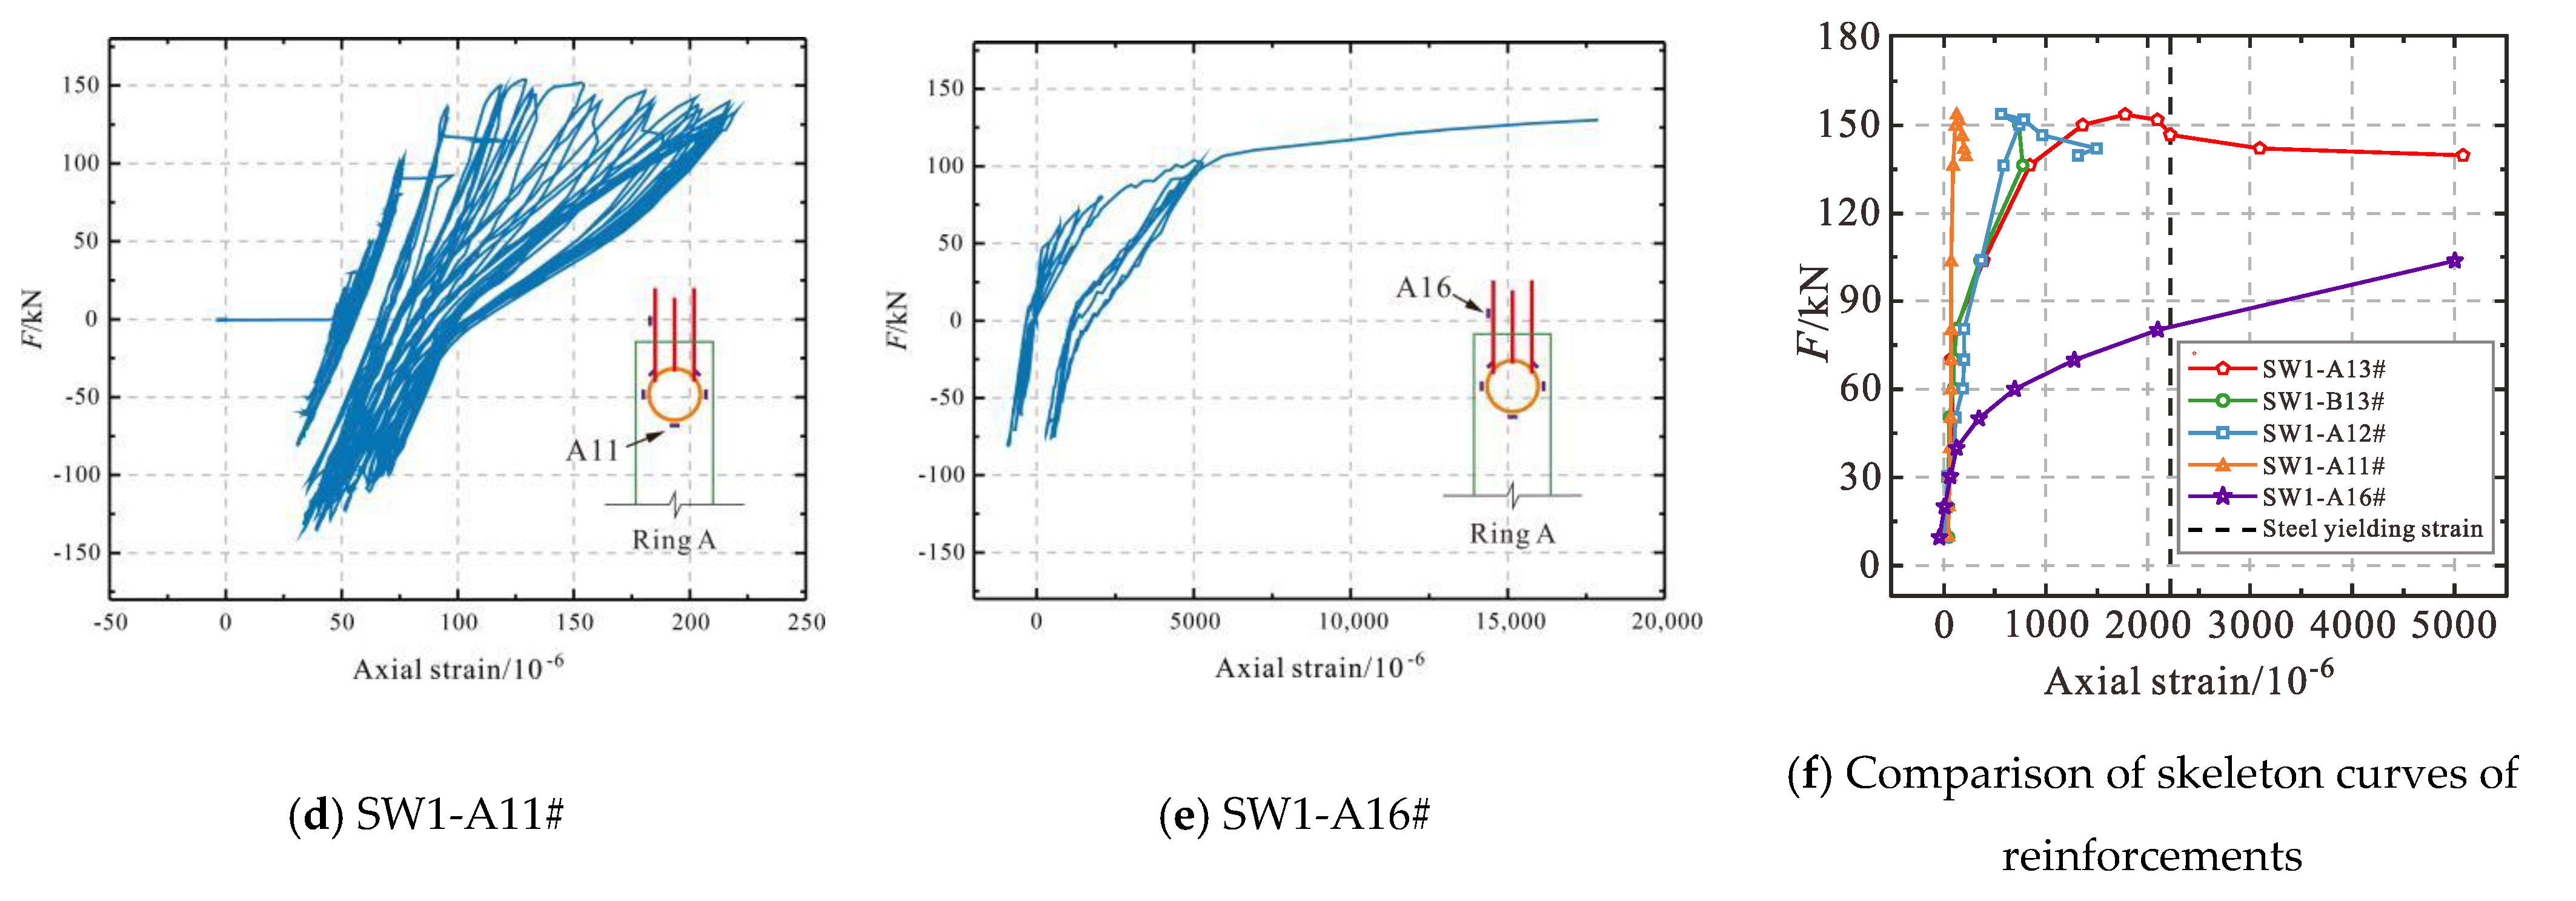
Figure 18 presents the strain analysis of the steel anchor ring of specimen SW1. Due to the similarity of the strain changes between test pieces TW1 and SW1, the latter is used as an example for analysis. As seen in
Figure 18f, before loading the forward load of 40kN, the growth of U-shaped steel bar SW1-A16# and of the steel anchor ring (A13#, B13#, A12#, A11#) are almost the same. As the load approaches the normal yield load of 115.01kN, the strain of steel anchor ring bars (A13#, A12#, A11#) decreases successively. This indicates that the closer the location of the U-shaped reinforcement fastening point of the slab, the greater the strain on the AR bars, and vice versa. This proves that the force transmission path of the AR reinforcement is clear and that the U-shaped bars can better transmit the tensile force of the slab steel bar into the interior of the shear wall. Additionally, the strain of AR bar A13# was greater than that of B13#, indicating that the reinforcing steel AR near the floor surface grew faster than the one further away. At the nearly achieved peak load of 153.85 kN, the closest point to the fastening, SW1-A13#, reached yield. These results demonstrate that the AR detailing can transmit force and anchor well during loading, without premature yield and failure.
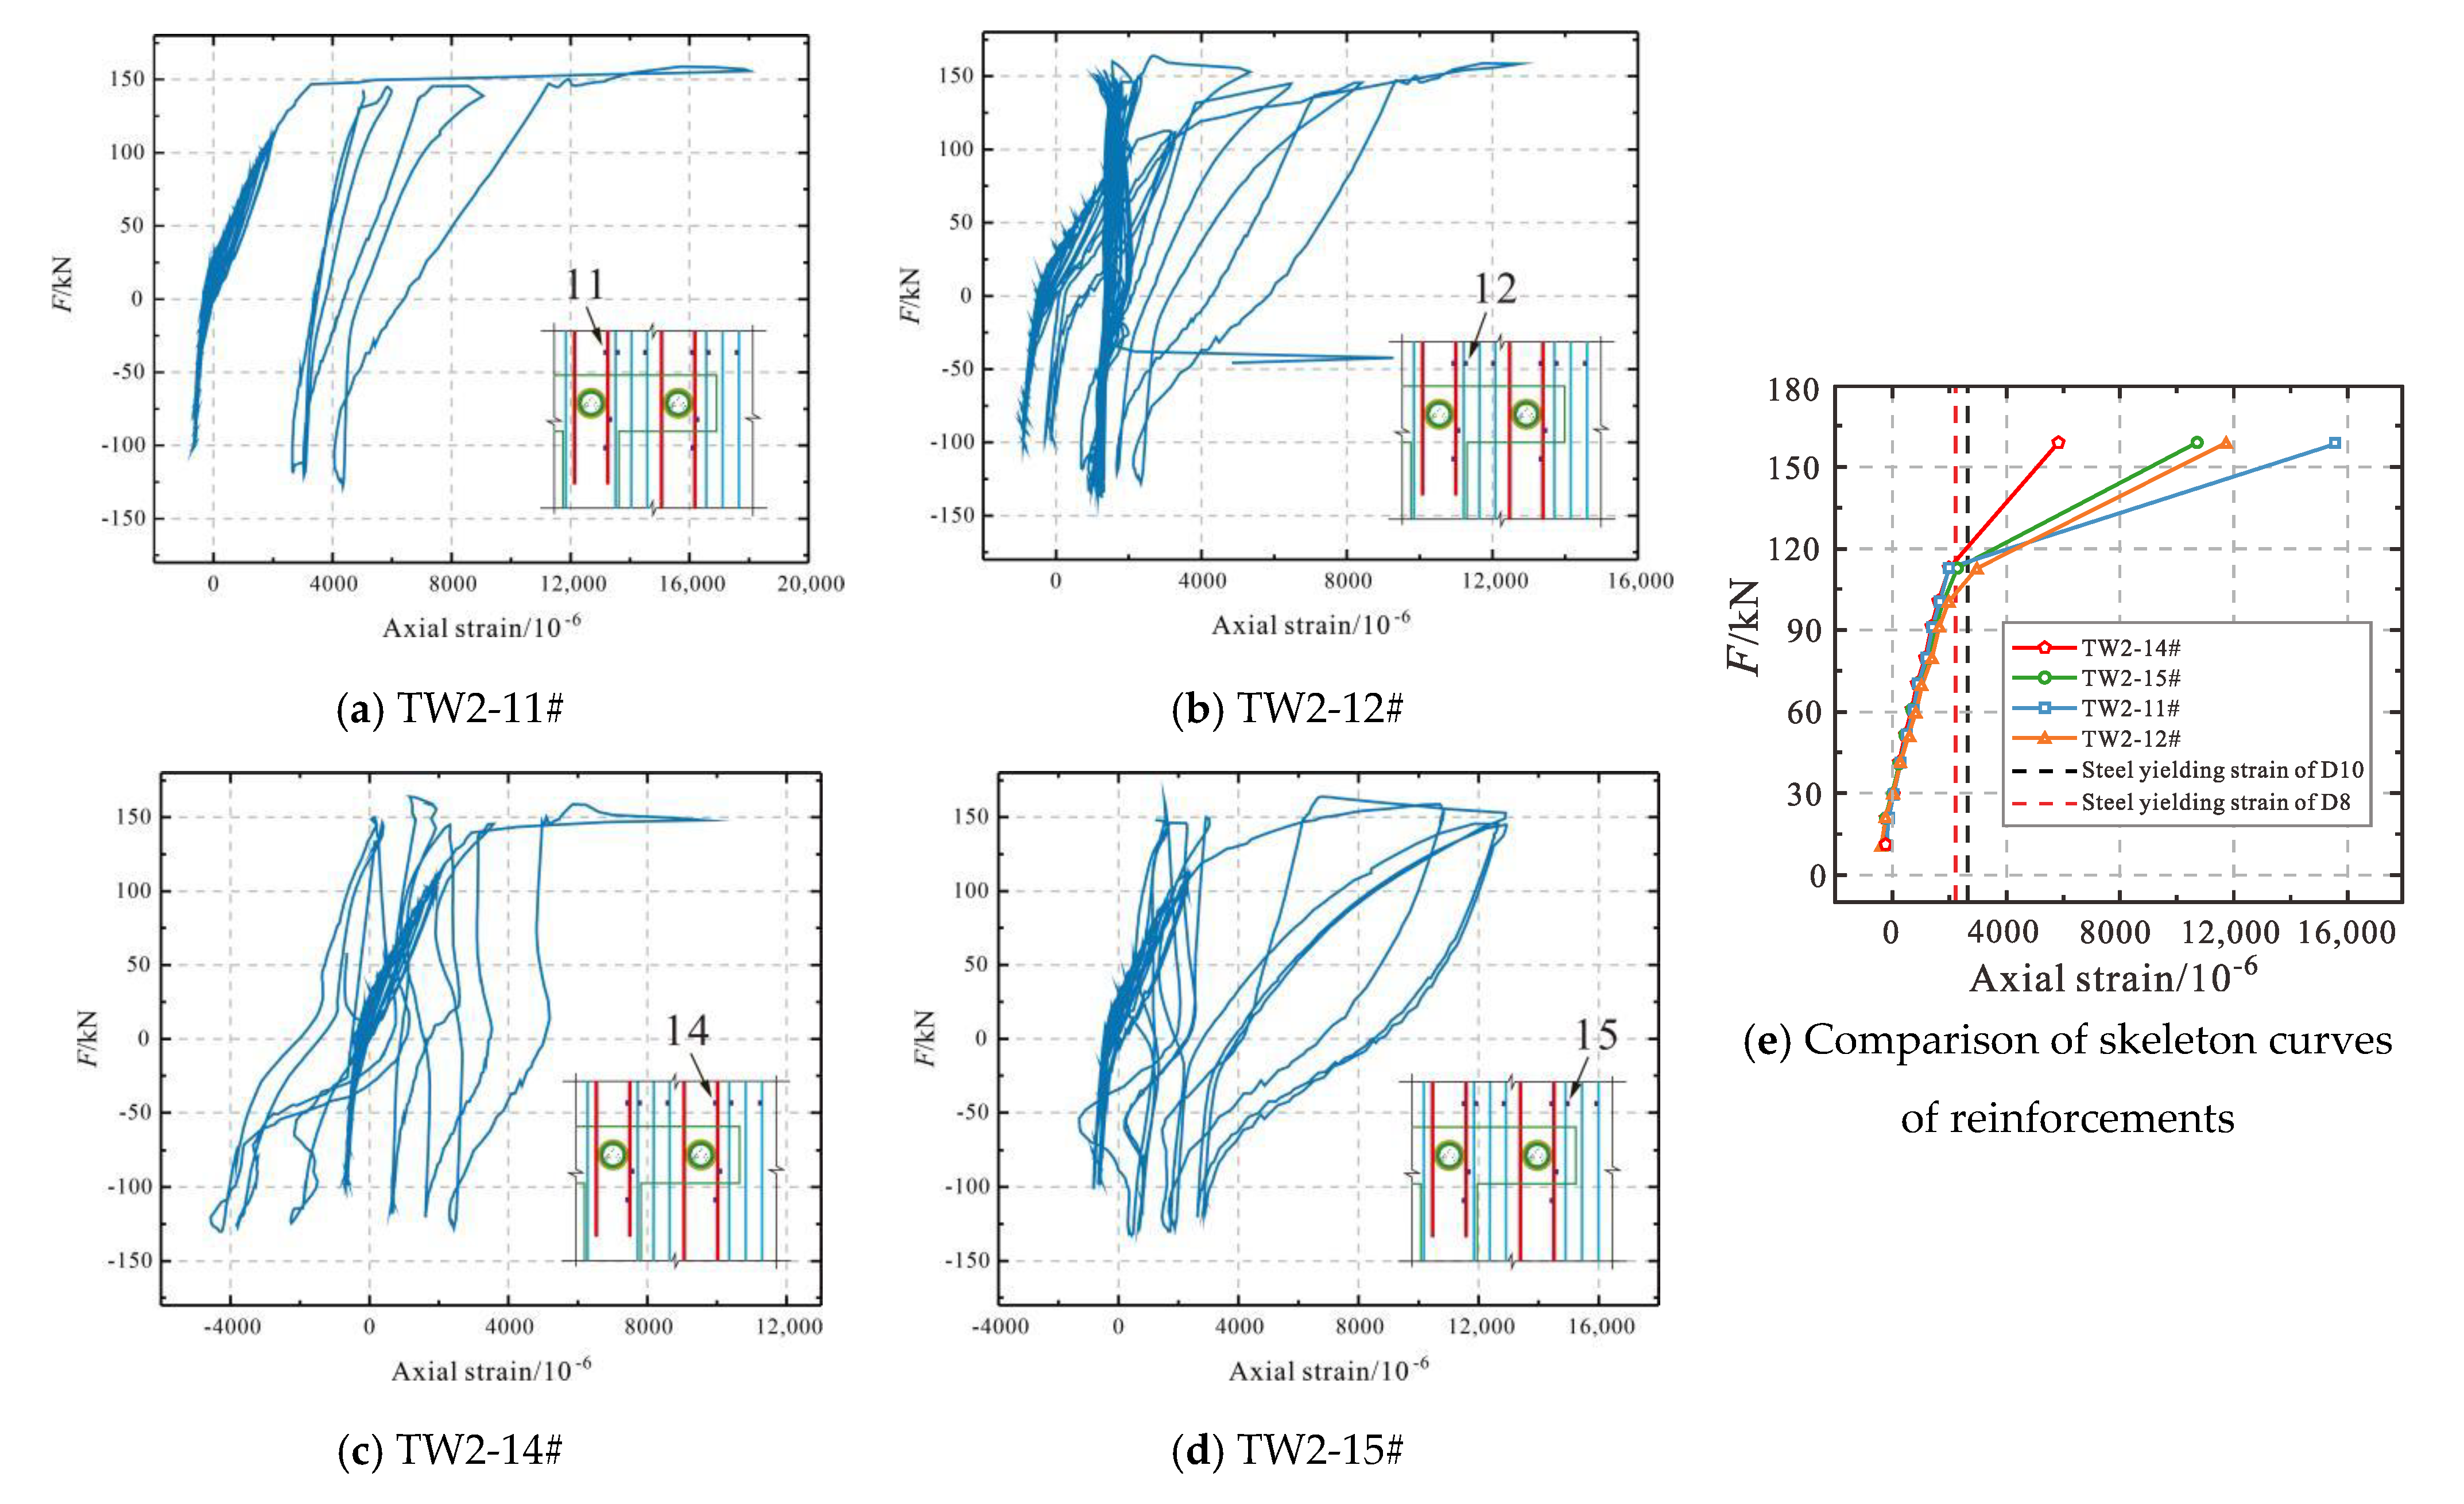
3.6.2. SW2 and TW2
In order to analyze the feasibility of the DA detailing, the strains of the direct anchoring steel bar on the west side of the test pieces SW2 and TW2, and its adjacent steel bars of slab, were compared, as depicted in
Figure 19 and
Figure 20.
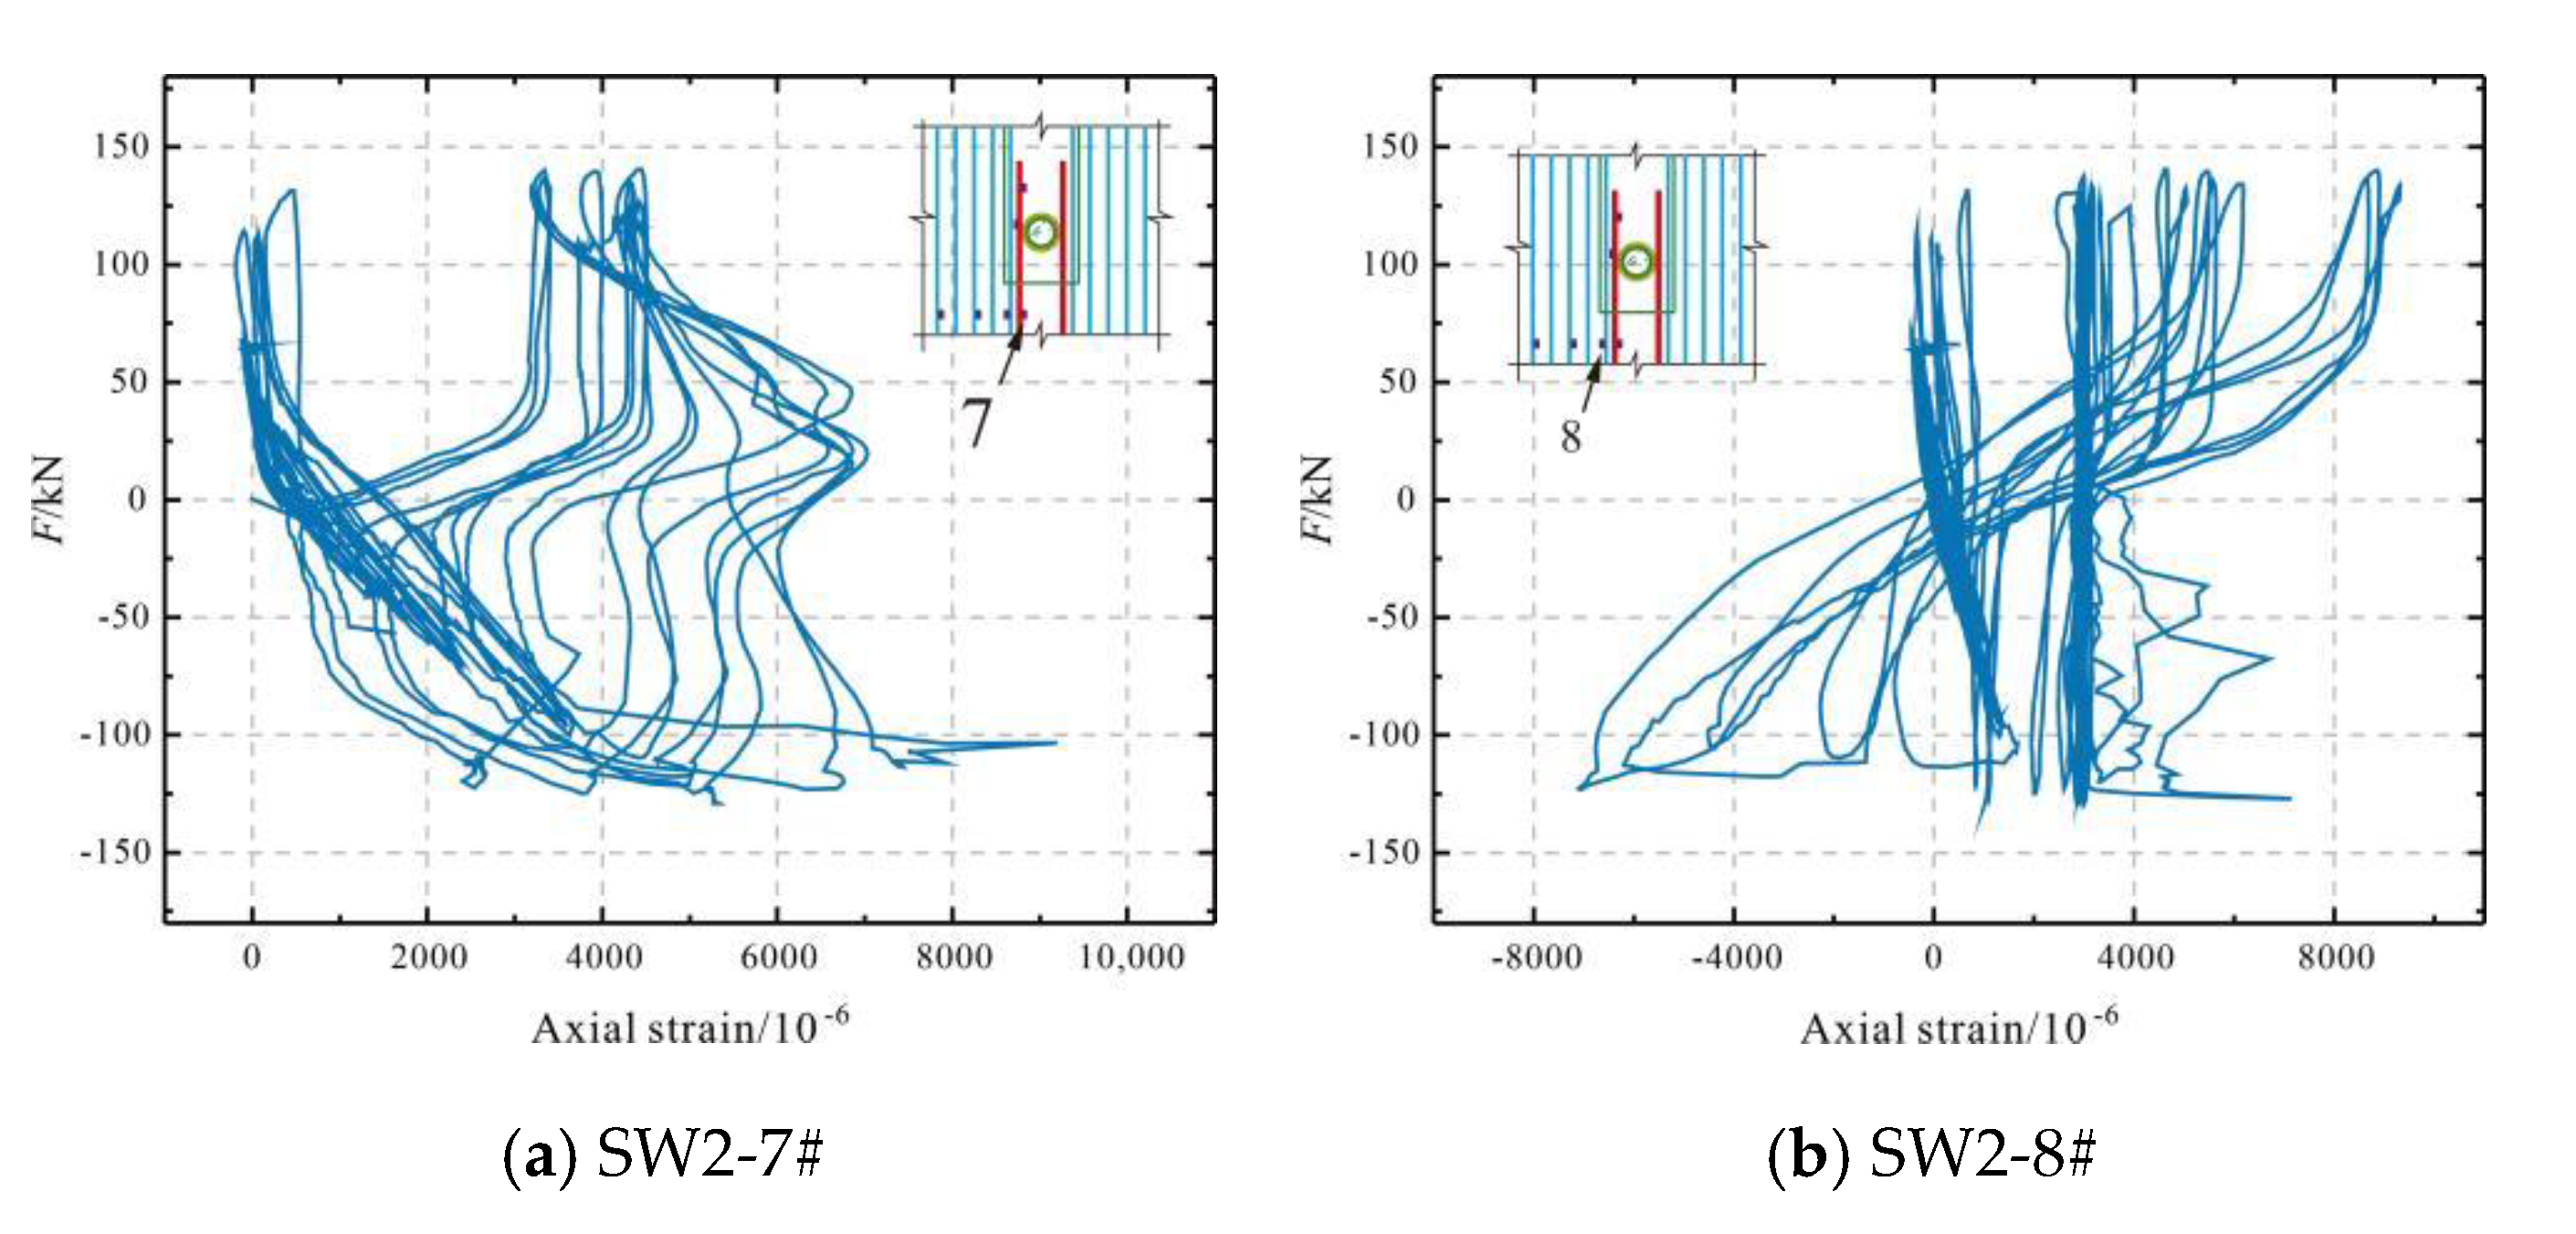
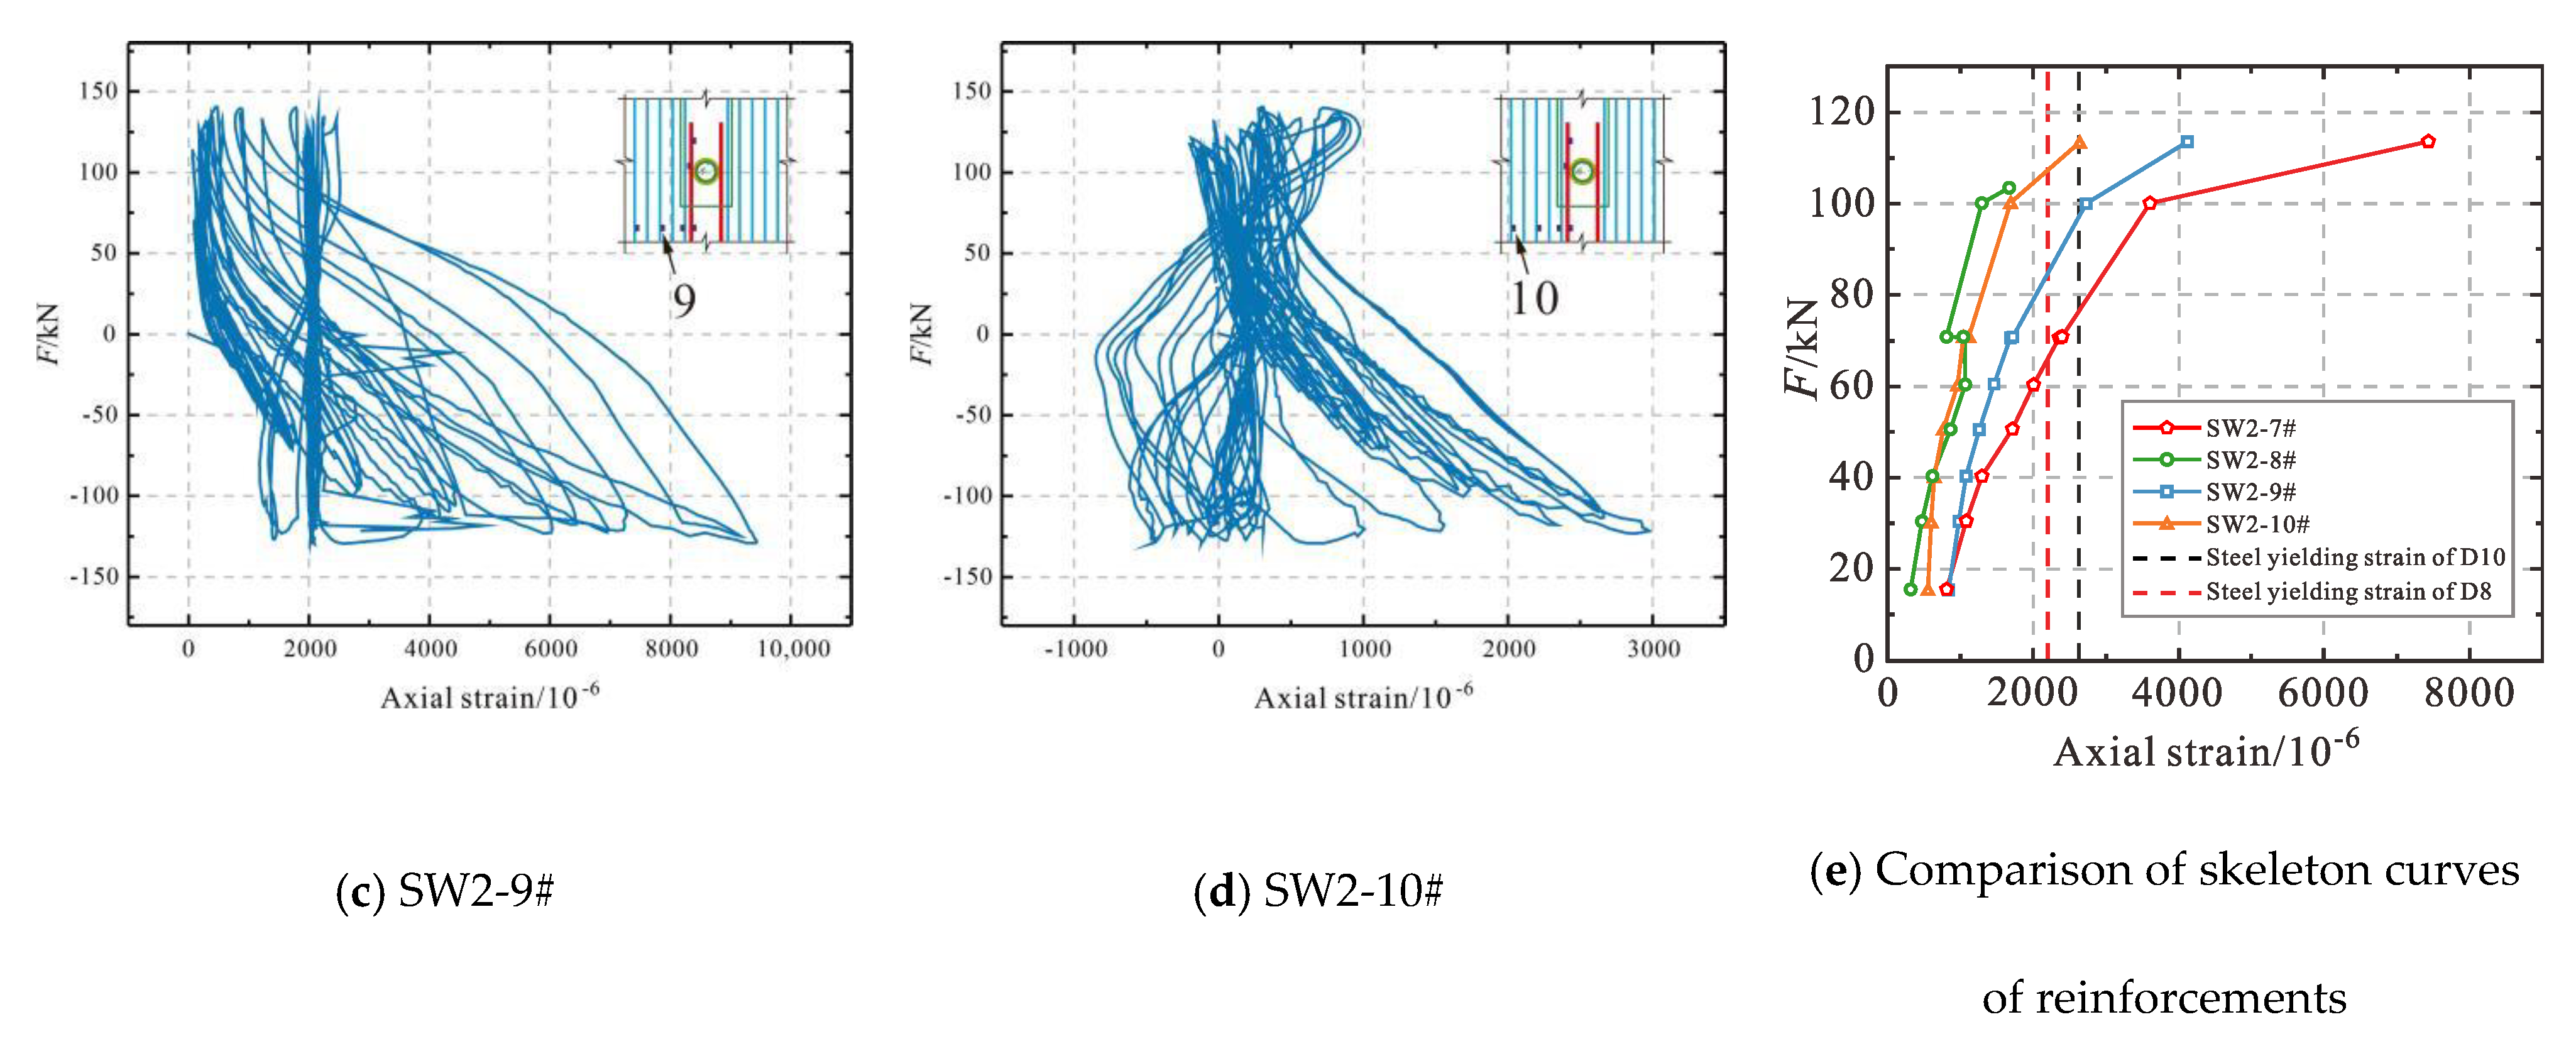
As shown in
Figure 19e, for the specimen SW2, the strain growth of the slab DA steel bar SW2-7# was ahead of the adjacent slab steel bars (8#, 9#, 10#). The DA steel bar reached the negative yield before the load of 104.45kN, explaining that the tensile force of each DA steel bar (D = 10 mm, A = 78.5 mm
2) was greater than 1.5 floor steel bars (D = 8 mm, A = 50.3 mm
2). This shows that the two steel bars of the DA detailing can meet the design intention of bearing capacity of three slab steel bars.
Figure 20 indicates that, in contrast to specimen SW2, the strain of the steel bar in specimen TW2 remained relatively stable during the entire loading process. This is due to the fact that specimen TW2 had a larger support range at the base of the floor, resulting in better support and smoother operation during the loading process. When specimen TW2 reached a positive yield load of 133.18kN, the strain growth of the DA steel bars (11#, 14#) was similar to that of the adjacent floor steel bar (12#, 15#). Based on this observation, we can infer that the tensile force of each DA steel bar was approximately equivalent to that of 1.5 slab steel bars. This finding also supports the design intent of the DA detailing. The above results indicated that the slab DA steel bar can have similar working performance as the adjacent floor steel bar.
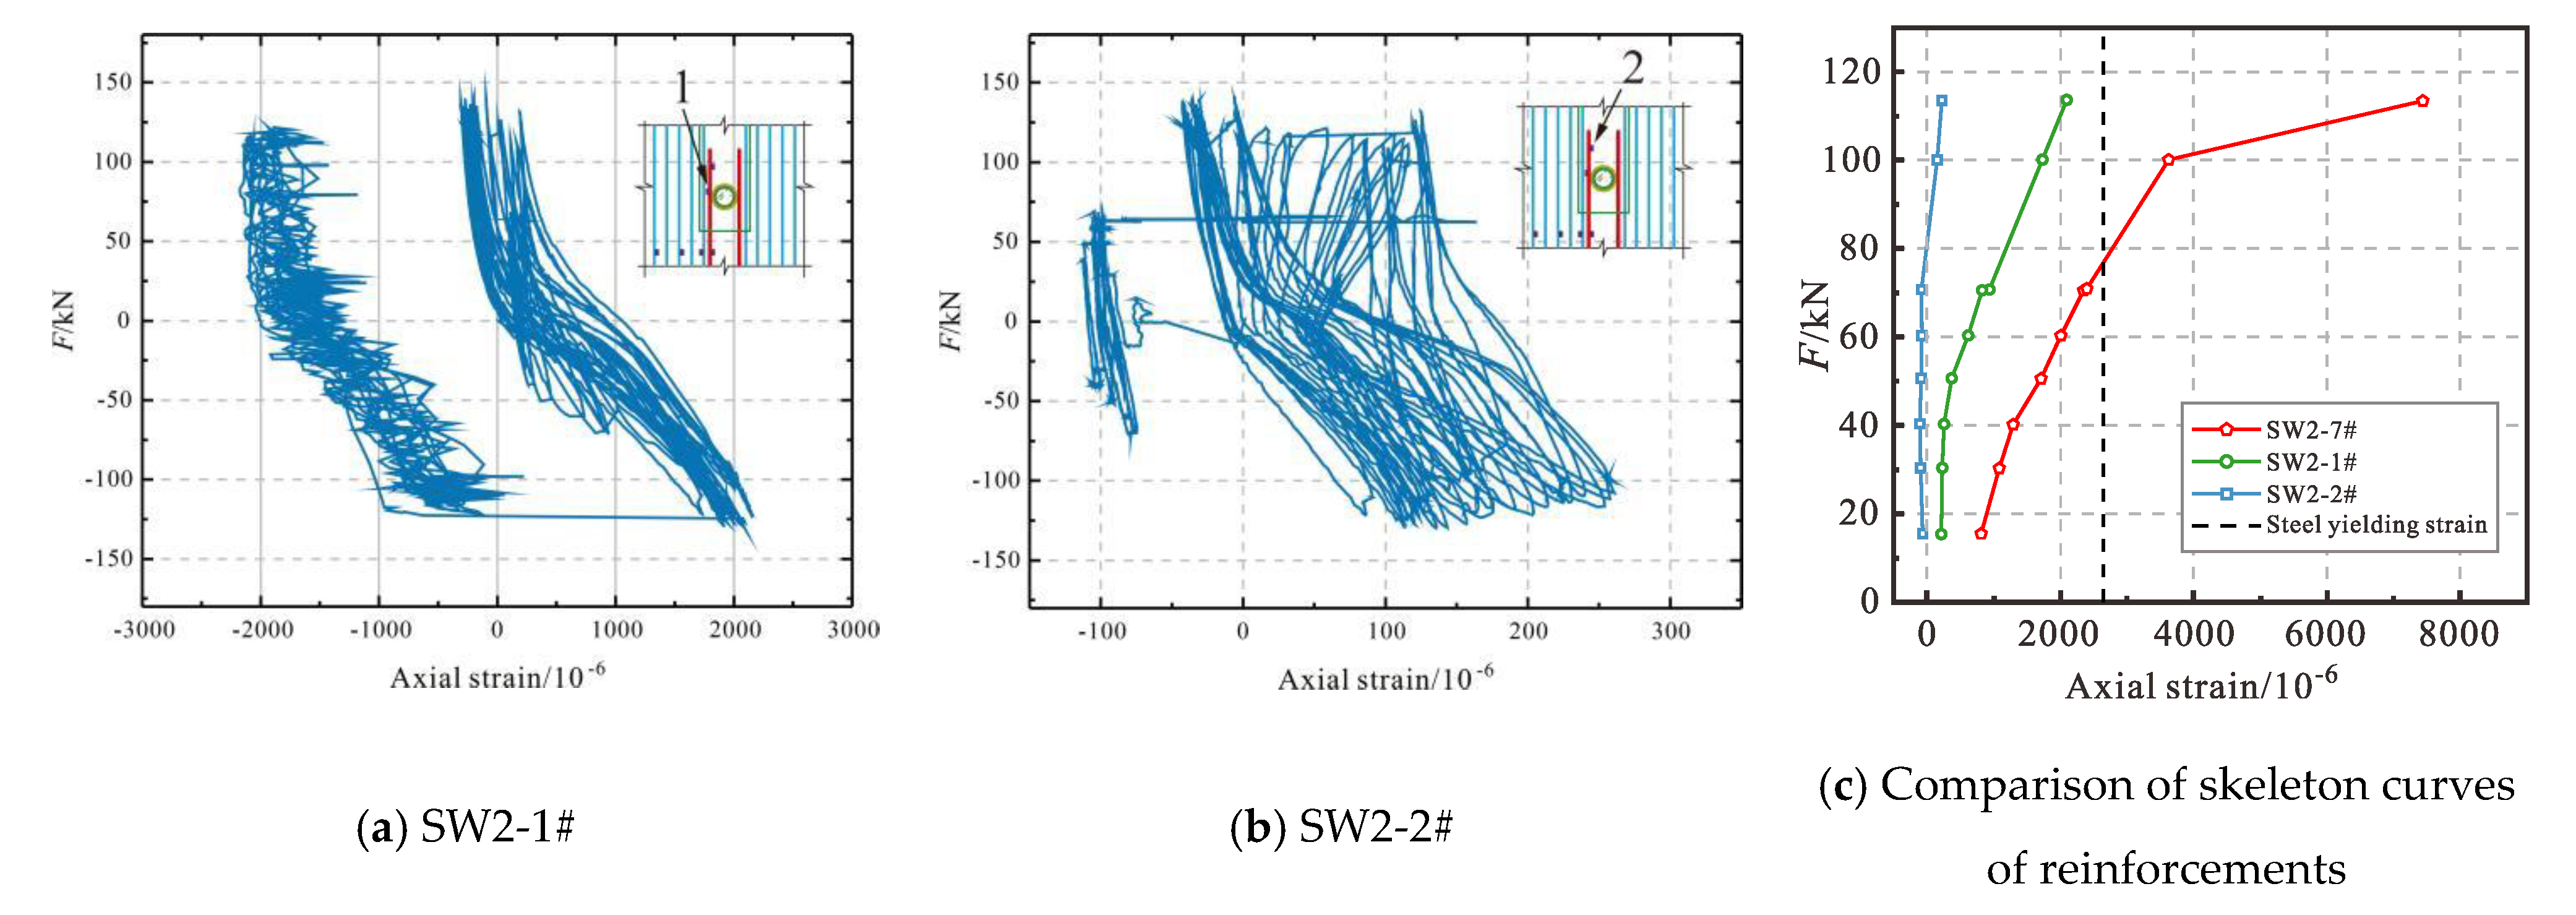
Figure 21 presents the strain analysis of the DA steel bar of specimen SW2. Due to the similarity of the strain changes between test pieces TW2 and SW2, the latter is used as an example for analysis.
The strain gauge distribution revealed that SW2-7# was not anchored to the shear wall, and the anchoring length of SW2-1# was 150 mm, whereas that of SW2-2# was 250 mm. Strain analysis of the DA steel bar in
Figure 21 demonstrated that the steel bar’s strain decreased with the increase in anchoring length. This indicates that the tensile force of the DA reinforcement can be effectively transmitted to the shear wall.
In general, the stress of the reinforcement increased steadily with the strain throughout the loading process, without a sudden drop in strain. The reinforcing steel of each anchorage detailing, AR and DA, near the floor surface grew faster than the one further away. The slab steel bar could reach the yield strength before the failure of the specimen, which provided sufficient lateral stiffness for the specimen.


