Abstract
This study investigated the flexural behavior of prefabricated RC bridge decks with different joint materials, normal strength concrete or UHPC (normal strength concrete for RC deck, while UHPC means ultra-high performance concrete). A total of three specimens were tested and subjected to four-point bending loads. The load–deflection curve, strain curve, load–crack width curve, and failure mode were analyzed. Numerical models with cohesive models were built and verified with test results to explore the force-transferring mechanism. The results show that UHPC effectively improved the crack strength, flexural strength, and failure mode. Compared with the joint with normal-strength concrete, the crack strength and flexural strength increased by 66.7% and 6%, respectively. The failure mode of the specimen with UHPC as joint material changed from a concentrated cracking failure of the joint to a multi-crack development failure. The behavior of the specimen with UHPC as joint material was similar to the monolithically cast specimen. In addition, the application of the current design method was evaluated and compared with test results.
1. Introduction
The steel–concrete composite girder bridge takes full advantage of steel and concrete. Under the background of bridge industrialization, steel–concrete composite girder bridges have broad application prospects in small and medium-span spans [1]. However, the problem of low crack resistance of precast bridge deck joints has always been a key problem of durability [2]. Once the joints crack, harmful gases and corrosive rainwater will penetrate into the concrete through cracks, accelerating the corrosion of steel bars, which will lead to the cracking of the concrete protective layer and pose a threat to safety and durability. The main reason for the damage to a structure is the discontinuity of the interface between joint concrete and precast bridge deck. UHPC (ultra-high performance concrete) has ultra-high mechanical properties and durability, which can improve the durability of the bridge deck and reduce life cycle cost [3,4,5]. Its interface bonding strength is high, which can effectively ensure interface bonding strength and impermeability [6,7]. Due to the addition of steel fiber, UHPC can also have good crack control ability, which can effectively overcome the problem of easy cracking at joints pouring with traditional concrete materials [8,9].
Many researchers have carried out relevant research on the joint problem of precast bridge decks. It was found that the interface bonding strength between UHPC wet joint and the ordinary concrete was high [10]. UHPC can greatly improve the strength, crack resistance, fatigue performance, and impermeability of joints, and increase the integrity of the bridge deck [11]. Therefore, UHPC has been applied in the steel–concrete composite girder bridge, as shown in Figure 1. In addition, the influence of interface form on bonding performance is studied, and the interface shear prediction formula was proposed [12,13]. Graybeal studied the form of UHPC joints, in which the reinforcement extends from the precast bridge deck to the joint. The test shows that the use of UHPC joints can improve structural performance and waterproofing of bridge decks [14,15]. Furthermore, Deng et al. [16] studied the lap form of longitudinal reinforcement on a multi-beam bridge deck with a UHPC joint. It is found that UHPC wet joint can effectively improve the flexural performance of the bridge deck. However, how to reduce large joint width was still an unsolved problem, which would make the pouring workload tedious. To address this gap in knowledge, Zhang et al. [17] carried out the bending test to study the bending resistance of UHPC joints by using UHPC as a joint filler. The specimen of UHPC-U-shaped bar joints (joint width 300 mm) and the specimen of RC-U-shaped bar joints (joint width 600 mm) were designed and manufactured for bending tests. The results show that the joint interface was the weak part, but UHPC can greatly improve crack resistance. The flexural capacity and bending stiffness of the specimens were basically the same. Therefore, UHPC can be applied to reduce the joint width. To make more effective use of UHPC, the design concept of a functional gradient structure was introduced, which has upper-layer NC and lower-layer UHPC. Wang et al. [18] carried out a bending test of UHPC functionally graded wet joint plates. The results show that UHPC can enhance the bonding performance of the interface, and significantly improve the cracking load. With the increase in flexural toughness ratio (UHPC/NC), the bearing and deformation properties of precast slabs gradually increase. In addition, how to maintain good bonding performance in joints was a difficult problem. Chen et al. [19] proposed an epoxy resin treatment method, which used a high-pressure water gun to chisel aggregate in a joint interface instead of difficult artificial chiseling. It was found that the treatment method of using a high-pressure water gun to chisel fine aggregate was the best. In addition, studies were conducted on structural health monitoring of bridges. Cao et al. [20] carried out experimental and theoretical investigations on an RC frame retrofitted with a novel external sub-structure, forming a self-centering precast bolt-connected steel-plate reinforced concrete buckling-restrained brace frame (SC-PBSPC BRBF). Sinsamutpadung and Sasaki [21] performed a visual inspection of the crack condition of existing bridges and built an FE model to evaluate the state of the bridge. Philip et al. [22] studied structural health monitoring (SHM) techniques, which improved the evaluation of structural safety and serviceability. Erdogmus et al. [23] developed nondestructive testing (NDT) approach for the early detection of various flaws (corrosion, delamination, and concrete cracking) in RC bridge decks.
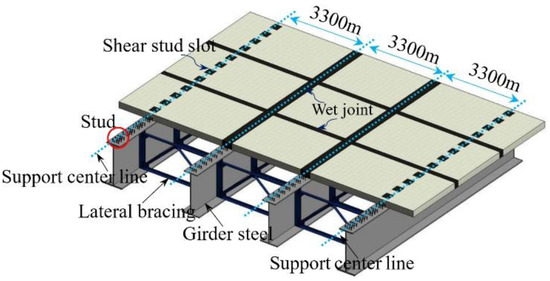
Figure 1.
Prototype steel–UHPC composite girder (unit: mm).
At present, the research mainly focuses on the influence of UHPC materials on the mechanical properties of wet joints. The research on the bending mechanism of precast bridge decks with different joint materials was not deep enough. The lack of calculation method in cracking moment affects the popularization and application of precast bridge deck. Therefore, it is proposed to carry out the bending test and establish a numerical simulation method that can accurately reflect stress deformation law and structural failure characteristics. After verification by bending test, the bending mechanism is discussed, and the calculation formulas of cracking bending moment and bending bearing capacity are put forward, which can provide references for the engineering application of a precast bridge deck.
2. Experimental Program
2.1. Test Specimens
The prototype structural layout was shown in Figure 1. The spacing of the supporting girder was 3300 mm. These girders were laterally braced. The precast bridge deck was placed at two adjacent girders, and connected by wet joint and studs on the top flange of the girder [24]. Three specimens were designed based on this prototype bridge as tabulated in Table 1. As shown in Figure 2, the width and length of the specimen were 600 mm and 3600 mm, with an effective length of 3300 mm, simulating a deck strip between the mid-span of two adjacent two decks. The specimen height was 240 mm. Two specimens, namely J-C and J-U, were designed with wet joints in the center, and reinforcing bars were connected as ring ribs (Figure 2a). The difference between J-C and J-U was the joint material, J-C filled with C50 concrete and J-U filled with UHPC. Specimen Z-C was designed for comparison. This specimen was monolithically cast with reinforcement details shown in Figure 2b. The interface of the tested slabs before pouring the UHPC is shown in Figure 2c. The joint material is divided into C50 joint material and UHPC joint material. The deck was cast with C50 concrete for all the specimens.

Table 1.
Specimen details.
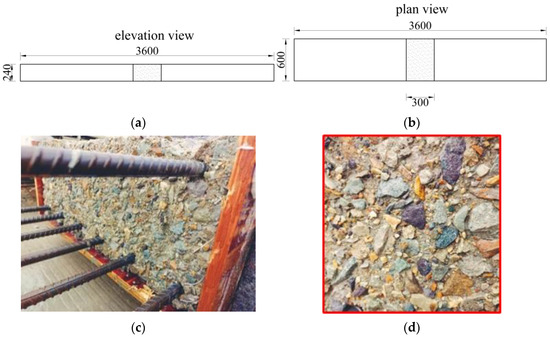
Figure 2.
Specimen structure diagram (unit: mm). (a) Elevation view. (b) Plan view. (c) The surface of the concrete. (d) The surface of the concrete.
The surface of the concrete was roughened by brushing the retarder on the formwork before casting and scouring it using a high-pressure water gun after cement hardening. C50 concrete or UHPC was then poured into the joint to improve the joint integrity.
2.2. Materials
The UHPC mix (weight ratio) is listed in Table 2. CX-8 polycarboxylic acid superplasticizer, with a water reduction rate of more than 25%, was used to improve the workability of UHPC. Specimens J-U were cast with steel fibers with a volumetric ratio of 2.5%. Specimen J-C was cast without any steel fibers for comparison. The steel fibers used in the mix were straight plain fibers with a diameter, length, and tensile strength of 0.2 mm, 13 mm, and 2500 MPa, respectively. The C50 mix (weight ratio) is listed in Table 3. The test results of material properties with 150 mm cubes are shown in Table 4.
Table 2.
Joint pouring mix ratio.
Table 3.
Precast bridge deck mix ratio.
Table 4.
Concrete properties.
HPB400 reinforcement with a nominal yield strength of 400 MPa and diameter of 12 mm was utilized for the transverse reinforcement. HRB400 reinforcement with a nominal yield strength of 400 MPa and diameter of 12 mm was utilized for the longitudinal reinforcement. The steel material samples are tested according to the specification requirements. The yield and ultimate tensile strength of the HPB400 reinforcement were 427 MPa and 603 MPa, respectively. The yield and ultimate tensile strength of the HRB400 reinforcement were 444 MPa and 626 MPa, respectively. The reinforcement ratio used was 0.84%. The transverse and longitudinal spacing of steel bars was 100 mm. In addition, the elastic modulus was 200.0 GPa, as summarized in Table 5.
Table 5.
Steel properties.
2.3. Test Setup, Instrumentation, and Loading Protocol
A four-point loading setup was adopted to obtain the flexural strength of the specimens. As shown in Figure 3, the length of two shear spans and the pour moment region was all 1100 mm. The size of the support plates was 900 mm long and 900 mm wide. The load was applied with a 500 kN-capacity hydraulic jack, and transferred from the distribution beam to the specimen. The beam was simply supported with one pinned support and another roller support. The out-of-plane effect and torsion effect were not considered in this paper because the slab was simply supported and subjected to concentrical loads. However, in certain circumstances, the out-of-plane effect and torsion effect could be prominent [25]. The same supports were used to transfer the load between the distribution beam and the specimen to ensure the consistency of the load transfer and the stress direction of the slab.
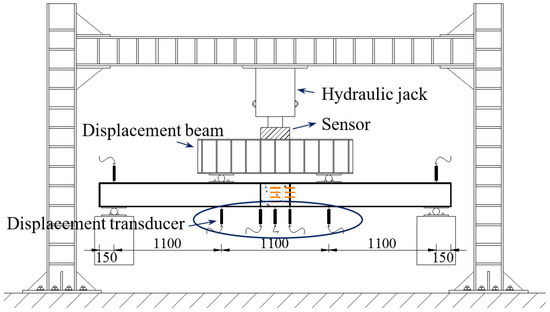
Figure 3.
Test setup (unit: mm).
The loading process was divided into two stages, the pre-loading stage and the formal loading stage. In the pre-loading stage, the load was slowly applied to 40% of the estimated cracking load to eliminate the gap between the specimen and the loading device. The function of the data acquisition system was also checked in the pre-loading stage. The formal loading was force controlled with a step of 5 kN before the crack width reached 0.05 mm and a step of 10 kN afterward. The load was held for 5 min for each stage to collect data, and observe and record the crack development and deformation of the specimen.
Seven displacement transducers were installed to measure displacements at different locations, two at the loading points beneath the distribution beam, one at the mid-span, two at the deck–joint interface, and two at the supports to monitor support settlement. The layouts of the strain gauges are shown in Figure 4. The anchorage length was 270 mm as shown in Figure 4e. Four concrete strain gauges were glued on the top and bottom of the specimen, and eight concrete strain gauges were glued on its side. Four to six strain gauges were glued to the top and bottom reinforcing bars at the mid-span, joint, and loading point.
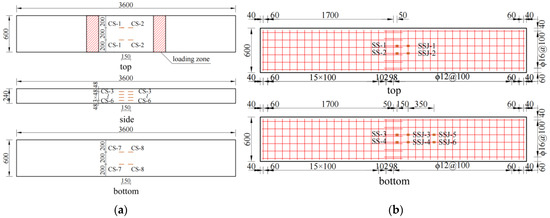
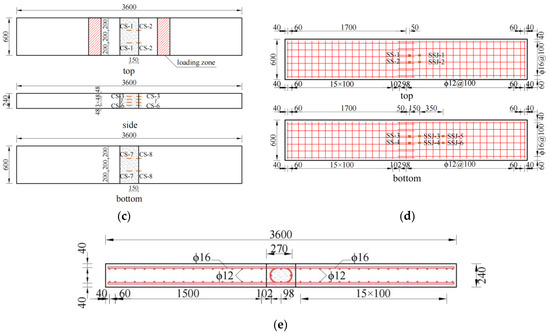
Figure 4.
Instrumentations (unit: mm). (a) Concrete strain gauges (Z-C). (b) Steel strain gauges (Z-C). (c) Concrete strain gauges (J-C, J-U). (d) Steel strain gauges (J-C, J-U). (e) Side elevation (J-C, J-U).
3. Test Results
3.1. Failure Modes
General observations of J-C during the loading process were the following. In the initial loading stage up to 0.12Pu (where Pu is the peak strength), no notable deformation was formed. When the applied load reached 0.12Pu (30 kN), the initial crack was generated at the joint interface and the maximum crack width was 0.15 mm. The deflected shape and initial crack of the structure at this stage are shown in Figure 5a–c. When loading to 0.20Pu (50 kN), the initial crack extended to the top flange, and the initial crack width increased to 0.20 mm as shown in Figure 5d. When the load reached 0.3Pu (74 kN), two cracks were generated at the bottom of the specimen at the loading point and extended to the top. The initial crack width increased with increasing load. Cracks continued to generate at the bottom between the loading point and the support. When the load reached 0.73Pu (180 kN), it was observed that the deflection of the girder was considerable, while microcracks appeared at the bottom at mid-span, as shown in Figure 5e. When the lead reached 0.90Pu (220 kN), a notable vertical deflection was developed, and the mid-span crack extended through the bottom to the middle of the specimen, as shown in Figure 5f. When the load reached Pu (245 kN), the crack at the bottom at the mid-span extended through the bottom and develops into the main crack. The concrete at the connection was crushed as shown in Figure 5g,h.
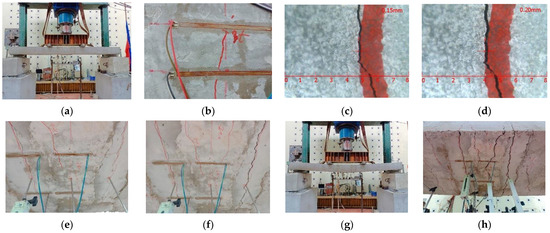
Figure 5.
Loading progress of J-C. (a) Deformed shape (0.12Pu). (b) Initial crack (0.12Pu). (c) Width of initial crack (0.12Pu). (d) Width of cracks (0.20Pu). (e) Deformed shape (0.73Pu). (f) Main crack (0.90Pu). (g) Deflection shape (Pu). (h) Main crack (Pu).
General observations of J-U during the loading process were the following. In the initial loading stage up to 0.12Pu (where Pu is the peak strength), no notable deformation was formed. The deflected shape of the structure at this stage is shown in Figure 6a. When loading to 0.19Pu (50 kN), the initial crack was generated at the joint interface and the maximum crack width was 0.09 mm as shown in Figure 6b,c. When the load reached 0.28Pu (74 kN), the initial crack width develops rapidly. Multiple cracks continued to generate at the bottom of the loading point. In addition, there is a tendency to penetrate the bottom of the plate. When loading to 0.31Pu (80 kN), the initial crack width exceeded 0.20 mm as shown in Figure 6d. When the load reached 0.88Pu (230 kN), the experimental phenomenon of specimen J-U is similar to that of specimen J-C, as shown in Figure 6e,f. When the load reached Pu (260 kN), several main cracks are formed at the bottom and the joint interface. Until the concrete at the connection was crushed, the joint area had not been cracked, as shown in Figure 6g,h. General observations of Z-C during the loading process were the following. In the initial loading stage up to 0.17Pu (where Pu is the peak strength), no notable deformation was formed. The initial crack was generated at the joint interface and the maximum crack width was 0.08 mm. When loading to 0.19Pu (50 kN), the maximum crack width was 0.09 mm. When the load reached 0.52Pu (140 kN), the initial crack width develops rapidly. When loading to 0.78Pu (210 kN), a notable vertical deflection was developed, and several main cracks were formed at the bottom. The structure approaches the failure state. When the load reached Pu (270 kN), several main cracks are formed at the bottom. The concrete at the connection was crushed.
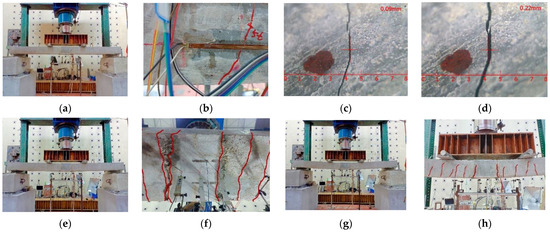
Figure 6.
Loading progress of J-U. (a) Structural deflection shape (0.12Pu). (b) Initial cracks (0.19Pu). (c) Width of initial cracks (0.19Pu). (d) Width of cracks (0.31Pu). (e) Structural deflection shape (0.88Pu). (f) Main fracture (0.88Pu). (g) Structural deflection shape (Pu). (h) Main fracture (Pu).
3.2. Discussions on the Test Results
3.2.1. Load–Deflection Curves
The measured load–deflection curve of each specimen is shown in Figure 7. The flexural behavior of the slab could be divided into three stages. (i) Elastic stage, the deflection change linearly with the load, while the magnitude of the deformation degree is small. This stage is terminated when the crack load is reached. (ii) Crack development stage, cracks continue to generate while the stiffness is notably reduced compared with the first stage. Deflection is relatively small at this stage. (iii) Strengthening stage, the tensile reinforcing bars begin to yield and the slope of the load–deflection curve reduced greatly. At this stage, cracks propagate and widen quickly while the stiffness of the slab is greatly reduced. The slab can still sustain the load and show good ductility.
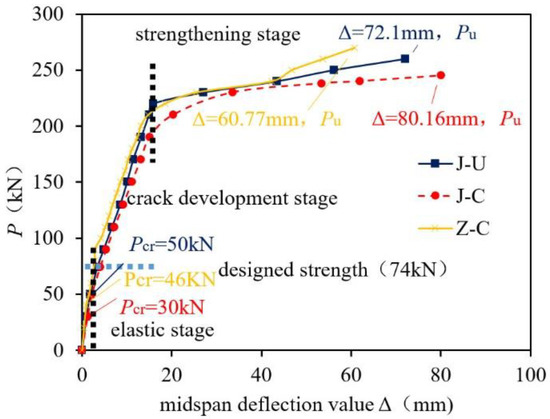
Figure 7.
The mid-span load–deflection curve.
In the elastic stage, the curves of different specimens were basically the same, as summarized in Table 6. The inflection point of J-U was formed later than J-C. The crack loads of these two specimens are 50 kN and 30 kN, respectively. The crack load of J-U is 66.7% higher than J-C. The inflection point of J-U was formed close to Z-C. The crack loads of these two specimens are 50 kN and 46 kN, respectively. The crack load of J-U is 8.7% higher than Z-C. UHPC can effectively improve the crack load. In the crack development stage, the deflection of J-U is higher than J-C with the same load, while lower than Z-C. The performance of these specimens was similar. At this stage, the slope of the curve of J-C decreased faster than J-U, indicating that J-U had higher post-crack flexural stiffness. In the strengthening stage, the strength Pu of J-U reached 92.5% of Z-C. The strength Pu of J-U is 6% higher than J-C. Therefore, UHPC effectively improves the crack load, post-cracking flexural stiffness, and ultimate strength of the slab.
Table 6.
Load–deflection part numerical summary.
3.2.2. Strain Distributions
The strain distribution at the joint interface along the height of the slab is shown in Figure 8. At early loading before cracking, the strain varied linearly with the load, which satisfied the plane section assumption. With the progress of loading, the joint interface cracked first and the strain gauges began to fail at the bottom of the slab. With the development of cracks, the tensile and compressive strains continued to grow. When the crack extended to the top of the slab, the strain gauges along the height of the slab gradually failed and the neutral axis of the section moved up slowly. The concrete in the tension zone gradually quit working. At a load of 230 kN, an effective compressive zone was formed for J-U based on the strain distribution as shown in Figure 8b. The concrete strain development of J-U was slower compared with J-C under the same load condition. UHPC effectively enhanced the structural performance of the connection at the wet joint interface, dispersed the stress in concrete, and delayed the strain development at the interface.
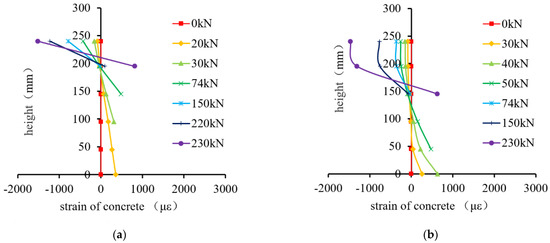
Figure 8.
Concrete strain distribution at the joint interface. (a) J-C. (b) J-U.
The strain development of the mid-span section and the joint connection section are plotted in Figure 9. The strain changed slowly in the initial loading stage and increased linearly with increasing load. The strain at the bottom and top of the slab at the joint interface grew more rapidly than the mid-span section. It was because the joint cracked first and the tensile strain gauge at the bottom of the plate failed when the load was low. As the load continued to increase, the strain continued to grow. The inflection point of the tensile strain curve at the bottom of the mid-span section formed first, the slope of the curve decreased, and the strain development began to accelerate. When the load continued to grow, the compressive strain curve began to grow, the slope of the curve decreased, and the development of compressive strain began to accelerate. This observation indicates that large cracks were developed, the concrete in the tension zone quit working, and the structural deformation increased. The strain development rate of J-C was faster than J-U, indicating that the UHPC in a joint can significantly improve stiffness and slow down strain development.
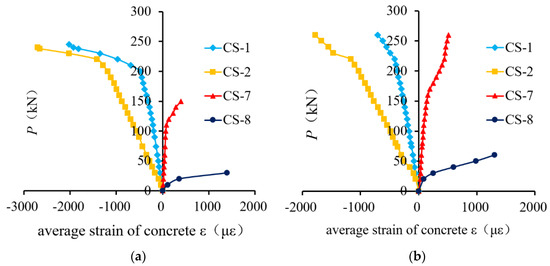
Figure 9.
Concrete strain curves. (a) J-C. (b) J-U.
The strain development of the mid-span section and the joint connection section are plotted in Figure 10. The strains were measured on the reinforcements and the measuring points were shown in Figure 4b,d. It can be seen from Figure 10 that for the bottom steel, the strain changed slowly in the initial loading stage and increased linearly with increasing load. When the structure cracked, the inflection point of the tensile strain curve formed, the slope of the curve decreased, and the strain development began to accelerate. As the load continued to increase, the steel bar gradually enters the yield state, and the curve begins to flatten. It can be seen from Figure 10 that for the top steel, until the middle loading stage, the strain changed slowly and increased linearly with increasing load. As the load continued to increase, the inflection point of the compressive strain curve formed, which is in the middle of the top and the joint. The compressive strain development began to decrease gradually. When the structure tends to the bearing capacity limit state, the stress state of the steel bar gradually changes from compression to tension, indicating that the neutral axis of the section is moving up along the height of the section.
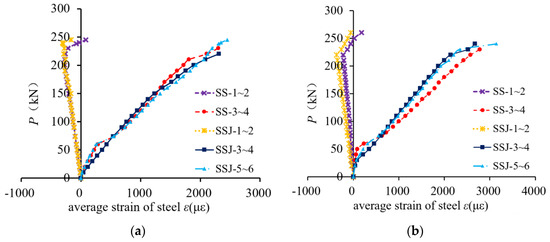
Figure 10.
Steel strain curves. (a) J-C. (b) J-U.
3.2.3. Analysis of Load–Crack Width Curve
The maximum crack width was plotted against the applied load as shown in Figure 11. The crack development was divided into three stages: (i) Micro-crack initiation stage, the initial crack first appeared at the joint interface with a low applied load. (ii) Crack propagation stage, the initial cracks continued to extend and expand, and new cracks continued to grow along the cross direction of the plate with increasing load. In this process, the crack was evenly developed and there was no obvious main crack. (iii) Main crack propagation stage, when the crack width exceeded a certain limit value, the crack was no longer uniformly developed. At this stage, the load increased slowly, while the crack width develops rapidly, especially the main crack.
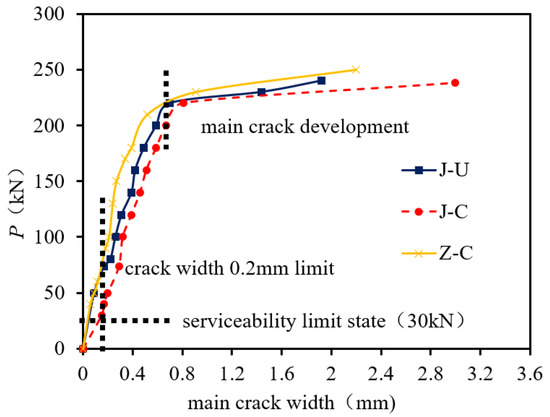
Figure 11.
Load–crack width curve.
Comparing the load–crack width curves of J-C and J-U, better initial crack performance and crack control ability were observed for J-U. Under the same load level, the crack width of J-U was smaller than J-C. When the load reached the serviceability limit state (30 kN), the initial crack appeared in J-C with a width of 0.15 mm, while J-U did not crack. When the crack width reached 0.2 mm, the load of J-C and J-U were 50 kN and 80 kN, respectively. Compared with J-C, the load of J-U increased by 60%. In the stage of main crack development, the two curves exhibited a similar pattern. However, when the specimen failed, damage to J-C was concentrated in the joint area, while damage to J-U was multiple main cracks with similar widths at the joint interface and the rest of the specimen. UHPC effectively improved the crack resistance, controlled crack development, and improved the failure mode of the specimen.
Comparing the load–crack width curves of Z-C and J-U, better initial crack performance and crack control ability were observed for J-U, as summarized in Table 7. Under the same load level, the crack width of J-U was smaller than Z-C. When the load reached the serviceability limit state (30 kN), the initial crack appeared in Z-C with a width of 0.12 mm, while J-U did not crack. When the crack width reached 0.2 mm, the load of J-C and J-U were 96.7 kN and 80 kN, respectively. Compared with Z-C, the load of J-U reaches 82.7% of it. In the stage of main crack development, the two curves exhibited a similar pattern. However, when the specimen failed, the damage to J-C was multiple secondary cracks and the main crack width changes abruptly, while the damage to J-U was multiple main cracks with similar widths at the joint interface and the rest of the specimen. UHPC effectively improved the crack resistance, controlled crack development, and improved the failure mode of the specimen.
Table 7.
Load–joint crack width summary.
4. Finite Element Analysis
4.1. Model Setup
Numerical simulations were performed using Abaqus. The steel bar was modeled with T3D2 elements and the concrete was modeled with C3D8R elements. The C3D8R element was suitable for nonlinear simulations with large displacement and large strain, while this element was not prone to shear self-locking in flexural analysis. The interfacial debonding behavior at the interface was simulated using the cohesive model. Compared with the tie method that defined normal and tangential behavior, the cohesive model could simplify the modeling process and accurately simulate the debonding force at the interface between the joint and the prefabricated slab [26,27,28]. The steel bar was modeled as truss elements with a number of 2605. The concrete was modeled as hexahedron elements with a number of 34,200. The standard method of numerical convergence was applied. The cohesive model was defined with the following three steps, (i) define cohesion parameters such as viscous behavior and damage criterion, (ii) select contact pair, and define the corresponding master and slave contact surfaces, (iii) select the discrete method as ‘Node to surface’ and select the defined bonding properties to complete the interface definition. The contact surface was set to finite sliding, and the degree of smoothing for the master surface was 0.2. The values of ‘Enn, Ess, Ett’ were defined as ‘69’ when considering the properties assumed at the interface. In addition, an ‘embedded region’ was assumed between the rebars and the surrounding concrete.
The boundary conditions were shown in Figure 12. Loading pads and support pads were modeled. The reference point was set on the outer surface of each pad and was coupled with the pad surface. In the global coordinate system, the simply supported boundary conditions were set for the analysis model. To improve computational efficiency and improve the convergence of calculation, the displacement-controlled loading was adopted by applying displacement on the coupling point of the loading plate to simulate the flexural response process of the specimen.
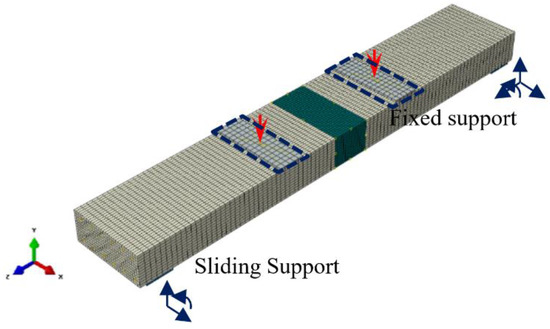
Figure 12.
Boundary constraints.
Bilinear stress–strain relationships were adopted as the constitutive model for the steel bars. Compared with ordinary concrete, the tensile and compressive properties of UHPC were greatly improved, and the applicable constitutive model should be selected according to the difference in concrete types [29,30] as shown in Figure 13. The damage plasticity model (CDP) was used to define the constitutive properties of concrete in the finite element (FE) simulation. This model was a continuum, plasticity-based, damage model for concrete, which assumed that the main two failure mechanisms are tensile cracking and compressive crushing of the concrete material. This model was suitable for different load analyses of concrete structures. Paramters of this model used in the simulation were listed in Table 8.
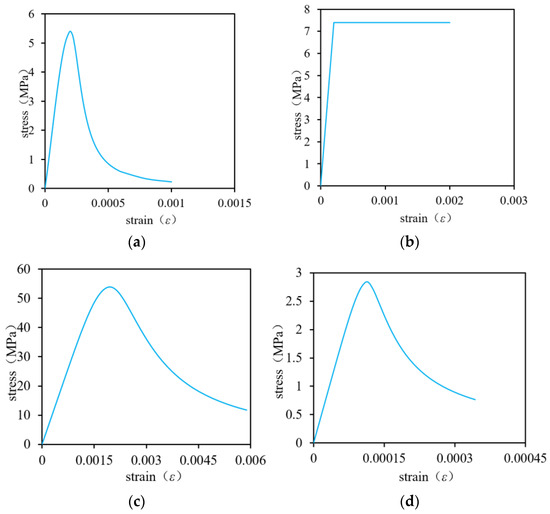
Figure 13.
Stress–strain curves. (a) Compression curve of UHPC. (b) Tensile curve of UHPC. (c) Compression curve of C50. (d) Tensile curve of C50.
Table 8.
Parameters in CDP model.
4.2. Model Verification
In order to verify the accuracy of the numerical model, results from the FE analysis were compared with the test results, including yield strength and ultimate strength. Results were tabulated in Table 9 and Table 10. The strength of the FE analysis was in good agreement with the measured results. The maximum error between the simulated load value and the measured value is only 2.8%.
Table 9.
Comparison of yield strength.
Table 10.
Comparison of ultimate strength.
It can be seen that the load value corresponding to the yield state in the bottom steel bar of specimen J-U is higher than that of specimen J-C, which is consistent with the test results. When the structure reaches the ultimate load, the structural load in the later stage of loading is mainly borne by the steel bars in the plate, so the ultimate load of the joint plate does not show much deviation. The simulated value of the ultimate load of each specimen is also in good agreement with the measured value, and the maximum error is 4.4%. It shows that the finite element model established in this paper can accurately simulate the bearing capacity of the specimen with a joint.
The load–deflection curves of each specimen obtained from tests were compared with FE results as shown in Figure 14. The curve from FE analysis was consistent with the curved from rest results, which conformed to the three-stage development, elastic stage, crack development stage, and strengthening stage. The reduction in the slope of the FE simulation matched the measured curve in the crack development stage indicating that the FE analysis simulated well the structural stiffness degradation caused by concrete cracking. The steel constitutive model considered the strengthening characteristics of the material. Therefore, in the strengthening stage, the development trend of the finite element simulation curve was still in good agreement with the measured curve.
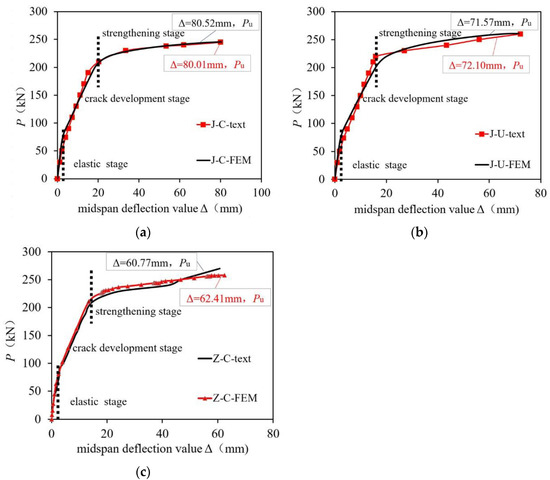
Figure 14.
Comparison of load–deflection curves. (a) J-C. (b) J-U. (c) Z-C.
4.3. Force-Transferring Mechanism
The failure modes of each specimen were slightly different because of the different materials in the joint. In this section, the failure modes and stress development of the FE analysis model were compared with the test results to further reveal the force-transferring mechanism. When the specimen was loaded, the tensile stress was concentrated at the joint interface as shown in Figure 15a, while cracks were initiated at the same location. The crack width developed rapidly with increasing load. As the cracks in the joint interface propagated toward the slab top, the concrete at the joint interface gradually separated from the prefabricated slab, and the concrete in the tension zone gradually quit working. When the structure reached the limit state as shown in Figure 15, the distribution of major cracks from the FE was similar to the test results. The neutral axis of the section moved up along the height of the section and the height of the concrete compression zone was reduced to the minimum. The loading area at the top of the slab was concentrated in compression as shown in Figure 16.
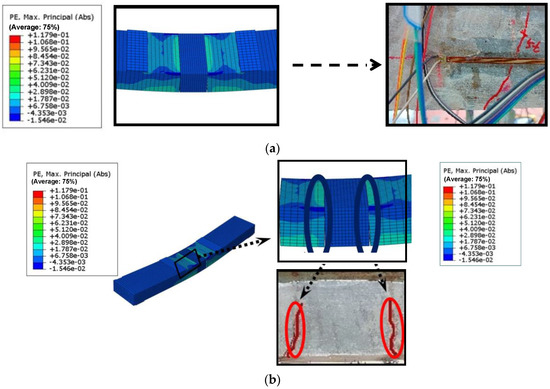
Figure 15.
Major crack development of J-U (MPa). (a) Micro-crack initiation stage. (b) Main crack propagation stage.
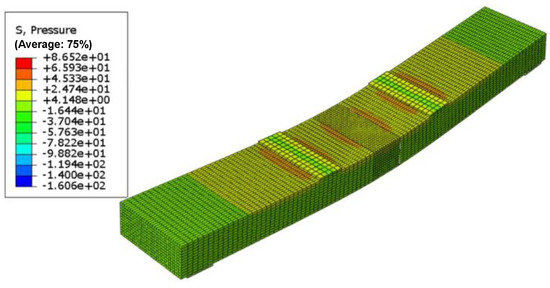
Figure 16.
Pressure stress diagram (MPa).
Before debonding and separating the joint from the precast slab, the tensile stress at the joint was mainly transferred by the mechanical force Fa by aggregate interlocking and the tensile force Fs of the steel bar. At the specimen preparing stage, the joint interface was brushed with a high-pressure water gun and filled with a retarder, to generate reliable mechanical force between the concrete interface, as shown in Figure 17.
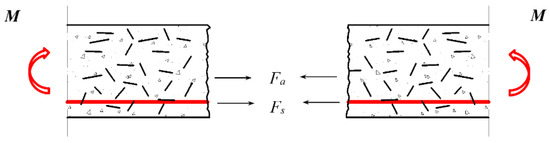
Figure 17.
Force diagram of joint interface.
Figure 18 shows the interface debonding process of J-U in the FE analysis. At the early loading stage, initial cracks developed, and slight damage was observed at the interface. The stress in the bottom reinforcement continued to increase with increasing loading, and the interface damage further developed. However, the damage development was relatively slow. When the reinforcing bar yielded, only the bottom part of the concrete area was seriously damaged. The cohesive force still existed at the interface as shown in Figure 18a. A large amount of coarse aggregate exposed at the interface with increasing loading increased the mechanical force and greatly improved the cracking strength of the joint. The coarse aggregate and UHPC gradually separated with increasing loads. Therefore, the crack developed rapidly as shown in Figure 18b. When the structure reaches the ultimate state, 3/4 of the cross-sectional area was seriously damaged and quit working as shown in Figure 18c. The interface debonding process of J-C was similar to J-U. It was found that the interface damage of J-U was smaller than J-C, and the interface damage developed slowly. In summary, the coarse aggregate exposed by the high-pressure water gun and retarder effectively bonded concrete and UHPC at the joint interface, improved the crack resistance, slowed down the stress growth in the steel bar, reduced the degree of interface debonding damage, and enhance the overall mechanical performance of the bridge deck.
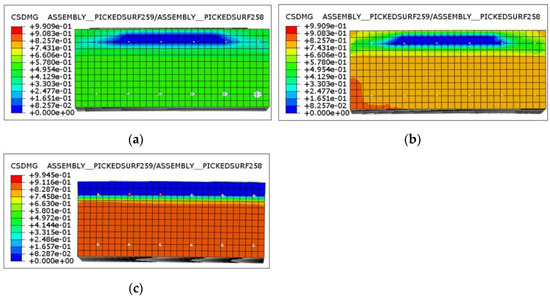
Figure 18.
Force-transferring mechanism at joint interface (J-U). (a) J-C. (b) J-U. (c) Z-U.
The stress diagram of the reinforcing bar when the specimen reached the limit state was shown in Figure 19. Since the initial crack appeared at the joint interface, stress was concentrated in the reinforcing bar at the crack. The longitudinal stress of the bottom reinforcement increased with the loading until entering the yield state. With the development of cracks, the stress in the bottom tensile bar increased continuously. The stress concentration in the tensile reinforcing bar was significant when the specimen was destroyed. The stress distribution along the longitudinal direction was not uniform, and the stress in the bar at the joint was obviously smaller than in other parts. As shown in Figure 19d, the stress value of the joint steel bar at the final stage of loading was only 50% of the bottom tensile bar, because the reinforcement ratio was twice compared with the reinforcement ratio of the precast slab. During the development of cracks, the neutral axis of the section continued to move up, and the compressive stress value of the top steel bar gradually increased.
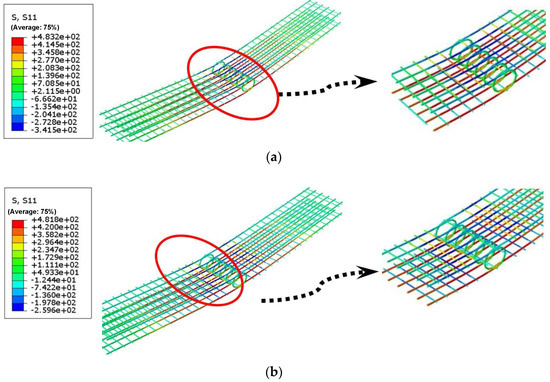
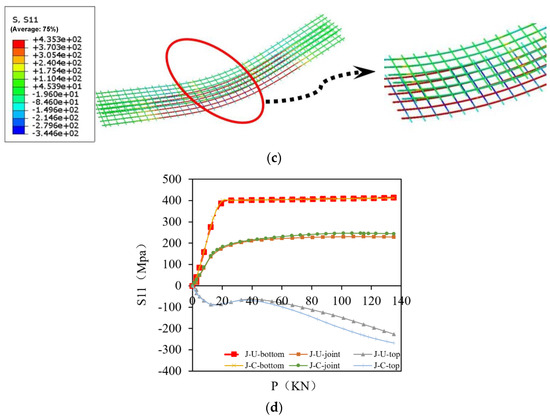
Figure 19.
Steel stress diagram at failure (MPa). (a) J-C. (b) J-U. (c) Z-C. (d) Longitudinal stress diagram of steel bar.
The inflection points of the curve of J-C were generated earlier than J-U, and the slope of the curve was larger than J-U. The stress values of the J-U joint and top steel bar were 93.6% and 84.8% of J-C, respectively. J-U had better interface bonding performance, which delayed the stress growth in the steel bar at the joint and reduced the stress value at the joint steel bar. As shown in Figure 19, after cracking the cast-in-place slab, the bottom steel bar mainly resisted the flexural moment, while the contribution of the top bar was less significant. While the bottom bar in the joint slab was close to the prefabricated slab, the bottom bar mainly resisted the flexural moment. Therefore, the contribution of UHPC material and bottom reinforcement to the flexural resistance should be considered in the design recommendation.
5. The Proposed Calculation Procedure
5.1. Assumptions
This design procedure was based on the following assumptions: (i) Plane section assumption. The strain distribution along the height of the slab was linear, which satisfied the deformation combinability. (ii) It is assumed that the bonding between the steel bar and the concrete in the deck was reliable and these two components could deform together during the loading process.
5.2. Calculation of Cracking Moment
The cracking moment of a rectangular section is given in reference [31] and listed as Equation (1). The contribution of the reinforcing bar to the moment resistance was neglected in the calculation. It was considered that the stress distribution was linear in the cracking limit state as shown in Figure 20a.
where ftu is UHPC ultimate tensile strength, b is section width, h is section height, and W is section resistance moment (ignoring the influence of the reinforcing bar).
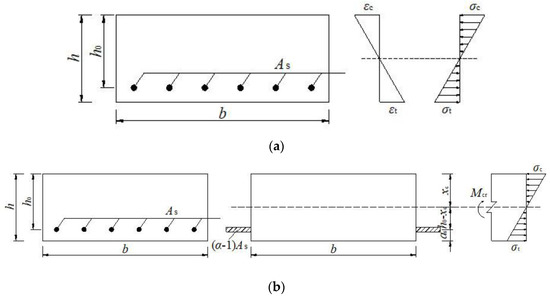
Figure 20.
Stress diagram. (a) Sectional stress distribution diagram. (b) Conversion cross-section diagram.
In order to calculate the flexural cracking stress of the section, the influence of the tensile reinforcement was considered in the following calculation. The resistance moment of the converted section was calculated as shown in Figure 20b.
The area (A) of the converted section was calculated according to Equation (2):
where Es is the elastic modulus of steel bars, Ec is the elastic modulus of concrete.
The height of compression zone xc and the moment of inertia I0 were calculated using Equations (4) and (5).
For the specimen with a joint, the cracking moment is calculated according to Equation (6). W0 is the resistance moment, considering the influence of the reinforcing bar. For J-U, ftu was taken as the average value of the ultimate tensile strength of concrete and UHPC considering the contribution of UHPC to the cracking bending moment. For Z-U, ftu was the ultimate tensile strength of the precast deck. The calculated cracking moment is compared with the experimental results as shown in Table 10.
where ftu is the standard value of the axial tensile strength of ordinary concrete, and W0 is elastic resistance moment in the section tensile edge.
For the Z-C, the cracking moment is calculated according to the formula given in reference [32] and listed as Equation (7). The calculation results are shown in Table 10:
where γ is the plastic influence coefficient of the resistance moment, and W0 is the section resistance moment considering the influence of the bottom reinforcement.
The calculated results of three specimens were compared with the test results in Table 11. The calculated results were in good agreement with the measured results. The maximum error between the calculated value and the measured value was 4%. As the contribution of wet joint materials and tensile reinforcement were considered, the cracking moment could be better predicted by Equation (6).
Table 11.
Comparison of the calculated cracking moment.
5.3. Calculation of Flexural Strength
The stress diagram of the compressive stress should be considered a triangular distribution when calculating flexural strength, according to reference [31]. From test and FE results, it was observed that failure was mainly caused by the cracking of the joint interface. Before the reinforcing bar yielded, the compressive zone was nearly in an elastic state, and no obvious damage was found. Due to the locking effect between coarse aggregate and UHPC, it was assured that the cracked area of the section could provide certain tensile stress after cracking. The residual tensile strength provided by UHPC was accounted for in the following calculation. The flexural strength was derived with reference [31] as shown in Figure 21.
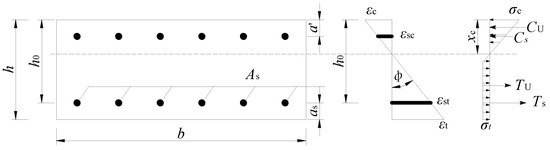
Figure 21.
Section stress distribution diagram.
The resultant force in the compressive zone was composed of concrete stress and the internal force of the reinforcing bar. The resultant force CU can be calculated according to Equation (8):
The internal force Cs of the compressed reinforcing bar can be calculated by Equation (9):
where σsc is the stress of the top reinforcing bar, a’ is the distance from the edge of the compression zone to the center of the top reinforcing bar, εst is the strain of the bottom tensile reinforcing bar, As is the area of the top or bottom reinforcing bar.
After cracking, TU was mainly provided by the mechanical bite force of coarse aggregate and UHPC, given in Equation (10). According to FE results, it was recommended that the residual tensile strength of UHPC was 5.0 MPa, and the residual tensile strength of ordinary concrete was 4.5 MPa.
where σt is the residual tensile strength provided by the wet joint.
When the reinforcing bar yielded, the internal force Ts of the tensile reinforcing bar can be calculated by Equation (11):
where fy is yield stress of the reinforcing bar.
When the bottom reinforcing bar yielded, the height of the compression zone xc can be calculated by Equation (12):
According to the equilibrium condition of the bending moment, the flexural capacity My can be calculated by Equation (13):
The calculated results of three specimens were compared with the test results. Results were tabulated in Table 12. The calculated results were in good agreement with the measured results. The maximum error between the calculated value and the measured value was 5.9%, indicating that the calculation method of flexural strength was accurate. In summary, the flexural strength could be better predicted by Equation (13) while the contribution of tensile stress of the cracked area was considered.
Table 12.
Comparison of calculated flexural strength.
6. Conclusions
This paper explored the crack development law and failure mode of UHPC joints bridge deck, by experimental tests and numerical analysis. The main conclusions of this study are as follows:
(1) UHPC effectively improved the crack strength, flexural strength, and failure mode of the specimen. The failure mode was changed from the concentrated cracking failure in the joint part to the multi-crack development failure when the joint material was replaced with UHPC.
(2) The interfacial debonding behavior at the interface was simulated using the cohesive model. Compared with the tie method that defined normal and tangential behavior, the cohesive model could simplify the modeling process and accurately simulate the debonding force at the interface between the joint and the prefabricated slab.
(3) Based on the assumption of plane section, and deformation compatibility between steel and concrete, the calculation method of cracking moment and flexural capacity of the precast bridge deck was verified with good accuracy.
(4) The calculation method has limitations in derivation and verification. For the joints of different structural forms, based on their complex stress conditions and force-transferring mechanism, the calculation method still needs to be further improved.
(5) The costs of the UHPC joints bridge deck were about 25% to 42% higher than the standard RC joints bridge deck. From the cost–benefit perspective, it would be meaningful to carry out a further study about this increase in structural efficiency to the increased costs of UHPC.
Author Contributions
Conceptualization, X.Z. and W.X.; methodology, Y.Y.; design, Y.W.; validation, J.T., J.H. and Q.Z.; analysis, F.X. All authors have read and agreed to the published version of the manuscript.
Funding
The authors gratefully acknowledge the financial support from the research and development of key technologies for the intelligent construction of prefabricated steel–concrete composite bridges (No. JSGG20191129113016887).
Data Availability Statement
The data presented in this study are available on request from the corresponding author.
Conflicts of Interest
The authors declare no conflict of interest.
References
- Azizinamini, A. Accelerated bridge construction. J. Bridge Eng. 2020, 25, 02020002. [Google Scholar] [CrossRef]
- Shao, X.; Hu, W. Experiment on flexural behavior of UHPC joint in negative moment area of composite bridges. China J. Highw. Trans. 2021, 34, 246–260. [Google Scholar]
- Graybeal, B.A. Material Property Characterization of Ultra-High Performance Concrete; No. FHWA-HRT, 06-103; Federal Highway Administration: Washington, DC, USA, 2006. [Google Scholar]
- Graybeal, B.A. Ultra-High Performance Concrete; Rep, No. FH-WA-HRT, 11-038; Federal Highway Administration: Washington, DC, USA, 2011. [Google Scholar]
- Zhao, Q.; Yang, M.; Li, C.; Yang, J. Experimental study on flexural performance of reinforced UHPC slab. Ningxia Daxue Xuebao 2019, 40, 331–336. [Google Scholar]
- Tayeh, B.A.; Abu Bakar, B.H.; Megat Johari, M.A.; Voo, Y.L. Mechanical and permeability properties of the interface between normal concrete substrate and ultra high performance fiber concrete overlay. Constr. Build. Mater. 2012, 36, 538–548. [Google Scholar] [CrossRef]
- Tayeh, B.A.; Abu, B.; Megat, J.; Voo, Y. Evaluation of bond strength between normal concrete substrateand ultra-high performance fiber concrete as a repair material. Procedia Eng. 2013, 54, 554–563. [Google Scholar] [CrossRef]
- Buitelaar, P. Heavy reinforced ultra high performance concrete. In International Symposium on Ultra High-Performance Concrete, 1st ed.; Kassel University: Kassel, Germany, 2014. [Google Scholar]
- Lampropoulos, A.P.; Paschalis, S.A.; Tsioulou, O.T. Strengthening of reinforced concrete beams using ultra high performance fibre reinforced concrete. Eng. Struct. 2016, 106, 370–384. [Google Scholar] [CrossRef]
- Shah, Y.I.; Hu, Z.; Yin, B.; Li, X. Flexural performance analysis of UHPC wet joint of prefabricated bridge deck. Arab. J. Sci. Eng. 2021, 46, 11253–11266. [Google Scholar] [CrossRef]
- Perry, V.; Weiss, G. Innovative Field Cast UHPC Joints for Precast Bridge Decks. Design, Prototype Testing and Projects; Chapter 28; John Wiley & Sons, Inc.: Hoboken, NJ, USA, 2011. [Google Scholar]
- Varga, I.; Haber, Z.; Graybeal, B.A. Bond of Fieldcast Grouts to Precast Concrete Elements; Federal Highway Administration, America: Washington, DC, USA, 2017. [Google Scholar]
- Young, J.K.; Won, J.C.; Se, J.J. Interface shear strength at joints of Ultra-High performance concrete structures. Int. J. Concr. Struct. Mater. 2018, 12, 767–780. [Google Scholar]
- Graybeal, B.A. Behavior of Field-Cast Ultra-High Performance Concrete Bridge Deck Connections under Cyclic and Static Structural Loading; FHWA-HRT-11-023; Office of Infrastructure Research & Development, Federal Highway Administration: Washington, DC, USA, 2011. [Google Scholar]
- Graybeal, B.A. Ultra-high-performance concrete connections for precast concrete bridge decks (Review). PCI J. 2014, 59, 48–62. [Google Scholar] [CrossRef]
- Deng, E.; Zhe, Z.; Chen, X.; Yi, T.; Wei, W.; Zhan, J.; Ji, P. Experimental study on flexural behavior of UHPC wet joint in prefabricated multi-girder bridge. Eng. Struct. 2023, 275, 115314. [Google Scholar] [CrossRef]
- Zhang, Y. Test study of mechanical behavior of UHPC-U shape reinforcement wet joint of precast deck slabs. Bridge Constr. 2018, 48, 48–52. [Google Scholar]
- Wang, K.; Guo, L.; Wang, J.; Hu, S.; Yu, G. Flexural behaviour analysis of wet joint of precast bridge deck with UHPC functional gradient. Adv. Struct. Eng. 2022, 26, 448–458. [Google Scholar] [CrossRef]
- Chen, D.; Zeng, M.; Su, Q.; Lou, Y. Interfacial treatment measures of wet joints in composite bridge deck composed of steel and UHPC layer. China J. Highw. Transp. 2018, 31, 154–162. [Google Scholar]
- Cao, X.; Feng, D.; Wu, G.; Wang, Z. Experimental and theoretical investigations of the existing reinforced concrete frames retrofitted with the novel external SC-PBSPC BRBF sub-structures. Eng. Struct. 2022, 256, 113982. [Google Scholar] [CrossRef]
- Sinsamutpadung, N.; Sasaki, E. Strain-based evaluation of bridge monitoring using numerical model analysis. Mater. Sci. Eng. 2019, 639, 012023. [Google Scholar] [CrossRef]
- Marsh, P.S.; Frangopol, M.F.D. Reinforced concrete bridge deck reliability model incorporating temporal and spatial variations of probabilistic corrosion rate sensor data. Reliab. Eng. Syst. Saf. 2008, 93, 394–409. [Google Scholar] [CrossRef]
- Erdogmus, E.; Garcia, E.; Amiri, A.S.; Schuller, M. A novel structural health monitoring method for reinforced concrete bridge decks using ultrasonic guided waves. Infrastructures 2020, 5, 49. [Google Scholar] [CrossRef]
- Du, Y. Mechanical Behavior for UHPC Ribbed Deck and Internal Shear Connection of Composite Beams with Steel Plates. Master’s Thesis, Fuzhou University, Fuzhou, China, 2019. [Google Scholar]
- Cao, X.; Xiong, C.; Feng, D.; Wu, G. Dynamic and probabilistic seismic performance assessment of precast prestressed reinforced concrete frames incorporating slab influence through three-dimensional spatial model. Bull. Earthq. Eng. 2022, 20, 6705–6739. [Google Scholar] [CrossRef]
- Jang, H.O.; Lee, H.S.; Cho, K. Numerical and experimental analysis of the shear behavior of ultra high-performance concrete construction joints. Adv. Mater. Sci. Eng. 2018, 2018, 6429767. [Google Scholar] [CrossRef]
- Hussein, H.H.; Walsh, K.K.; Sargand, S.M. Modeling the shear connection in adjacent box-beam bridges with ultrahigh-performance concrete joints. J. Bridge Eng. 2017, 22, 04017043. [Google Scholar] [CrossRef]
- Deng, O. Study on the interfacial properties of UHPC-NC composite component. J. Chongqing Univ. 2021, 44, 63–74. [Google Scholar]
- Shao, X.; Li, Y.; Liao, Z.; Cao, J. Test and finite element analysis on bending performance of UHPC Waffle deck panel. Chang’an Daxue Xuebao 2018, 38, 52–63. [Google Scholar]
- Zhu, J.; Xin, G.; Xu, C.; Zhang, H.; Wang, Y. Analysis of Flexural Behavior of Steel-UHPC Composite Girders Based on Plastic Damage Model. Steel Constr. 2022, 35, 24–32. [Google Scholar]
- Aaleti, S.R.; Petersen, B.; Sritharan, S. Design Guide for Precast UHPC Waffle Deck Panel System, Including Connections; Washington: Federal Highway Administration and U.S. Department of Transportation: Washington, DC, USA, 2013. [Google Scholar]
- GB/T 50010-2010; Code for Design of Concrete Structures. China National Standardization Administration. China Standards Press: Beijing, China, 2010.


Disclaimer/Publisher’s Note: The statements, opinions and data contained in all publications are solely those of the individual author(s) and contributor(s) and not of MDPI and/or the editor(s). MDPI and/or the editor(s) disclaim responsibility for any injury to people or property resulting from any ideas, methods, instructions or products referred to in the content. |
© 2023 by the authors. Licensee MDPI, Basel, Switzerland. This article is an open access article distributed under the terms and conditions of the Creative Commons Attribution (CC BY) license (https://creativecommons.org/licenses/by/4.0/).