Abstract
With the spread of sustainability concepts, due to the global energy crisis and the unrestrained consumption of natural resources, the importance of rational use and reduction of energy consumption has been intensified, albeit in short steps. This concern has taken up bioclimatic concepts in buildings, especially housing buildings for low-income people, aiming at improving the quality of housing production in terms of its habitability. The objective of this research is to theoretically and experimentally study the natural ventilation in a housing building, which fits into the low-cost pattern. The use of Computational Fluid Dynamics to predict natural ventilation was adopted as a tool to perform these analyses. Experiments were carried out by visiting the study area to collect data on air velocity, temperature, and relative humidity in all rooms of the residence in order to carry out the intended analyses. Computer simulation of natural ventilation considering the building with the doors and windows open and with fixed geometry was performed. Results proved that the proposed mathematical model was able to reproduce, with rich details and physical coherence, the internal and external air flow inside the building, indicating better internal ventilation performance in environments that have door and window openings, with recesses, revealing the importance of cross ventilation to reduce the internal temperature and consequent improvement in thermal comfort. The idea is to help civil engineers and specialists in the economically viable design of low-cost buildings from the economic, social, and thermal comfort points of view.
1. Introduction
The Brazilian housing problem has its historical roots in its rapid urbanization process, which ignored planning actions, especially concerning housing production issues, reflecting an expressive and historic housing deficit.
The housing issue is one of the great challenges of Brazilian cities, due to the need to build a large number of low-cost and good-quality housing units, in a short period of time and that are adequately served by urban services [1]. The country has a considerable housing deficit, and there is a need to meet this demand, especially in the low-income population groups, which despite being target of policies and programs of social interest, are still far from meeting the existing demand. Santos [2] explains that housing is a basic need and aspiration of the human being, being vital for the principle of human dignity, and for this reason the right to housing constitutes a basic right for every citizen. It is important to emphasize that the offer of decent housing should not be limited to providing an environment to live in.
According to the United Nations [3], in a document prepared by the UN-Habitat, there are seven basic components that must be considered for the promotion of adequate housing: security of tenure; availability of services, equipment and infrastructure; availability at affordable prices; habitability; accessibility to all social groups; location (access to employment, health and social facilities); and cultural adequacy.
In the architecture of buildings aimed at housing purposes, for the full satisfaction of users and supplying their needs, it is not enough to consider only dimensional and quantitative parameters of the environments so that adequate housing conditions are achieved. For these spaces, there is the concept of habitability, which goes beyond, involving aspects related to the comfort of users, considering the most diverse aspects. Therefore, solutions must be sought that minimize unpleasant sensations, without disregarding functionality and aesthetics. Among the various aspects, the following can be mentioned: (a) distance between the slab and the roof, dimensions of the openings in the facades, windows and doors; (b) orientation of the house in relation to the wind direction; and (c) location of doors and windows in relation to the wind direction (direct or cross ventilation). There is also the effect of the relationship between the dimensions of the doors and windows. For example, air inlets larger than air outlets produce better air movement and distribution.
Frota and Schiffer [4] summarize important aspects of human well-being in built environments, which should serve humans and their comfort, including thermal comfort. Humans have a better life and health conditions when they can function without being subjected to fatigue or stress, including thermal effects. Architecture, as one of its main functions, must offer thermal conditions compatible with human thermal comfort inside buildings, regardless of the external climatic conditions [4].
Environmental comfort is related to the feeling of satisfaction with the environment and involves several aspects, such as adequate lighting conditions, acoustics, ventilation, adequate size of physical spaces, colors compatible with the use, relationship of harmony with the surroundings, among other aspects. The control of comfort conditions must be part of the architecture in the most diverse projects, especially when it comes to housing, considering the amount of time and daily activities performed in these spaces. However, thermal comfort stands out for promoting the physical and psychological health of users, being related to the metabolic changes that the body undergoes when it is not in balance with the external environment.
Currently, the production of low-cost popular housing, aimed at reducing the housing deficit, also called Housing of Social Interest (HSI), is often characterized by the standardization of the housing unit, disregarding regional particularities, which compromises environmental comfort and the salubrity of the environments. In addition, the replication of the same project, by a single architectural type or standard project, in popular housing projects does not consider that the beneficiary families have different configurations. Thus, housing units often do not meet the spatial needs of users [5,6,7,8].
Compliance with the minimum conditions of environmental comfort indices in residential buildings has been regulated in Brazil, among other regulations, by NBR 15575/2013 (Standard of Performance in Housing Buildings) [9] and by NBR 15220-3/2005 (Standard of Thermal Performance of Buildings) [10] and must be obeyed. The referred norms consider that, for each Brazilian Climatic Zone, compatible constructive solutions must be used, ranging from the best location for implantation in the site (considering short and long-term environments) and size of openings for better use of natural ventilation to types of materials used in construction, among other aspects. In this sense, studies have shown that the use of natural resources for ventilation and climate mitigation presents itself as an important strategy to promote thermal comfort without greater electrical energy expenses, representing a considerable reduction in the costs involved [4,11].
In search of a sustainable architecture that promotes integration between the built environment, architecture assumes the role of ally, as it uses strategies to optimize the environmental conditions of each region, by taking advantage of natural ventilation, aiming not only the comfort of users but also adequate energy performance. Thus, it is possible to provide thermal comfort to the users of the built spaces, enabling the development of activities more efficiently and satisfactorily.
One of the computational tools that have been used in the area of thermal and environmental comfort is CFD (Computational Fluid Dynamics). Several correlated studies can be found in the literature, such as [12,13,14,15,16,17,18,19]. Mistriotis et al. [12] reported in their research the validity and advantages of the CFD technique as applied to predict pressure distribution and air velocity in greenhouse; however, because the authors used a more simplified mathematical model, no information on the effect of relative humidity was given. Usman and Bakar [18] reported the use of CFD in predicting indoor thermal comfort in residential house; the study was validated by comparing predicted and experimental external wall temperature data at different points of the house. Unfortunately, Usman and Bakar [18] did not detail the mathematical model used in the research, highlighting the need for more detailed studies on the subject.
Given the above, in this work, we aim to study the natural ventilation in a Brazilian housing building, which fits the low-cost standard, using experiments and high-performance computer simulation (CFD) including a detailed and advanced mathematical modeling. Herein, in complement to the research studies cited in the literature, information about the effect of the temperature, relative humidity, and velocity of the air flowing inside the residence are presented and analyzed. The idea is to help the construction industry and academia in making safe decisions related to low-cost housing, with a view to increasing thermal and environmental comfort for occupants; a problem of global impact, mainly in underdeveloped and developing countries.
2. Materials and Methods
The building analyzed in this research is a multifamily residence with an area of 60 m2, and is part of a housing complex located in the city of Campina Grande, State of Paraíba, Brazil; a city in the interior of the Brazilian Northeast. The criteria for choosing the building were based on characteristics that make it fit in the category of low-cost housing. Among these features, the following can be highlighted:
- (a)
- Poor urban insertion: the building is located in a peripheral and expanding area of the city, far from the center and urban mobility;
- (b)
- Built area: this type of building has a reduced area;
- (c)
- Constructive standardization: the building follows the same floor plan as the others in the housing complex;
- (d)
- The building presents thermal comfort problems due to the standardization of the construction project;
All units of the housing project under study have the same configuration of floor plan, organized internally with the following environments: integrated living and dining room, bathroom, three bedrooms, kitchen, service area, and three setbacks (front, back, and side).
The topography of the ground where the residence is located is predominantly flat, and all the buildings of the residential complex are of the single floor type, presenting a configuration of houses combined on one of the sides (linked house), a design strategy commonly used to lease the largest number of housing units per building area. The main facade of the studied building points to the East, in which the window openings of one of the bedrooms, the door and the window of the integrated living and dining room of the house are located. Sun protection is provided through a marquee that projects in front of the building. Observing the building implementation conditions regarding its position, it appears that the orientation of the main facade toward the East, conditions the long-stay rooms to the most critical direction (West), which receives the sunset solar radiation during the afternoon, in disagreement with the technical recommendations for the thermal comfort of the environments.
As it is a single plan for the entire housing complex, the positioning of the environments occurs in the same way in all construction areas of each residence, regardless of the most favorable solar orientation for their distribution. This configuration, which reproduces the floor plan for all houses, does not contribute to solving the critical position of long-stay rooms, demonstrating the inadequacy of the arrangement to the characteristics of the site and environmental conditions.
2.1. Experimental Procedures
Data collections were carried out through a technical visit in loco to the study area. As this is a steady state analysis process, the data collection was carried out in a single day, with climatic characteristics typical of the Brazilian summer (most critical thermal scenario) and at different times, aiming to understand the phenomena in the hottest periods of the day, by incident radiation. The measurements were carried out on 29 February 2020, starting at 11:30 a.m. and ending at 1:45 p.m. on the same day. For reference, at February 2020, the mean daily ranges of outdoor air parameters characteristic of the area where the facility was located are: temperature ranging from 21 °C to 33 °C, velocity ranging from 15.7 to 21.7 km/h, and relative humidity ranging from 55% to 59%.
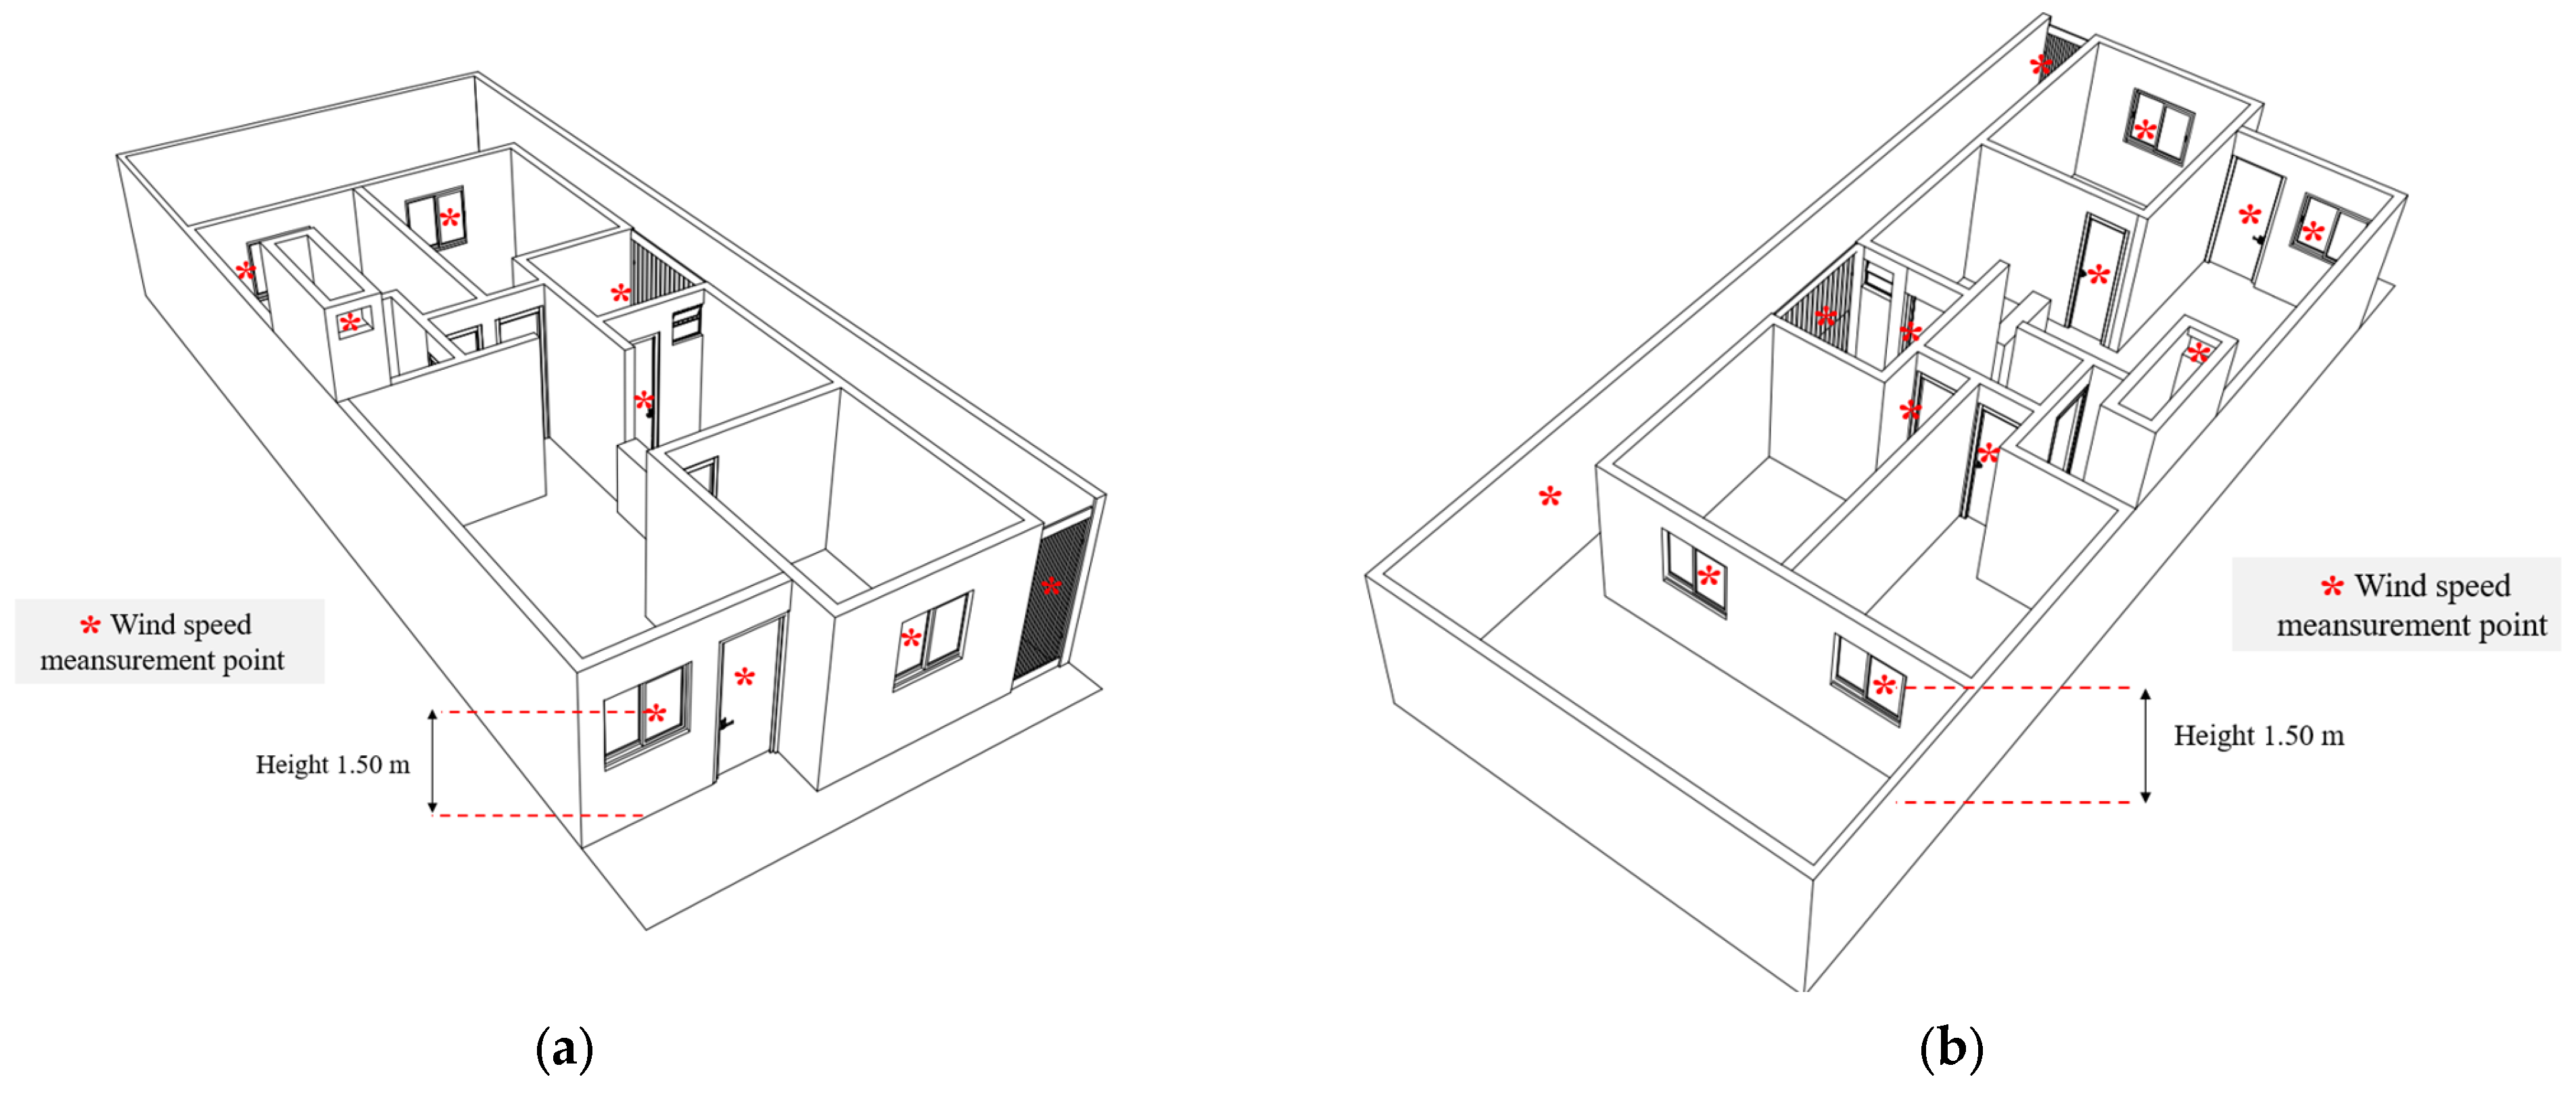
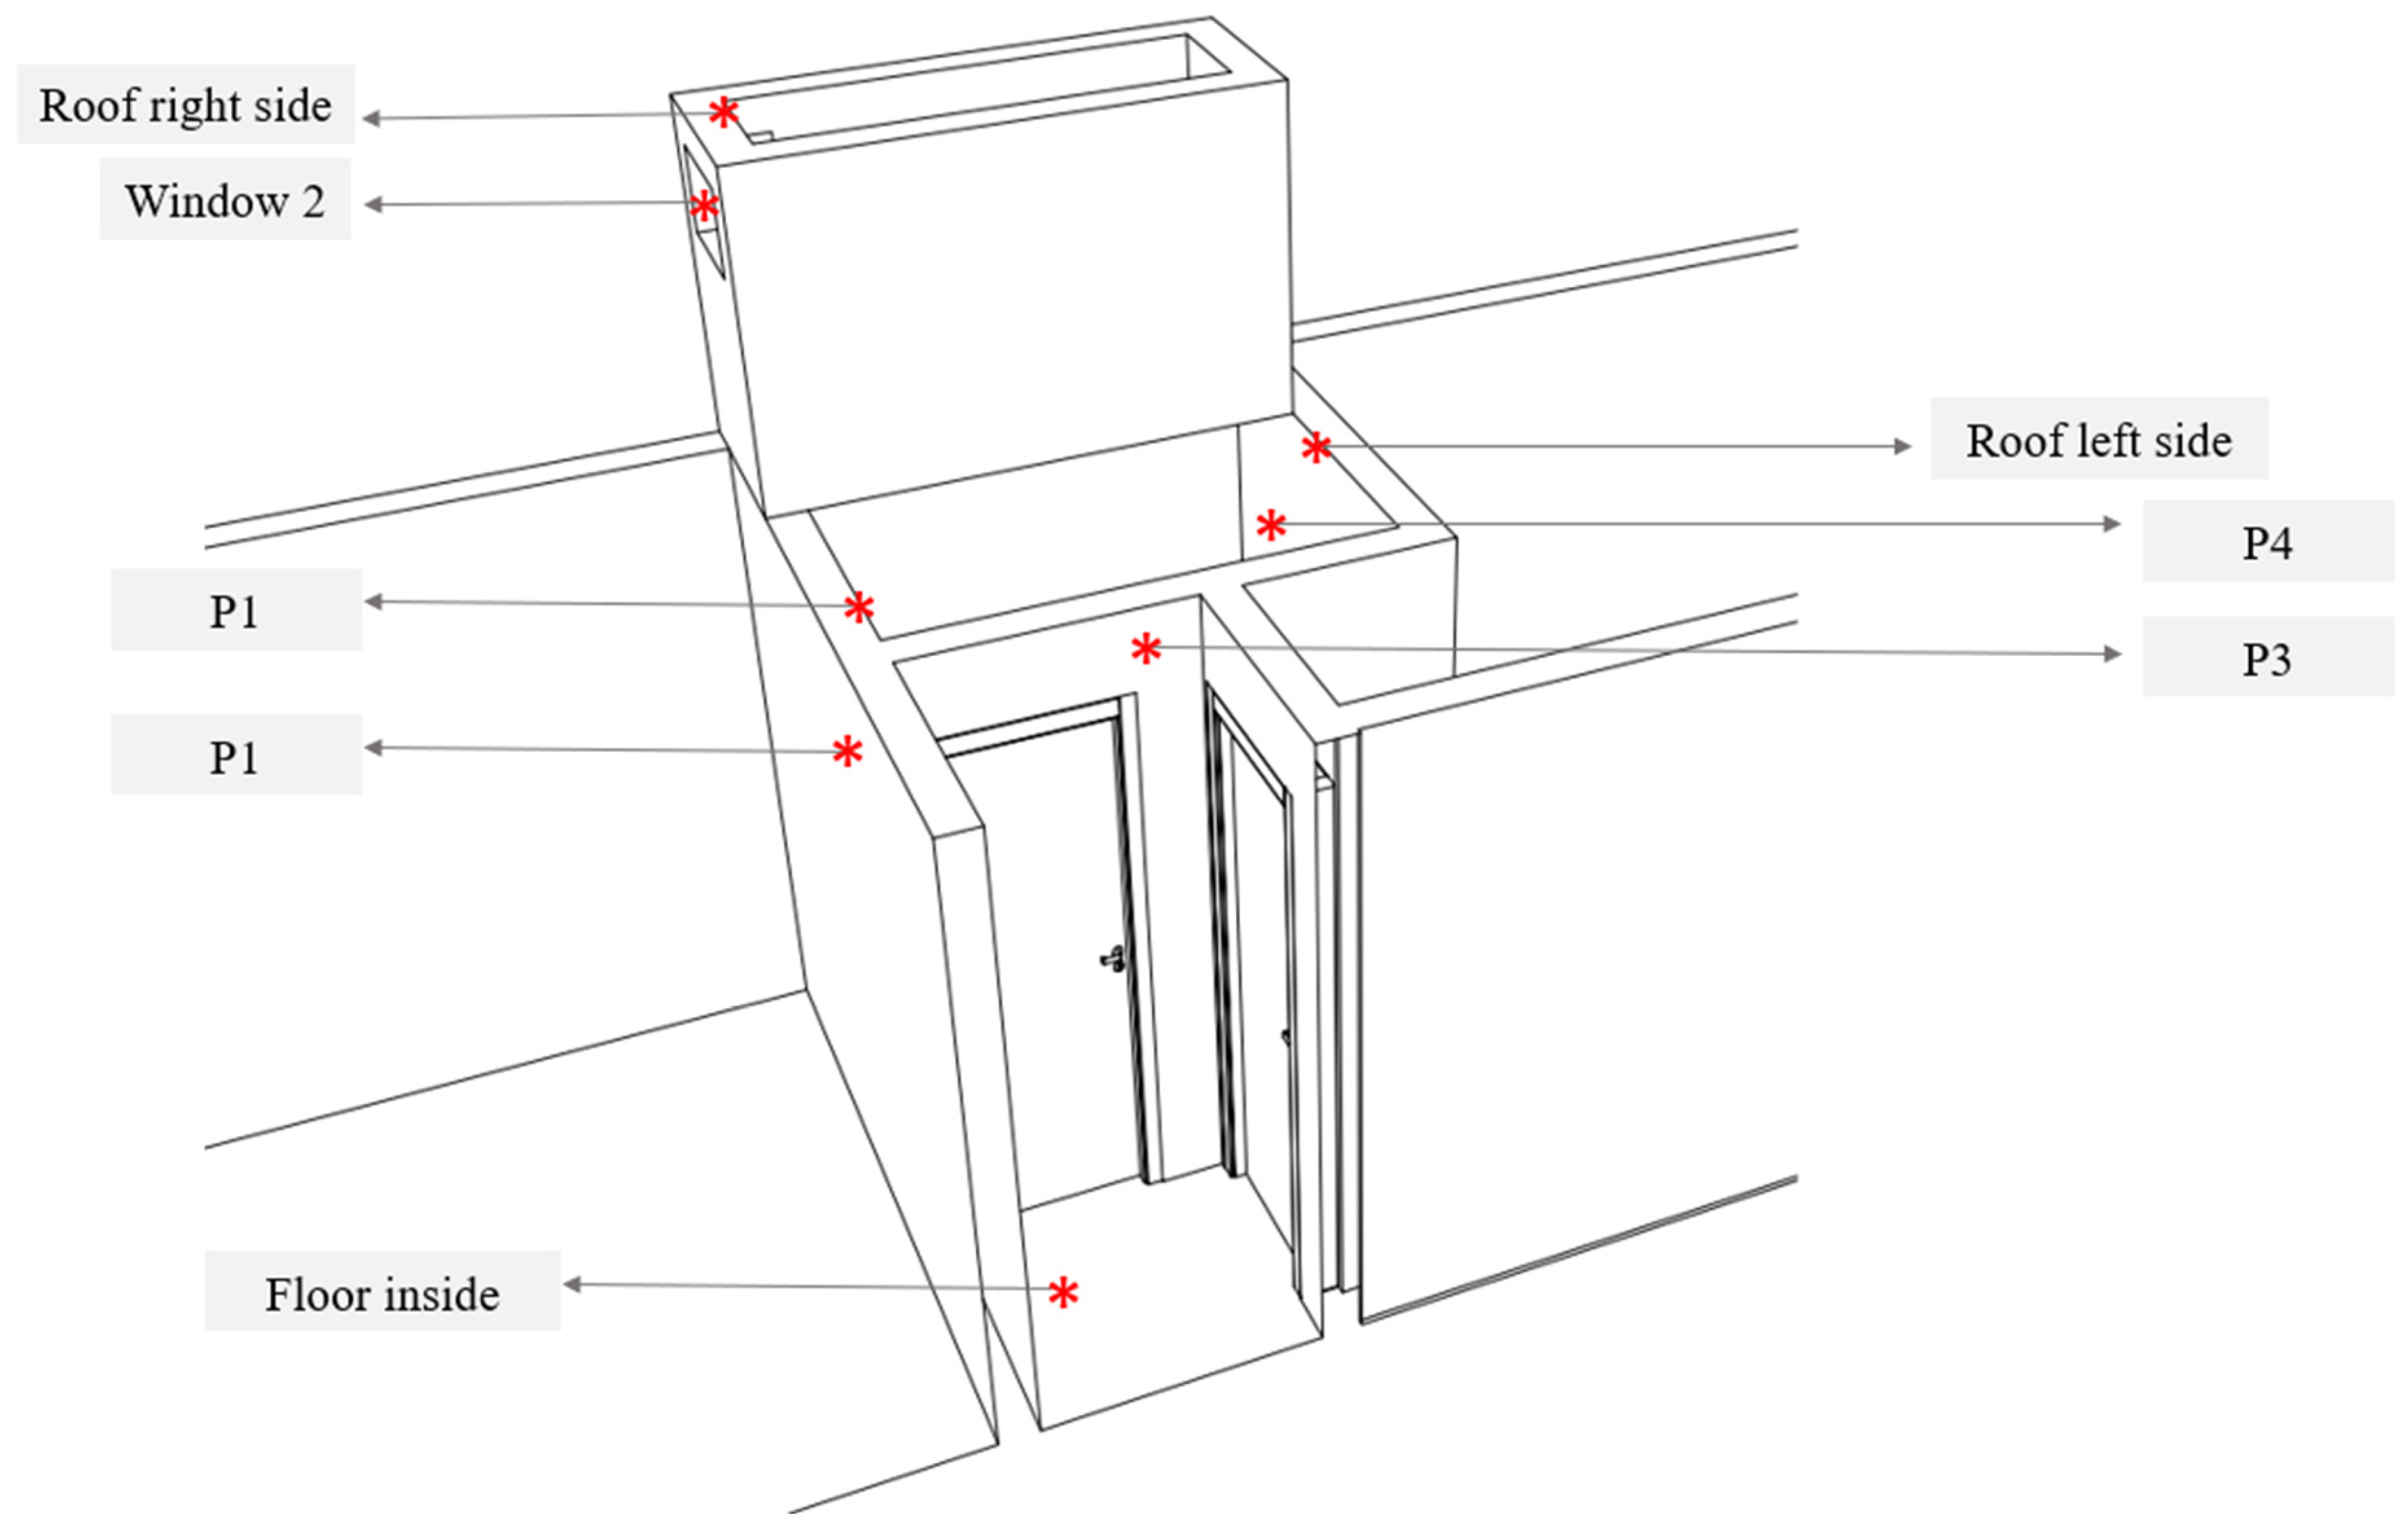
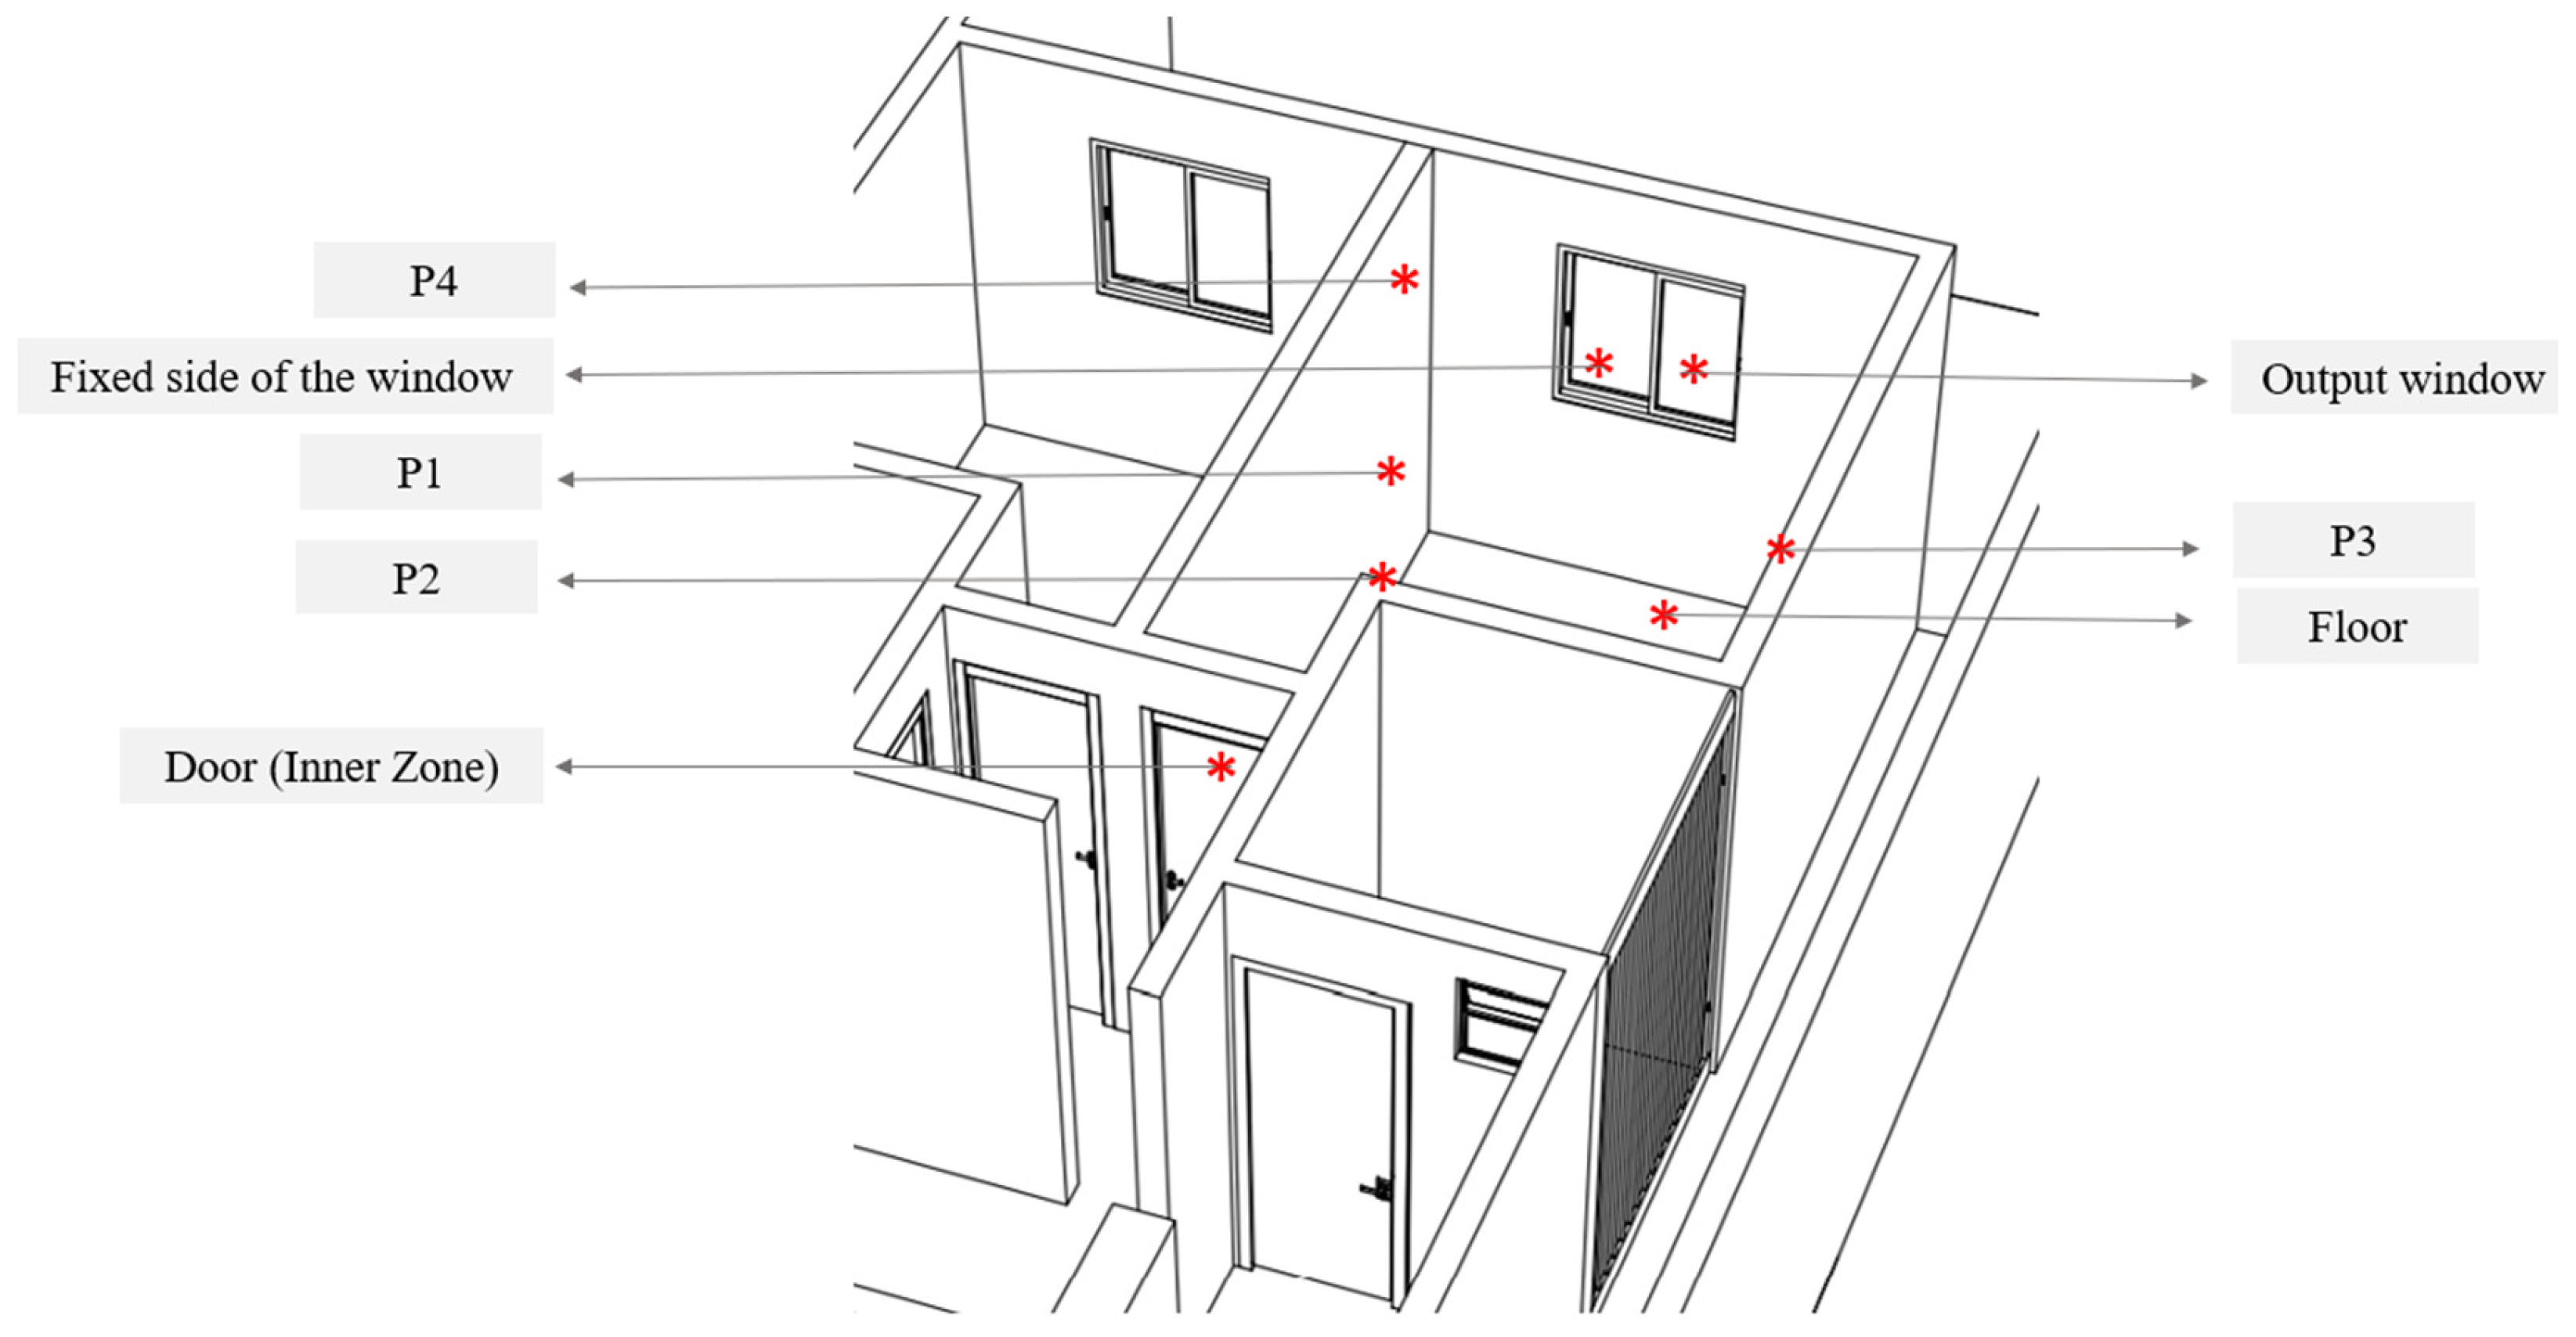
For that, the following instruments were used: (a) digital thermo-hygrometer, (b) digital anemometer, and (c) infrared thermometer, to collect data referring to air temperature, air velocity, and air relative humidity at different points of the residence. Relative humidity and temperature of the indoor air on the house were measured using a thermohygrometer (ICEL, model HT 208, accuracy ±0.1 °C and ±1%) and wall surface temperature were measured using a digital infrared thermometer (Instrutemp, model TI 890, accuracy ±2 °C). Moreover, air velocity was measured using a digital anemometer, (Instrutemp, model AMI 300, accuracy ±2%). In Figure 1a there is a three-dimensional scheme of the building, indicating the measurement points, which were carried out at a height of 1.5 m in relation to the ground.
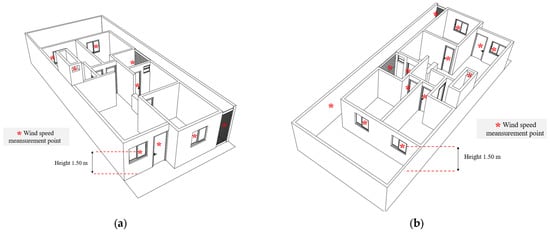
Figure 1.
3D (a) front and (b) back views of the building.
The digital thermohygrometer was positioned on flat surfaces in each room, and it was stipulated to wait 5 min for data stabilization, standardizing this procedure and this period of time in all environments. This procedure was important to standardize the analyzes in all rooms of the residence, considering the peaks that, perhaps, could exist.
In all measurements and all environments, the infrared thermometer was directed to all the walls of the rooms, taking an average of the values obtained, despite the small variation observed between these data.
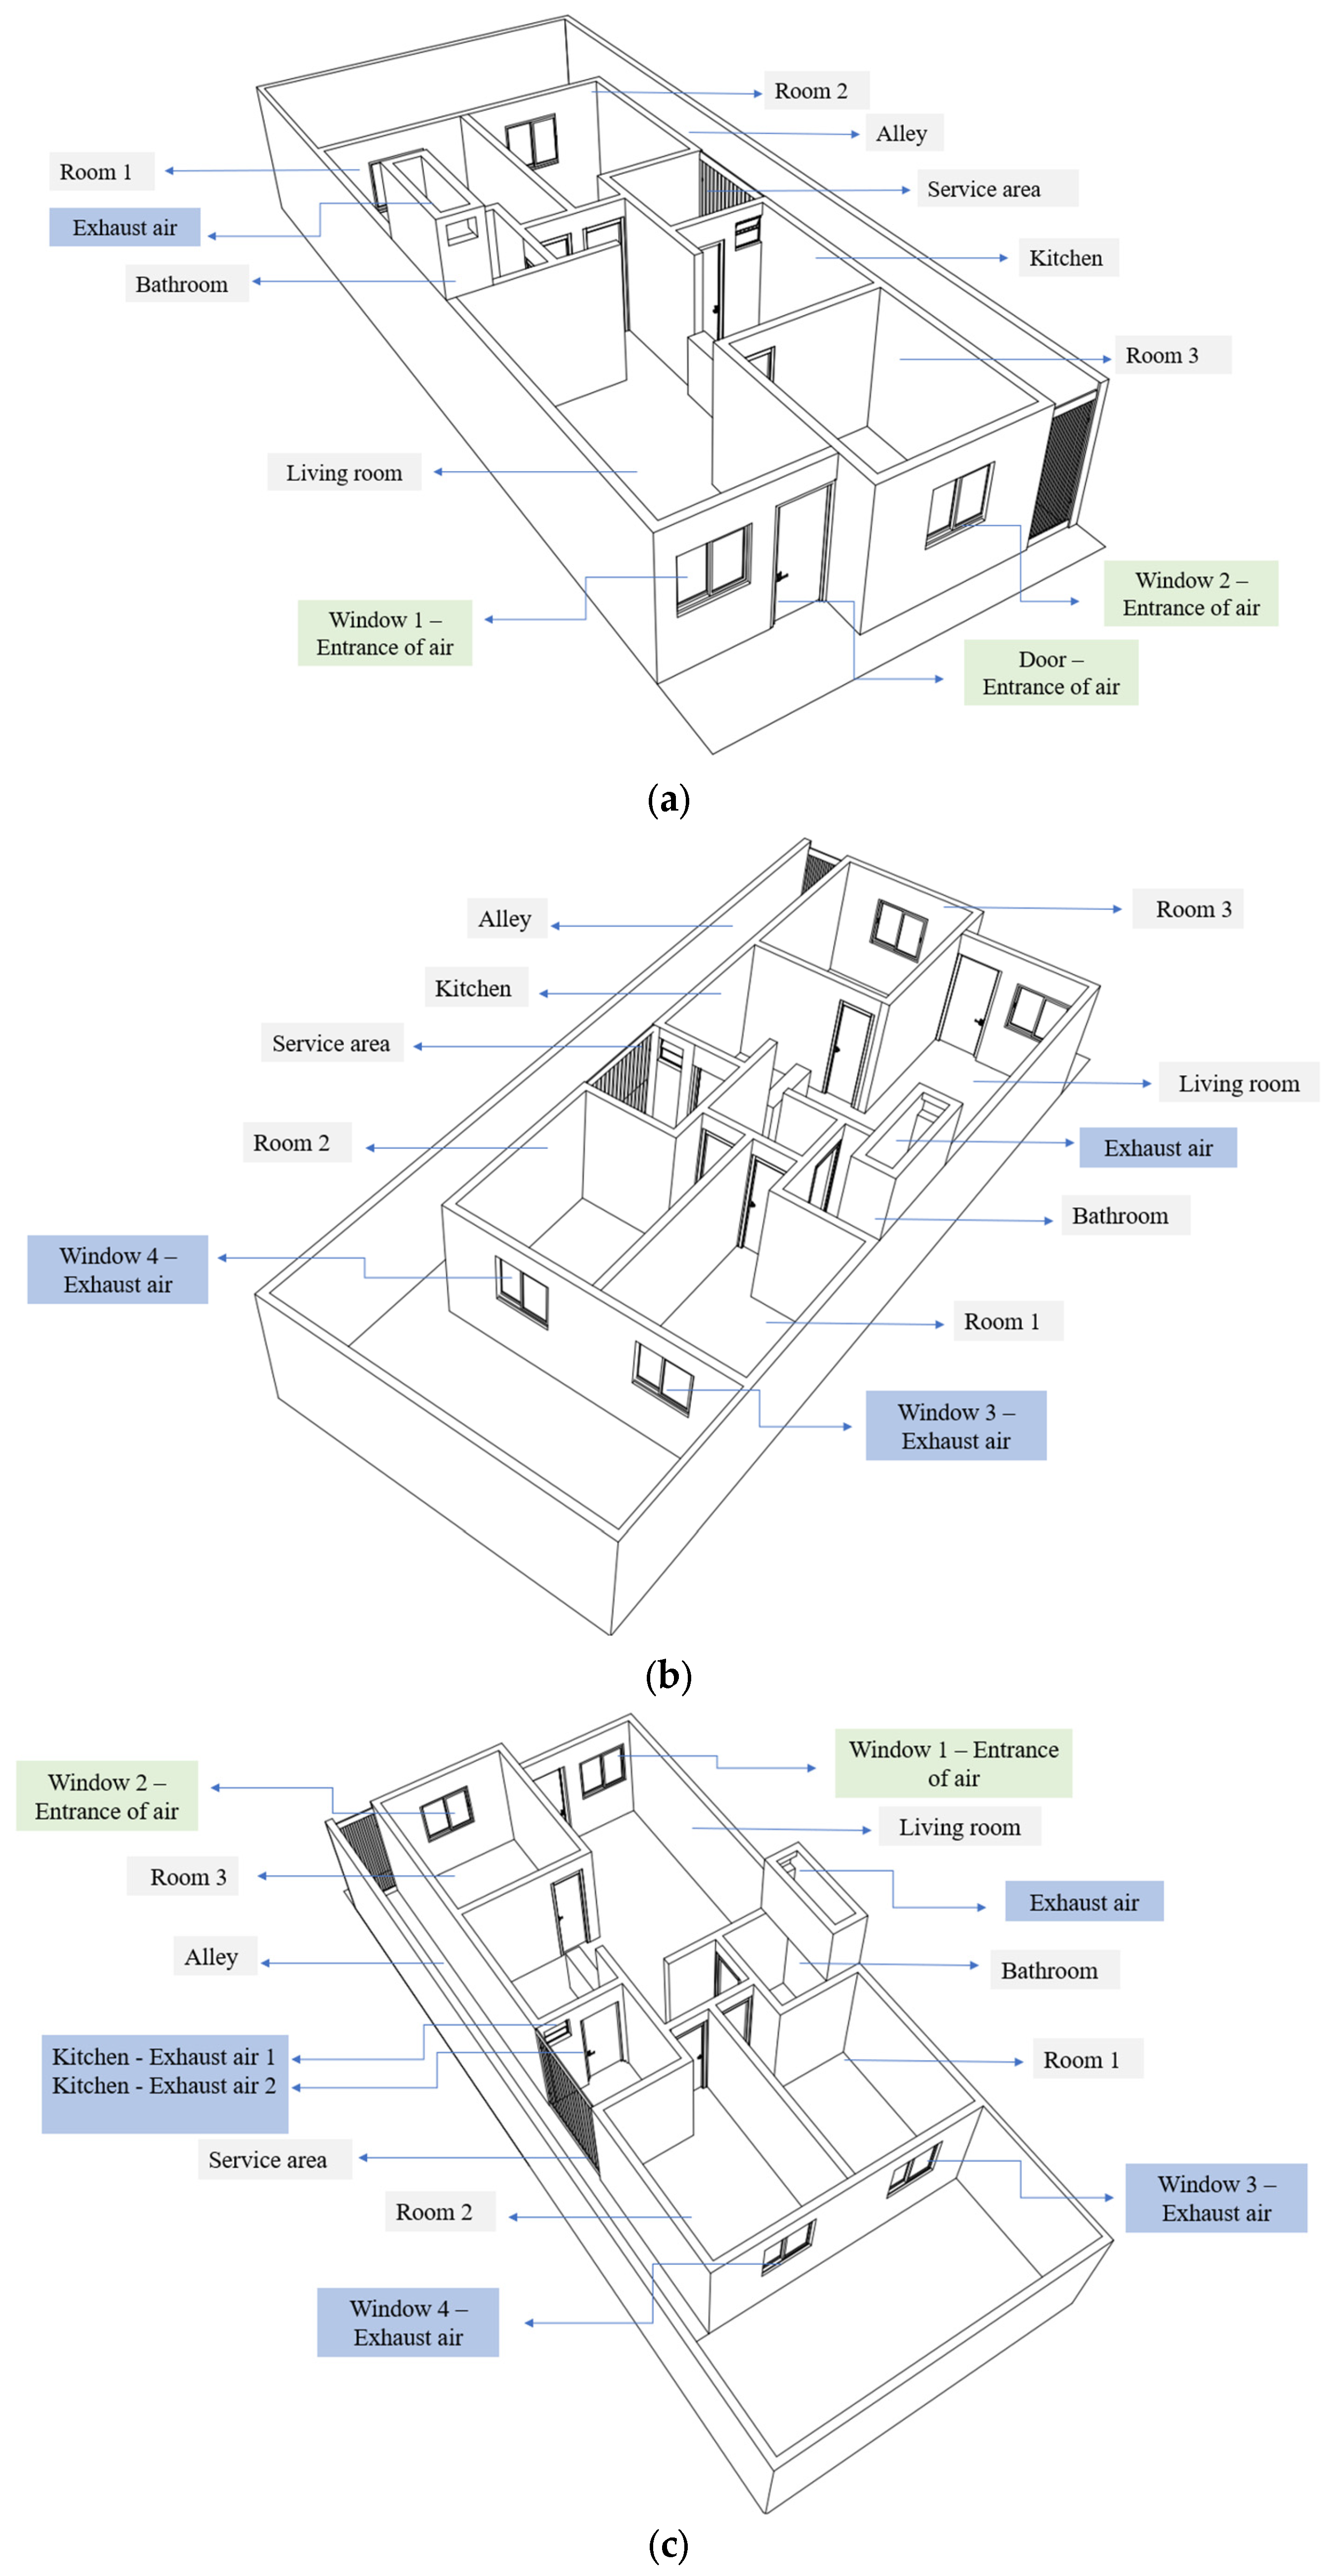
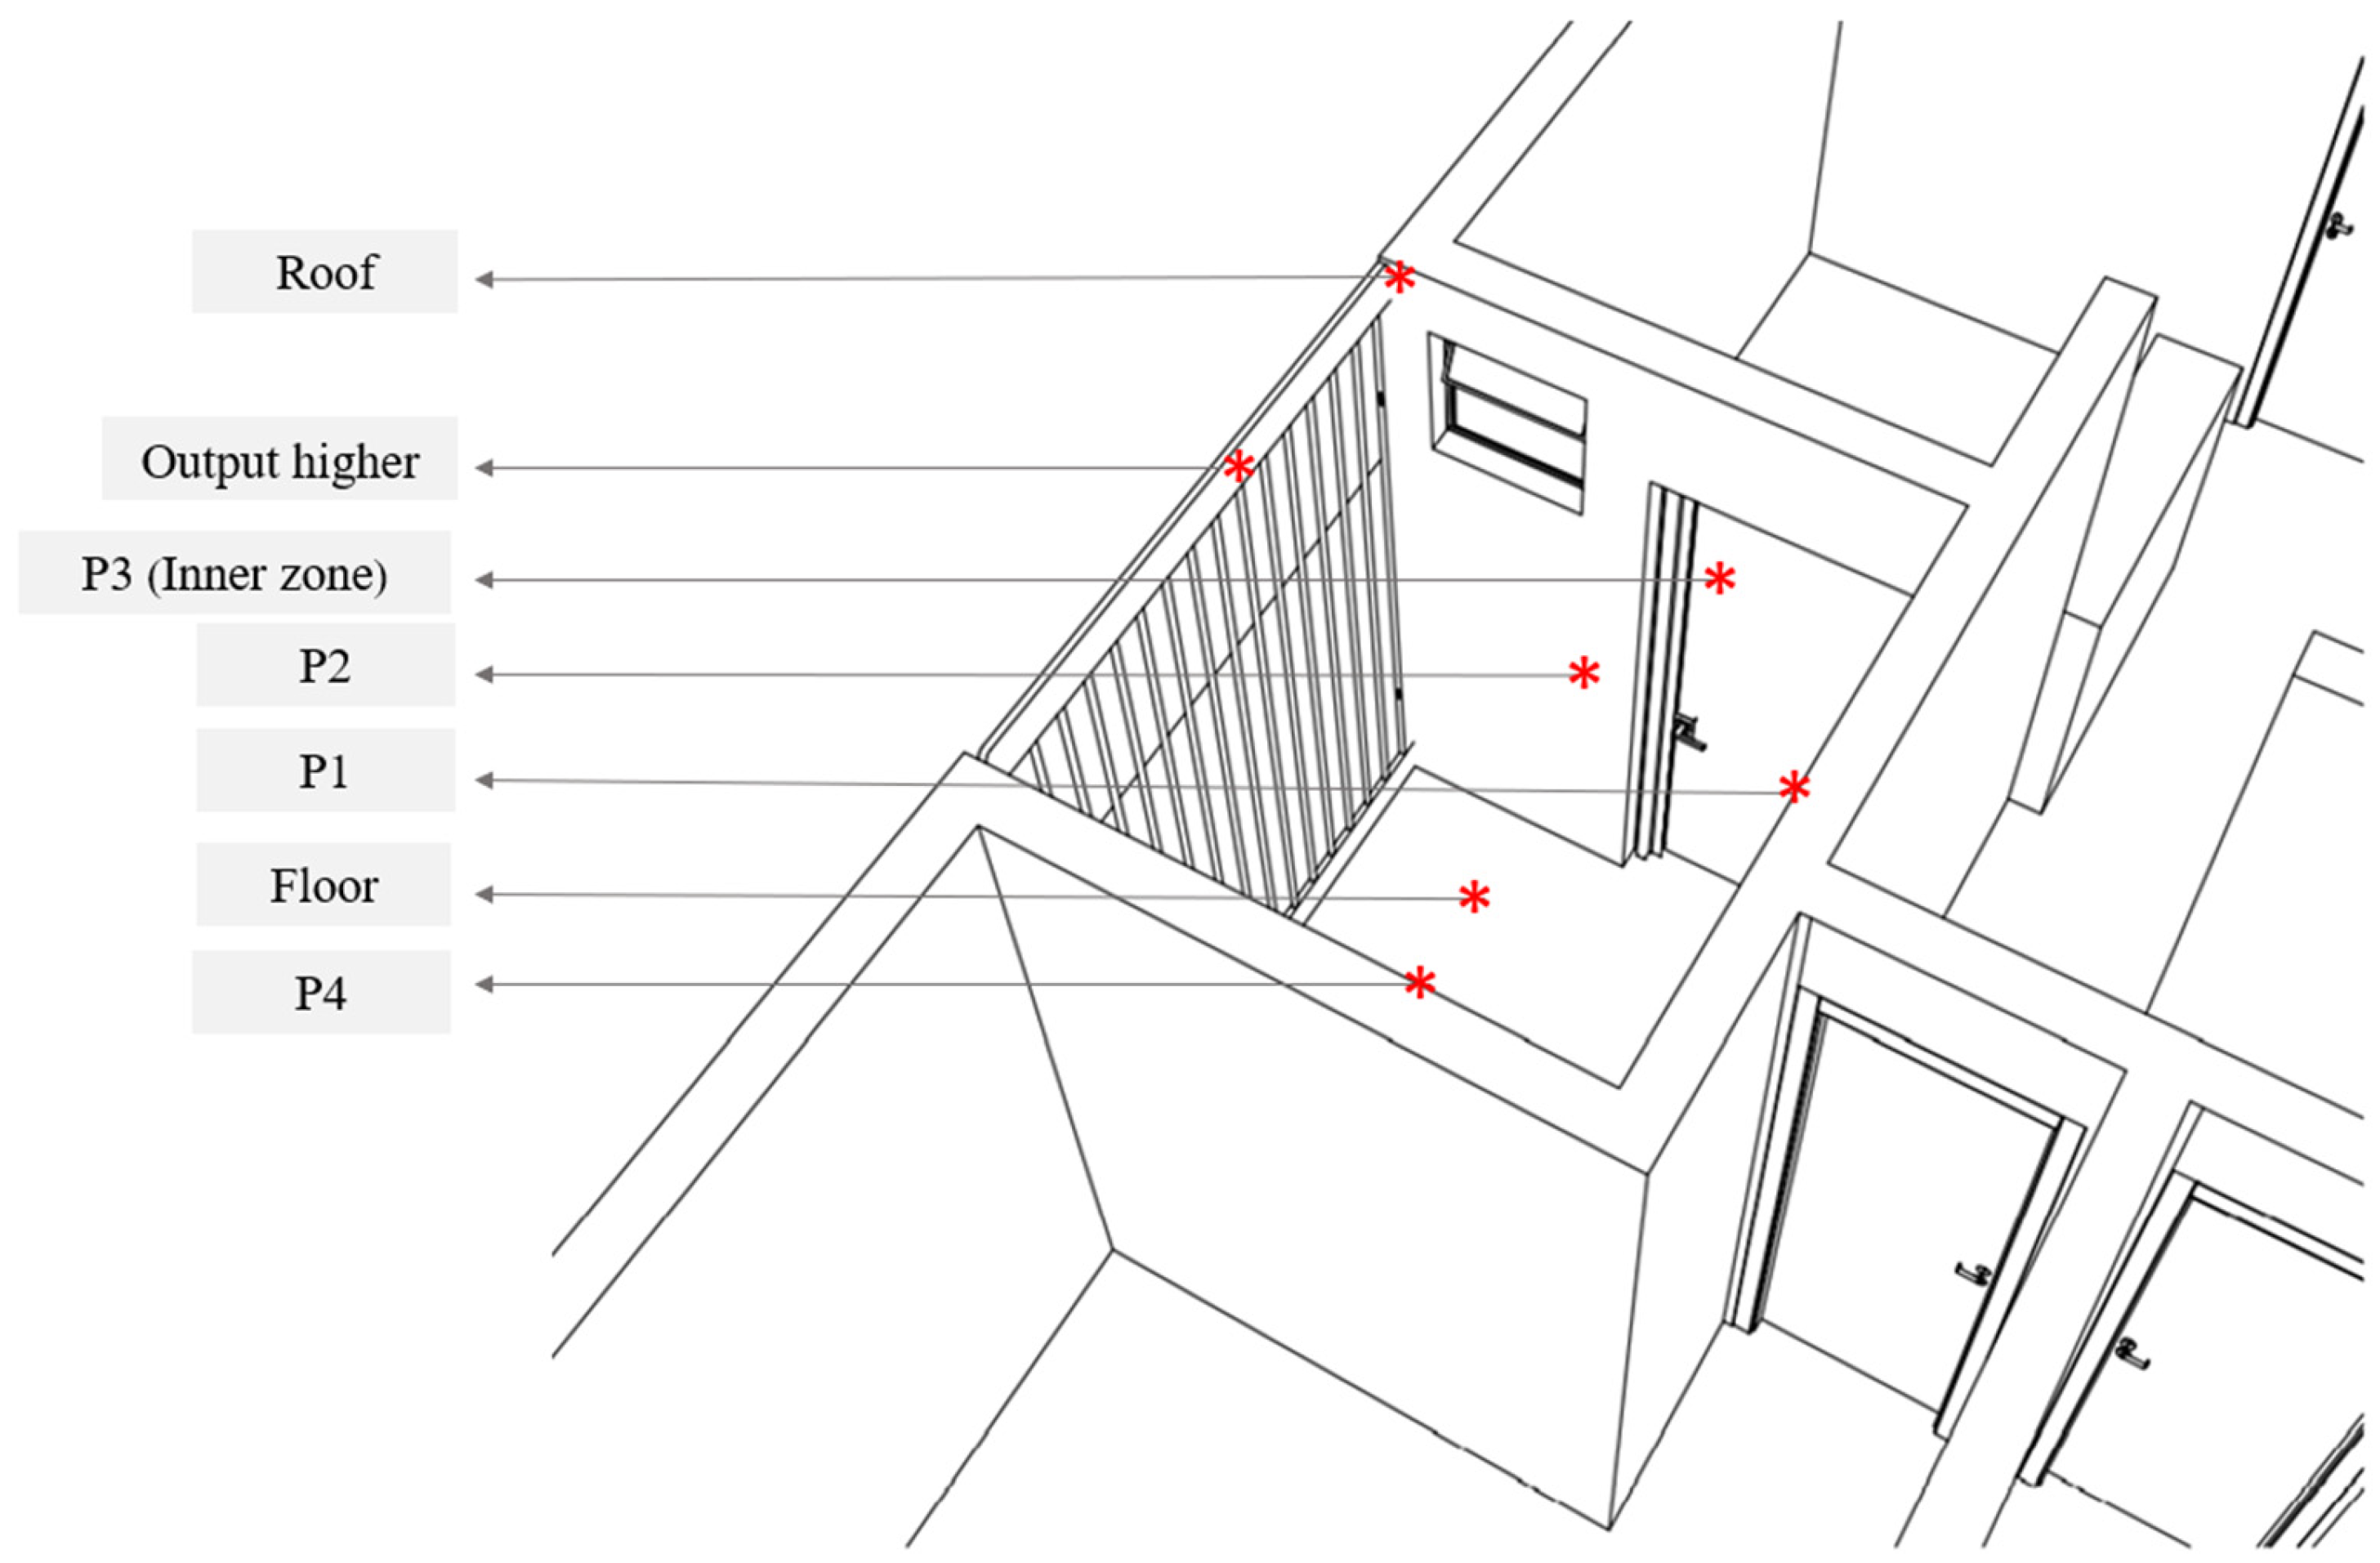
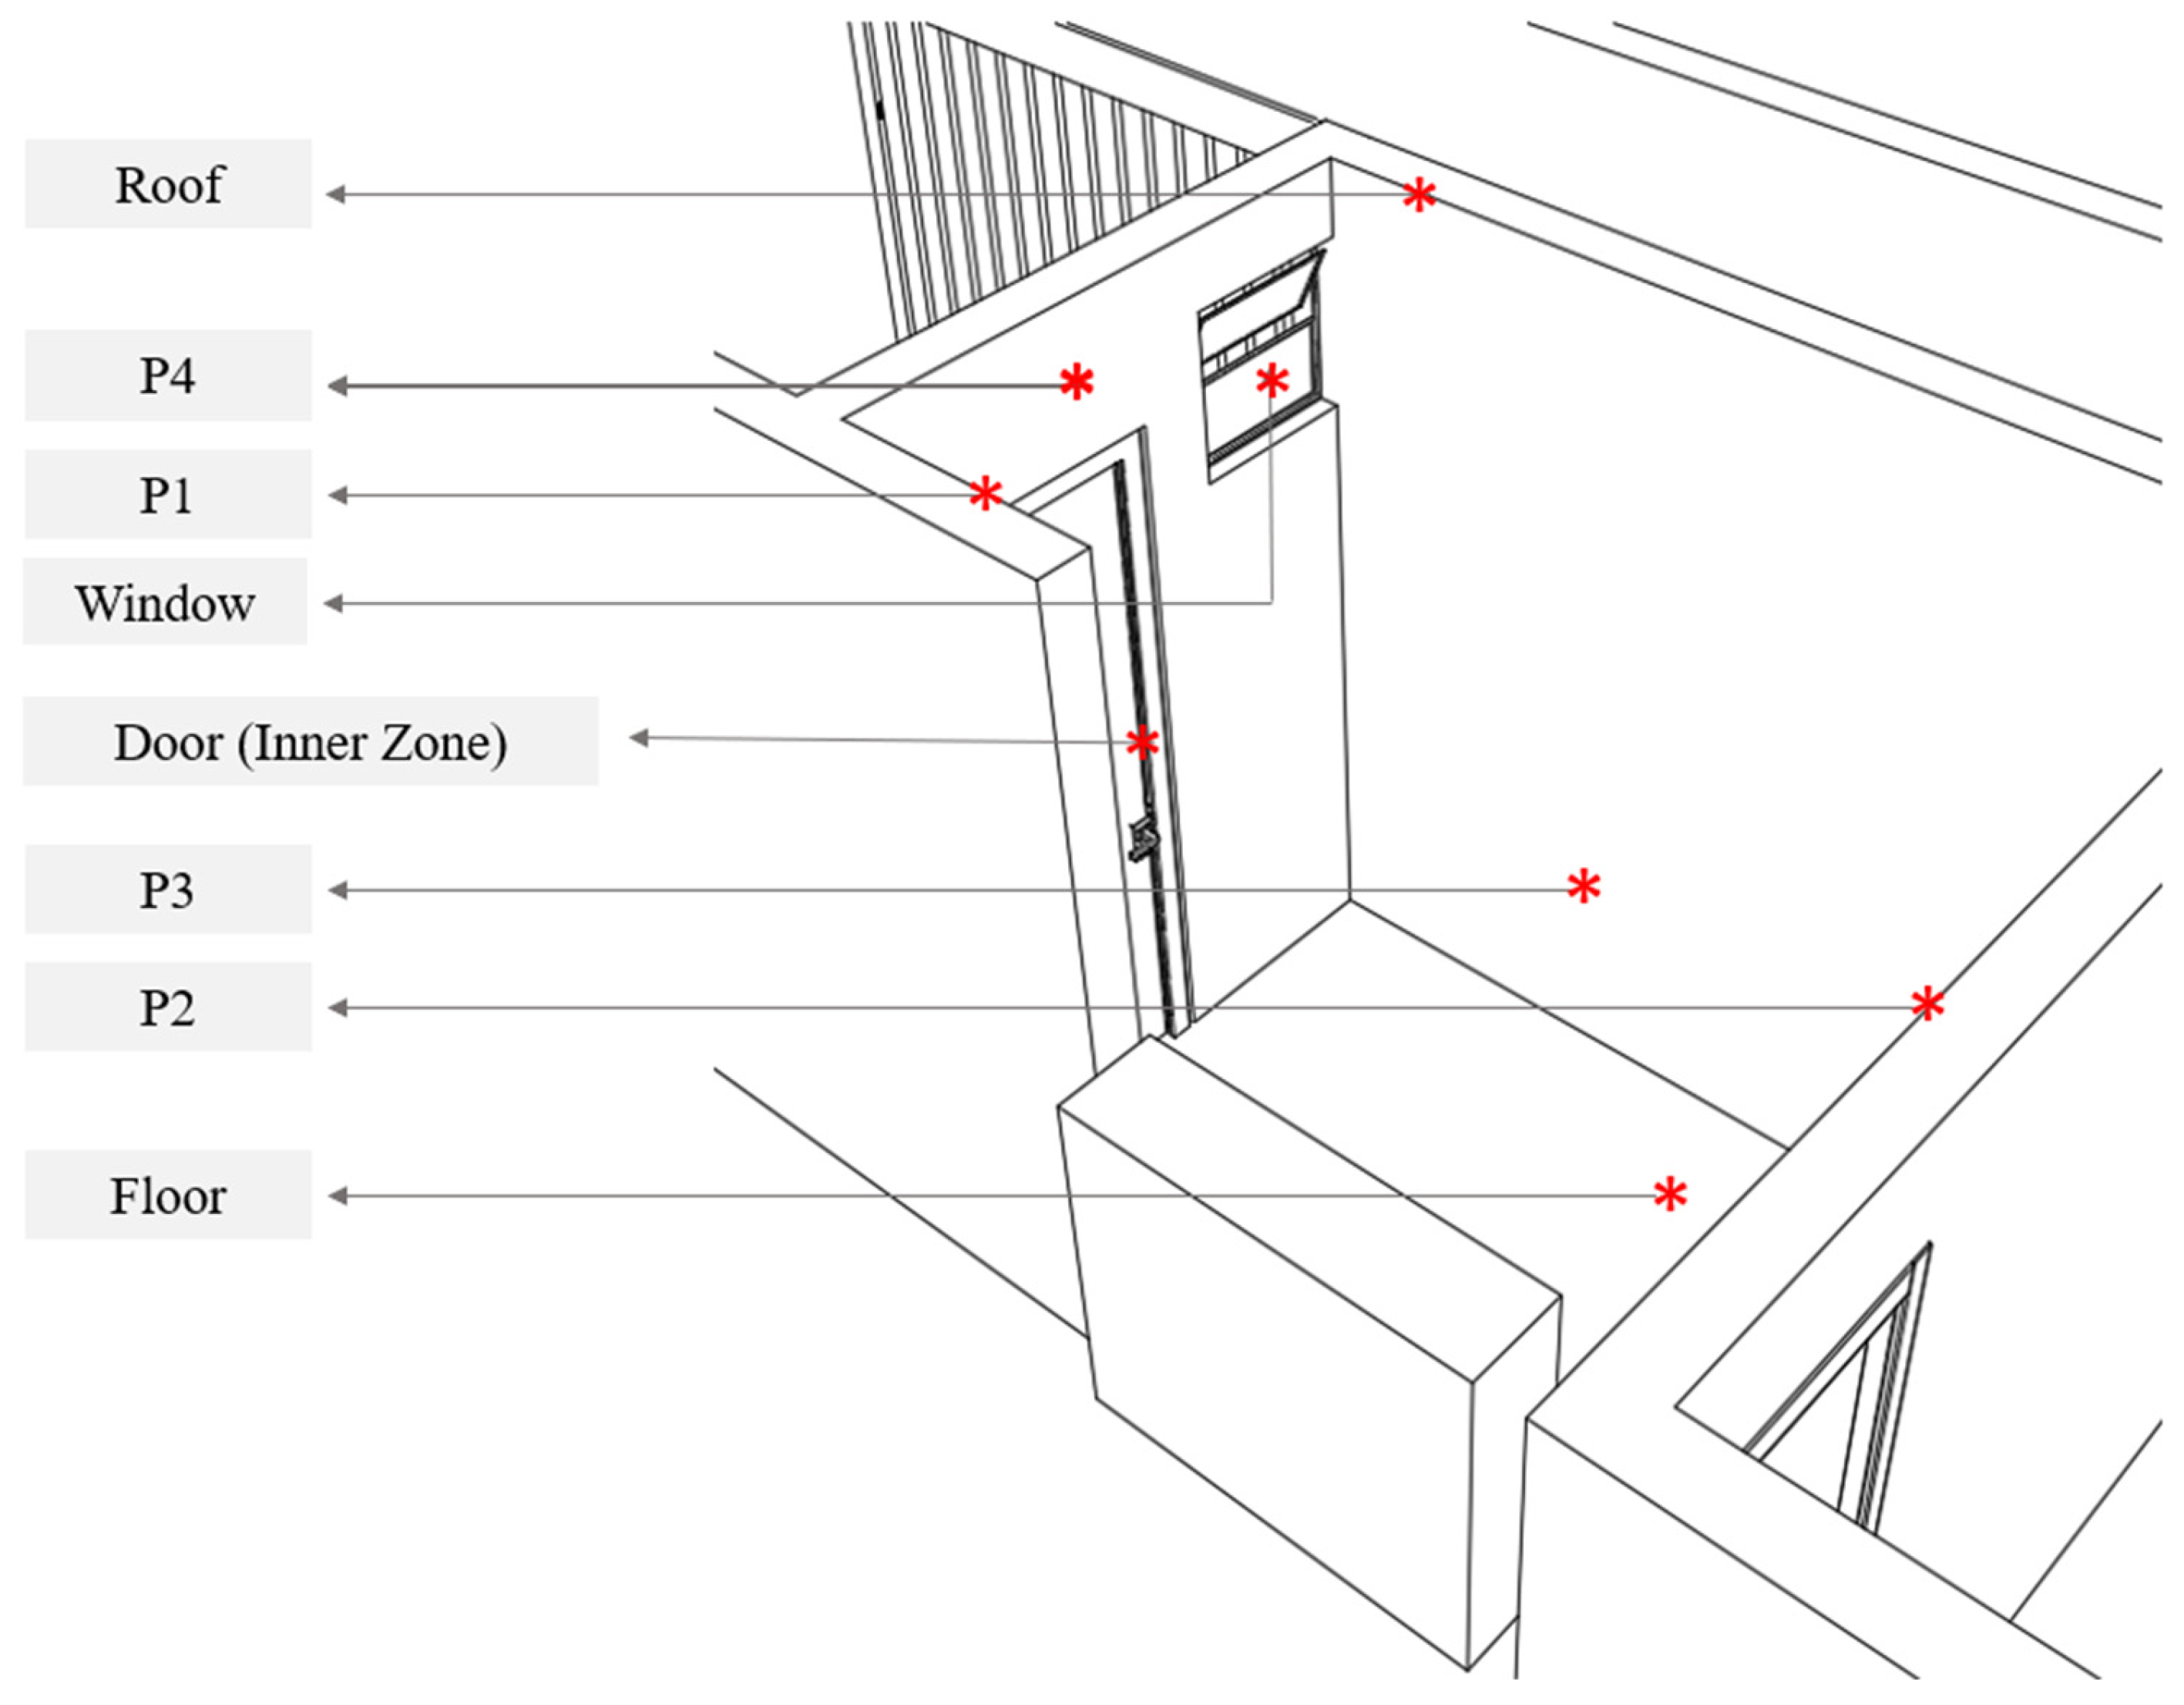
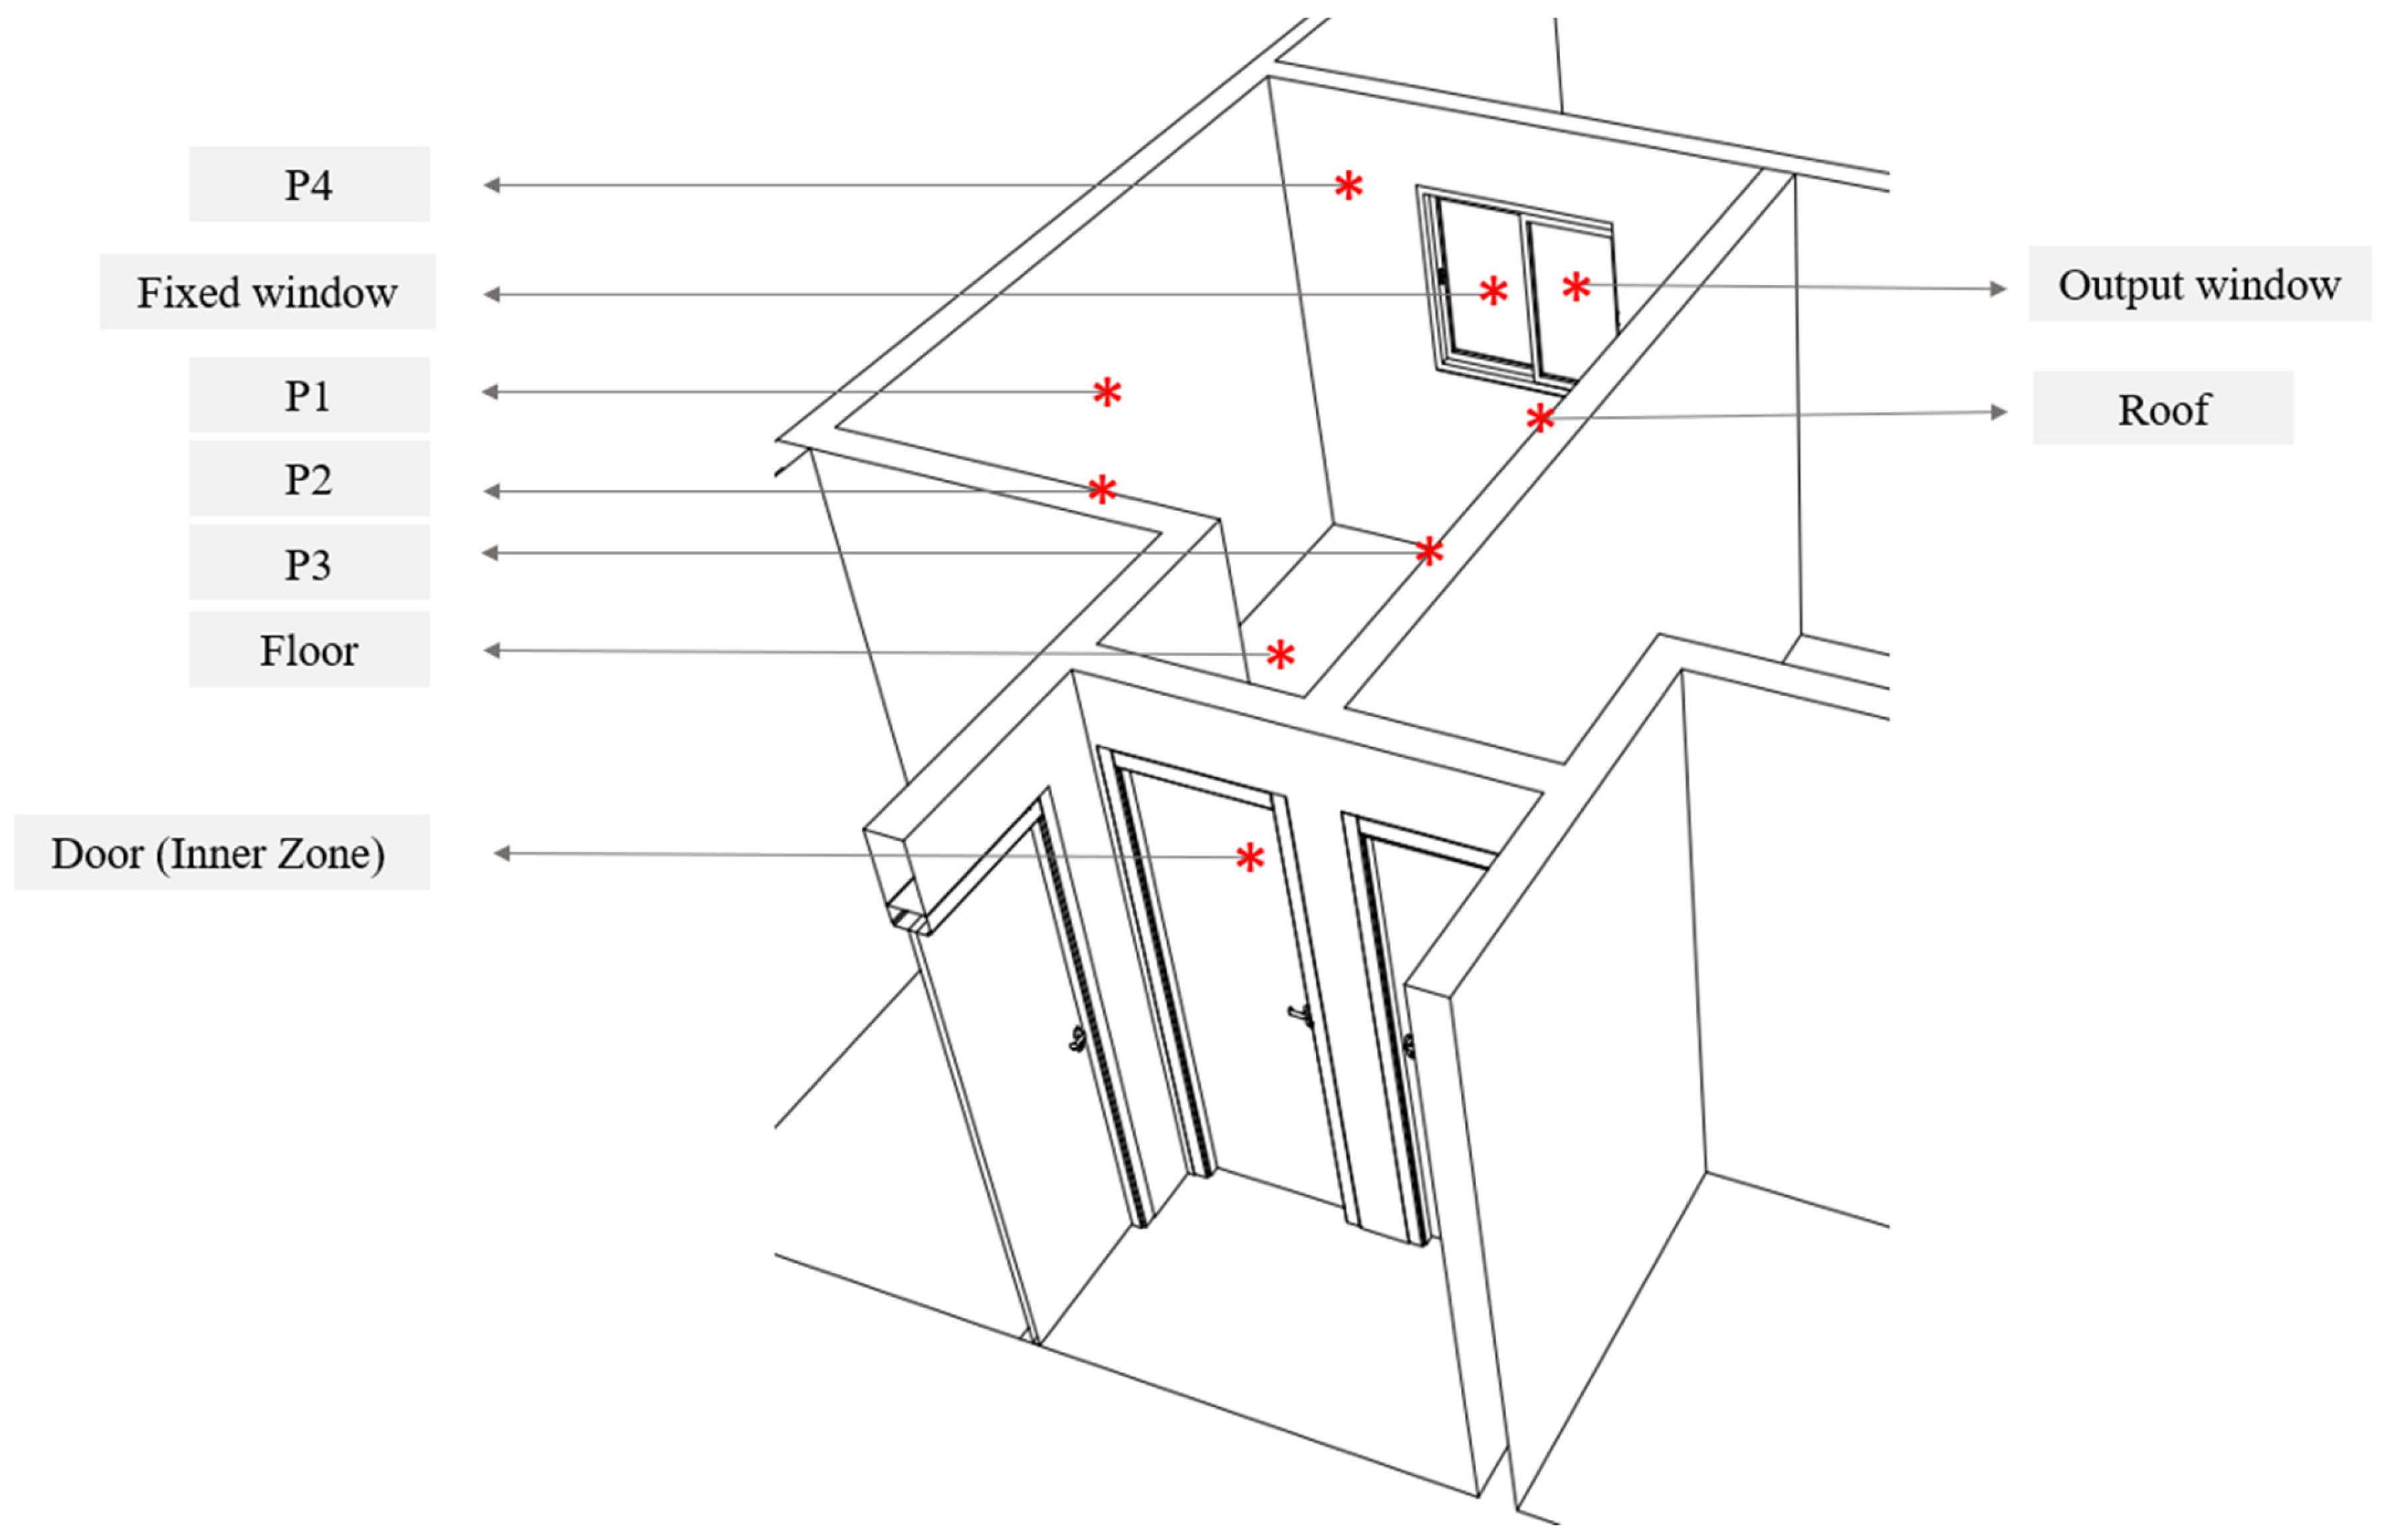
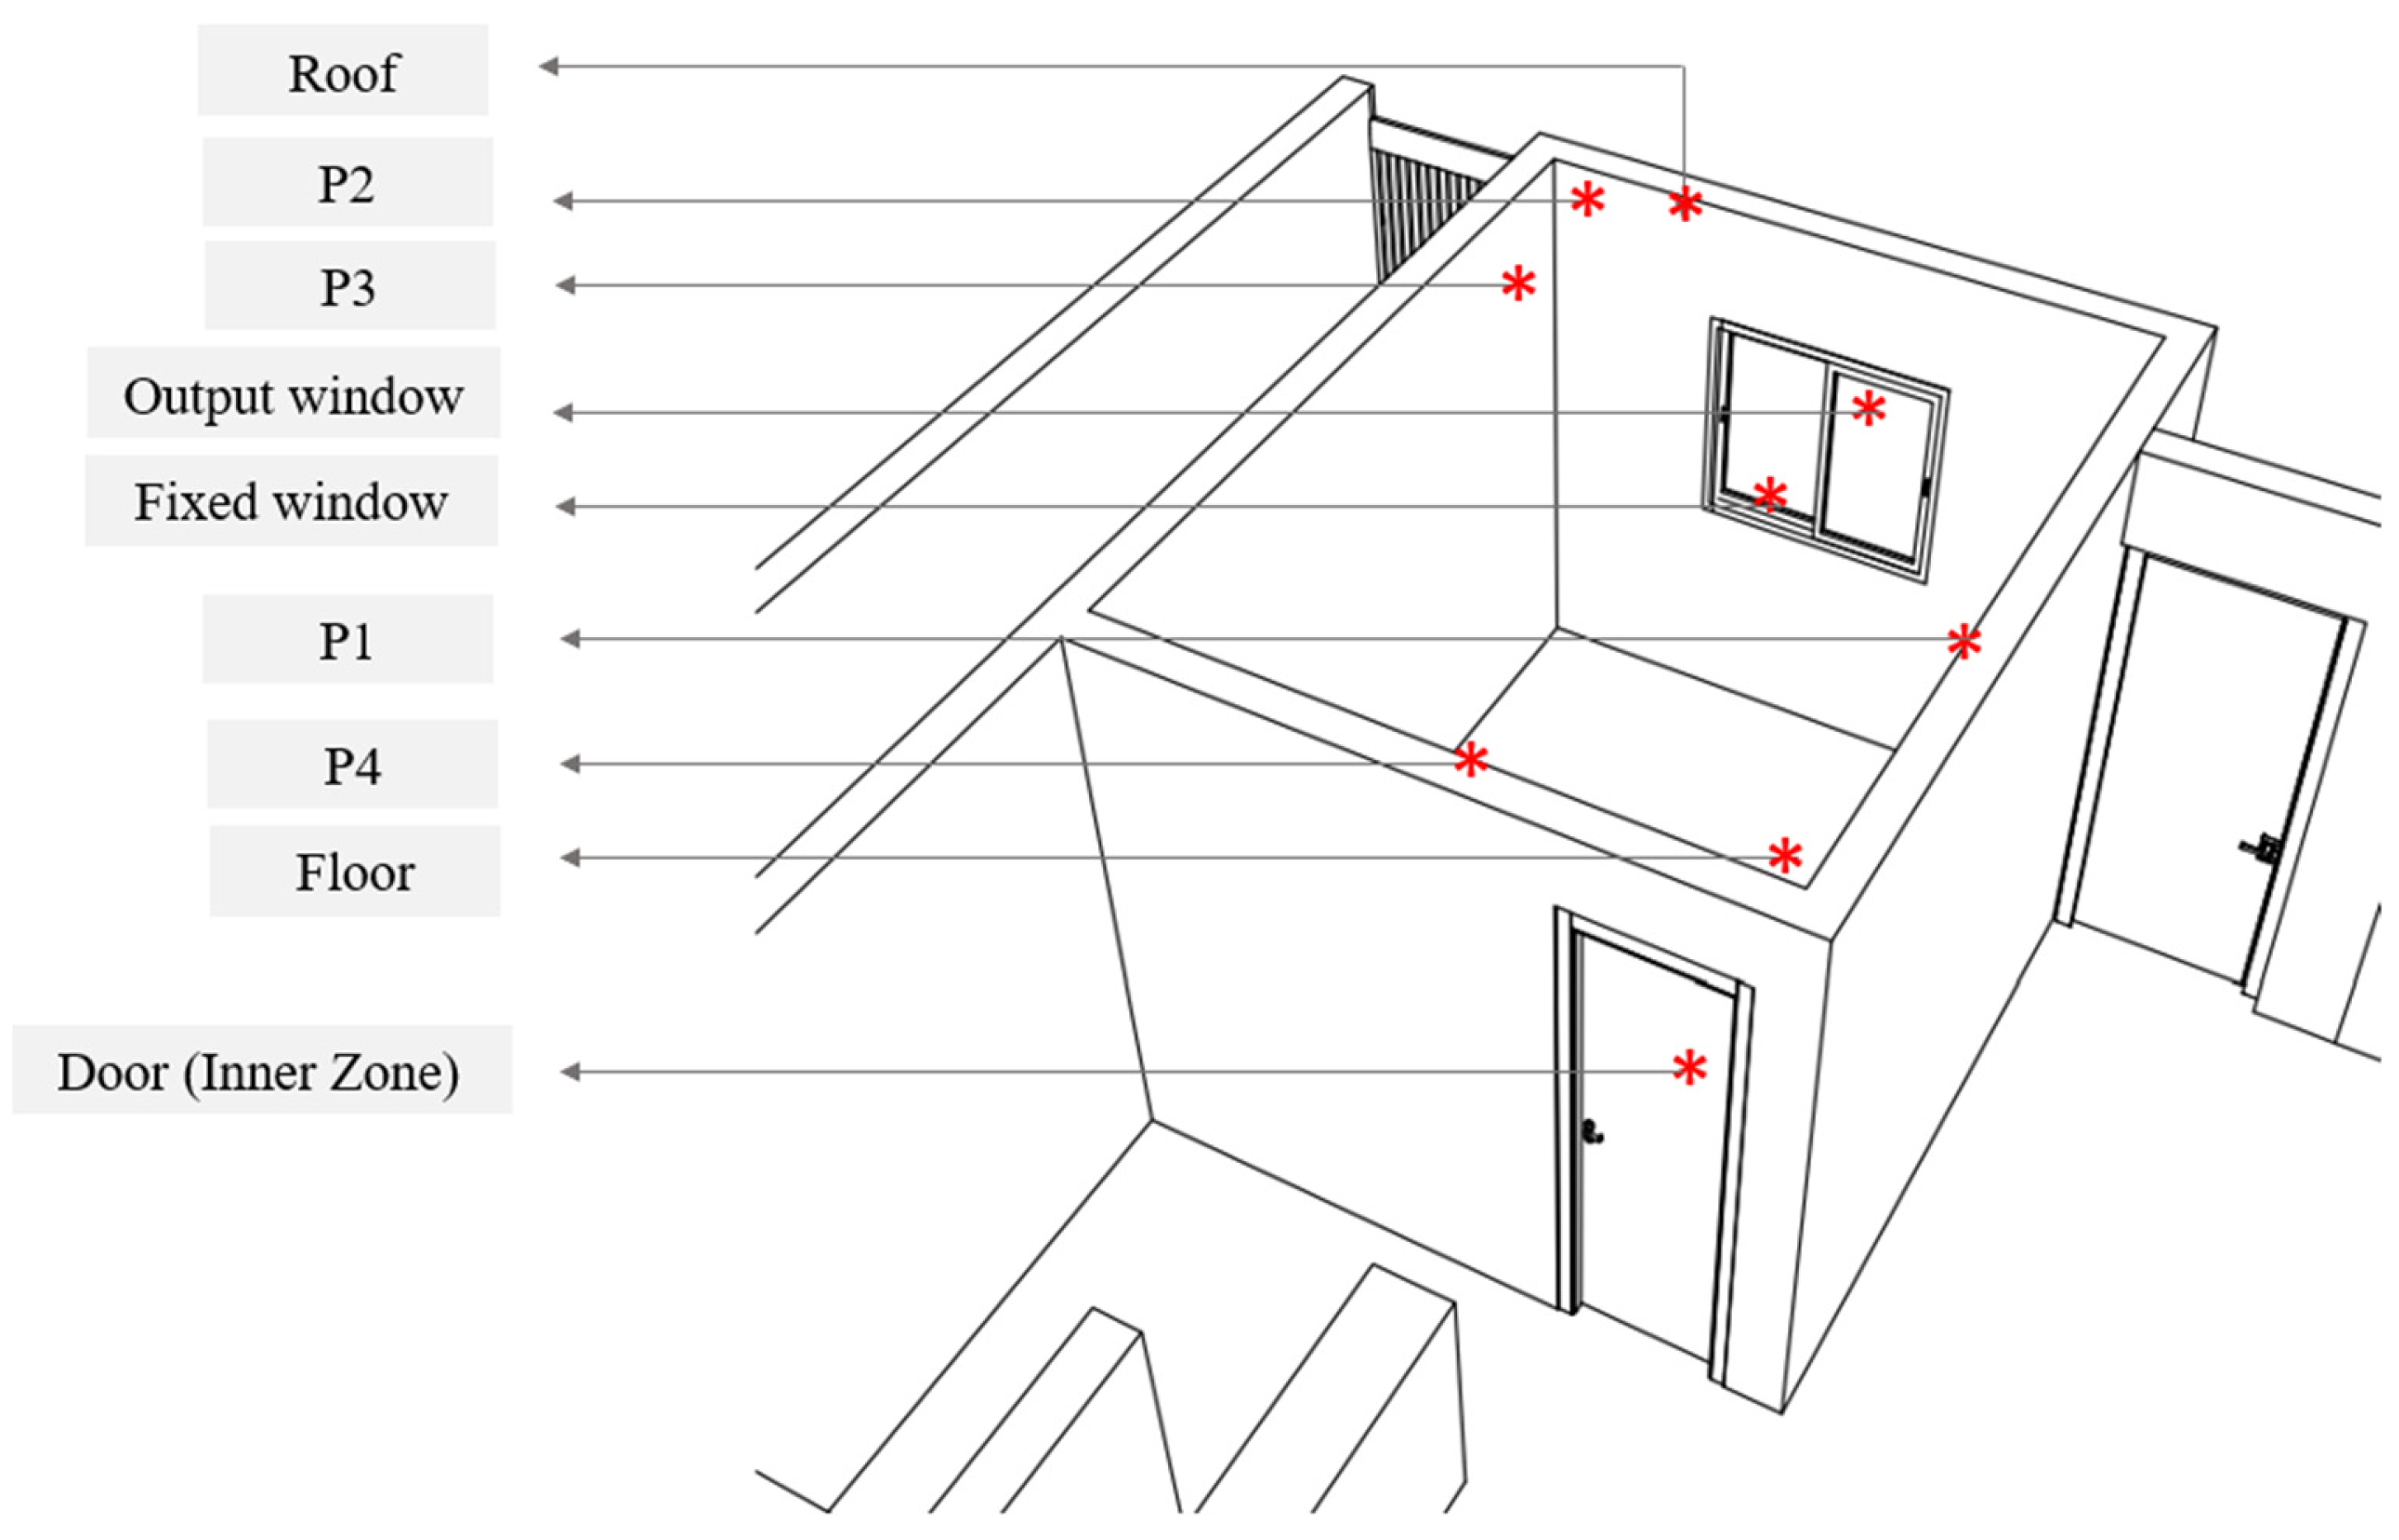
Figure 2 shows the internal details of the building with their respective air inlets and outlets (doors, windows, and opening skylight), which were important for understanding the fluid dynamics inside the building. In each environment, the following experimental procedures were performed:
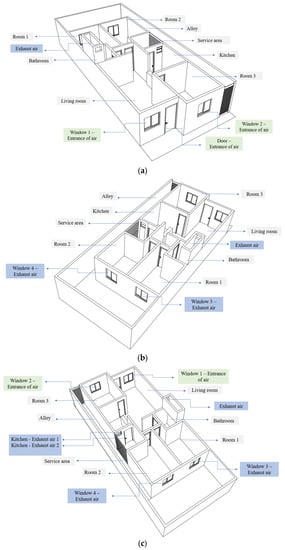
Figure 2.
3D views of the building showing the air inlets and outlets. (a) Front top view, (b,c) Rear top view.
- (a)
- In the integrated room (living and dining room): measurement of the initial condition of temperature and relative humidity of the air in the window opening of the room, using the digital thermohygrometer equipment. The data were confronted with information from the official meteorological data of temperature and relative humidity for the city of Campina Grande, Brazil, presenting results very close to the information collected on site.
- (b)
- Room 01: measurement of the initial conditions of temperature and relative humidity. The infrared thermometer equipment was directed to all the walls of the room, obtaining approximate values.
- (c)
- Room 02: a digital thermohygrometer was used to measure the air inlet and outlet conditions (temperature and relative humidity). The infrared thermometer was positioned on all the walls of the room, presenting results with small variations.
- (d)
- Room 03: Temperature and relative humidity were measured. It was verified that the air temperature was higher in the window opening than inside the room.
- (e)
- Living room: In this space, as described in the other rooms of the residence, a digital thermohygrometer was used to verify the initial temperature and relative humidity conditions.
The influence of external obstacles to the building was verified, capable of changing the air velocity inside the room space, such as wall/grid. For this reason, it was decided to wait five minutes for the results to stabilize, since the velocity values presented peaks; therefore, the average of the values obtained was performed.
- (a)
- Bathroom: environment with a single air outlet, via an opening skylight.
- (b)
- Alley (side setback): with the anemometer equipment, positioned close to the entrance (approximately 2 cm), the air velocity was measured, and the values obtained at that point were averaged. As it is an area without coverage, the temperature presented a value higher than that found inside the building.
- (c)
- Services Area: the air inlet and outlet conditions (temperature, velocity, and relative humidity) were verified.
- (d)
- Leisure area (rear yard setback): as it is an open environment, the air velocity was measured in the bedroom windows, pointing the anemometer from the outside towards the inside of the environment. With the infrared thermometer, the temperature of the walls was verified, which showed a high value due to the time of day (12:22 p.m.) and for receiving direct incidence of solar radiation.
2.2. Theoretical Procedures
2.2.1. Geometry and the Physical and Computational Domains
The physical domain of the present research consists of an existing and consolidated house, which presents constructive standardization and orientation that disregards the environmental conditions of the site. The purpose of this geometry is to study the fluid flow inside the house and the heat exchange with the walls of the building (Figure 1 and Figure 2).
The numerical mesh (computational domain) consists of the three-dimensional partition of the geometry of the physical domain. These partitions are called mesh elements or control volumes, where the conservation equations of the physical problem will be solved, reproducing, in a numerical environment, the transport phenomena that characterize the air and heat flows, and the consequent distributions of velocity, temperature, and relative humidity of this fluid, inside the house.
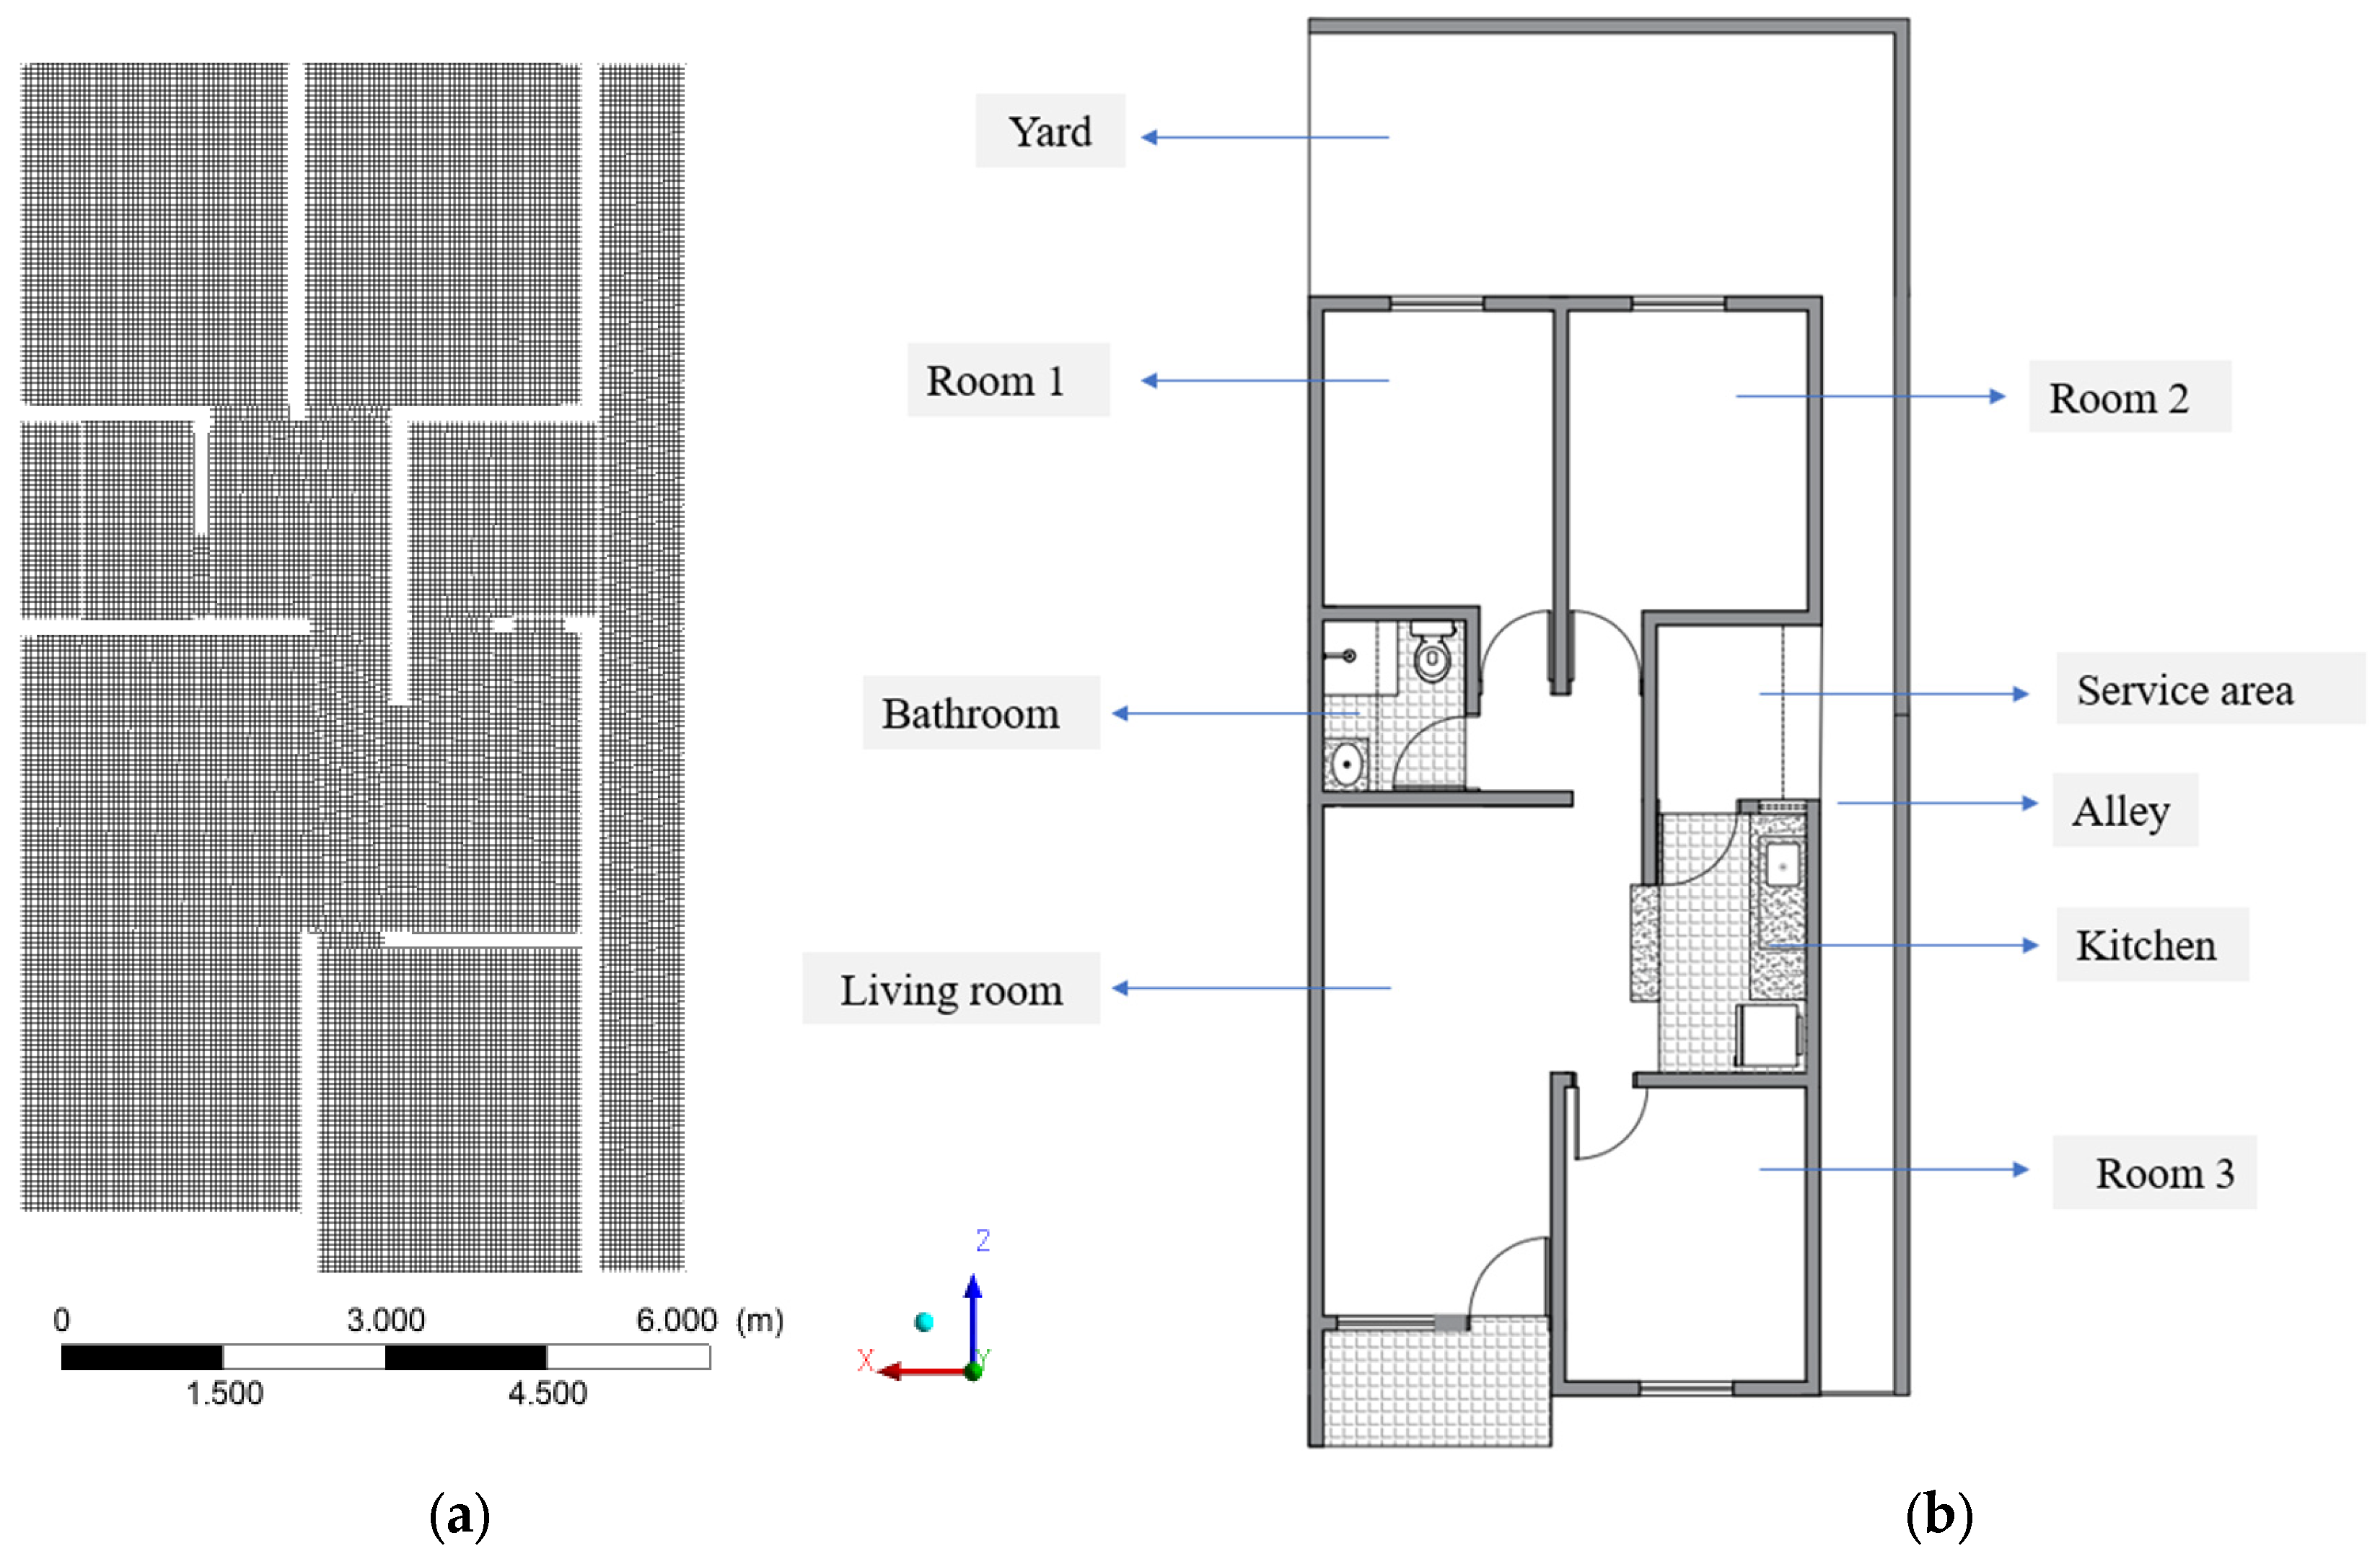
The meshes were built with hexahedral elements within the Ansys Meshing software. A geometry partition technique was used in connection with the mesh elements to maintain maximum uniformity of the elements, which increases the quality of the CFD results. Figure 3 and Figure 4 illustrate the meshes used to treat the physical problem. In Figure 3, the floor plan shows the mesh and the technical drawing, where the environments are described.
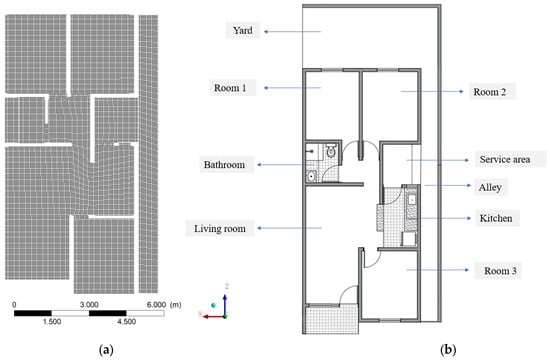
Figure 3.
Plan of the building. (a) Mesh and (b) floor.
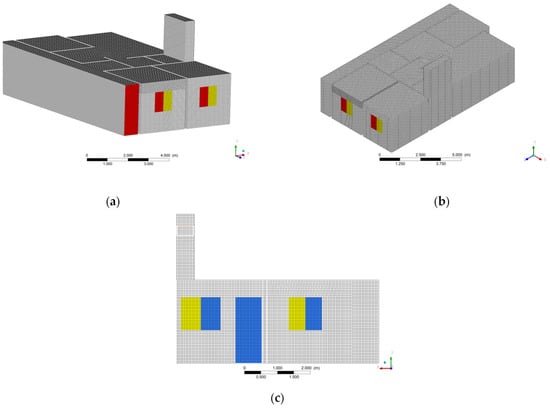
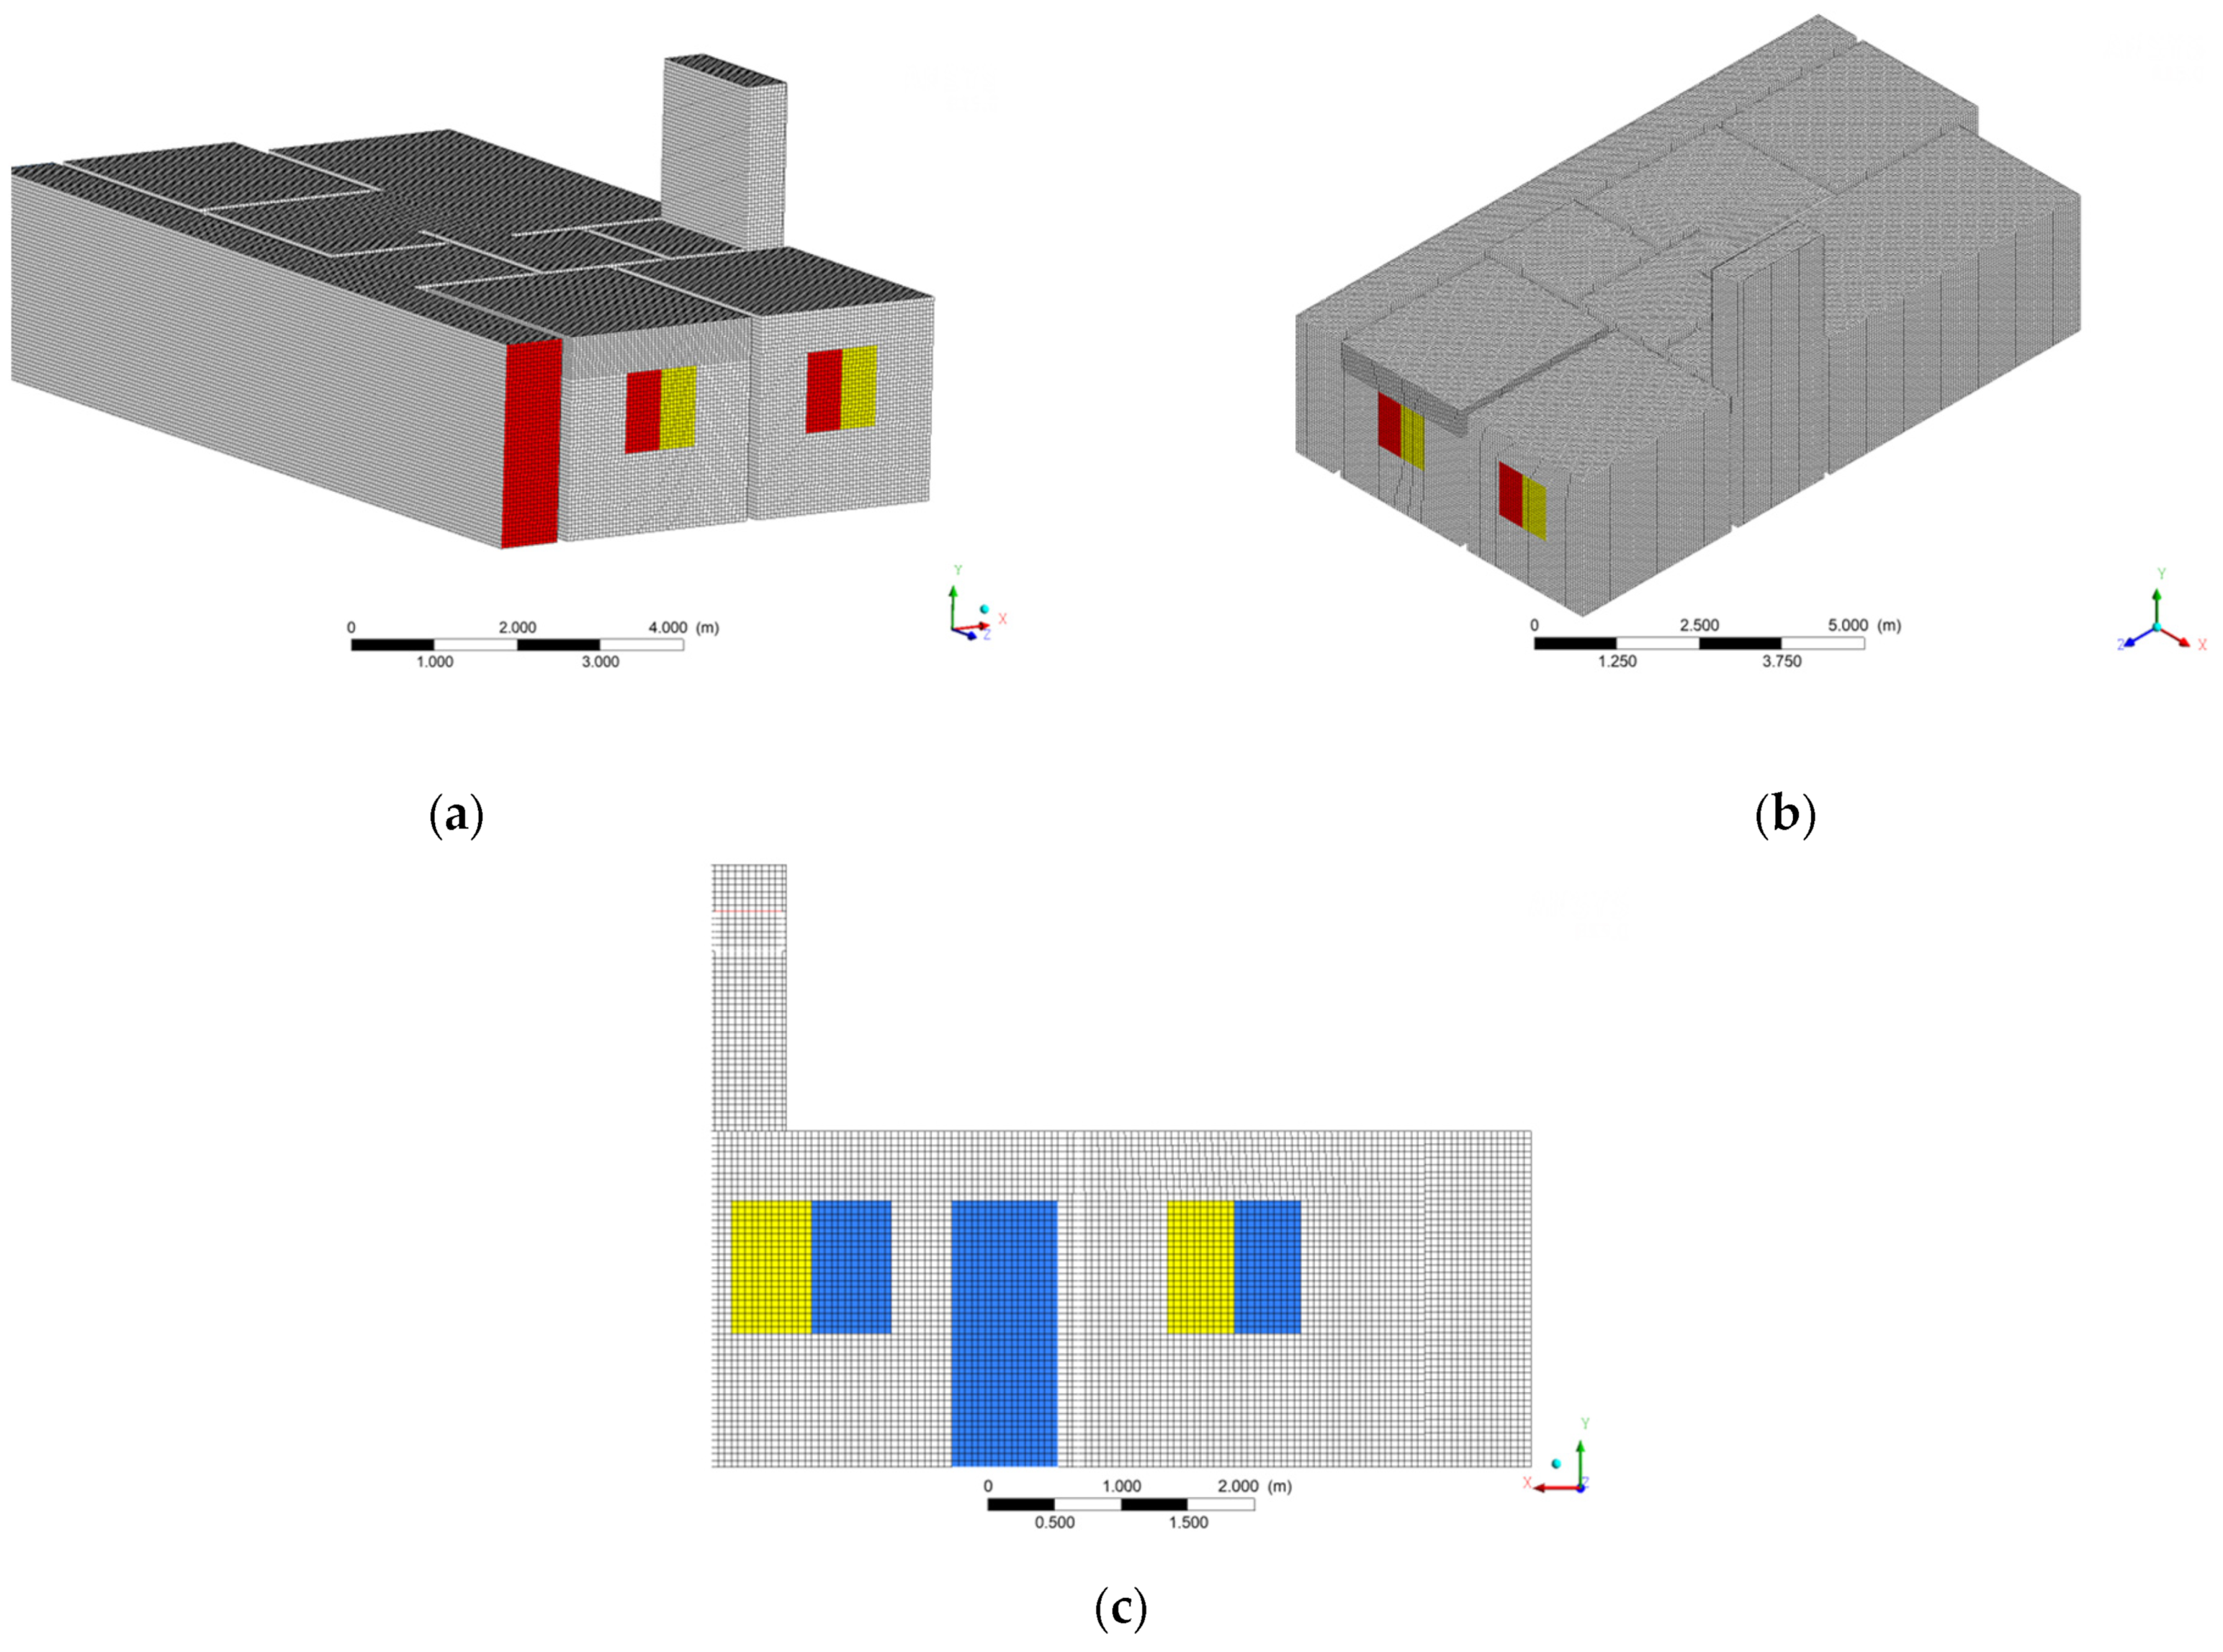
Figure 4.
Three-dimensional hexahedral mesh of the building. (a) Rear view, (b) rear view, and (c) section that crosses the building on its main facade.
In Figure 4, there is a three-dimensional hexahedral mesh with the front (a) and back views of the building (b), in addition to a section that crosses it on its main facade (c). The faces in blue represent the air inlets (doors and windows) and in red the air outlets. The faces of the windows highlighted in yellow were considered as wall was considered.
In Table 1, the numbers of mesh elements are represented. The mesh quality indicators of all meshes are within the limit recommended by Ansys [20], with skewness values below 0.95 and orthogonality values above 0.1.

Table 1.
Constructed meshes and their respective number of elements.
After the meshes were built, a refinement study was done. From this study, the mesh 3 was chosen due to its convergence, accuracy of the results obtained, and computational effort.
2.2.2. Mathematical Formulation
In the physical problem to be described, there is a need to analyze 3 (three) physical aspects: the fluid dynamics of the air that circulates in the house, the temperature distributions developed in the rooms of the residence, and the distributions of relative humidity. For that, the models of conservation of mass, linear momentum, energy, and species transfer were used, in addition to the realizable k–ε turbulence model.
To obtain the RANS equations, it is necessary to decompose the flow variables of the Navier–Stokes equations, in terms of temporal averages and fluctuating components, as described in Equation (1), for a generic variable .
where is the time-average component and represents the fluctuations of this variable. Thus, we have the following conservation equations for turbulent flows.
- (a)
- Continuity
- (b)
- Momentum
- (c)
- Turbulence
To describe the turbulent phenomena, the k–ε turbulence model was used, which allows the determination of turbulence, in length and time scales, solving two transport equations separately. This model was chosen after a careful study using different turbulent models. These equations describe the conservation of turbulent kinetic energy (k) and the turbulence dissipation rate (ε). The transport equation model for k is derived from an exact equation, while the transport equation model for ε was obtained using physical considerations and bears little resemblance to its mathematically exact counterpart. In the derivation of the k–ε model, it is assumed that the flows are completely turbulent and the effects of molecular viscosity are neglected. The transport equations are described as follows:
and
In these equations, represents the generation of turbulent kinetic energy due to time-averaged gradients, is the generation of turbulence due to gravitational effects, and represents the contribution due to density variations relative to compressible flows. The terms , , and are model constants. and are the turbulent Prandtl numbers for the variables k and ε, respectively. and are the source terms of the respective equations.
Turbulent viscosity is defined as:
where is a constant. The model constants used were the following: and .
- (d)
- Energy
To model the heat transfer between the fluid and the walls of the house, as well as inside the fluid itself, the energy model used by Ansys FLUENT® 15.0 was applied, which deals with energy conservation as follows:
where is temperature, is the energy source term, (Equation (8)) is the total energy, and is the effective thermal conductivity.
where is sensible enthalpy defined by:
where , , and are the reference enthalpy, the reference temperature, and the specific heat of the fluid at constant pressure. In the software’s default mode, and are taken as 0 J/kg and 15 °C, respectively.
The effective thermal conductivity is given by:
where
The term is the shear stress tensor given by:
where
- (e)
- Species Transfer
To calculate the relative humidity of the air, the model of chemical species was used in the scope of the software Ansys Fluent. This model treats the fluid (air) as a mixture of three types of chemical species, namely, nitrogen, oxygen, and water vapor, which are treated in terms of mass fractions.
Mass fraction is defined as the mass of the respective component or species involved in a mixture, divided by the total mass of the mixture. In this way, we have:
where is the mass fraction of one of the components in the mixture.
In this way, the species transport model calculates the balance of the local mass fractions of N-1 chemical species contained in the studied fluid through the solution of the convection–diffusion equation, described as follows:
where is the production rate of that species by chemical reactions and is the rate of creation of the species by addition from the dispersed phase. This equation is solved for N-1 species, since the mass fractions calculated in the mesh element will have the sum equal to unity.
In turbulent flows, the species transfer model computes the mass transport (diffusion) of that species as:
where is the mass diffusion coefficient of species i in the mixture, is the thermal diffusion coefficient, and is the turbulent viscosity. is the Schmidt number for turbulent flows given as follows:
where is the effective mass diffusion coefficient, due to turbulence.
Regarding the energy aspect of the problem, the enthalpy transport related to energy conservation considers the sum of the enthalpies of each species weighted by their respective mass diffusions, as follows.
Treating air as a mixture of water vapor and other gases, is defined as the mass of water vapor and being the sum of the masses of the other gases involved. Thus, the absolute humidity of the air is defined as:
In terms of mass fraction one can write:
The vapor pressure of water in the air, the saturation pressure of water, and the relative humidity of the air are determined as follows:
The following considerations were adopted:
- (a)
- Thermophysical properties of the air are variables with the temperature.
- (b)
- Simulation was carried out without the presence of furniture and others components and physical interference of residents inside the house.
2.2.3. Boundary Conditions
- (a)
- Inlet
- -
- Prescribed Velocity (Inlet Velocity)
This type of boundary condition is used to define the flow velocity, with respect to the relevant scalar properties at the mesh inputs. In such cases, the stagnation pressure is not fixed but will increase in response to the computed static pressure and as a function of the fluid inlet velocity.
- (b)
- Outlet
- -
- Prescribed mass flow
The mass flow at the outlets of the house was defined, based on the velocity values that were measured. For the prescribed velocity conditions, the mass flow specification allows the total pressure to vary in response to the numerical solution. In this boundary condition, the absolute reference system, the flow direction (normal to the inlet surface), the turbulence intensity I = 5% (Equation (24)), and the turbulent viscosity ratio (Equation (25)).
where is the inlet velocity fluctuation and the average velocity.
- -
- Prescribed pressure
This boundary condition was applied to the alley exit. It only requires the gauge pressure at the outlet to be set. Such pressure values were maintained at zero Pa, that is, ambient pressure. The pressure difference between the air inlets and outlets of the house, at atmospheric pressure, drives the air flow inside the house.
- (c)
- Walls
Wall conditions are used to bridge the fluid and solid regions. Nonslip boundary conditions were applied to the walls of the house, which are taken as stationary surfaces with negligible roughness.
As for the heat transfer, boundary conditions of the first kind were applied, prescribing the temperatures of the walls. These were experimentally measured, and their average values were defined on each surface of the house. For the internal surfaces that separate the rooms from the residence, windows and doors, interior wall conditions (open surface) were used, which allowed the flow of air through these surfaces.
2.2.4. Numerical Solution Techniques
- (a)
- Pressure-velocity coupling COUPLED
In this research, the Coupled algorithm was used to solve the pressure–velocity coupling. In this method, the continuity equations are solved, based on the calculation results of the conservation of linear momentum and pressure, in a coupled form, which gives it a convergence range with a smaller number of iterations when compared to segregated solution algorithms such as SIMPLE. The Coupled algorithm is also more stable than the segregated methods. Therefore, it is recommended to use this algorithm method when the mesh quality is poor, or when several time steps are used to solve a transient problem. It was observed that the time per iteration in a case using the Coupled algorithm is greater than the one related to the SIMPLE algorithm, but it promotes a more accentuated reduction of the error per iteration.
- (b)
- Spatial interpolation
To obtain the numerical solution of the conservation equations presented, it is necessary to discretize or truncate the partial equations, which work within differential limits, in algebraic equations, defined for the finite three-dimensional limits of the numerical grid. Therefore, for the generic variable , we have the discretization of the general transport equation as follows:
where is the general term relating to the physical properties, characteristics of each conservation equation, is the area vector corresponding to the faces (), is the source term per unit volume (), and is the number of faces of the respective cell, in which the conservative equation is analyzed. Knowing the value of the variable in the centroids (c0, c1, …,cn) of the cells and its values () in the faces, it is possible to obtain solutions of the conservation equations, along the physical space. In this research, the Least Squares Cell-Based method [21] was used to determine the gradient, the Quadratic Upwind Implicit Differencing Convective Kinematics (QUICK) method [22] for discretizing the turbulent kinetic energy equations and turbulence dissipation, the second-order Upwind method [23] for the discretization of density, linear momentum, energy and mass fraction equations, and the PRESTO! [20] for pressure discretization.
- (c)
- Relaxation factors
Due to the nonlinearity of the conservation equations, the solver uses relaxation factors to control the changes in the variables, along the iterations performed, both in problems solved in the steady state, and within each time step of the transient cases. As described in Equation (27), the updated value of the generic variable , within the time step, is dependent on the value of the previous iteration , the difference calculated in the iteration ∆Φ and the relaxation factor ζ. These factors are inserted into the conservation equations and promote stability in their solution. The relaxation factors used in the SIMPLE and Coupled pressure–velocity coupling methods are illustrated in Table 2.

Table 2.
Relaxation factors used in the simulations.
- (d)
- Convergence criteria
The convergence criteria used in the simulations are described in Table 3, below:

Table 3.
Convergence criteria used in each simulation.
2.2.5. Studied Cases
After the construction of the numerical mesh, the definition of the mathematical modeling and the experimental measurements in the residence, which were used as a boundary condition, the preprocessing was carried out. This information was entered into the Ansys Fluent software to perform the simulation process. To facilitate the operation of the Software, the air flow in the house was first simulated, so that, after reaching the steady state, the obtained results could be used as an initial condition for simulation in the transient state, with the species and energy models. In the simulations, Sct = 0.7 was used, which is the software standard. Table 4 describes the conditions of the case studied.

Table 4.
Details of the case studied in this research.
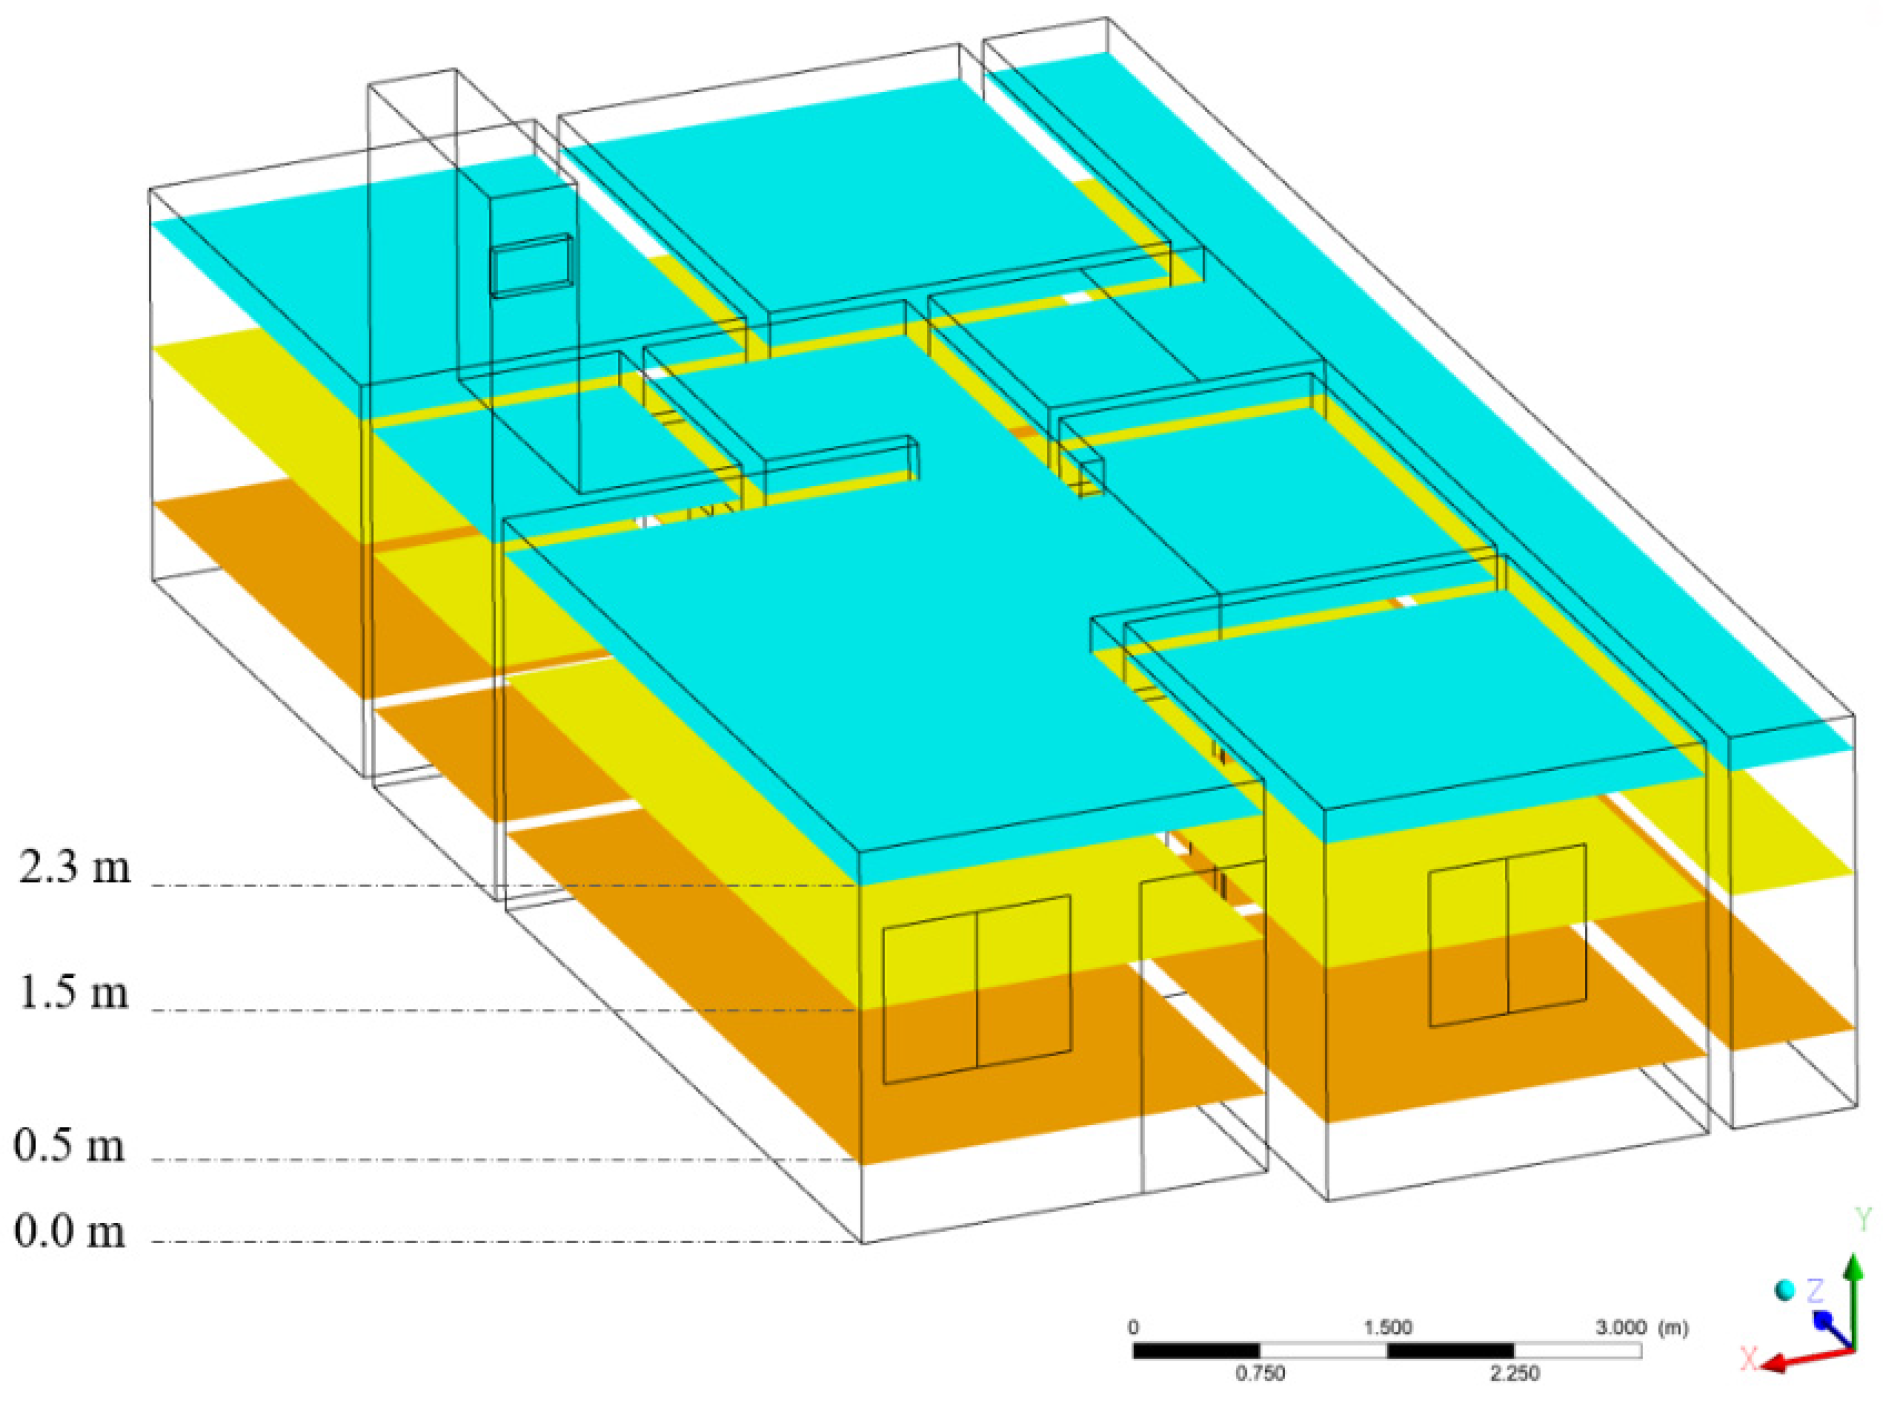
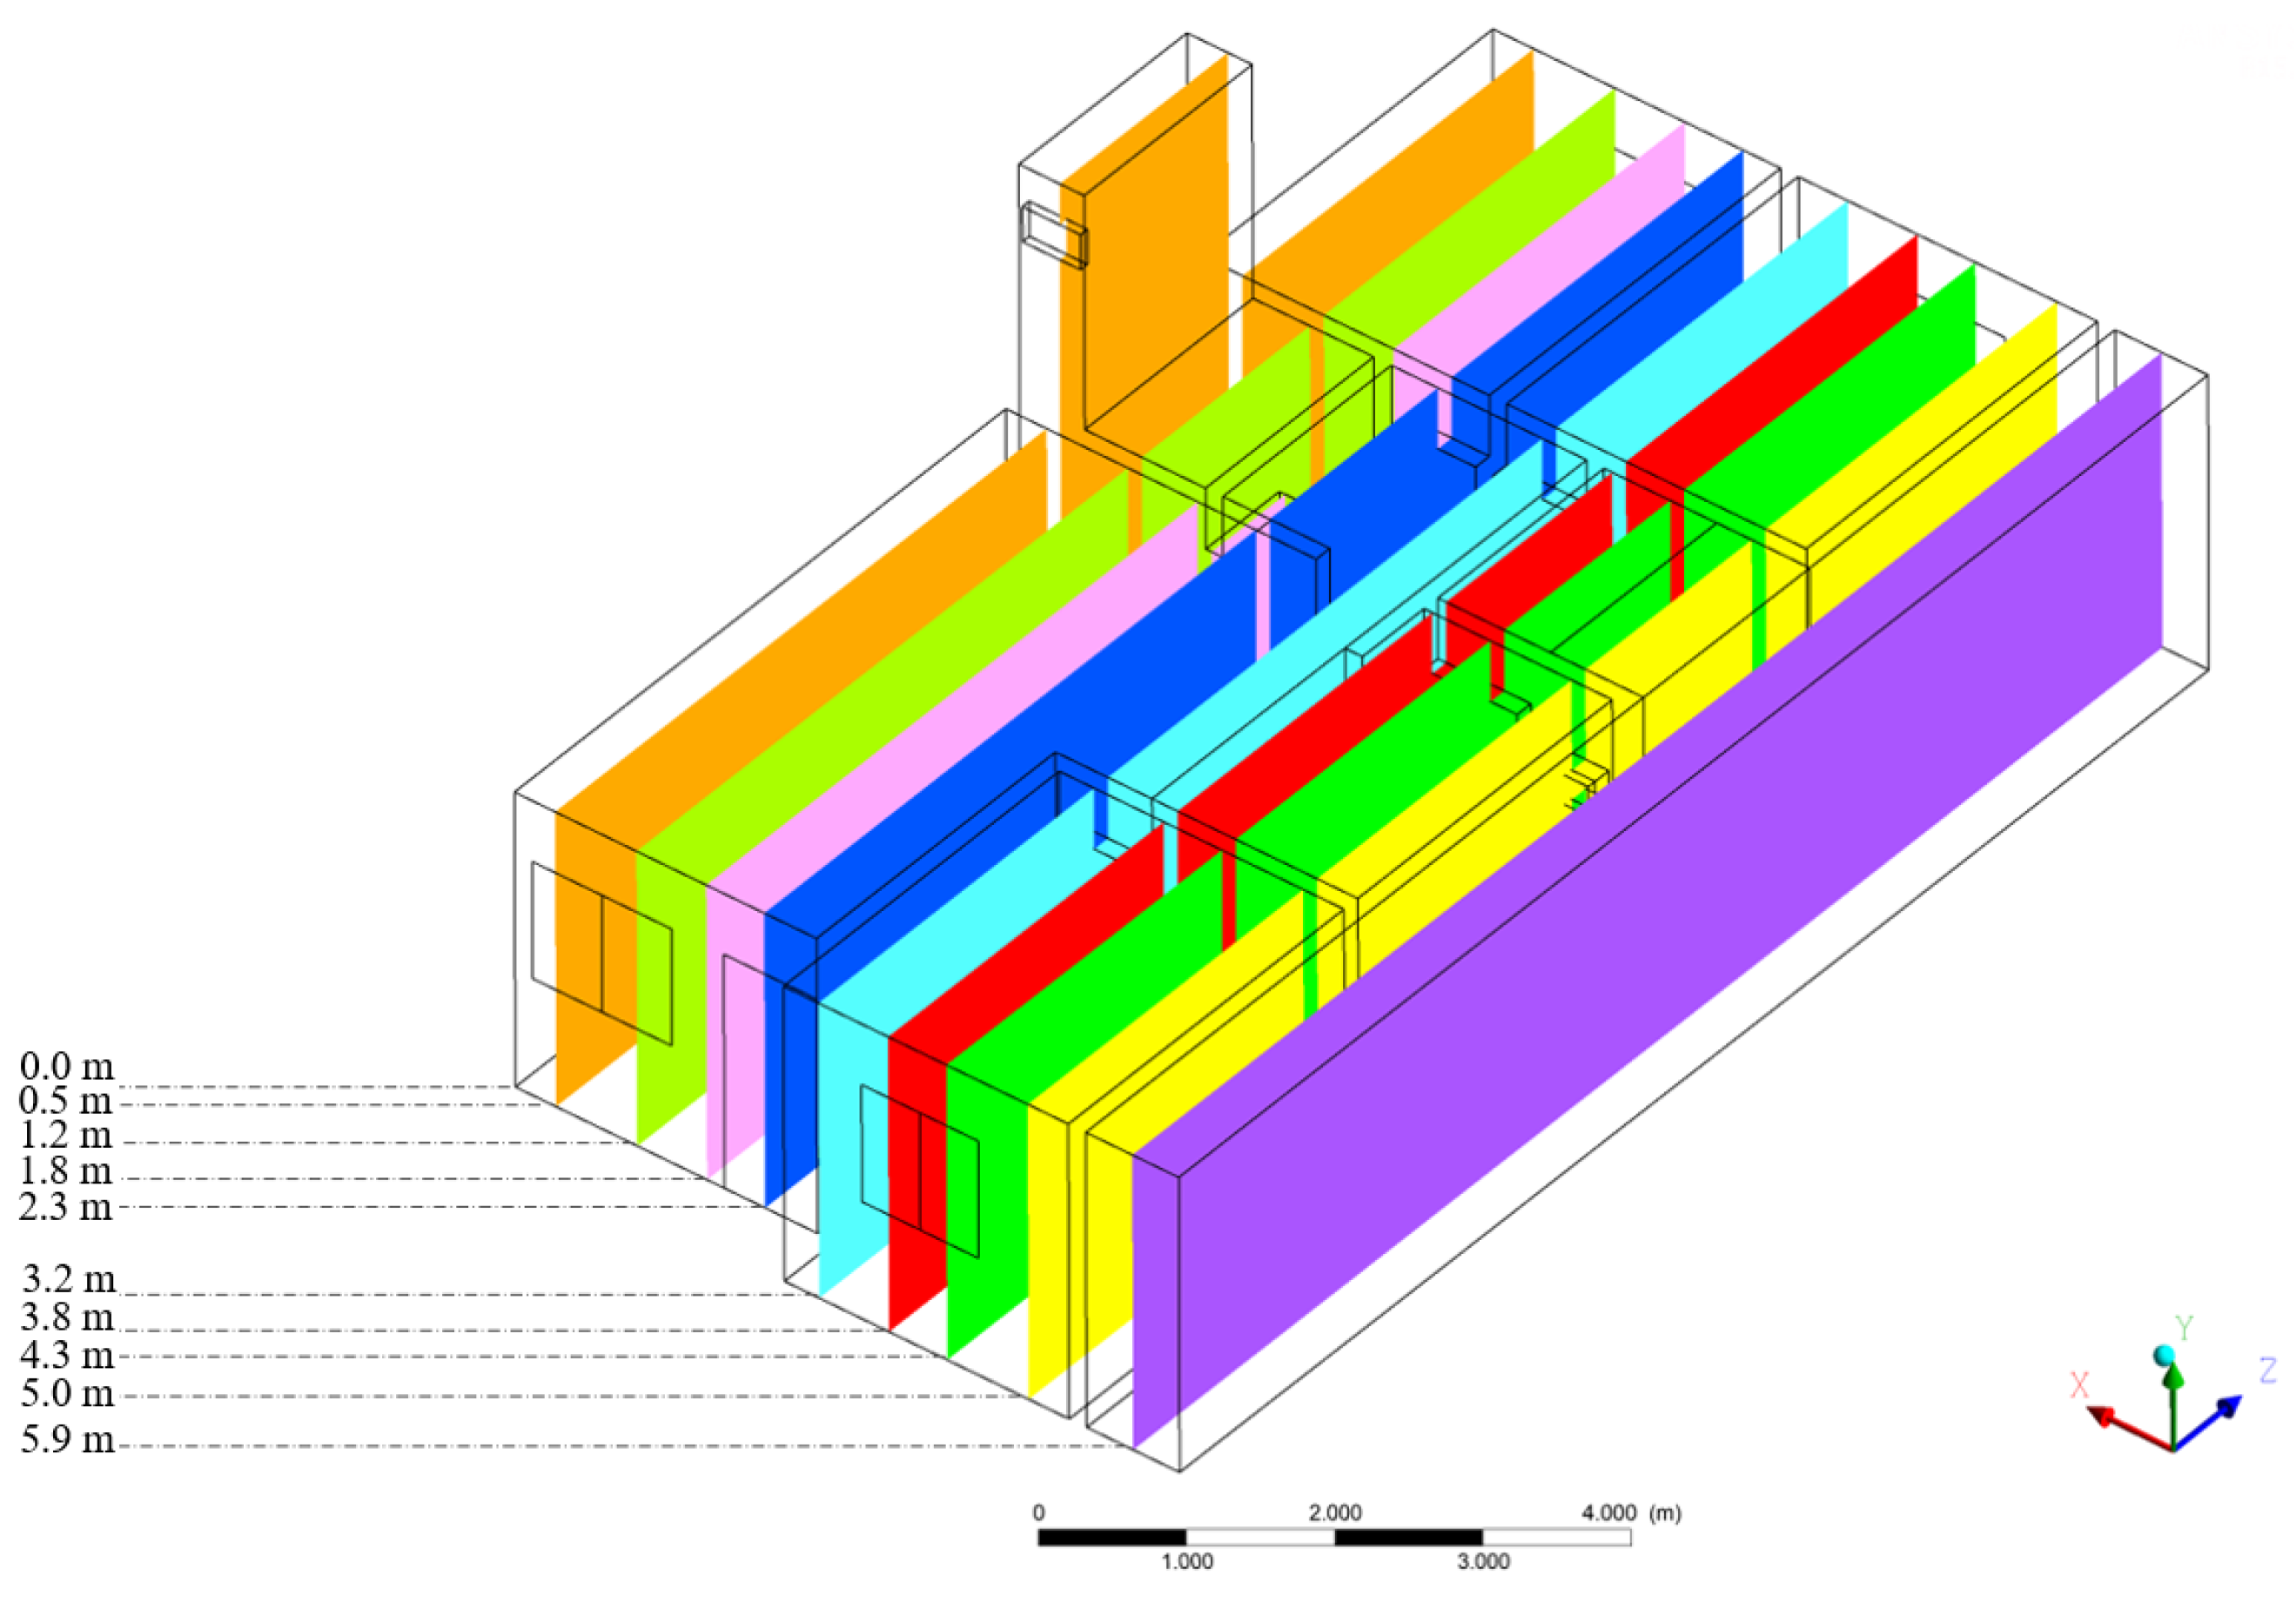
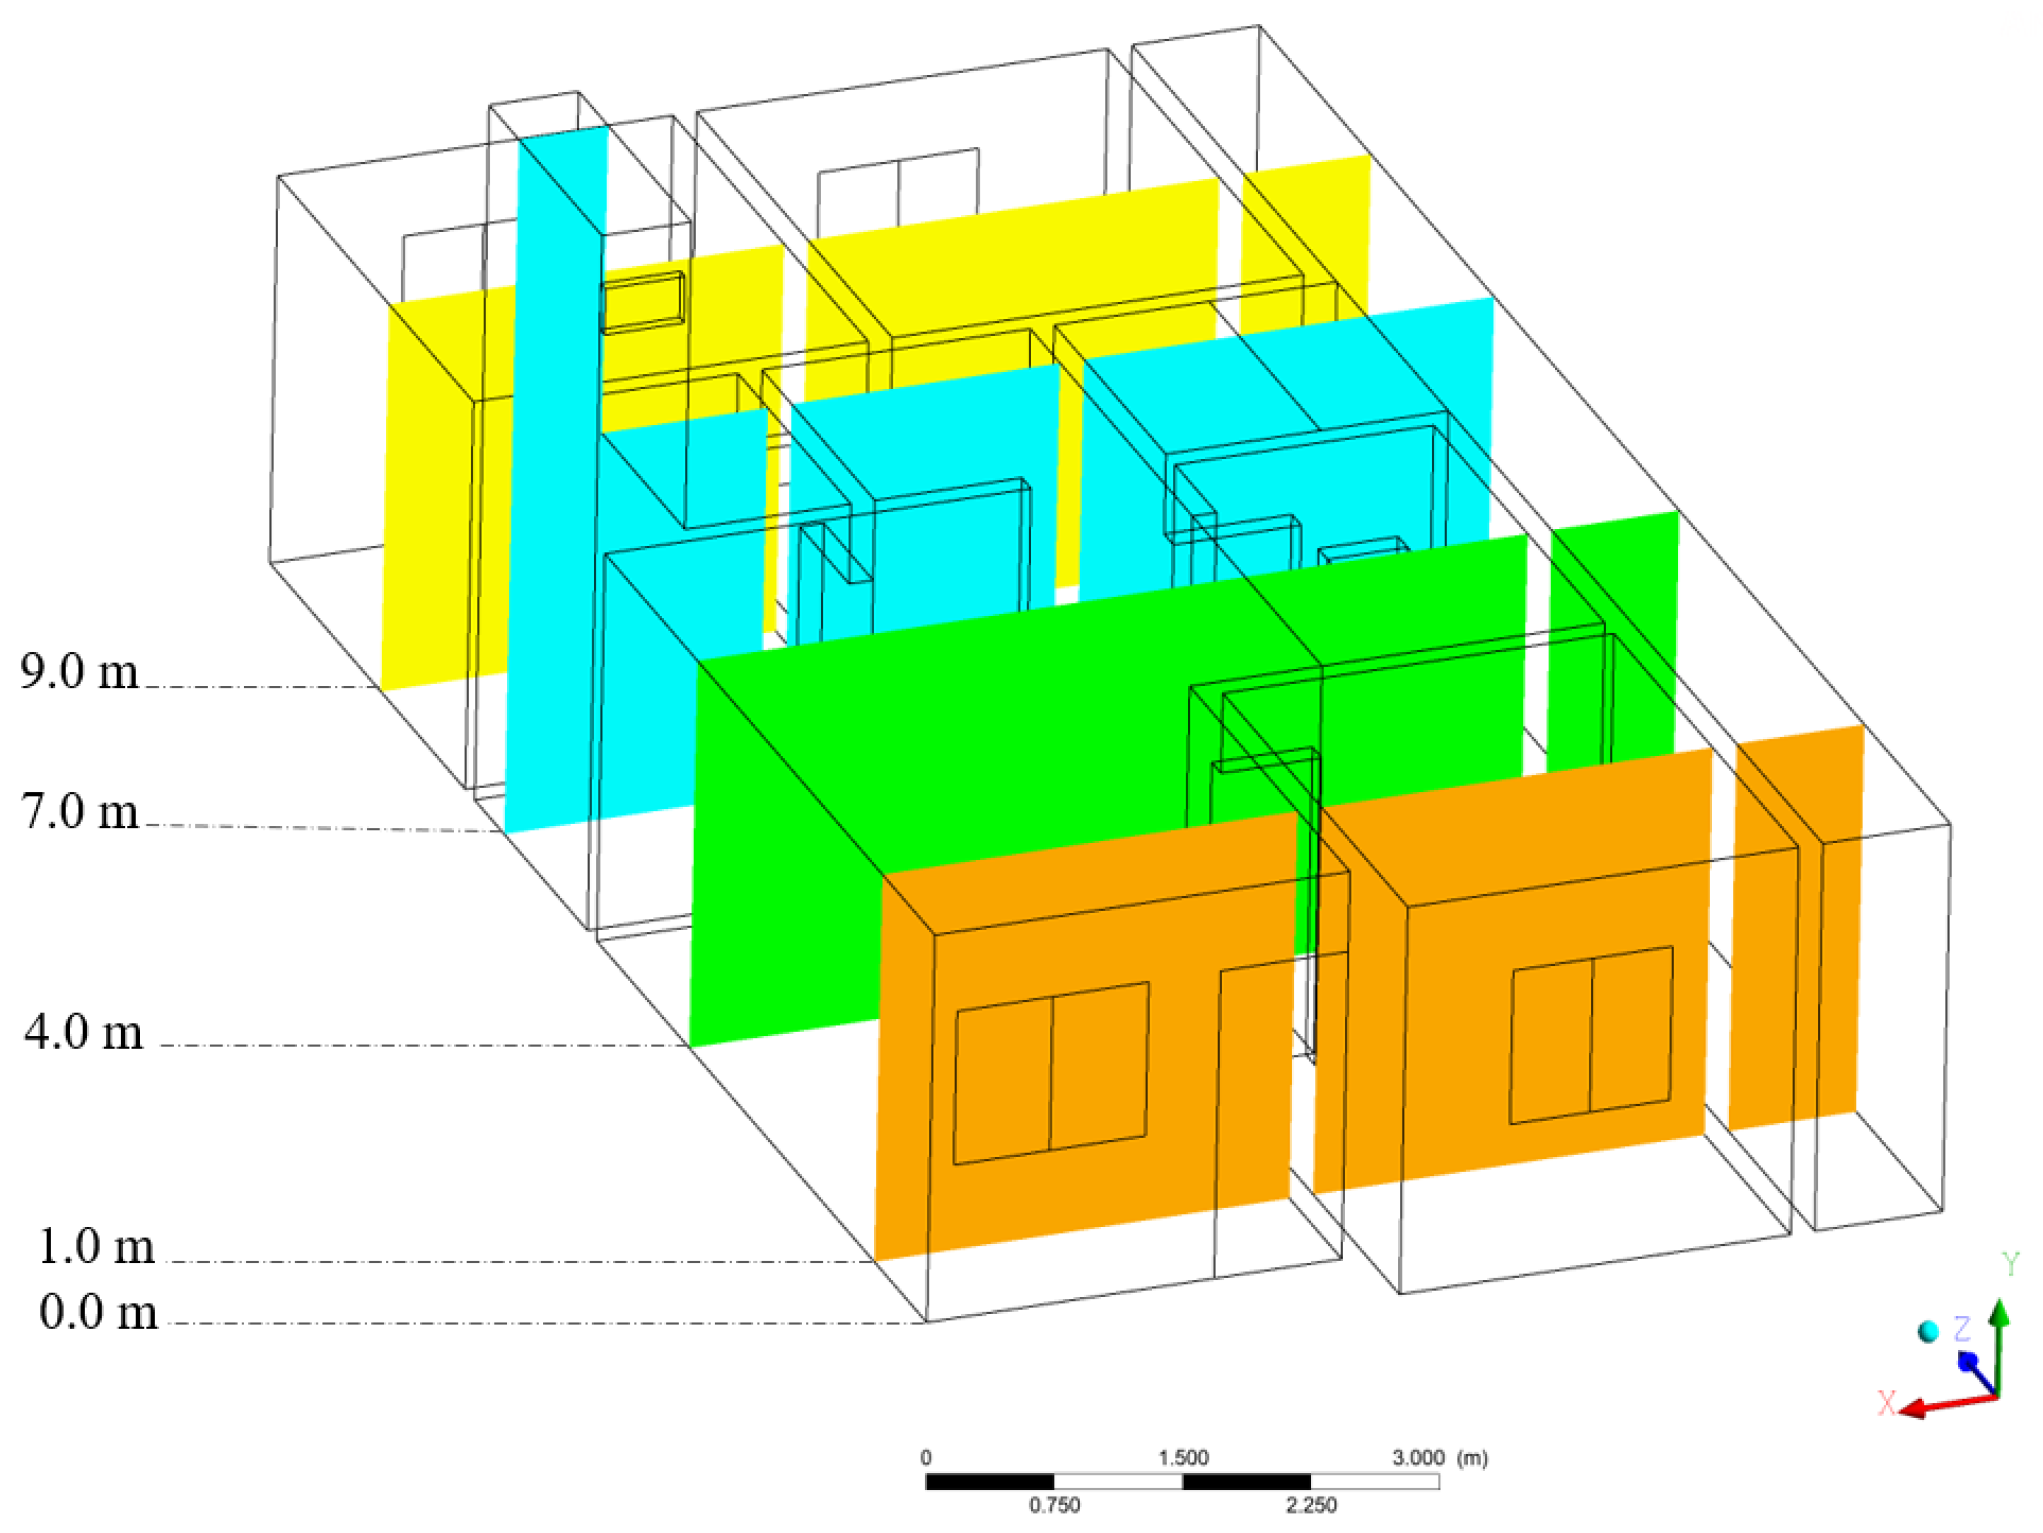
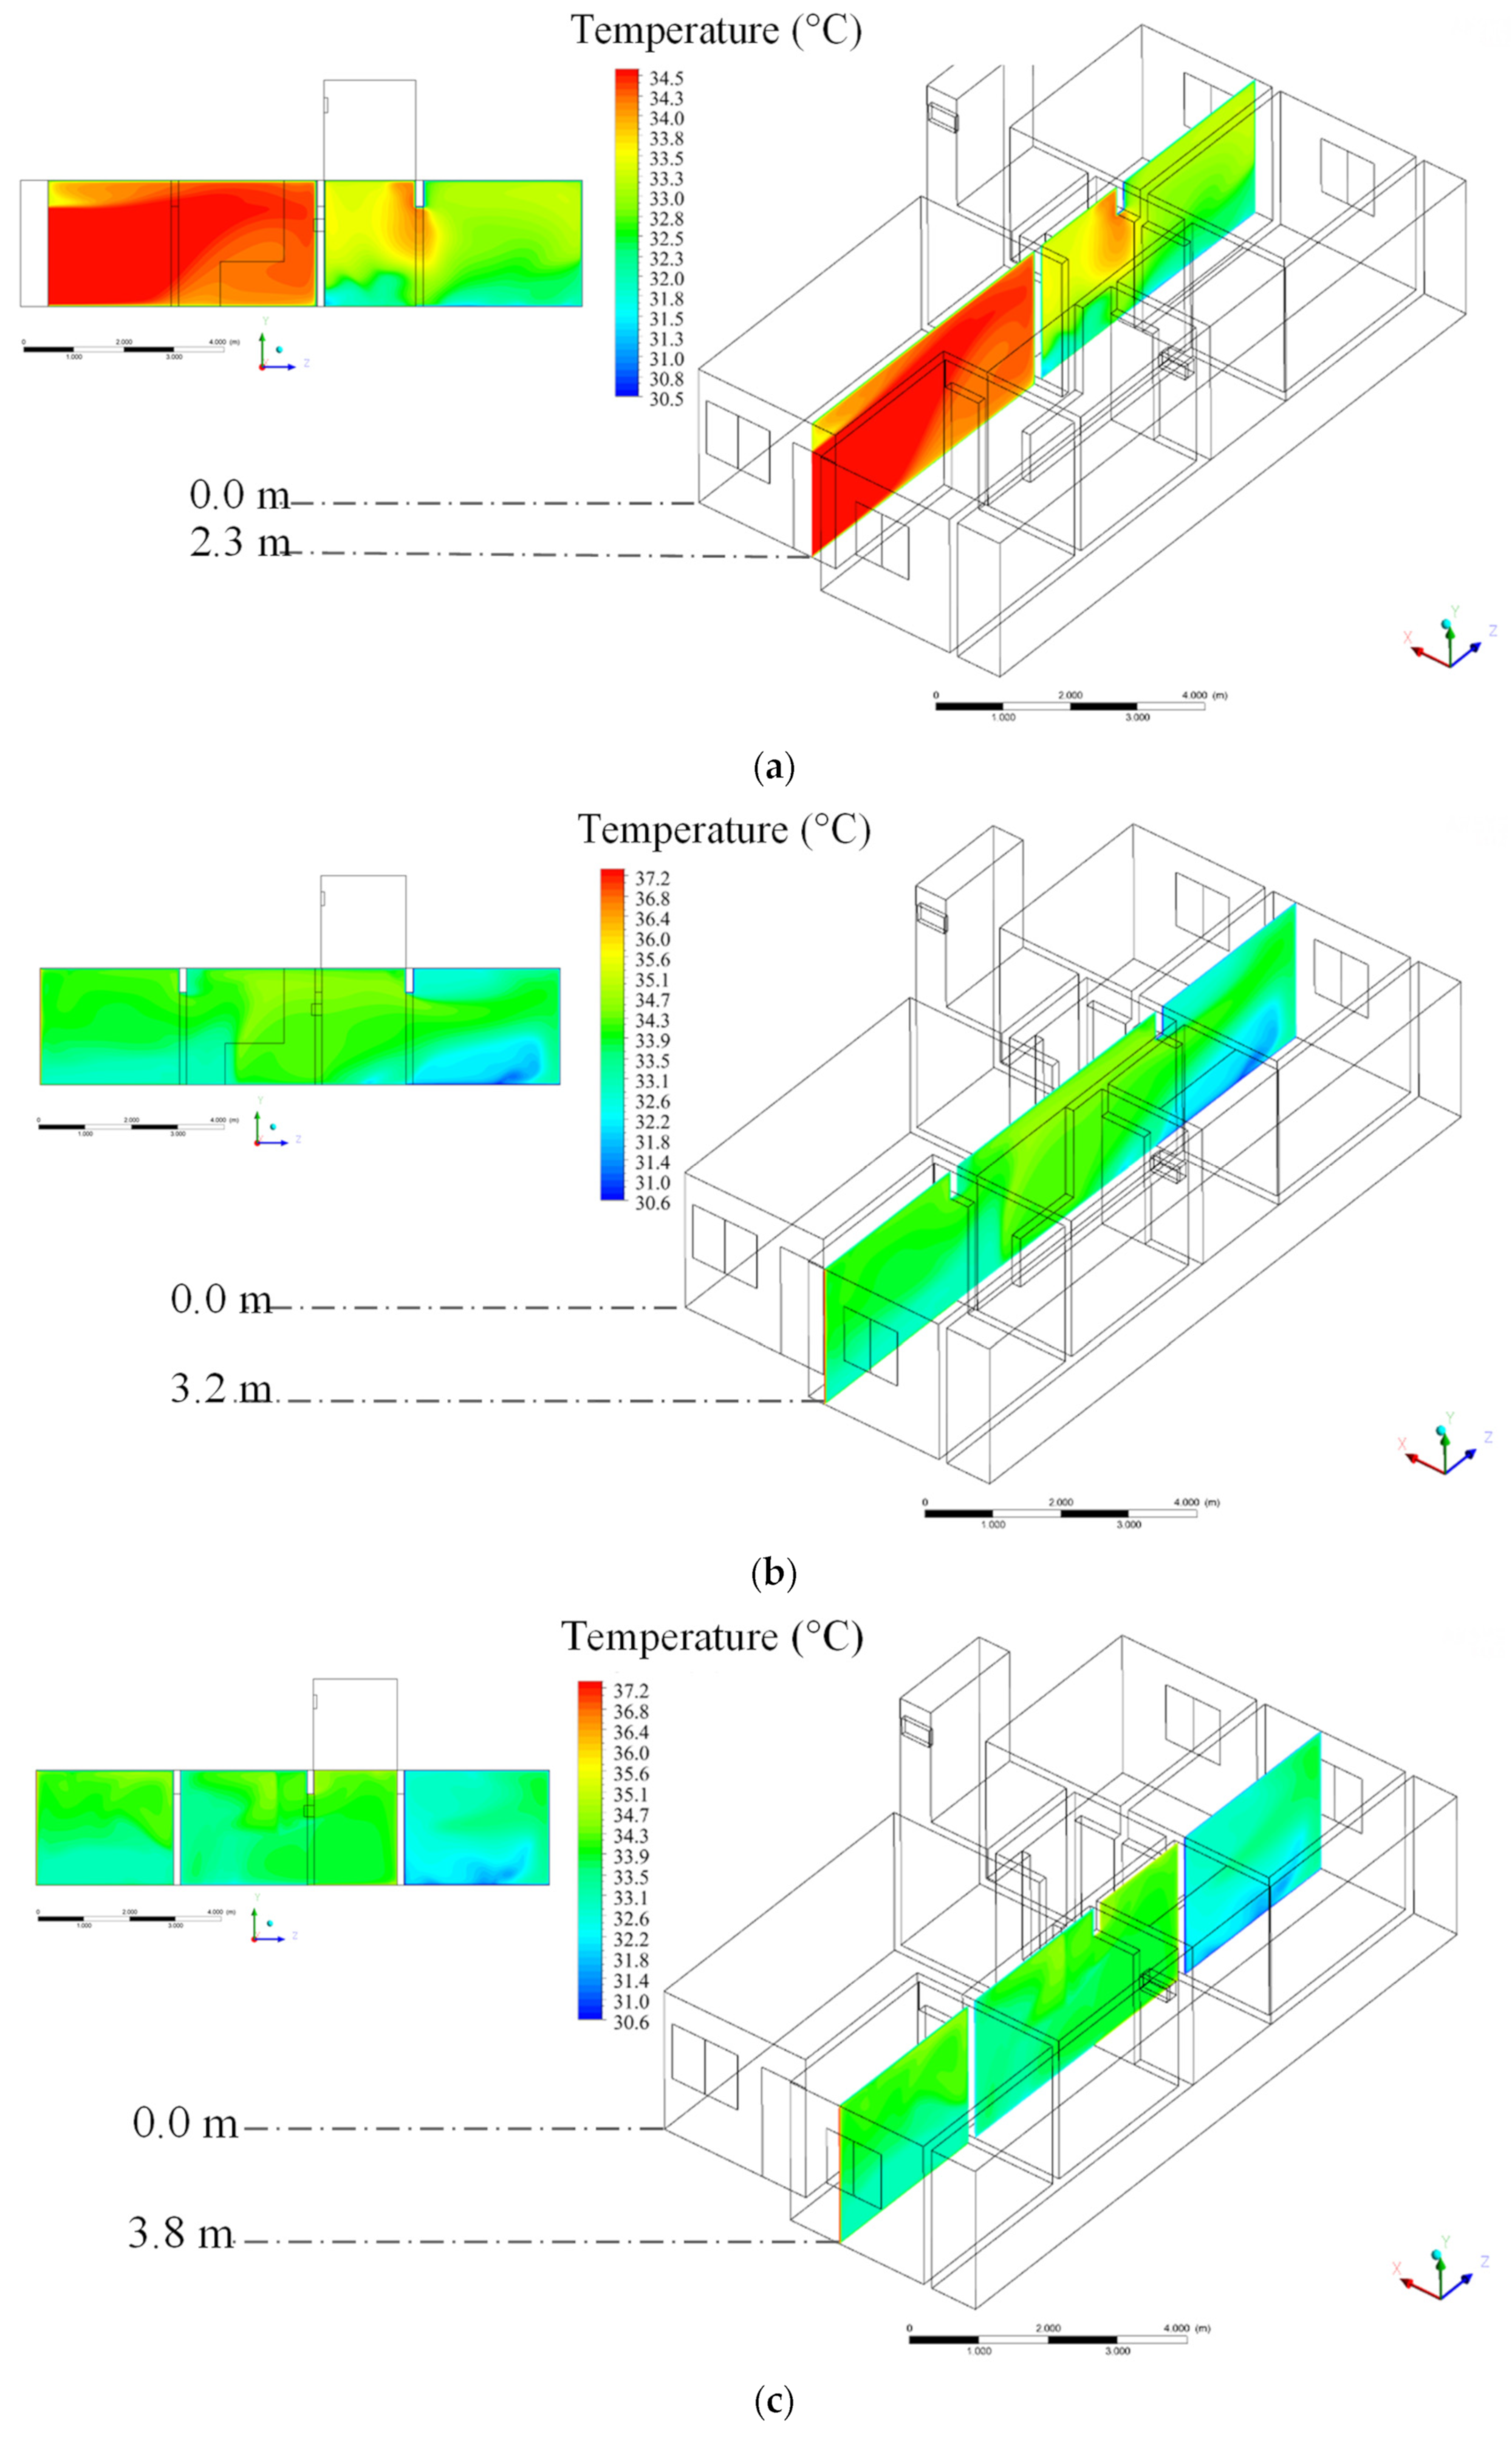
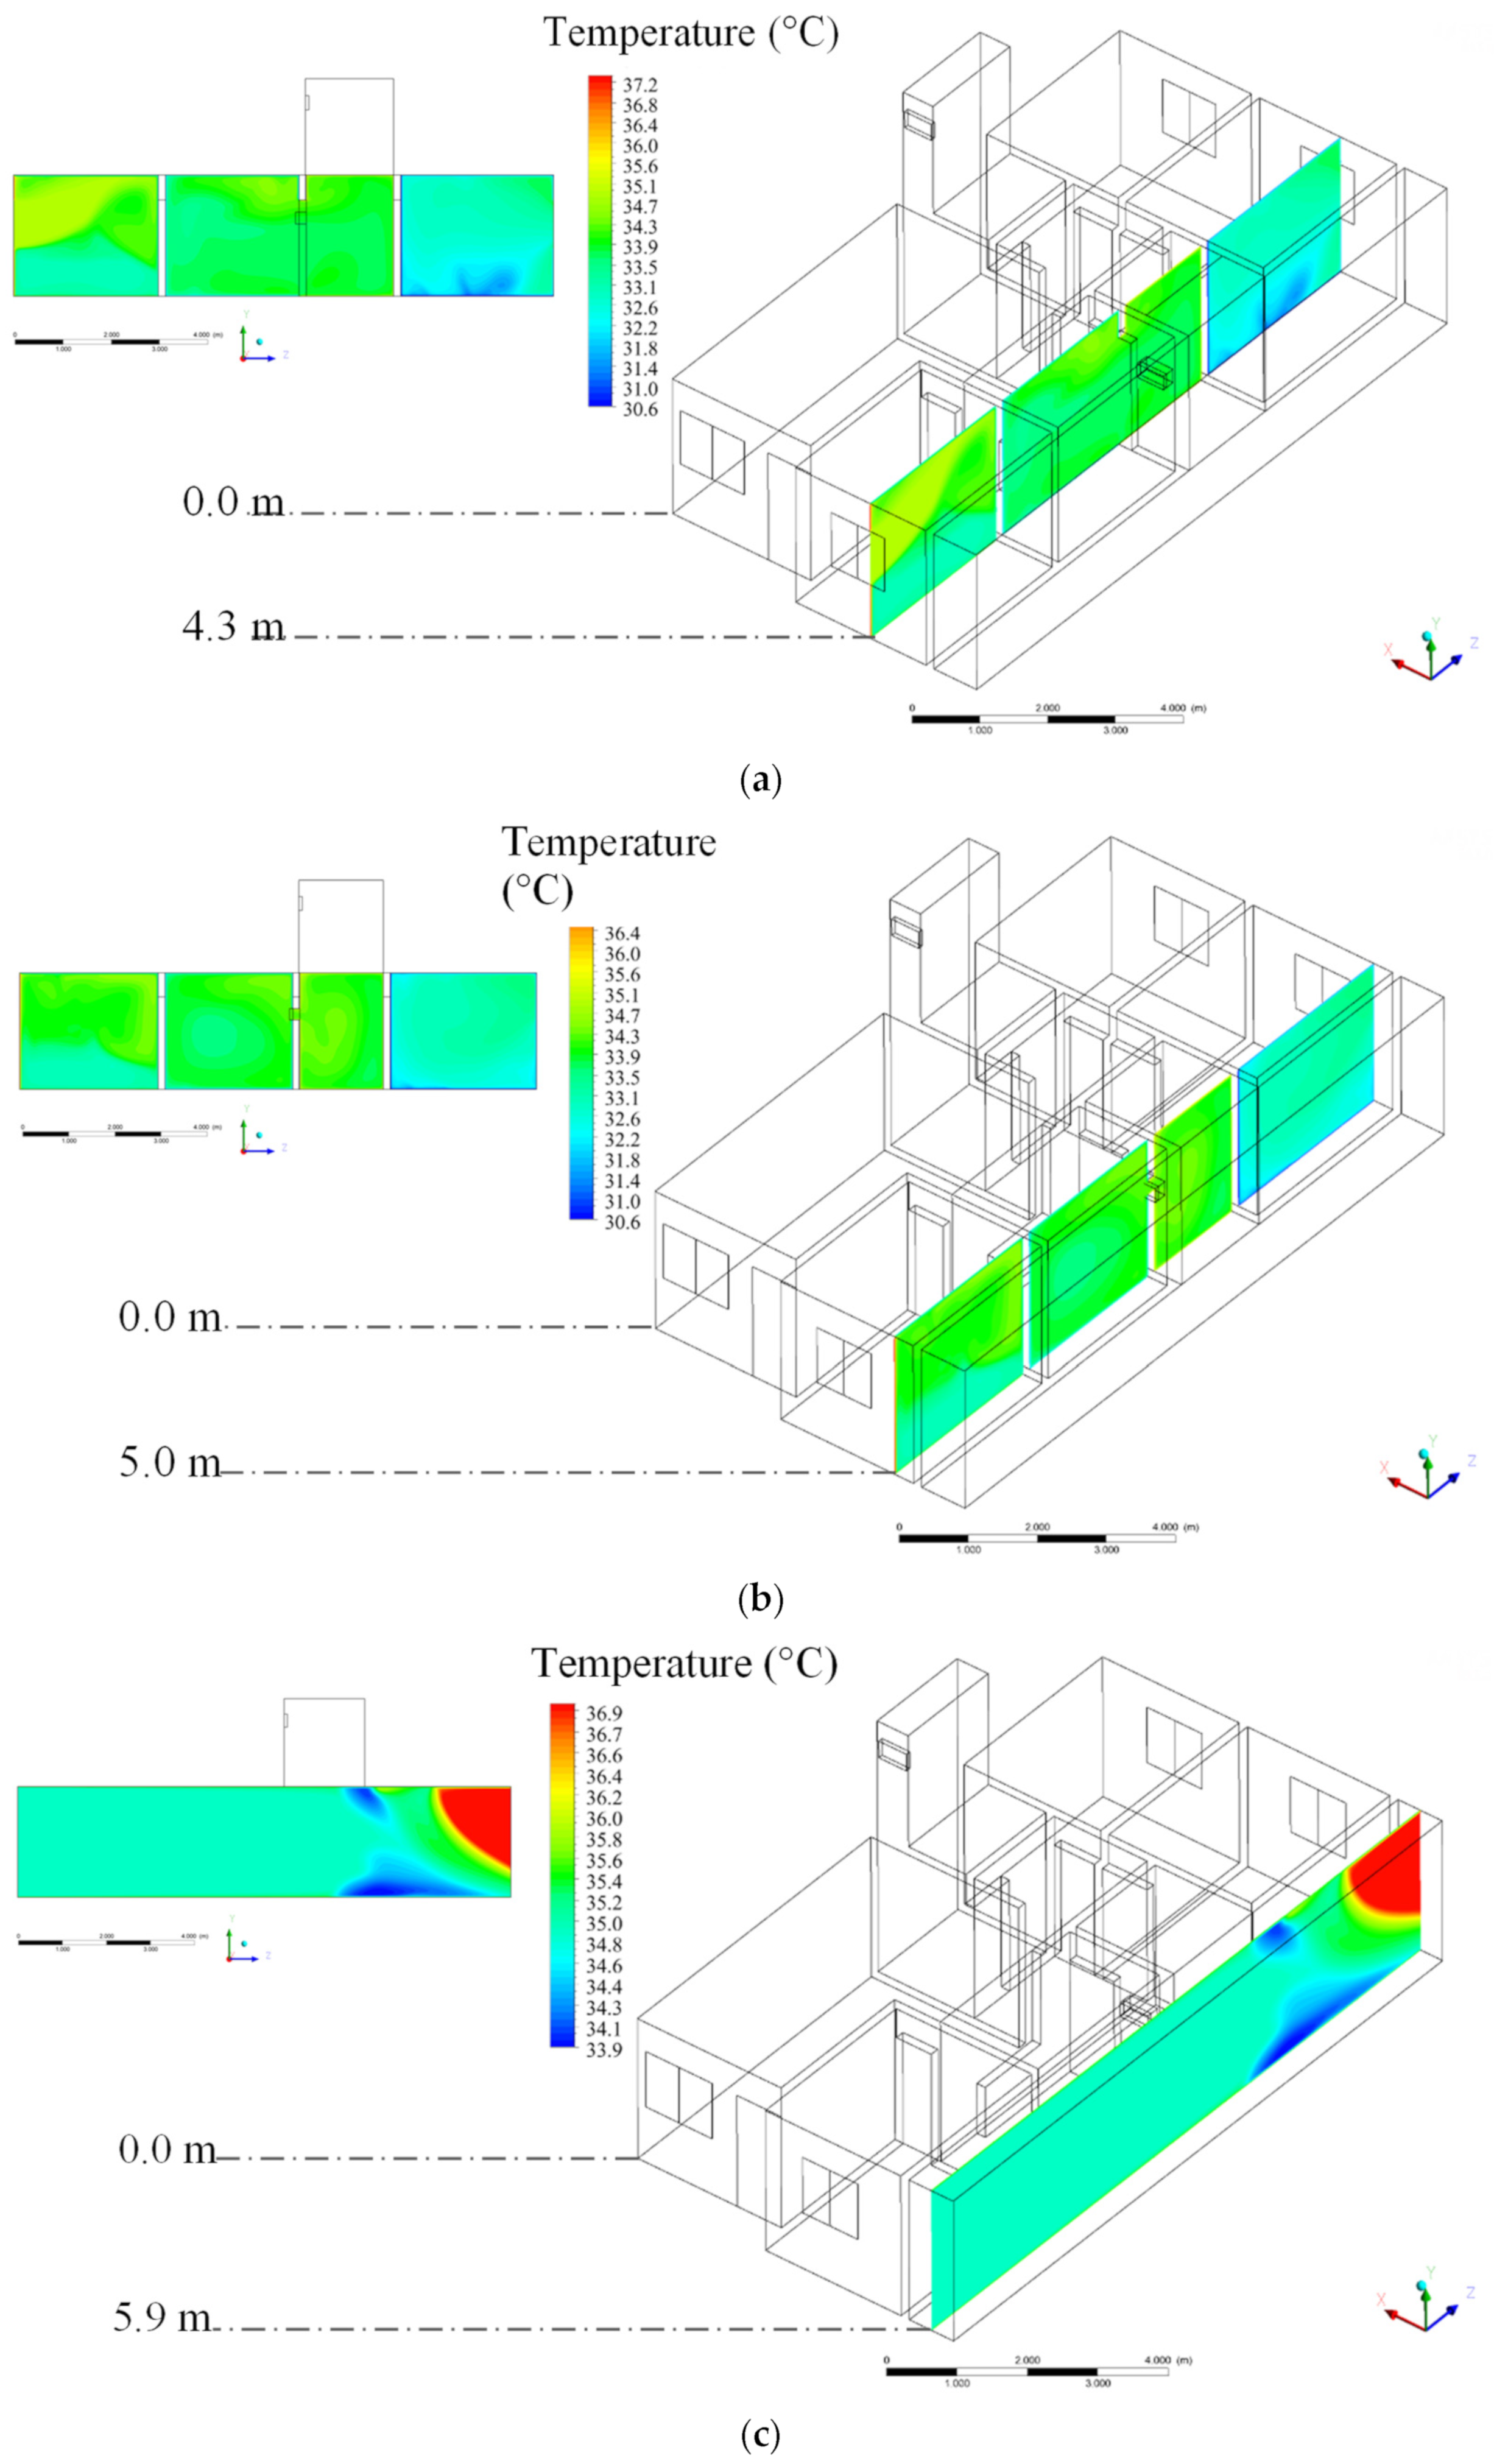
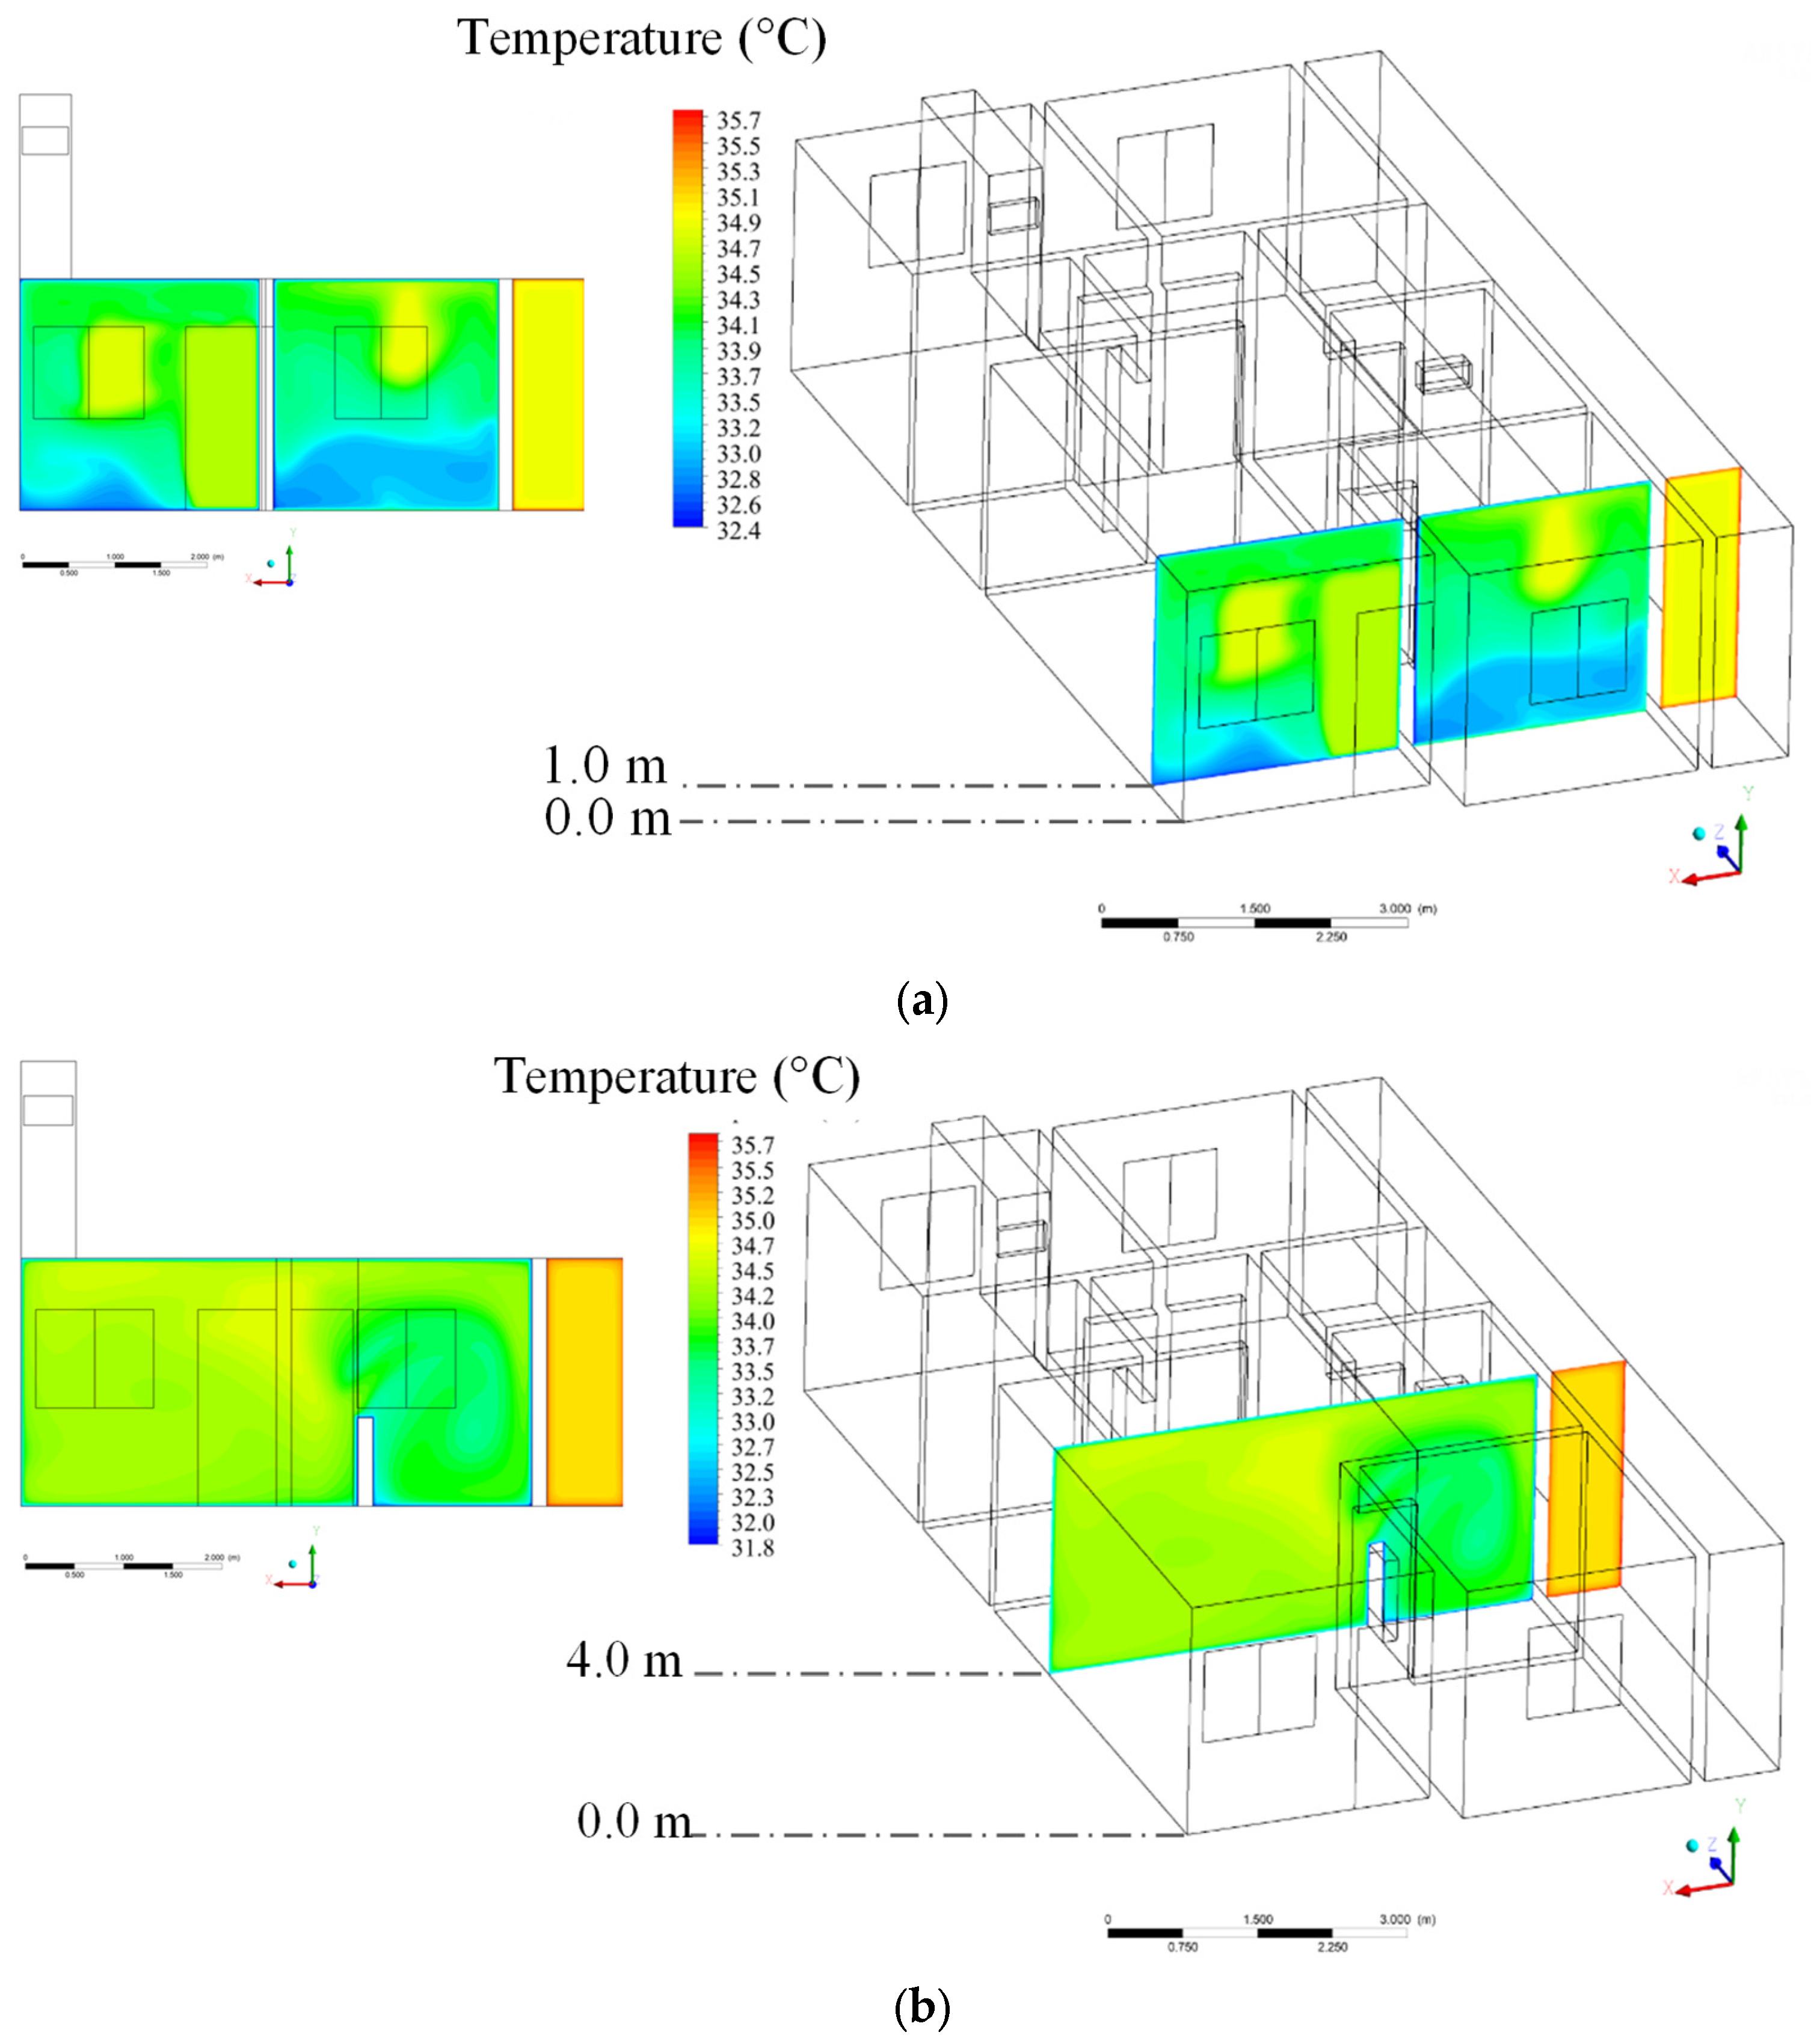
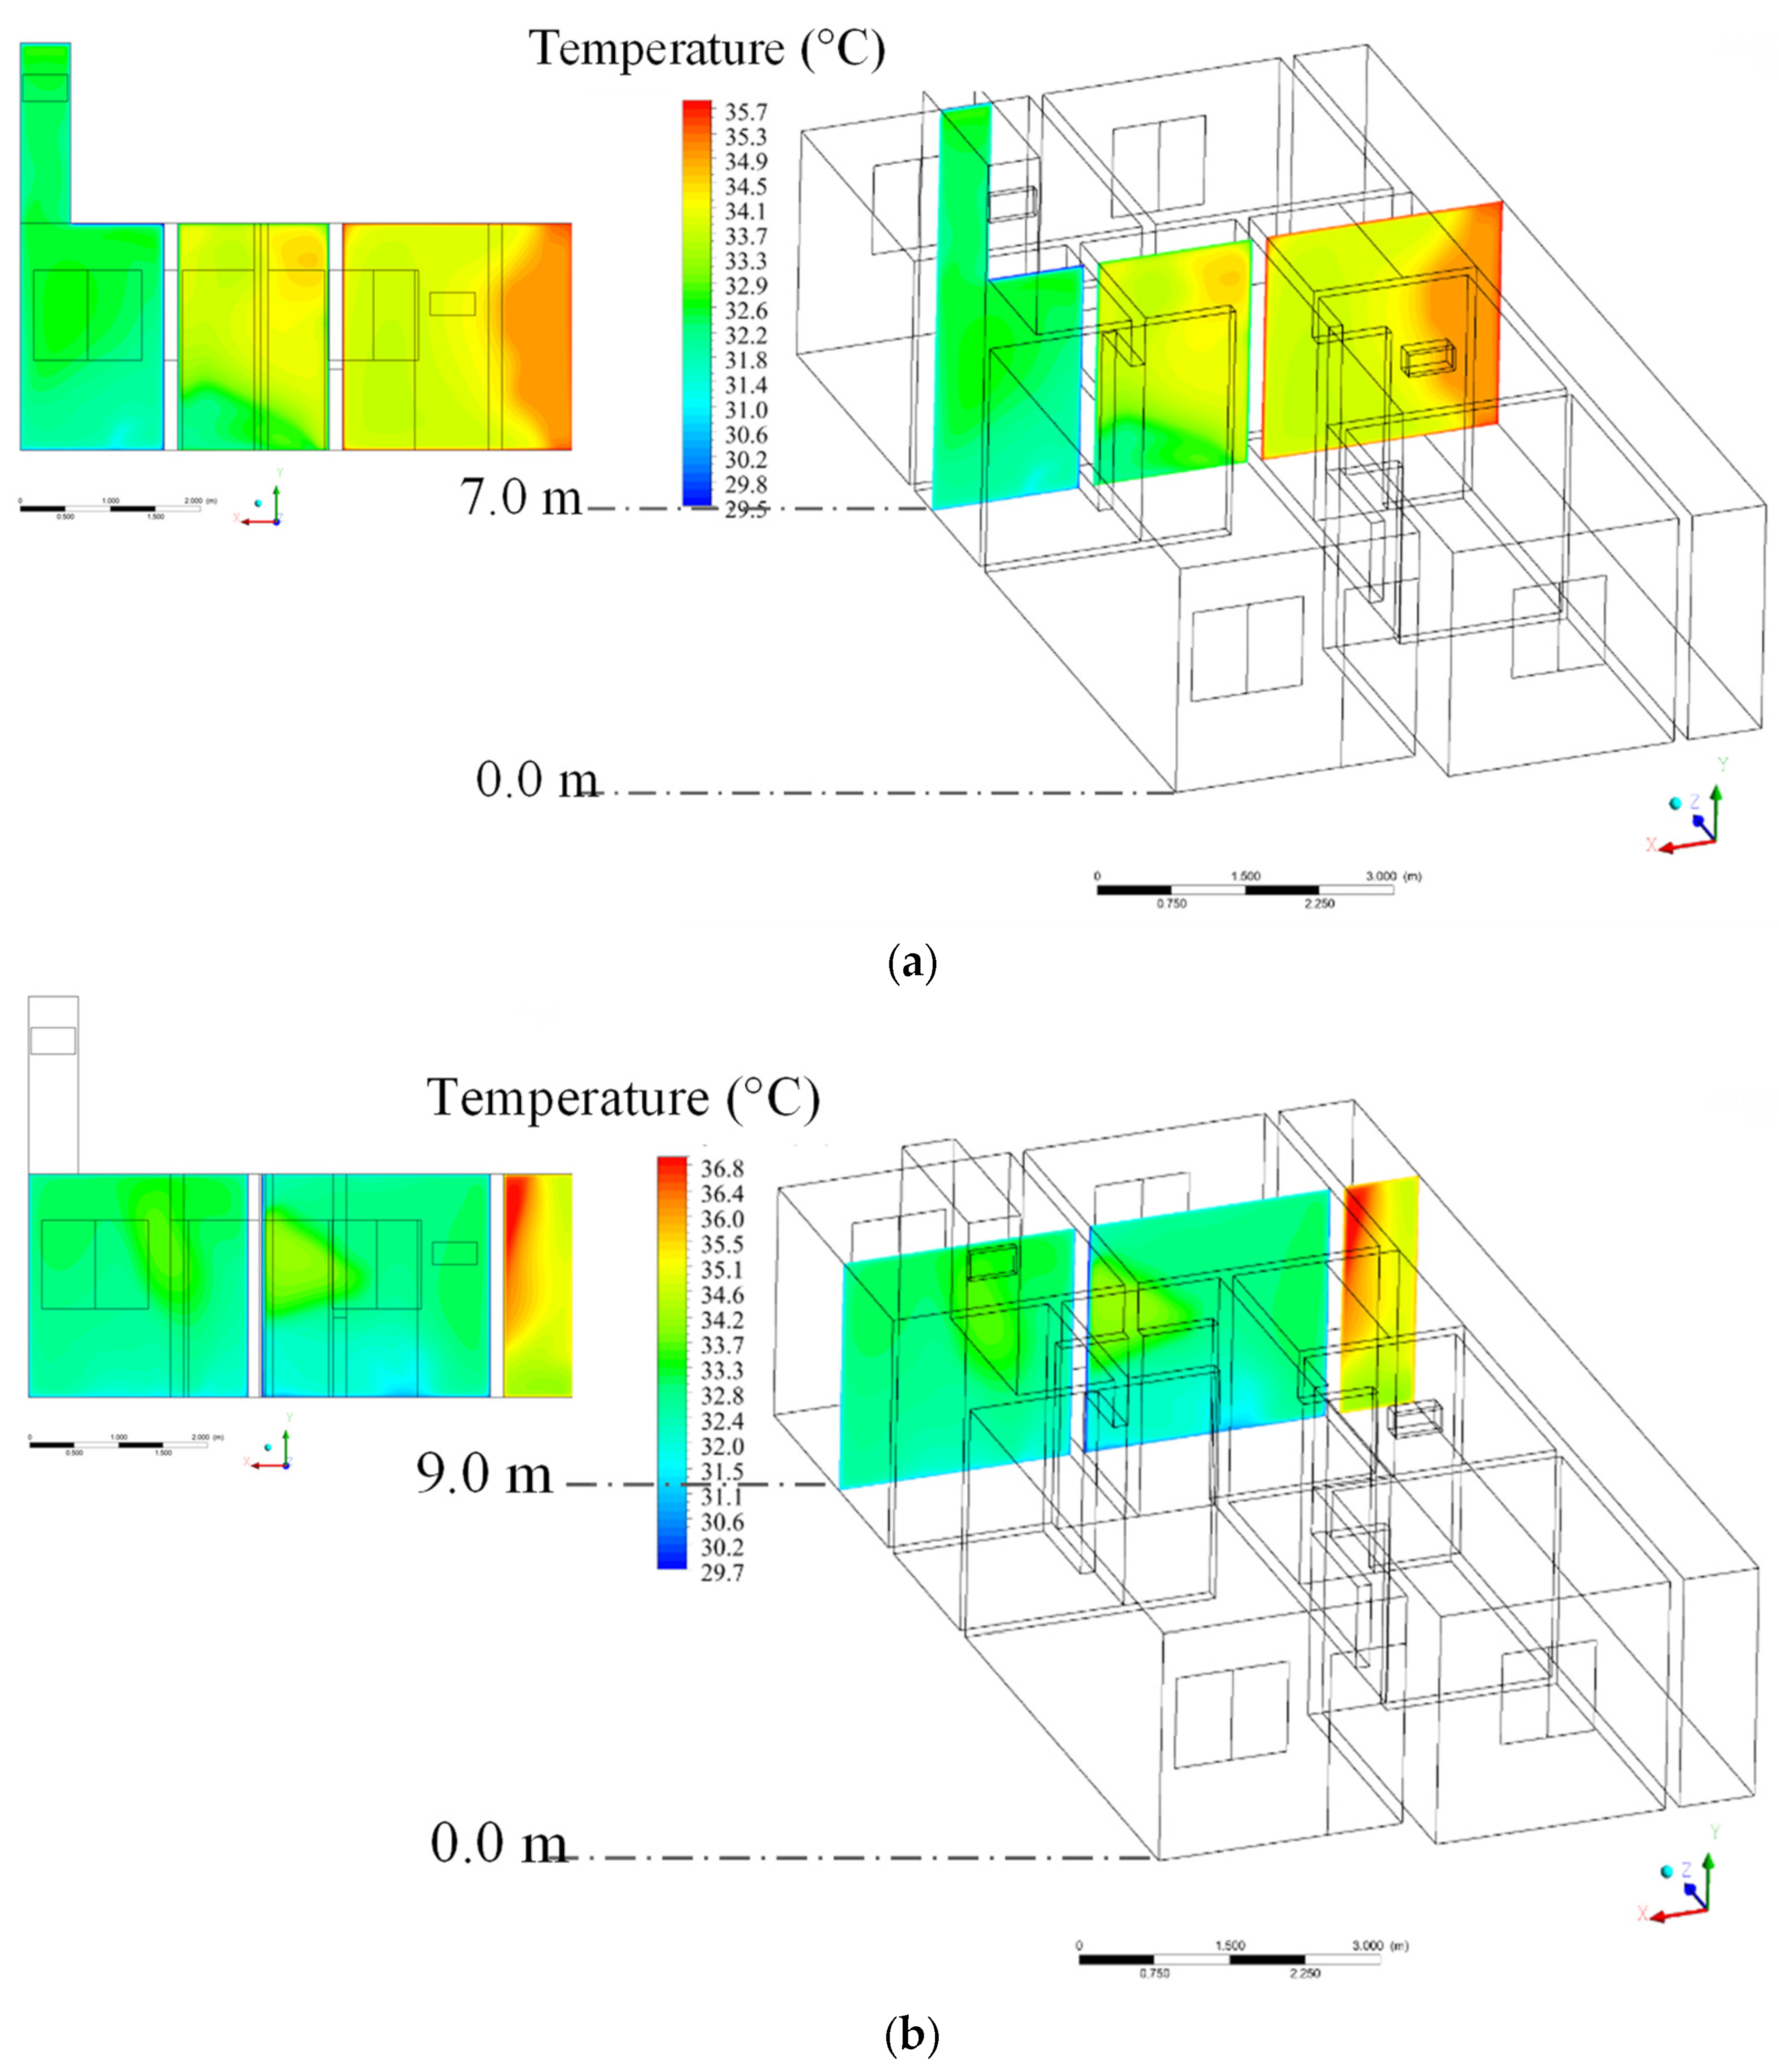
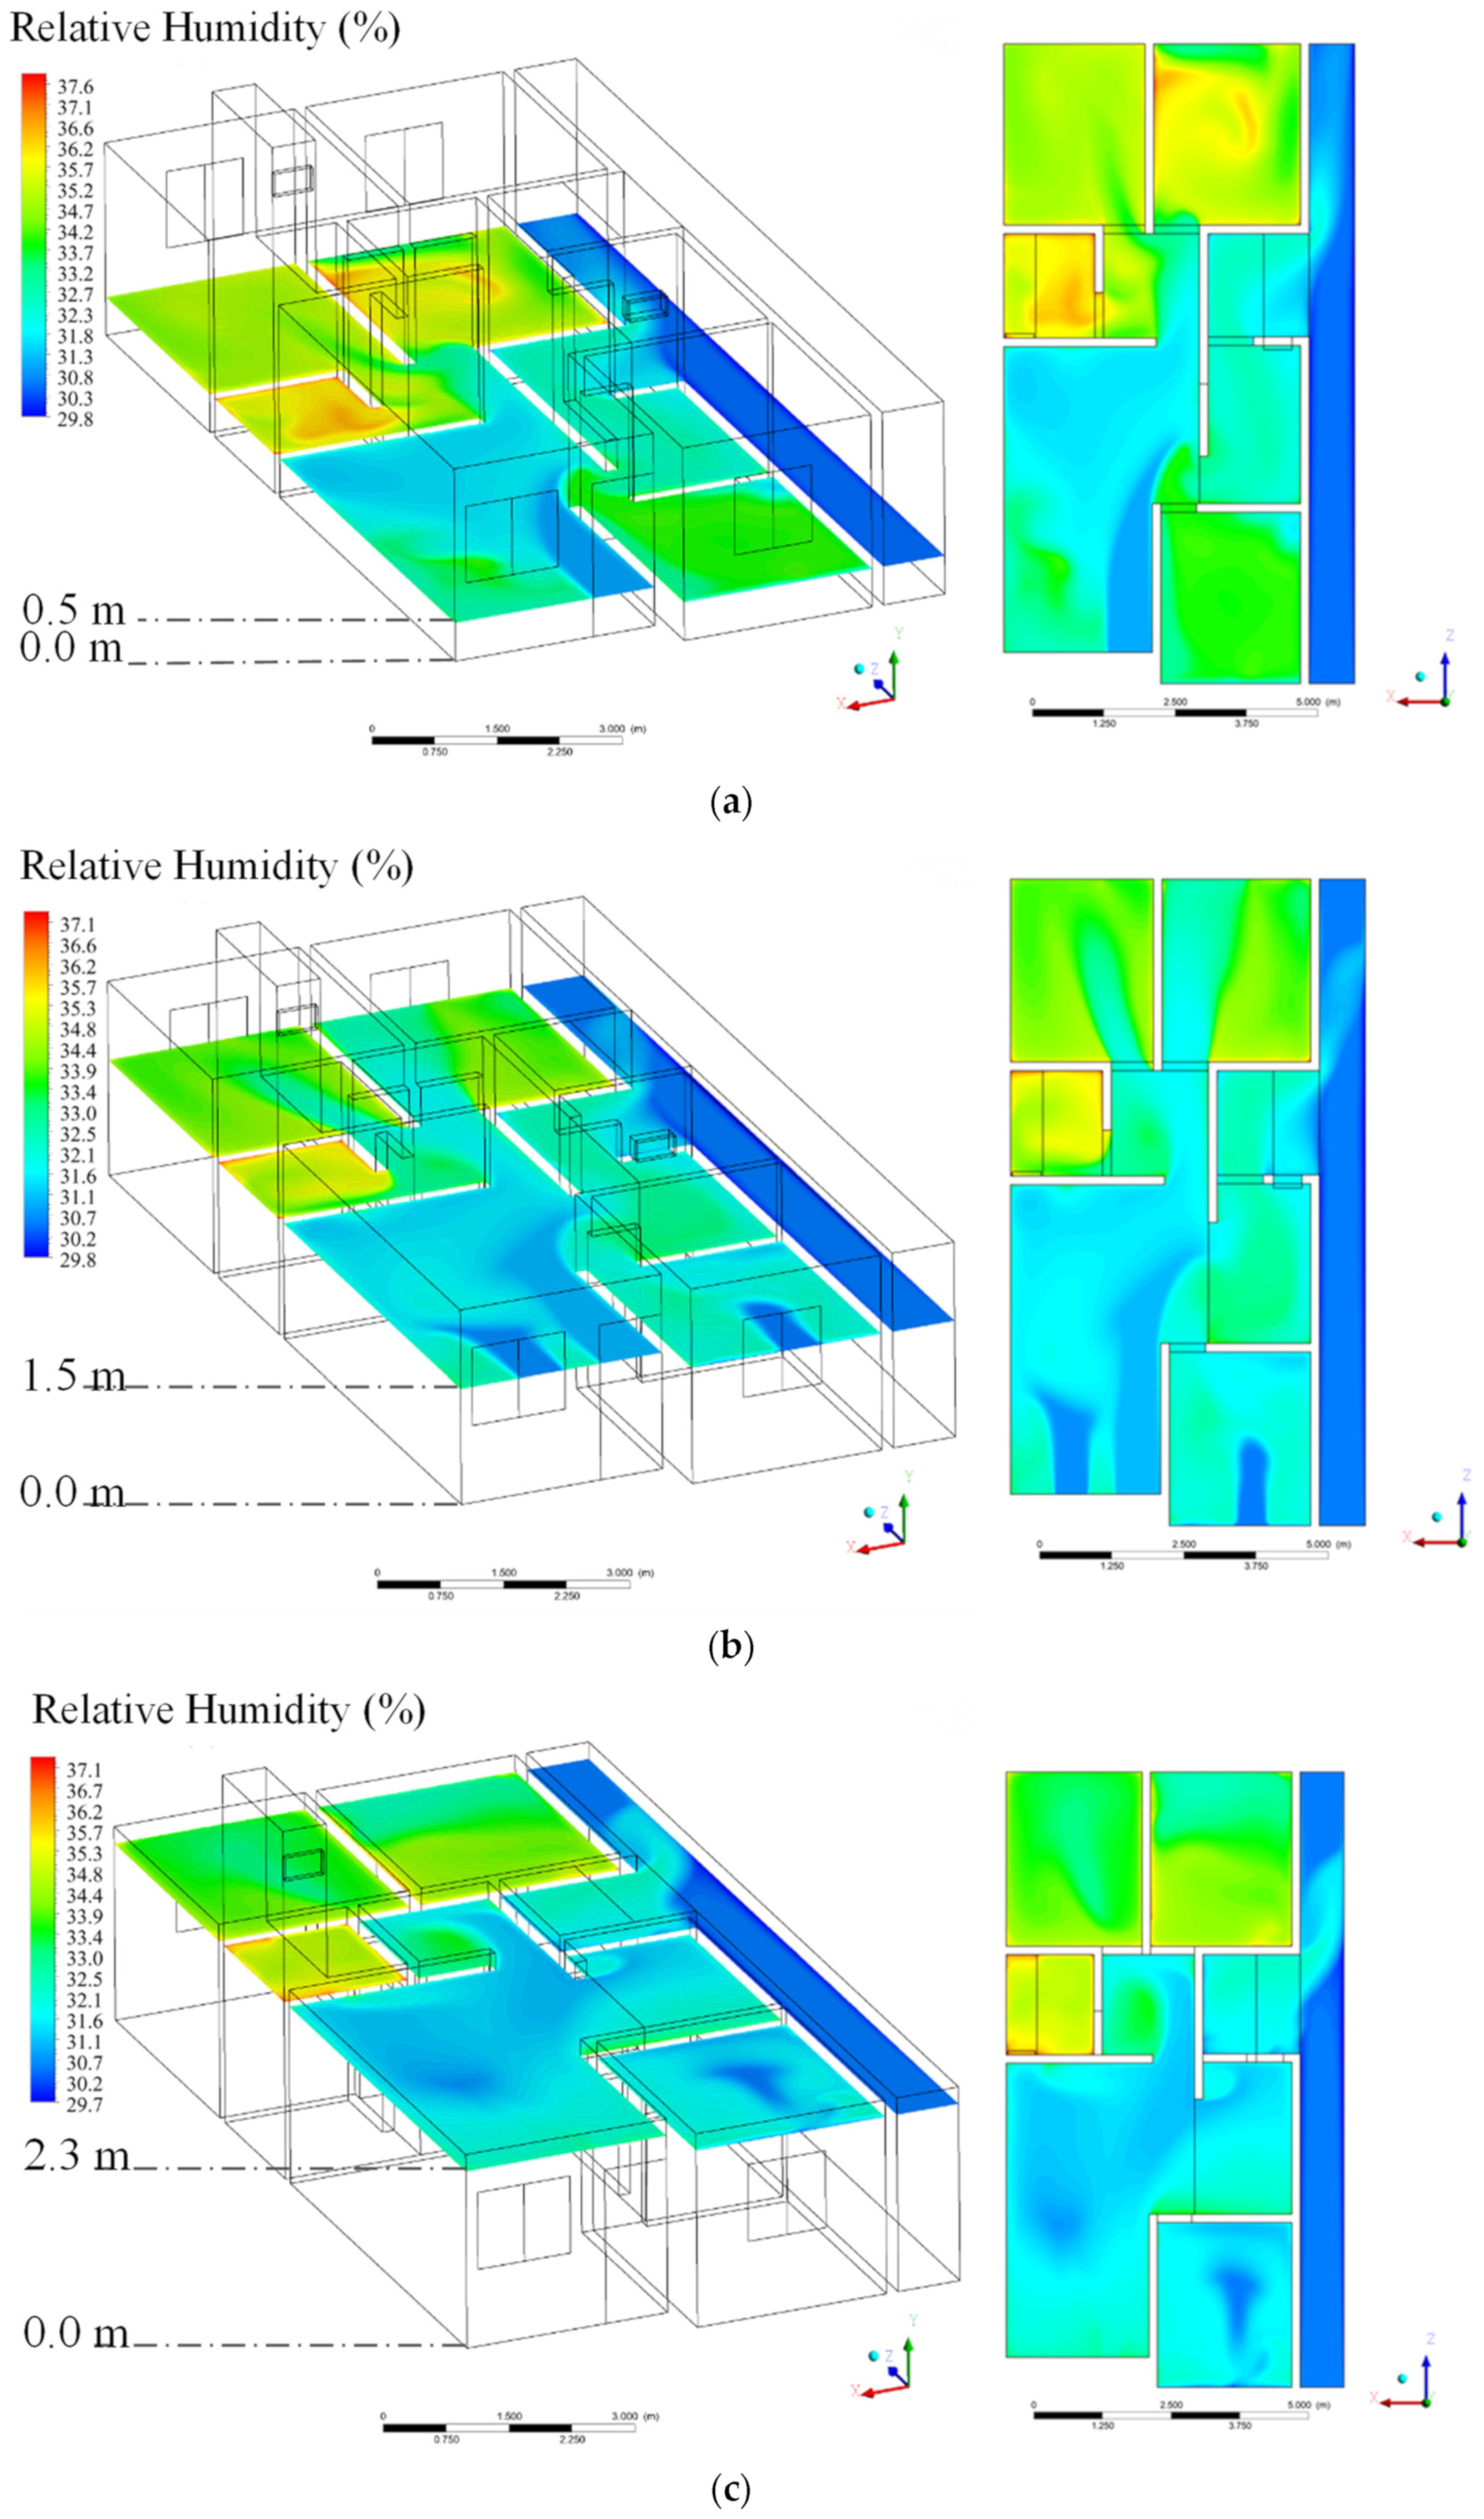
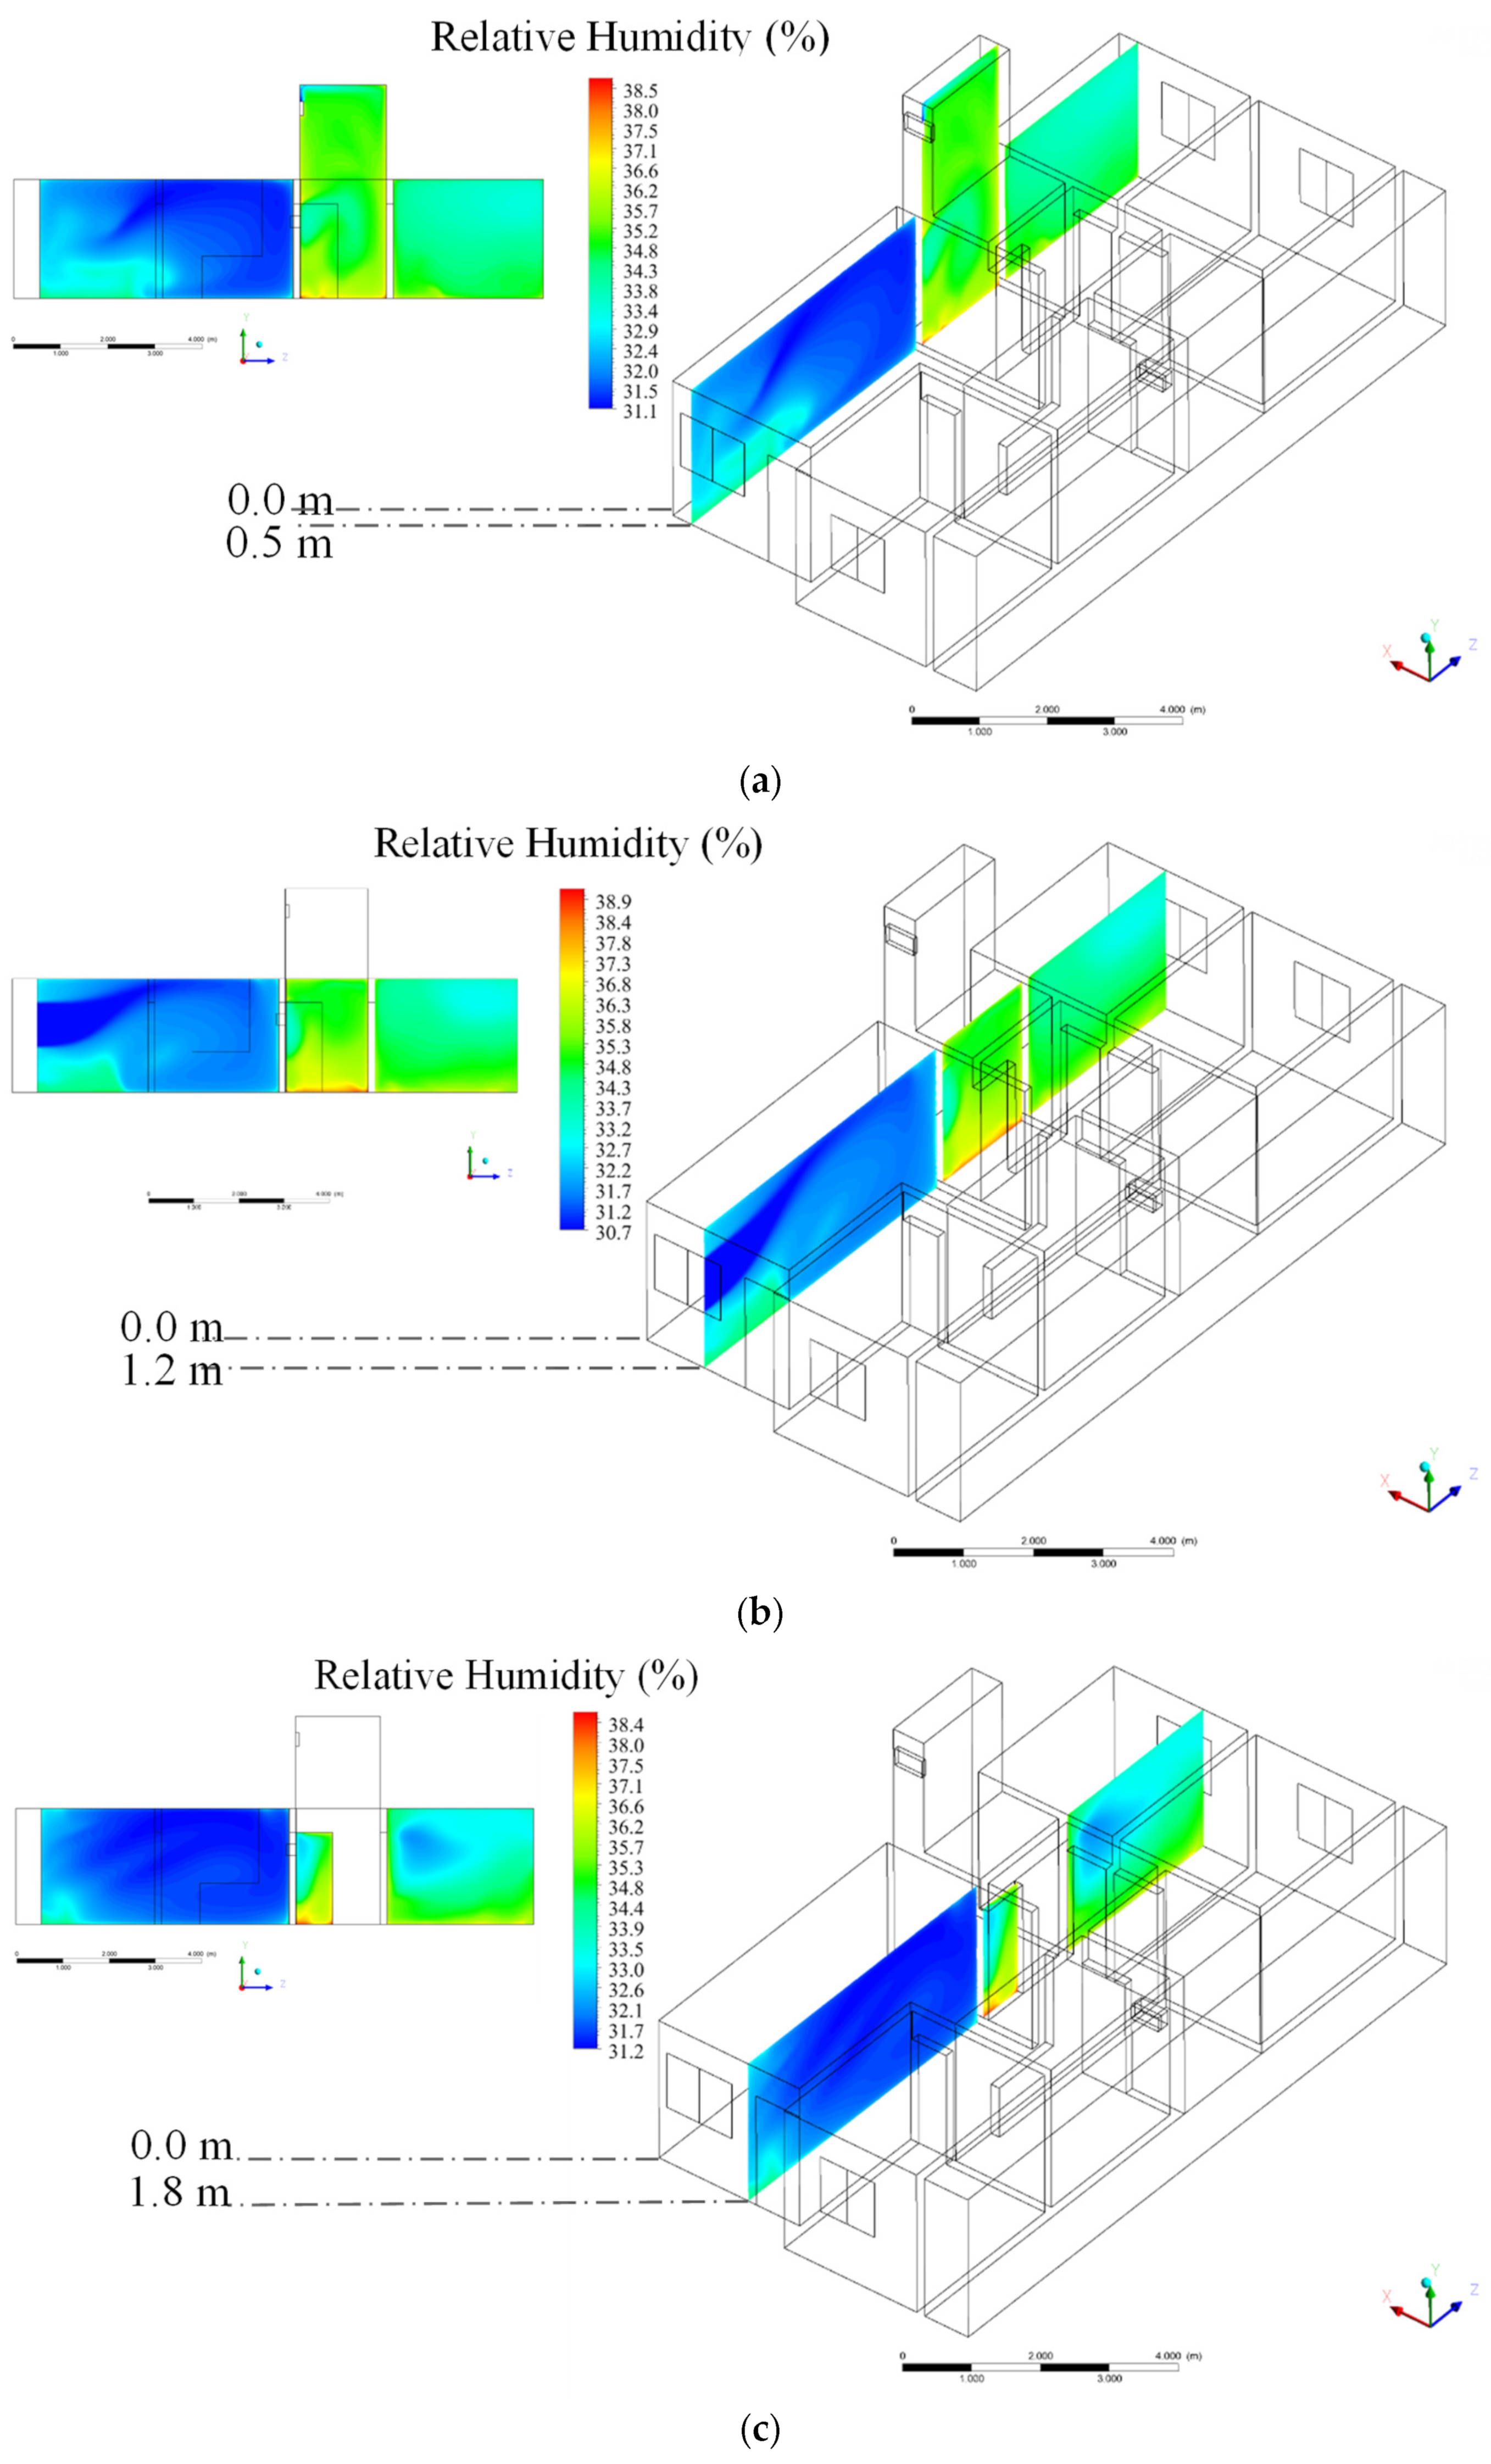
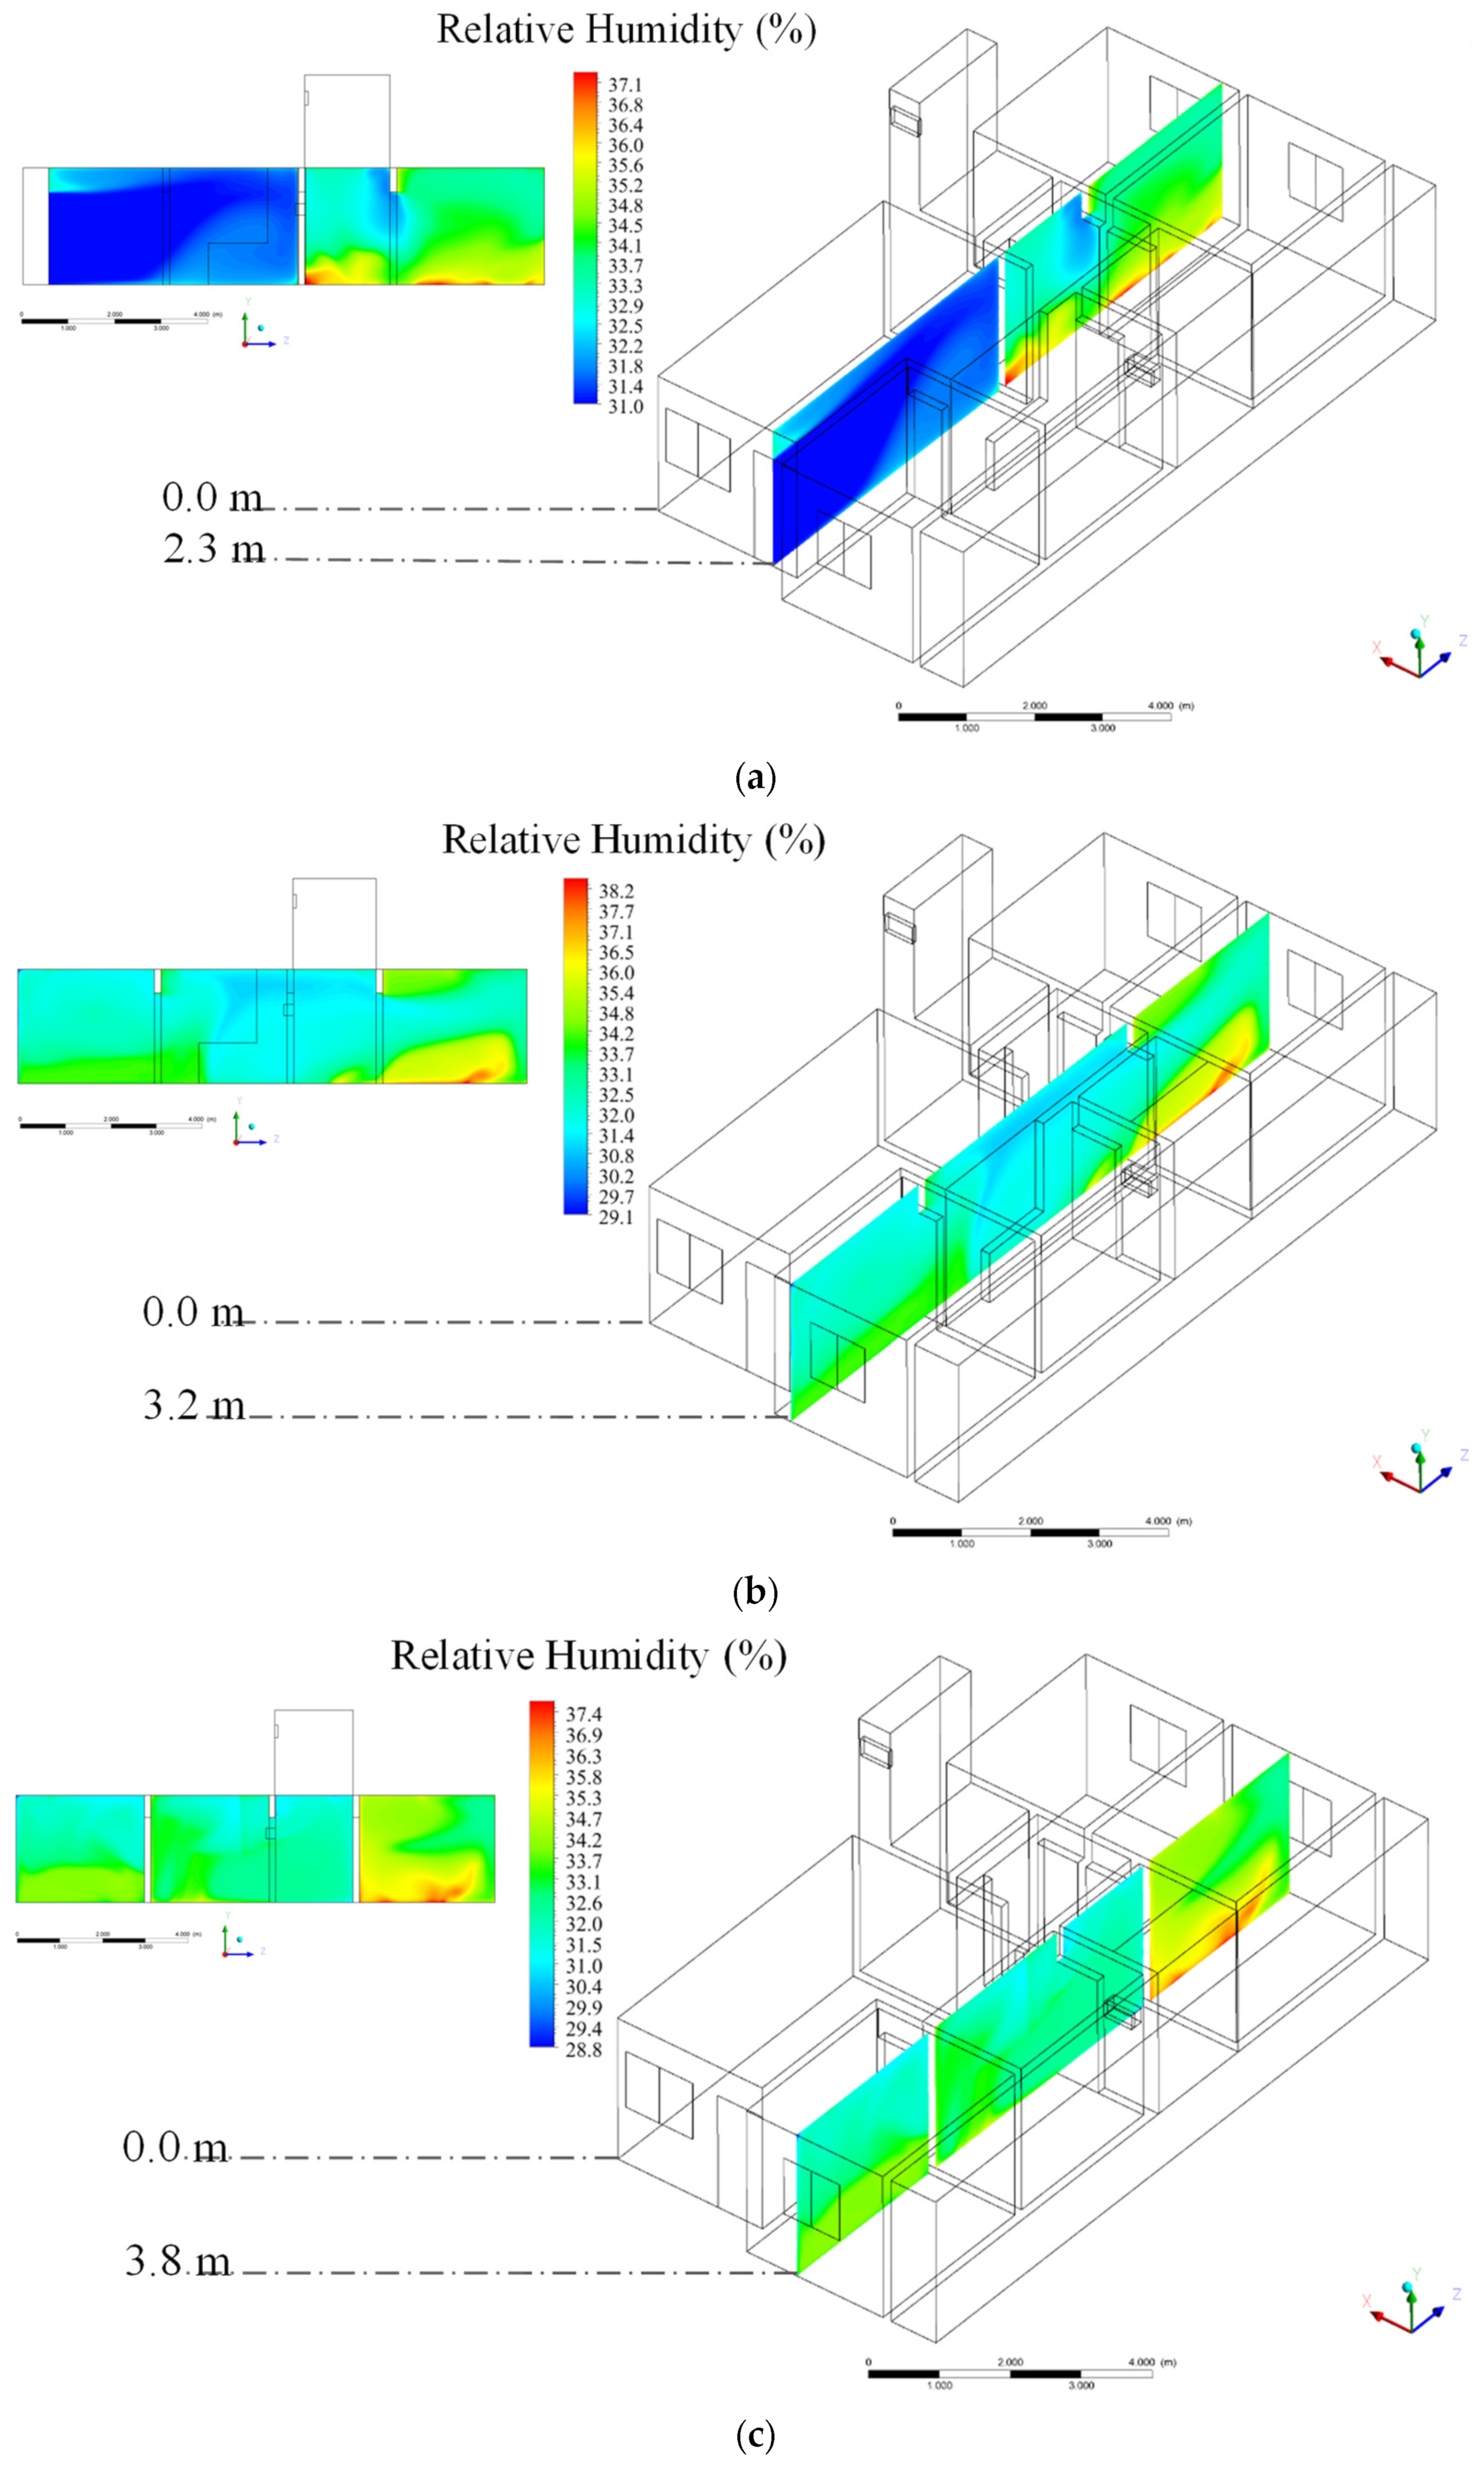
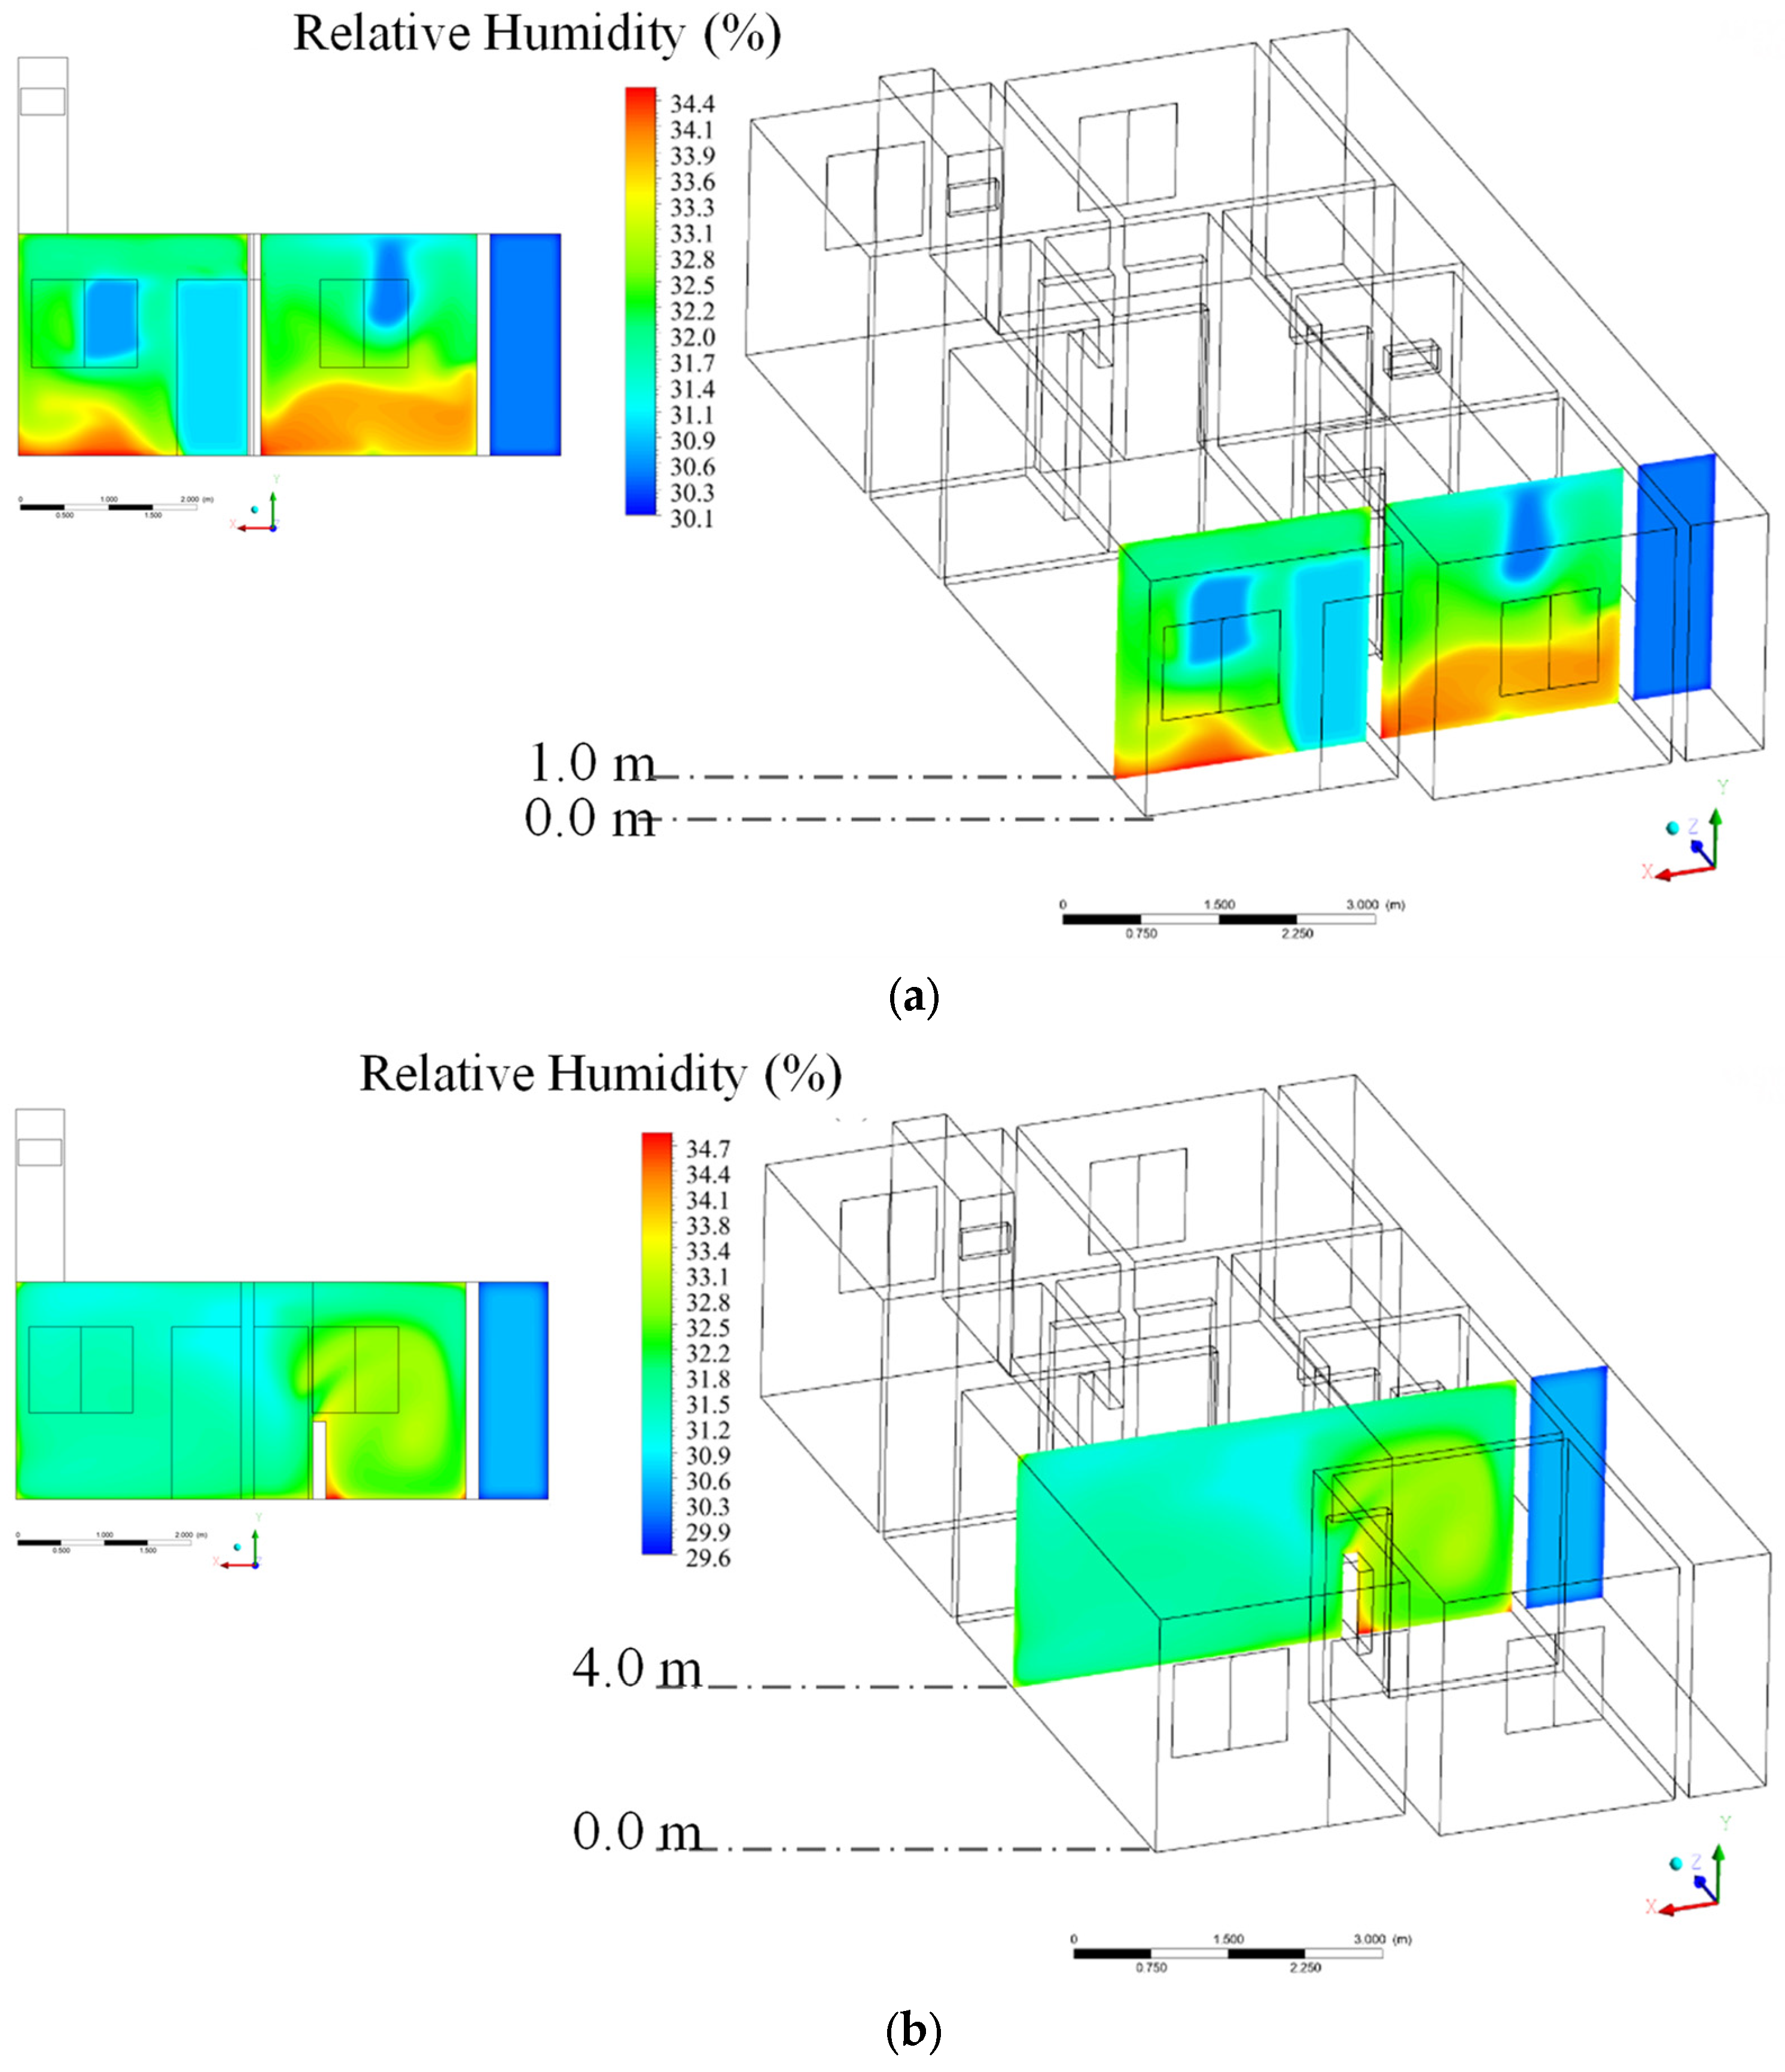
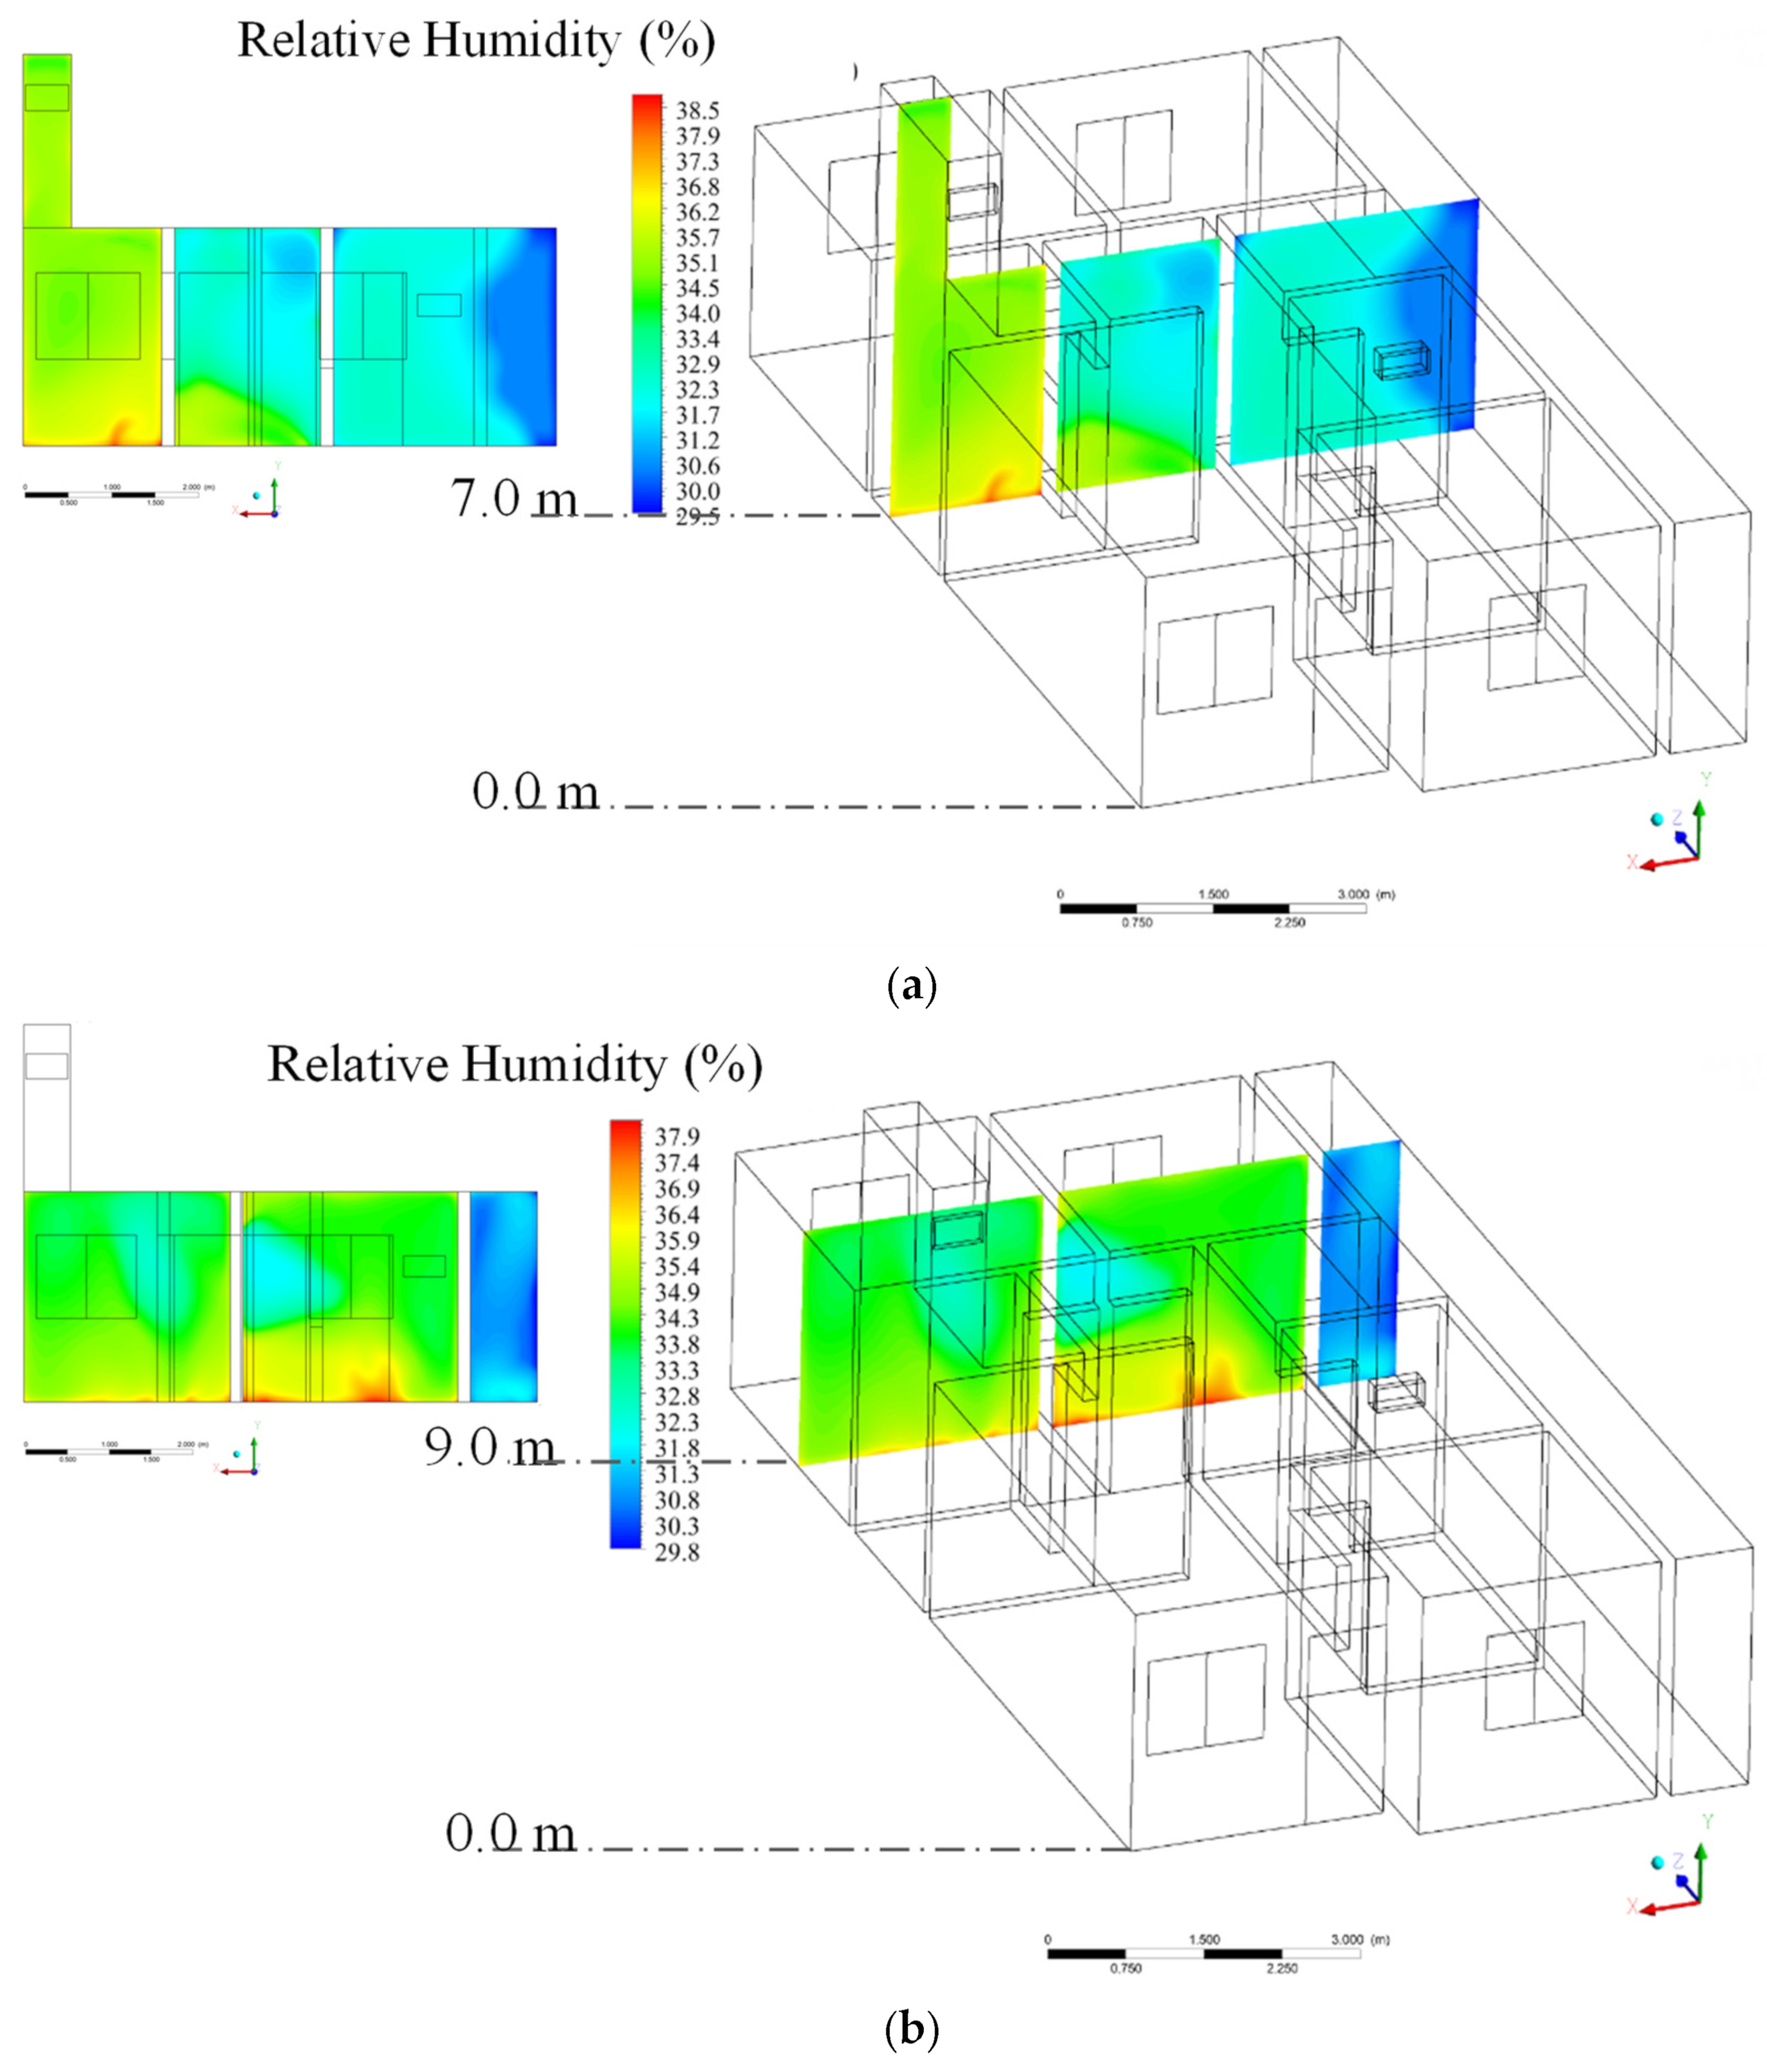
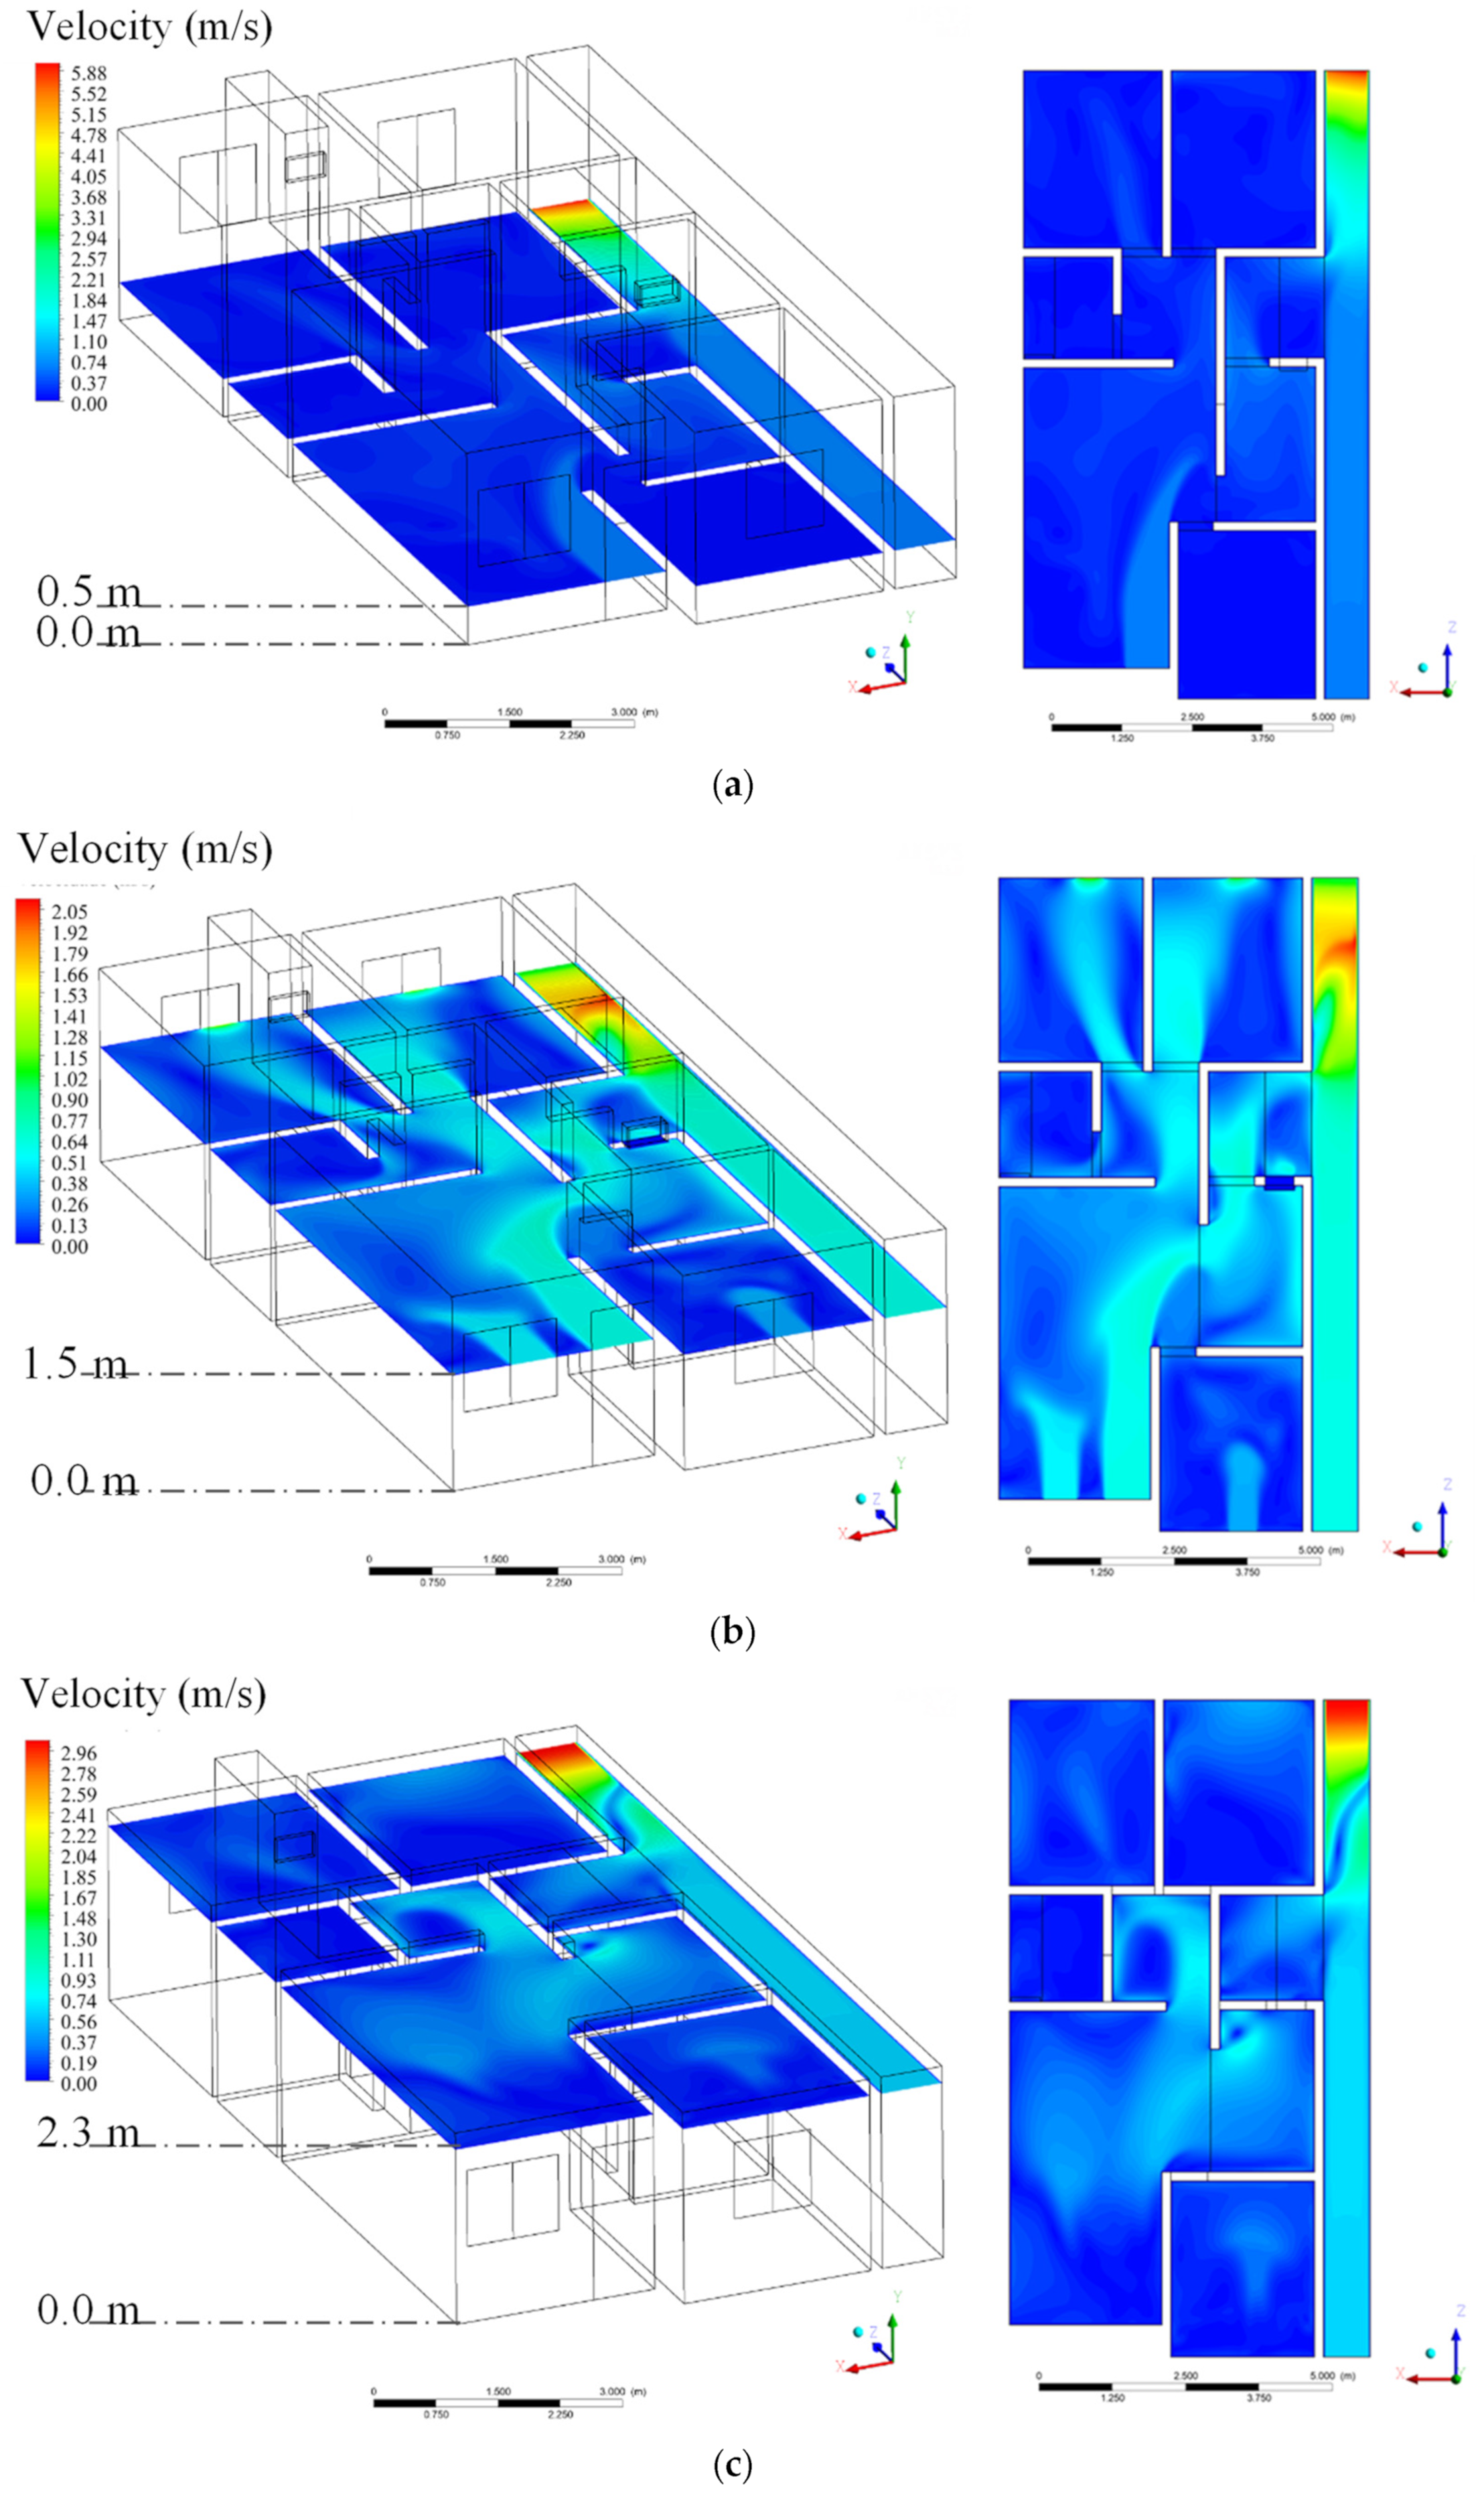
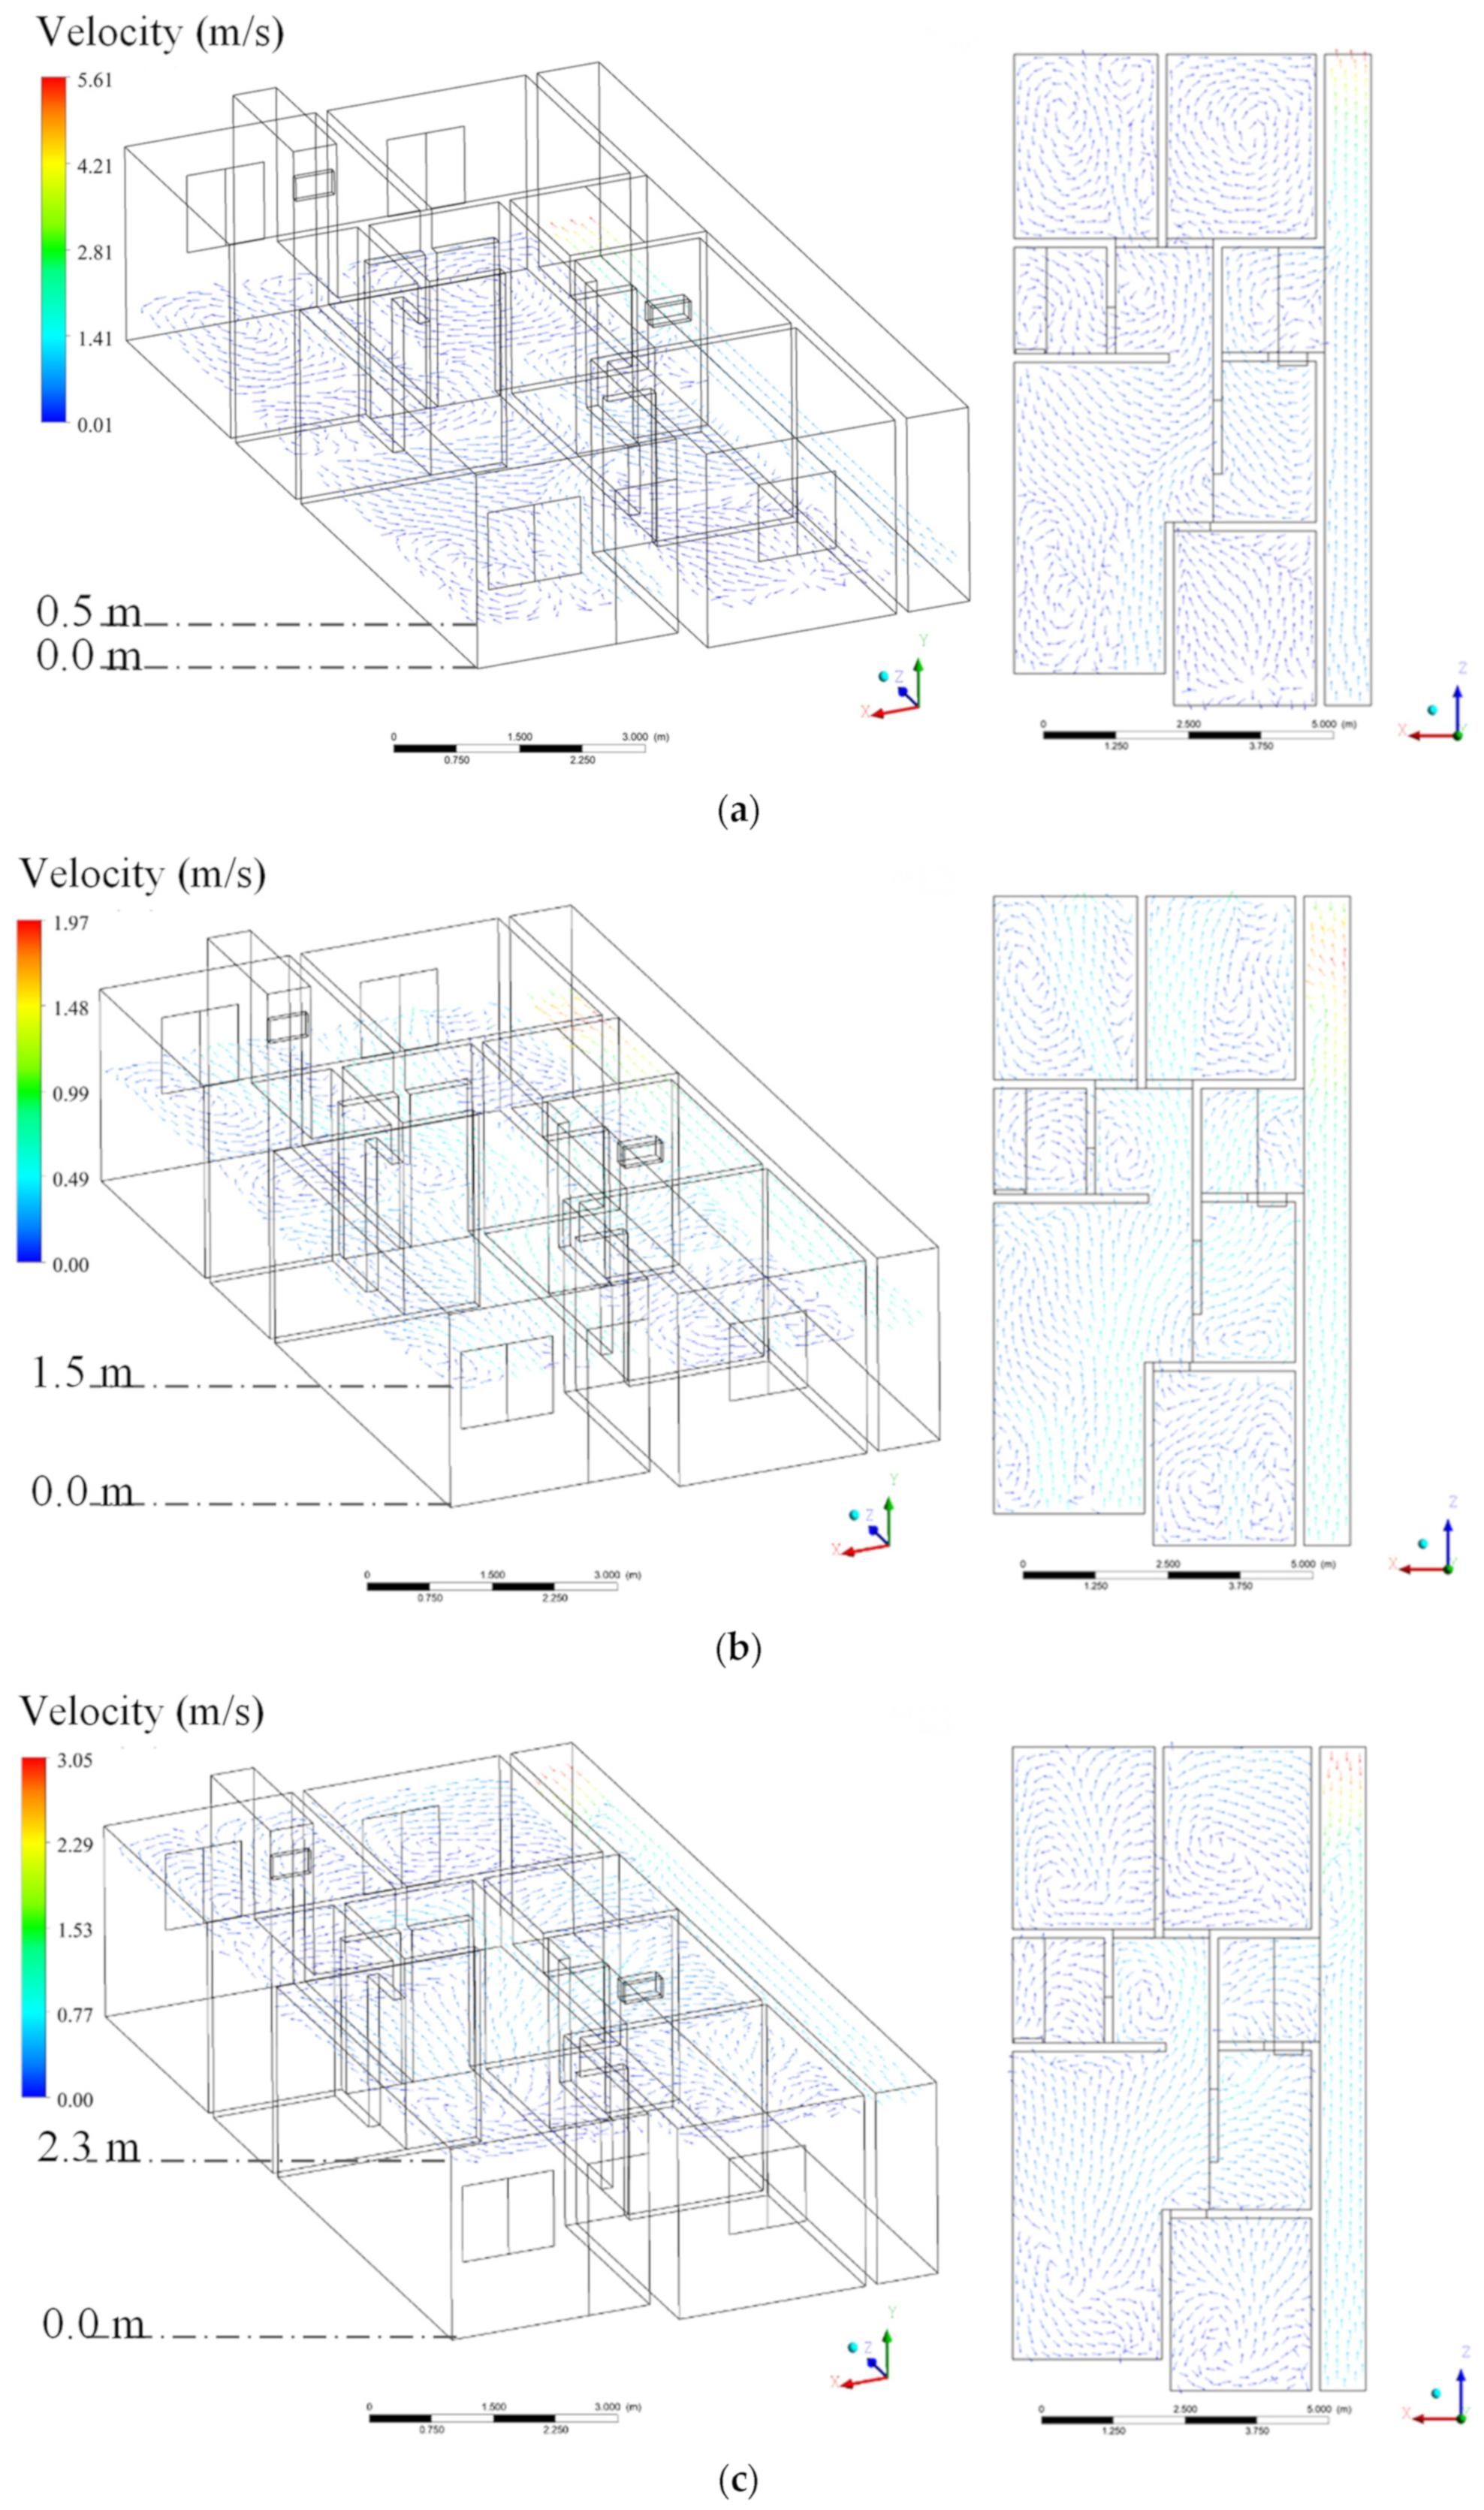
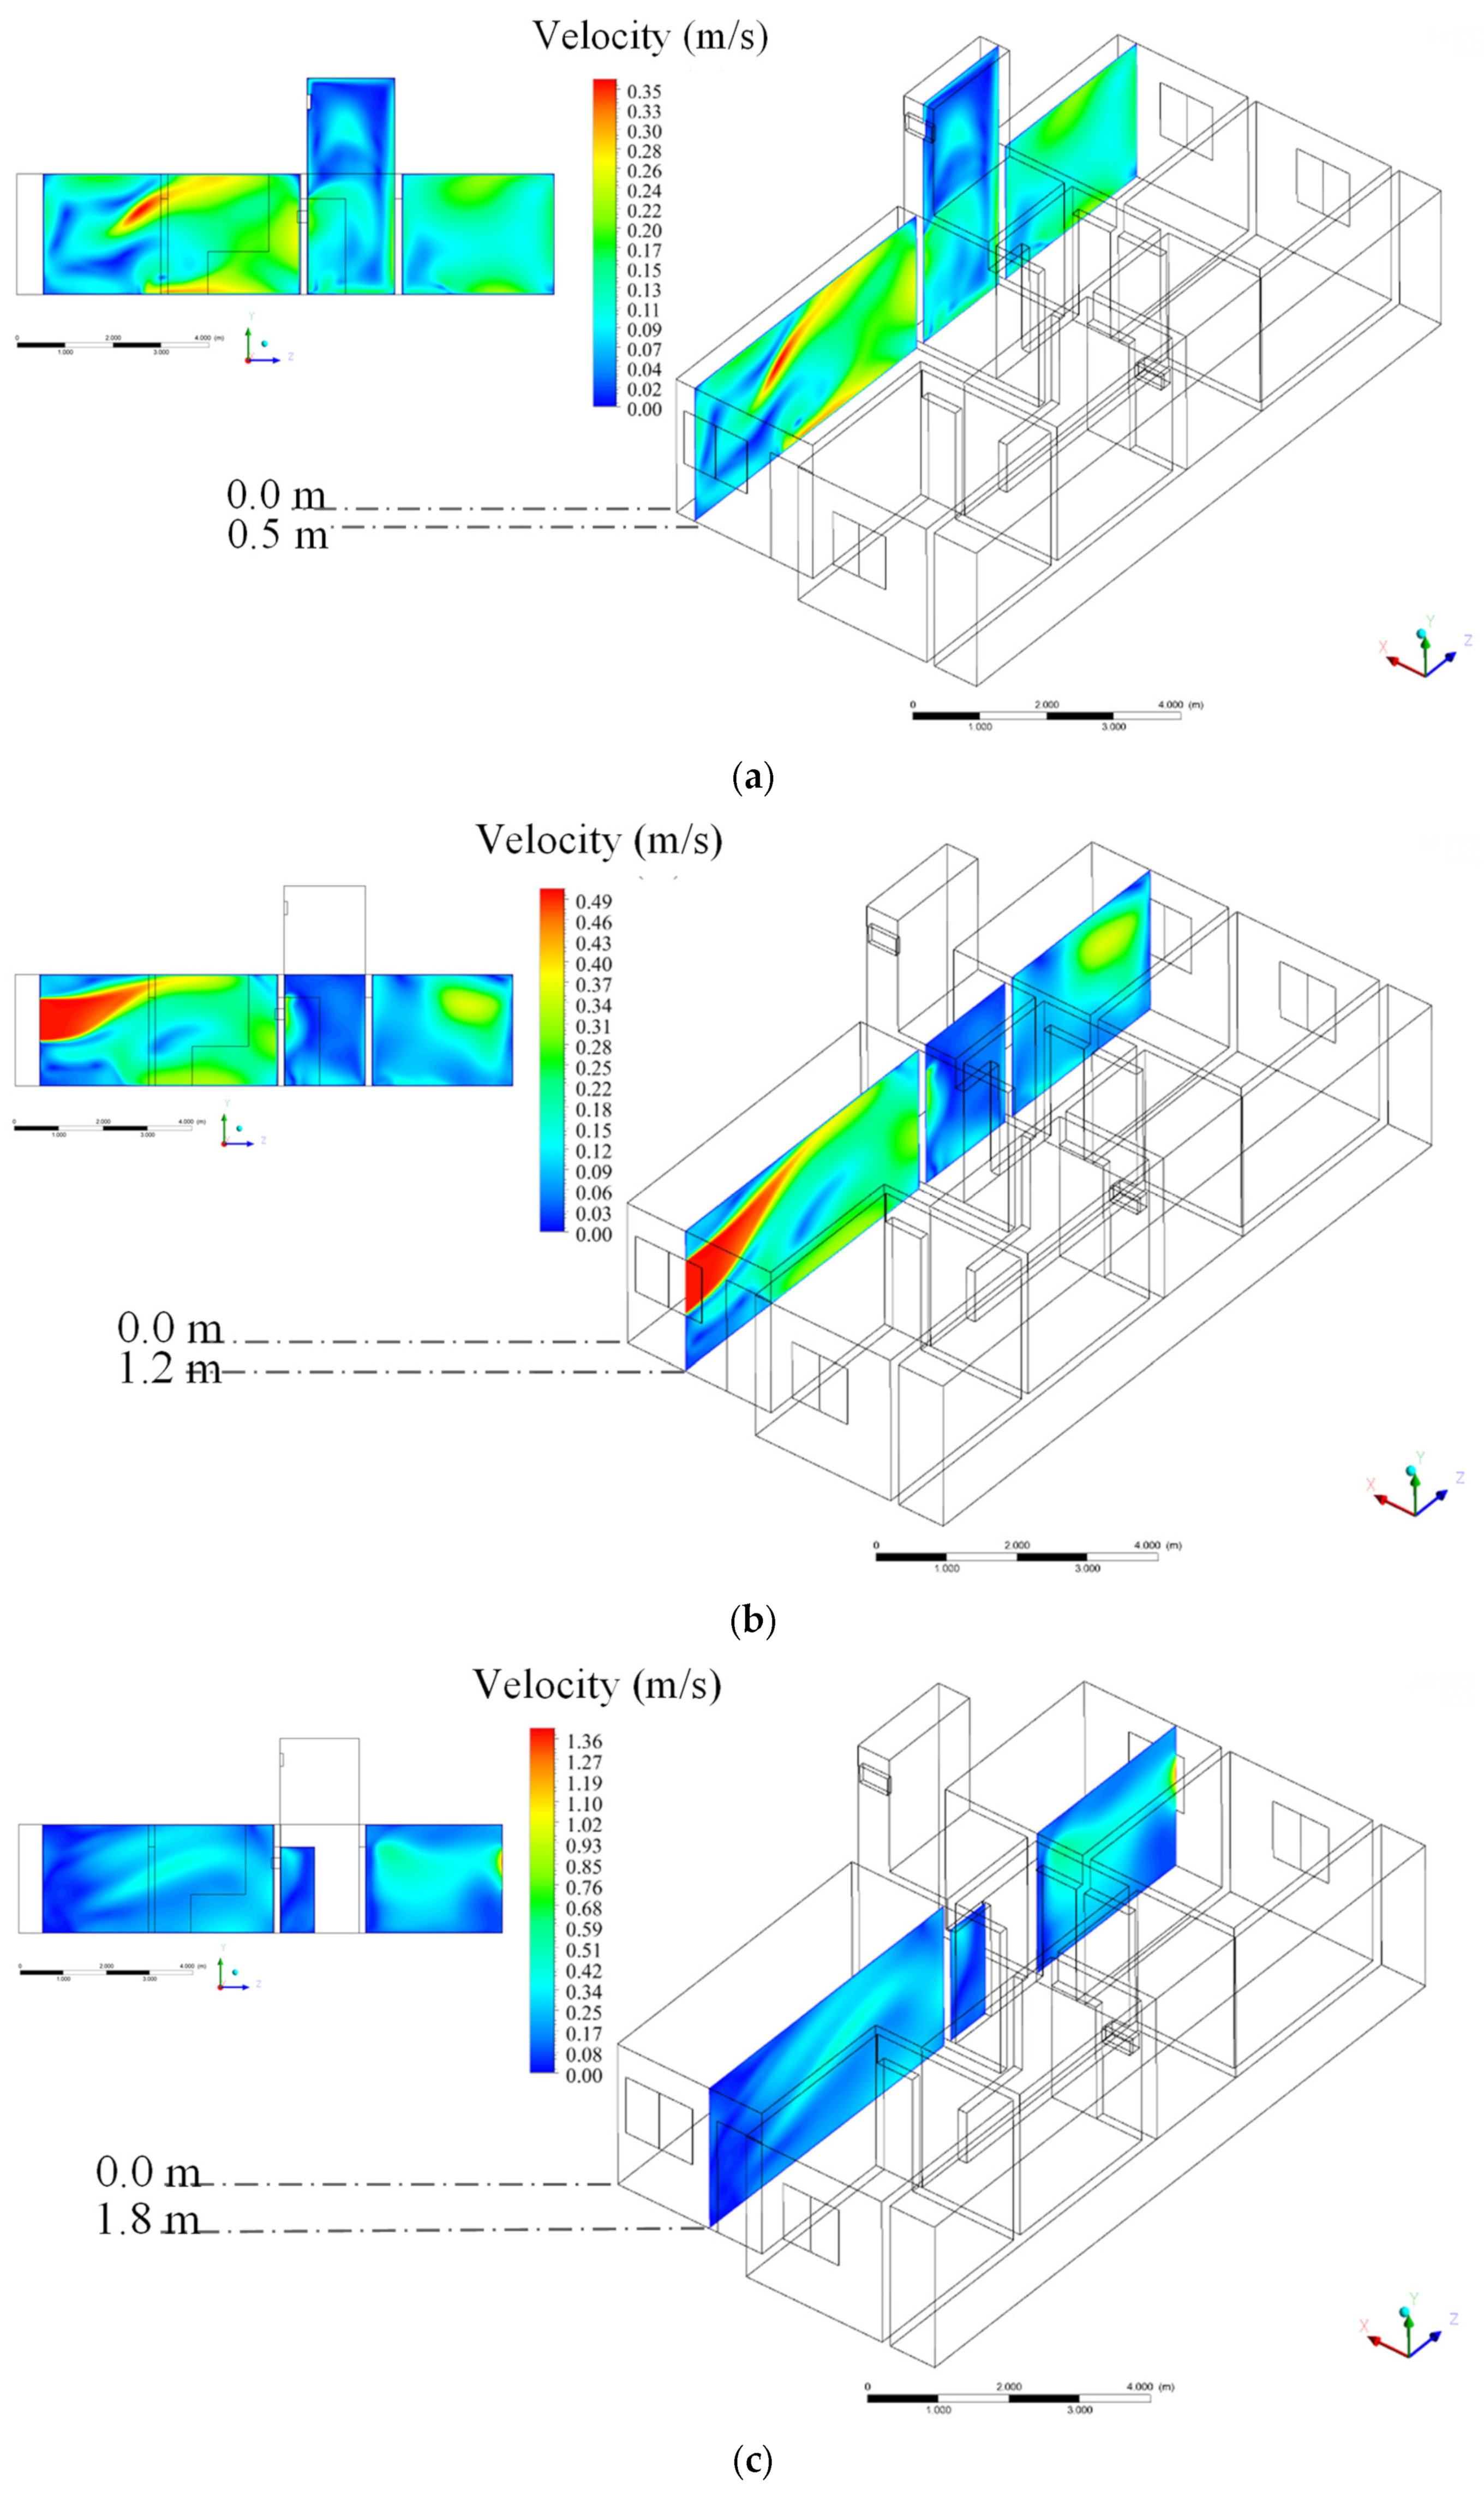
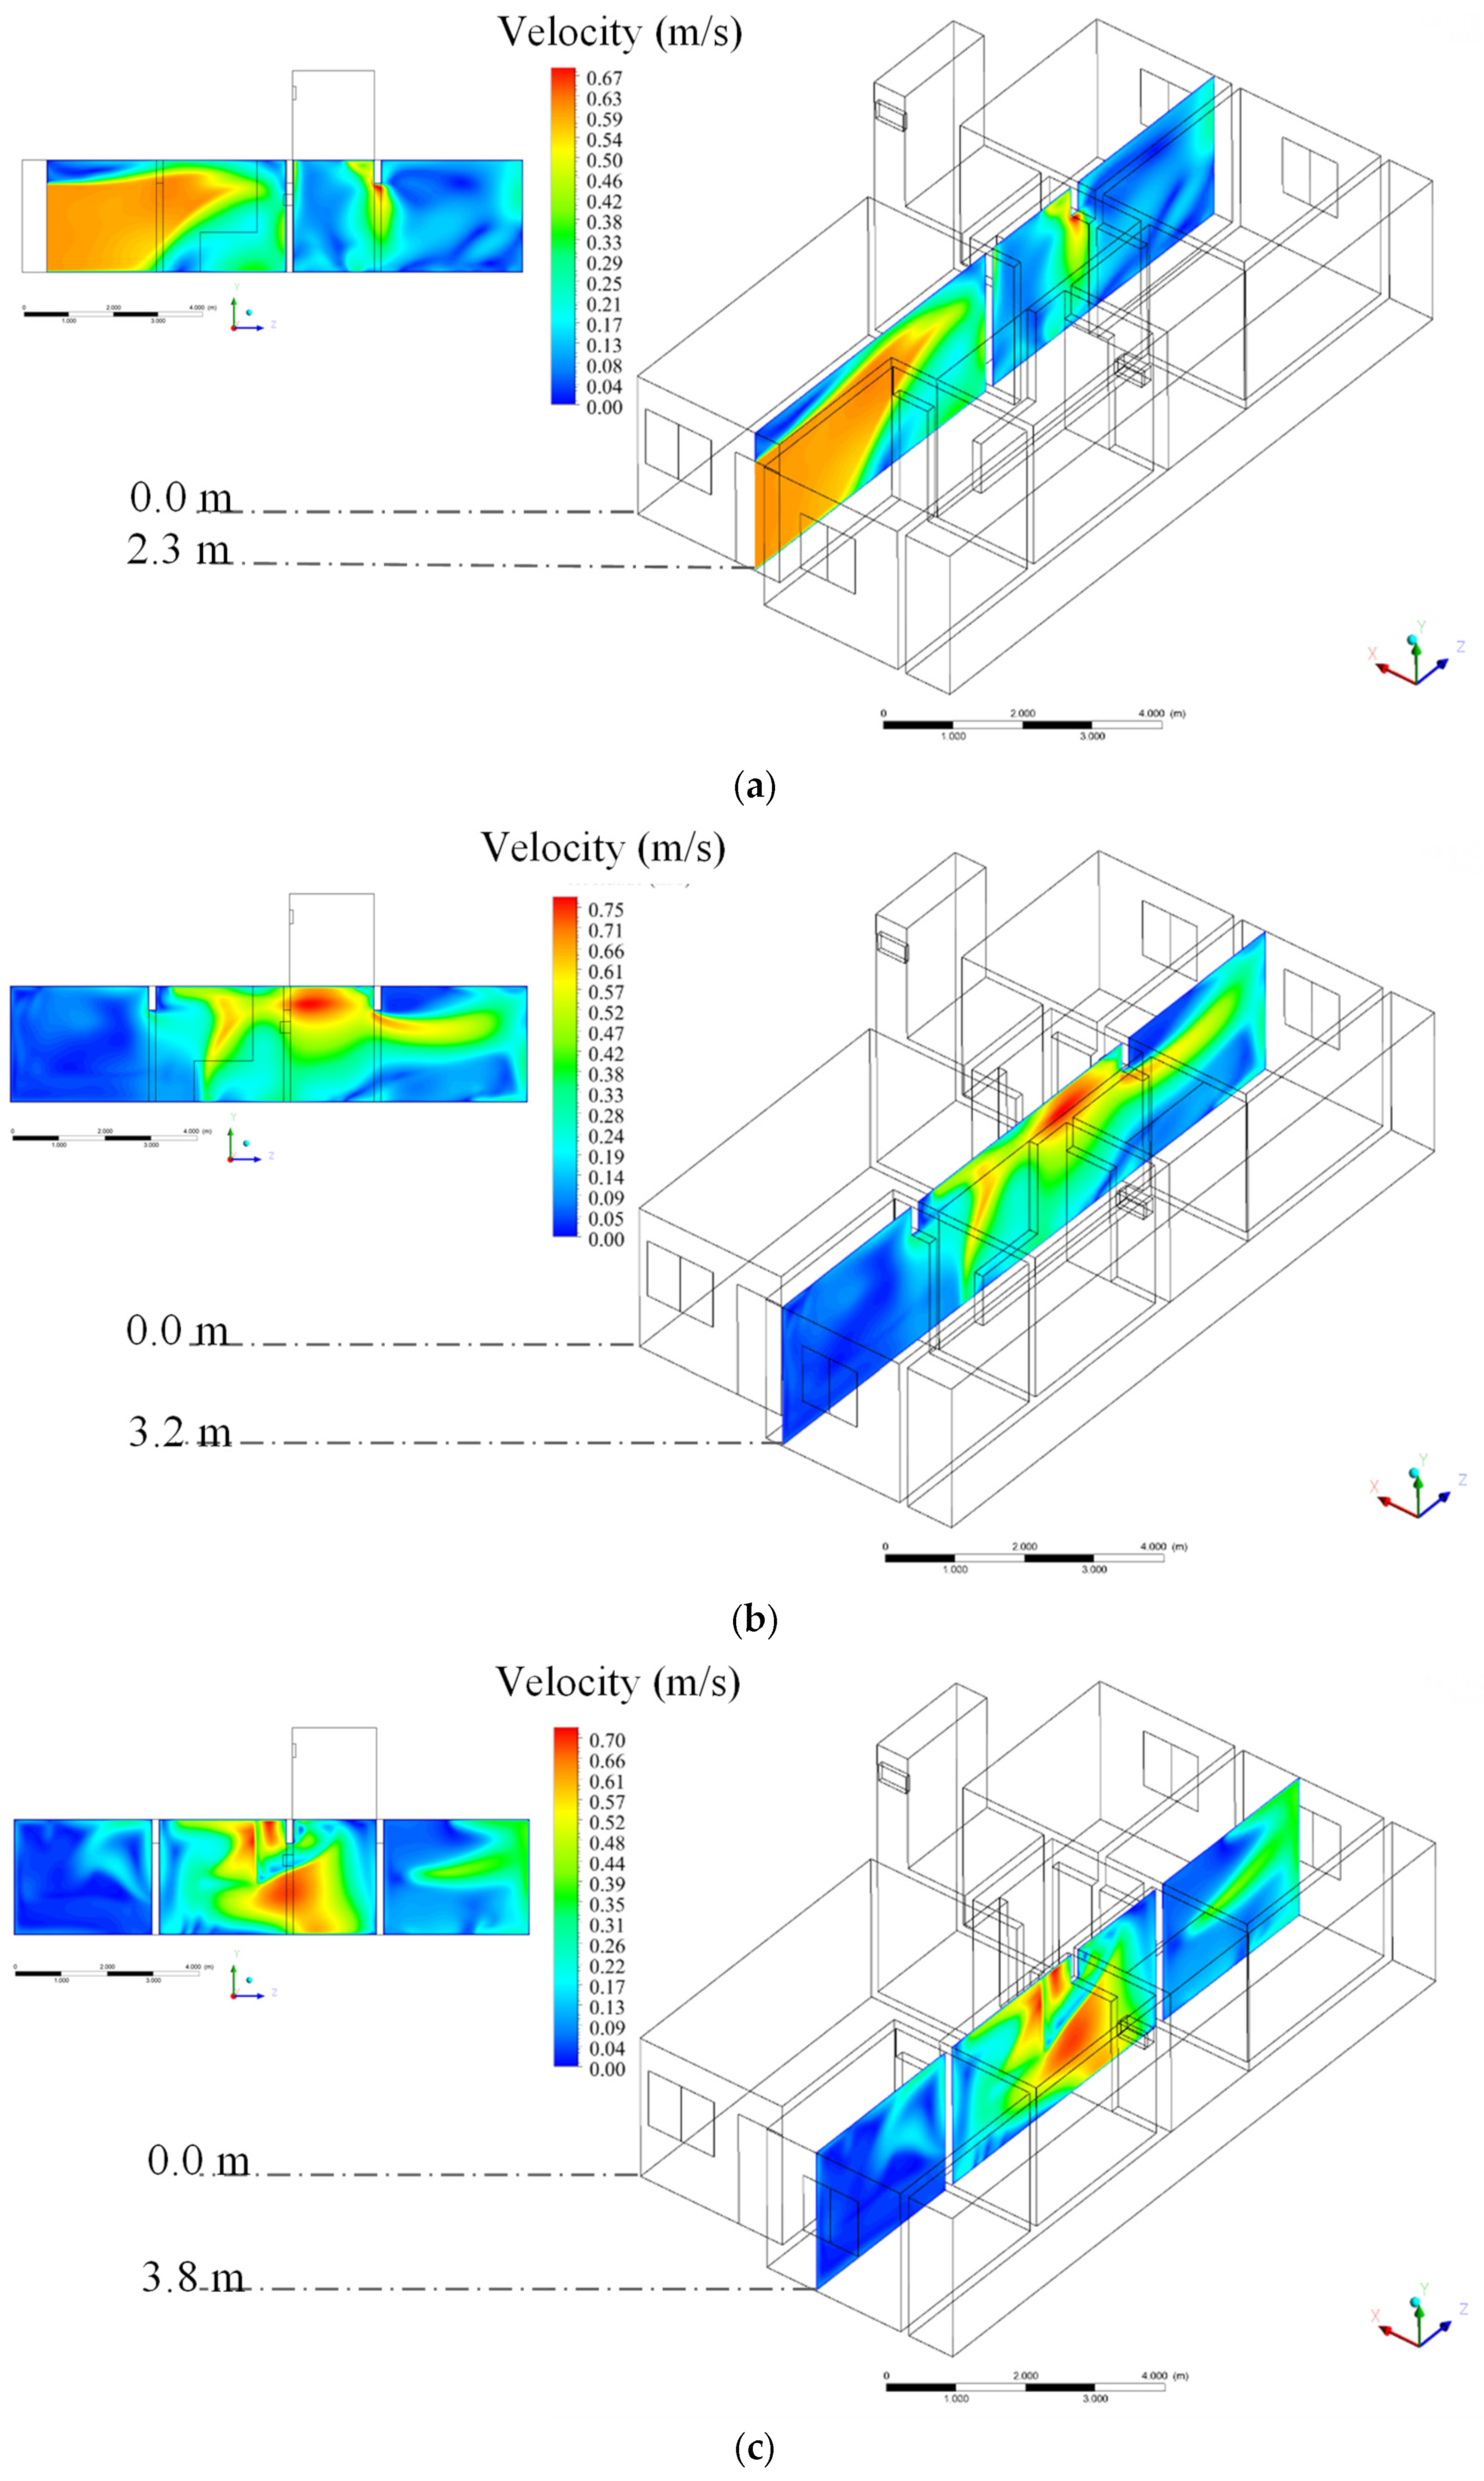
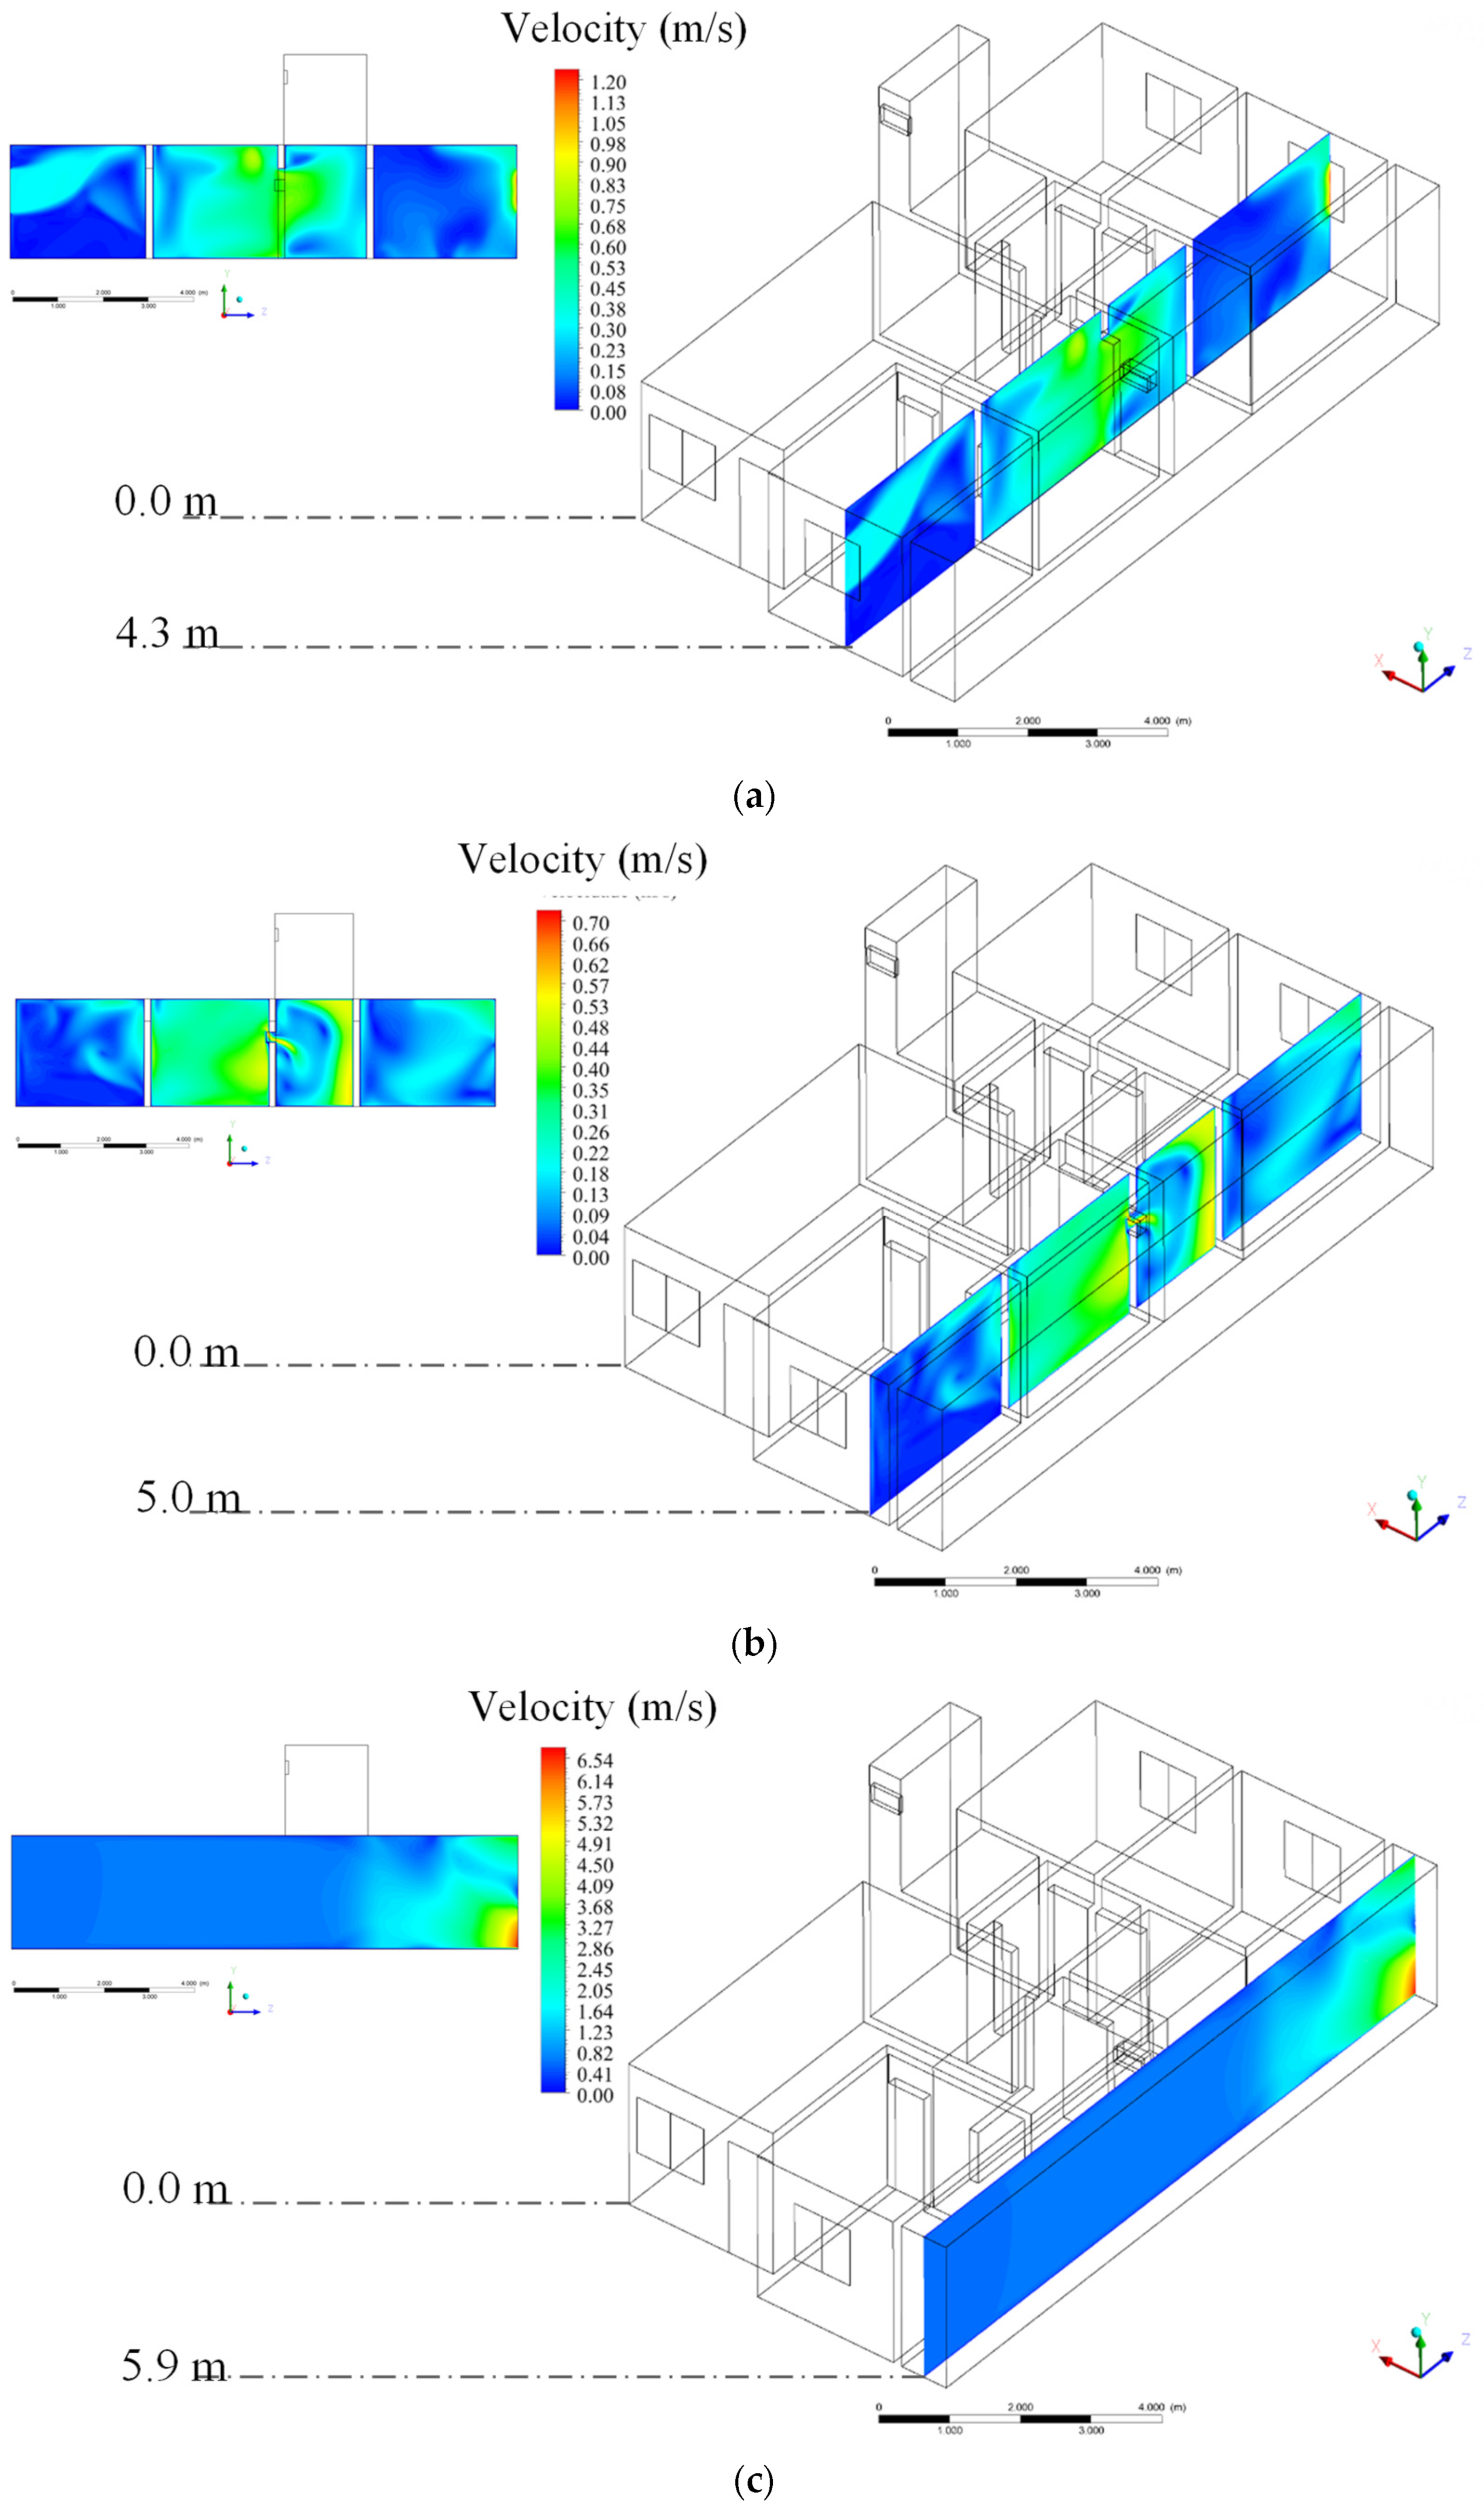
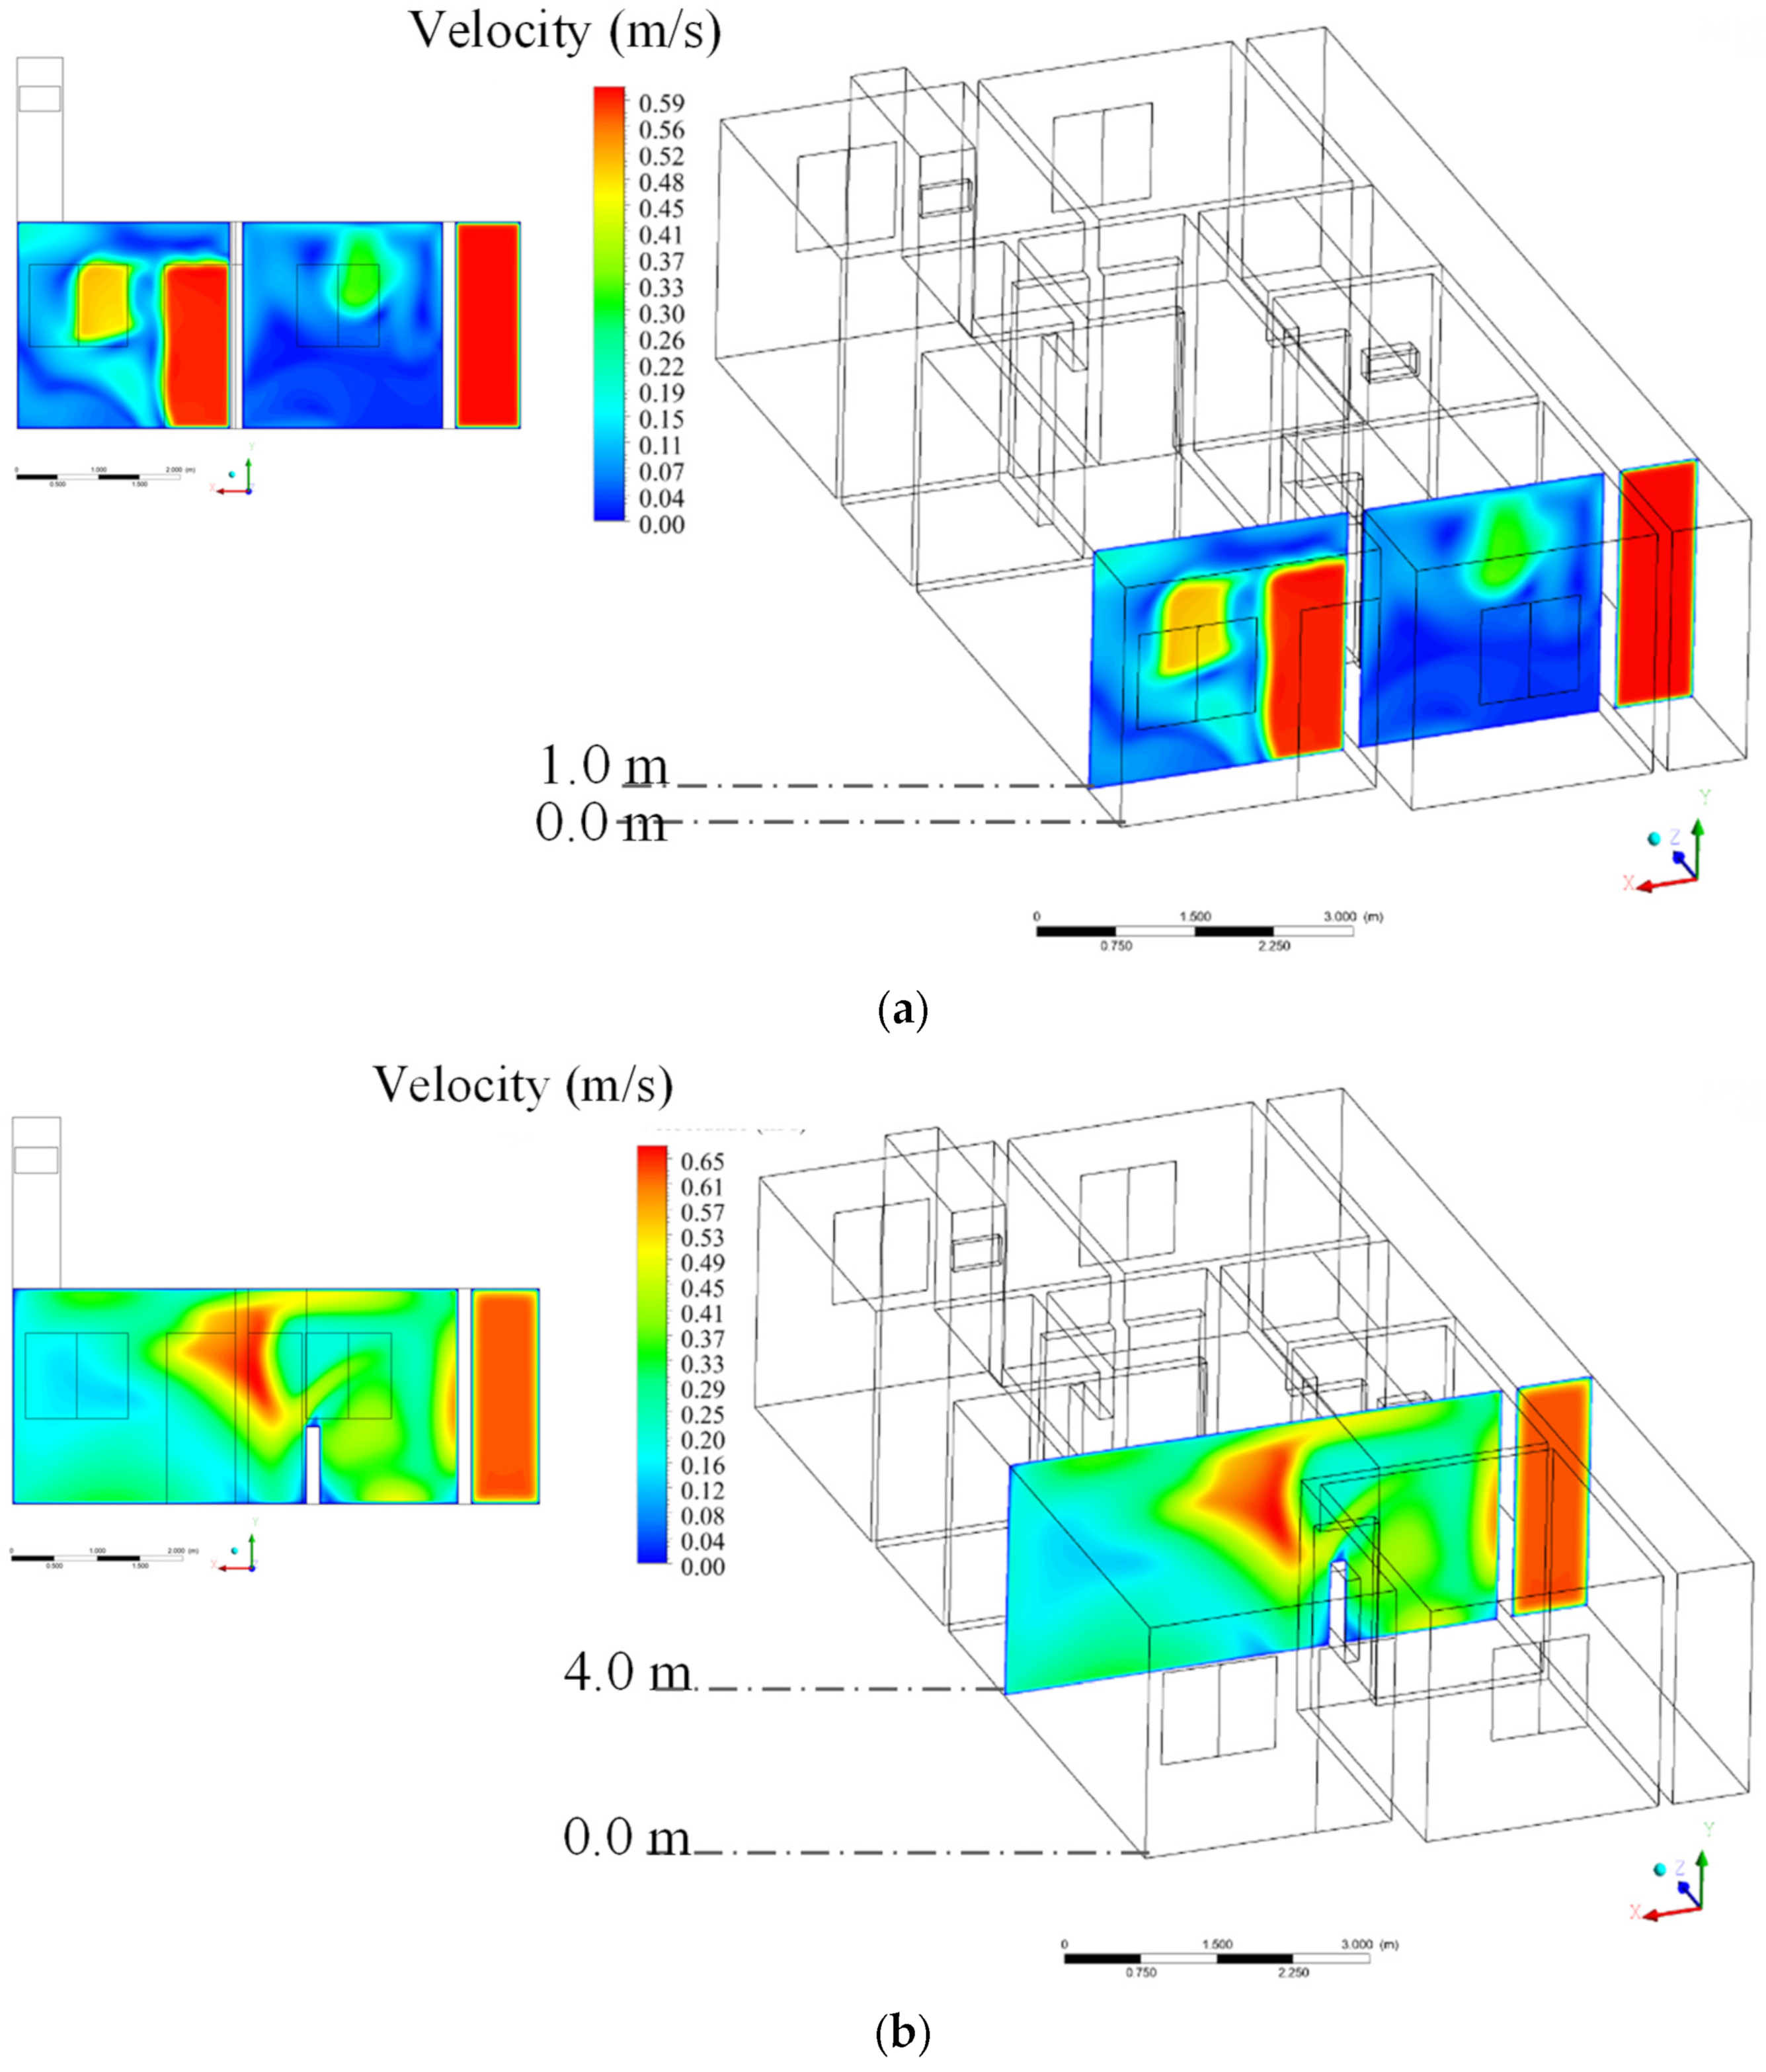
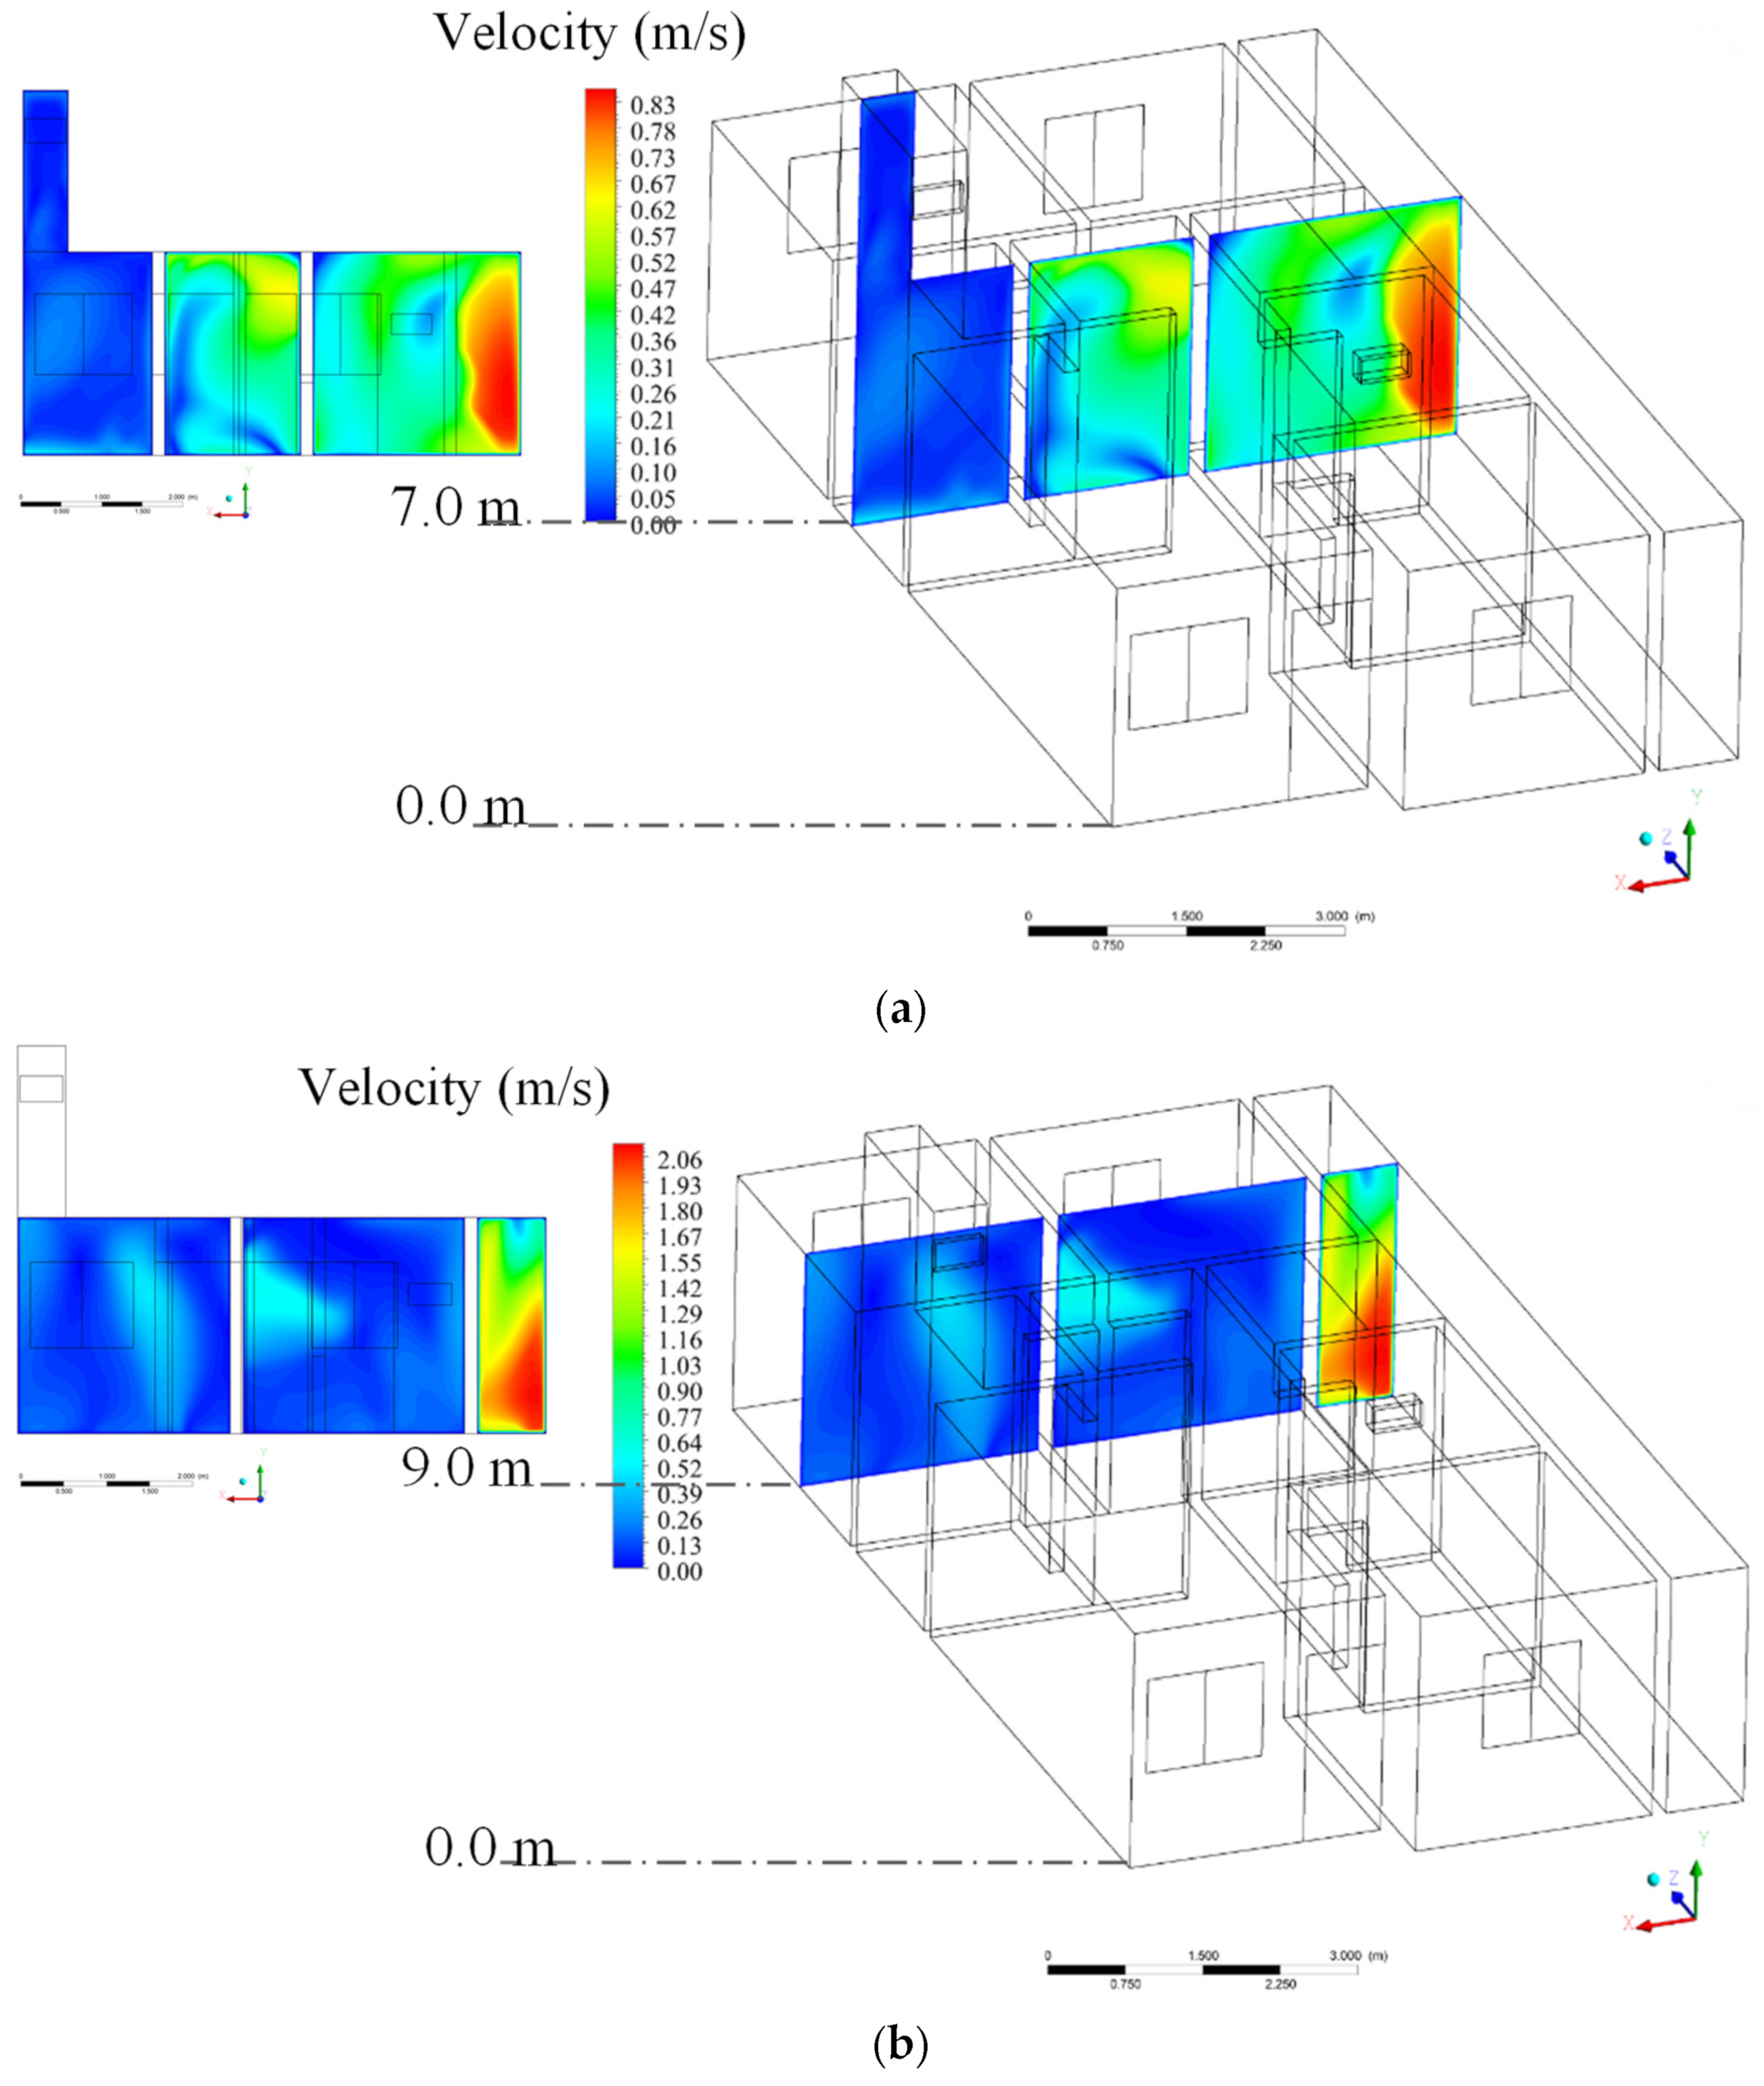
As a way of simplifying the interpretation of the results, the building geometry was subdivided into planes. These plans are shown in Figure 5, Figure 6 and Figure 7. For the top planes, the building was subdivided into three heights, starting from the entrance face (0.0): at 0.5 m, 1.5 m, and 2.3 m, respectively, specified in the Y-axis direction. For the lateral planes, the building was segmented into 9 (nine) planes from the entrance face (0.0): at 0.5 m, 1.2 m, 1.8 m, 2.3 m, 3.2 m, 3.8 m, 4.3 m, 5.0 m, and 5.9 m, respectively, specified in the X-axis direction. For the frontal planes, the building was segmented into 4 (four) planes from the entrance face (0.0): at 1.0 m, 4.0 m, 7.0 m, and 9.0 m, respectively, specified in the Z-axis direction.
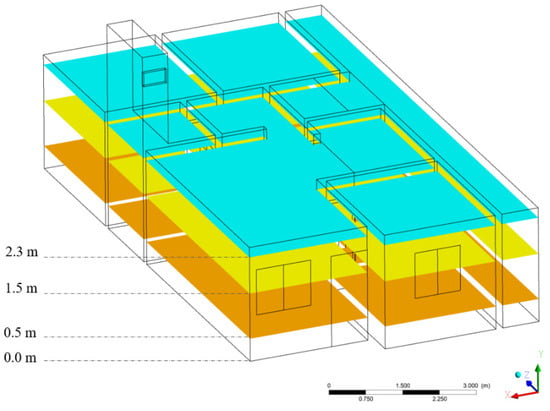
Figure 5.
Location of the top planes and their respective heights (Y-axis).
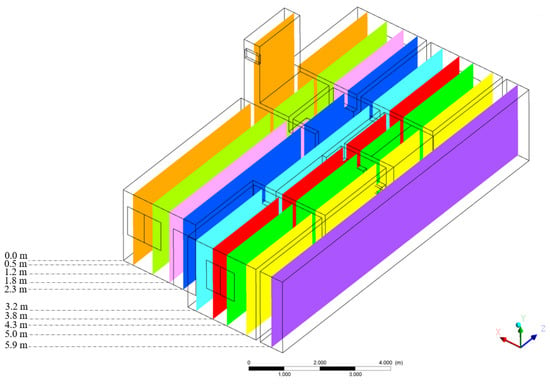
Figure 6.
Location of the lateral planes and their respective distances (X-axis).
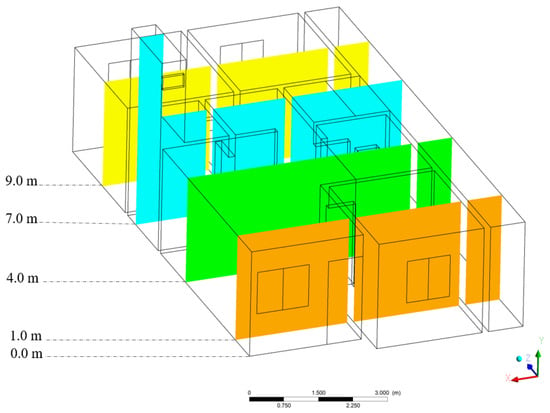
Figure 7.
Location of the frontal planes and their respective distance (Z-axis).
3. Results and Discussion
3.1. Experimental
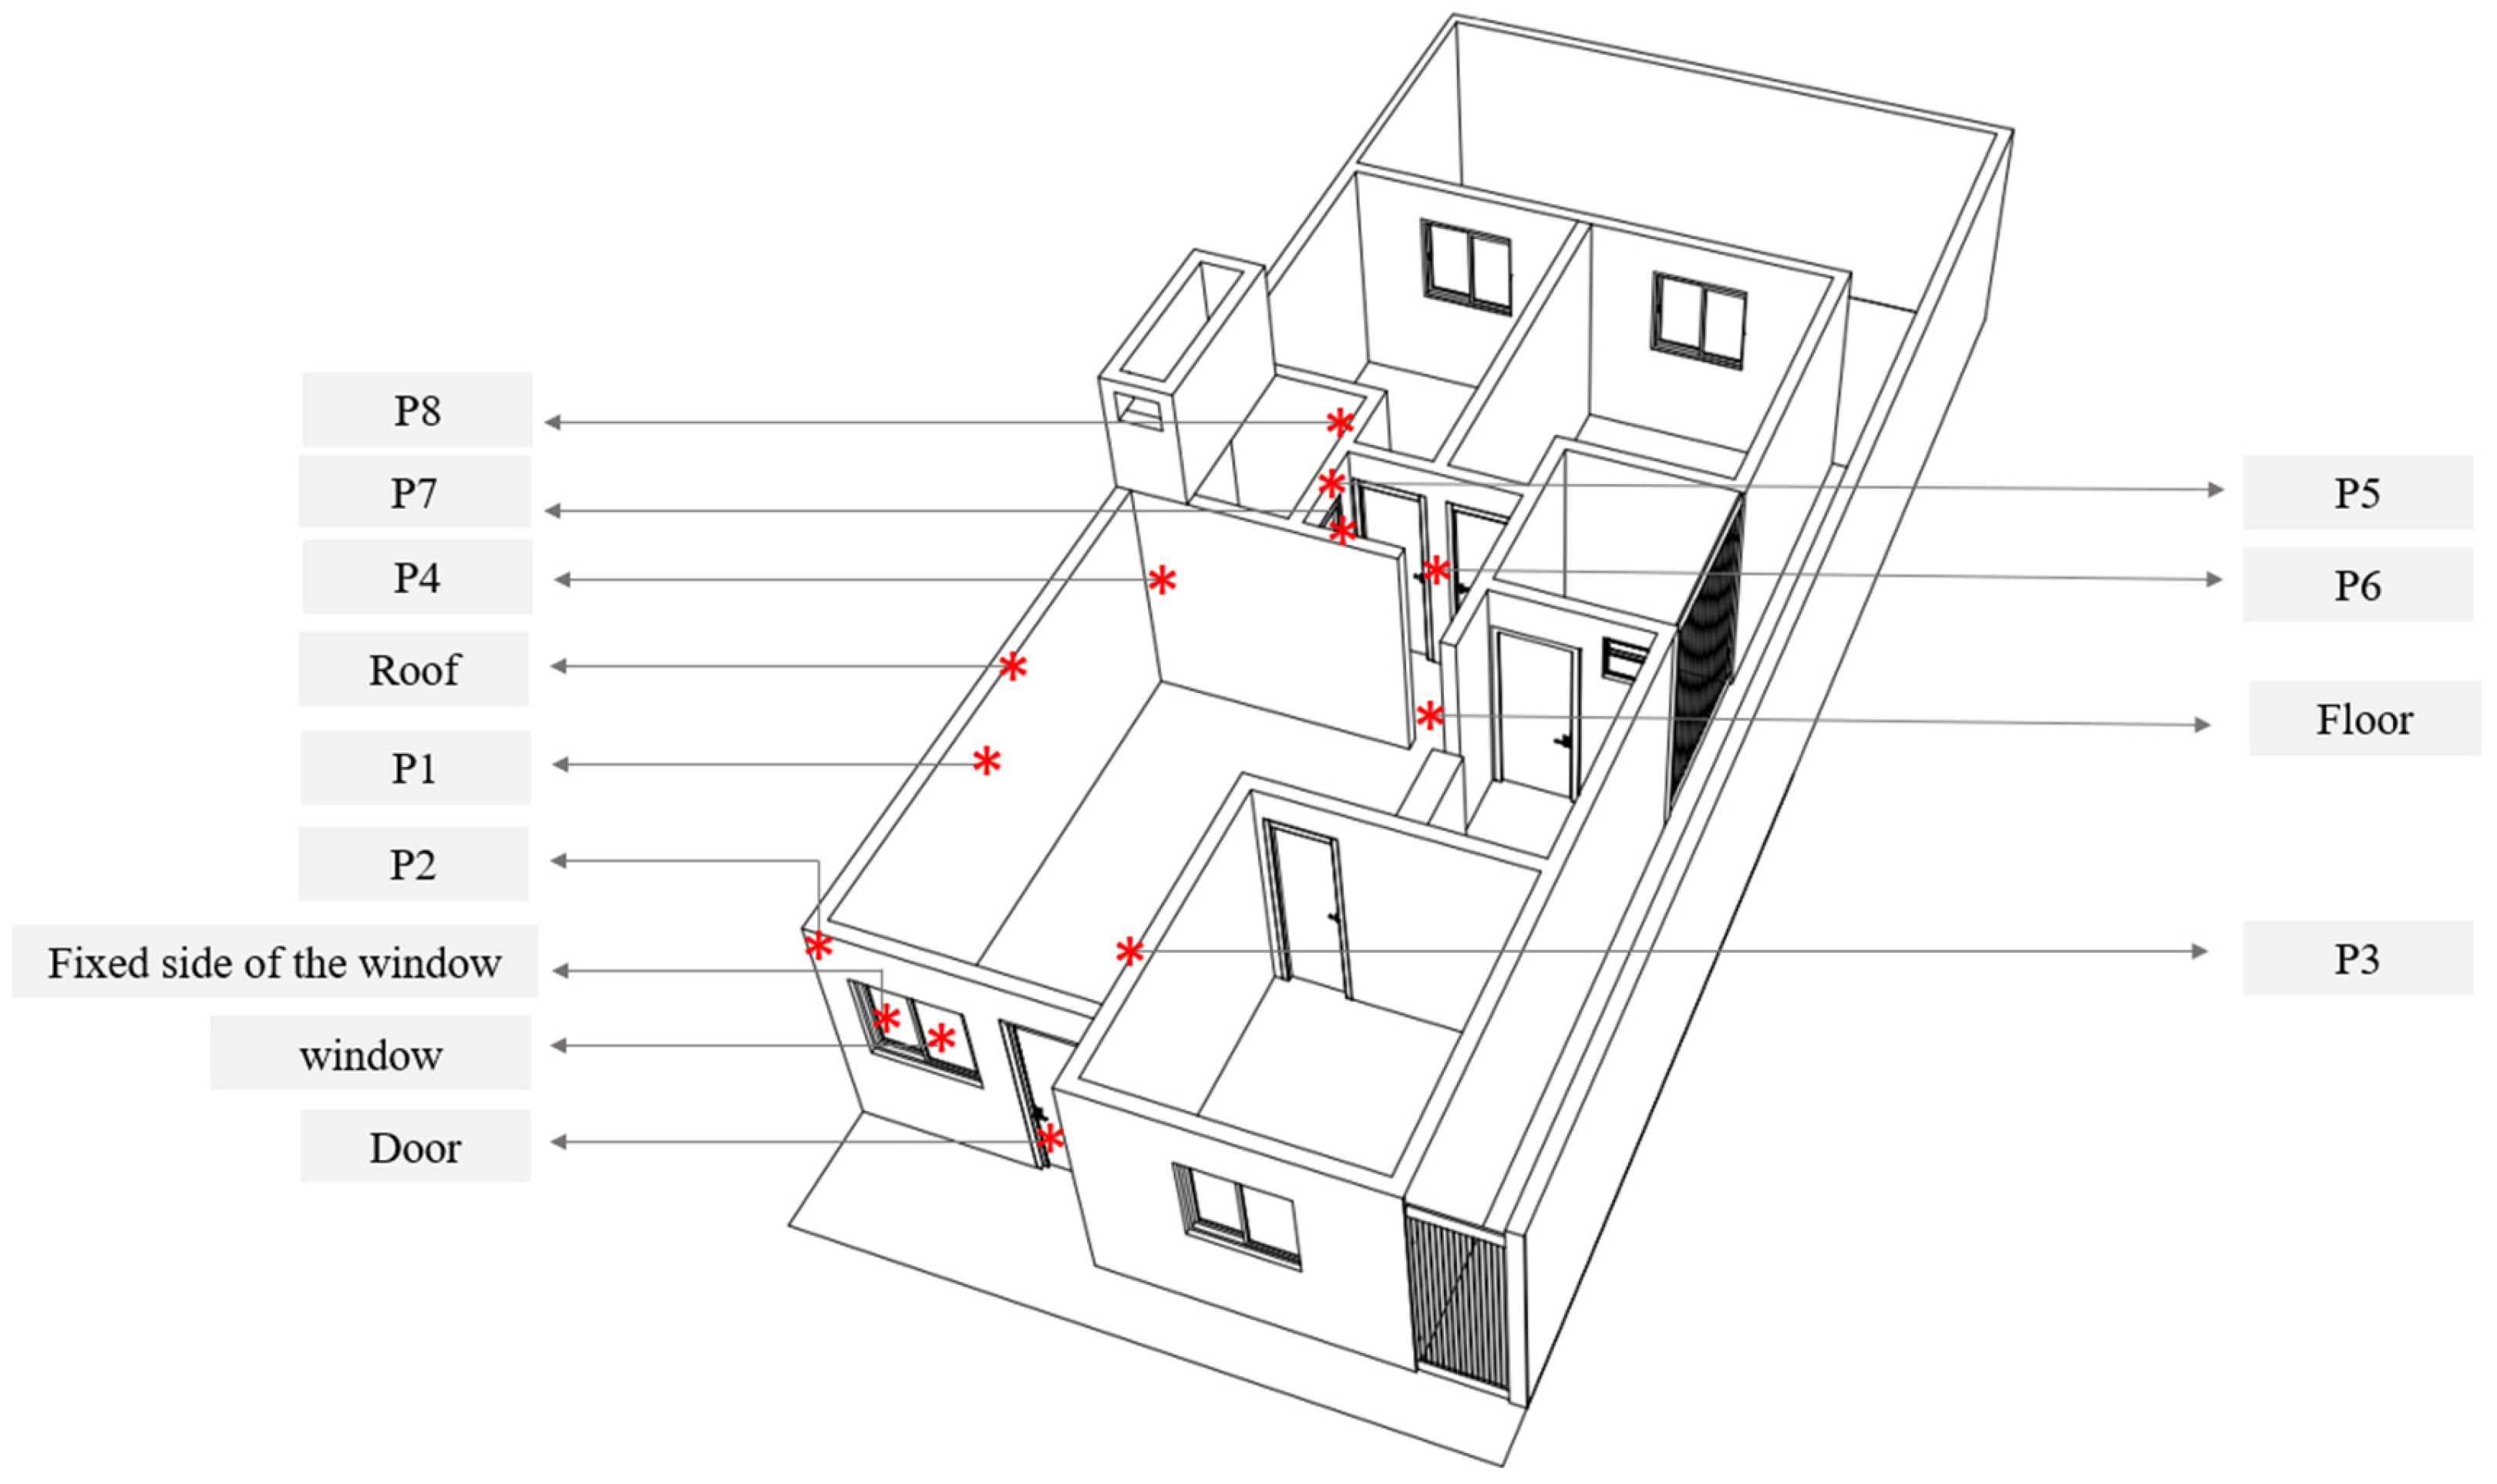
In Figure 8, the measurement points in the integrated room are specified. Table 5 summarizes the results obtained in the integrated living and dining room, showing the resulting values of each face, here called walls, ceiling, and floor, as well as the window openings.
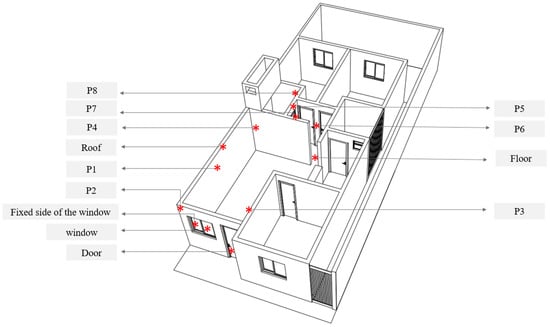
Figure 8.
Measuring points in the integrated room environment.

Table 5.
Results of measurements of velocity, temperature, and relative humidity of the air in the integrated room.
Analyzing the results of Table 5, it can be seen that in the same environment, there was a temperature variation of around 3.6 °C, where the highest obtained values come from the faces close to the main facade, with East orientation (door, exit window, and fixed part of the window), which is justified by the fact that it receives direct solar radiation. The airflows that enter the building are hot, so higher temperature values are observed near the air inlets. Although the East orientation is indicated for long-stay environments, such as living rooms and bedrooms, due to the time at which the temperature measurements were taken, around 11:25 a.m., the environment had already received significant sunlight, given its sunrise position. On the other hand, a downward trend was observed in the temperature values on the faces closest to the interior of the building.
It is important to note that, although window openings generally contribute to the reduction of energy consumption and heat alleviation, since they influence the incidence of light and airflow into the building, the results show air velocity at the building entrances between 0.5 m/s and 0.6 m/s. According to the methodology described by Alaman [24], although the air velocities at these points are in the range considered “pleasant for short-stay environments”, the evaluated building is classified as a long-stay environment, requiring to promote higher air velocities to the interior of the building to improve the thermal comfort.
Figure 9 specifies the measurement points in the building’s bathroom, and Table 6 summarizes the results obtained in this environment. Analyzing the results reported in Table 6, it appears that the values obtained for temperature are lower than those found in the integrated room environment, varying around 2 °C. Because it is a wet area, the relative humidity of the air is higher than in the rest of the house. This space does not have a direct window opening to the outside, because it is a linked house, so the exhaustion takes place through an opening skylight. It is known that, due to thermal convection, hot air, being less dense, tends to rise, due to the buoyancy force, which explains the value presented in this environment to be the highest.
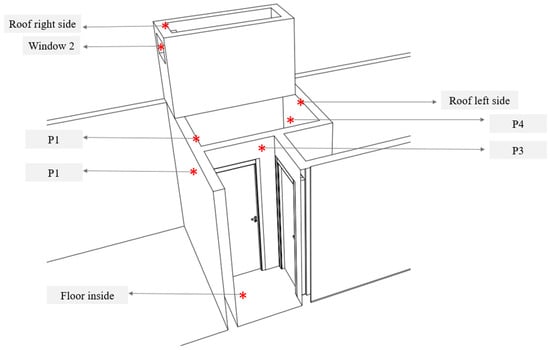
Figure 9.
Measuring points in the bathroom environment.

Table 6.
Results of air temperature measurements in the bathroom.
Figure 10 specifies the measurement points in the service area of the building, and Table 7 summarizes the results obtained in this environment. Analyzing the results, it appears that this space had the highest average temperatures compared to the rest of the house.
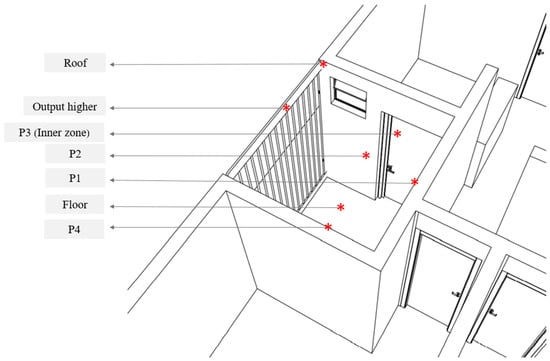
Figure 10.
Measuring points in the service area environment.

Table 7.
Results of air temperature measurements in the service area.
Figure 11 specifies the measurement points in the kitchen area, and Table 8 summarizes the results obtained in this environment. Analyzing the results, a variation of 0.2 °C is observed, this being the environment where there was a smaller variation compared to the rest of the residence. The face called P4 presented the highest temperature value due to the direct solar radiation it receives from the service area environment.
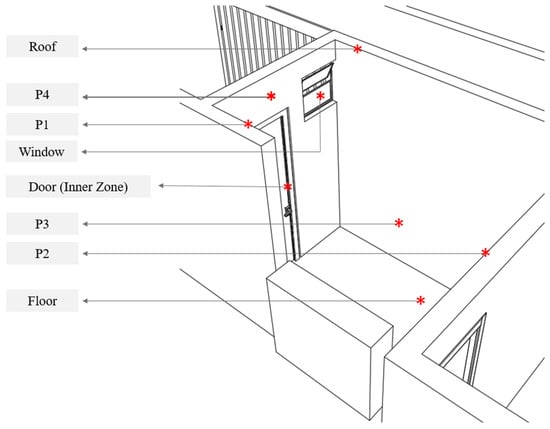
Figure 11.
Measuring points in the kitchen environment.

Table 8.
Results of air temperature measurements in the kitchen environment.
Figure 12 specifies the measurement points in the environment called Room 1 of the building, and Table 9 summarizes the results obtained in this environment. This space had high-temperature values, as they are located on the west side of the land. This can be verified through the temperature value of the face P4, precisely on the external wall that receives the greatest solar radiation.
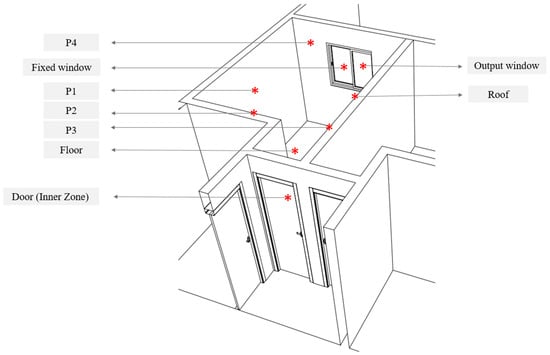
Figure 12.
Measuring points in the Room 1 environment.

Table 9.
Results of air temperature measurements in the Room 1 environment.
Figure 13 specifies the measurement points in the Room 2 environment of the building, and Table 10 summarizes the results obtained in this environment. The thermo-physical situation is very similar to that of Room 1, given its configurations. The P4 wall and the window opening wall showed the highest temperature values, due to the solar orientation. In both environments, the ceiling has a high-temperature value, which can be explained by the tendency of the warm air present in the environment to rise, due to the buoyancy forces and difference in density of hot and cold air.
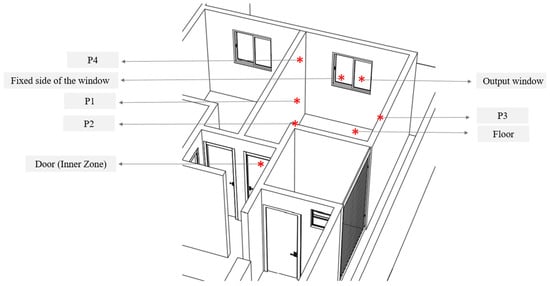
Figure 13.
Measuring points in the Room 2 environment.

Table 10.
Results of air temperature measurements in the Room 2 environment.
Figure 14 specifies the measurement points in the Room 3 environment of the building, and Table 11 summarizes the results obtained in this environment. It can be seen that the inlet window has the highest temperature value, demonstrating that hot air enters the building, raising the temperature on almost all sides of the analyzed room. As exposed in the integrated room environment, the same happens with the space of the rooms, where the highest values of temperature are on the faces close to the air outlet.
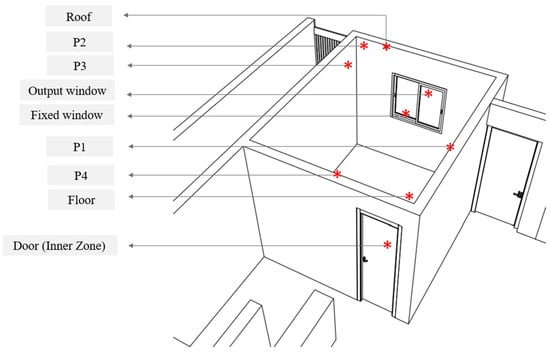
Figure 14.
Measurement points in the Room 3 environment.

Table 11.
Results of air temperature measurements in the Room 3 environment.
3.2. Theoretical (Simulated)
The results refer to the case in which the building was simulated without the presence of furniture and physical interference of users, in a steady state. It is known that the tendency is that, with the presence of these elements provoke changes in heat inside the residence and consequent heating of the environment. Thus, the existence of a critical scenario, even in the best conditions evaluated, demonstrates unsatisfactory conditions of thermal comfort. However, we notice that furniture adds thermal mass to the space inside the residence which could be beneficial minimizing the delivery of energy (heat) to the indoor air. On the other hand, occupants are responsible to added sensible and latent heat in the environment. These phenomena were not analyzed in this research.
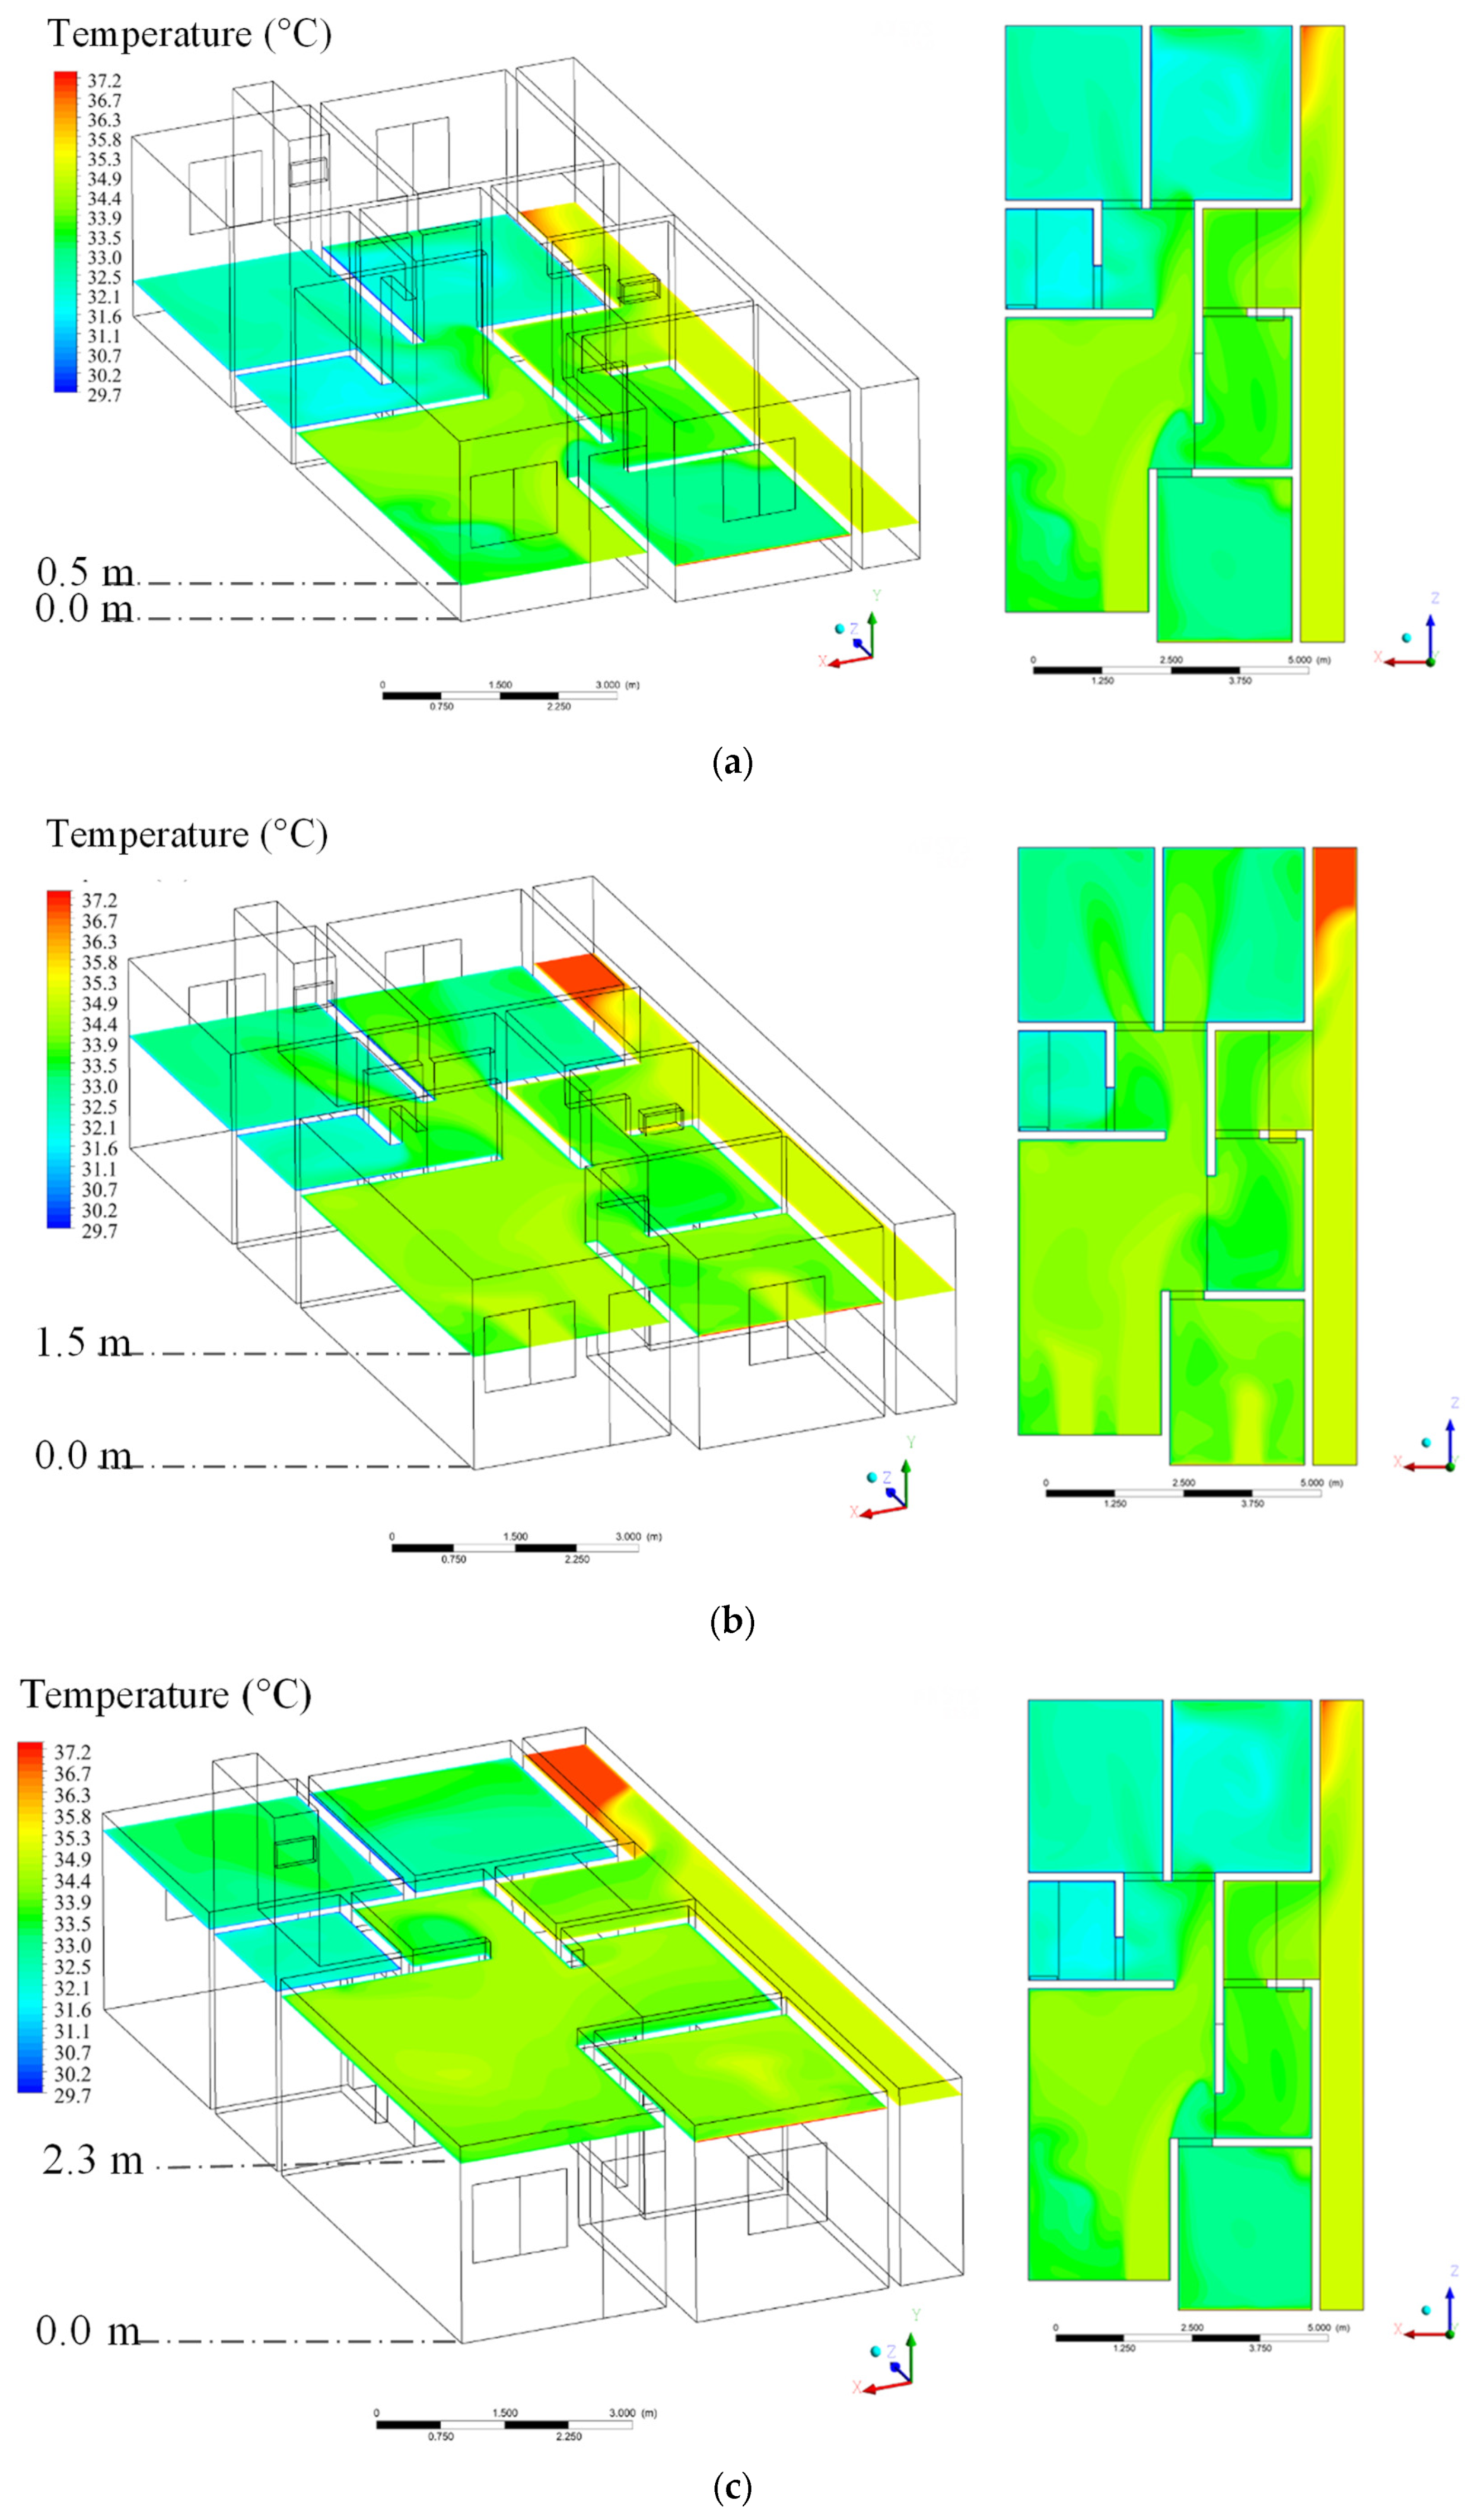
Figure 15, Figure 16, Figure 17, Figure 18, Figure 19 and Figure 20 illustrate the temperature distributions, in the top, lateral, and frontal planes, respectively. These graphs allow understanding of the temperature behavior both in 3D view and in sections, at different heights. Analyzing Figure 15, which illustrates the temperature in the top plane, it is possible to see that, in the section Y = 1.5 m, the temperatures become higher compared to the lower height, mainly close to the air inlets, due to the action of the hot airflows that enter the building at height Y = 1.10 m (window sill) and through the main door, as a result of external weather conditions. This can be explained by the fact that the data were collected on a hot day, typical of summer, and at a time of greater solar incidence, which causes the external temperature to be higher, as well as the temperature of the prevailing airflows. In this same plane (Y = 1.5 m), it is observed that the lateral setback of the building has a temperature above 37 °C, which remains constant throughout almost its entire length. The lateral setback of the building and the service area presented higher temperatures due to the solar orientation that promotes a greater incidence of solar radiation in these spaces.
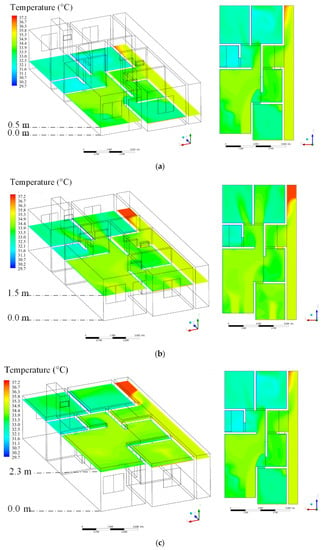
Figure 15.
Behavior of the air temperature inside the house (top planes). (a) Y = 0.5 m, (b) Y = 1.5 m, and (c) Y = 2.3 m.
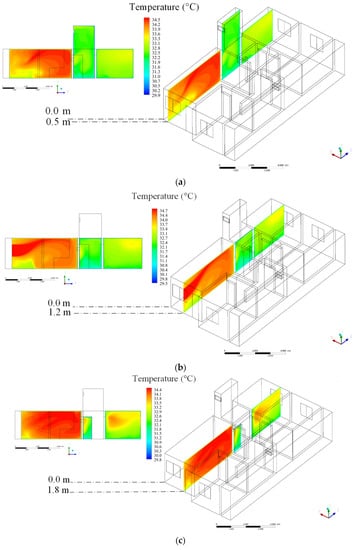
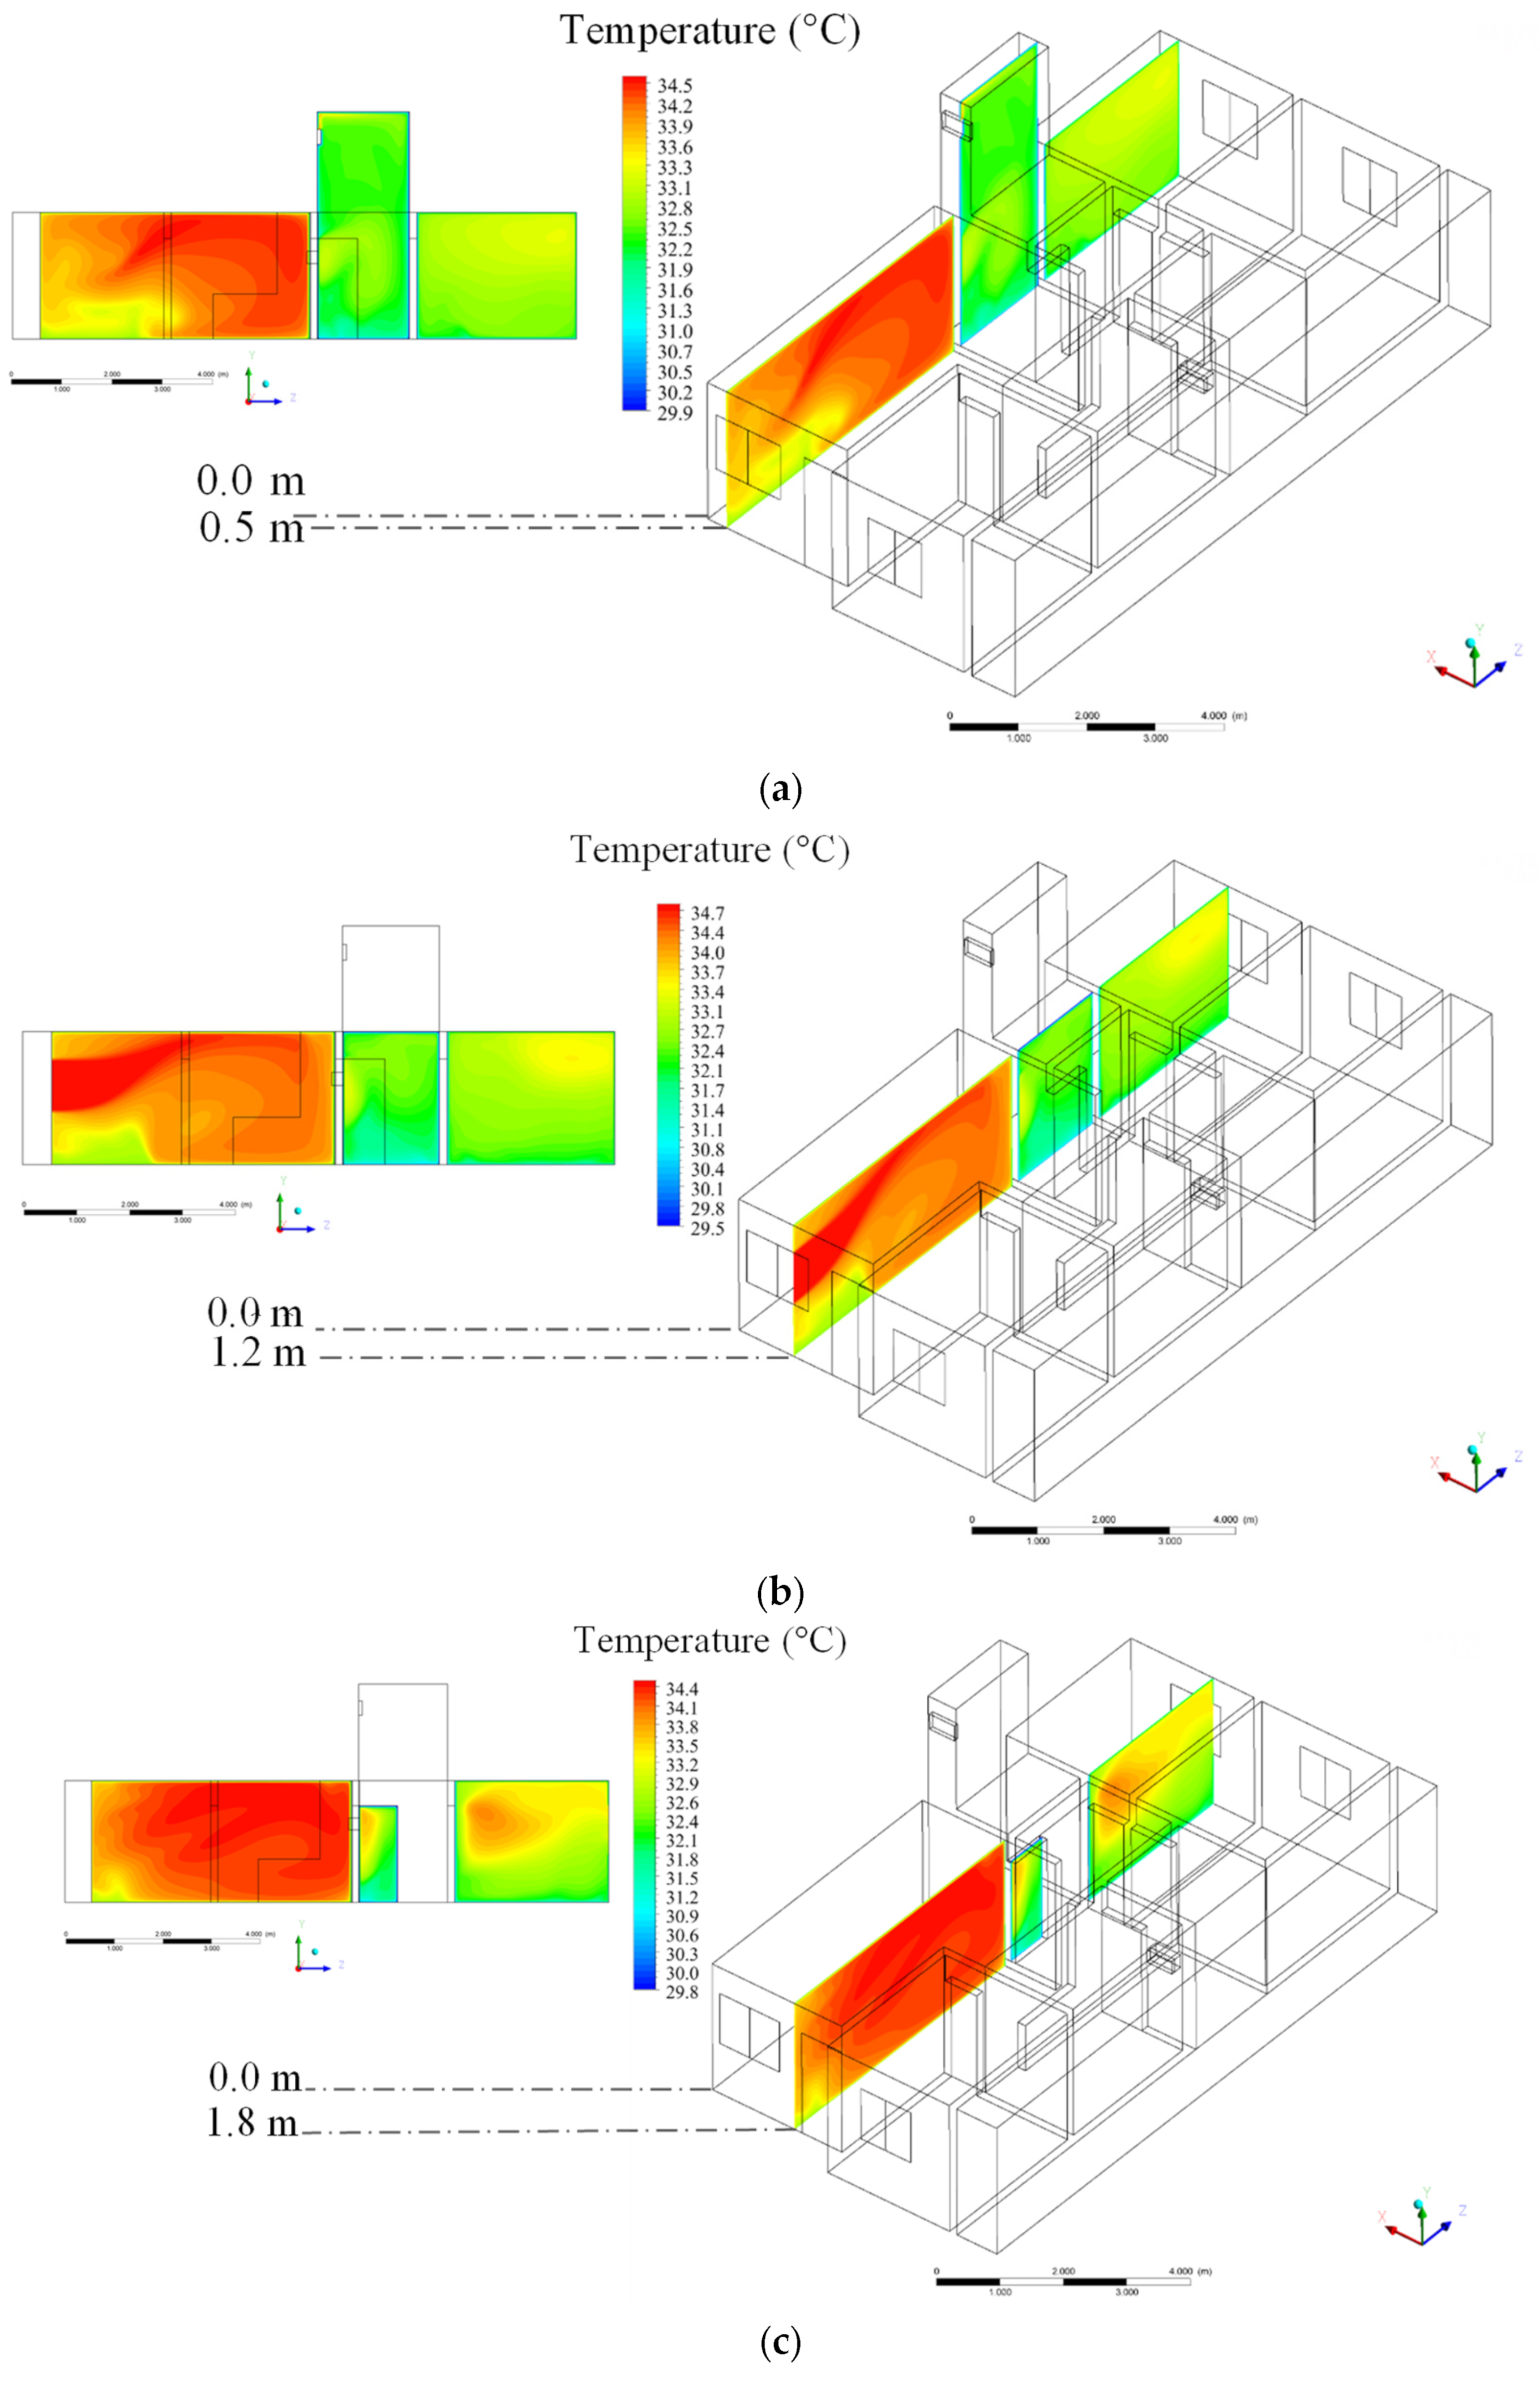
Figure 16.
Behavior of the air temperature inside the house (lateral planes). (a) X = 0.5 m, (b) X = 1.2 m, and (c) X = 1.8 m.
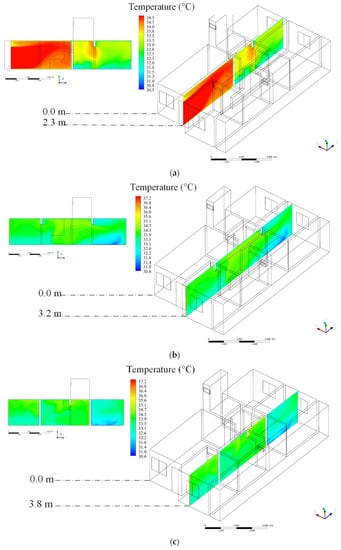
Figure 17.
Behavior of the air temperature inside the house (lateral planes). (a) X = 2.3 m, (b) X = 3.2 m, and (c) X = 3.8 m.
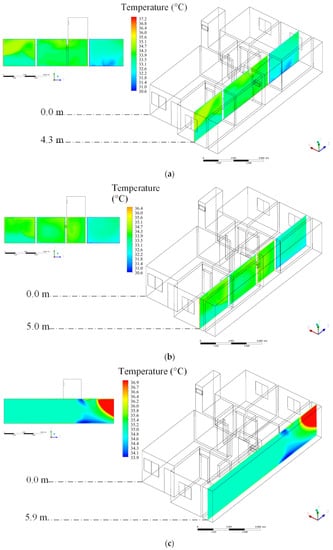
Figure 18.
Behavior of the air temperature inside the house (lateral planes). (a) X = 4.3 m, (b) X = 5.0 m, and (c) X = 5.9 m.
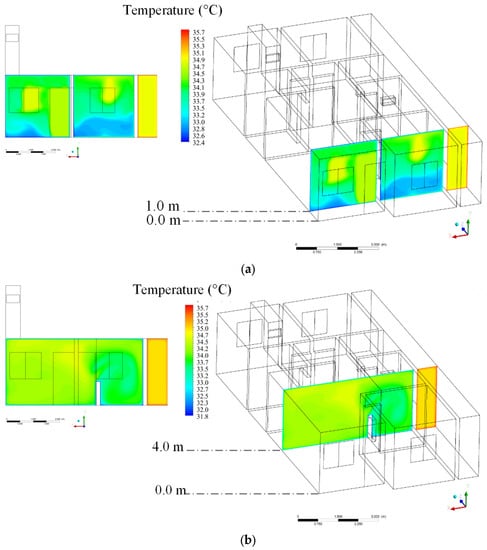
Figure 19.
Behavior of the air temperature inside the house (front planes). (a) Z = 1.0 m and (b) Z = 4.0 m.
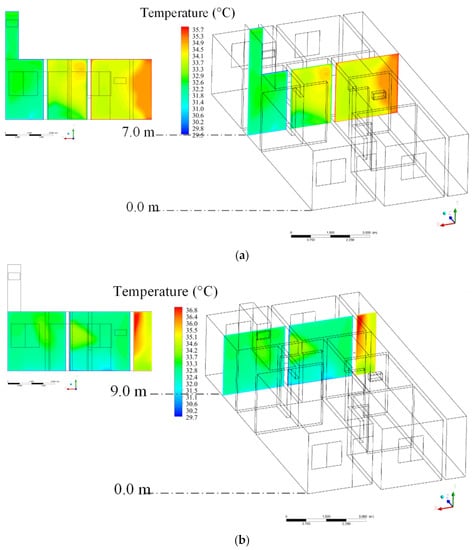
Figure 20.
Behavior of the air temperature inside the house (front planes). (a) Z = 7.0 m and (b) Z = 9.0 m.
In the lateral and frontal sections (Figure 16, Figure 17, Figure 18, Figure 19 and Figure 20), it is noticed that the temperature gradient starts to present lower values, especially in the posterior environments (Rooms 1 and 2). Although the solar orientation is critical (west) in this region of the building, the existence of window openings allows the existence of an air current coming from the entrance of the integrated rooms which favors cross ventilation between these environments. This type of geometric arrangement, where the openings are on opposite or adjacent walls, allows the entry and exit of air by pressure difference, generating a greater air circulation inside the building. Cross ventilation is a simple strategy capable of directing the incoming air, forming an air current that helps to ventilate the environment and reduce the effect of temperature. The bathroom had lower temperature values, which is justified by the high relative humidity of the air in this region.
It is observed that, in the lateral planes, the temperature tends to be higher close to the air inlets, which can be explained once again due to the cross ventilation in the environments, causing the temperature to decrease in the posterior rooms, despite unfavorable solar orientation (west).
Analyzing the results of the frontal planes, it is possible to visualize, through the chromatic scales, the same behavior already observed in the other planes: in the air inlets, the temperature tends to be higher, despite the shading generated by the front awning of the house. As the air enters, in the frontal plane at point Z = 4.0 m, there is a more uniform behavior of the temperature, with a slight reduction of this parameter close to the hallway, due to the air current in the place, generated by the pressure difference between room openings.
In the Z = 7.0 m plane (Figure 20a), it can be seen that the temperature is influenced by the opening skylight located in the bathroom of the building. It is possible to verify that, exactly in this room, there is a heat alleviation, because, although there is no frontal opening, this project strategy favors the recirculation of the airflows. The sectors in red and yellow (Z = 7.0 m and Z = 9.0 m), which indicate higher temperature values, are those facing the air inlet coming from the side setback (alley), which does not have any type of shading, so the air entering the building is warmer.
Figure 21, Figure 22, Figure 23, Figure 24 and Figure 25 illustrate the air relative humidity distributions, in the top, lateral and frontal planes, respectively. These graphs make it possible to understand the behavior of this variable through schematics in 3D views and sections, in different planes, along the X, Y, and Z axes.
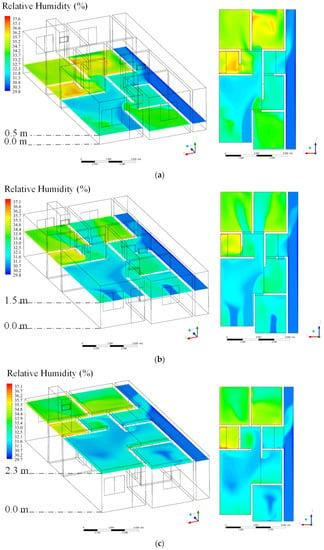
Figure 21.
Behavior of relative humidity inside the house (top planes). (a) Y = 0.5 m, (b) Y = 1.5 m, and (c) Y = 2.3 m.
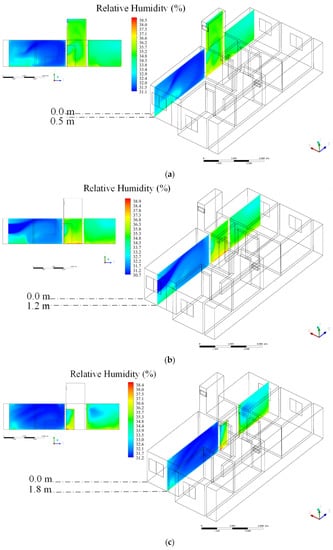
Figure 22.
Behavior of the air relative humidity inside the house (lateral planes). (a) X = 0.5 m, (b) X = 1.2 m, and (c) X = 1.8 m.
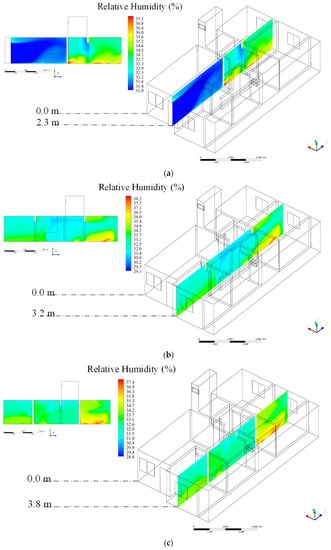
Figure 23.
Behavior of relative humidity inside the house (lateral planes). (a) X = 2.3 m, (b) X = 3.2 m, and (c) X = 3.8 m.
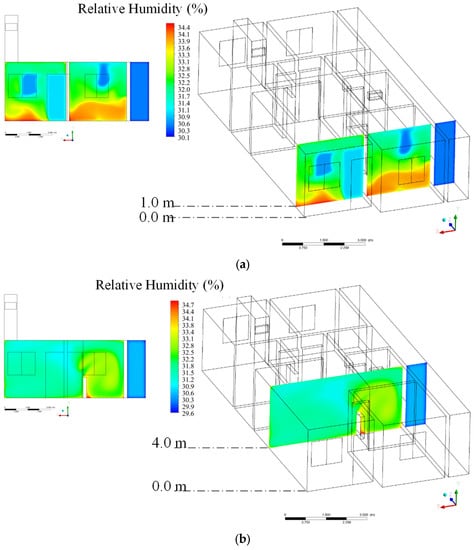
Figure 24.
Behavior of relative humidity inside the house (frontal planes). (a) Z = 1.0 m and (b) Z = 4.0 m.
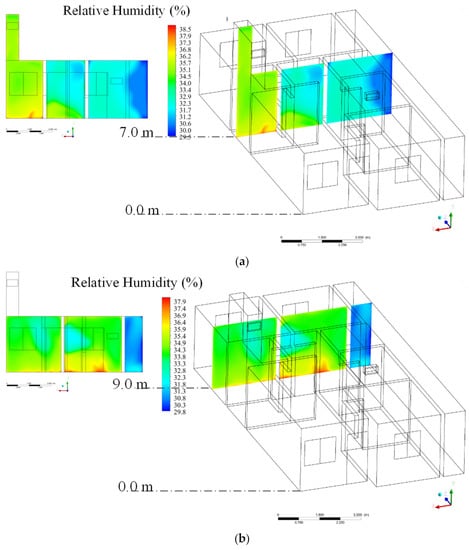
Figure 25.
Behavior of relative humidity inside the house (frontal planes). (a) Z = 7.0 m and (b) Z = 9.0 m.
Analyzing the results obtained for the relative humidity of the air inside the house, it can be seen that the bathroom has the highest values for this parameter. This can be explained by the dynamics of the space, as it is configured as a wet area, causing the presence of water in the environment to raise the relative humidity values. In addition, this environment does not have a direct air outlet through windows. This type of design solution, also called a linked house, is characterized by two or more buildings that share the same side walls, which makes it impossible to open windows on these sides due to the absence of lateral setbacks, leaving the exhaust to be via the opening skylight (through the roof).
It is possible to see through the figures that, at the bathroom entrance, there is a localized reduction in relative humidity, presenting intermediate values, which can be explained by the mixture of dry air that circulates through the building, but that cannot efficiently traverse the entire physical space, since it only has the entrance door and the skylight exit, generating little circulation of airflows and causing the internal relative humidity to remain high.
In the case of Room 2, the relative humidity values differ from the rest of the house, which can be explained by its proximity to the bathroom. In addition, the existence of two entrances in these environments (door and windows) favors cross-ventilation, which contributes to the modifications in the relative humidity. It is possible to understand from the geometry of the building itself that the obstacles caused by the division of the internal walls also show an influence on the values of relative humidity. The projection of the masonry of the integrated (living and dining) room acts as a screen and, consequently, causes a reduction in the internal circulation of the airflows. This design strategy, used to generate more privacy in intimate areas (rooms), in the building, impairs the sensation of thermal comfort as it makes the environment less ventilated.
It is worth noting that the environments with lower values of relative humidity are those that receive direct ventilation from the outside of the building, with warmer airflows. With emphasis on the integrated room, kitchens, and the lateral setback of the building, the relative humidity values related to the high temperature of these environments (on average 31°C) are related to lower thermal acceptability of the environment. According to the World Health Organization [25], the ideal level of relative humidity for the human body should be between 40% and 70%. ASHRAE [26] establishes the range between 30% and 60% relative humidity, combined with normal ambient temperatures, with 24 °C as a reference, as the best thermal comfort conditions for occupants of air-conditioned environments.
Given the above, it appears that the values of relative humidity presented in the building do not pose a risk to the health of users; however, they influence the sensation of thermal comfort. In practical terms, relative humidity affects the skin’s ability to evaporate sweat; for this reason, environments with high relative humidity make it difficult for sweat to evaporate, reducing heat loss and increasing the sensation of thermal discomfort.
An analysis of the relative humidity results in the different planes demonstrates that the hottest areas of the residence are the ones that presented smaller values of the relative humidity of the air. There is a relationship between temperature and relative humidity that corroborates the results presented in the simulation. Air humidity is determined by the amount of water droplets in the atmosphere; therefore, as the air temperature increases, the relative humidity decreases, as warmer air retains a greater amount of water vapor, i.e., increases its solubility to water vapor.
The values presented for relative humidity of air are within the range considered pleasant, which helps to minimize the common discomfort in hot and dry climates, such as Campina Grande, Brazil. This parameter, when combined with a higher speed in the airflows, can increase comfort conditions through the physiological cooling generated by sweat evaporation from the skin. This is because, with the movement of air, and the consequent evaporation of sweat, heat is removed from the skin, providing a feeling of comfort by reducing body temperature [26].
Figure 26, Figure 27, Figure 28, Figure 29, Figure 30, Figure 31 and Figure 32 illustrate the air velocity distributions, in the top, lateral and frontal planes, respectively. These graphics make it possible to understand the behavior of this variable through schematics in 3D views and sections, in different planes.
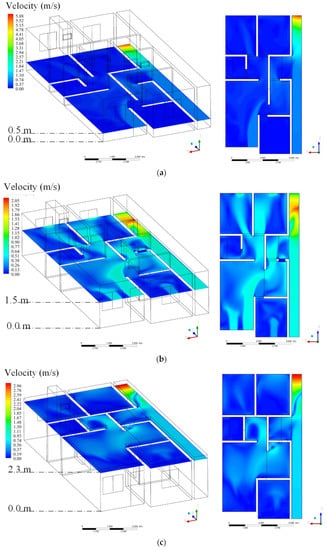
Figure 26.
Air velocity behavior inside the house (top planes). (a) Y = 0.5 m, (b) Y = 1.5 m, and (c) Y = 2.3 m.
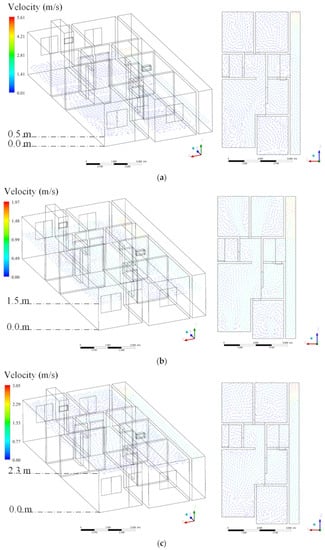
Figure 27.
Behavior of the air velocity vector field inside the house (top planes). (a) Y = 0.5 m, (b) Y = 1.5 m, and (c) Y = 2.3 m.
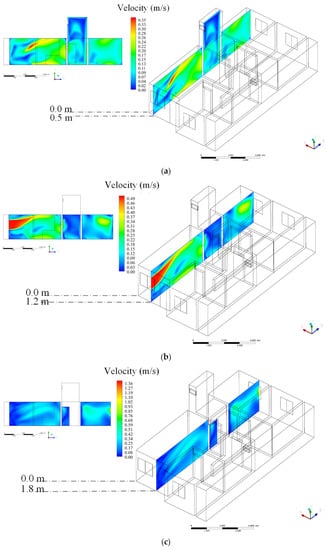
Figure 28.
Air velocity behavior inside the house (side planes). (a) X = 0.5 m, (b) X = 1.2 m, and (c) X = 1.8 m.
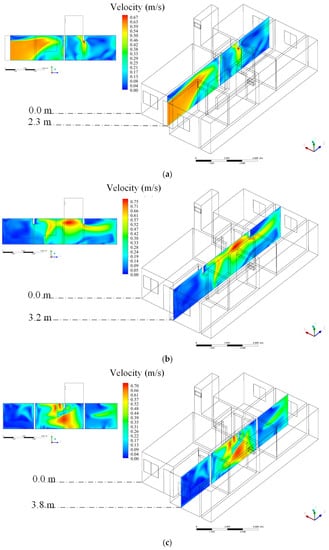
Figure 29.
Air velocity behavior inside the house (side planes). (a) X = 2.3 m, (b) X = 3.2 m, and (c) X = 3.8 m.
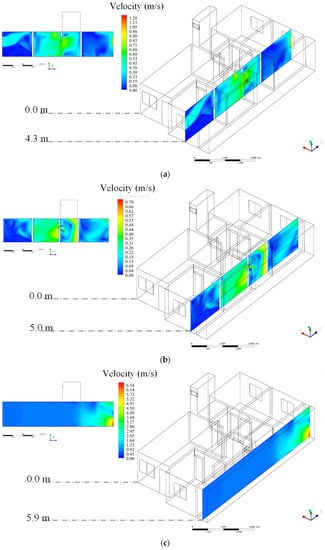
Figure 30.
Air velocity behavior inside the house (side planes). (a) X = 4.3 m, (b) X = 5.0 m, and (c) X = 5.9 m.
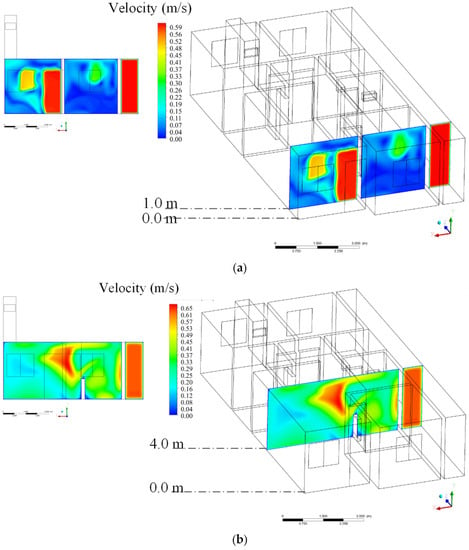
Figure 31.
Air velocity behavior inside the house (front planes). (a) Z = 1.0 m and (b) Z = 4.0 m.
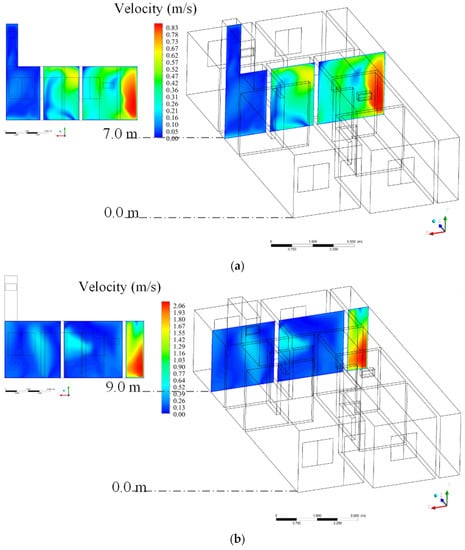
Figure 32.
Air velocity behavior inside the house (front planes). (a) Z = 7.0 m and (b) Z = 9.0 m.
Analyzing the results, it is verified, in the frontal plane, that there is a correlation between air velocity and the highest temperature values. The results demonstrate that the building’s bathroom has lower temperature airflows, even though the only opening in the environment is the skylight. The behavior of the airflows inside the building is due to the openings of doors and windows, once again provided by the phenomenon of pressure difference between the environments, contributing to the air movement. The environments with two openings (door and window) provided better ventilation and air distribution, constituting cross-ventilation. It is noticed that the combination of openings at the entrance (doors and windows) and at the exit of the building (windows of Rooms 2 and 3) promotes a greater direction of the airflow inside the building, leading to believe that the opening position in the other environments can influence the pressure difference in the environments and greater internal ventilation. This can be evidenced by the side opening, which leads to the service area, which served as an air inlet coming from the building’s setback. The values of this hydrodynamic variable demonstrate satisfactory levels that could be better used if there were more openings in other environments to provide the same phenomenon.
With regard to air velocity, the results demonstrate that the least favorable environmental condition occurred in the bathroom. This can be explained by the absence of direct openings. As already mentioned, this space has an upper air outlet, via an opening skylight. As for the behavior of average velocity, in the indoor environments, the results show that there is a predominance of low velocities in all environments. This indicates that the housing unit has little natural ventilation inside, reflecting thermal discomfort and, consequently, the need to provide artificial mechanical modes to compensate for this low natural ventilation.
When openings in the building are correctly dimensioned and positioned, air currents are created inside the environments. It is important to plan the environments, knowing the position of the dominant local airflow, so that the direction of the air flow always starts from “dry” areas (such as bedrooms and living rooms) to “wet” areas (such as kitchens and bathrooms), maintaining the indoor air quality healthier. In this sense, neighboring environments with openings to the same facade should be avoided, especially if the incident airflow is orthogonal to them. Whenever possible, it is recommended to place one of them on an adjacent facade [27].
The air velocity is governed by the pressure gradient established between areas that present different pressures. The greater the pressure gradient between two adjacent regions, the greater the air velocity in that region. Comparing the velocity values, small differences were found, demonstrating that the problem is not the air velocity passing through the system, but the architecture of the building. Thus, it becomes crucial to pay more attention to this design condition than the inlet air velocity at the windows and doors.
With regard to validation, we notice that all experimental data were used as boundary condition. Since that the proposed mathematical modeling is composed by conservation equations already extensively used in predicting fluid flow and heat transfer at different application with good and well validated results, simulations were carried out without furniture and residents (approaching fluid flow in rectangular space), and the small variations in the unknown variable results, so, in-deep validation study is not crucial. However, the authors have compared some predicted and experimental indoor results of temperature, relative humidity, and velocity at the outlet window (Figure 12 and Table 9) presenting moderate difference. For comparison, at this location predicted and experimental mean data are given as follows: temperature: 32.9 °C and 40.6 °C, velocity: 0.9 m/s and 0.7 m/s, and relative humidity: 34% and 41%, respectively.
The behavior of the airflows inside the building is due to the openings of doors and windows, which provide pressure differences between the environments, contributing to the movement of air. The environments with two openings (door and window) provided better distribution of air, constituting cross-ventilation. It can be seen that the combination of openings at the entrance (doors and windows) and at the exit of the building (windows in Rooms 2 and 3) provoke one better distribution and higher airflow inside the building. This proves that the opening position in the other environments could influence the pressure difference in the environments and greater internal ventilation. This can be verified by the side opening, located in the service area, which works as an air inlet coming from the back of the building. The velocity values demonstrate satisfactory levels that could be better used if there were more openings in other environments to provide the same phenomenon.
Although climate conditions vary during the day, our research was conducted around midday, where climate conditions are more severe and provoke intense thermal discomfort in comparison to the morning conditions. It should be noted that the city of Campina Grande, Brazil is in a climate transition zone between the coastal and very hot and dry hinterland regions. Therefore, on summer days, ventilation openings can harm thermal comfort. In the case studied, particularly, the solar orientation of the building favors the good use of the prevailing airflows, however, this phenomenon only appears in some rooms where it is possible to have cross-ventilation and its consequent air renewal. In the other environments, the constructive configuration of the building (layout) has a distribution in which there are some obstacles to the phenomenon of cross-ventilation (either by the small passageway and/or wall obstacles, which are necessary for the privacy of the environment), which could also be confirmed by analysis.
4. Conclusions
In this research, emphasis is given to the study of natural ventilation in low-cost homes. Based on the obtained results and the literature cited, we can notice that the analysis tool used in this research (CFD) proved to be effective in predicting the phenomenon and can serve as a substitute for the optimization of future projects. From the results obtained, it was found that:
- (a)
- Natural ventilation inside the building was inefficient, culminating in an increase in the internal temperature and leading to the need to use a mechanical ventilation system to improve thermal comfort.
- (b)
- The position of the door and window openings in the building arrangements had a direct influence on the decrease in temperature.
- (c)
- Lower temperature values in environments with greater airflow recirculation, via cross ventilation, prove that the relevant parameter is not only the velocity of the air passing through the system but also the architecture of the building.
- (d)
- The low values of relative humidity are nonetheless within the range considered pleasant, which helps to minimize the common discomfort in hot and dry climates.
- (e)
- Variations in air velocity verified inside the house do not cause thermal discomfort to residents.
From the above, it is recommended to pay more attention to the geometry of the building, when compared to the effect of the incoming air velocity, and these strategies are related to issues ranging from the implementation of the building in the construction area to the configuration of the internal and external geometries of the building. It was found that facades that promote recesses and the use of openings on opposite and adjacent faces allow airflow to cross the environments. These issues reinforce the importance of customized architectural projects for the place in which it will be inserted in order to make the most of all environmental conditions and promote a more sustainable and humane architecture, providing optimal conditions for thermal and environmental comfort.
Author Contributions
All the authors contributed to the development, analysis, writing, and revision of the paper: Conceptualization, L.A.R., A.N.O.V. and M.R.L.; methodology, L.A.R., A.S.C. and I.B.S.; software, L.A.R., A.S.C. and G.L.O.N.; validation, L.A.R., I.B.S. and V.A.B.O.; formal analysis, L.A.R., M.J.V.S. and D.B.T.V.; investigation, L.A.R., A.N.O.V. and M.R.L.; writing—original draft preparation, L.A.R., R.S.G. and D.B.T.V.; writing—review and editing, R.S.G. and J.M.P.Q.D.; visualization, A.S.C., V.A.B.O. and G.L.O.N.; supervision, A.G.B.L. and J.M.P.Q.D.; funding acquisition, A.G.B.L. and J.M.P.Q.D. All authors have read and agreed to the published version of the manuscript.
Funding
This research received external funding from FAPESQ-PB/CAPES, grant number 18/2020, CAPES, grant number 88881.707847/2022-01 and CNPq, grant number 308255/2022-4 (Brazilian Research Agencies).
Data Availability Statement
The data that support the findings of this study are available upon request from the authors.
Acknowledgments
The authors are grateful to CNPq, CAPES, FINEP, and FAPESQ-PB for the financial support and the researchers mentioned in the manuscript who, with their research, helped in the development of this work. This work is a result of the project “BlueWoodenHouse”, with the reference POCI-01-0247-FEDER-047157, co-funded by the European Regional Development Fund (ERDF) through the Operational Programme for Competitiveness and Internationalization (COMPETE 2020), under the Portugal 2020 Partnership Agreement, and the project “BlueHouseSim”, with reference 2022.06841.PTDC, funded by national funds (PIDDAC) through FCT/MCTES. In addition, this work was financially supported by FCT—Fundação para a Ciência e a Tecnologia through the individual Scientific Employment Stimulus 2020.00828.CEECIND.
Conflicts of Interest
The authors declare no conflict of interest.
References
- Abiko, A.K. Introduction to Housing Management; EPUSP Editora: São Paulo, Brazil, 2004; Available online: http://publicacoes.pcc.usp.br/PDF/ttcap12.pdf (accessed on 9 September 2020). (In Portuguese)
- Santos, C.H.M. Federal Housing Policies in Brazil: 1964–1998; Ministry of Finance, Secretary of State for Planning and Evaluation: Brasília, Brazil, 1999; p. 32. Available online: http://periciajudicial.adm.br/pdfs/Politica_%20Federal_%20Habita%C3%A7%C3%A3o%20_Brasil%20_IPEA_1964_1998.pdf (accessed on 9 September 2020). (In Portuguese)
- ONU-Habitat-United Nations Organization. The Right to Adequate Housing. Informative File nº 21/rev. 1. 2010. Available online: http://www.ohchr.org/Documents/Publications/FS21_rev_1_Housing_sp.pdf (accessed on 10 November 2020). (In Spanish).
- Frota, A.B.; Schiffer, S.R. Thermal Comfort Manual, 5th ed.; Studio Nobel: São Paulo, Brazil, 2001. (In Portuguese) [Google Scholar]
- Romero, M.; Ornstein, S. Post-Occupancy Evaluation: Methods and Techniques Applied to Social Housing, 1st ed.; ANTAC Editora: Porto Alegre, Brazil, 2003. (In Portuguese) [Google Scholar]
- Diligenti, M.P. Sustainability and Social Interest Housing: Social Movements and the (Re)Signification of the Place. In Proceedings of the 1st National Meeting of the National Association for Research and Graduate Studies in Architecture and Urbanism (ENANPARQ), Rio de Janeiro, Brazil, 29 November–3 December 2010; Available online: https://www.anparq.org.br/dvd-enanparq/simposios/51/51-655-1-SP.pdf (accessed on 10 November 2020). (In Portuguese).
- Silva, E.F. Searching for Habitability: Adjustments Inserted in the Boa Sorte Housing Complex in Coimbra. MG. Master’s Thesis, Civil Engineering, Federal University of Viçosa, Viçosa, Brazil, 2011. Available online: https://www.locus.ufv.br/handle/123456789/3759 (accessed on 20 October 2020). (In Portuguese).
- Imai, C. User Participation in Evaluation Processes: Methodologies and Results. In Environmental Quality in Housing Post-Occupancy Assessment; Villa, S.B., Ornstein, S.W., Eds.; Editora Oficina de Textos: São Paulo, Brazil, 2013; Chapter 4; pp. 75–88. (In Portuguese) [Google Scholar]
- ABNT Stardard-NBR 15575; Residential Buildings-Performance. Associação Brasileira de Normas Técnicas: Rio de Janeiro, Brazil, 2013. (In Portuguese)
- ABNT Standard-NBR 15220-3; Thermal Performance of Buildings Part 3: Brazilian Bioclimatic Zoning and Construction Guidelines for Single-Family Housing of Social Interest. Associação Brasileira de Normas Técnicas: Rio de Janeiro, Brazil, 2005. (In Portuguese)
- Frota, A.B.; Schiffer, S.R. Thermal Comfort Manual, 6th ed.; Studio Nobel: São Paulo, Brazil, 2003. (In Portuguese) [Google Scholar]
- Mistriotis, A.; De Jong, T. Computational Fluid Dynamics (CFD) as a tool for the analysis of ventilation and indoor microclimate in agricultural buildings. Neth. J. Agri. Sci. 1997, 45, 81–96. [Google Scholar] [CrossRef]
- Norton, T.; Sun, D.W.; Grant, J.; Fallon, R.; Dodd, V. Applications of computational fluid dynamics (CFD) in the modelling and design of ventilation systems in the agricultural industry: A review. Bioresour. Technol. 2007, 98, 2386–2414. [Google Scholar] [CrossRef] [PubMed]
- Saraz, J.A.O.; Tinôco, I.F.F.; Rocha, K.S.O.; Mendes, L.B.; Norton, T. A CFD based approach for determination of ammonia concentration profile and flux from poultry houses with natural ventilation. Rev. Fac. Nac. Agron. Medellin 2016, 69, 7825–7834. [Google Scholar] [CrossRef]
- Naboni, E.; Lee, D.S.H.; Fabbri, K. Thermal Comfort-CFD maps for Architectural Interior Design. Procedia Eng. 2017, 180, 110–117. [Google Scholar] [CrossRef]
- Aghniaey, S.; Lawrence, T.M.; Sharpton, T.N.; Douglass, S.P.; Oliver, T.; Sutter, M. Thermal comfort evaluation in campus classrooms during room temperature adjustment corresponding to demand response. Build. Environ. 2019, 148, 488–497. [Google Scholar] [CrossRef]
- Alizadeh, M.; Sadrameli, S.M. Numerical modeling and optimization of thermal comfort in building: Central composite design and CFD simulation. Energy Build. 2018, 164, 187–202. [Google Scholar] [CrossRef]
- Usman, F.; Bakar, A.R.A. Thermal Comfort Study Using CFD Analysis in Residential House with Mechanical Ventilation System. In Proceedings of the AICCE’19: Transforming the Nation for a Sustainable Tomorrow 4, Penang, Malaysia, 21–22 August 2019; Springer: Cham, Switzerland, 2020; Volume 53, pp. 1613–1628. [Google Scholar] [CrossRef]
- Chen, L.; Fabian-Wheeler, E.E.; Cimbala, J.M.; Hofstetter, D.; Patterson, P. Computational Fluid Dynamics Modeling of Ventilation and Hen Environment in Cage-Free Egg Facility. Animals 2020, 10, 1067. [Google Scholar] [CrossRef] [PubMed]
- ANSYS Inc. ANSYS FLUENT Theory Guide; Release 15.0; ANSYS Inc.: Canonsburg, PA, USA, 2013; 814p. [Google Scholar]
- Anderson, W.K.; Bonhaus, D.L. An implicit upwind algorithm for computing turbulent flows on unstructured grids. Comput. Fluids 1994, 23, 1–21. [Google Scholar] [CrossRef]
- Leonard, B.P.; Mokhtari, S. ULTRA-SHARP Non-Oscillatory Convection Schemes for High-Speed Steady Multidimensional Flow, NASA TM 1-2568 (ICOMP-90-12); NASA Lewis Research Centre: Sandusky, OH, USA, 1990.
- Barth, T.; Jespersen, D. The design and application of upwind schemes on unstructured meshes. In Proceedings of the 27th Aerospace Sciences Meeting, Reno, NV, USA, 9–12 January 1989; p. 366. [Google Scholar]
- Alaman, A. Hygrothermal comfort conditions in buildings. In Board of Scientific and Technical Research “Juan de la Cierva” of the Higher Council for Scientific Research; Enero: Madrid, Spain, 1968. (In Spanish) [Google Scholar]
- WHO. WHO Official Records n°2, 2012. Available online: http://www.who.int/library/collections/historical/es (accessed on 11 October 2021).
- ASHRAE. Ashrae Epidemic Task Force: Schools & Universities. 2021. Available online: https://www.ashrae.org/file%20library/technical%20resources/covid-19/ashrae-reopening-schools-and-universities-c19-guidance.pdf (accessed on 12 December 2021).
- Givoni, B. Basic Study of Ventilation Problems in Houses in Hot Countries; Building Research Station of the Institute of Technology: Haifa, Israel, 1962. [Google Scholar]
Disclaimer/Publisher’s Note: The statements, opinions and data contained in all publications are solely those of the individual author(s) and contributor(s) and not of MDPI and/or the editor(s). MDPI and/or the editor(s) disclaim responsibility for any injury to people or property resulting from any ideas, methods, instructions or products referred to in the content. |
© 2023 by the authors. Licensee MDPI, Basel, Switzerland. This article is an open access article distributed under the terms and conditions of the Creative Commons Attribution (CC BY) license (https://creativecommons.org/licenses/by/4.0/).

