
Prediction of Nonlinear Flexural Behavior of Continuous RC Beams Pre-Damaged by Corrosion


Abstract
1. Introduction
2. Methods and Materials
2.1. Model Development
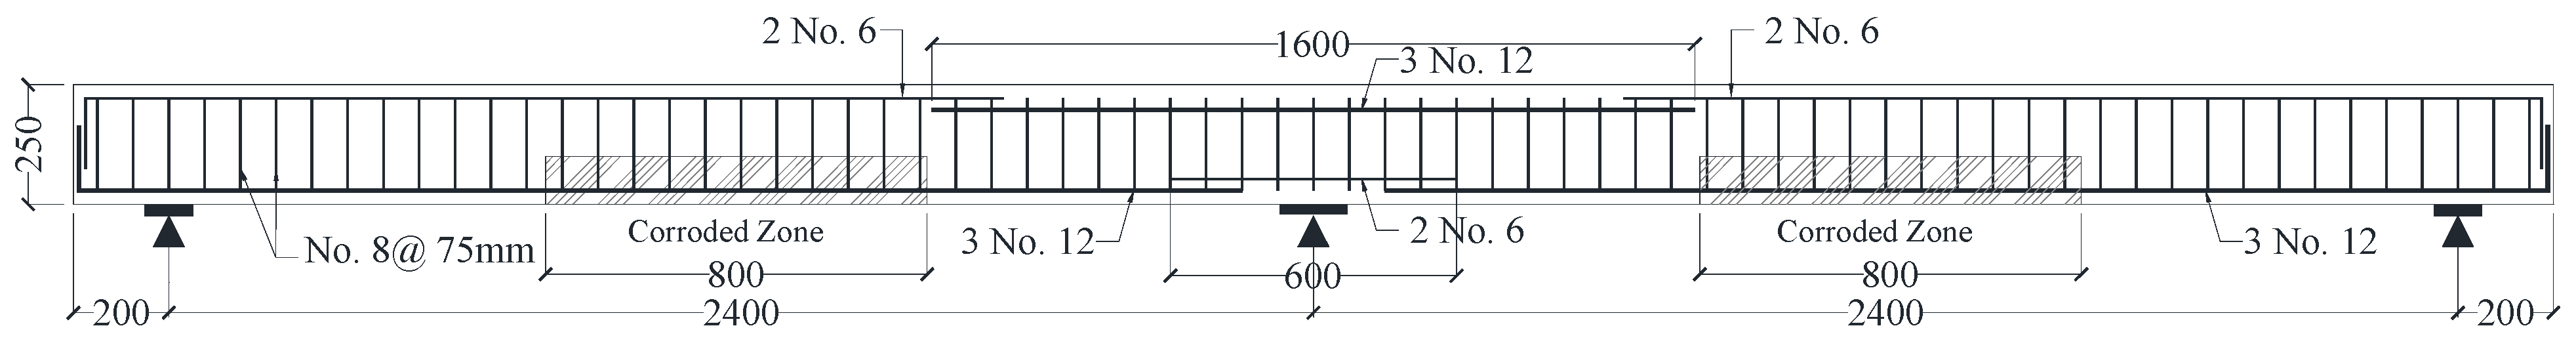
2.1.1. Configuration of the Continuous Beam Model
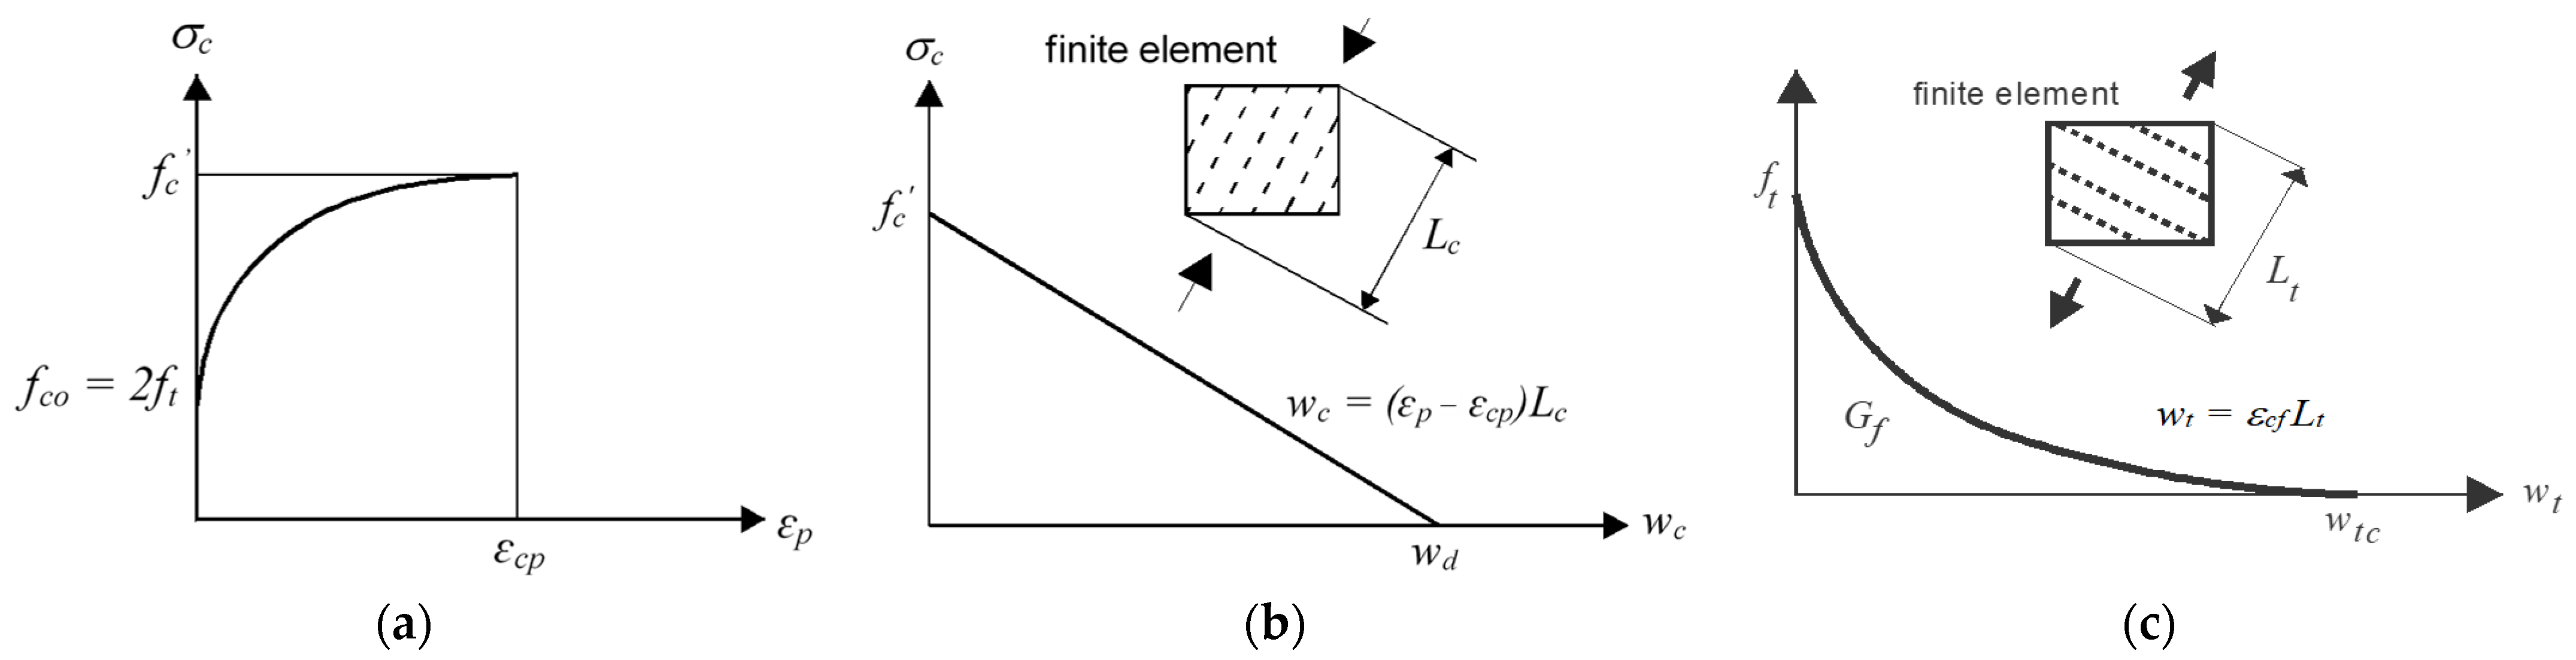
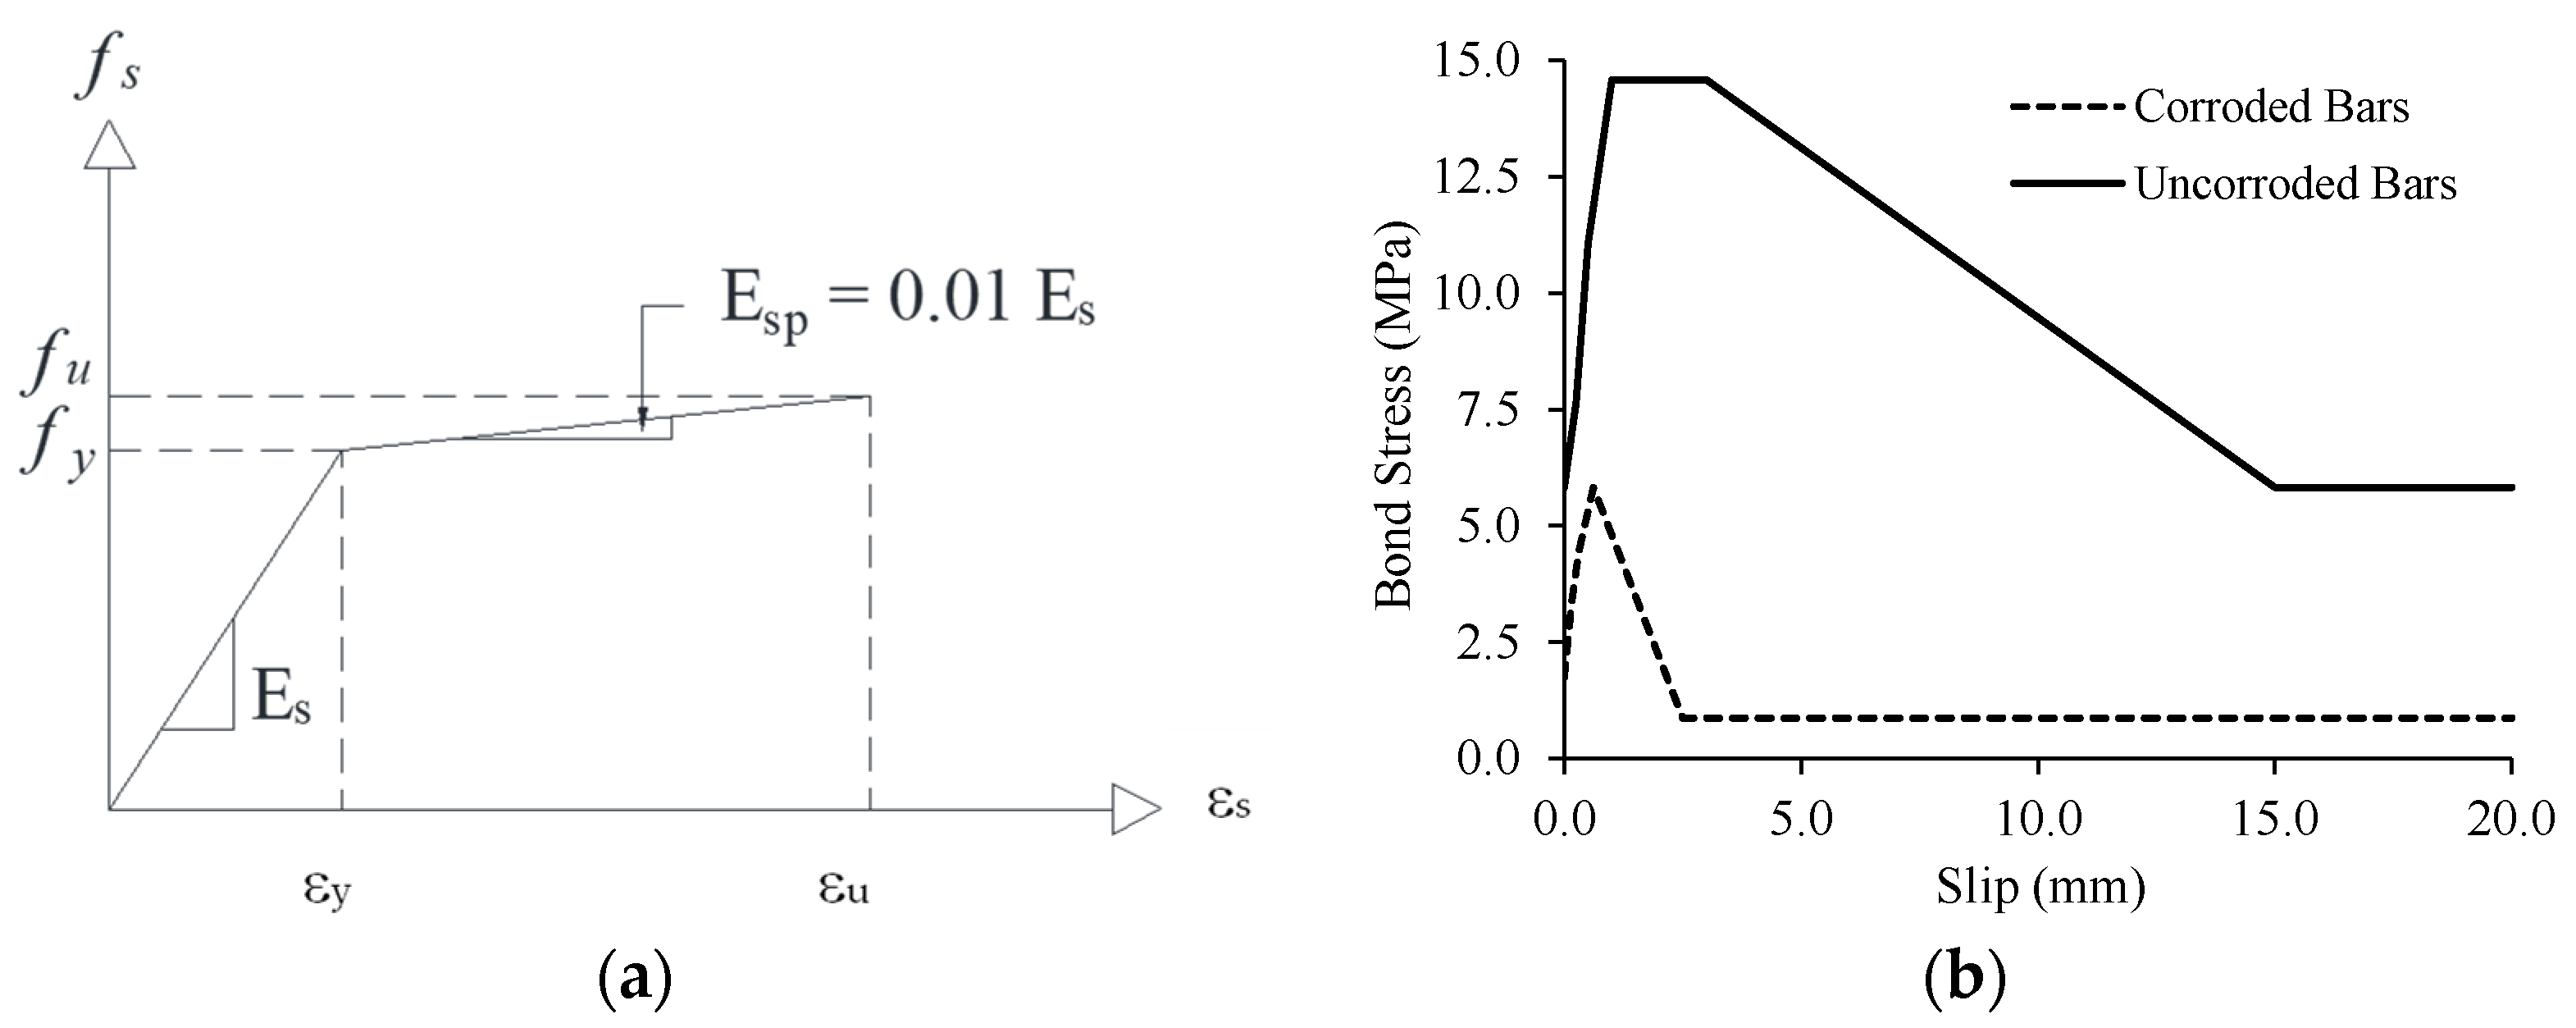
2.1.2. Material Constitutive Laws
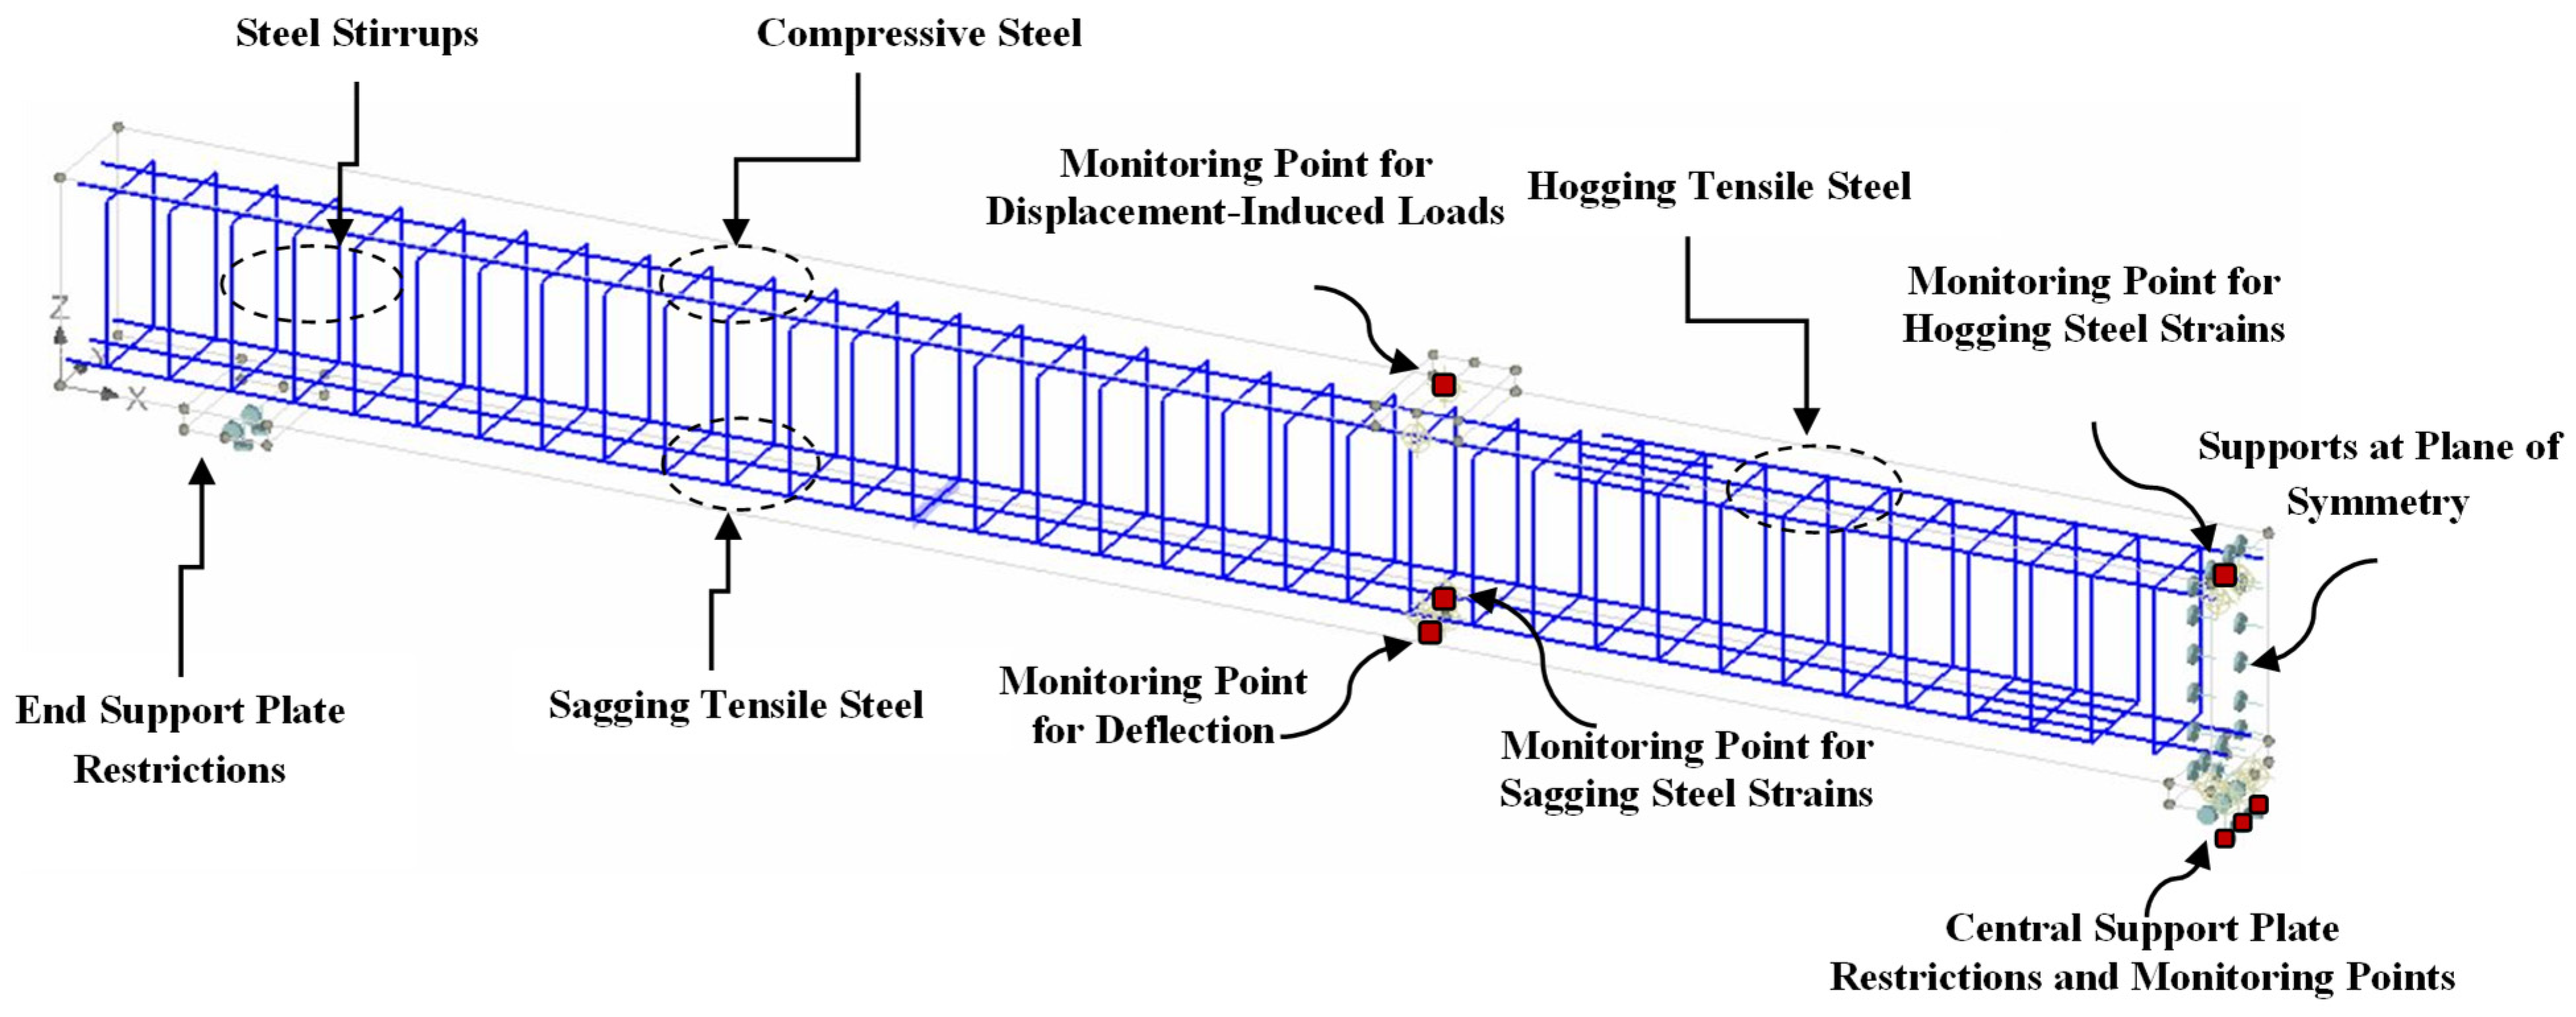
2.1.3. Element Types and Boundary Conditions
2.2. Experimental Testing
2.2.1. Test Matrix
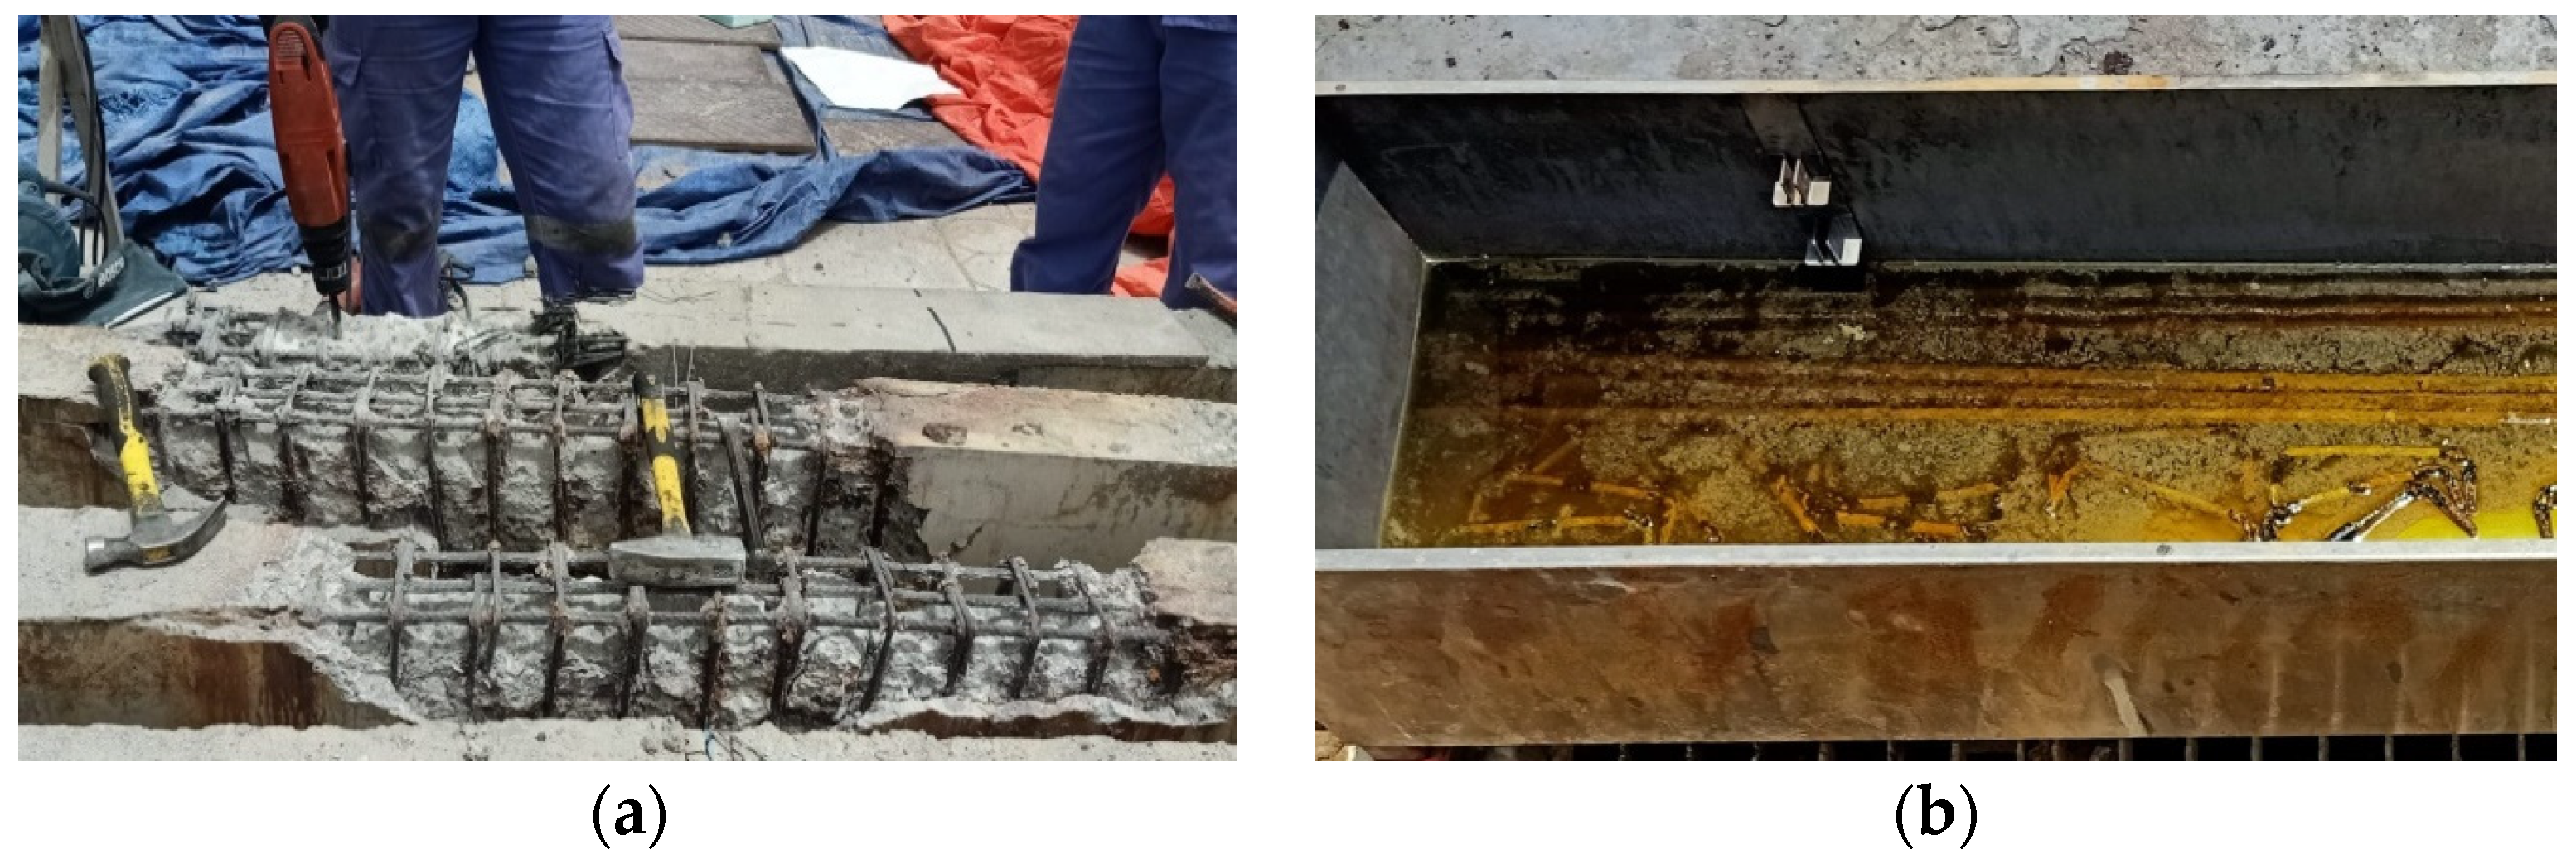
2.2.2. Accelerated Corrosion
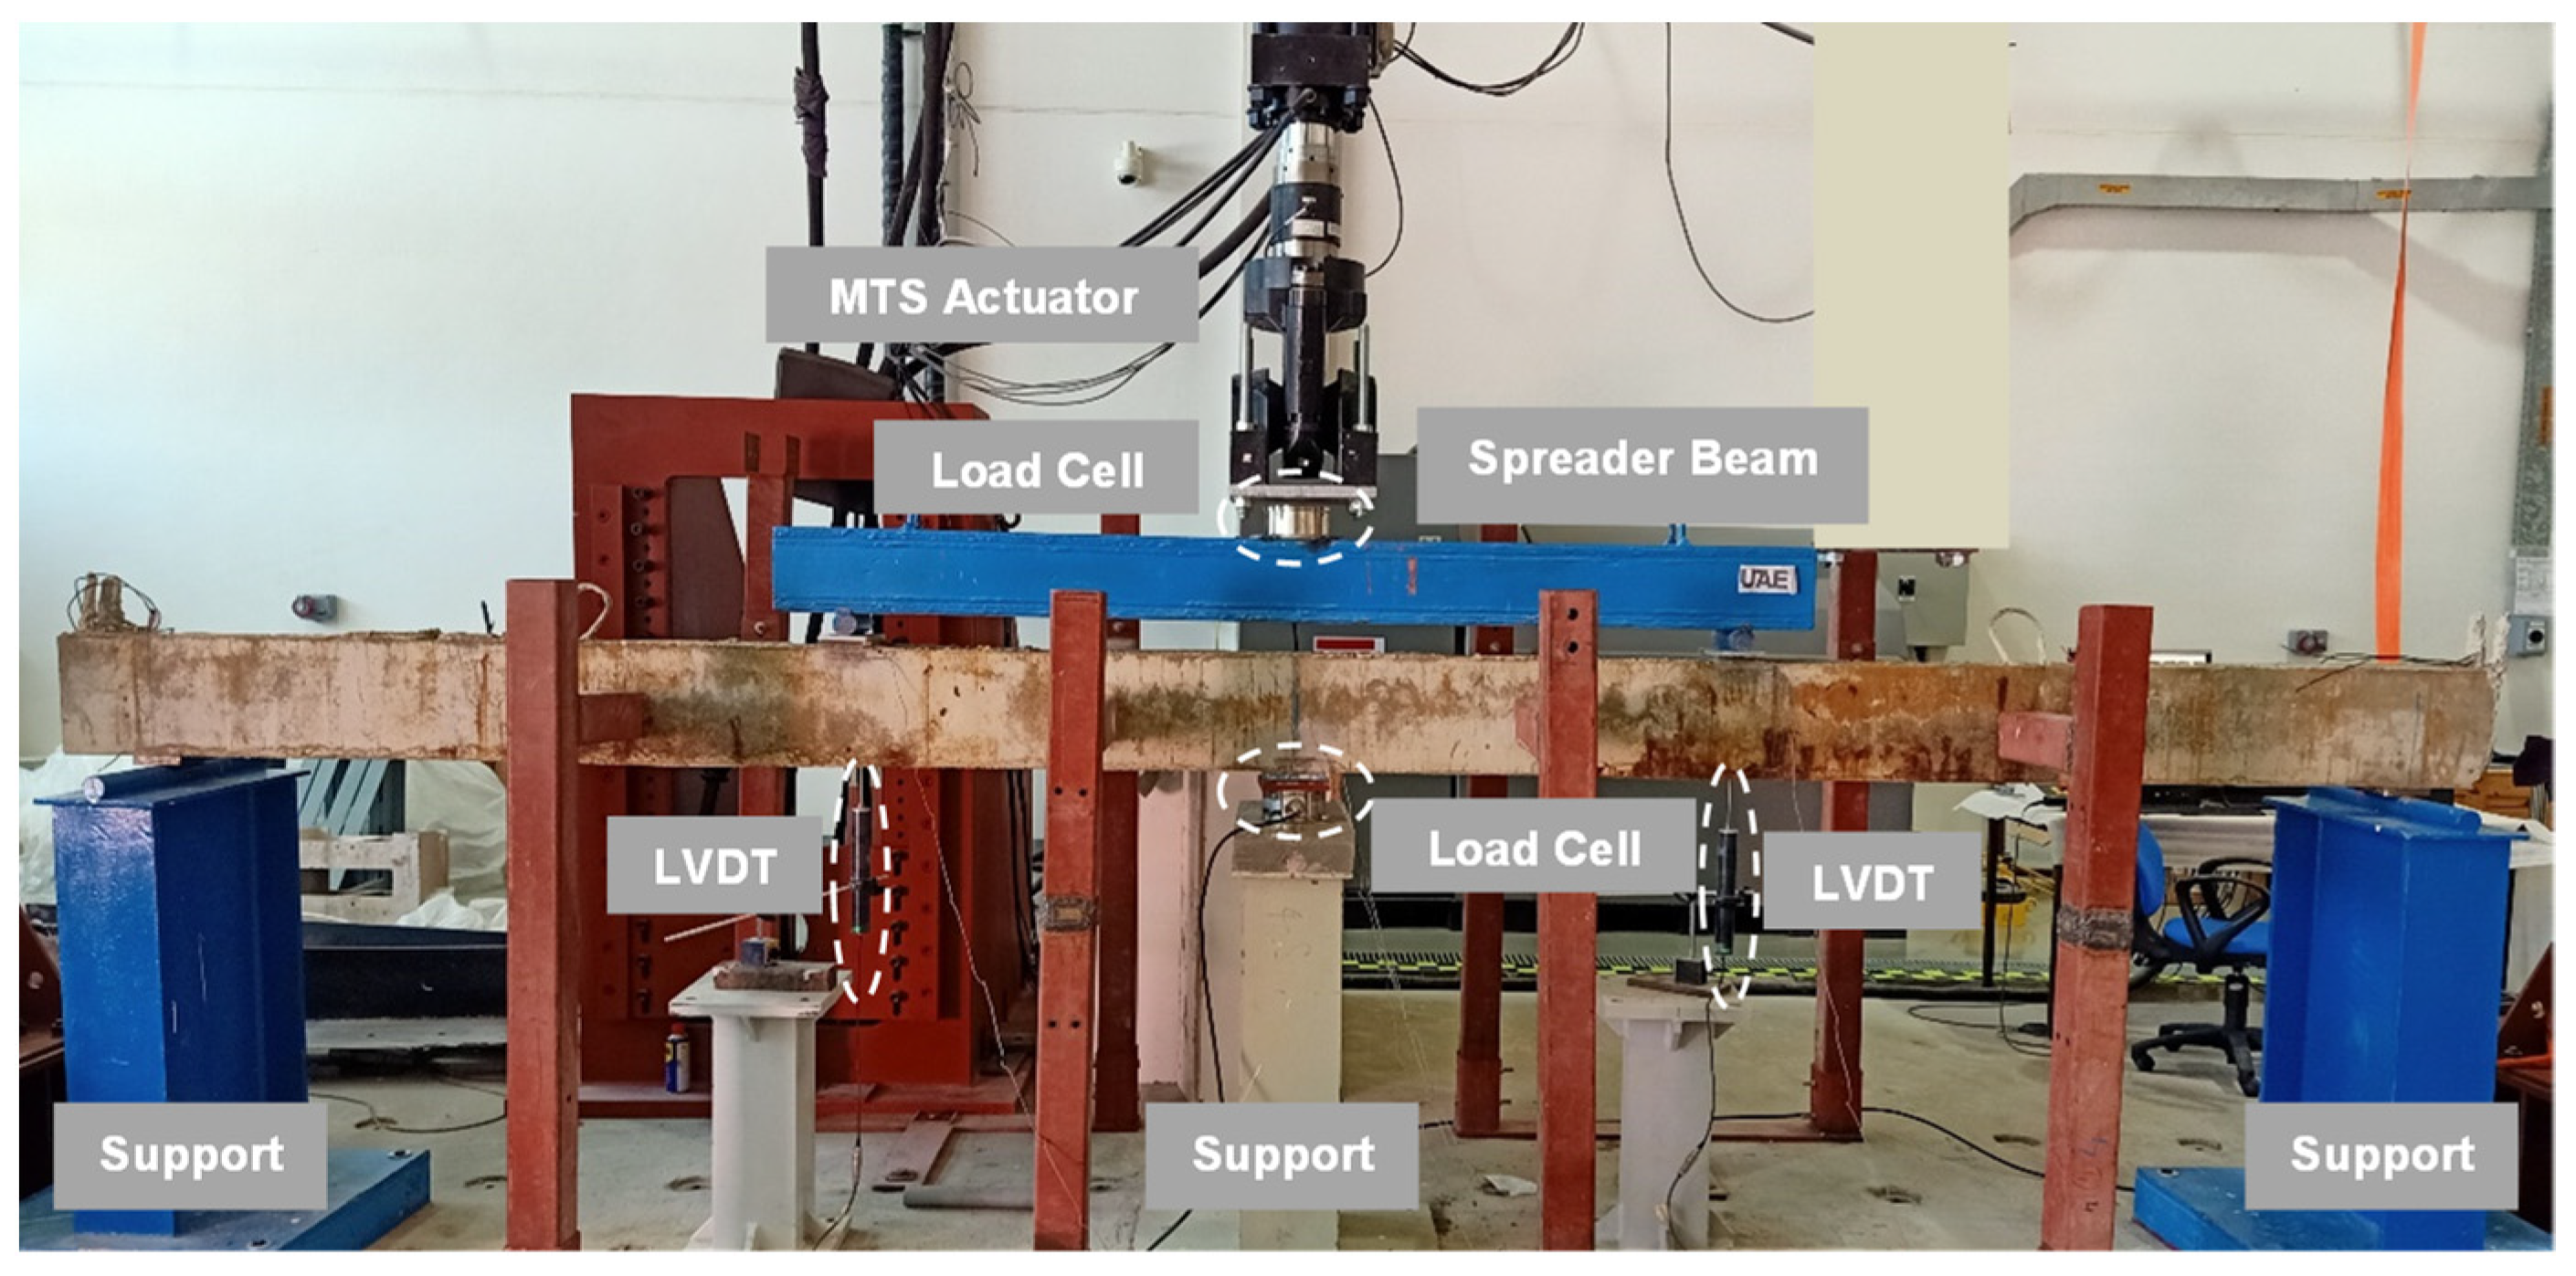
2.2.3. Structural Test Setup
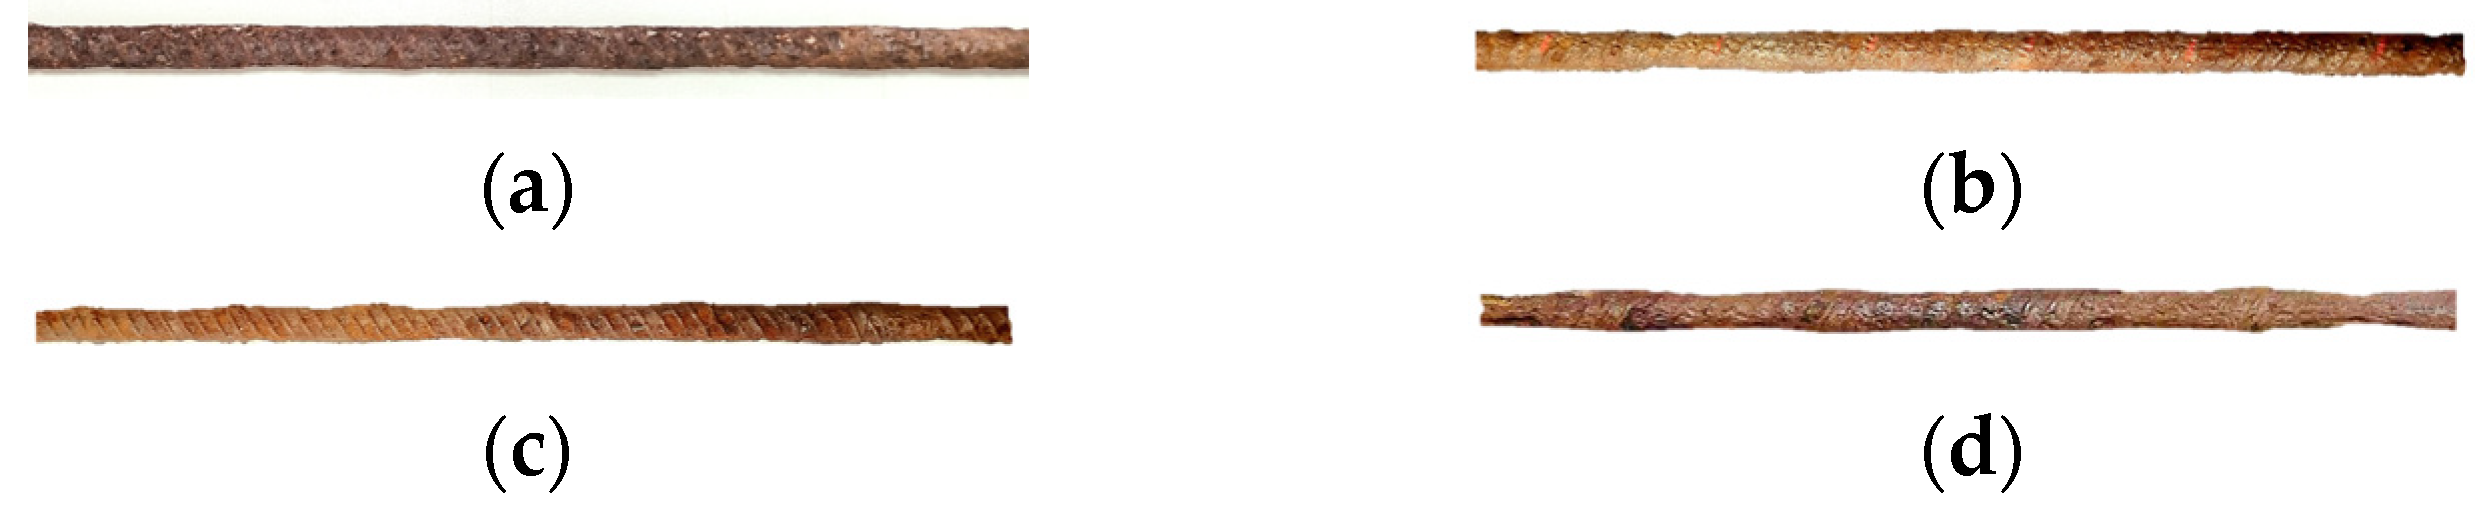
2.2.4. Cross-Sectional Loss Due to Corrosion
3. Model Validation
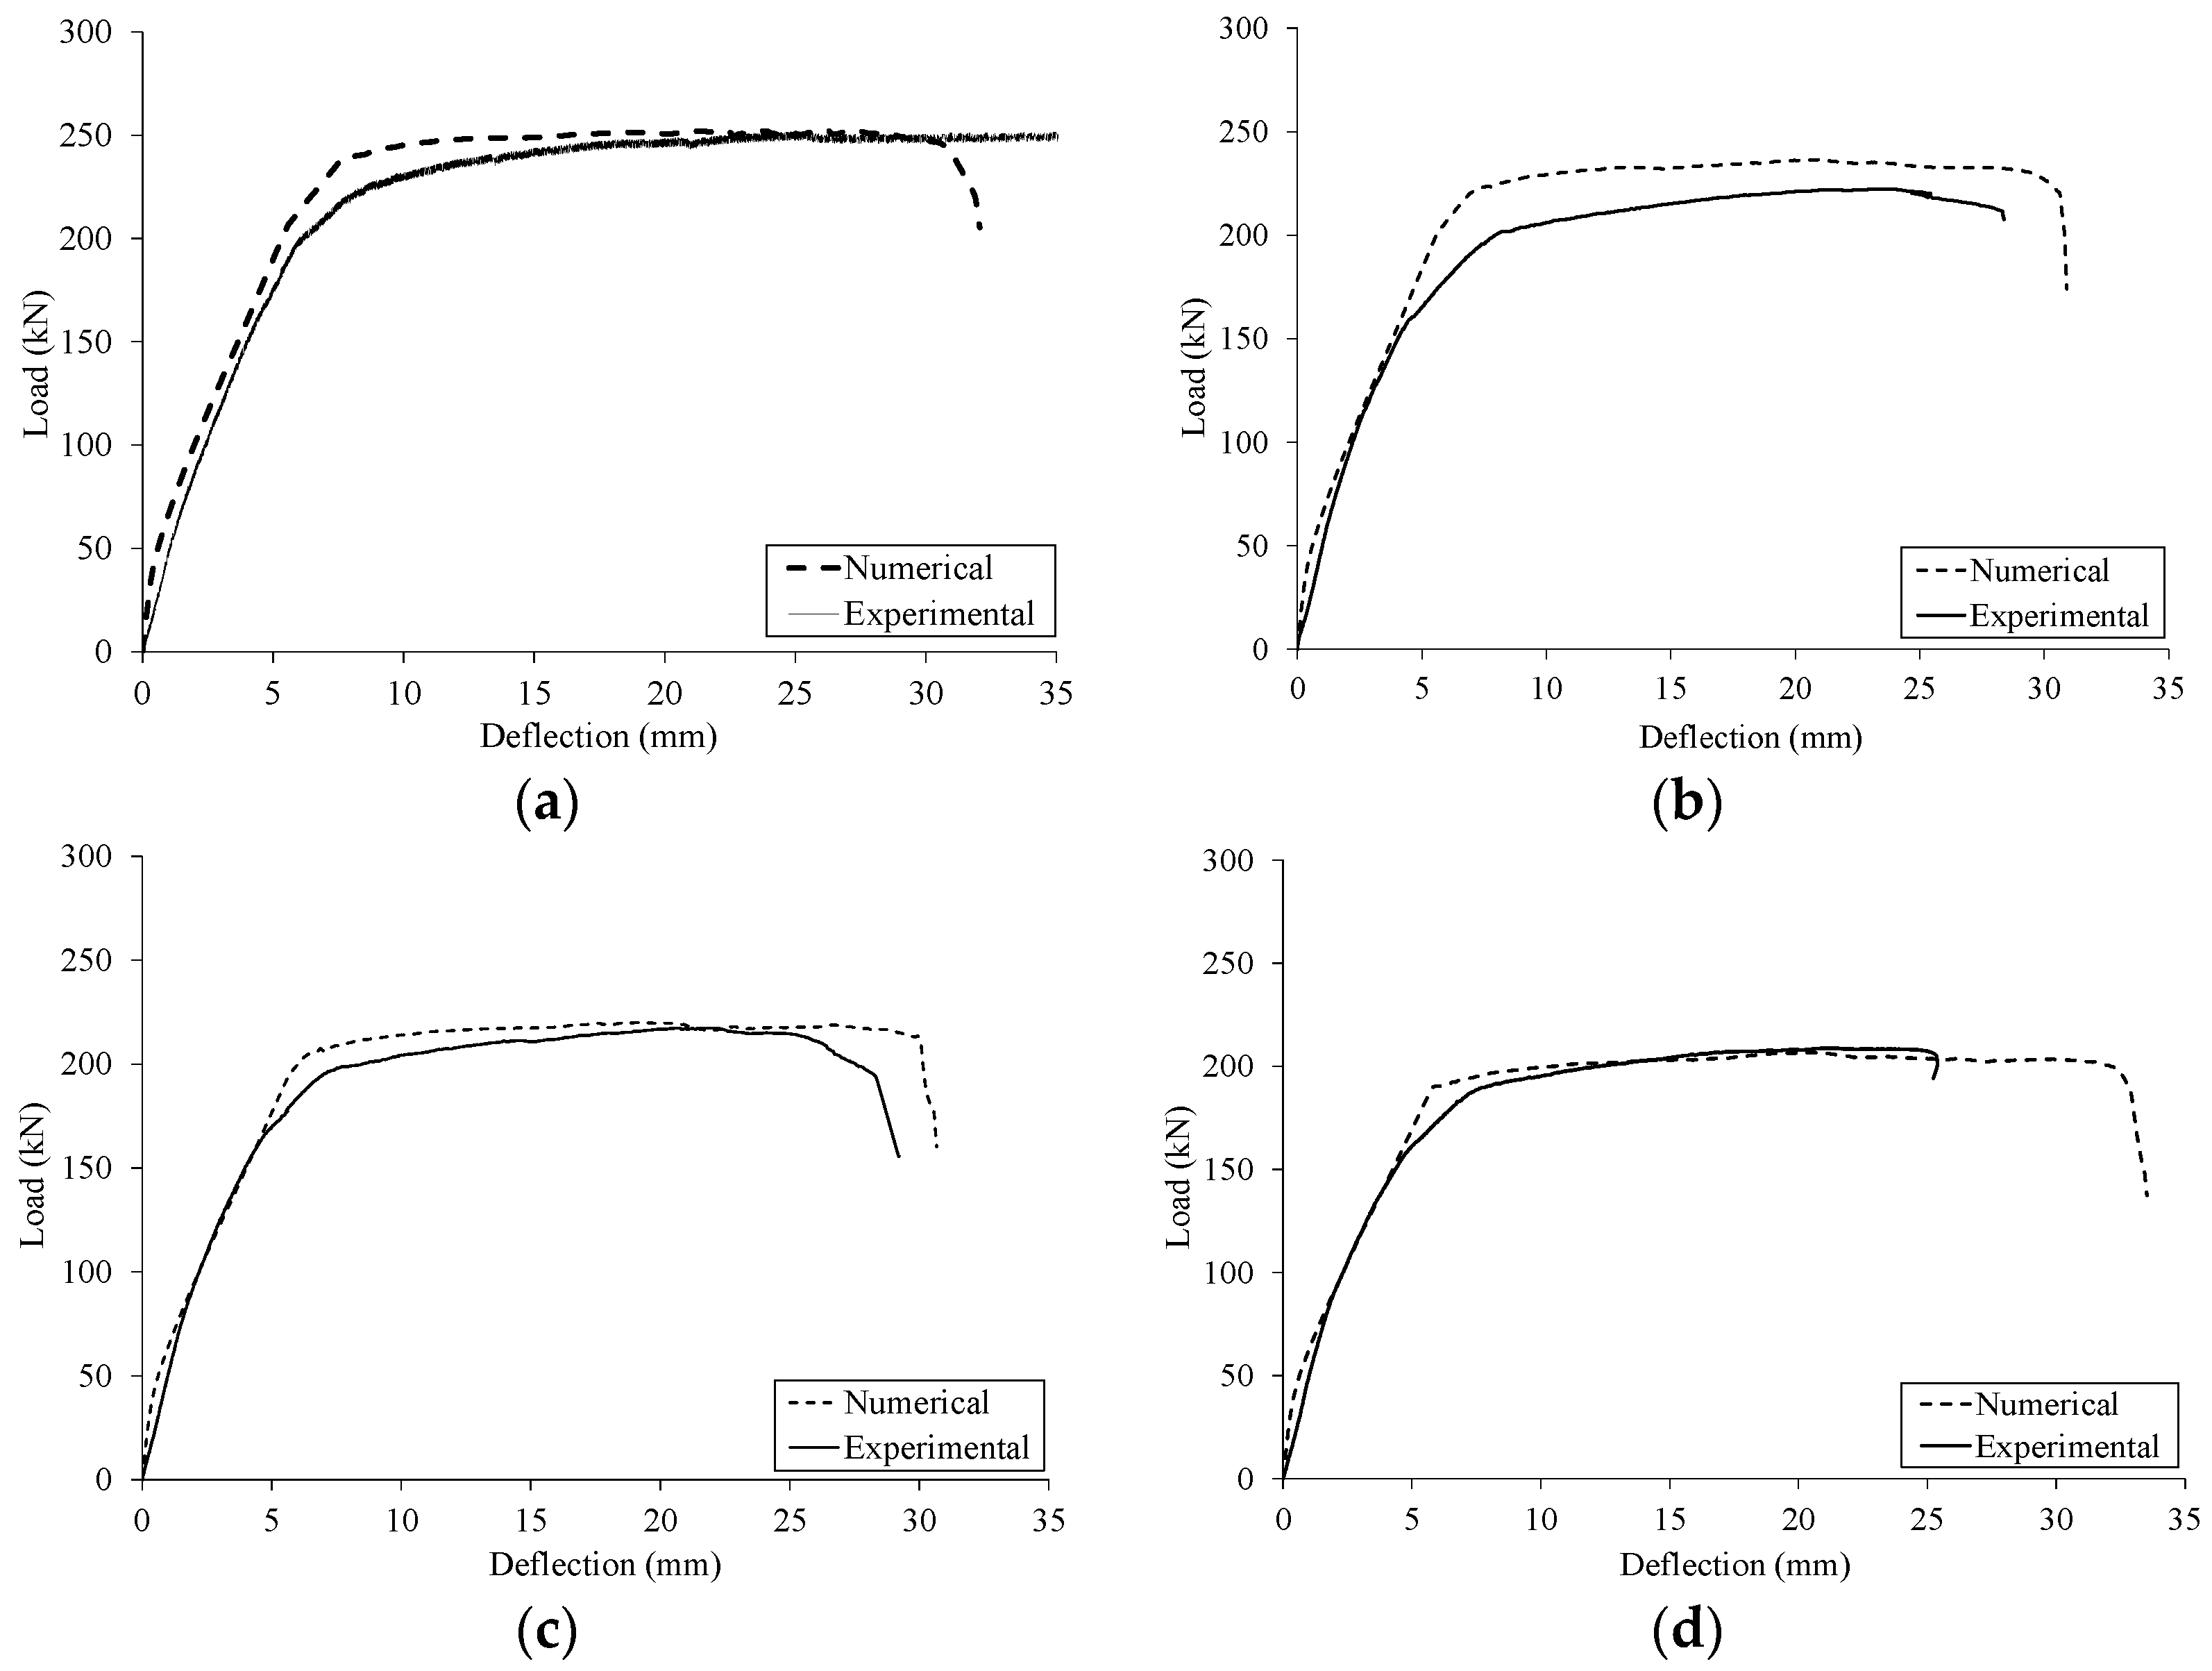
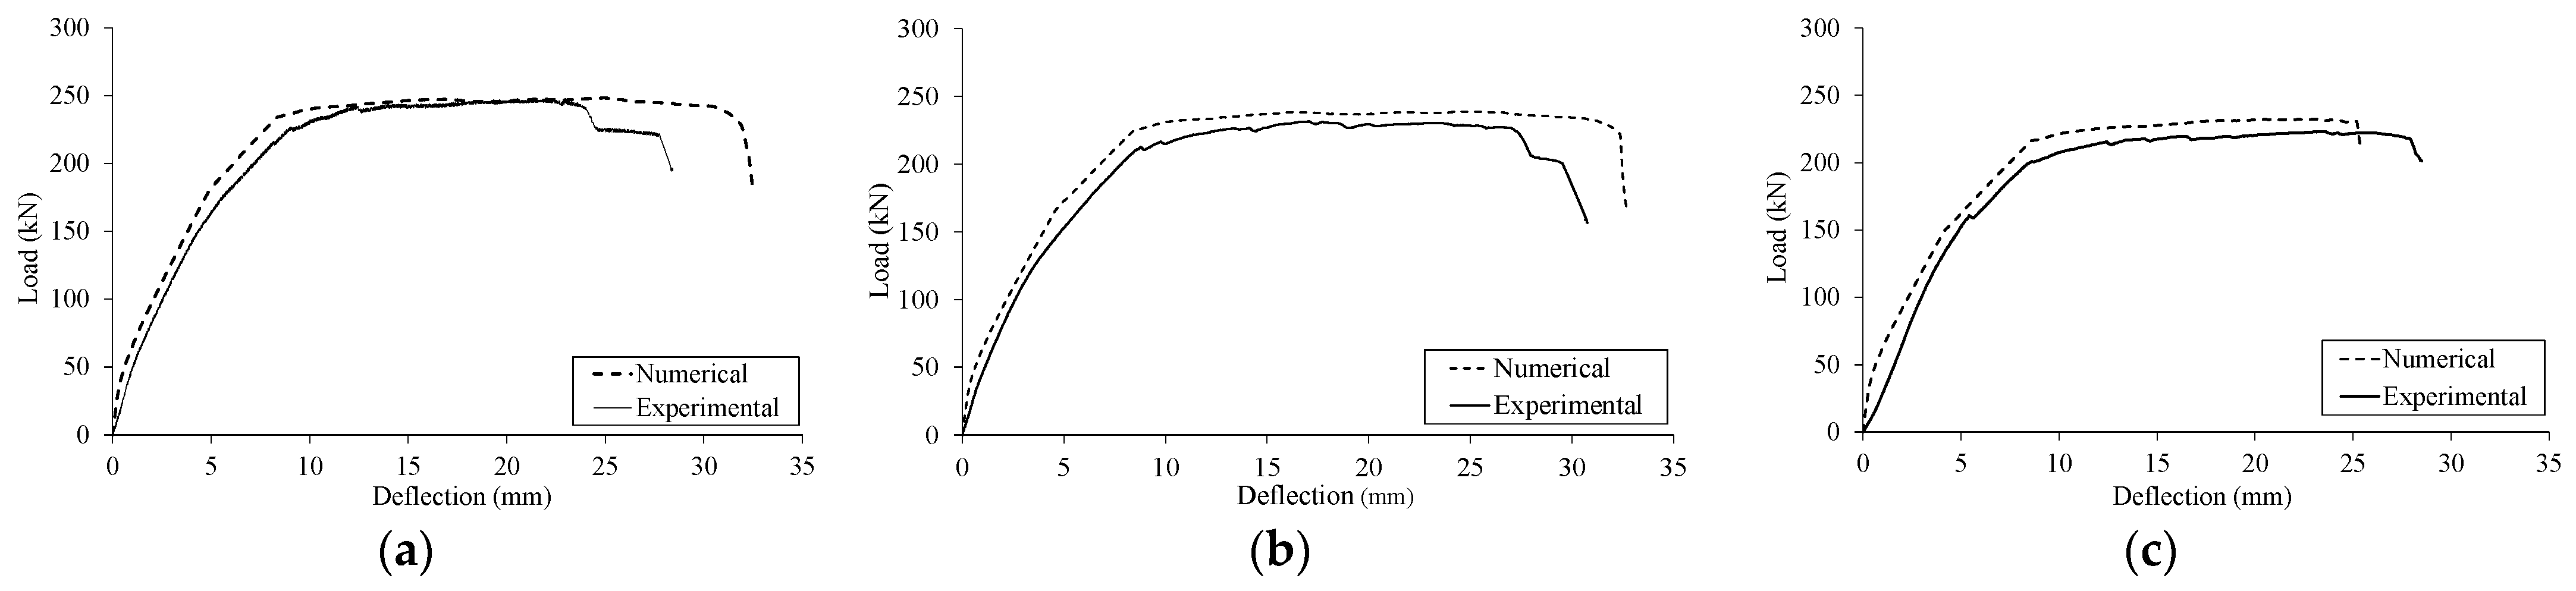
3.1. Load-Deflection Response
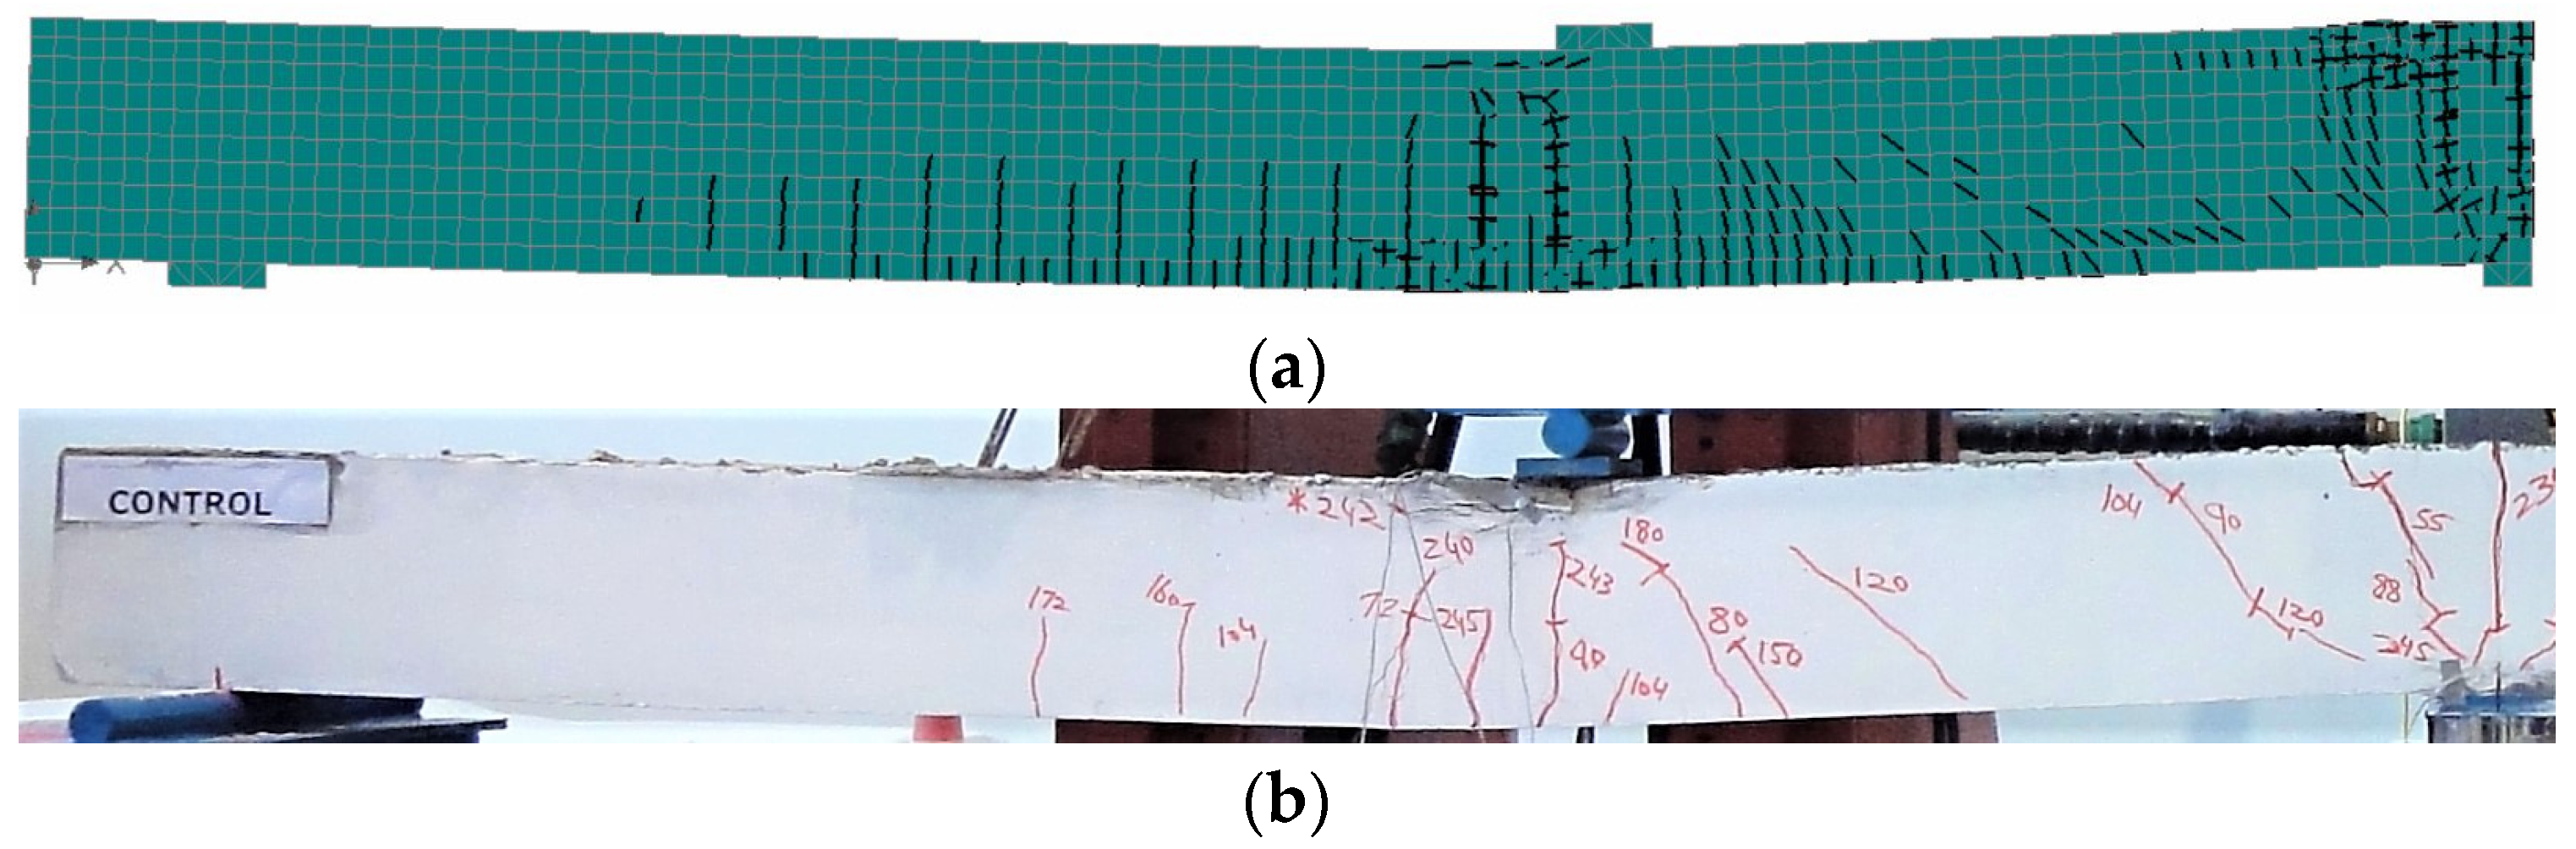
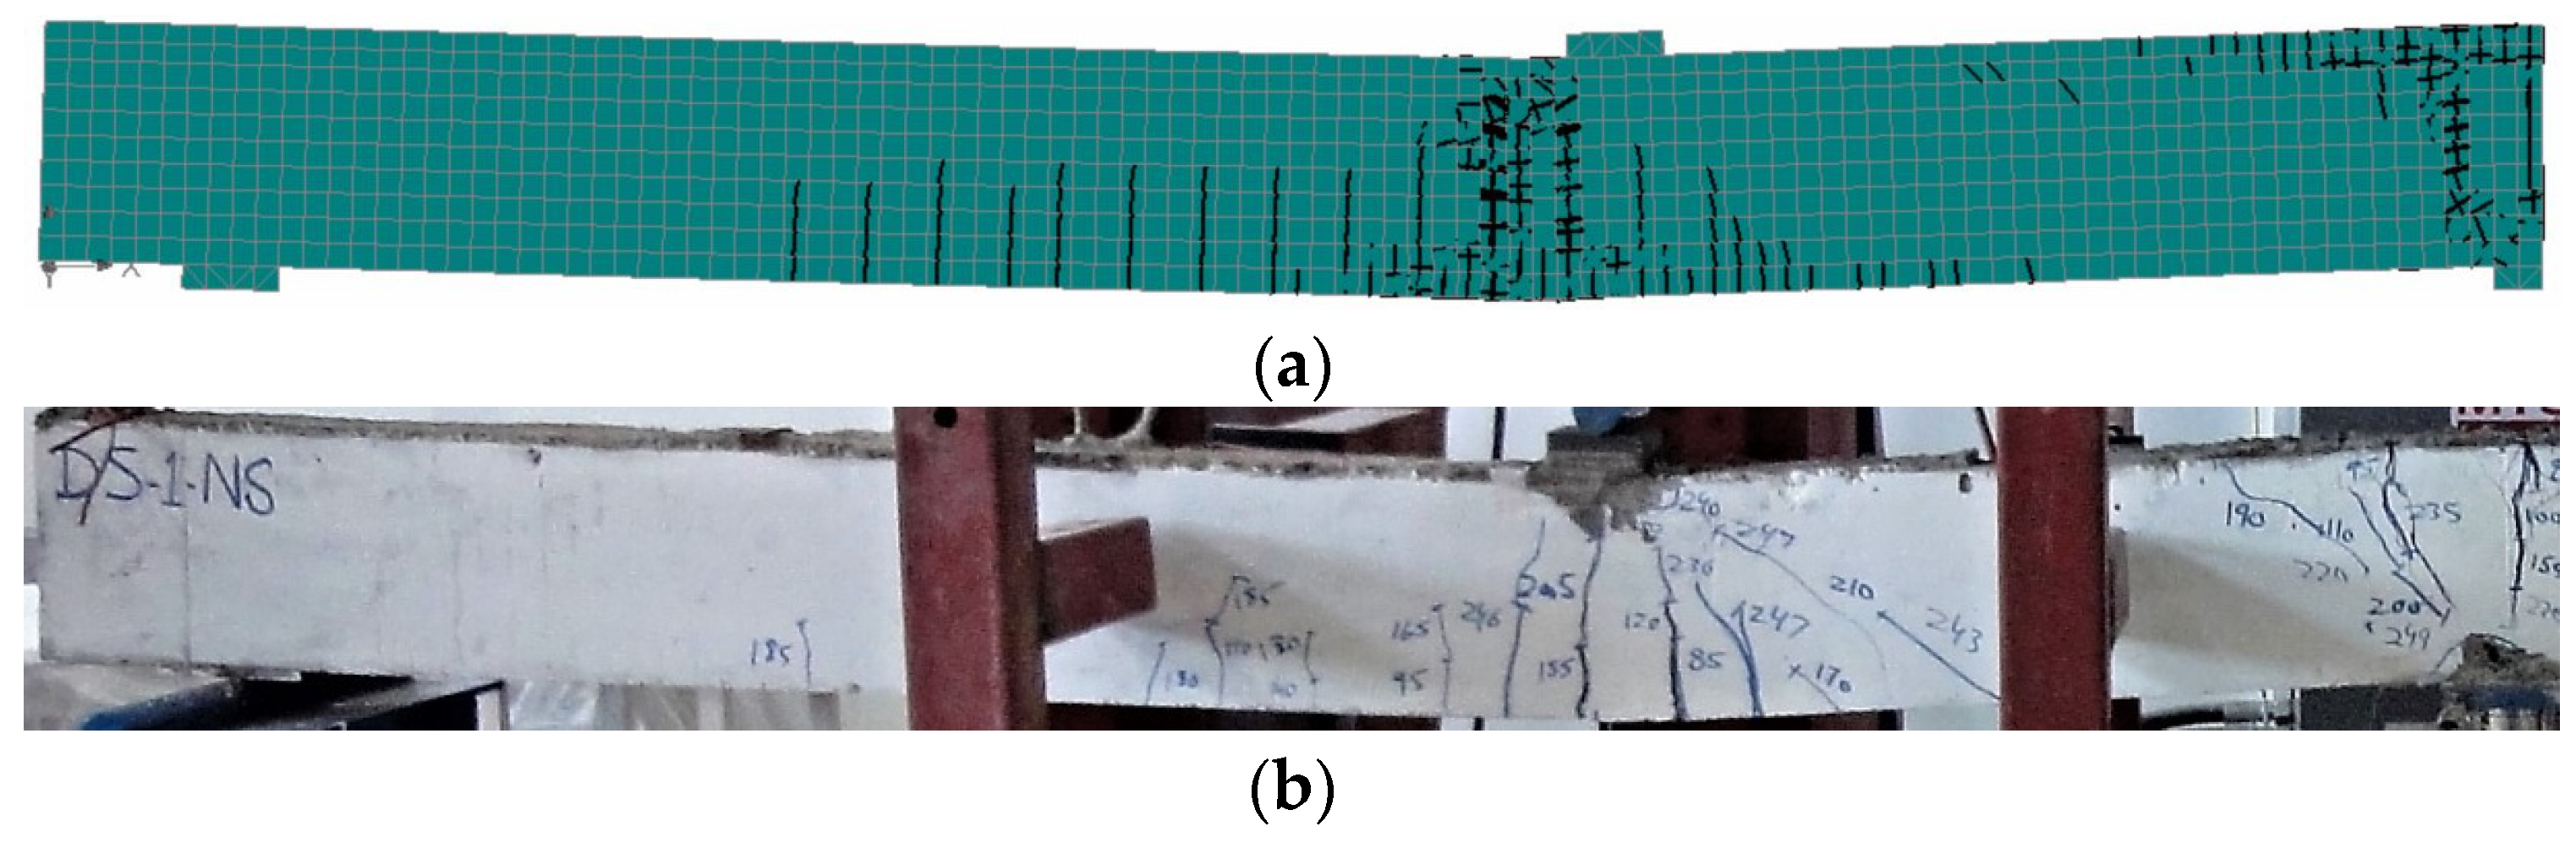
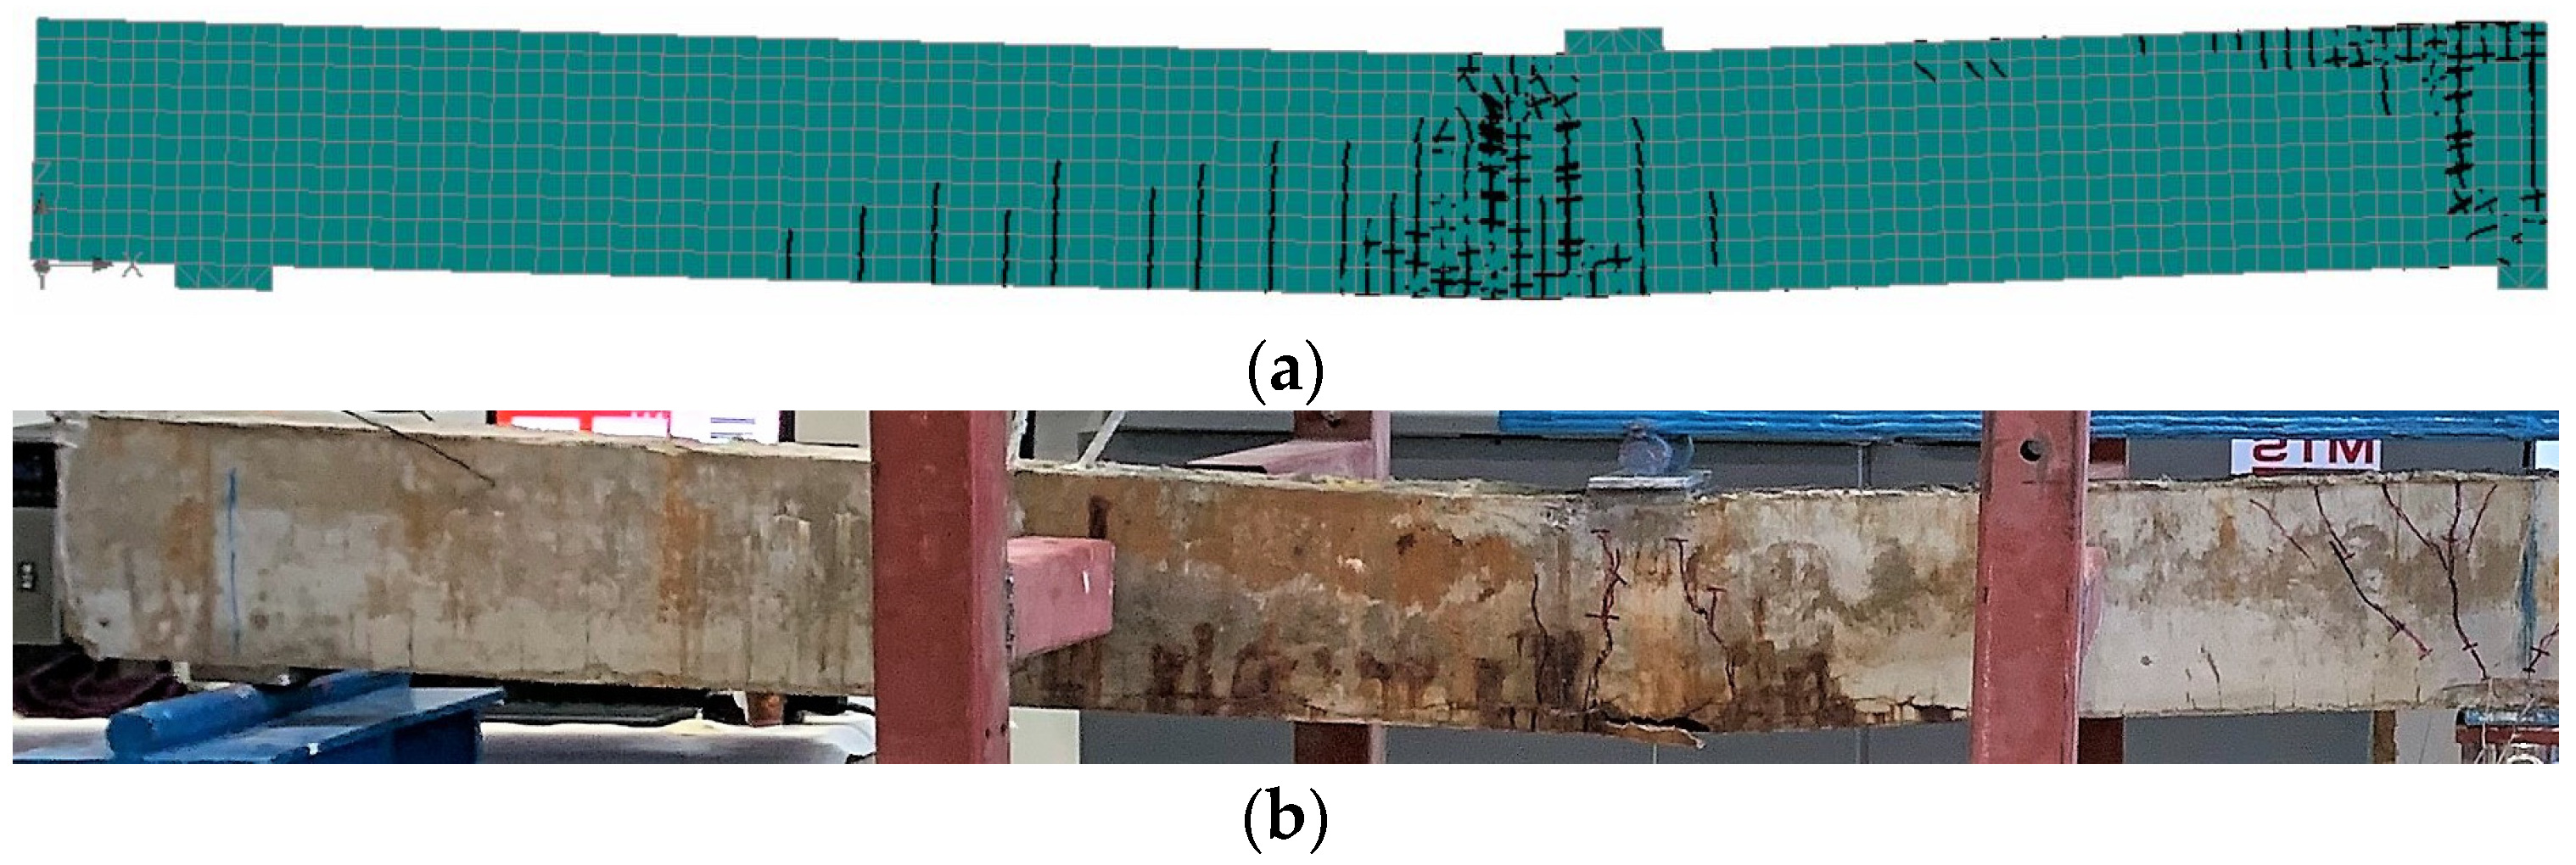
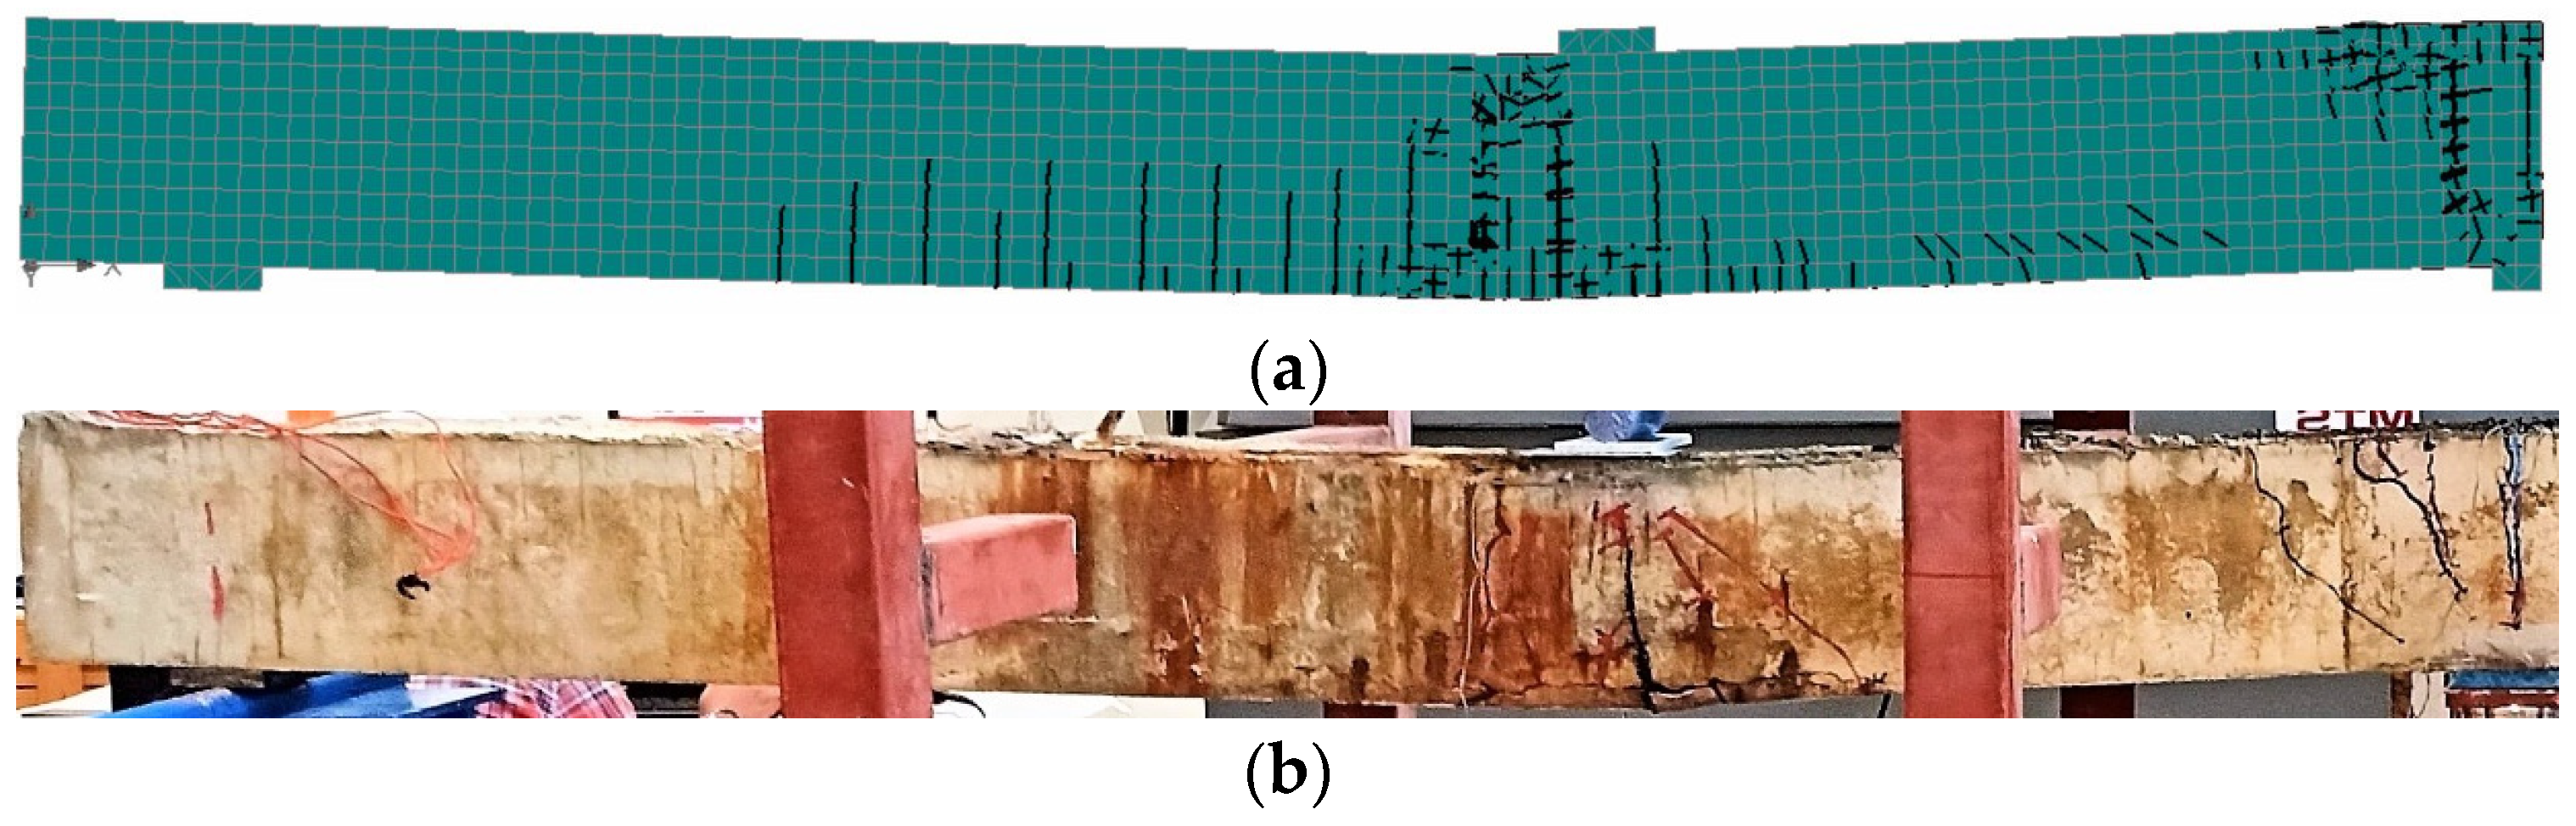
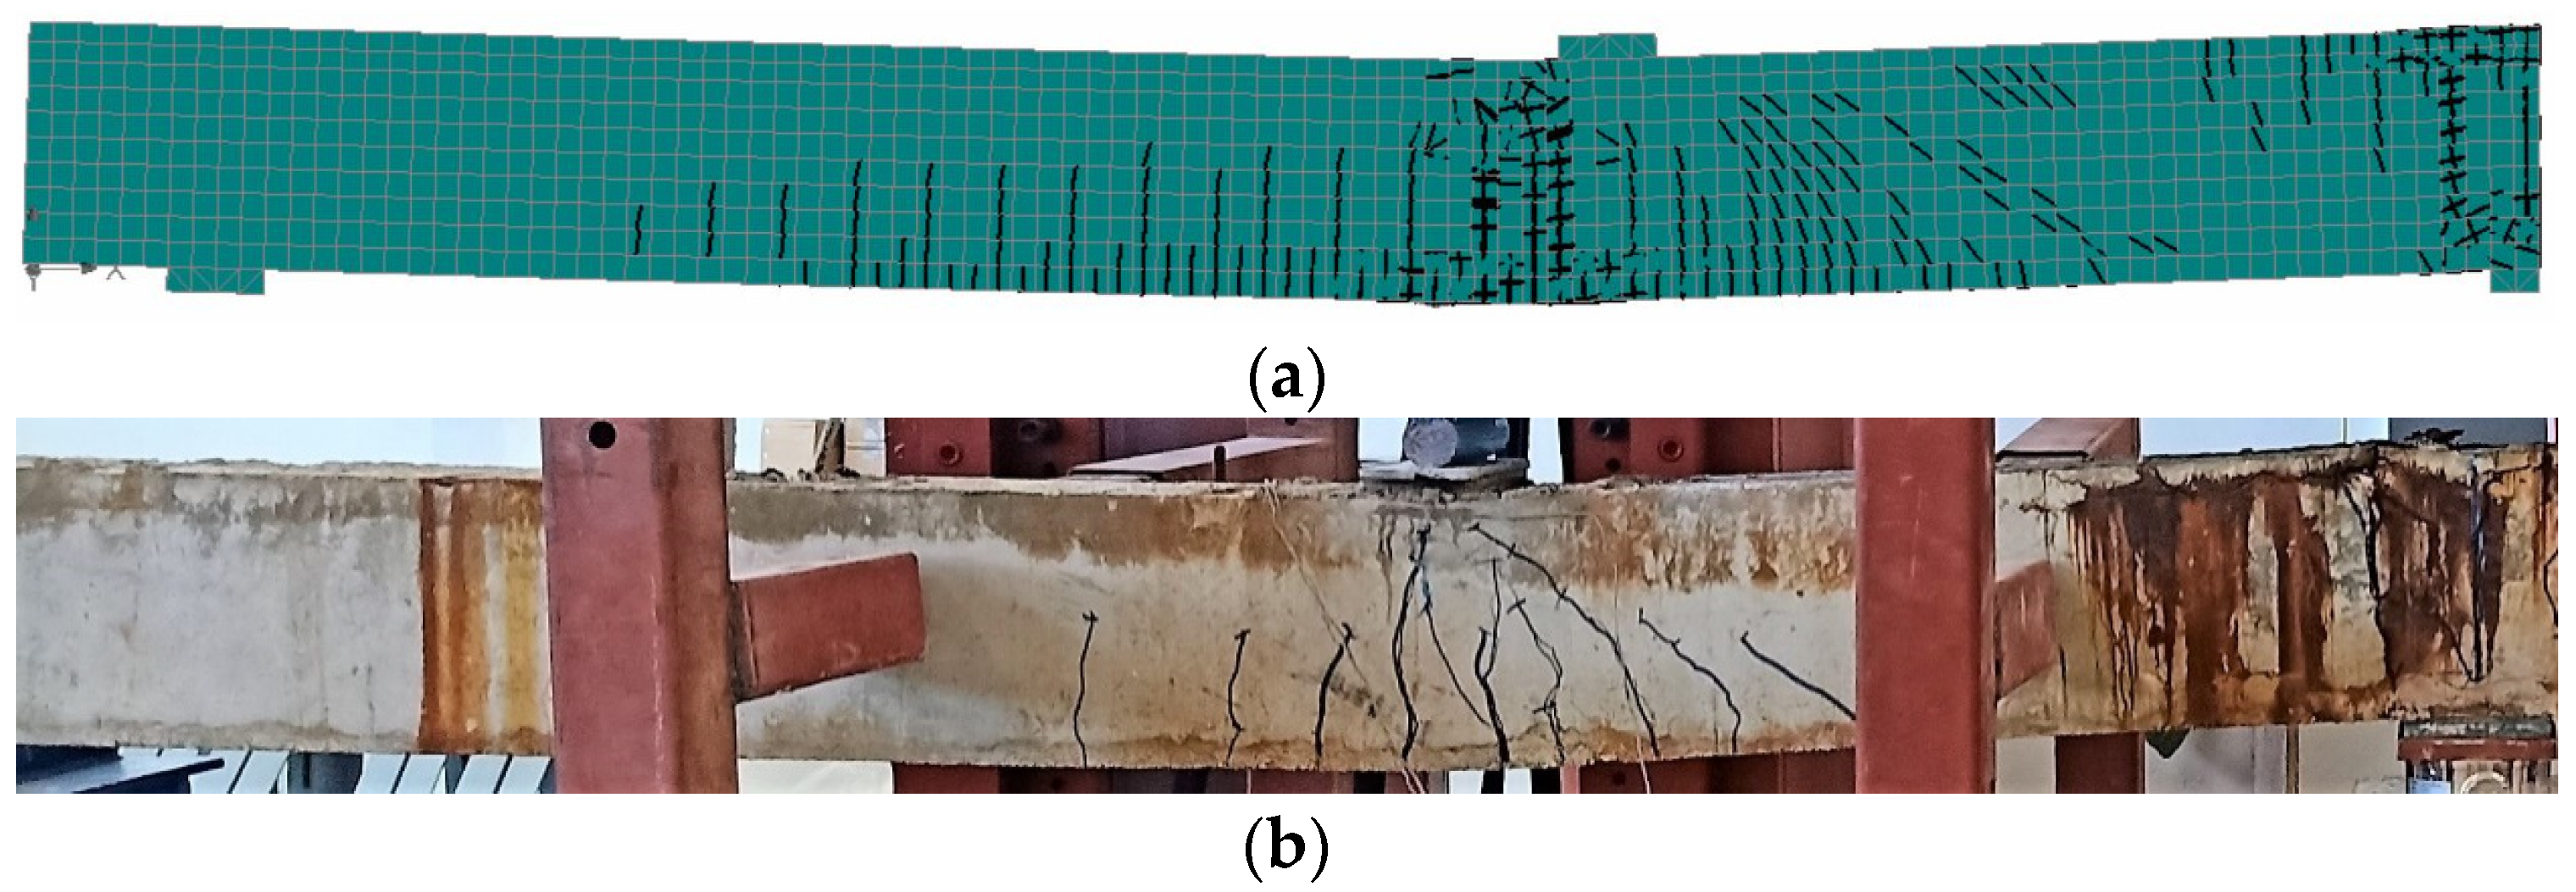
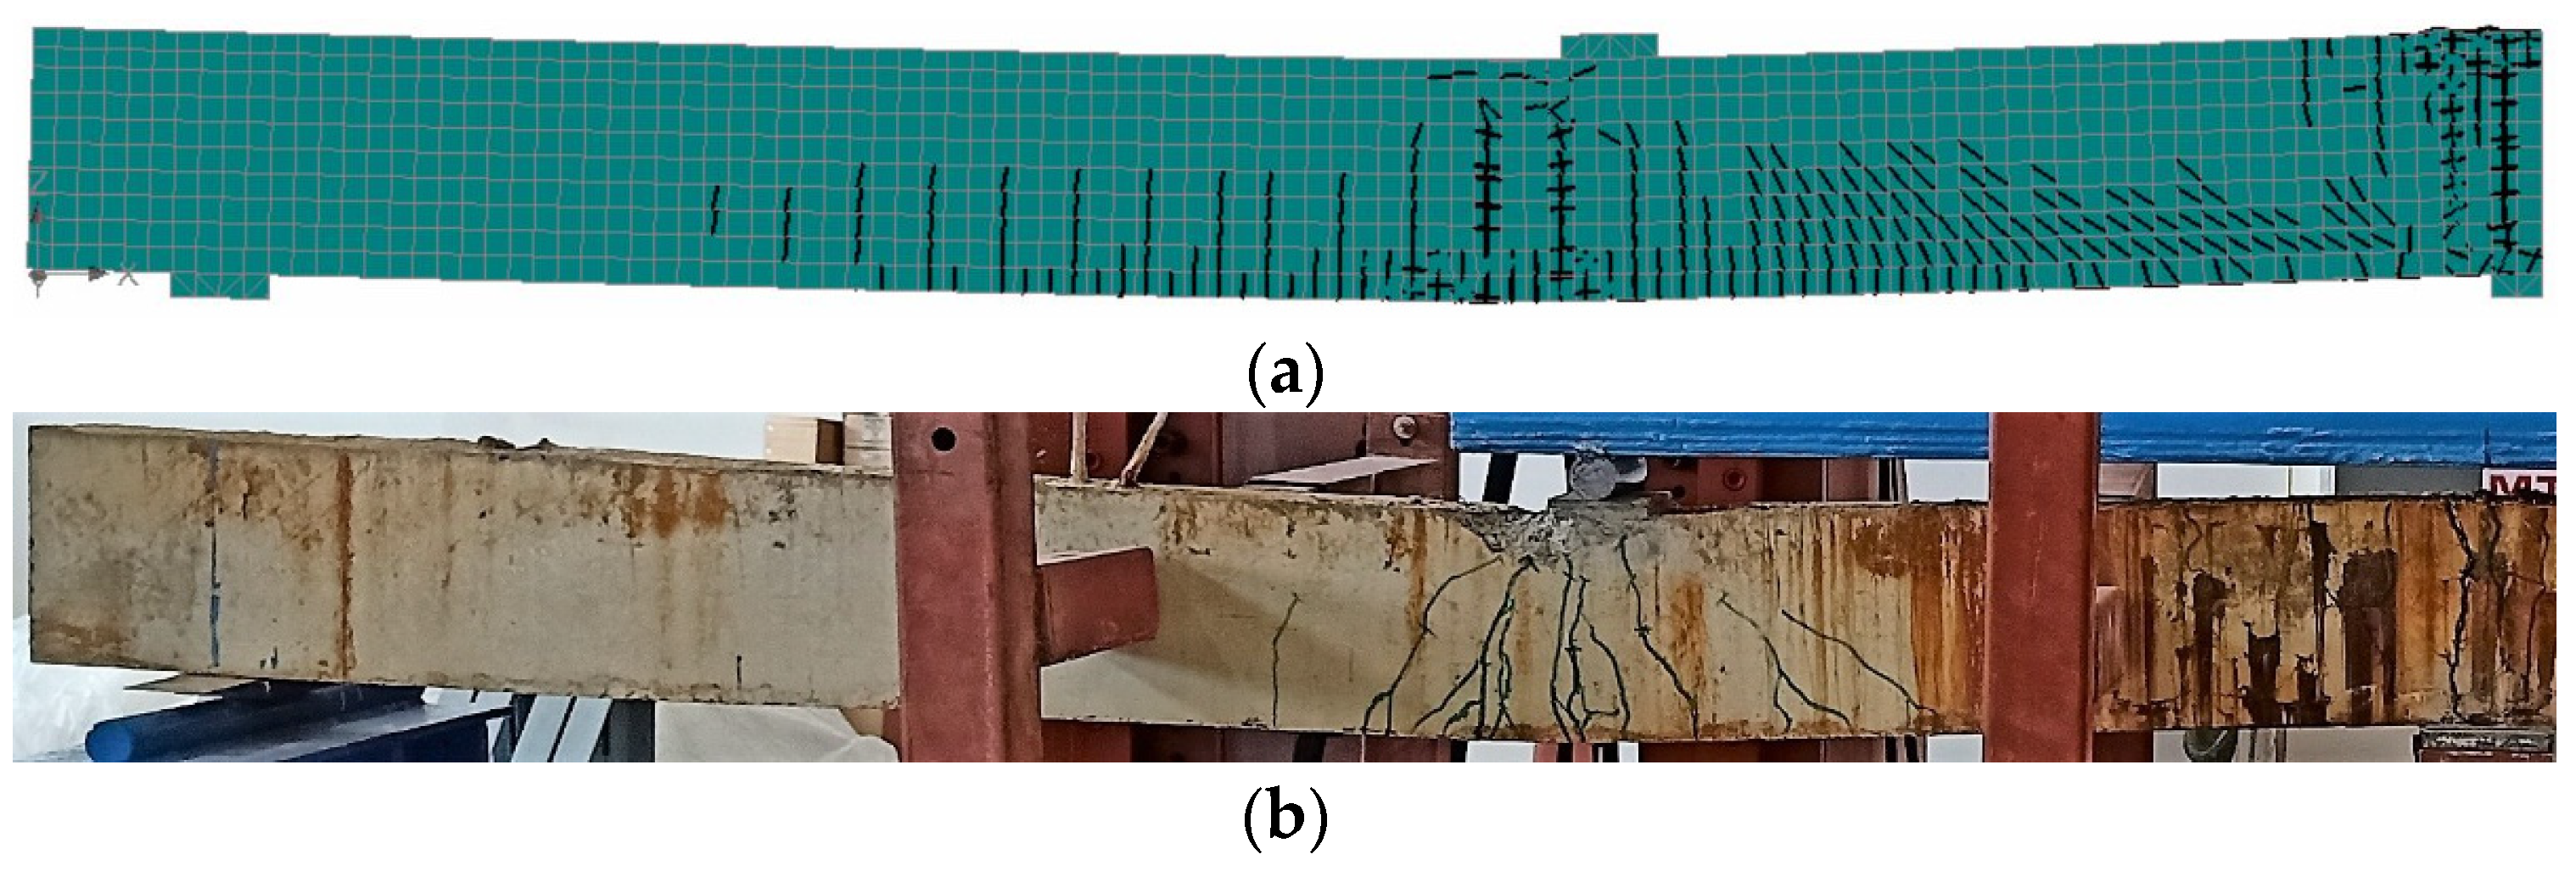
3.2. Crack Pattern
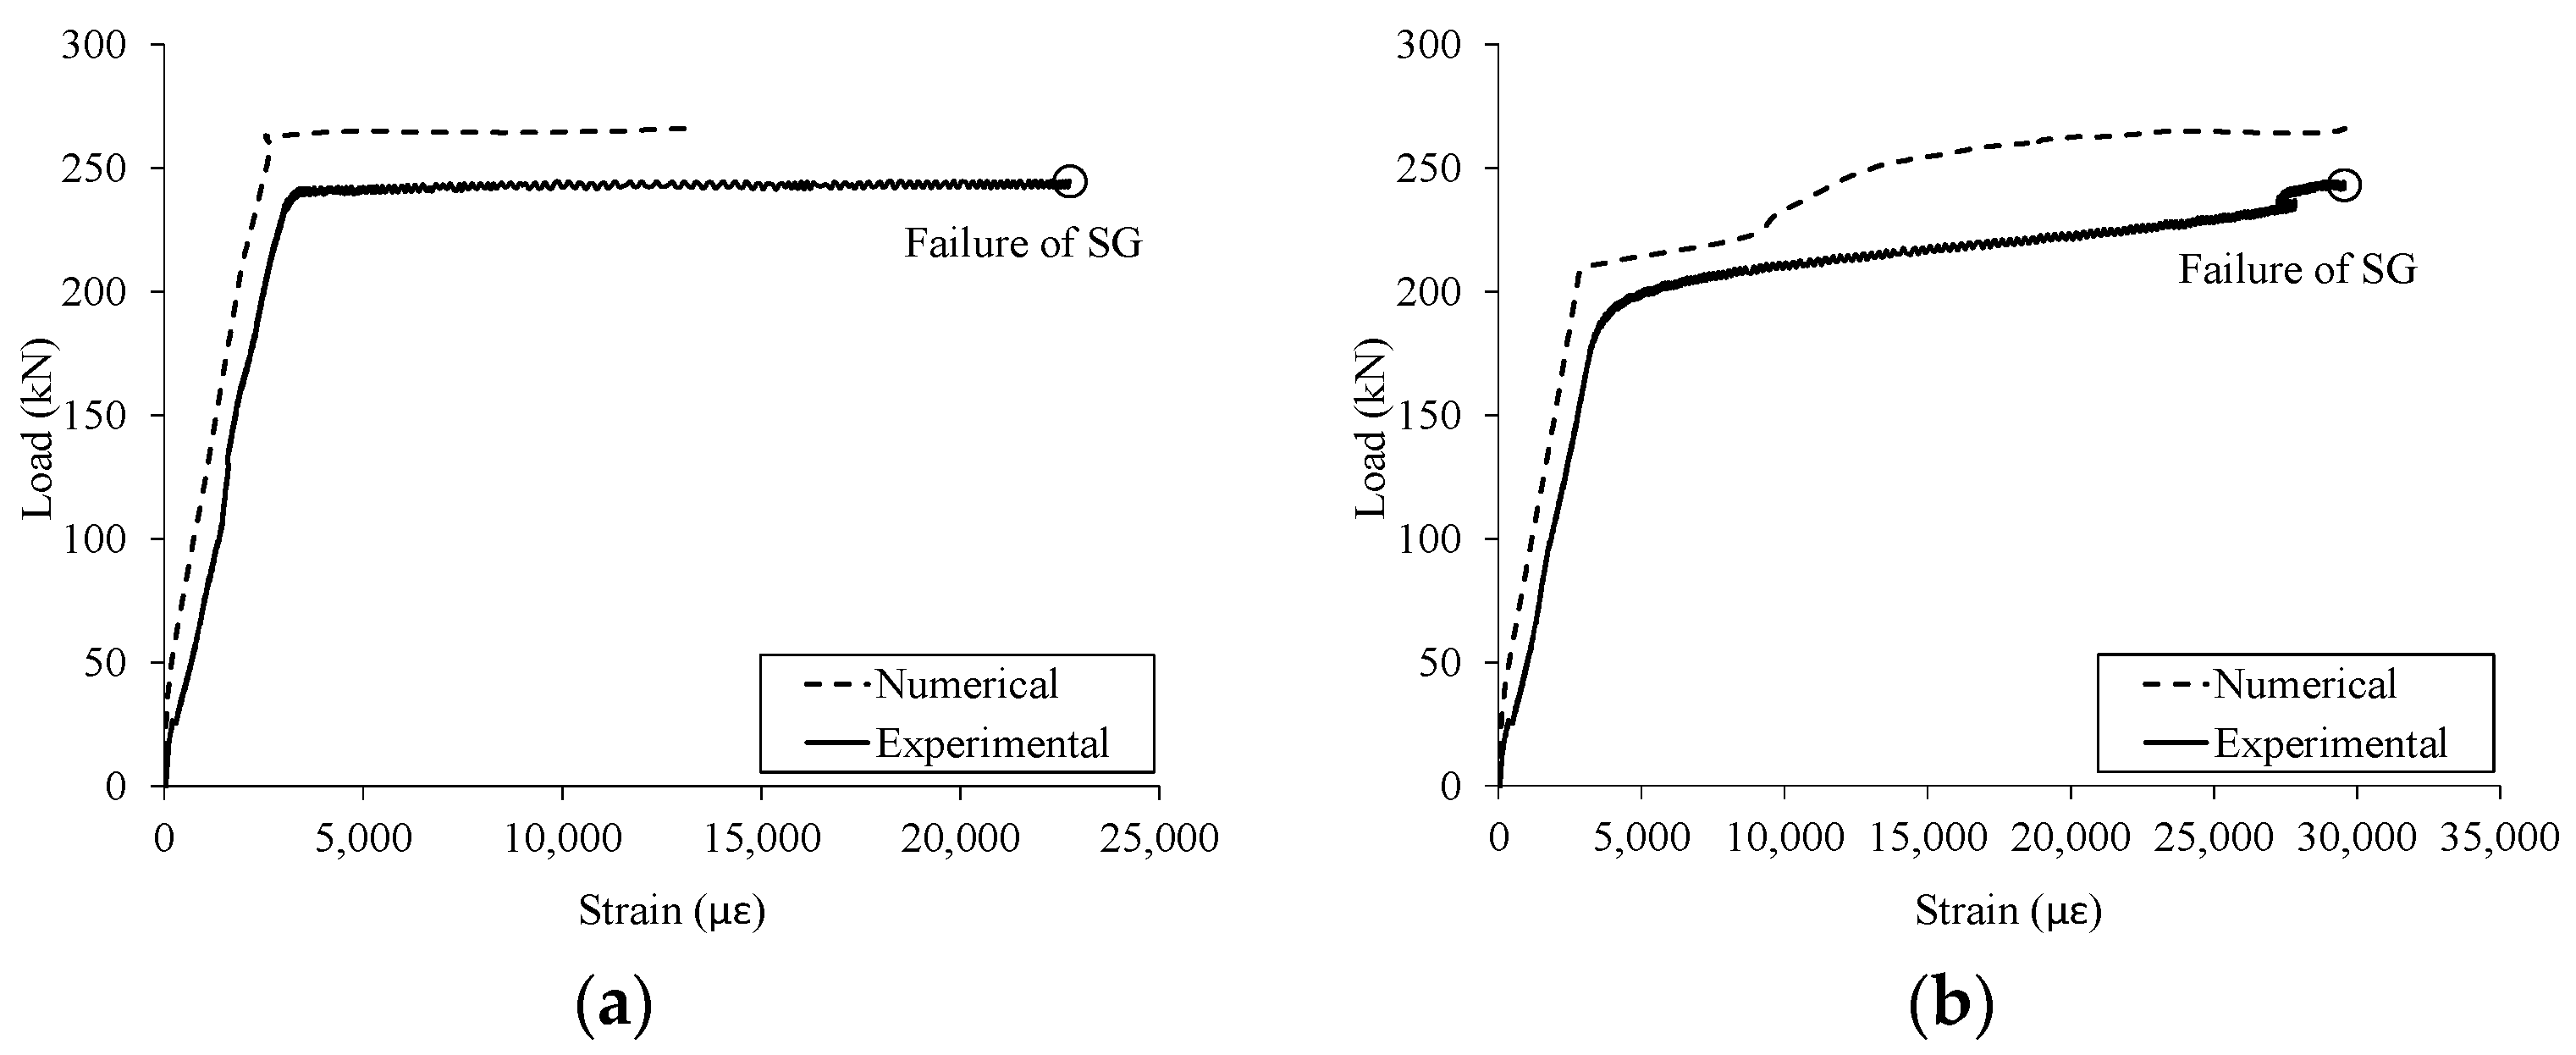
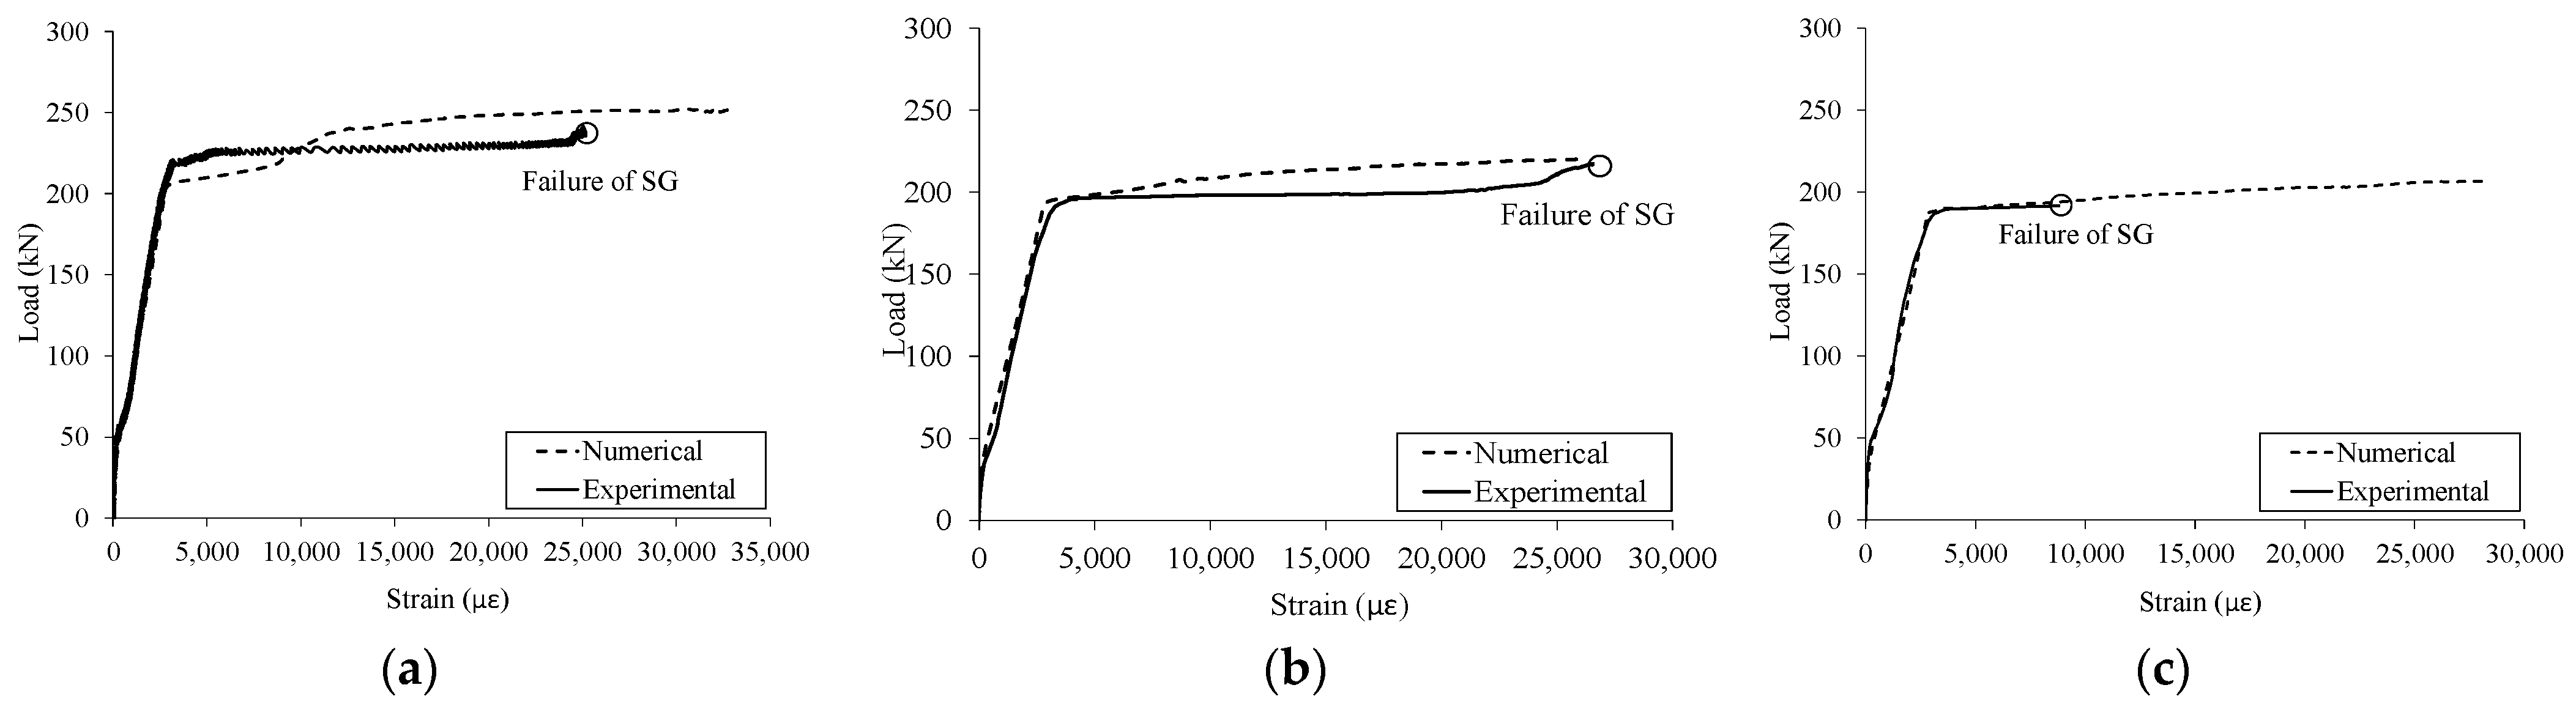
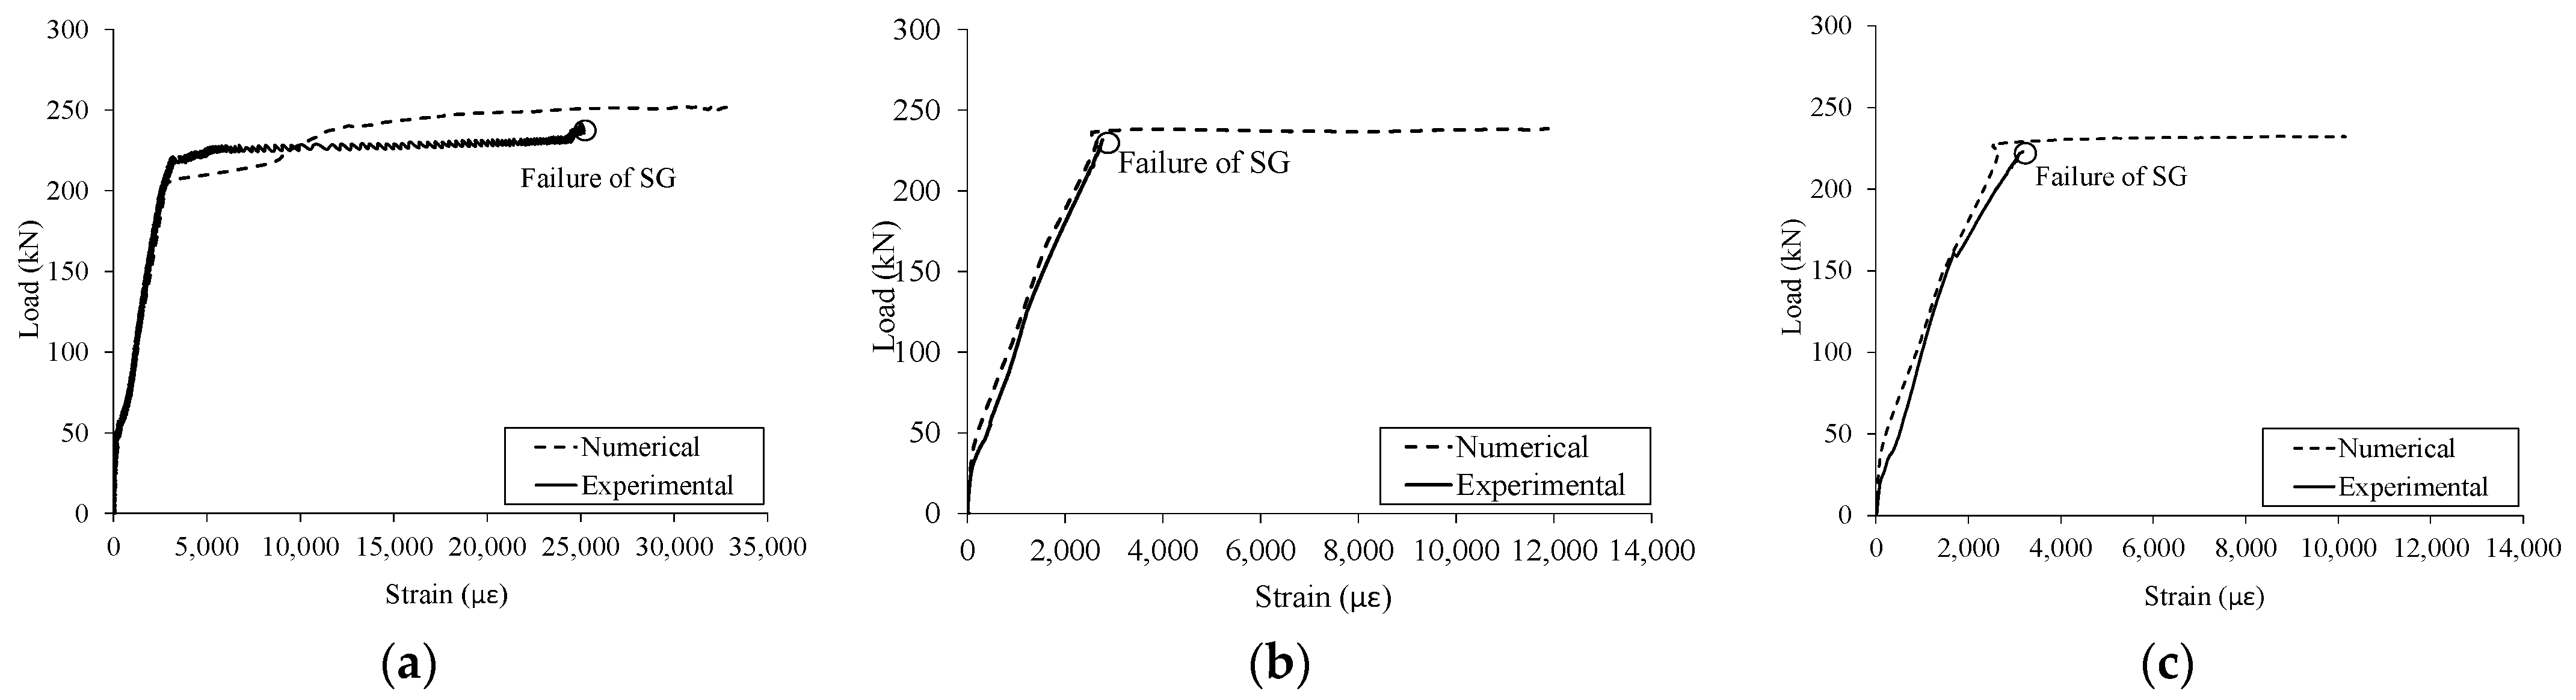
3.3. Steel Strains
4. Parametric Study
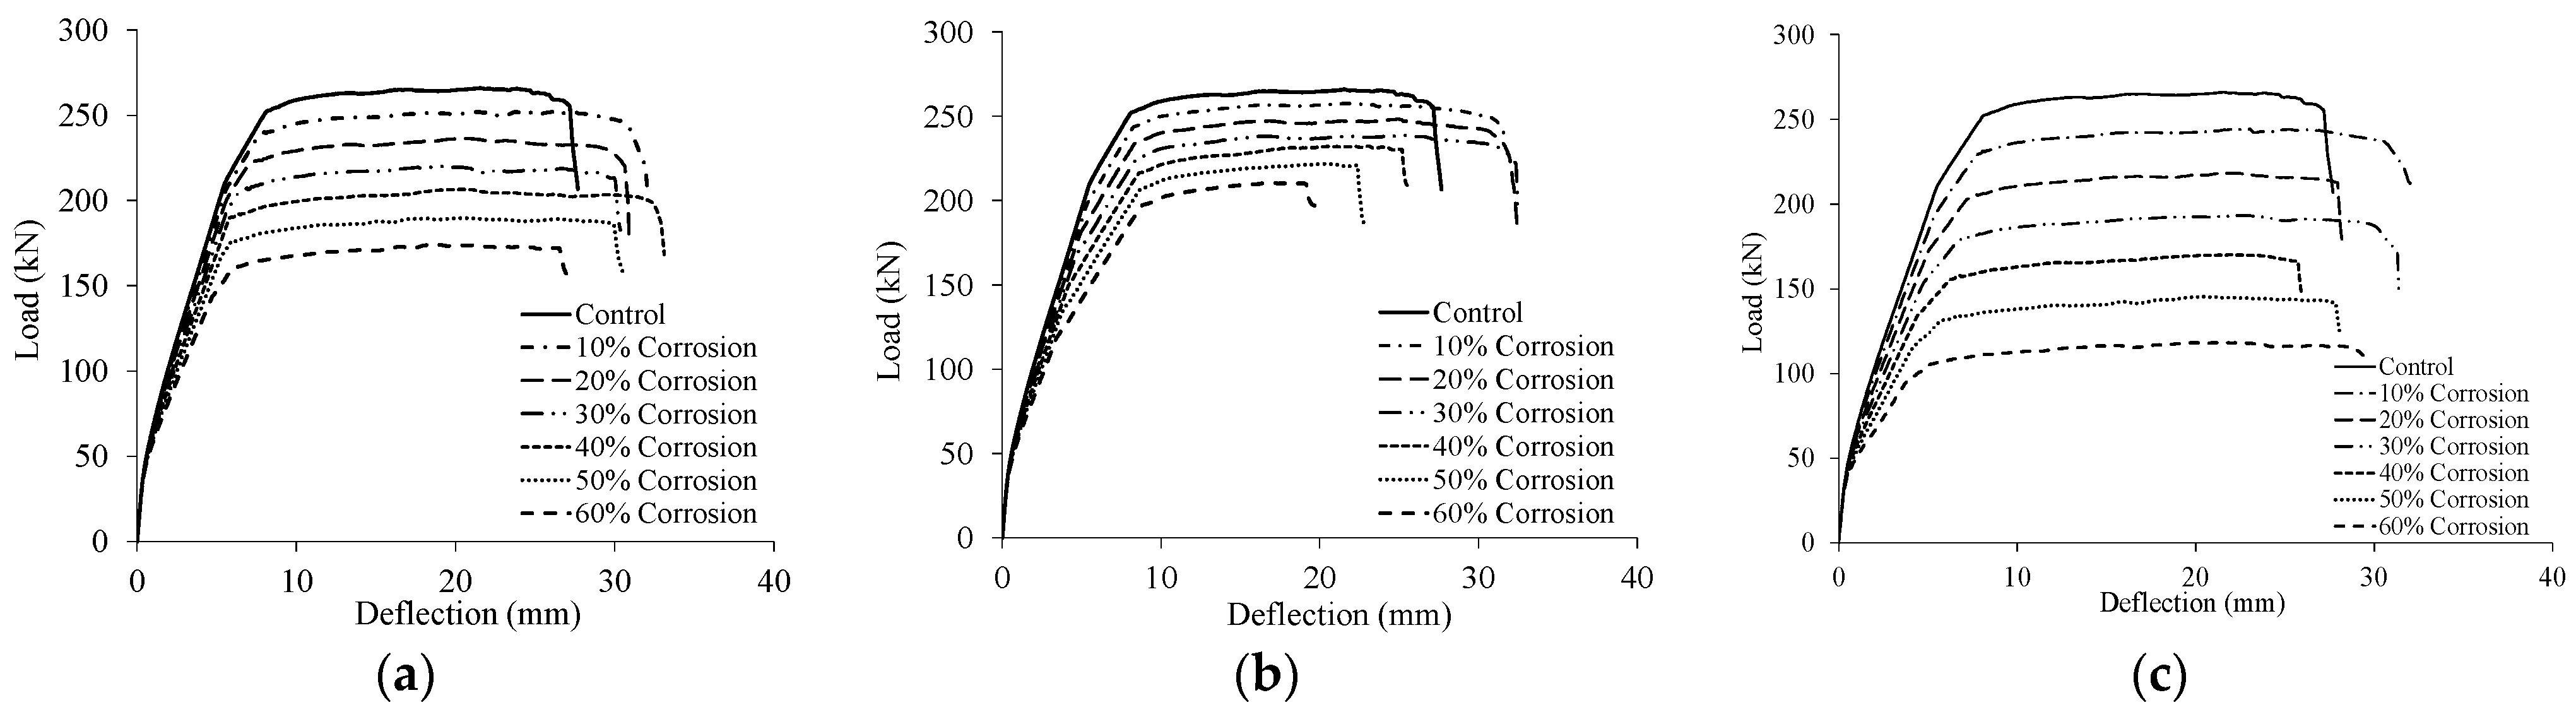
4.1. Effect of Corrosion on Load-Deflection Response
4.2. Effect of Corrosion on Moment Redistribution
5. Conclusions
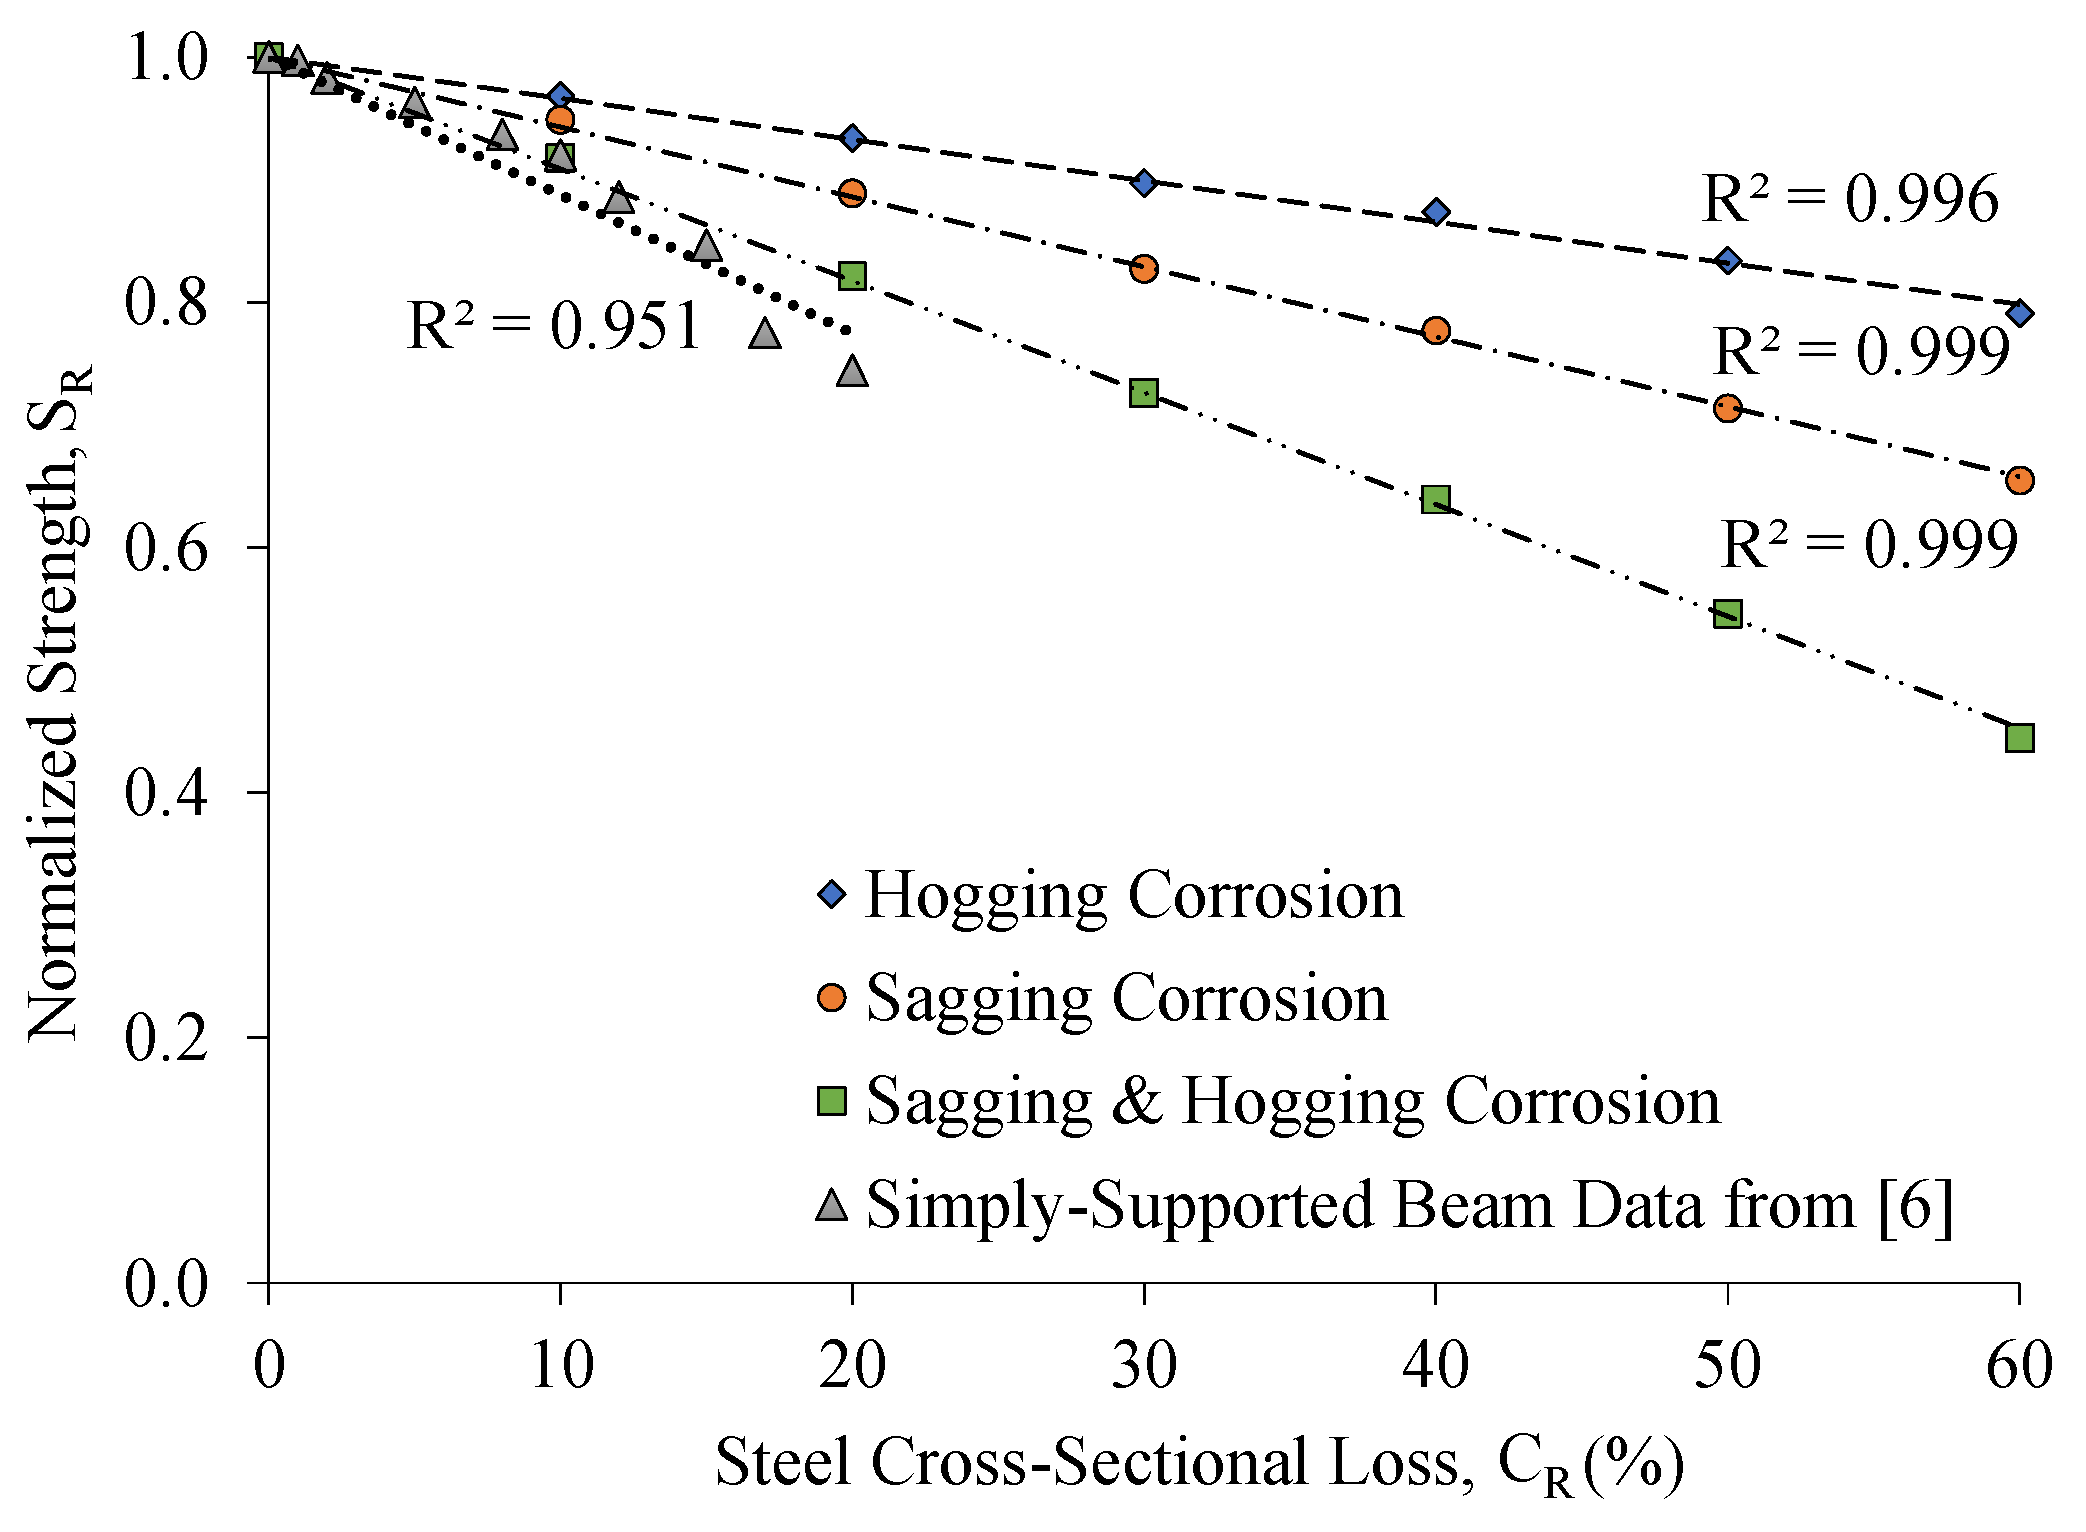
- The load-carrying capacity of two-span RC beams decreased linearly with an increase in the level of corrosion, irrespective of its location. The rate of the strength reduction was, however, dependent on the location of the corrosion.
- The rate of the strength reduction of the beam models with corrosion in the sagging region only was approximately 70% higher than that of their counterparts with hogging corrosion only.
- The rate of the strength reduction of the beam models with corrosion in both sagging and hogging regions was approximately 2.7 times that of their counterparts with hogging corrosion only.
- Although sagging corrosion was more detrimental to the load capacity than hogging corrosion, the flexural stiffness of the beam models with hogging corrosion was lower than that of their counterparts with sagging corrosion. The beam models experiencing sagging and hogging corrosion concurrently exhibited the poorest performance in terms of flexural stiffness and load capacity.
- The value of the moment redistribution ratio at the ultimate load was dependent on the location of corrosion and the order of steel yielding. The control uncorroded beam model exhibited a first steel yielding in the hogging section followed by a second steel yielding in the sagging section, which resulted in a moment redistribution ratio of 18% at the ultimate load.
- The moment redistribution ratio at the ultimate load of the beam models with corrosion in the sagging region only decreased with an increase in the level of damage up to 30% corrosion. Further corrosion in the sagging region increased the moment redistribution ratio at ultimate load. The beam model with 60% corrosion in the sagging region exhibited a moment redistribution ratio of 22% at the ultimate load.
- The moment redistribution ratio at ultimate load of the beam models with corrosion in the hogging region only increased consistently with an increase in the level of corrosion damage. The beam models with corrosion in the hogging region only exhibited a moment redistribution ratio of 22–50% at the ultimate load.
- The corrosion of steel in both the sagging and hogging regions concurrently did not change the order of the steel yielding. The moment redistribution ratio at ultimate load for the beam models with sagging and hogging corrosion remained constant at 18%.
Author Contributions
Funding
Institutional Review Board Statement
Informed Consent Statement
Data Availability Statement
Conflicts of Interest
References
- Bossio, A.; Imperatore, S.; Kioumarsi, M. Ultimate Flexural Capacity of Reinforced Concrete Elements Damaged by Corrosion. Buildings 2019, 9, 160. [Google Scholar] [CrossRef]
- Yalciner, H.; Kumbasaroglu, A.; El-Sayed, A.K.; Balkis, A.P.; Dogru, E.; Turan, A.I.; Karimi, A.; Kohistani, R.; Mermit, M.F.; Bicer, K. Flexural Strength of Corroded Reinforced Concrete Beams. ACI Struct. J. 2020, 117, 29–41. [Google Scholar] [CrossRef]
- El Maaddawy, T.; Soudki, K.; Topper, T. Long-Term Performance of Corrosion-Damaged Reinforced Concrete Beams. ACI Struct. J. 2005, 102, 649–656. [Google Scholar]
- El Maaddawy, T.; Soudki, K. A model for prediction of time from corrosion initiation to corrosion cracking. Cem. Concr. Compos. 2007, 29, 168–175. [Google Scholar] [CrossRef]
- Wang, Y.; Zhao, Y.; Gong, F.; Dong, J.; Maekawa, K. Developing a Three-Dimensional Finite Element Analysis Approach to Simulate Corrosion-Induced Concrete Cracking in Reinforced Concrete Beams. Eng. Struct. 2022, 257, 114072. [Google Scholar] [CrossRef]
- Zeng, B.; Yang, Y.; Gong, F.; Maekawa, K. Corrosion Crack Morphology and Creep Analysis of Members Based on Meso-Scale Corrosion Penetration. Materials 2022, 15, 7338. [Google Scholar] [CrossRef] [PubMed]
- El-Refaie, S.A.; Ashour, A.F.; Garrity, S.W. Sagging and Hogging Strengthening of Continuous Reinforced Concrete Beams Using Carbon Fiber-Reinforced Polymer Sheets. ACI Struct. J. 2003, 100, 446–453. [Google Scholar]
- El-Maaddawy, T.; Alshawa, J.; El-Ariss, B. Strengthening of Continuous Concrete Slab Strips Containing Cutouts. ACI Struct. J. 2016, 113, 1243–1252. [Google Scholar] [CrossRef]
- Alkhalil, J.; El-Maaddawy, T. Nonlinear Flexural Response of Continuous Concrete Slab Strips Strengthened with Near Surface–Mounted Composites. J. Compos. Constr. 2017, 21, 04016071. [Google Scholar] [CrossRef]
- Alkhalil, J.; El-Maaddawy, T. Finite Element Modelling and Testing of Two-Span Concrete Slab Strips Strengthened by Externally-Bonded Composites and Mechanical Anchors. Eng. Struct. 2017, 147, 45–61. [Google Scholar] [CrossRef]
- Su, M.; Zeng, C.; Li, W.; Zhu, J.H.; Lin, W.; Ueda, T.; Xing, F. Flexural Performance of Corroded Continuous RC Beams Rehabilitated by ICCP-SS. Compos. Struct. 2020, 232, 111556. [Google Scholar] [CrossRef]
- Feng, R.; Liu, Y.; Zhu, J.H.; Xing, F. Flexural Behaviour of C-FRCM Strengthened Corroded RC Continuous Beams. Compos. Struct. 2020, 245, 112200. [Google Scholar] [CrossRef]
- Fernandez, I.; Herrador, M.F.; Marí, A.R.; Bairán, J.M. Structural Effects of Steel Reinforcement Corrosion on Statically Indeterminate Reinforced Concrete Members. Mater. Struct. Mater. Constr. 2016, 49, 4959–4973. [Google Scholar] [CrossRef]
- Fernandez, I.; Herrador, M.F.; Marí, A.R.; Bairán, J.M. Ultimate Capacity of Corroded Statically Indeterminate Reinforced Concrete Members. Int. J. Concr. Struct. Mater. 2018, 12, 1–23. [Google Scholar] [CrossRef]
- Khattak, N.; Mansour, M.; El-Maaddawy, T.; Ismail, N. Continuous Reinforced Concrete Beams Strengthened with Fabric-Reinforced Cementitious Matrix: Experimental Investigation and Numerical Simulation. Buildings 2022, 12, 27. [Google Scholar] [CrossRef]
- Cairns, J.; Coakley, E. Deformation of Continuous Reinforced Concrete Beams during Patch Repair. Struct. Concr. 2010, 11, 149–160. [Google Scholar] [CrossRef]
- Ashour, A.F.; El-Refaie, S.A.; Garrity, S.W. Flexural Strengthening of RC Continuous Beams Using CFRP Laminates. Cem. Concr. Compos. 2004, 26, 765–775. [Google Scholar] [CrossRef]
- Fernandez, I.; Bairán, J.M.; Marí, A.R. Corrosion Effects on the Mechanical Properties of Reinforcing Steel Bars. Fatigue and σ-ε Behavior. Constr. Build. Mater. 2015, 101, 772–783. [Google Scholar] [CrossRef]
- Insua, A.G. Effects of Reinforcement Corrosion on Ductility and Stress Redistribution Capacity in Continuous Reinforced Concrete Beams; Tabajo Final de Máster: Barcelona, Spain, 2021. [Google Scholar]
- Marí, A.R.; Valdés, M. Long-Term Behavior of Continuous Precast Concrete Girder Bridge Model. J. Bridge Eng. 2000, 5, 22–30. [Google Scholar] [CrossRef]
- ATENA Computer Software. Cervenka Consulting s.r.o.: Prague, Czech Republic. Available online: https://www.cervenka.cz/products/atena/ (accessed on 23 November 2022).
- ACI 318-19; Building Code Requirements for Structural Concrete—Commentary on Building Code Requirements for Structural Concrete (ACI 318R-19). American Concrete Institute (ACI): Farmington Hills, MI, USA, 2019.
- Ashour, S.A.; Hasanain, G.S.; Wafa, F.F. Shear Behavior of High-Strength Fiber Reinforced Concrete Beams. Struct. J. 1992, 89, 176–184. [Google Scholar]
- El-Tawil, S.; Ogunc, C.; Okeil, A.M.; Shahawy, M. Static and Fatigue Analyses of RC Beams Strengthened with CFRP Laminates. J. Compos. Constr. 2001, 5, 58–267. [Google Scholar] [CrossRef]
- Comité Euro-International du Béton (CEB). CEB-FIP Model Code-Design Code; Thomas Telford: London, UK, 1991. [Google Scholar]
- ASTM G1-90; Standard Practice for Preparing, Cleaning, and Evaluating Corrosion Test Specimens. ASTM International: West Conshohocken, PA, USA, 1999.


| Specimen | Corrosion Location | Corrosion Duration (Days) | Corrosion Damage (%) * |
|---|---|---|---|
| Control | - | - | - |
| S-10 | Sagging Region | 60 | 10 |
| S-20 | Sagging Region | 120 | 20 |
| S-30 | Sagging Region | 180 | 30 |
| S-40 | Sagging Region | 240 | 40 |
| H-20 | Hogging Region | 120 | 20 |
| H-30 | Hogging Region | 180 | 30 |
| H-40 | Hogging Region | 240 | 40 |
| Specimen | Ultimate Load (kN) | Error (%) * | Deflection at Ultimate Load (mm) | Error (%) * | ||
|---|---|---|---|---|---|---|
| Numerical (PFE) | Experimental (PExp) | Numerical (ΔFE) | Experimental (ΔExp) | |||
| Control | 266.0 | 244.7 | +8.7 | 21.6 | 17.1 | +26.3 |
| S-10 | 252.4 | 251.7 | +0.3 | 26.2 | 25.0 | +4.8 |
| S-20 | 236.4 | 222.3 | +6.3 | 20.9 | 23.8 | −12.2 |
| S-30 | 220.0 | 217.3 | +1.2 | 19.2 | 22.0 | −12.7 |
| S-40 | 206.6 | 208.7 | −1.0 | 20.8 | 21.6 | −3.7 |
| H-20 | 248.4 | 247.4 | +0.4 | 24.0 | 22.0 | +9.1 |
| H-30 | 238.6 | 231.4 | +3.1 | 24.6 | 23.5 | +4.7 |
| H-40 | 232.4 | 223.0 | +4.2 | 23.1 | 23.6 | −2.1 |
| Corrosion Location | Corrosion Damage (%) | Moment at Ultimate, MFE (kN.m) | Elastic Moment, ME (kN.m) | Moment Redistribution Ratio, β (%) | |||
|---|---|---|---|---|---|---|---|
| Sagging | Hogging | Sagging | Hogging | Sagging | Hogging | ||
| Control | - | 46.9 | 50.2 | 39.8 | 61.3 | 18 | −18 |
| Sagging | 10 | 43.2 | 50.0 | 37.8 | 58.2 | 14 | −14 |
| 20 | 38.5 | 49.9 | 35.4 | 54.5 | 9 | −8 | |
| 30 | 33.8 | 49.6 | 33.0 | 50.7 | 2 | −2 | |
| 40 | 30.0 | 49.4 | 31.0 | 47.6 | −3 | 4 | |
| 50 | 25.4 | 49.1 | 28.4 | 43.7 | −11 | 12 | |
| 60 | 20.9 | 48.9 | 26.1 | 40.1 | −20 | 22 | |
| Hogging | 10 | 47.0 | 46.3 | 38.6 | 59.4 | 22 | −22 |
| 20 | 47.2 | 41.8 | 37.2 | 57.2 | 27 | −27 | |
| 30 | 47.1 | 37.3 | 35.7 | 55.0 | 32 | −32 | |
| 40 | 47.0 | 33.9 | 34.8 | 53.5 | 35 | −37 | |
| 50 | 46.8 | 29.1 | 33.2 | 51.1 | 41 | −43 | |
| 60 | 46.8 | 24.2 | 31.5 | 48.5 | 49 | −50 | |
| Sagging and Hogging | 10 | 43.2 | 46.2 | 36.6 | 56.3 | 18 | −18 |
| 20 | 38.6 | 41.6 | 32.7 | 50.3 | 18 | −17 | |
| 30 | 34.08 | 36.6 | 28.9 | 44.5 | 18 | −18 | |
| 40 | 29.8 | 32.1 | 25.5 | 39.2 | 17 | −18 | |
| 50 | 25.5 | 27.5 | 21.8 | 33.5 | 17 | −18 | |
| 60 | 20.8 | 22.3 | 17.7 | 27.3 | 18 | −18 | |
Disclaimer/Publisher’s Note: The statements, opinions and data contained in all publications are solely those of the individual author(s) and contributor(s) and not of MDPI and/or the editor(s). MDPI and/or the editor(s) disclaim responsibility for any injury to people or property resulting from any ideas, methods, instructions or products referred to in the content. |
© 2023 by the authors. Licensee MDPI, Basel, Switzerland. This article is an open access article distributed under the terms and conditions of the Creative Commons Attribution (CC BY) license (https://creativecommons.org/licenses/by/4.0/).
Share and Cite
Elmezayen, Y.; Khattak, N.; El-Maaddawy, T. Prediction of Nonlinear Flexural Behavior of Continuous RC Beams Pre-Damaged by Corrosion. Buildings 2023, 13, 1398. https://doi.org/10.3390/buildings13061398
Elmezayen Y, Khattak N, El-Maaddawy T. Prediction of Nonlinear Flexural Behavior of Continuous RC Beams Pre-Damaged by Corrosion. Buildings. 2023; 13(6):1398. https://doi.org/10.3390/buildings13061398
Chicago/Turabian StyleElmezayen, Youssef, Nouman Khattak, and Tamer El-Maaddawy. 2023. "Prediction of Nonlinear Flexural Behavior of Continuous RC Beams Pre-Damaged by Corrosion" Buildings 13, no. 6: 1398. https://doi.org/10.3390/buildings13061398
APA StyleElmezayen, Y., Khattak, N., & El-Maaddawy, T. (2023). Prediction of Nonlinear Flexural Behavior of Continuous RC Beams Pre-Damaged by Corrosion. Buildings, 13(6), 1398. https://doi.org/10.3390/buildings13061398