Abstract
This paper focuses on the compressive strength of Glass fiber reinforced polymer (GFRP)-confined reinforced concrete columns. Data from 114 sets of GFRP-confined reinforced concrete columns were collected to evaluate the researchers’ and proposed model. A data-driven machine learning model was used to model the compressive strength of the GFRP-confined reinforced concrete columns and investigate the importance and sensitivity of the parameters affecting the compressive strength. The results show that the researchers’ model facilitates the study of the compressive strength of confined columns but suffers from a large coefficient of variation and too high or conservative estimation of compressive strength. The back propagation (BP) neural network has the best accuracy and robustness in predicting the compressive strength of the confined columns, with the coefficient of variation of only 14.22%, and the goodness of fit for both the training and testing sets above 0.9. The parameters that have an enormous influence on compressive strength are the concrete strength and FRP thickness, and all the parameters, except the fracture strain of FRP, are positively or inversely related to the compressive strength.
1. Introduction
It is always known that external confinement of concrete columns can be added to improve their ductility and strength. Traditional methods of external confinement include adding concrete cages to the exterior of the column or installing steel jackets to the exterior of the column. The concrete cage will increase the cross-sectional area and self-weight of the column to a greater extent, whereas steel jackets have a negligible effect on the cross-sectional area and self-weight of the column. The steel structure, however, is subject to environmental factors and is prone to corrosion [,]. In addition, both of these methods are time-consuming and uneconomical. In recent years, fiber-reinforced polymers (FRPs) have been widely used to strengthen concrete structures due to their high strength, lightweight, and easy installation [,,]. Numerous experiments have shown that wrapping it around the outside of a column can significantly increase its axial compressive strength [,,,,]. The models proposed by the researchers have contributed significantly to studying the limit states of FRP-confined columns. Still, the validity of the earlier models is often not guaranteed due to the small amount of experimental data on which they are based, as there are many parameters affecting the confined columns and complex relationships with the limit states of the reinforced columns. Therefore, a model for predicting the limit state of confined FRP columns driven by a large amount of experimental data and considering multiple parameters is yet to be proposed. Starting from the 1990s, a large number of researchers have investigated and proposed restraint models for FRP-confined concrete columns in the ultimate state [,,,,,,,] (including axial compressive strength and ultimate axial strain). Currently, ACI440 takes a model modified from the one proposed by Lam and Teng in 2003 []. Machine learning techniques have been widely used to predict structural status in recent years. Compared to traditional models, machine learning is a data-driven model that takes into account multiple parameters and is adaptive, and the accuracy of the model will improve as the size of the data increases in the future [,,] Naderpour et al. used decision tree and neural networks to predict the failure modes of reinforced concrete columns []. Zhang et al. used six machine learning methods, neural networks, support vector machines, decision tree, gradient boosting decision tree, random forests, and extreme gradient boosting to predict the bond strength of FRP-concrete interfaces []. Vu et al. used gradient boosting tree, random forests, decision tree, support vector machines, and deep learning, to predict the strength of the concrete filled steel tubular columns and the results showed that the gradient boosting tree performed best []. Hu et al. used the dung beetle algorithm to optimize the BP neural network and then predicted the IC and PE peeling of FRP-strengthened reinforced concrete beams []. Nguyen et al. used support vector regression, multilayer perceptron, gradient growth regression, and mechanism gradient growth models to predict the compressive and tensile strengths of high-strength concrete []. Huang et al. used BP neural networks to predict the bond strength of FRP-strengthened reinforced concrete beams [].
In summary, structural engineering has widely used data-driven machine learning techniques. This study uses a data-driven approach to evaluate the proposed model and to develop a cost-saving, highly accurate, and stable model for predicting the compressive strength of GFRP-confined columns. Thus, this study uses linear models (multiple linear regression and ridge regression) and non-linear models (decision trees, random forests, and BP neural networks) in machine learning to predict the compressive strengths of GFRP-confined concrete columns to obtain a model with good prediction results.
2. Experimental Data
2.1. Parameter Selection
Most of the existing models for studying the compressive strength of FRP-confined reinforced concrete columns are based on the equation proposed by Richart in 1929 (Equation (1)).
As can be seen from Equation (1), the parameters considered by the researchers were the concrete strength, the FRP thickness, the column diameter, and the fracture strain and elasticity modulus of FRP.
2.2. Standards for Data Collection
The data collection criteria are as follows.
- (a)
- All columns are confined with GFRP.
- (b)
- The geometric and material properties of the columns and the geometric and material properties of the FRP in the sample are well defined.
The sources of the data are shown in Table 1. Table 1 contains 114 sets of test data from 20 researchers, selected parameters being column diameter, concrete strength, FRP thickness, fracture strain and modulus of elasticity of FRP.

Table 1.
Experimental database.
The distributions of the parameters are shown in Figure 1.
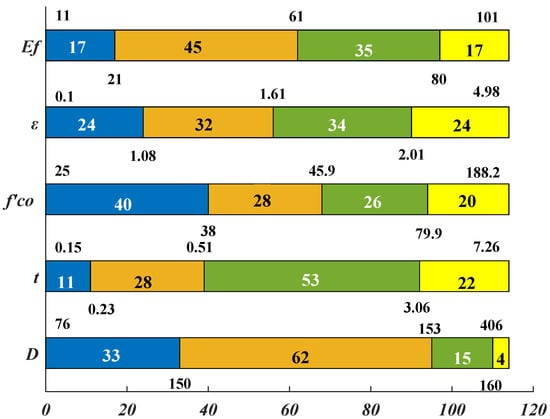
Figure 1.
Distributions of the parameters.
From Figure 1, it can be seen that the distributions of most parameters in the sample are not uniform. For example, the maximum distribution range of the diameters of the confined columns is 150–153 mm, with only 4 having a diameter over 160 mm. The maximum distribution of the FRP thickness is 0.51–3.06 mm, with only 11 having a thickness less than 0.23 mm. The concrete strength is mainly distributed in the range of 25–38 MPa, while the number of samples in the other ranges is not very different. The fracture strain of FRP is uniformly distributed in various intervals, and the elastic modulus of FRP is mainly distributed in 25–80 GPa.
3. Model Evaluation
3.1. Existing Models
See Table 2 for existing evaluation models. It contains seven models for predicting the compressive strength of the confinedcolumns from 1970 to date.

Table 2.
Existing evaluation models.
As seen from Table 2, except for the models by Mander and Ma, all the models are in the same form as Equation (1), with only the power exponent changing. Furthermore, the parameters considered in all models are the concrete strength and the transverse confining stress provided by the FRP, which in turn is related to the FRP thickness, the modulus of elasticity of the FRP, the FRP fracture strain, and the diameter of the column. Therefore, the parameters considered in this paper are feasible.
3.2. Model Evaluation
The models mentioned in ‘Table 1’ were evaluated using the mean value of the calculated values and the coefficient of variation, where the mean value can reflect the overall deviation of the calculated values from the experimental values to a certain extent. If the mean value is much greater than 1, it means that there is a risk that the calculated values overestimate the compressive strength, and if the mean value is much less than 1, it means that the calculated values are too conservative. The coefficient of variation is used to reflect the dispersion between the calculated values and the experimental values. The coefficient of variation is used to reflect the degree of dispersion between the calculated and tested values. The closer it is to zero, the less dispersion between the two data sets and the more accurate the model is. The formulas for calculating the mean and coefficient of variation are shown in Equations (2) and (3).
where Predicted indicates the calculated values of the proposed model, Experiment indicates the experimental values, SD indicates the standard deviation between the calculated values of the authors and the experimental values. xi indicates the calculated value, μ indicates the mean, and n indicates the number of samples.
A comparison of the calculated and experimental values for the models proposed by individual researchers is shown in Figure 2.
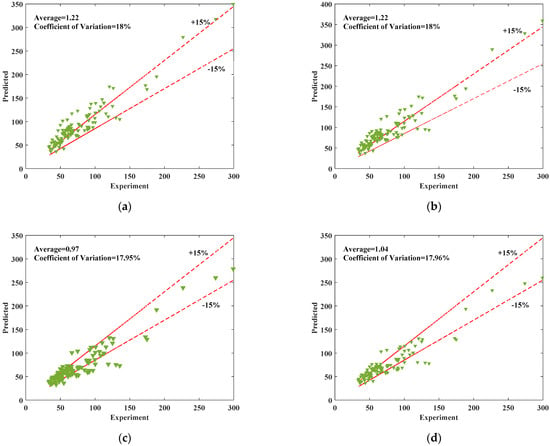
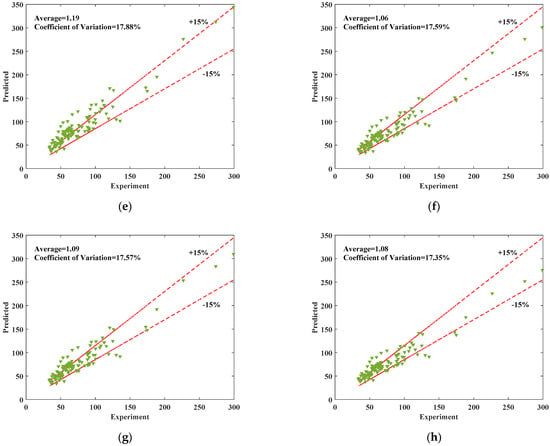
Figure 2.
Comparisons of the predicted and experimental results. (a) Newman [], (b) Mander [], (c) Karbhari [], (d) Samaan [], (e) Toutanji [], (f) Lam and Teng [], (g) Sadeghian and Fam [], (h) Ma and Liu [].
As can be obtained from Figure 2, with the statistical analysis of the data collected in this paper, the average value of the ratio of model predictions to test values for Newman, Mander and Toutanji were around 1.2, which suffers from an overestimation of the compressive strength of the confined columns. The coefficients of variation of all the researchers’ models were in the range of 17–18%, which is not a significant difference. Among them, the predicted values of Ma and Liu’s model basically fall within plus or minus 15% of the tested values, which has high accuracy.
4. Construction of the Data-Driven Model
As seen from Section 3, the coefficients of variation for the ratio of the calculated to experimental values based on the collected models are all around 18%. This section attempts to construct a compressive strength prediction model for FRP-confined columns using a data-driven machine learning approach to obtain a more accurate compressive strength prediction model.
4.1. Model Construction & Evaluation
The data−driven models used established machine learning models, both linear and non-linear, with linear models using linear regression and ridge regression and non-linear models using decision trees, random forests, and BP neural networks []. The data for the models were collected from the gathered experiments shown in Table 1, with 80% of the data used to train the models and 20% to test them. The input parameters to the model were the diameter of the column, concrete strength, FRP thickness, FRP fracture strain, and modulus of elasticity, and the output parameters were the compressive strength of the column after being confined. The performance of the model is measured by the goodness of fit and the percentage error, where the goodness of fit is calculated in Equation (4). The percentage error is calculated in Equation (5). The results of the goodness of fit and the percentage error of the machine learning models are shown in Figure 3 and Figure 4.
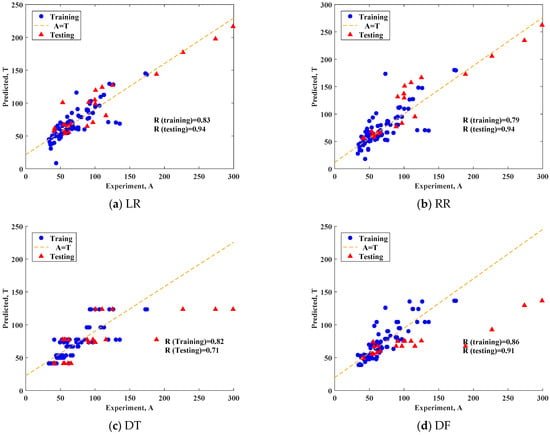
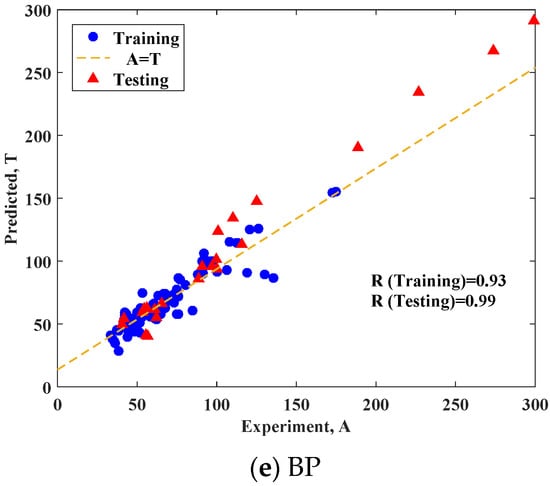
Figure 3.
Goodness of fit of the machine learning models.
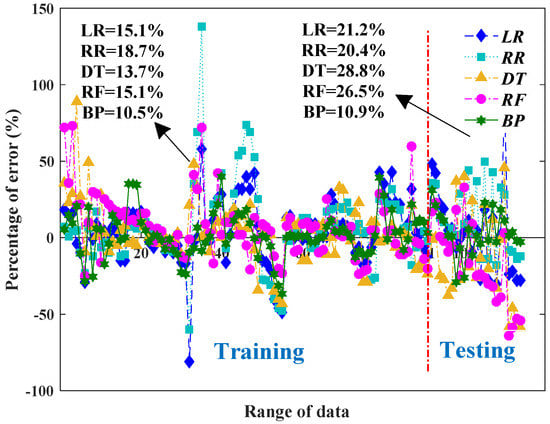
Figure 4.
Percentage error of the machine learning models.
From Figure 3, it can be seen that, among the machine learning models, the training set of ridge regression had the lowest goodness-of-fit of 0.79 and the training set of BP neural network had the highest goodness-of-fit of 0.93. The testing set of decision tree had the lowest goodness-of-fit of 0.71 and the testing set of BP neural network model had the highest goodness-of-fit of 0.99. In summary, only the BP neural network model performed better in both the training and testing sets. From Figure 4, the percentage errors between the training and testing sets of the LR and RR models were 6.2% and 1.7%, respectively. In contrast, the percentage errors between the training and testing sets of the decision tree and random forest models differed significantly, being 15.1% and 11.4%, respectively. In summary, the BP neural network model has the highest goodness of fit of the predicted values to the test values and the lowest percentage error of all the models. Therefore, it is the most suitable model for predicting the compressive strength of confined columns. Further, the BP neural network model was compared with the better existing model in Figure 5. It can be seen that, compared with the model of [], the average and coefficient of variation of the ratio of predicted to test values for the BP neural network model were lower, and most values were within plus or minus 15% of the test values.
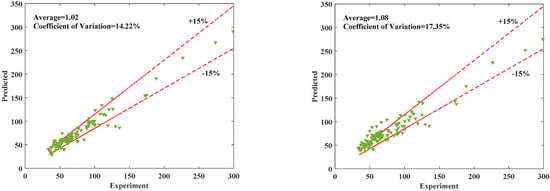
Figure 5.
Model performance of BP and [].
4.2. Parametric Study
4.2.1. Importance Analysis
This section performs the importance analysis of parameters to investigate the key parameters that affect the compressive strength of the confined columns. The importance of the parameters is determined by the inter−layer weights and thresholds of the BP neural network, where the transfer function between the input and implied layers is Equation (6) and between the implied and output layers is Equation (7). The inter-layer connection weights of the neural network are shown in Table 3.
where, , wij is the connection weight of the ith layer to the jth neuron, and φj is the bias at the jth neuron.

Table 3.
Inter-layer connection weights.
Table 3 shows the connection weights and biases between the neurons in the input layer, the hidden layer, and the output layer. The importance of individual parameters to the confined columns have been calculated and are shown in Figure 6.
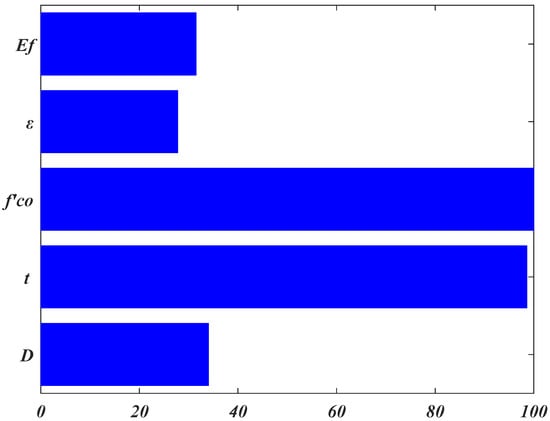
Figure 6.
Importance analysis.
From Figure 6, it can be seen that the concrete strength and the FRP thickness have a greater effect on the compressive strength of the confined columns, while the diameter of the column and the fracture strain and elastic modulus of FRP have a smaller effect on it.
4.2.2. Sensitivity Analysis
In this section, sensitivity analysis of the parameters is carried out to investigate the relationships between individual parameters and the compressive strength of the confined columns. The sensitivity analysis of the parameters is carried out using the BP neural network model. When studying the relationship between a variable and the compressive strength, let D be taken as 100, 150, 200, 250 (when studying D, t is taken as 0.15, 1.15, 2.15, and 3.15), keeping the values of the other parameters constant. Thus, the values of the parameters are taken as the average of 114 sets of data collected in Table 1 for individual parameters, respectively, with t = 1.64 mm, f′co = 50.3 MPa, εfrp = 1.52, and Ef = 45 GPa, and the relationships between individual parameters and the compressive strength of the confined column are shown in Figure 7.
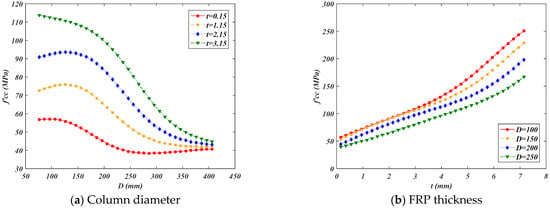
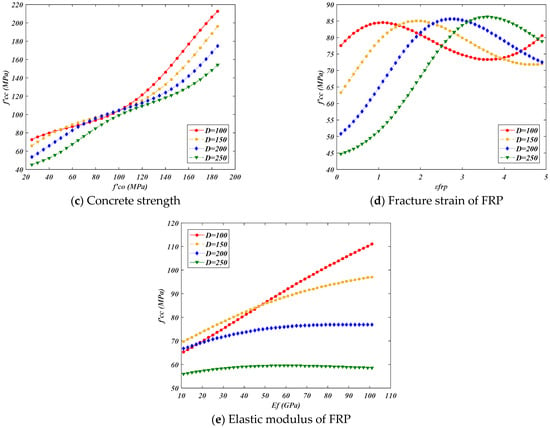
Figure 7.
Sensitivity analysis.
From Figure 7a, it can be seen that the compressive strength of the confined columns with different FRP thicknesses is inversely proportional to the diameter of the column and tends to plateau at different FRP thicknesses after the column diameter reaches 400 mm.
As can be seen in Figure 7b, the compressive strength of the restrained columns is proportional to the FRP thickness for different column diameters, and the increase in compressive strength of the confined column becomes apparent after the thickness of the FRP is greater than 5 mm.
It can be seen from Figure 7c that the compressive strength of the confined column is directly proportional to the concrete strength. For the concrete strengths less than 100 MPa, the compressive strength of the confined columns with larger diameters increased more than those with smaller diameters as the concrete strength increased. For the concrete strength greater than 100 MPa, the compressive strength of the confined columns at different diameters increased similarly as the concrete strength increased.
Figure 7d shows that when the column diameter is 100 mm, the compressive strength of the confined columns increases, then decreases, and then increases as the fracture strain of the FRP increases. When the column diameters are equal to 150, 200, and 250 mm, as the fracture strain of the FRP increases, and the compressive strength of the confined column increases and then decreases.
It can be seen from Figure 7e that the compressive strength of the confined column increases with the increase in the elastic modulus of the FRP for different diameters. In particular, the increase in the elastic modulus of FRP has a more prominent increase in compressive strength when the column diameter is equal to 100 mm, but as the column diameter becomes larger, the effect of the increase in the elastic modulus of FRP on the compressive strength is not apparent or even does not increase, which reflects that, to some extent, the influence of the column diameter on the compressive strength is much more significant than that of the elastic modulus of FRP.
5. Conclusions
This paper investigates the compressive strength of FRP-confined columns employing a data-driven machine learning algorithm and evaluates the models proposed by the authors qualitatively and quantitatively, leading to the following conclusions:
- The gathered models have contributed to the study of GFRP-confined columns. Still, the coefficients of variation of the models are all around 18% and suffer from over or conservative estimates of the compressive strength.
- The established BP neural network model showed better accuracy and stability in predicting the compressive strength of the confined columns compared to the gathered models. In addition, the model is adaptive, and its accuracy and stability will be further improved in the future as the dataset is expanded.
- The data collected in this paper is relatively minor and the traditional BP neural network is used for modelling, future data collection and model selection (e.g., deep learning) need to be increased to build a better model.
Author Contributions
Conceptualization, methodology, software, validation, Writing-original draft, Writing, H.L.; supervision, funding acquisition, writing, D.Y. and T.H. All authors have read and agreed to the published version of the manuscript.
Funding
This research received no external funding.
Data Availability Statement
Not applicable.
Conflicts of Interest
The authors declare no conflict of interest.
References
- Saadatmanesh, H.; Ehsani, M.R.; Li, M.W. Strength and ductility of concrete columns externally reinforced with fiber composite straps. Struct. J. 1994, 91, 434–447. [Google Scholar]
- Elsanadedy, H.M.; Al-Salloum, Y.A.; Abbas, H.; Alsayed, S.H. Prediction of strength parameters of FRP-confined concrete. Compos. Part B Eng. 2012, 43, 228–239. [Google Scholar] [CrossRef]
- Li, G.; Hu, T.; Bai, D. BP neural network improved by sparrow search algorithm in predicting debonding strain of FRP-strengthened RC beams. Adv. Civ. Eng. 2021, 2021, 1–13. [Google Scholar] [CrossRef]
- Valente, M.; Milani, G. Alternative retrofitting strategies to prevent the failure of an under-designed reinforced concrete frame. Eng. Fail. Anal. 2018, 89, 271–285. [Google Scholar] [CrossRef]
- Valente, M. Seismic upgrading strategies for non-ductile plan-wise irregular R/C structures. Procedia Eng. 2013, 54, 539–553. [Google Scholar] [CrossRef]
- Toutanji, H.; Balaguru, P. Durability characteristics of concrete columns wrapped with FRP tow sheets. J. Mater. Civ. Eng. 1998, 10, 52–57. [Google Scholar] [CrossRef]
- Lin, C.T.; Li, Y.F. An effective peak stress formula for concrete confined with carbon fiber reinforced plastics. Can. J. Civ. Eng. 2003, 30, 882–889. [Google Scholar] [CrossRef]
- Rochette, P.; Labossiere, P. Axial testing of rectangular column models confined with composites. J. Compos. Constr. 2000, 4, 129–136. [Google Scholar] [CrossRef]
- Xiao, Y.; Wu, H. Compressive behavior of concrete confined by carbon fiber composite jackets. J. Mater. Civ. Eng. 2000, 12, 139–146. [Google Scholar] [CrossRef]
- Shehata, I.A.; Carneiro, L.A.; Shehata, L.C. Strength of short concrete columns confined with CFRP sheets. Mater. Struct. 2002, 35, 50–58. [Google Scholar] [CrossRef]
- Fardis, M.N.; Khalili, H.H. FRP-encased concrete as a structural material. Mag. Concr. Res. 1982, 34, 191–202. [Google Scholar] [CrossRef]
- Newman, K.; Newman, J.B. Failure theories and design criteria for plain concrete. Struct. Solid Mech. Eng. Des. 1971, 963–995. [Google Scholar]
- Mander, J.B.; Priestley, M.J.; Park, R. Theoretical stress-strain model for confined concrete. J. Struct. Eng. 1988, 114, 1804–1826. [Google Scholar] [CrossRef]
- Karbhari, V.M.; Gao, Y. Composite jacketed concrete under uniaxial compression—Verification of simple design equations. J. Mater. Civ. Eng. 1997, 9, 185–193. [Google Scholar] [CrossRef]
- Samaan, M.; Mirmiran, A.; Shahawy, M. Model of concrete confined by fiber composites. J. Struct. Eng. 1998, 124, 1025–1031. [Google Scholar] [CrossRef]
- Lam, L.; Teng, J.G. Design-oriented stress–strain model for FRP-confined concrete. Constr. Build. Mater. 2003, 17, 471–489. [Google Scholar] [CrossRef]
- Sadeghian, P.; Fam, A. Improved design-oriented confinement models for FRP-wrapped concrete cylinders based on statistical analyses. Eng. Struct. 2015, 87, 162–182. [Google Scholar] [CrossRef]
- Ma, G.; Liu, K. Prediction of compressive strength of CFRP-confined concrete columns based on BP neural network. J. Hunan Univ. 2021, 48, 88–97. [Google Scholar]
- ACI 440.2R-08; Guide for the Design and Construction of Externally Bonded FRP Systems for Strengthening Concrete Structures. American Concrete Institute: Farmington, MI, USA, 2008.
- Wakjira, T.G.; Ibrahim, M.; Ebead, U.; Alam, M.S. Explainable machine learning model and reliability analysis for flexural capacity prediction of RC beams strengthened in flexure with FRCM. Eng. Struct. 2022, 255, 113903. [Google Scholar] [CrossRef]
- Fu, B.; Feng, D.C. A machine learning-based time-dependent shear strength model for corroded reinforced concrete beams. J. Build. Eng. 2021, 36, 102118. [Google Scholar] [CrossRef]
- Xu, J.G.; Chen, S.Z.; Xu, W.J.; Shen, Z.S. Concrete-to-concrete interface shear strength prediction based on explainable extreme gradient boosting approach. Constr. Build. Mater. 2021, 308, 125088. [Google Scholar] [CrossRef]
- Naderpour, H.; Mirrashid, M.; Parsa, P. Failure mode prediction of reinforced concrete columns using machine learning methods. Eng. Struct. 2021, 248, 113263. [Google Scholar] [CrossRef]
- Zhang, F.; Wang, C.; Liu, J.; Zou, X.; Sneed, L.H.; Bao, Y.; Wang, L. Prediction of FRP-concrete interfacial bond strength based on machine learning. Eng. Struct. 2023, 274, 115156. [Google Scholar] [CrossRef]
- Vu, Q.V.; Truong, V.H.; Thai, H.T. Machine learning-based prediction of CFST columns using gradient tree boosting algorithm. Compos. Struct. 2021, 259, 113505. [Google Scholar] [CrossRef]
- Hu, T.; Zhang, H.; Zhou, J. Prediction of the debonding failure of beams strengthened with FRP through machine learning models. Buildings 2023, 13, 608. [Google Scholar] [CrossRef]
- Nguyen, H.; Vu, T.; Vo, T.P.; Thai, H.T. Efficient machine learning models for prediction of concrete strengths. Constr. Build. Mater. 2021, 266, 120950. [Google Scholar] [CrossRef]
- Huang, L.; Chen, J.; Tan, X. BP-ANN based bond strength prediction for FRP reinforced concrete at high temperature. Eng. Struct. 2022, 257, 114026. [Google Scholar] [CrossRef]
- Kshirsagar, S.; Lopez-Anido, R.A.; Gupta, R.K. Environmental aging of fiber-reinforced polymer-wrapped concrete cylinders. Mater. J. 2000, 97, 703–712. [Google Scholar]
- Aire, C.; Gettu, R.; Casas, J.R. Study of the compressive behavior of concrete confined by fiber reinforced composites. Carbon 2001, 1, 239–243. [Google Scholar]
- Micelli, F.; Myers, J.J.; Murthy, S. Effect of environmental cycles on concrete cylinders confined with FRP. In Proceedings of the CCC2001 International Conference on Composites in Construction, Porto, Portugal, 10–12 October 2001. [Google Scholar]
- Pessiki, S.; Harries, K.A.; Kestner, J.; Sause, R.; Ricles, J.M. The axial behavior of concrete confined with fiber reinforced composite jackets. J. Compos. Constr. 2001, 5, 237–245. [Google Scholar] [CrossRef]
- Toutanji, H. Stress-strain characteristics of concrete columns externally confined with advanced fiber composite sheets. Mater. J. 1999, 96, 397–404. [Google Scholar]
- Lam, L.; Teng, J.G. Ultimate condition of fiber reinforced polymer-confined concrete. J. Compos. Constr. 2004, 8, 539–548. [Google Scholar] [CrossRef]
- Silva, M.A.; Rodrigues, C.C. Size and relative stiffness effects on compressive failure of concrete columns wrapped with glass FRP. J. Mater. Civ. Eng. 2006, 18, 334–342. [Google Scholar] [CrossRef]
- Berthet, J.F.; Ferrier, E.; Hamelin, P. Compressive behavior of concrete externally confined by composite jackets. Part A: Experimental study. Constr. Build. Mater. 2005, 19, 223–232. [Google Scholar] [CrossRef]
- Youssef, M.N.; Feng, M.Q.; Mosallam, A.S. Stress–strain model for concrete confined by FRP composites. Compos. Part B Eng. 2007, 38, 614–628. [Google Scholar] [CrossRef]
- Harries, K.A.; Kharel, G. Behavior of variably confined concrete. ACI Mater. J. 2002, 99, 180–189. [Google Scholar]
- Kharel, G. Behavior and Modeling of Variably Confined Concrete. Ph.D. Thesis, University of South Carolina, Columbia, SC, USA, 2001. [Google Scholar]
- Bullo, S. Experimental study of the effects of the ultimate strain of fiber reinforced plastic jackets on the behavior of confined concrete. In Proceedings of the International Conference Composites in Construction, Cosenza, Italy, 16–19 September 2003; pp. 16–19. [Google Scholar]
- Cui, C.; Sheikh, S.A. Experimental study of normal-and high-strength concrete confined with fiber-reinforced polymers. J. Compos. Constr. 2010, 14, 553–561. [Google Scholar] [CrossRef]
- Demers, M.; Neale, K.W. Strengthening of concrete columns with unidirectional composite sheets. Dev. Short Medium Span Bridge Eng. 1994, 895–905. [Google Scholar]
- Jiang, T.; Teng, J.G. Analysis-oriented models for FRP-confined concrete: A comparative assessment. Eng. Struct. 2007, 29, 2968–2986. [Google Scholar] [CrossRef]
- Mastrapa, J.C. The Effect of Construction Bond on Confinement with FRP Composites. Master’s Thesis, University of Central Florida, Orlando, FL, USA, 1997. [Google Scholar]
- Teng, J.G.; Yu, T.; Wong, Y.L.; Dong, S.L. Hybrid FRP–concrete–steel tubular columns: Concept and behavior. Constr. Build. Mater. 2007, 21, 846–854. [Google Scholar] [CrossRef]
- Almusallam, T.H. Behavior of normal and high-strength concrete cylinders confined with E-glass/epoxy composite laminates. Compos. Part B Eng. 2007, 38, 629–639. [Google Scholar] [CrossRef]
- Micelli, F.; Modarelli, R. Experimental and analytical study on properties affecting the behaviour of FRP-confined concrete. Compos. Part B Eng. 2013, 45, 1420–1431. [Google Scholar] [CrossRef]
- Zohrevand, P.; Mirmiran, A. Behavior of ultrahigh-performance concrete confined by fiber-reinforced polymers. J. Mater. Civ. Eng. 2011, 23, 1727–1734. [Google Scholar] [CrossRef]
- Hu, T.; Li, G. Machine Learning-based model in predicting the plate-end debonding of FRP-strengthened RC beams in flexure. Adv. Civ. Eng. 2022, 2022. [Google Scholar] [CrossRef]
Disclaimer/Publisher’s Note: The statements, opinions and data contained in all publications are solely those of the individual author(s) and contributor(s) and not of MDPI and/or the editor(s). MDPI and/or the editor(s) disclaim responsibility for any injury to people or property resulting from any ideas, methods, instructions or products referred to in the content. |
© 2023 by the authors. Licensee MDPI, Basel, Switzerland. This article is an open access article distributed under the terms and conditions of the Creative Commons Attribution (CC BY) license (https://creativecommons.org/licenses/by/4.0/).