Article

Mechanical Behavior of Crimping Composite Post Insulator: Experimental and Simulation Study

1
State Key Laboratory of Simulation and Regulation of Water Cycle in River Basin, China Institute of Water Resources and Hydropower Research, Beijing 100044, China
2
Xuji Electric Co., Ltd., Xuchang 461000, China
*
Author to whom correspondence should be addressed.
Buildings 2023, 13(5), 1275; https://doi.org/10.3390/buildings13051275
Submission received: 18 April 2023 / Revised: 5 May 2023 / Accepted: 11 May 2023 / Published: 13 May 2023
(This article belongs to the Section Building Structures)

Abstract

:
The composite post insulator composed of a large diameter mandrel and flange pressed by a one-time integral pultrusion has high strength and good toughness and is widely used in the existing flexible converter valve. For constructing the finite element model of the crimped post insulator, most of the flange surface and the mandrel surface are directly connected, making the simulation model’s stiffness deviate from the actual model and the model distortion. Based on this, this study proposes a new finite element simplified model of crimped composite post insulator based on multi-point constraints (MPC), which accurately simulates the crimping area of mandrel and flange in engineering practice. It verifies the model’s reliability through static tests and characteristic vibration tests. The results show that the difference between the finite element simulation and the test results is within 5%. The finite element modeling method based on MPC local constraints is very reliable in applying crimped composite post insulators. Based on the proposed model, the influence of flange height and thickness on the mechanical properties of composite post insulators is further explored. The results show that the influence of flange height on mechanical properties can be ignored when the height of the insulator stiffener (non-press common area) is constant. Within the allowable thickness range of the flange crimping process, the increase in flange thickness will significantly reduce the maximum bending stress of the insulator and increase its safety margin. It provides a good design idea for the design of crimping composite insulators.

1. Introduction

Seismic damage data of power systems worldwide shows that earthquakes easily damage all high-voltage electrical equipment in substations [1,2,3,4]. Due to the obvious comprehensive advantages of composite materials, such as strong impact resistance, good fracture toughness and anti-burst performance, and large self-damping and earthquake resistance, composite pillar insulators have been used in the substation and converter stations since 2000 [5,6,7]. However, the research on the mechanical mechanics, dynamic characteristics, and seismic capacity evaluation of composite electrical equipment worldwide still needs to be stronger. With the rapid development of the ultra-high-voltage (UHV) direct current (DC) transmission grid in recent years, most of the equipment in the converter station is supported by pillar insulators, which not only provide electrical insulation for electrical equipment but also serve as structural support. In addition to the mechanical stress, it also bears complex electrical stress, so the reliability of the pillar insulator plays a crucial role in the stable operation of the substation’s electrical equipment [8,9]. At present, pillar insulators are widely used in substations, converter stations, or power distribution devices as the fixing and insulating support components of high-voltage busbars, such as flexible DC converter valves, busbar pillars, isolation switches, smoothing reactors, and other occasions [10,11].
At the beginning of the 21st century, large-diameter composite post insulator mainly adopts hollow composite material [10,12,13]. A.M. Reinhorn conducted mechanical performance tests on hollow composite post insulators and pointed out the main structural failure modes of post composite insulators in 2009 [14,15]. Rao Hong studied the ±800 kV DC post composite insulators with a small diameter mandrel as the base shaft, which was wound and cured into a large-diameter mandrel, and a high-temperature vulcanized silicone rubber adhered to the periphery of the mandrel [16]. The end flanges bonded with adhesive and the mandrel with sealing measures. Composite post insulators are mainly subjected to bending, torsion, and mechanical compression loads [17]. Based on this, He Faliang studied the assembly and connection of end flange fittings and large-diameter cores by crimping process, which solved the problem of excessive offset value caused by existing glued post composite insulators under bending load [18]. The crimping process’s characteristics are that the mandrel’s outer diameter and the flange’s inner diameter adopt a sliding fit size. In the production process of insulators, use a six-claw or eight-claw automatic hydraulic crimping machine on the outer diameter of the flange with uniform pressure so that the flange is firmly crimped on the mandrel to complete crimping. In recent years, the mandrel process of a single-piece pultrusion with large diameters below 220 mm has become increasingly mature and replaced hollow composite post insulators in batches. It is widely used in flexible DC projects. Compared with hollow composite post insulators, the insulator by once moulding has simpler processing technology, and the process reliability of the product is greatly improved. Therefore, the process of large diameter mandrel and flange integral crimping by once moulding will be the main development direction of composite post insulators [19,20].
The flexible DC converter valve comprises hundreds of insulators to form a structural frame, and the valve components equipped with power components are stacked in horizontal and vertical directions [2]. The converter valve is the core of electric equipment, and its structure size and weight are large, especially the flexible converter valve, which weighs nearly one hundred tons; the reliability analysis of the converter valve support structure is of great significance. At present, the seismic analysis of the converter valve is mainly carried out utilizing finite element simulation analysis. As the most important structural support component of the flexible DC converter valve, the accuracy of the finite element model of the composite post insulator will have a crucial impact on the overall structural characteristics of the flexible DC converter valve [21]. The composite post insulator is the most important structural support component of the flexible DC converter valve, and the accuracy of its finite element model will have a crucial impact on the overall structural characteristics of the flexible DC converter valve.
Currently, most simulation studies on post insulators as supporting components focus on glue-mounted post insulators [22,23], while the simulation analysis of crimped composite post insulators still needs to be improved. Furthermore, the researchers usually directly connect the flange surface with the mandrel surface by the rigid constraint in the seismic simulation analysis of engineering structures [24,25]. They usually ignore the lateral stiffness of the insulator connection section, which leads to a deviation between the simulation model and the actual situation.
To solve the distortion problem of the crimped composite post insulator model, this paper proposes a new simulation model method for constructing crimped composite insulators. This paper uses the multi-point constraints (MPC) local constraint method to simulate the crimping area of the insulator rod and flange. In Section 2, the accuracy and reliability of the modeling method are demonstrated by comparing the mechanical performance experiment with the simulation analysis results, which provides a solution for the accurate modeling of the structure in the flexible DC converter valve. Furthermore, according to this modeling method, the height and thickness parameters of the flange are designed and optimized in Section 3. Specifically, the influence of flange height and thickness parameters on the mechanical properties is explored, providing essential data for the processing and production of crimped composite insulators.

2. Materials and Methods

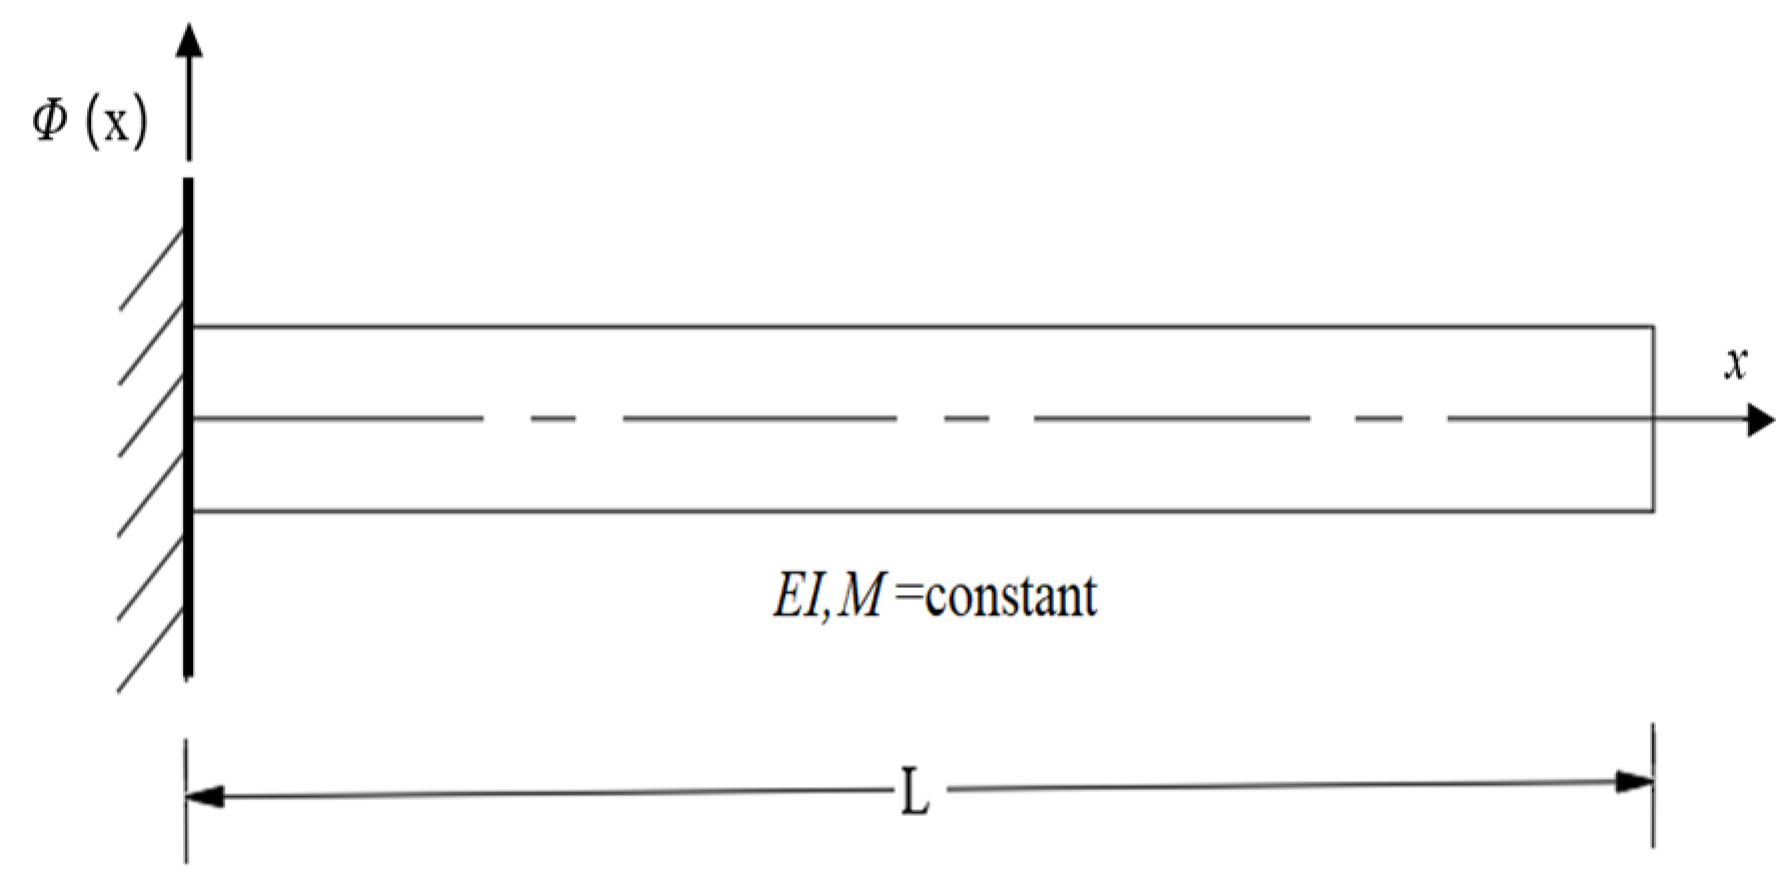
2.1. Simplified Mechanical Model

Currently, the flexible DC converter valve is mainly supported on the valve hall ground by composite post insulators [26]. Each layer of the converter valve is vertically supported by a composite post insulator to form the main structural support frame, thereby realizing the flexible converter valve’s structural support and electrical insulation. Figure 1 shows a project flexible DC converter valve. The composite post insulator mainly comprises a flange, core rod, and silicone rubber shed. In this paper, composite post insulators supported at the bottom of a flexible converter valve are selected as the research object, and their dimensions are shown in Figure 2.
The insulator length is 2750 mm and the rod diameter is 183 mm. The mandrel is made of reinforced glass fiber epoxy resin by integral pultrusion. The flange is made of cast steel. The crimping process fixes the flange and mandrel. Table 1 shows the main material parameters of composite post insulators.
Because the silicone rubber sheds coated on the outer side of the composite post insulator play an electrical insulation role [12], the influence on the structural strength can be ignored entirely. Therefore, the mechanical performance analysis of this paper does not consider the silicone rubber umbrella skirt.
According to the stress analysis and structural characteristics of composite post insulator, the deflection of the insulator is far less than its length. In other words, when the bending radius is much larger than the height of the insulator, the bending deformation is dominant, so the mechanical model of the insulator can be equivalent to the Euler–Bernoulli beam theory [13]. The free vibration equation of an insulator is:
M 2 u t 2 + 2 x 2 [ E I 2 u x 2 ] = 0
In Formula (1), EI is bending stiffness and M is bending moment. Solve Equation (1) by the method of separating variables, assuming that the form of the solution is:
u ( x , t ) = ϕ ( x ) q ( t )
In (2), ϕ(x) represents the shape of the vibration, which does not change with time. q(t) represents the amplitude changing with time. Substitute (2) into (1), and we can obtain
ϕ ( x ) ω 2 M E I ϕ ( x ) = 0
In Formula (3), ω is the angular velocity. One end of the insulator is fixed, and the other is free. It can be equivalent to a cantilever beam, as shown in Figure 3.
The boundary conditions are: At x = 0, its displacement and rotation angle are zero, that is φ(0) = 0, φ(0) = 0. At x = L, its bending moment and shear force are zero, that is φ(L) = 0, φ(L) = 0. The above can be solved.
ω 1 = 3.516 E I M L 4
ω 2 = 22.03 E I M L 4
For single composite post insulator, L = 2.75 m, E = 4.55∙1010 Pa, M = 87.45 kg/m, I = 5.505∙10−5 m4. Bringing it into (4) and (5), we can obtain ω1 = 78.68 rad/s, ω2 = 493.1 rad/s. The corresponding first two natural frequencies are f1 = 12.5 Hz and f2 = 78.5 Hz. Two insulators are connected in series along the vertical direction. From (4) and (5), the first two natural frequencies are 3.2 Hz and 20 Hz.

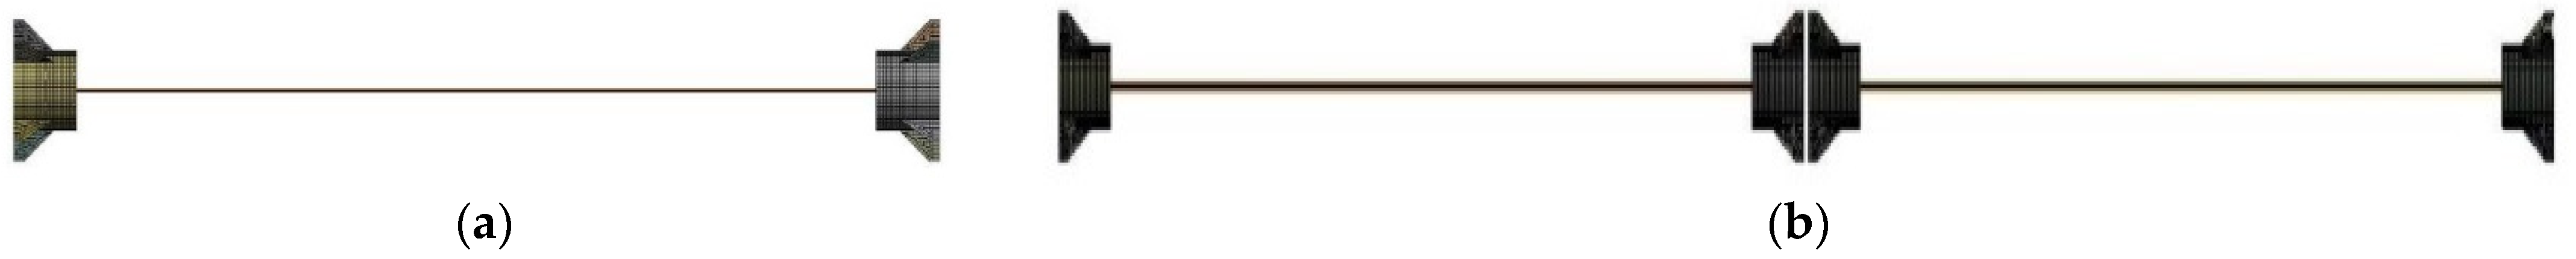
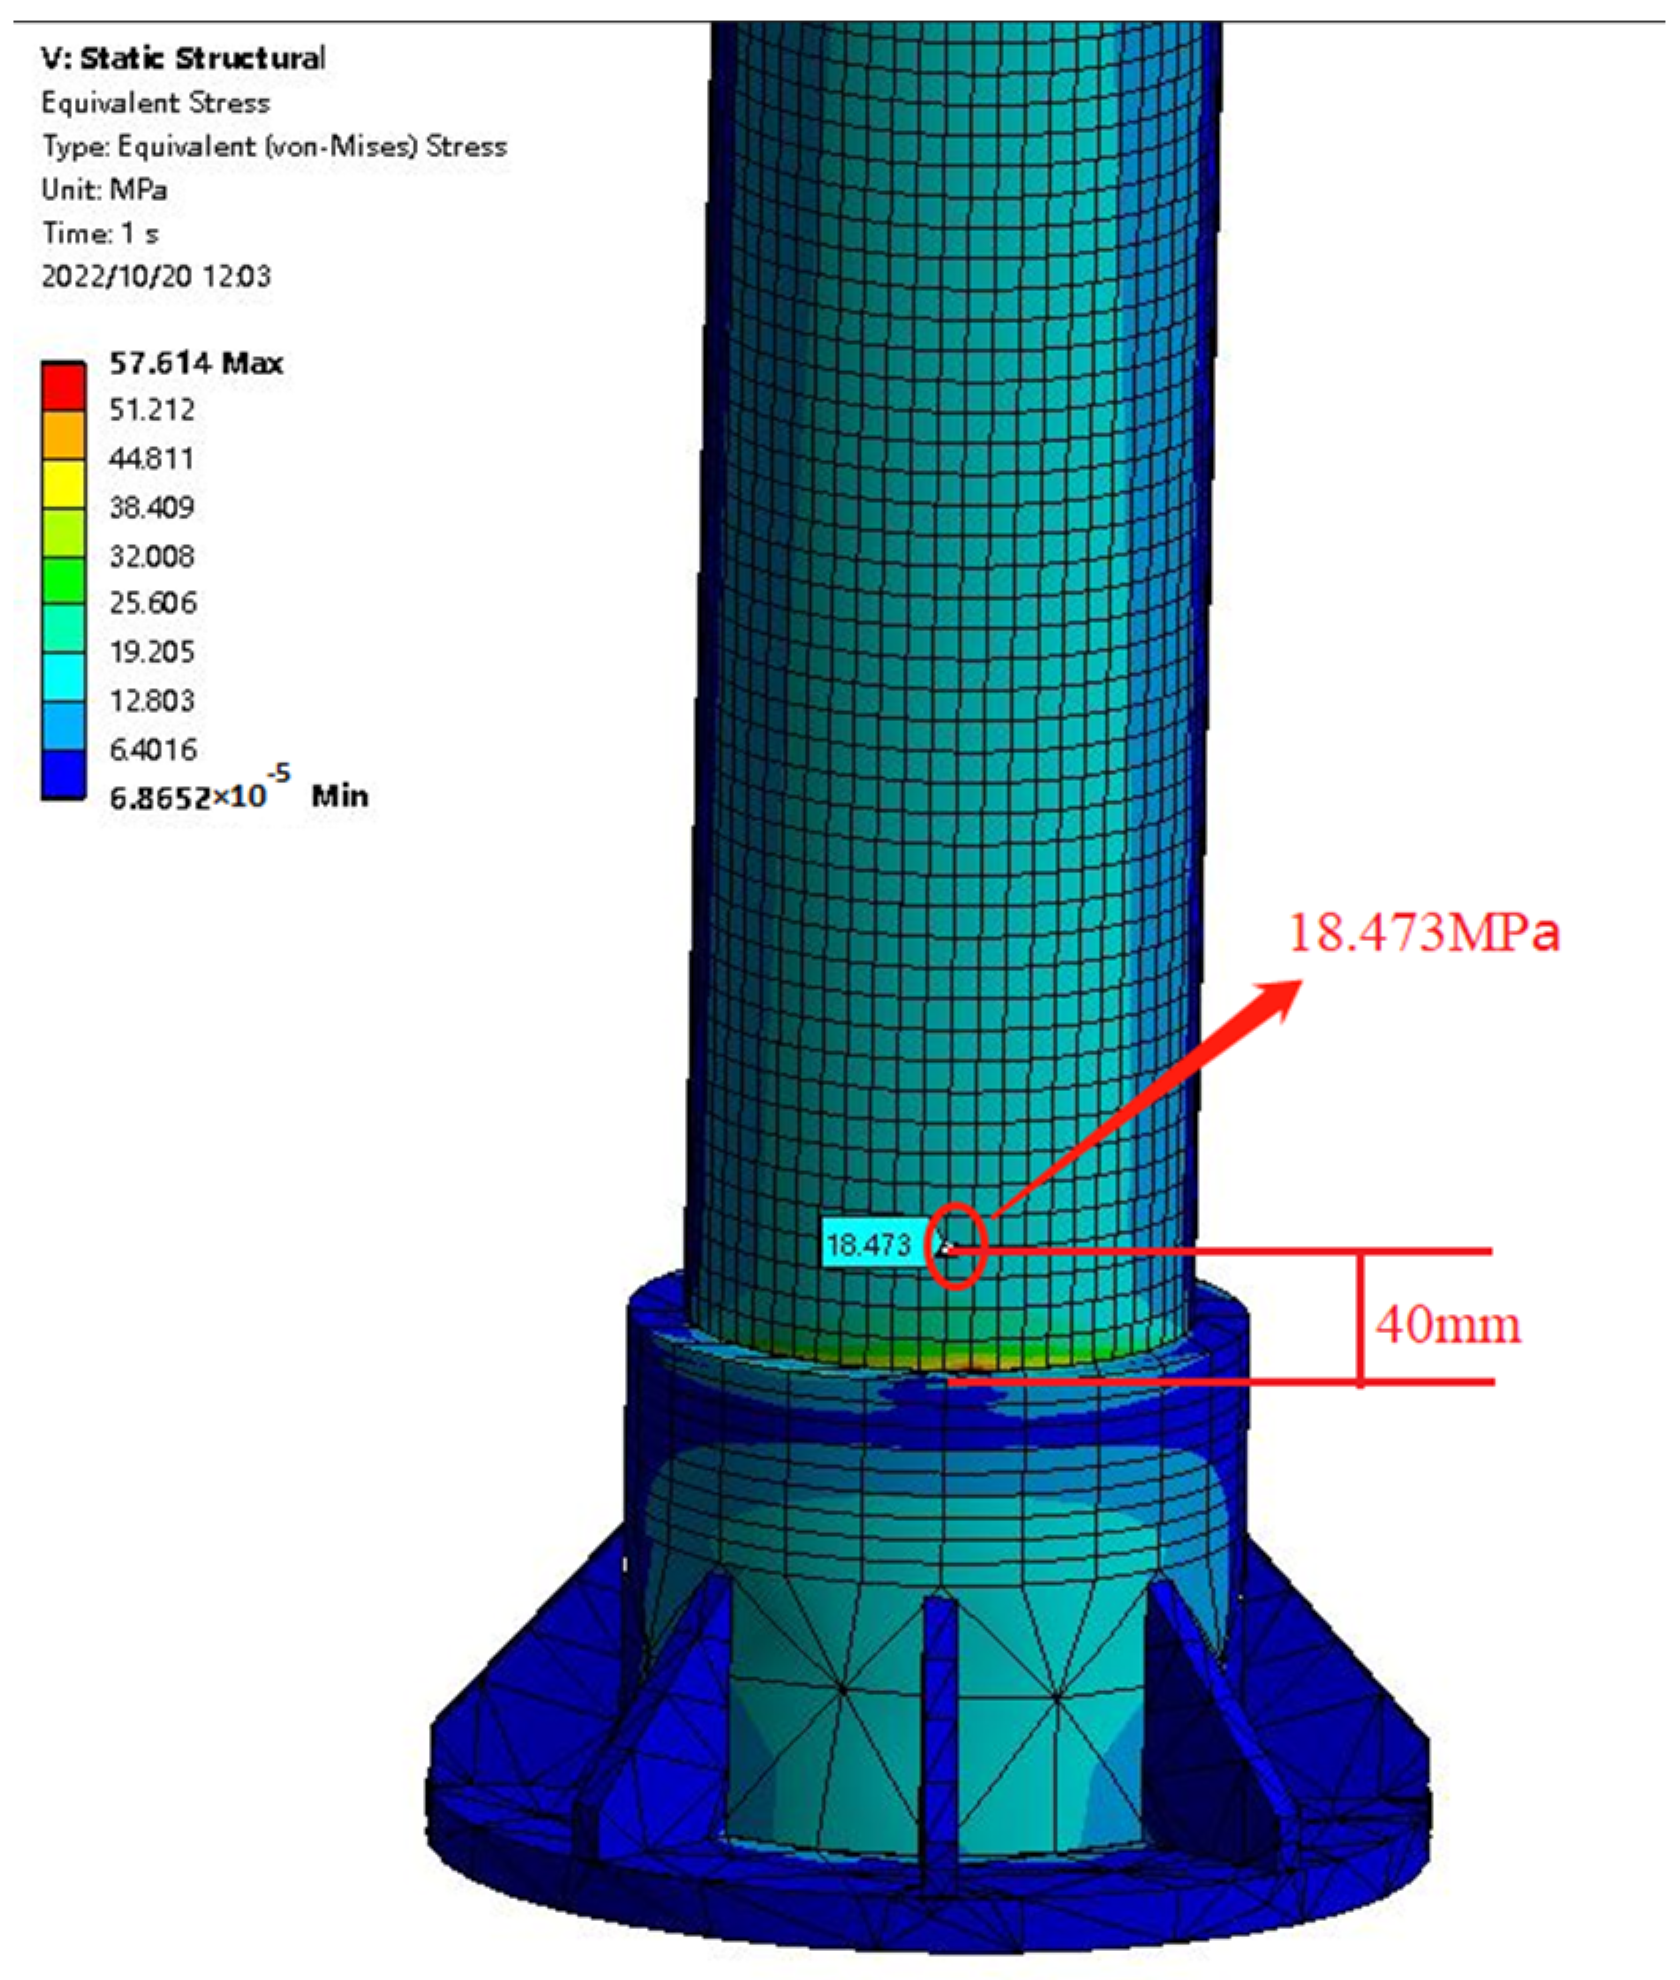
2.2. Finite Element Model

In this chapter, the finite element analysis software ANSYS is used for the numerical analysis of single and two composite post insulators. Specifically, extracting the center surface of the flange, the surface unit is used to replace the body unit in the solid flange model. Extracting the center line of the rod, the line unit replaces the body unit in the solid rod model. The simplified insulator model is shown in Figure 4.
According to the flange crimping process, the position of the flange stiffener is the non-pressing part. The upper part of the flange stiffener is the critical part, as shown in Figure 5. To simulate the contact between the mandrel and the flange crimping part more accurately, the contact pair between the mandrel and the flange inner wall is defined. The inner wall of the flange is used as the target surface, and the surface of the mandrel is used as the contact surface. The MPC local constraint method is used to constrain the multi-point of the crimping section, while the non-pressed parts take free contact, as shown in Figure 6. Specifically, the degree of freedom (DF) of the mandrel centerline is different from that of the inner wall of the flange. The local constraint of MPC is to take a certain DF of a node of the mandrel centerline as the expected value and then make the DF of the specified node of the flange establish a constraint relationship with the common value to realize the coupling of DF, further coupling all points on the mandrel centerline [28]. The specific formula is:
u i + j = 1 n C j u j = C 0 ( i j )
In the formula, ui is the secondary DF, uj is the primary DF, Cj is the weight coefficient, C0 is the constant term, i is the DF of the secondary node, and j is the degree of freedom of the primary node. Flange and rod model adapt 5 mm size, hexahedral mesh for meshing.
As shown in Table 2, the first-order natural frequencies of a single insulator and two insulator strings under two working conditions are similar. The difference is mainly concentrated in the second-order natural frequency. Compared with the theoretical calculation and simulation analysis, the second-order natural frequency obtained by the theoretical calculation is smaller than the simulation analysis. This is because the flange structure is ignored in the theoretical calculation process, and the insulator is directly simplified to the cantilever beam structure, which leads to the structural stiffness being smaller than the simulation calculation. So, the second-order natural frequency of the single insulator is smaller than the simulation calculation. When two insulators are connected in series, the second-order natural frequency of the simulation is smaller than the theoretical calculation. The main reason is that the simulation uses the binding transfer between the two insulators when dealing with the insulator string connection, which makes the overall stiffness smaller than the theoretical calculation. Furthermore, the model construction method is more realistic.

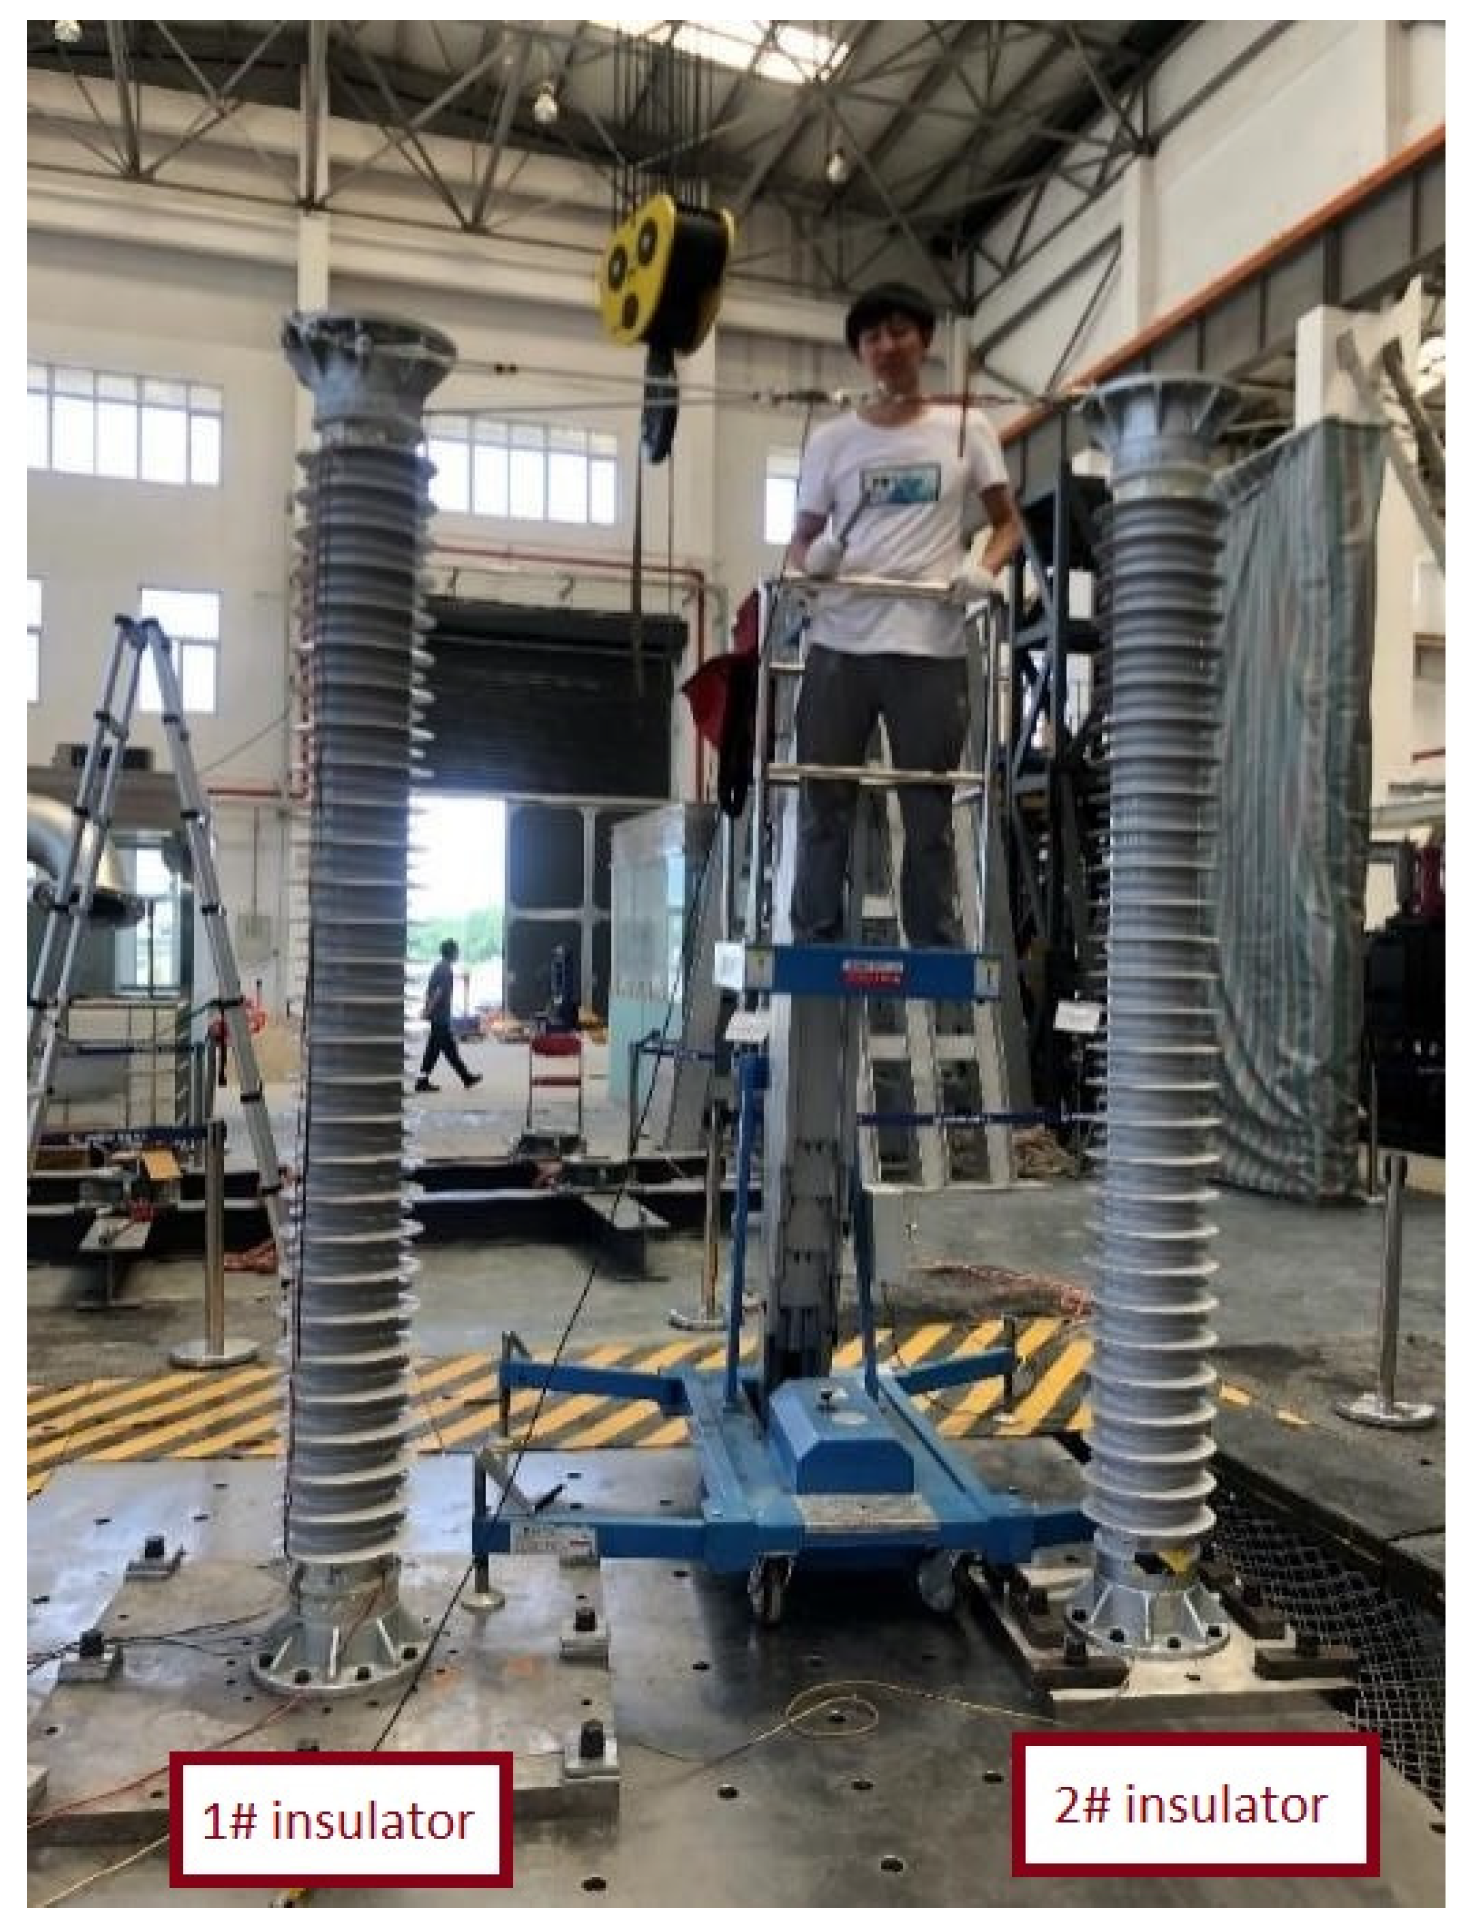
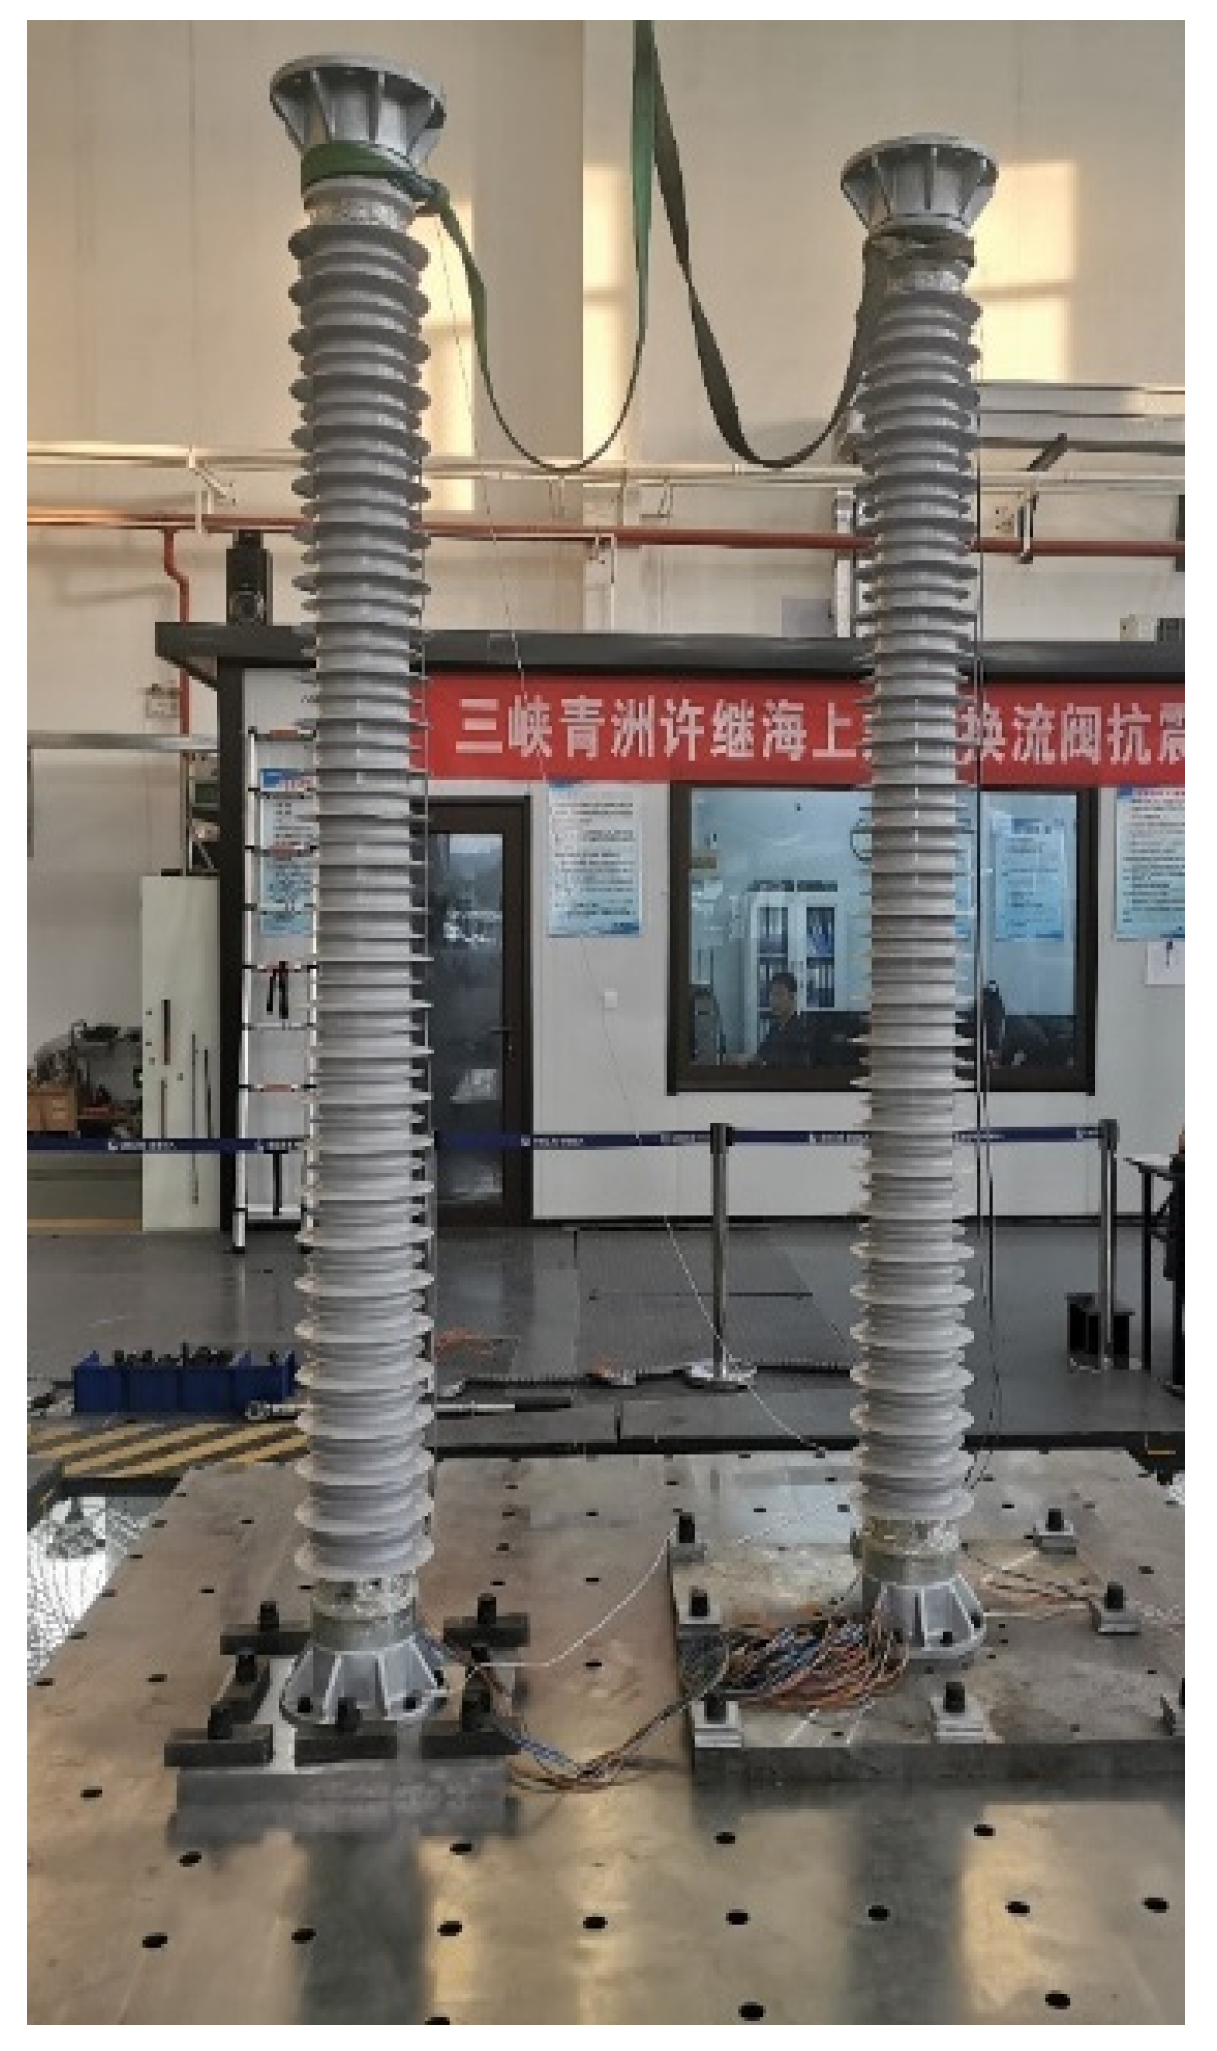
2.3. Experimental Verification of Statics

To verify the accuracy of the finite element model, this paper carried out a single insulator static tensile test. As shown in Figure 7, the 1# and 2# single insulators are installed on the 25 mm thick steel plate and fixed on the shaking table. The opposite horizontal tension is applied to the top flange of the two insulators, increasing from 0.5 kN to 4.5 kN in turn.
Tensile force sensors are used to control the pull force. There are five channels in the test, as shown in Table 3. The experiment was repeated four times. Strain measuring points are arranged on two sides of the core rod. As shown in Figure 8, the strain measuring points are about 40 mm from the top of the flange. The microstrain of the insulator core under different tension is measured. The elastic modulus of the insulator core and the stress at the corresponding measuring position can be obtained by data processing.
Table 4 shows the measured elastic modulus and Poisson’s ratio of 1# and 2# insulator cores. The average elastic modulus of 1# insulator rod is 47.278 GPa, and Poisson’s ratio is 0.210. The average elastic modulus of 2# insulator rod is 45.462 GPa, and Poisson’s ratio is 0.212. The difference in elastic modulus and Poisson’s ratio between the two insulator rods is less than 4%, so the consistency is good.
In order to further explore the mechanical gap between two insulator rods, Figure 9 shows the stress–train curves of two insulators under horizontal tension from 0.5 kN to 4.5 kN. The stress–strain curves of the two insulator cores are in good agreement, so their static properties are similar.
Based on the above experimental conclusions, the finite element model constructed in Section 2.2 is further fitted. Figure 10 shows the stress distribution diagram of the insulator under the horizontal tension of 4.5 kN. Figure 11 is the stress–strain curve comparison diagram of the insulator core rod root under horizontal tension from 0.5 kN to 4.5 kN. The stress monitoring point of the simulation group is consistent with the static test, that is, 40 mm from the top of the flange. The experimental and simulation results are very close, and the error range is within 5%.

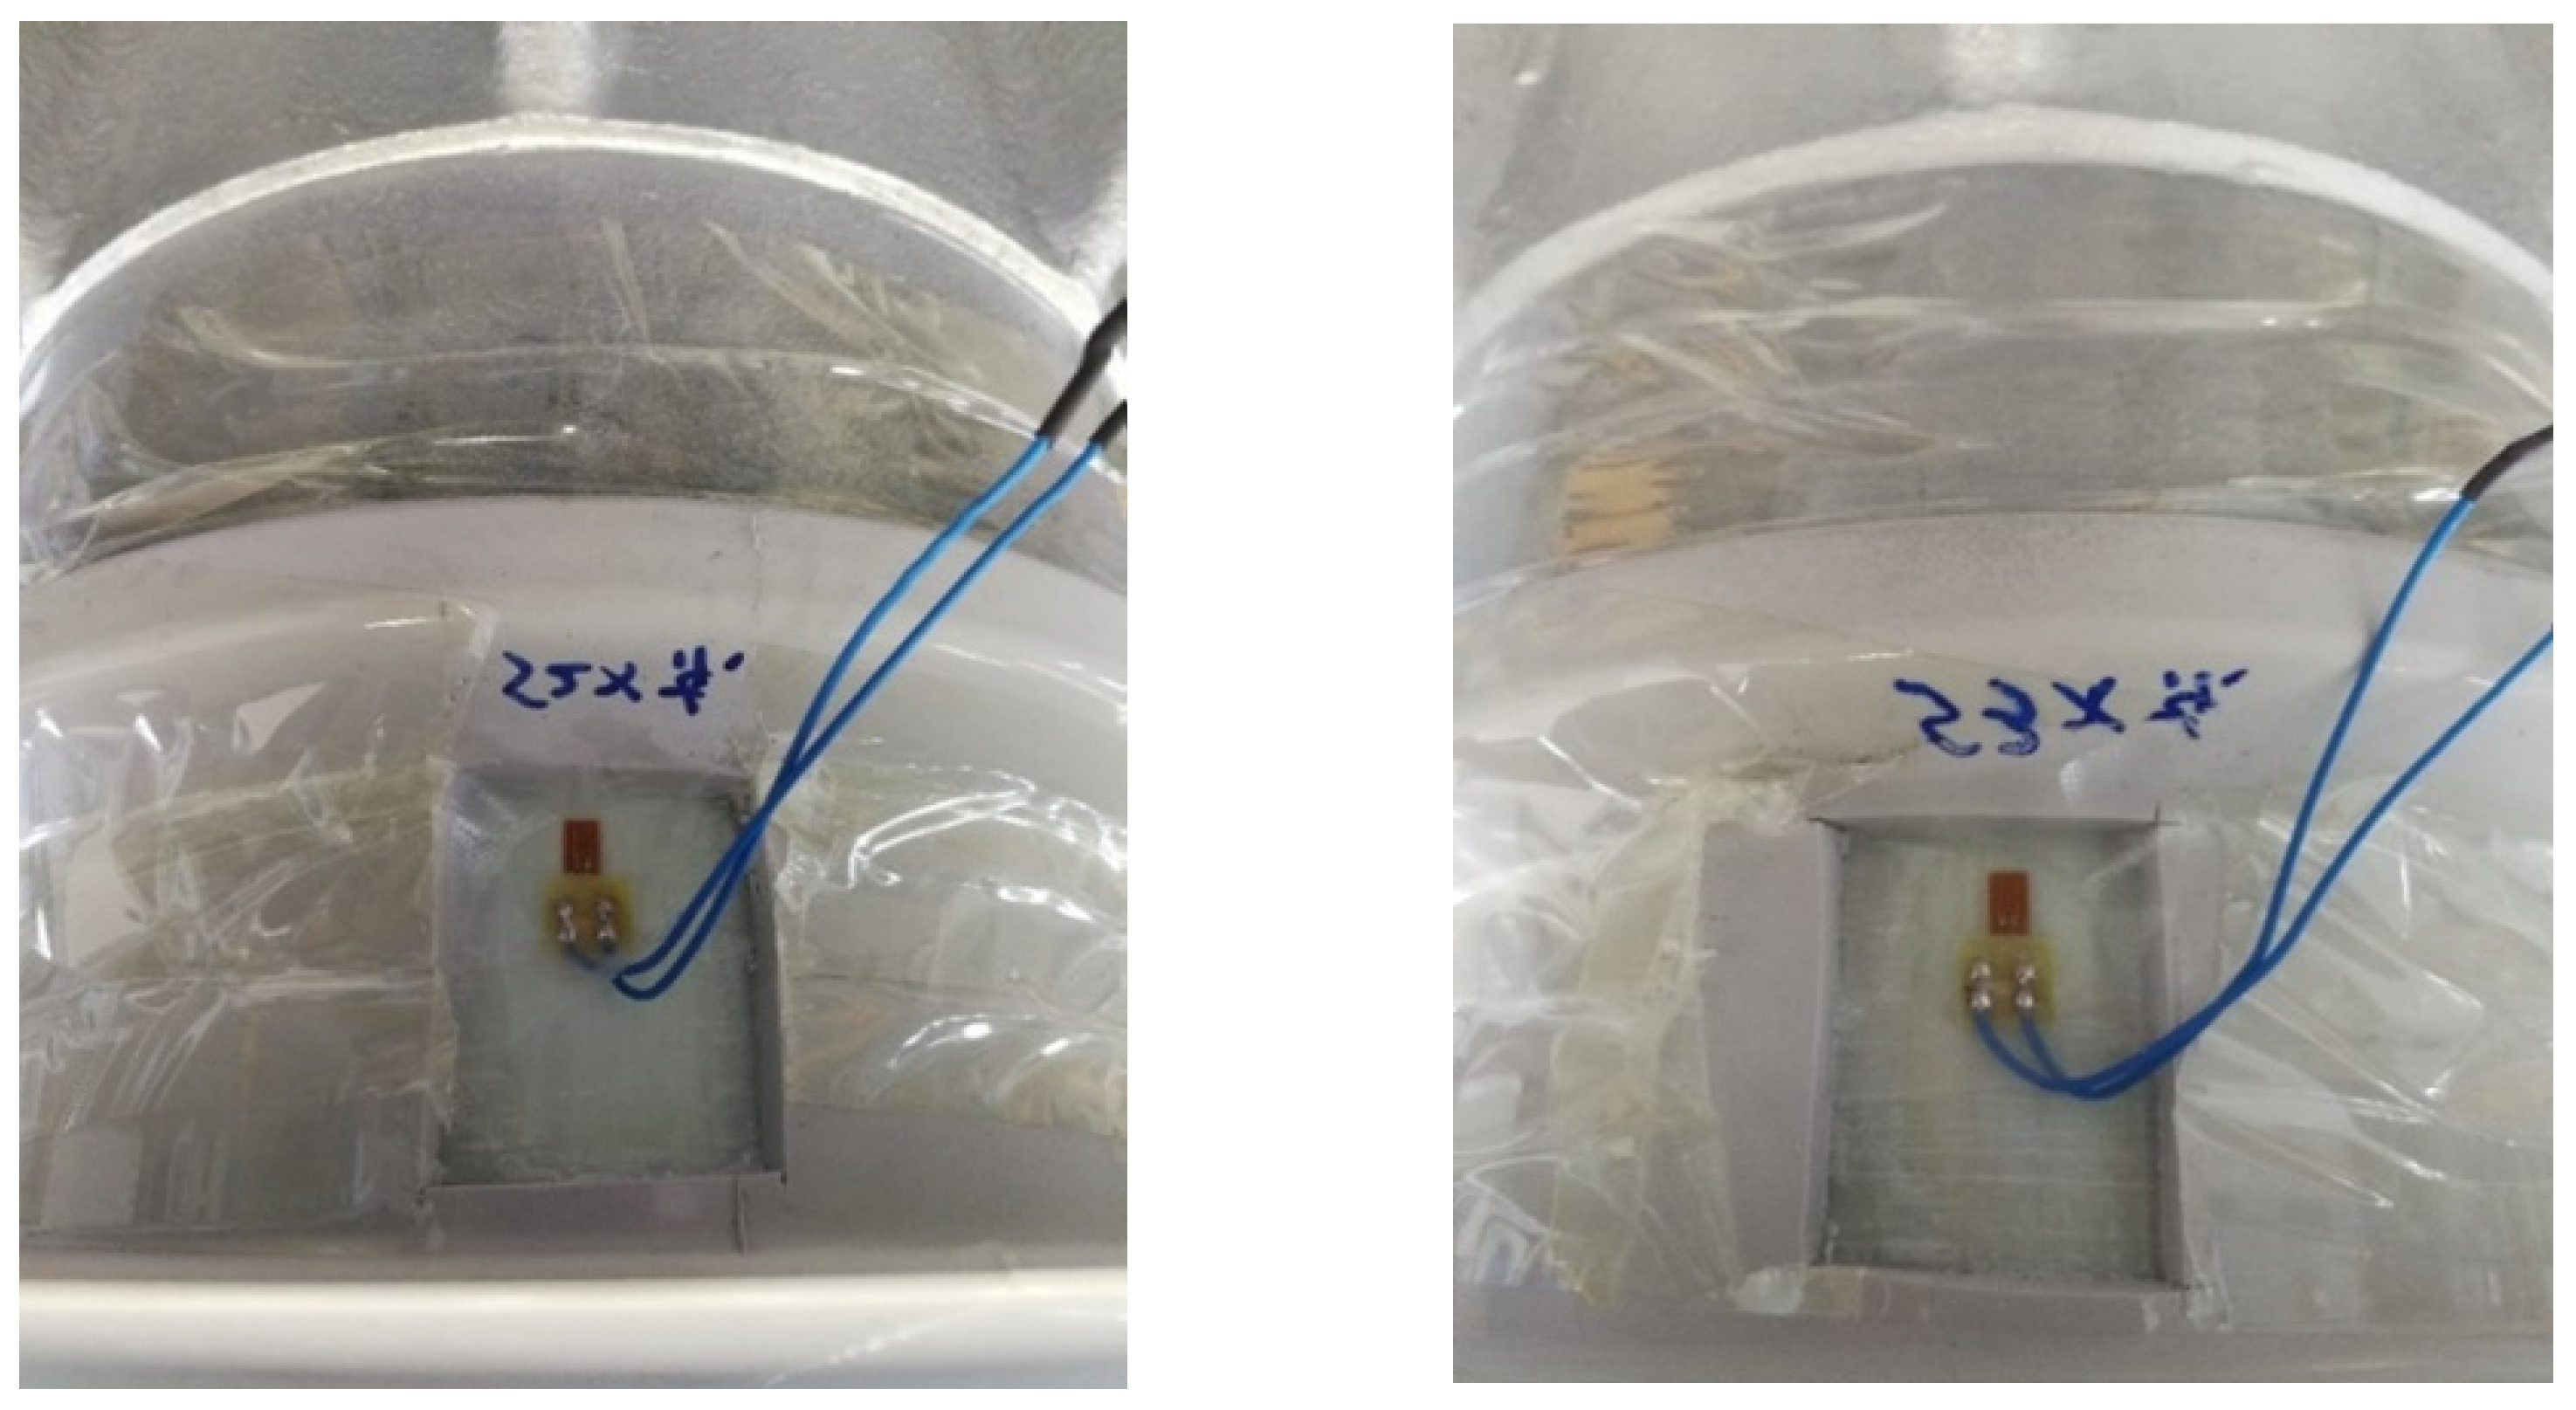
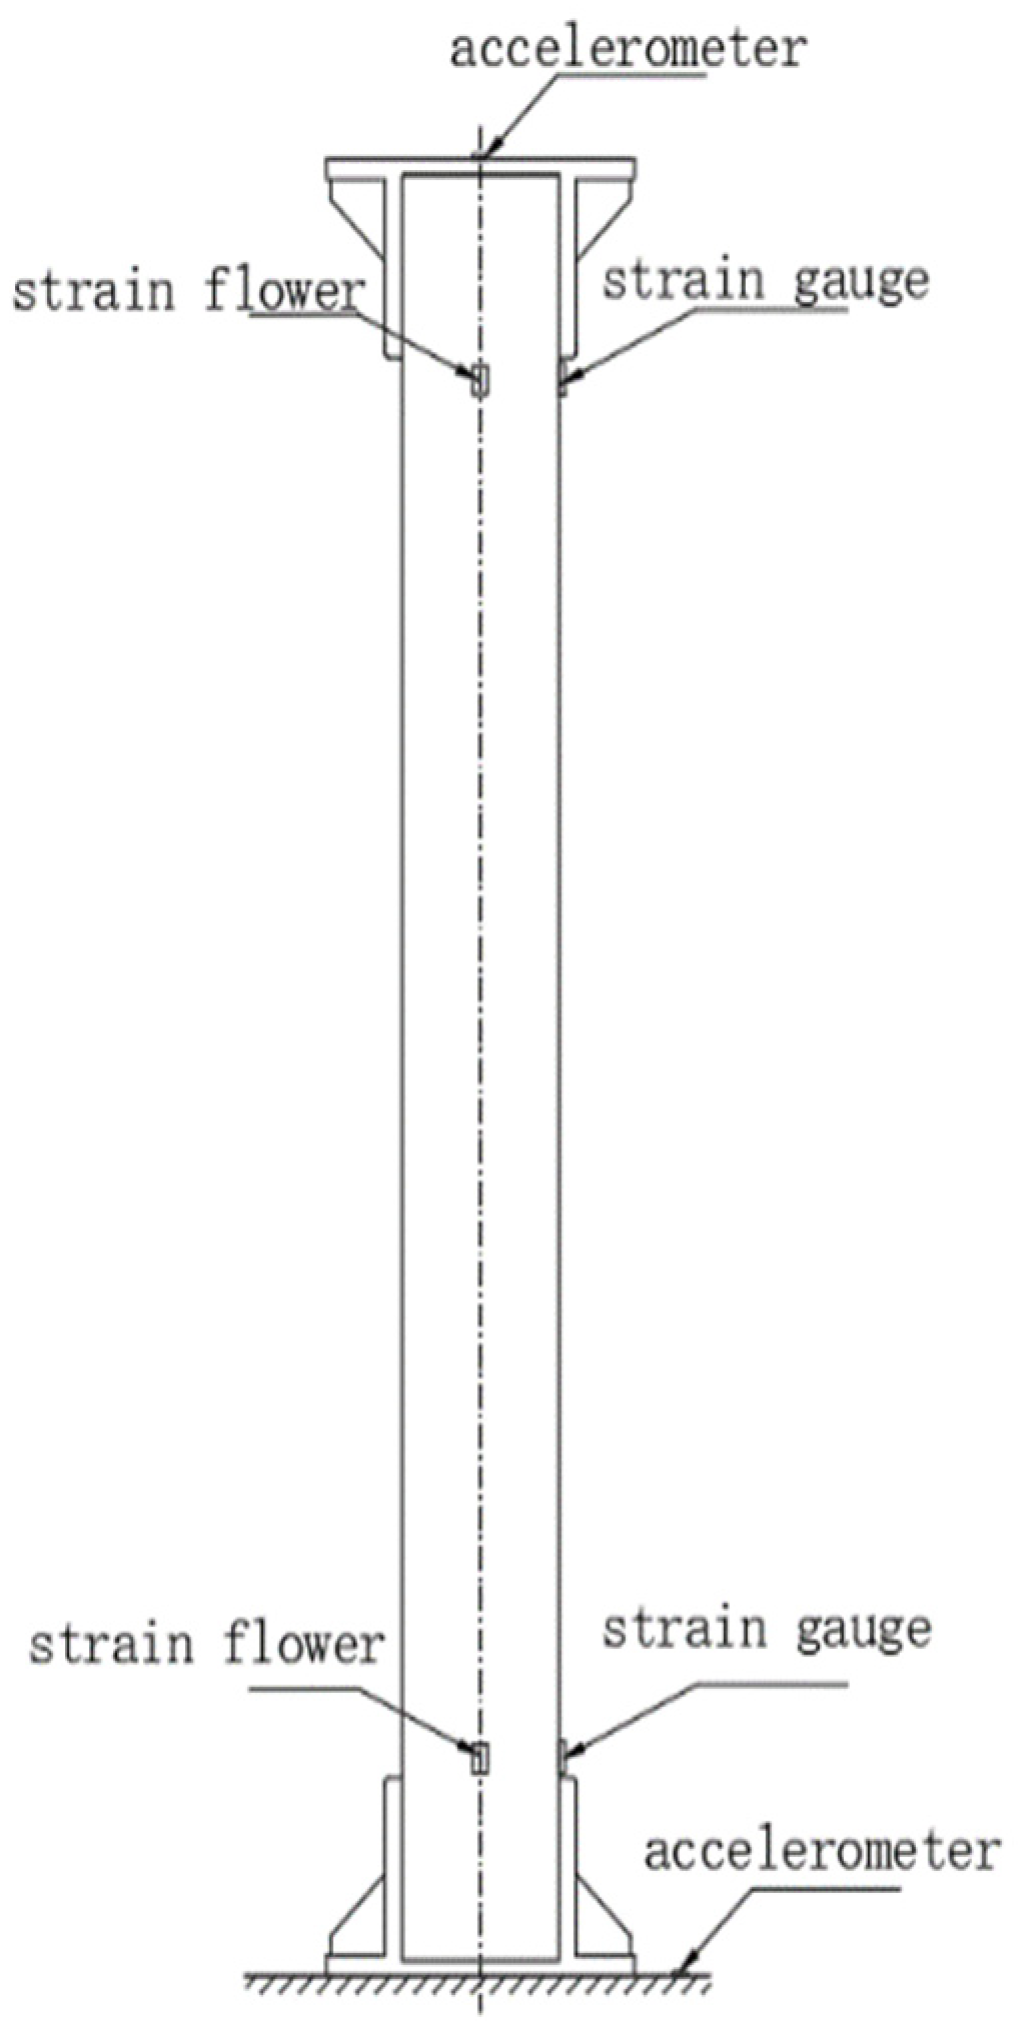
2.4. Experimental Verification of Vibration Characteristics

In this section, based on a single insulator and two series insulators, vibration characteristics tests are carried out to verify the simulation model further. As shown in Figure 12, two identical composite post insulators are fixed on the vibrating table through steel plates. An acceleration measuring point is arranged on the vibrating table. Two acceleration measuring points are arranged on the top and bottom of 1# and 2# insulators, respectively. A strain flower is arranged at the bottom of the insulator, and a vertical strain gauge is arranged on the opposite side at the bottom of the mandrel. The specific measuring point arrangement is shown in Figure 13. In the dynamic characteristics test of a single insulator, the white noise of 0.1–0.4 g amplitude in X and Y directions is input through the vibration test bench. The test conditions are shown in Table 5. The dynamic characteristics test of 1# and 2# insulator vertical connection (2# insulator above, 1# insulator below). The specific test conditions are shown in Table 6.
The modal analysis is carried out simultaneously based on the finite element model of the single insulator and the two insulators connected in the upper section. As shown in Table 7, the comparison results show that the simulation results of the first two frequencies of the insulator are consistent with the test results, and the deviation range is within 3%. The insulator simulation model constructed in this paper agrees with the engineering practice.

3. Results and Discussion

Based on the above conclusions, the structural parameters of the flange are optimized. This section examines the static stimulation and modal analysis of a single insulator and two insulators in series, respectively. In the static simulation, the bottom of the flange is fixed, and a horizontal tension of 10 kN is applied along the top of the insulator to analyze the stress of the insulator under the horizontal tension.
According to the manufacturing process of the flange, the thickness of the flange is generally 10 mm~20 mm. Therefore, flange thickness increases from 10 mm to 20 mm with each gradient of 2.5 mm, and flange height increases from 165 mm to 205 mm with each gradient of 10 mm.
The natural frequency characteristics of the insulator under different flange heights and thicknesses are explored when the height of the insulator stiffener (non-pressed area) is constant. Figure 14 and Figure 15 show the simulation results of the first two natural frequencies of the insulator under different flange structure parameters.
It can be seen from the diagram that whether it is a single insulator or two insulators in series, the influence of flange height and thickness on the first two natural frequencies is not apparent when the height of the insulator stiffener (non-pressed area) is constant. The first two natural frequencies are positively correlated with horizontal stiffness. It can be seen that when the height of the insulator stiffener (non-pressed area) is constant, the change of flange height and thickness parameters has little effect on the horizontal stiffness of the insulator.
Figure 16a is the maximum horizontal displacement diagram of a single insulator, and Figure 16b is the maximum stress diagram of a single insulator. The simulation results show that the maximum horizontal displacement of the insulator occurs at the top flange, and the maximum stress of the insulator occurs at the top of the flange stiffener, that is, the junction of the flange crimping area and the non-crimping area. The maximum horizontal displacement can reflect the horizontal stiffness of the insulator, and the maximum stress is the maximum value of the stress concentration area when the insulator is stressed. The smaller the maximum stress value, the higher the safety margin.
Figure 17 and Figure 18 are the insulator’s maximum horizontal displacement and maximum stress diagram, respectively. When the flange thickness is 10 mm, in the case of a single insulator, as the flange height increases from 165 mm to 205 mm, the maximum horizontal displacement of the insulator decreases from 23.6 mm to 23 mm, with a decrease of 2.5%. In the case of two insulator strings, the downward trend is the same, from the maximum horizontal displacement of 195 mm to 190.4 mm, a decrease of 2.4%. It can be seen that when the flange thickness of the two insulators is constant and the height of the insulator stiffener (non-pressing area) is constant, the maximum horizontal displacement decreases by less than 3% with the increase in flange height.
In the case of a single insulator, when the height of the flange is fixed at 205 mm, as the flange thickness increases from 10 mm to 20 mm, the maximum horizontal displacement of the insulator decreases from 23 mm to 21.8 mm, with a decrease of 5.2%. In the case of two insulator strings, the maximum horizontal displacement decreased from 190.4 mm to 183.35 mm, a decrease of 3.7%. It can be seen that when the flange height of the two insulators is constant, the maximum horizontal displacement decreases slightly with the increase in flange thickness, and the decrease is about 5%. Based on the above analysis, it can be seen that the change in flange height and thickness parameters has little effect on the change of horizontal stiffness, which is consistent with the above natural frequency conclusion.
Combined with the maximum stress diagram analysis of the two insulators, when the flange thickness is constant, the maximum stress value is unchanged when the height of the flange crimping zone changes. That is, the height of the flange crimping zone does not affect the bending resistance of the insulator. When the flange height is 205 mm, in the case of a single insulator, the flange thickness increases from 10 mm to 20 mm, and the maximum stress value decreases from 158.7 MPa to 72.3 MPa, with a decrease of 54.4%. In the case of two insulator strings, the maximum stress value decreased from 322 MPa to 146.6 MPa, a decrease of 54.4%. It can be seen that within the specified range of the crimping process, the thicker the flange, the smaller the maximum bending stress. Its bending strength is more significant, and the safety margin is more incredible.
In summary, when we choose the flange, the height size of the flange has little effect on the stiffness and bending performance of the post insulator. Therefore, we try to reduce the flange height to reduce the cost within the range of the flange height specified by the crimping process. On the other hand, under the allowable range of the flange crimping mandrel process, the flange with a thicker thickness can be selected as far as possible. Because the flange thickness increases, although the stiffness of the post insulator formed by crimping does not change much, its bending resistance is improved. So, its safety threshold is greater and more reliable in practical engineering applications.

4. Conclusions

This paper studies the crimped composite post insulator widely used in flexible DC converter valves. The MPC local constraint method is used to simulate the crimping process of the insulator mandrel and flange, and the simulation model of the new crimped insulator is constructed. The material mechanics equivalent calculation, shaking table dynamic characteristic test, and static tensile test of the composite post insulator are carried out, and the rationality of the model is demonstrated. Based on the above model, the structural parameters of the flange are optimized, and the influence of flange height and thickness on the mechanical properties of the insulator is explored. The main conclusions are as follows:
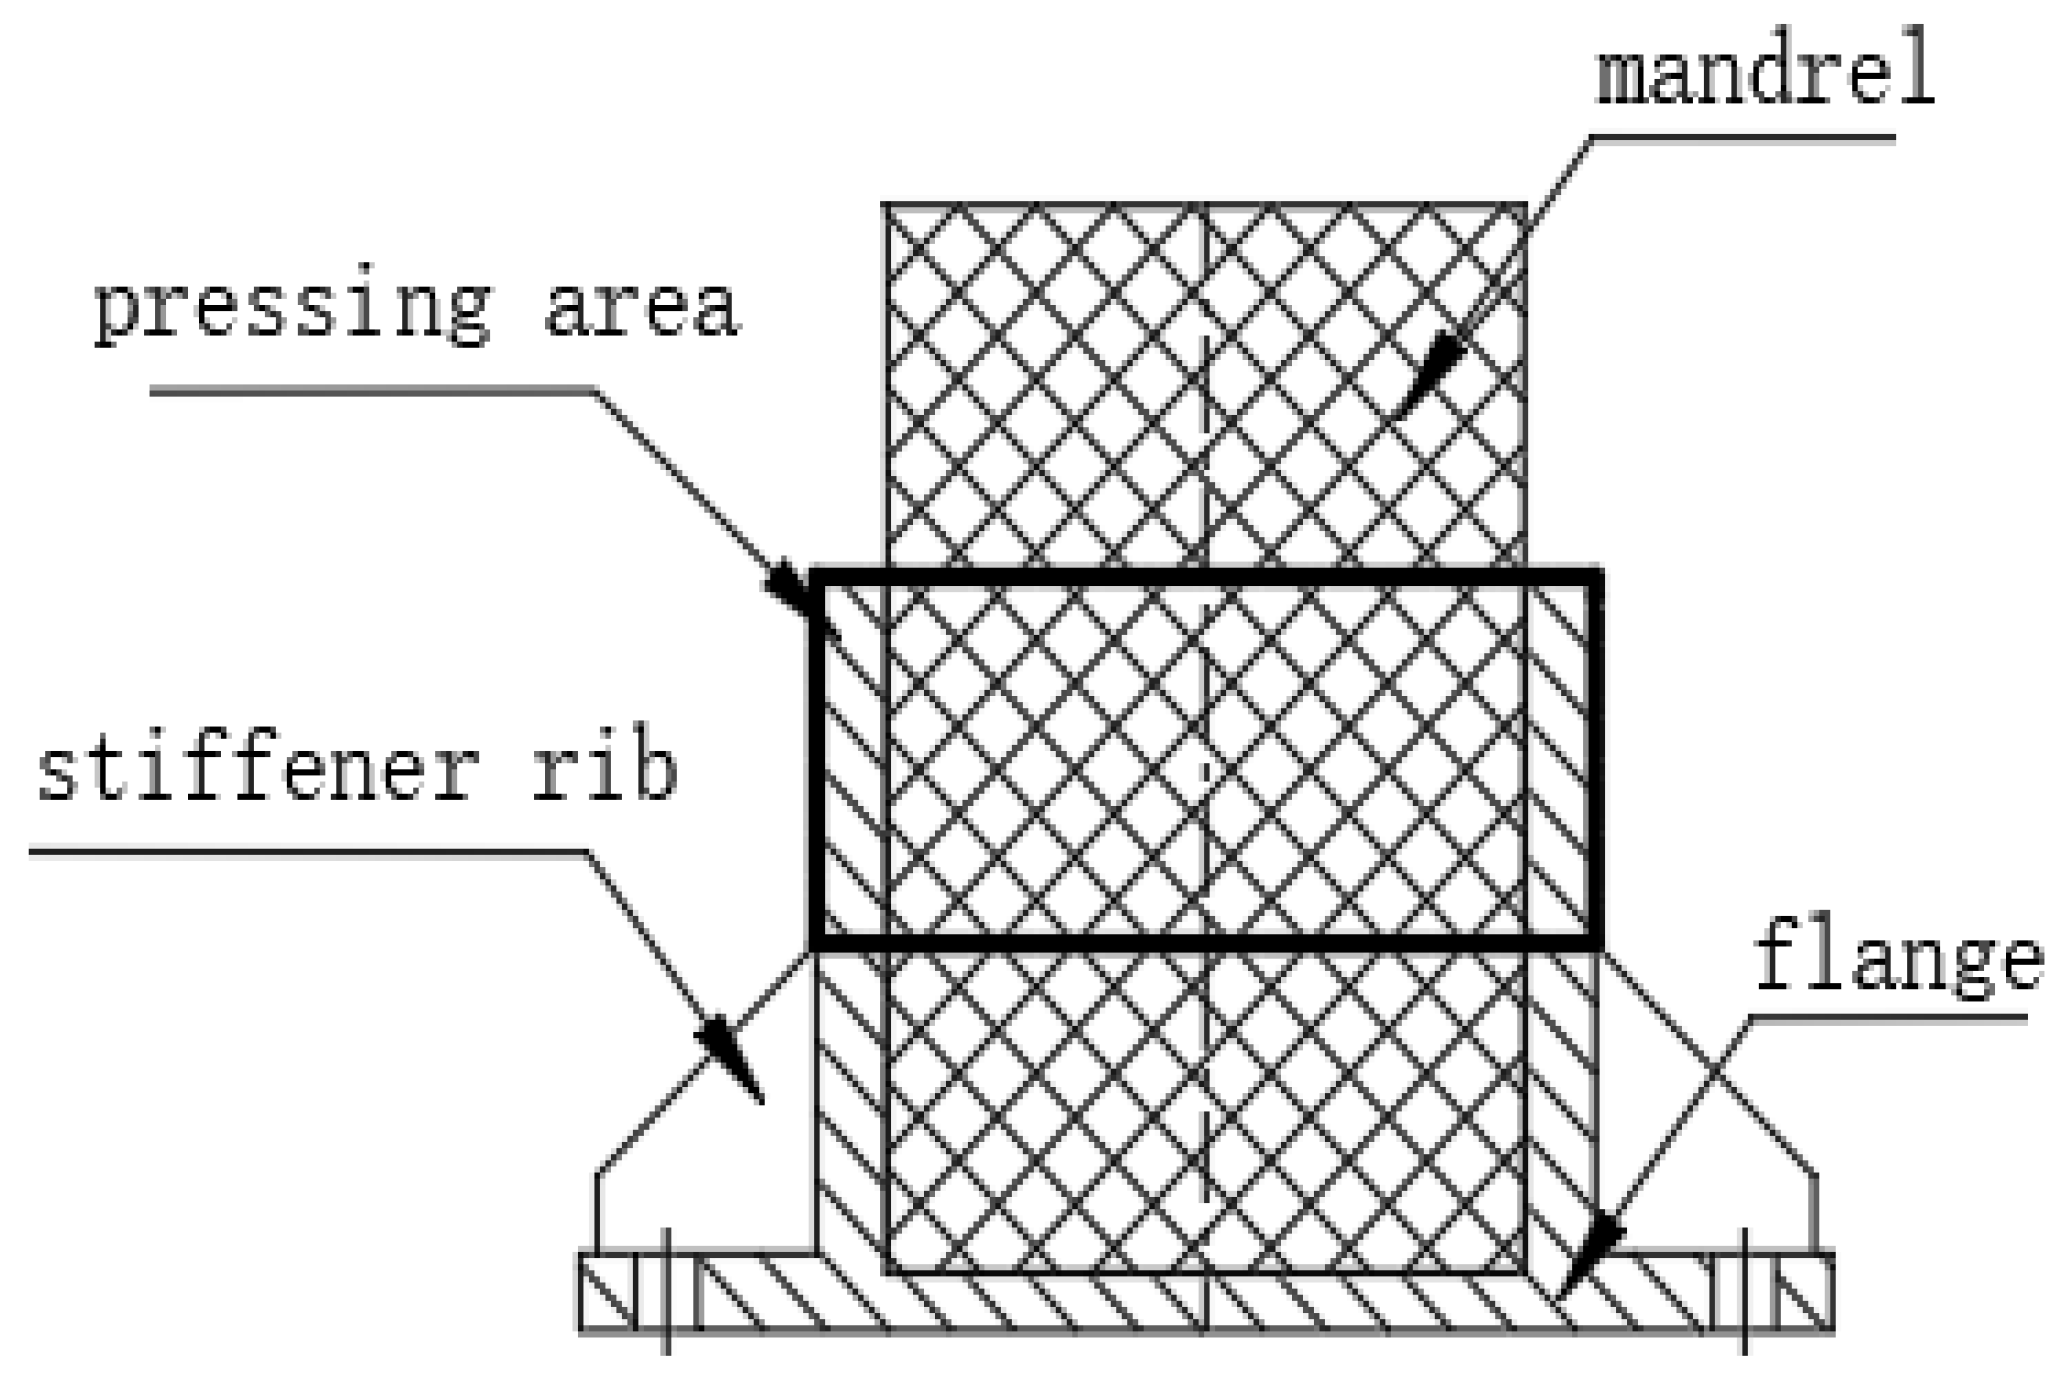
  • The MPC local constraint modeling method of ANSYS software is used to simulate the flange crimping process of composite post insulator. The difference between the simulation and test results is less than 5%. The simulation analysis method can be applied to the finite element simplified modeling of the post insulator in the flexible DC converter valve;
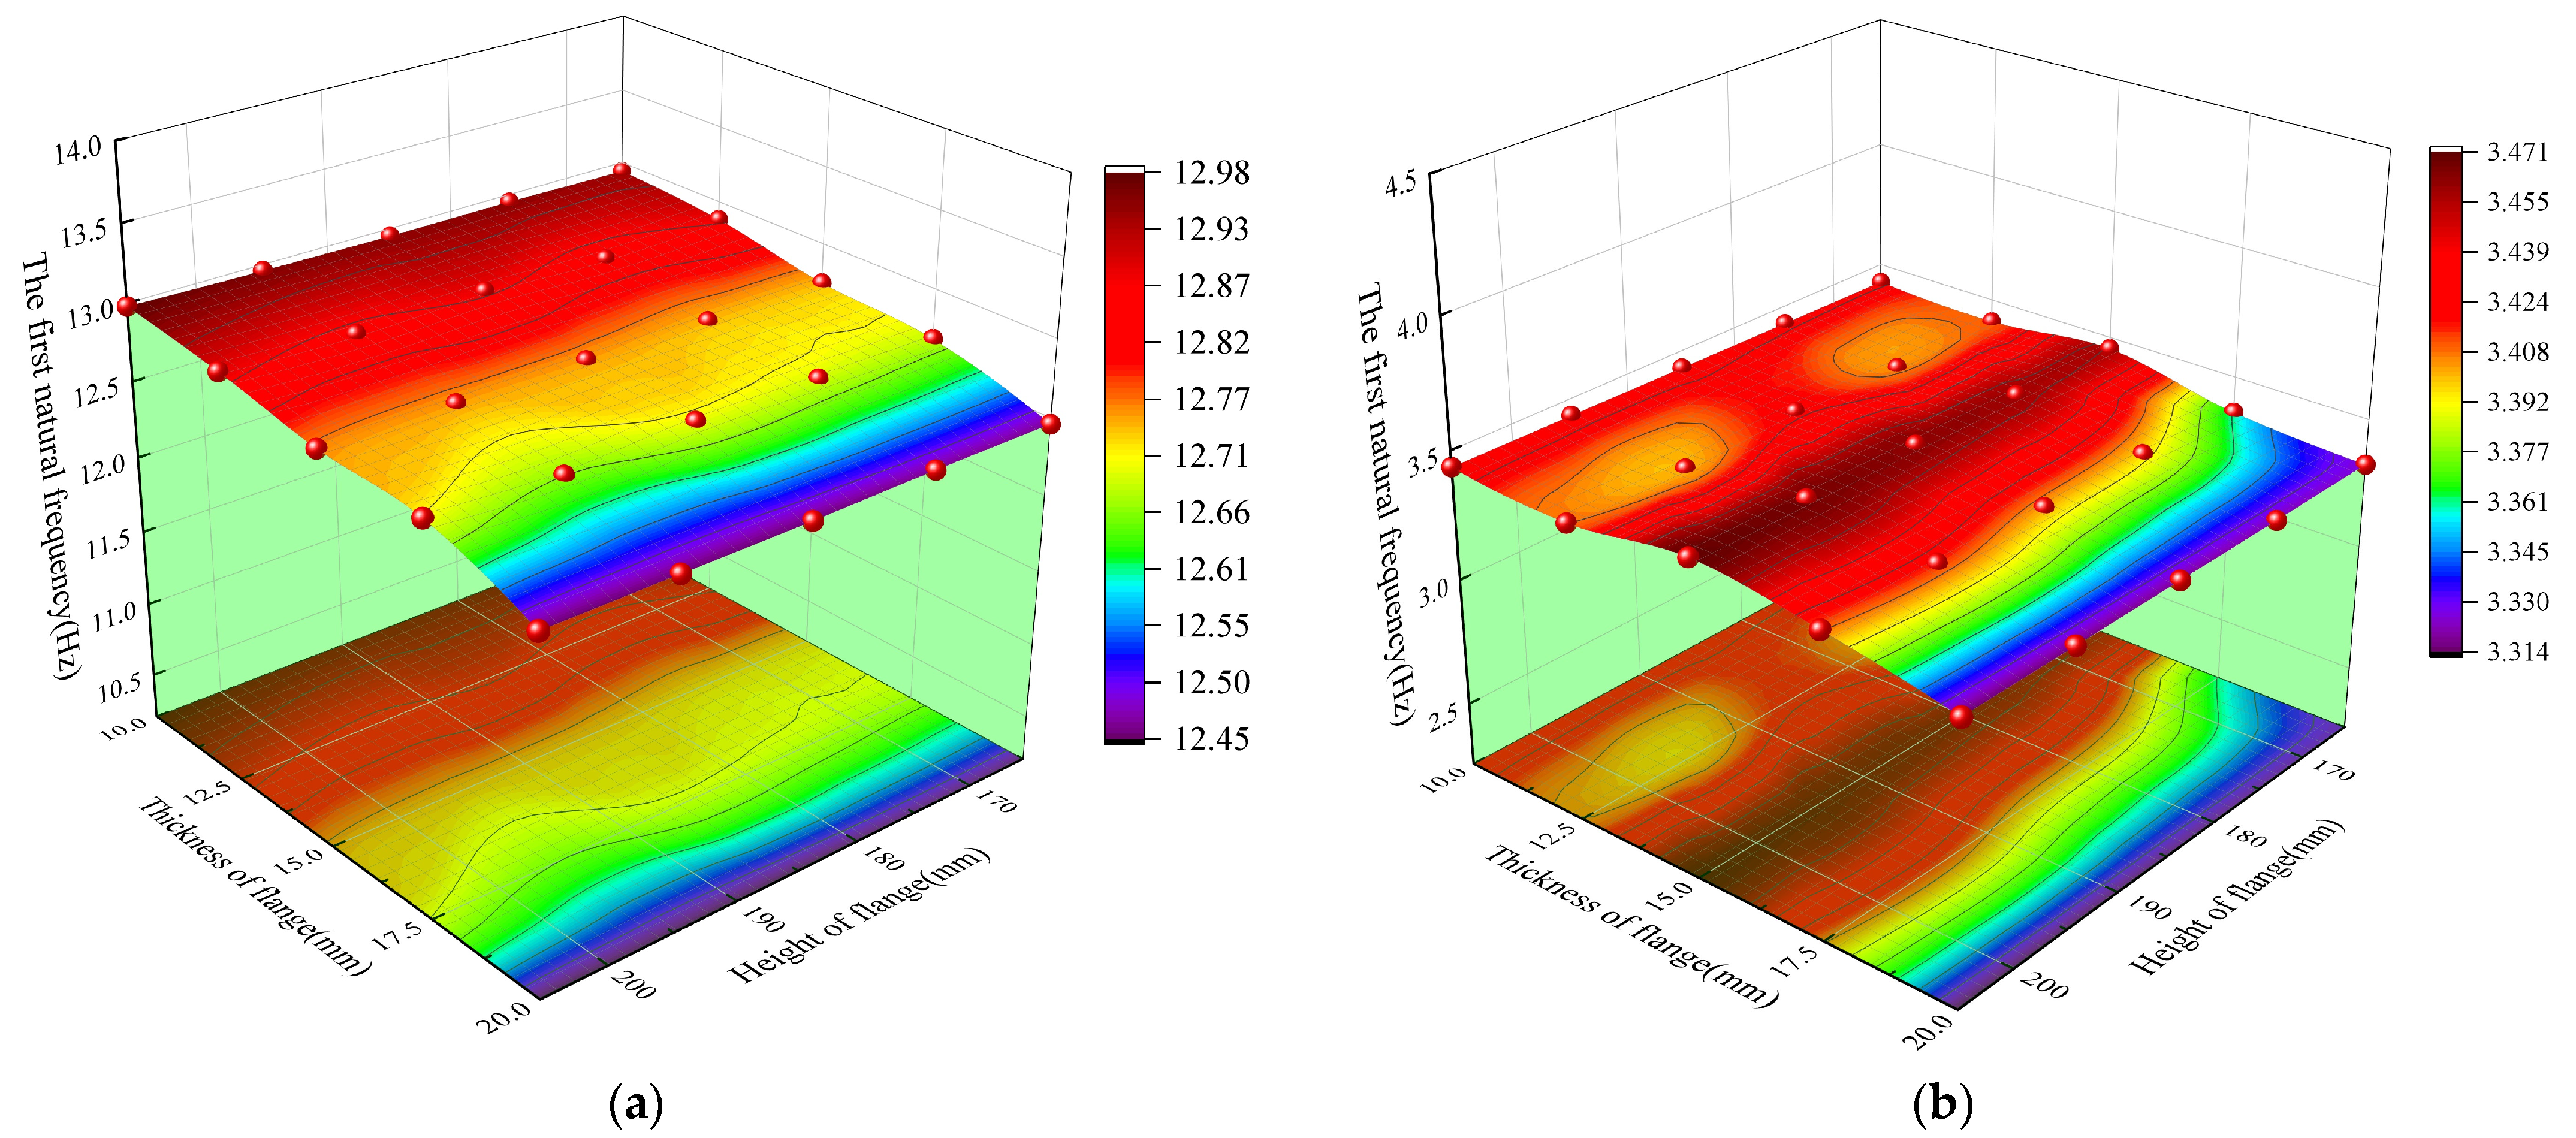
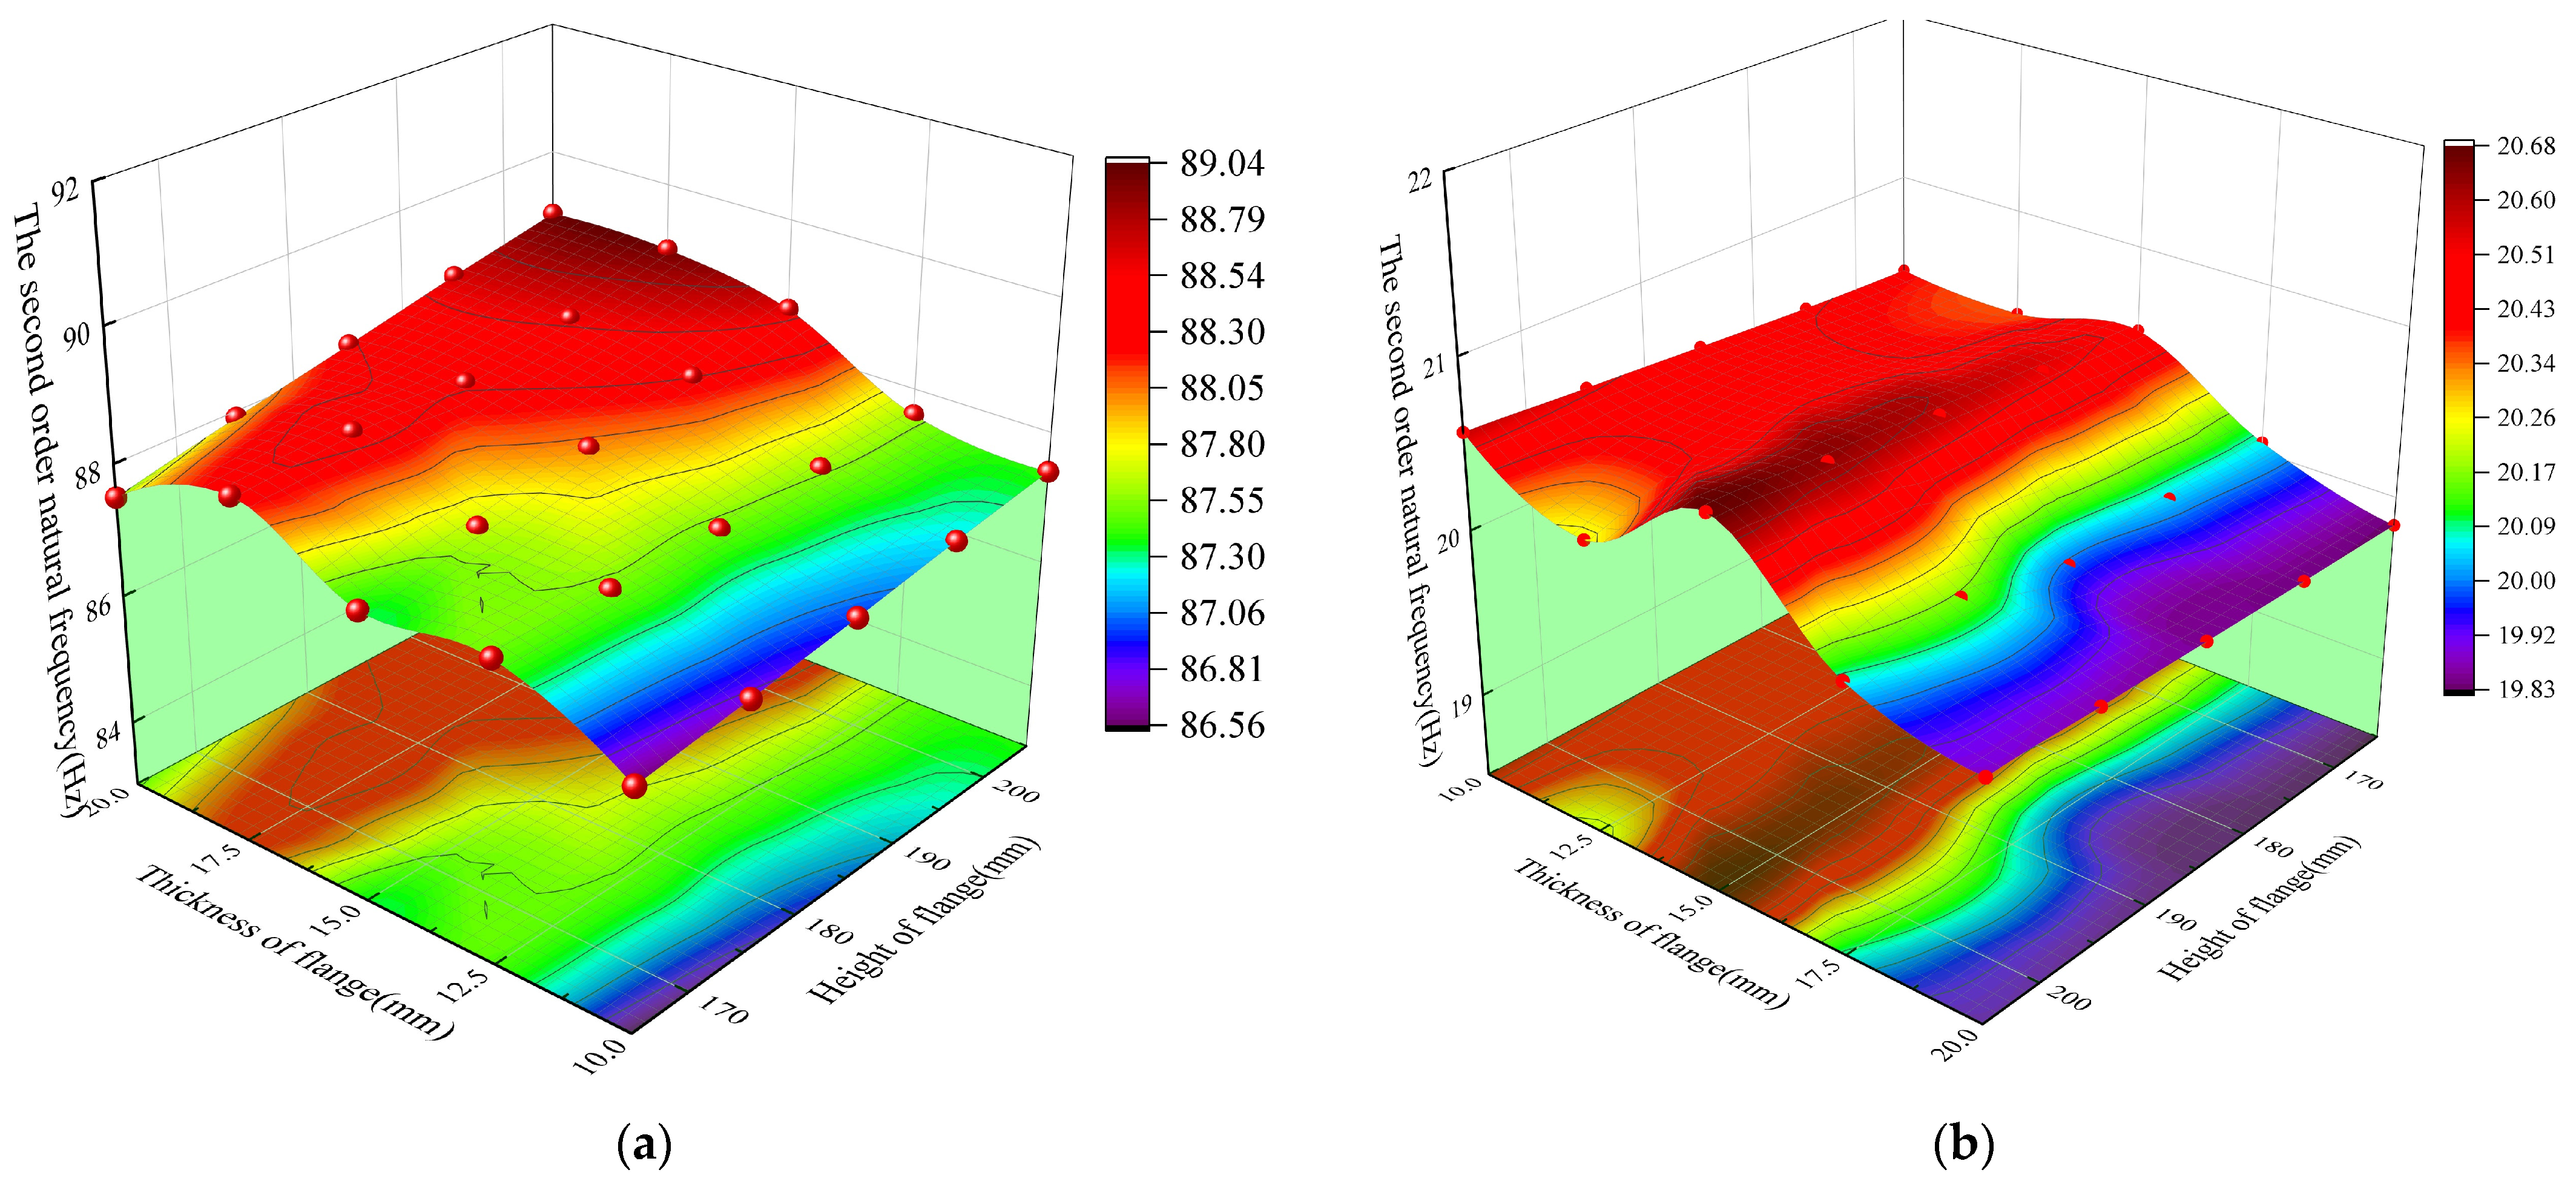
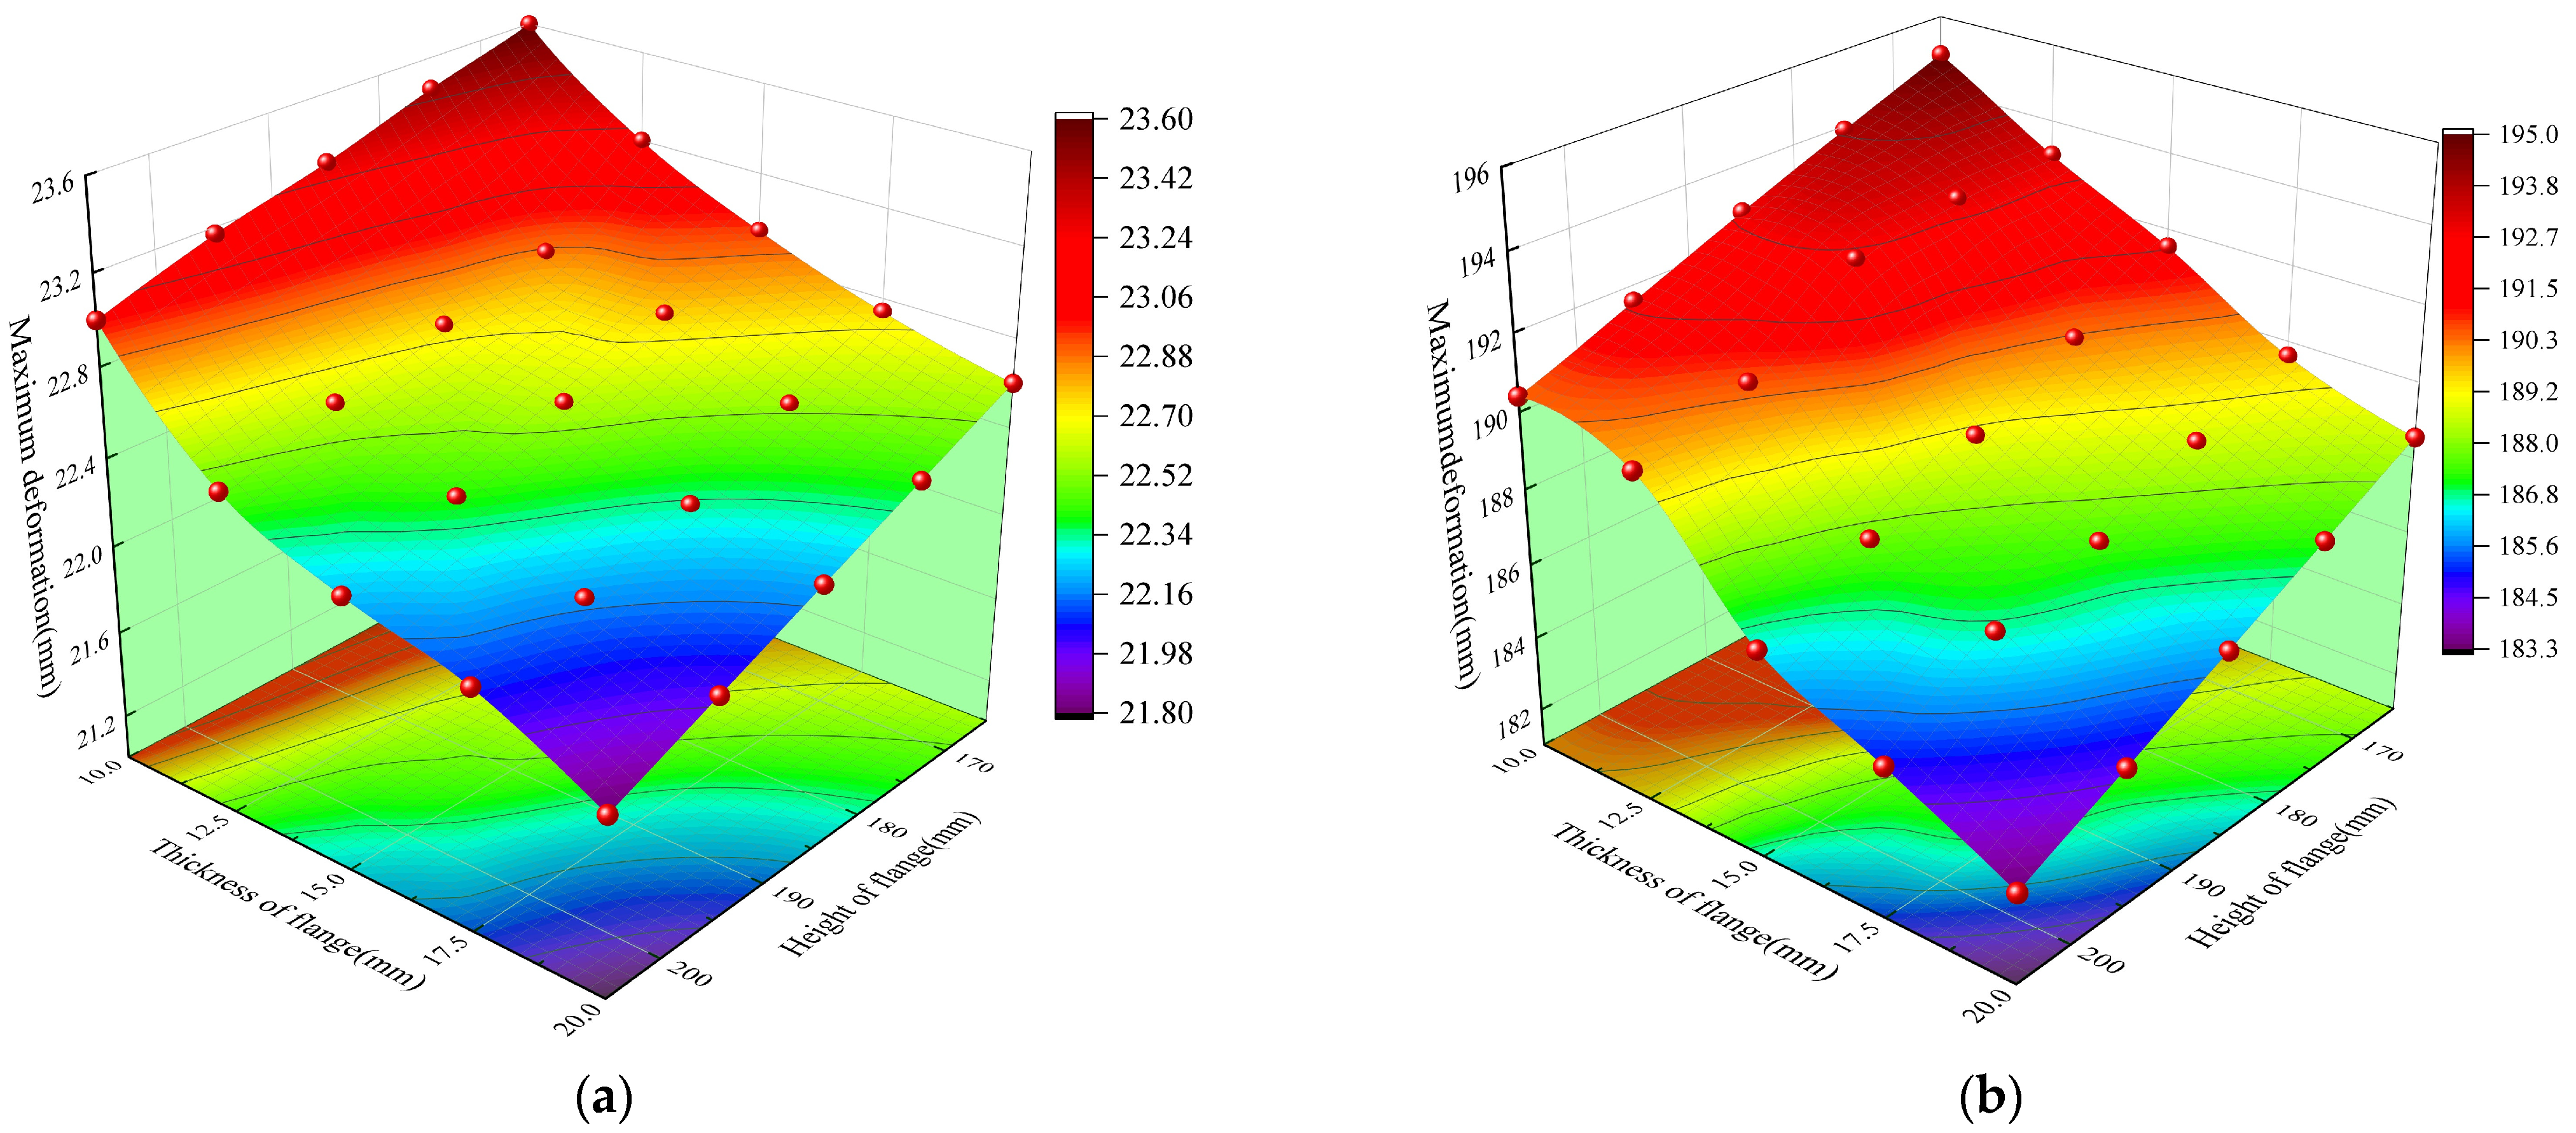
  • When the height of the insulator stiffener (non-pressing area) is constant, the influence of flange height and flange thickness on the horizontal stiffness of the insulator can be ignored. When the flange height and thickness change, the natural frequency of the insulator varies within 3%, which shows that the structural parameters have little effect on it. On the other hand, when the flange height changes and the thickness is fixed at 10 mm, the maximum horizontal displacement of the single insulator changes the most. The maximum horizontal displacement decreases from 23.6 mm to 23 mm with the increase in flange height, and the decrease is 2.5%. When the flange thickness changes and the height is fixed at 205 mm, the maximum horizontal displacement of a single insulator changes the most. The maximum horizontal displacement decreases from 23 mm to 21.8 mm with the increase in height, and the decrease is 5.2%. These changes are about 5%, so the impact is negligible;
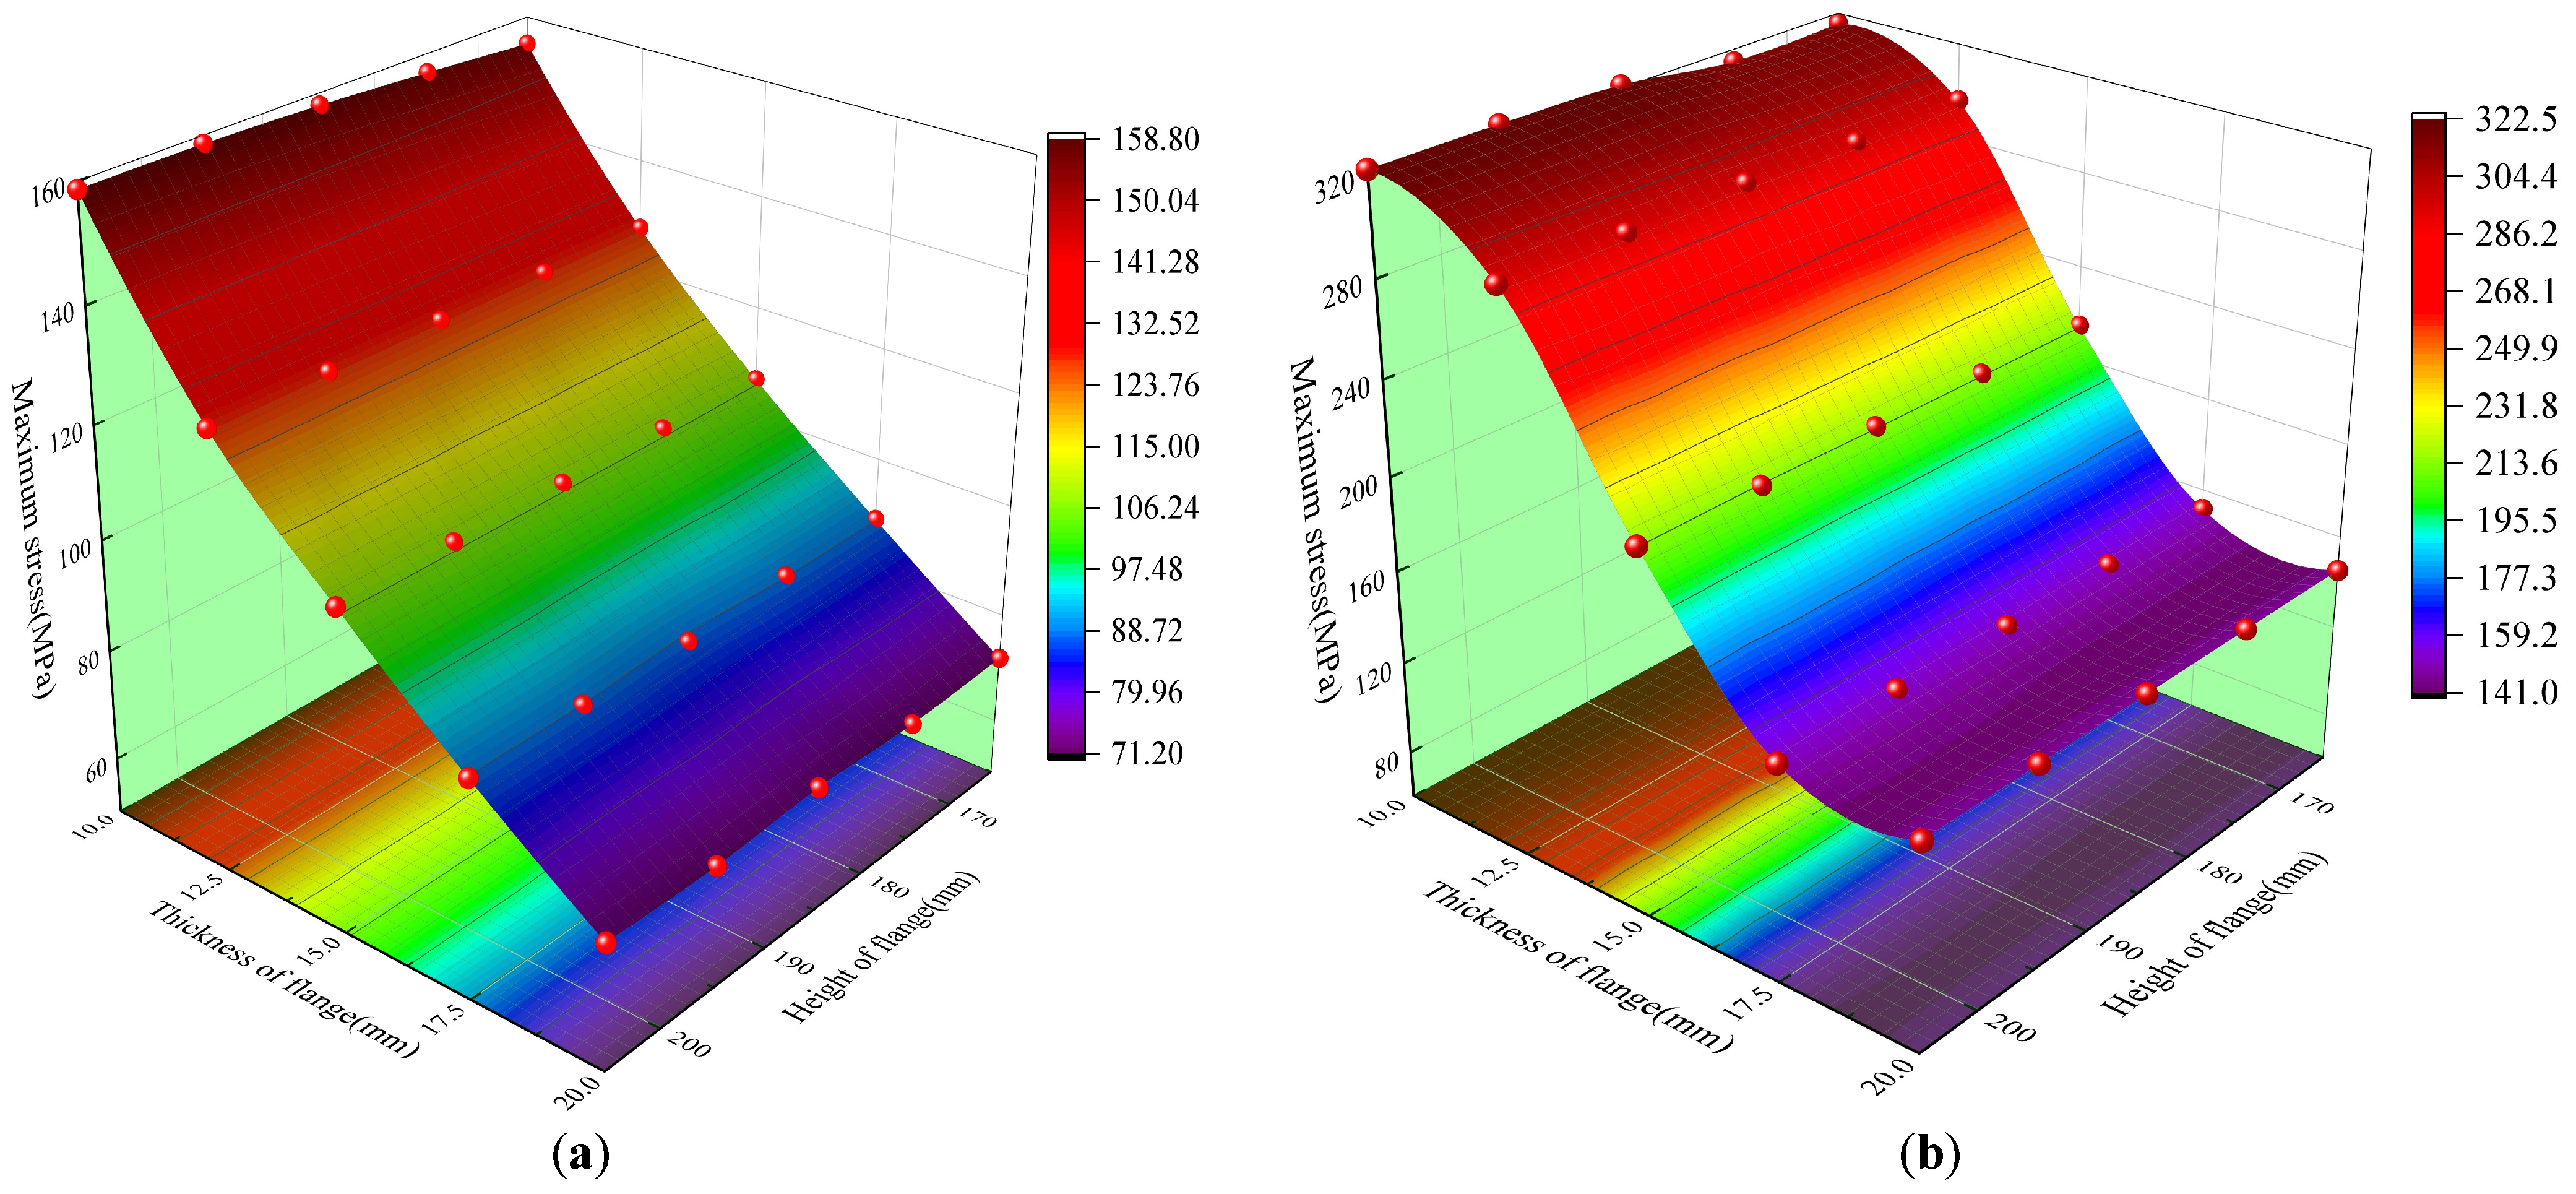
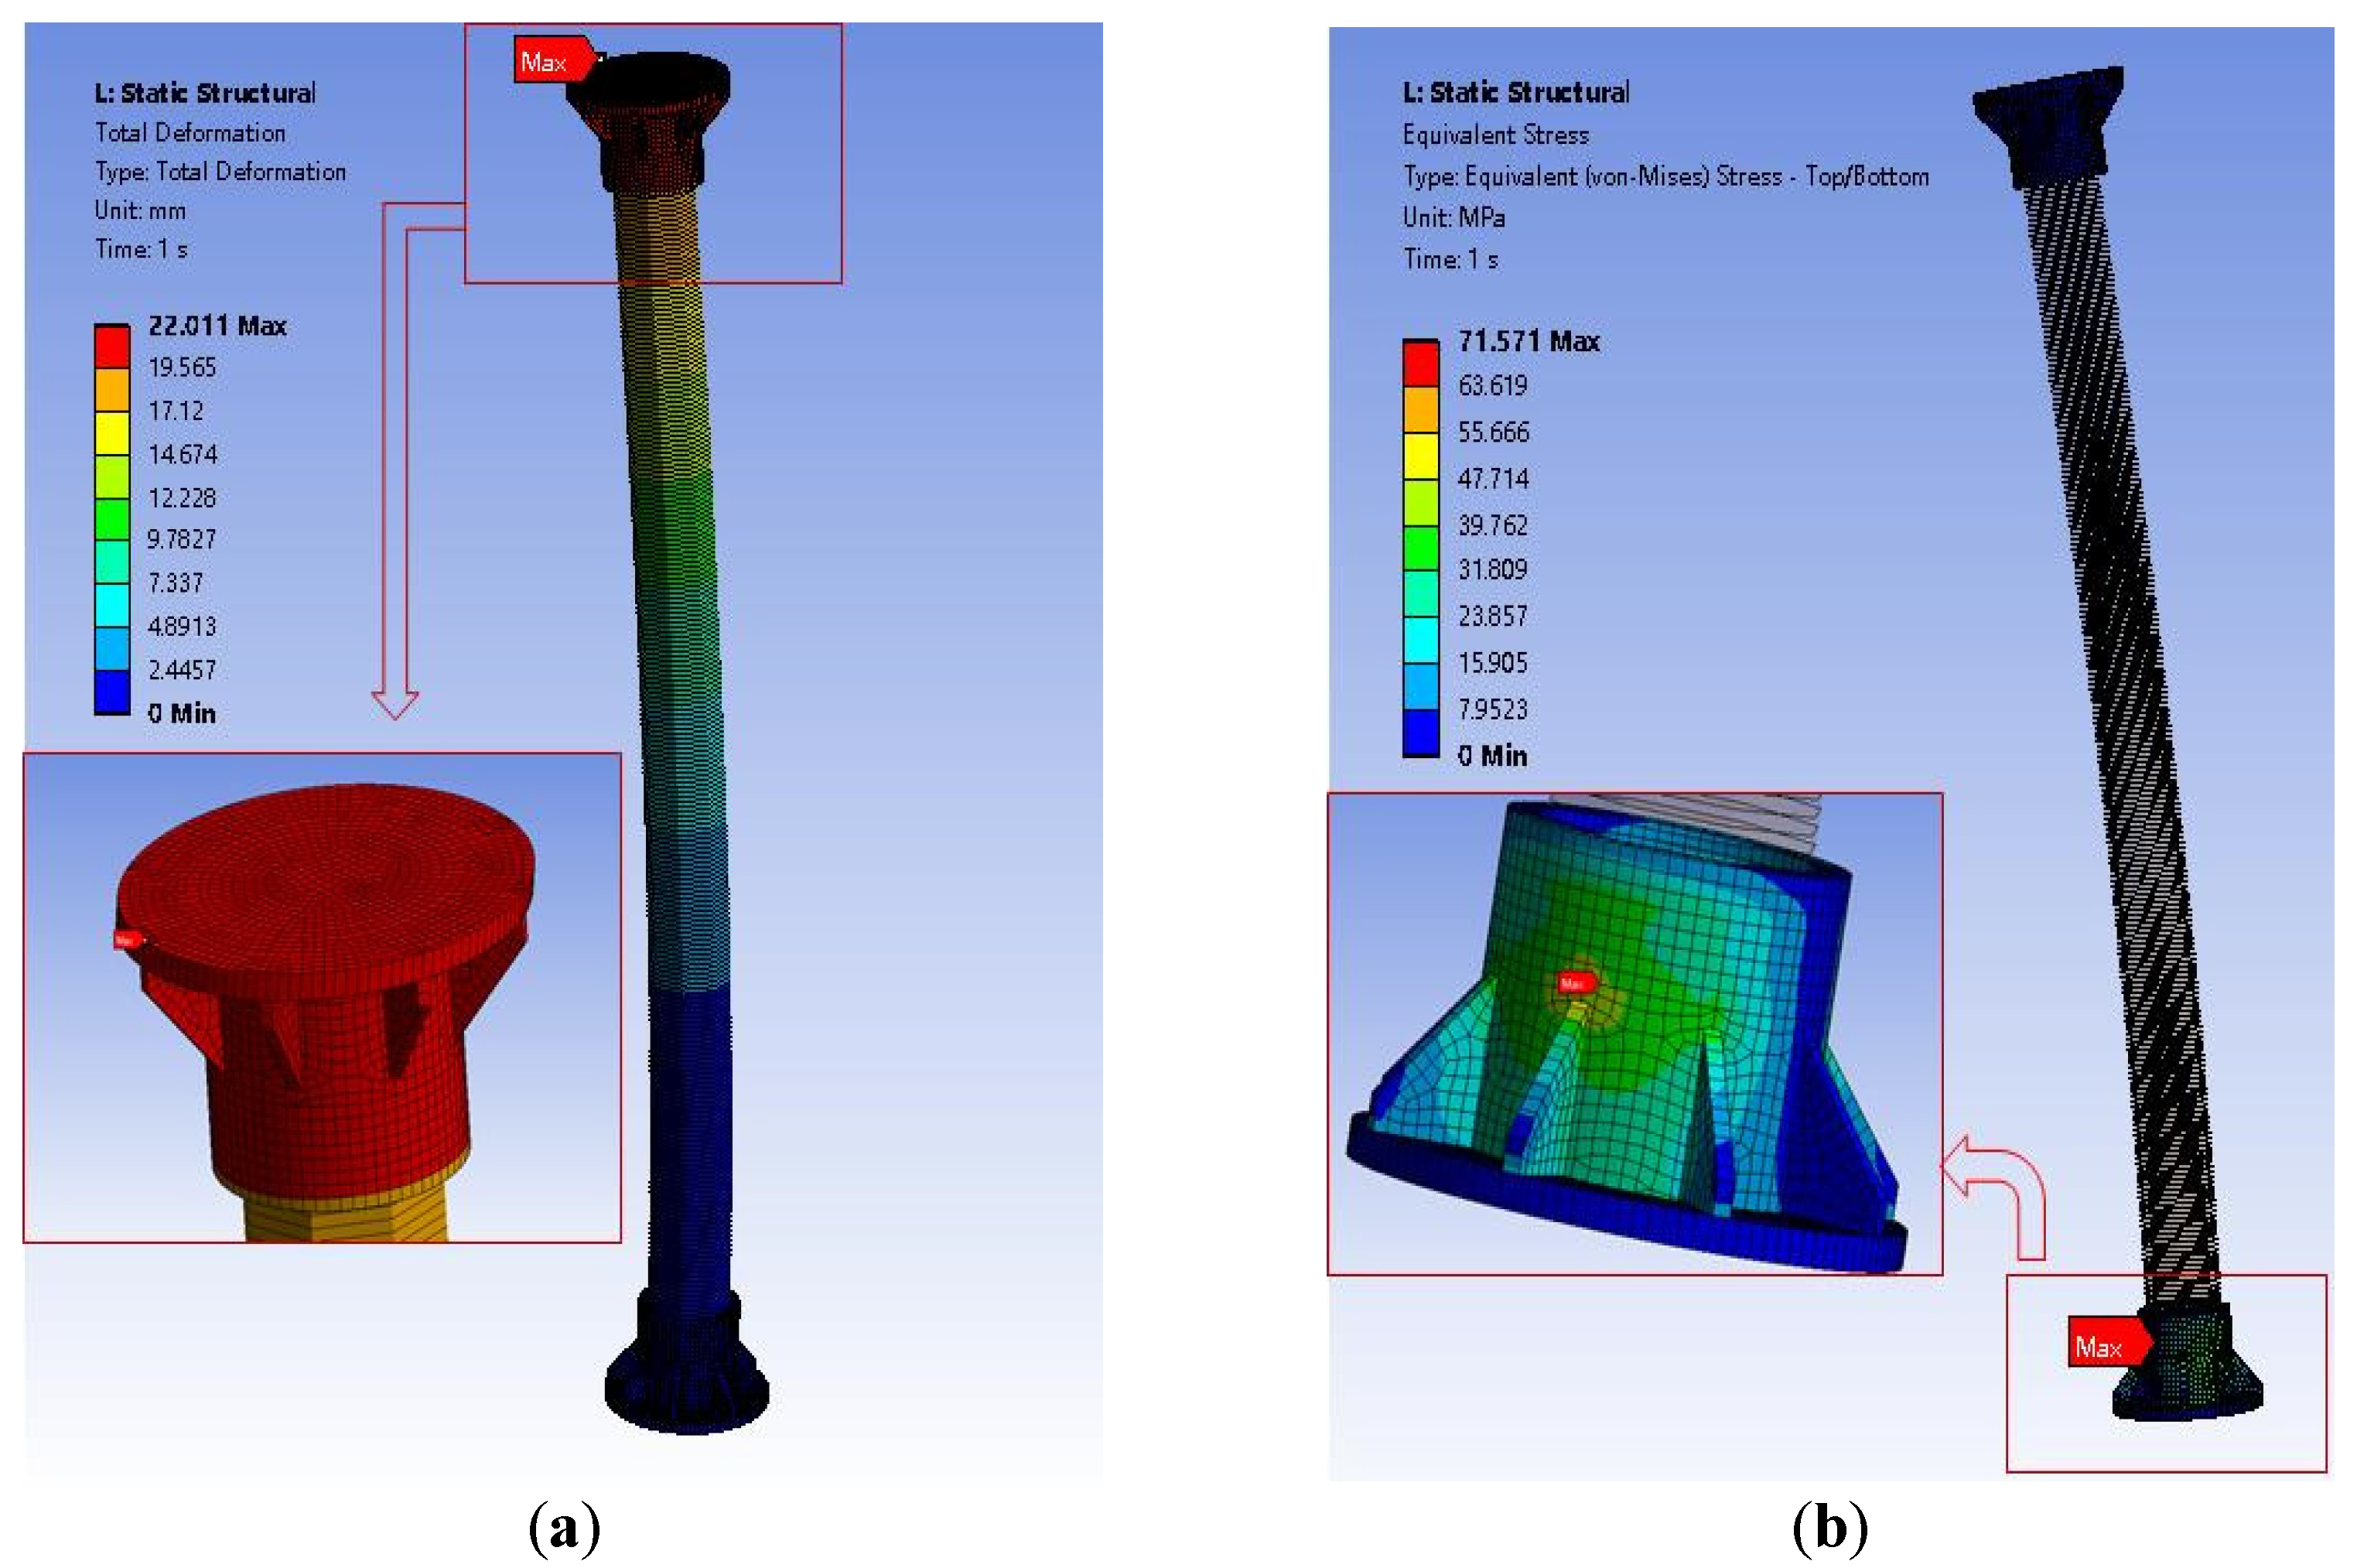
  • When the height of the insulator stiffener (non-pressing area) is constant, the change in flange thickness significantly affects the insulator’s bending performance. The thicker the crimped composite post insulator flange is, the smaller the maximum bending stress, and the maximum decrease is 54.4%. That is, the increase in flange thickness can significantly increase the bending resistance of the insulator;
  • In the production of the crimping insulator, the height of the flange is reduced as much as possible under the condition of process permission. The increase in flange height not only increases the cost but also reduces the dry arc distance of the insulator. More importantly, the influence of the flange height on the bending strength of the insulator can be ignored.

Author Contributions

Conceptualization, J.X.; methodology, J.X.; software, Y.Z.; validation, J.X., Y.Z., and Y.X.; formal analysis, Y.J.; investigation, Y.J.; resources, Y.J.; data curation, J.X.; writing—original draft preparation, J.X. and L.Z.; writing—review and editing, Y.Z. and L.Z.; visualization, Y.Z.; supervision, Y.X.; project administration, J.X.; funding acquisition, J.X. All authors have read and agreed to the published version of the manuscript.

Funding

This research was funded by the National Key R&D Program of Ministry of Science and Technology of China (grant number 2021YFB2400603).

Data Availability Statement

The data presented in this study are available on request from the corresponding author.

Conflicts of Interest

The authors declare no conflict of interest.

References

  1. Ang, A.H.-S.; Pires, J.A.; Villaverde, R. A Model for the Seismic Reliability Assessment of Electric Power Transmission Systems. Reliab. Eng. Syst. Saf. 1996, 51, 7–22. [Google Scholar] [CrossRef]
  2. Arrillaga, J.; Watson, N.R.; Liu, Y.H. Flexible Power Transmission: The Hvdc Options; John Wiley & Sons: New York, NY, USA, 2007. [Google Scholar]
  3. Park, R.; Billings, I.J.; Clifton, G.C.; Cousins, J.; Filiatrault, A.; Jennings, D.N.; Jones, L.C.P.; Perrin, N.D.; Rooney, S.L.; Sinclair, J.; et al. The Hyogo-Ken Nanbu Earthquake (the Great Hanshin Earthquake) of 17 January 1995: Report of the Nznsee Reconnaissance Team. Bull. Bull. N. Z. Soc. Earthq. Engineering 1995, 28, 1–98. [Google Scholar]
  4. Sokolov, V.; Wenzel, F. On the Modeling of Ground-Motion Field for Assessment of Multiple-Location Hazard, Damage, and Loss: Example of Estimation of Electric Network Performance During Scenario Earthquake. Nat. Hazards 2014, 74, 1555–1575. [Google Scholar] [CrossRef]
  5. Christensen, R.M. Mechanics of Composite Materials; Courier Corporation: North Chelmsford, MA, USA, 2012. [Google Scholar]
  6. Epackachi, S.; Dolatshahi, K.M.; Oliveto, N.D.; Reinhorn, A.M. Mechanical Behavior of Electrical Hollow Composite Post Insulators: Experimental and Analytical Study. Eng. Struct. 2015, 93, 129–141. [Google Scholar] [CrossRef]
  7. Xidong, L.; Shaowu, W.; Ju, F.; Zhicheng, G. Development of Composite Insulators in China. IEEE Trans. Dielectr. Electr. Insul. 1999, 6, 586–594. [Google Scholar] [CrossRef]
  8. Huang, H.; Xu, Y.; Li, H.; Zhang, Z.; Li, Y.; Zhang, H.; Cheng, J.; Yi, B.; Wang, Z.; Zhang, G. Optimization and Comparison of Specific ON-Resistance for Superjunction MOSFETs Considering Three-Dimensional and Insulator-Pillar Concepts. IEEE Trans. Electron Devices 2022, 69, 1162–1168. [Google Scholar] [CrossRef]
  9. Mohammadi, R.K.; Akrami, V.; Nikfar, F. Dynamic Properties of Substation Support Structures. J. Constr. Steel Res. 2012, 78, 173–182. [Google Scholar] [CrossRef]
  10. Moustafa, M.A.; Mosalam, K.M. Structural Performance of Porcelain and Polymer Post Insulators in High Voltage Electrical Switches. J. Perform. Constr. Facil. 2016, 30, 04016002. [Google Scholar] [CrossRef]
  11. Wen, B.; Niu, D.T. Seismic Response Analysis of Substation Involving Interaction of Main Structure-Electrical Equipments. Adv. Mater. Res. 2011, 163-167, 4022–4026. [Google Scholar] [CrossRef]
  12. Rowland, S.M.; Robertson, J.; Xiong, Y.; Day, R.J. Electrical and Material Characterization of Field-Aged 400 Kv Silicone Rubber Composite Insulators. IEEE Trans. Dielectr. Electr. Insul. 2010, 17, 375–383. [Google Scholar] [CrossRef]
  13. Tedesco, J.; McDougal, W.G.; Ross, C.A. Structural Dynamics; Pearson Education: London, UK, 2000. [Google Scholar]
  14. Cimellaro, G.P.; Reinhorn, A.M.; Schiff, A. Evaluation of Hollow Core Composite Insulators. In Proceedings of the TCLEE 2009: Lifeline Earthquake Engineering in a Multihazard Environment, Oakland, CA, USA, 28 June–1 July 2009; pp. 1–12. [Google Scholar]
  15. Cimellaro, G.P.; Roh, H.; Fahad, M.; Reinhorn, A.M.; Schiff, A. Modeling Combined Friction-Viscous Damping in Response of Hollow Core Composite Insulators. In Proceedings of the Structures Congress 2010, Orlando, FL, USA, 12–15 May 2010; pp. 2736–2747. [Google Scholar]
  16. Hong, R.; Bing, L.; Li, X.; Zongyuan, C.; Li, L. Development of ± 800kv Uhvdc Transmission Technology in China. In Proceedings of the 2008 International Conference on High Voltage Engineering and Application, Chongqing, China, 9–13 November 2008. [Google Scholar]
  17. Liang, X.; Bao, W.; Gao, Y. Decay-Like Fracture Mechanism of Silicone Rubber Composite Insulator. IEEE Trans. Dielectr. Electr. Insul. 2018, 25, 110–119. [Google Scholar] [CrossRef]
  18. Faliang, H.E. Development of Crimped Composite Post Insulator with Large Diameter Core Rod. Insul. Surge Arresters 2020, 2, 222–228. [Google Scholar]
  19. Safonov, A.; Gusev, M.; Saratov, A.; Konstantinov, A.; Sergeichev, I.; Konev, S.; Gusev, S.; Akhatov, I. Modeling of Cracking During Pultrusion of Large-Size Profiles. Compos. Struct. 2019, 235, 111801. [Google Scholar] [CrossRef]
  20. Volk, M.; Wong, J.; Arreguin, S.; Ermanni, P. Pultrusion of Large Thermoplastic Composite Profiles up to 40 Mm from Glass-Fibre/Pet Commingled Yarns. Compos. Part B Eng. 2021, 227, 109339. [Google Scholar] [CrossRef]
  21. Zhang, J.; Jiang, L.; Huang, Z.; Xu, X.; Wu, P.; Lei, H. Seismic Analysis under Sl-1 of New Structure Support Frame for Iter Pf Converter System. IEEE Trans. Plasma Sci. 2022, 50, 4355–4360. [Google Scholar] [CrossRef]
  22. Shiling, Z. Research on Operation Characteristics of Uhv Converter Valve Hall Based on Intelligent Image Processing and 3d Modeling Technology. J. Phys. Conf. Ser. 2021, 1871, 012135. [Google Scholar] [CrossRef]
  23. Yang, Z.; Xie, Q.; Zhou, Y.; Mosalam, K.M. Seismic Performance and Restraint System of Suspended 800 Kv Thyristor Valve. Eng. Struct. 2018, 169, 179–187. [Google Scholar] [CrossRef]
  24. Hasegawa, T.; Yamaji, K.; Irokawa, H.; Shirahama, H.; Tanaka, C.; Akabane, K. Development of a Thyristor Valve for Next Generation 500 Kv Hvdc Transmission Systems. IEEE Trans. Power Deliv. 1996, 11, 1783–1788. [Google Scholar] [CrossRef]
  25. Liang, H.; Qiang, X. System Vulnerability Analysis Simulation Model for Substation Subjected to Earthquakes. IEEE Trans. Power Deliv. 2021, 37, 2684–2692. [Google Scholar] [CrossRef]
  26. He, C.; Jiang, L.; Jiang, L. Seismic Failure Risk Assessment of Post Electrical Equipment on Supporting Structures. IEEE Trans. Power Deliv. 2023. [Google Scholar] [CrossRef]
  27. Wang, Z.D.; Zhang, M.; Yang, J.; Fang, S.Z.; Wang, W. Study on Bending Stiffness of Solid Post Composite Insulator. In Proceedings of the 2020 IEEE International Conference on High Voltage Engineering and Application (ICHVE), Beijing, China, 6–10 September 2020. [Google Scholar]
  28. Jawdhari, A.; Fam, A.; Kadhim, M.M. Thermal Bowing of Reinforced Concrete Sandwich Panels Using Time-Domain Coupled-Field Finite Element Analysis. Eng. Struct. 2021, 252, 113592. [Google Scholar] [CrossRef]
Figure 1. Flexible direct current converter valve in a project.
Buildings 13 01275 g001
Figure 2. Outline drawing of the insulator.
Buildings 13 01275 g002
Figure 3. Model of equivalent cantilever beam.
Buildings 13 01275 g003
Figure 4. Simplified finite element model: (a) single insulator (b) two insulator strings.
Buildings 13 01275 g004
Figure 5. Schematic drawing of flange.
Buildings 13 01275 g005
Figure 6. Local MPC constraint between flange and pressed position core rod.
Buildings 13 01275 g006
Figure 7. Static tensile test of insulator.
Buildings 13 01275 g007
Figure 8. Strain measuring points at the bottom of insulator rod.
Buildings 13 01275 g008
Figure 9. Stress–strain curves of 1# and 2# insulator rod.
Buildings 13 01275 g009
Figure 10. The mandrel under a horizontal tension of 4.5 KN.
Buildings 13 01275 g010
Figure 11. Stress comparisons in the bottom of the core rod with different horizontal tension.
Buildings 13 01275 g011
Figure 12. Dynamic performance test.
Buildings 13 01275 g012
Figure 13. Schematic drawing of test point.
Buildings 13 01275 g013
Figure 14. The first order frequency: (a) single insulator; (b) two insulators in series.
Buildings 13 01275 g014
Figure 15. The second-order frequency: (a) single insulator; (b) two insulators in series.
Buildings 13 01275 g015
Figure 16. (a) Max. horizontal displacement: (b) max. stress of the insulator.
Buildings 13 01275 g016
Figure 17. Max. horizontal displacement of the insulator: (a) single insulator; (b) two insulators in series.
Buildings 13 01275 g017
Figure 18. Max. stress of the insulator: (a) single insulator; (b) two insulators in series.
Buildings 13 01275 g018
Table 1. Main material parameter “Reprinted/adapted with permission from Ref. [27]. 2020, Wang, Z”.
MaterialElastic Modulus/GPaDensity/(kg·m−3)Poisson Ratio
Mandrel45.521500.21
Flange14078500.30
Table 2. Results comparison in different modeling methods.
ModelThe First-Order Natural Frequency/HzSecond-Order Natural Frequency/Hz
Theoretical calculation of single insulator12.5078.50
Model of single insulator12.5087.90
Theoretical calculation of two insulators3.2020.00
Model of two insulators3.2619.69
Table 3. Strain test point and force test point.
Measure PointPositionDirectionChannel
S2X-W1# insulator bottom west side X direction90°1
S2X-E1# insulator bottom east side X direction90°2
S3X-W2# insulator bottom west side X direction90°3
S3X-E2# insulator bottom east side X direction90°4
Forceguy ropehorizon5
Table 4. Elastic modulus and Poisson’s ratio of 1# and 2# insulator rod.
Loading Times1# Insulator2# Insulator
Elastic Modulus/GPaPoisson’s RatioElastic Modulus/GPaPoisson’s Ratio
147.2340.20845.5840.210
247.3350.20845.4580.210
347.2680.21245.4060.208
447.2740.21145.3990.211
average47.2780.21045.4620.212
Table 5. Dynamic performance test condition of insulators 1# and 2#.
ConditionIncoming WaveAmplitudeFrequency Range DurationHorizontal Direction
1-X\Ywhite noise0.1 g1–100 Hz
180 s
X\Y
2-X\Y0.2 g
3-X\Y0.3 g
4-X\Y0.4 g
Table 6. Dynamic performance test condition of two insulators in series.
ConditionIncoming WaveAmplitudeFrequency Range DurationHorizontal Direction
5-X\Y\Zwhite noise0.1 g1–100 Hz
180 s
X\Y\Z
6-X\Y\Z0.2 g
Table 7. Comparison of simulation analysis and shaking table test in two types of insulators.
The First-Order Natural Frequency/HzSecond-Order Natural Frequency/Hz
Single insulatorsimulation12.5087.90
experiment12.20/
deviation/%2.50/
Two insulators in seriessimulation3.2619.69
experiment3.2319.30
deviation/%1.02.0
Disclaimer/Publisher’s Note: The statements, opinions and data contained in all publications are solely those of the individual author(s) and contributor(s) and not of MDPI and/or the editor(s). MDPI and/or the editor(s) disclaim responsibility for any injury to people or property resulting from any ideas, methods, instructions or products referred to in the content.

