1. Introduction
The world business is currently facing what may be described as a “perfect storm”—a combination of challenges with unusual results. The ongoing global pandemic has slowed down the global economy and forced many companies to shut their doors, while employees are adapting to remote work. Natural resources are becoming increasingly scarce, resulting in changes to the process of transforming inputs into outputs in a sustainable manner. Inflation has led to a decrease in population incomes, and war has disrupted business stability, particularly in terms of raw material prices (e.g., metals, oil, gas) [
1,
2].
In these conditions, traditional management principles may not be sufficient to address the challenges faced by organizations. Strategies need to adapt to market trends, and changed management tactics must be applied to navigate these complexities [
3]. The projects they develop should analyse the goals and objectives, and they should plan all the activities according to their capabilities and the business environment in which they perform.
The construction industry, which represents 13% of the global GDP and is the second most important sector after Financial Services [
4], is expected to grow from 10.5 trillion USD in 2020 to 15.2 trillion USD in 2030 [
5]. This growth is driven by the high degree of urbanization in emerging countries and the need of residential buildings and infrastructure.
However, many construction projects fail to achieve their outcomes due to poor planning and resource allocation, resulting in cost and time overruns, poor quality, safety issues, and other challenges. Accurate planning is particularly challenging in the construction industry as most activities need to be carried out on site and not remotely [
6].
According to the Theory of Constraints [
7], a system needs to consider all the limits that can impact its functions. Applied to project management, a project has three main elements that trigger its performance: scope, time, and budget. If one of these constraints does not work as planned, it can create imbalances of the other two, leading to negative consequences on the project’s key performance indicators (KPIs) [
8,
9]. As constraints are factors that can jeopardize the performance of a project, they need to be managed in the early stages [
10]. The human resources of the organization, who deliver the products/services, are at the core of all three constraints.
Time is one of the most critical constraints in construction projects, as delays can have adverse effects on cost, scope, and/or quality. Statistics indicate that, in 2021, 84% of projects exceeded their budgets, and 72% took longer than expected to complete [
11].
The role of the project manager is crucial in assessing and monitoring the timeline, as accurate control can prevent delays or even accelerate the task’s completion. This requires continuous checking of whether the Work Breakdown Structure (WBS) is being executed as planned, as any errors can impact the project’s budget.
There are various methods for calculating activity durations and creating timelines for construction projects, such as Gantt Chart, Flowline, Critical Path, PERT, and others. Each of these methods uses industry norms, including the productive and non-productive time required to perform a task.
Based on the Theory of Constraints, Goldratt introduced the Critical Chain Project Management method (CCPM) [
12], which assumes that human resources represent a constraint, and therefore, management should focus on people to achieve project goals.
Goldratt argues that a person’s behaviour is influenced by two aspects: they will begin a task as late as possible (Student’s Syndrome), and if they are able to finish the task earlier, they will fill the spare time with useless actions till the end of the planned period (Parkinson Law) [
13].
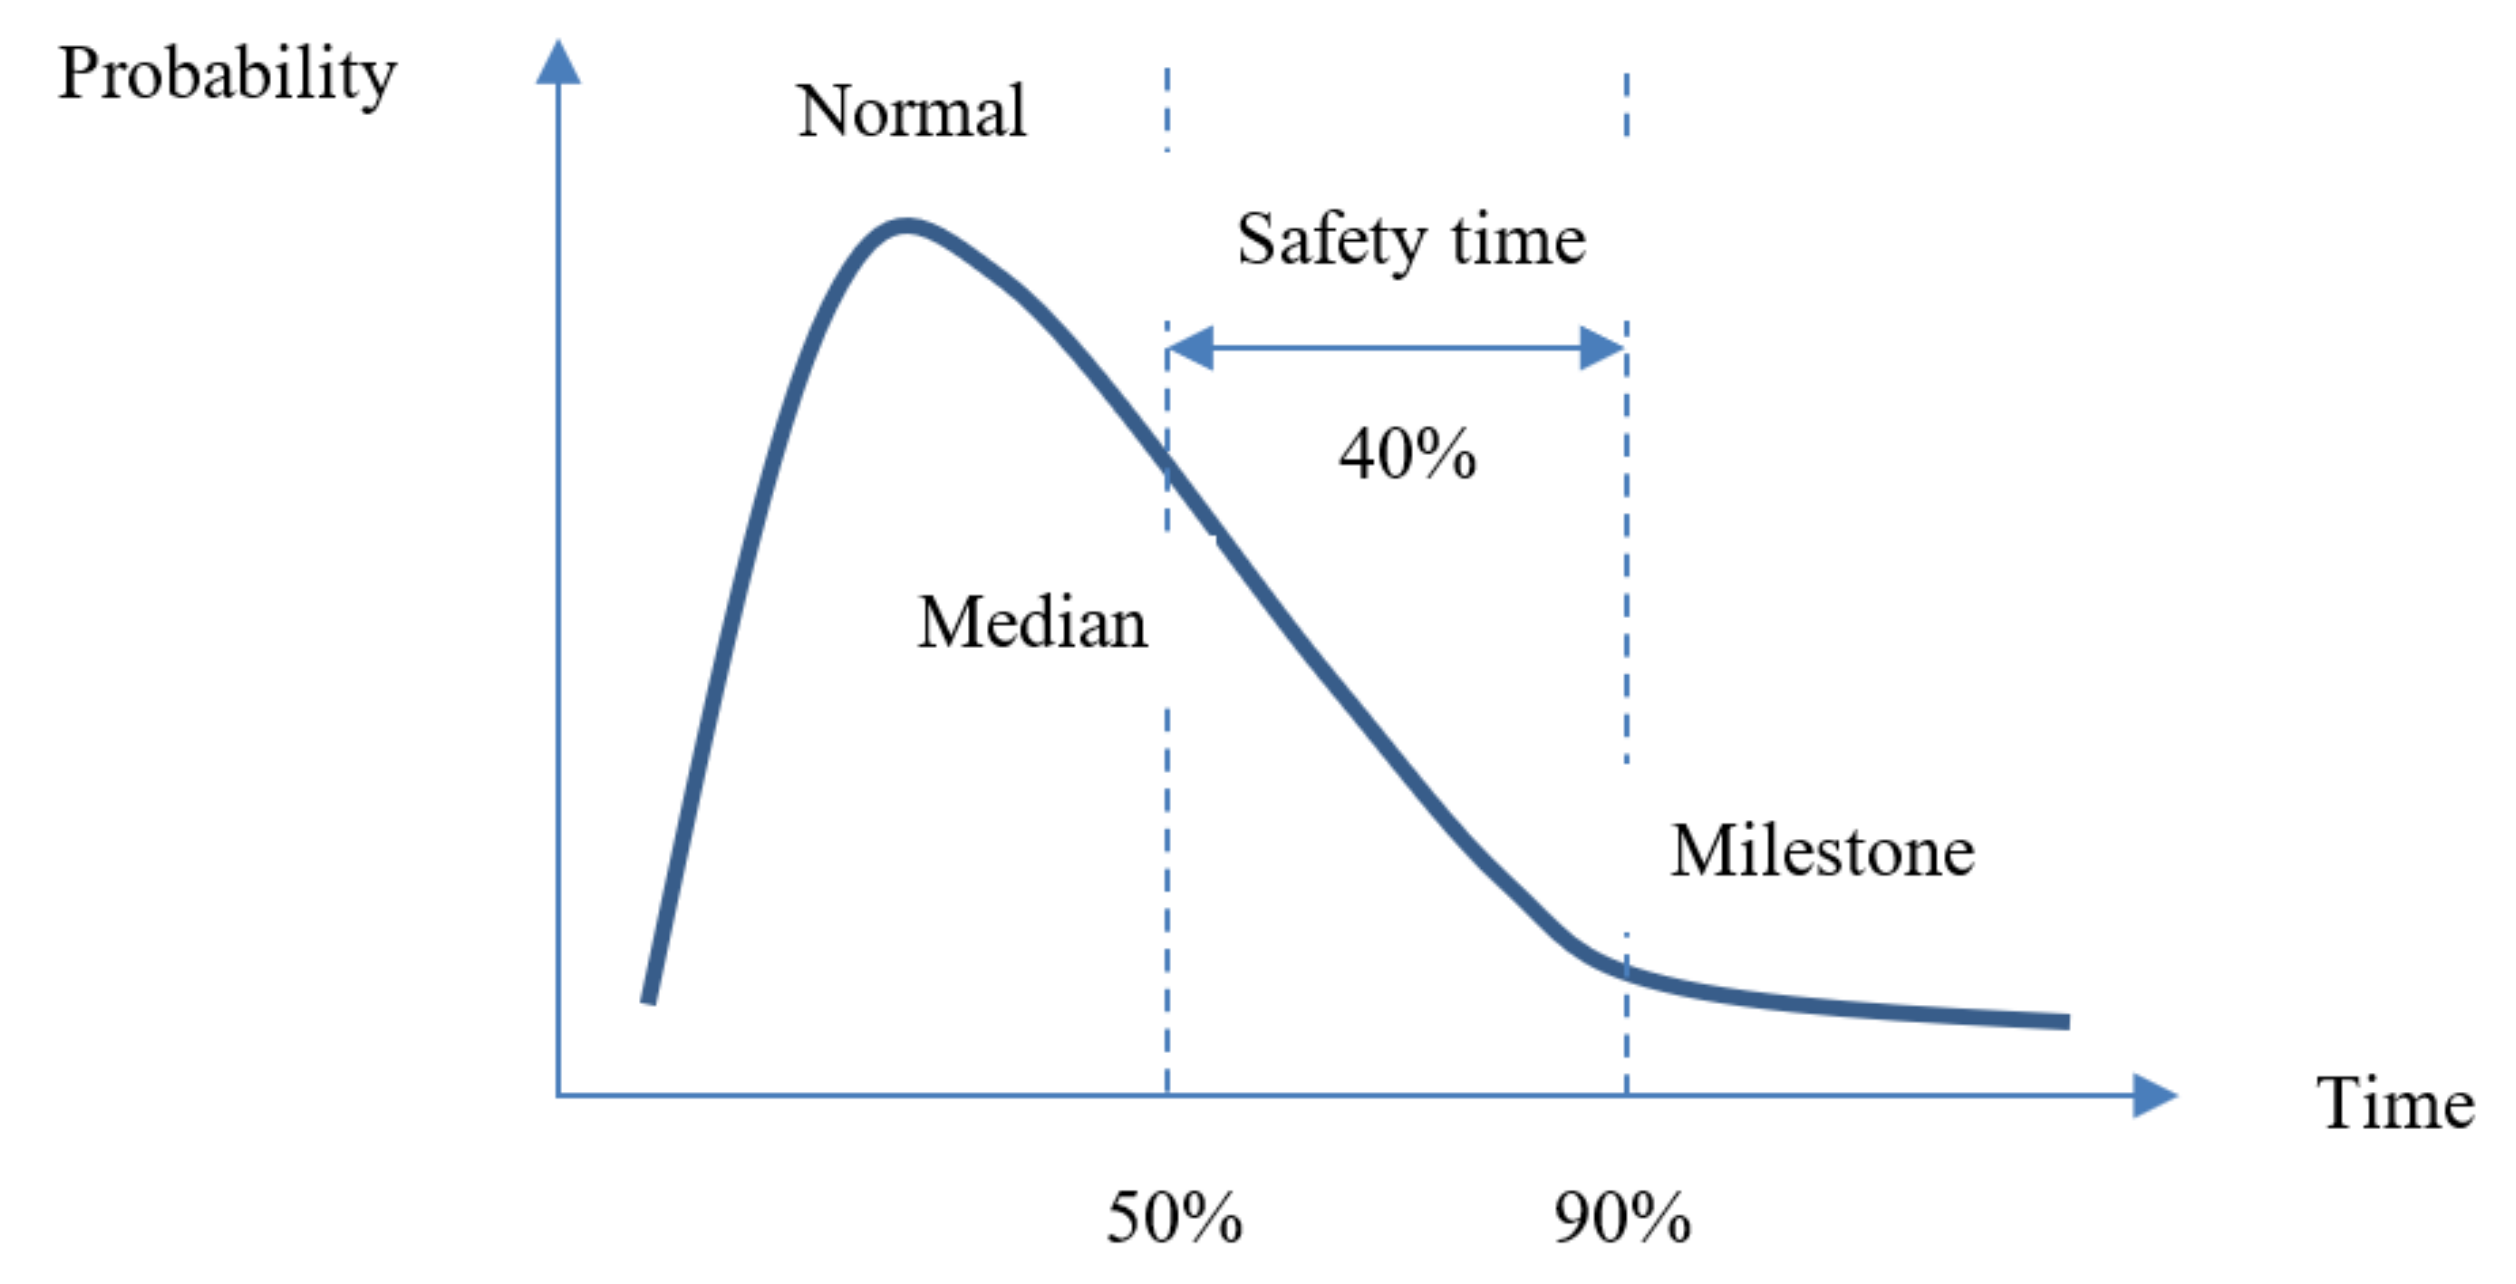
The Beta Distribution indicates that there is a high probability (−1σ ÷ +1σ) of completing a task in half of the calculated time (50%) based on the initial formula, which includes possible events that may delay the execution. Planners use these estimations as safe measures to mitigate uncertainty during the project’s development. Goldratt iterates that, based on Beta Distribution, there is a 50% chance (optimistic estimation) of finishing a task earlier than the timeline (pessimistic estimation 90%) calculated with the CPM method [
12], such as in
Figure 1.
By implementing Critical Chain Project Management (CCPM) in construction projects, tasks’ durations will be cut in half, and the float (reserve) will be placed at the end of the schedule as a buffer to protect the schedule against delays in performing the tasks with reduced duration and also to aggregate time savings if it can be implemented.
The project manager continuously monitors the progress of each activity and can allocate additional time from the project’s buffer if needed, resulting in an estimated 20–35% time savings according to statistics [
14].
The preference for traditional methods over innovative ones in construction management is a challenging question to answer, as practitioners in the field are often resistant to change [
15]. Consequently, there has been limited progress in the execution stage of construction projects in the last 20 years. Researchers have a vital role in presenting the results of their studies to promote the adoption of modern technologies in the construction industry.
Research Purpose
The purpose of this paper is to propose a method for improving the timeline of a construction project by applying CCPM, with a comparison made between a traditional schedule (CPM) and CCPM for the execution of three blocks of flats (residential).
The results indicate that using CCPM can result in about 20% time savings in the schedule. It is important to note that the time savings may vary for different tasks, as the case study reveals that each activity has its own spare time depending on the resources involved.
The reduction of the schedule can also serve as a negotiating advantage between the owner and the contractor, particularly in rental properties, where timely completion is crucial for the owner’s benefit.
2. Literature Review
Delays in construction projects have significant impacts on a company’s revenues and credibility in the market, as the customers often rely on references and a portfolio when choosing a contractor. Reputational damage takes considerable time to repair [
16].
The relationship between time and money in construction projects is interdependent. Baldwin and Bordoli argue that in developed countries, construction projects often fail to meet budget and schedule due to poor planning, with one of the main reasons being the lack of modern software and technologies to replace human errors. Additionally, resistance to investing in research and development poses a significant challenge [
17].
A study conducted by McKinsey revealed that meeting the planned schedule of a construction project can be a big challenge, as most activities are still performed manually. Furthermore, the construction industry faces a shortage of skilled workers, making it imperative to adopt innovative methods for time management. To survive in this competitive sector, 80% of respondents believe that effective changes have to be implemented, including strategies for cost and time [
18].
A research study targeting Malaysia, conducted by Viles et al. revealed that there are over 1.000 causes for delays in construction projects, with 80% of them attributed to dysfunctions in the execution phase, particularly related to labour planning and monitoring, such as poor construction management, construction errors, or lack of personnel experience [
19].
Oso et al. investigated the causes of project delays and identified poor management and communication as the key issues. To prevent time overruns, they recommended continuous monitoring of the project from the initial stages to the end, and the implementation of methods to improve workers’ performance [
20].
Lessing et al. argue that delays in the project execution can have a significant impact on the performance of the project in terms of the Iron Triangle elements, which include scope, budget, time, and quality. Therefore, effective scheduling and continuous monitoring by project managers are essential for the project’s success [
21].
Majumder et al. conducted an analysis on the importance of planning in construction projects. Based on their review of the literature, they assert that scheduling and controlling are crucial for achieving a project’s success. Skilled workers are a critical resource in determining KPIs of the project, and thus, the timeline planning should be adapted to the type and magnitude of the project [
22].
Abuhantash et al. conducted an analysis on the importance of the human factor in project management and argued that despite the type and quantity of resources in a project, humans are the main drivers of project failure or success [
23].
Leach highlighted the advantages of planning using CCPM as a suitable method for reducing the overall duration of a project. According to Leach, permanent control is mandatory in CCPM as it can identify delays in critical activities and provide extra time from the buffer because if a critical task is delayed, all the following ones along the critical path are affected. CCPM has positive effects on various aspects of the project, including reducing the timeline and the budget, increasing worker productivity by eliminating multitasking, and improving the project’s KPIs [
24].
Yaghootkar et al. explained the consequences of time pressure in a project. If the planned schedule is delayed, additional resources, such as money, workers, and changing technologies, may be needed to bring the project back on track. This not only affects project results, but also impacts the credibility of the organization in front of the stakeholders [
25].
Determining the size of the buffer in CCPM has been a constant concern among researchers, with numerous studies focusing on this dilemma [
26,
27,
28]. There is not a single answer to this question, as it depends on the type of the project, ongoing monitoring, and control. Zohrehvandi et al. developed a method for sizing the buffers using Fuzzy algorithms [
29].
As evident from the literature, researchers are focused on identifying the causes of delays in construction projects and their impacts on the project outcomes. Conversely, if the project’s timeline can be shortened, it can have positive effects on the company’s profitability.
The major features of a contract between the owner and the contractor are time and budget, and if a contractor can shorten the schedule, the owner may be willing to pay extra. Therefore, by implementing CCPM, the project can benefit from time savings and increased profitability.
3. Methods and Materials
Time is a critical constraint in a construction project, and calculating the total duration involves computing the duration of each activity in the Work Breakdown Structure (WBS) and determining the critical path.
Critical Chain Project Management (CCPM) is a scheduling method suitable for various manufacturing and service sectors. Studies have shown that CCPM can result in time savings up to 39%, a 70% success rate in delivering projects within the planned timeline, and an over 50% increase in throughput [
30].
In traditional Critical Path Method (CPM), critical tasks have no free float, and project managers may allocate extra time for them to protect the project against uncertainty [
31,
32,
33].
However, CCPM takes a different approach by considering human resources as critical, and the planner focuses on managing their tasks based on both predecessors and their productivity. This means that the timeline scheduled with constraints on human resources, as opposed to just the tasks, like in CPM, makes CCPM more effective in environments where teams are specialized and can work without interruptions, using the same tools, using the same resources, and performing the same task. According to Goldratt, CCPM is efficient only for teams that are performing the same activity without multitasking because without interruption, this type of planning can make an economy of time. A specialized team will move from one front to another with the same tools, using the same resources, and performing the same job.
The aim of this study is to highlight the time savings of the project by using CCPM method for executing the finishing activities in three identical blocks. Unlike CPM, which focuses solely on the duration of the critical tasks, CCPM takes into consideration the structure and composition of the norm, making it a valuable method for optimizing the project’s timeline while considering the workforce constraints.
3.1. Data Collection
To evaluate the feasibility of the proposed method in the civil engineering industry, we conducted an experimental study on a construction project in Romania. The project involved implementing CCPM for scheduling the finishes of three identical blocks, each with four levels.
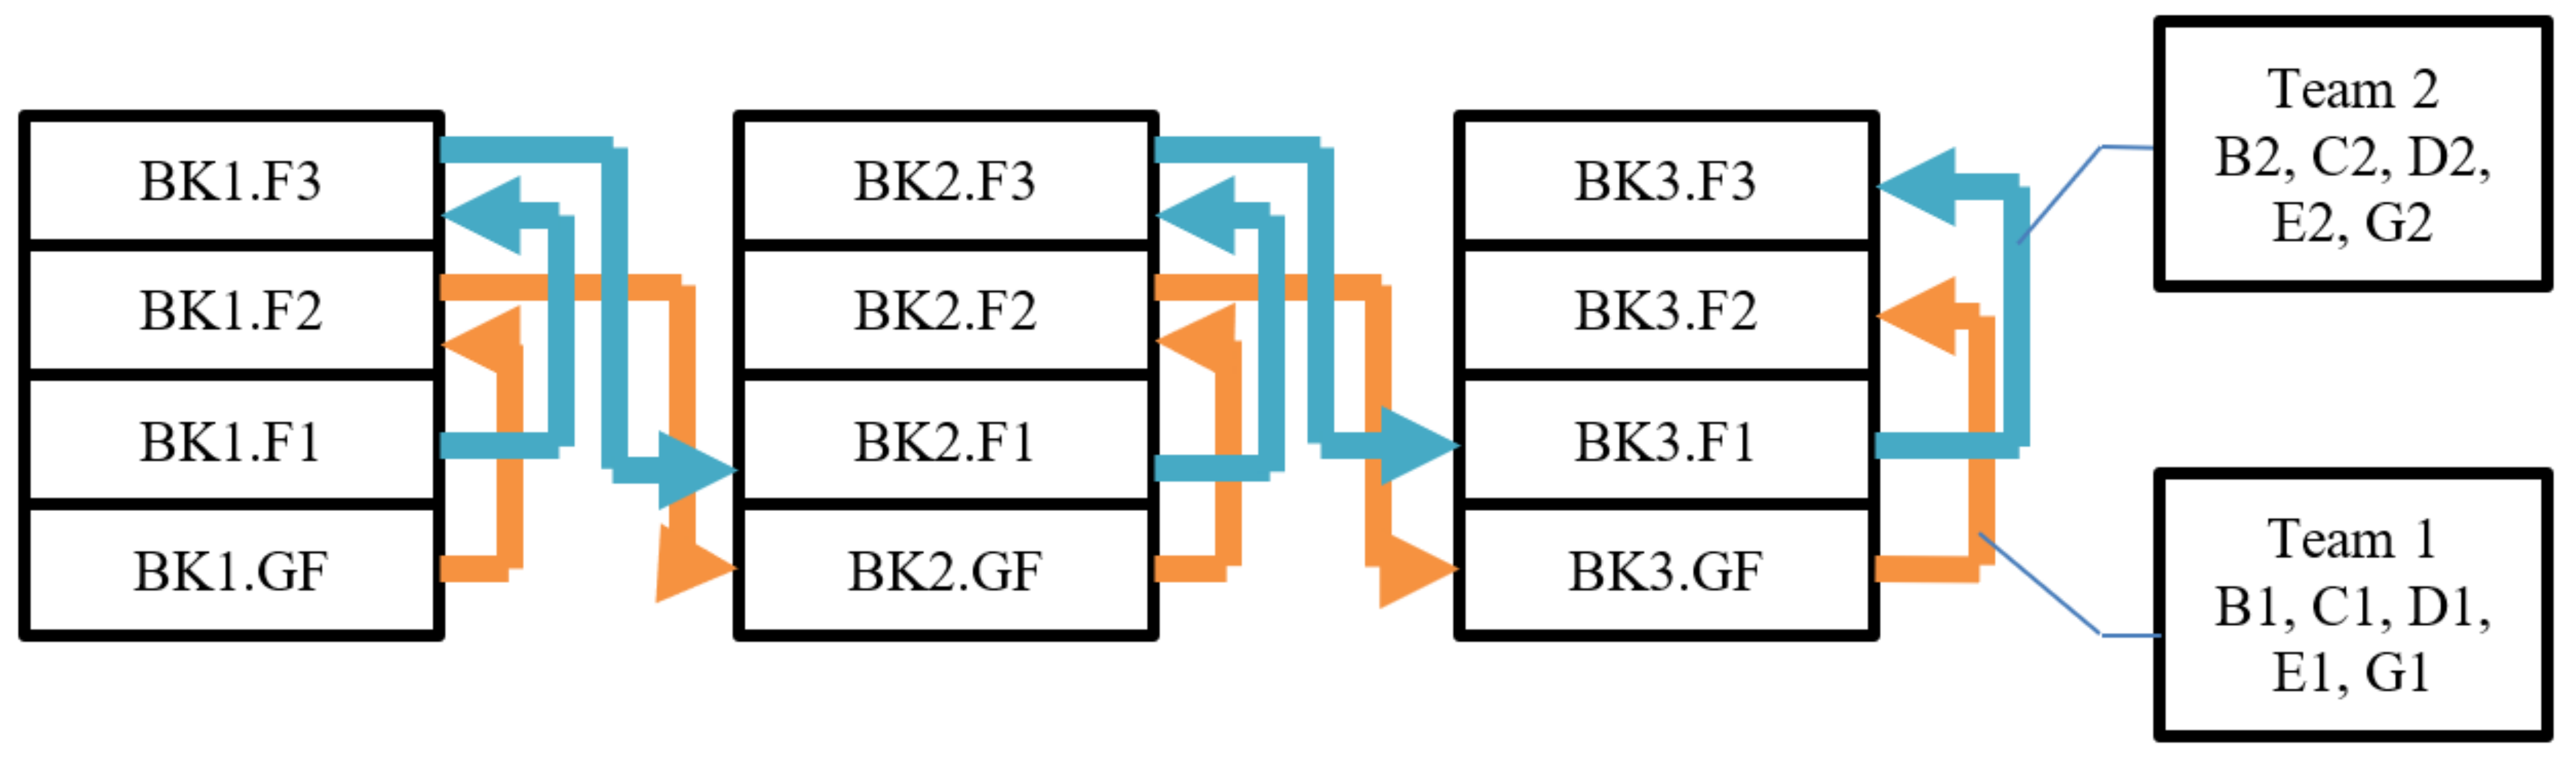
To expedite the project execution, the work front was divided into two sectors, with each sector assigned a specialized team to carry out the activities. The first team worked on the even floors (ground floor GF, second floor F
2,) while the second team worked on the odd floors (first floor F
1, third floor F
3,), such as in
Figure 2. The works were planned with CPM, and the execution was performed using CCPM.
This approach aimed to optimize the project timeline by leveraging the benefits of CCPM, such as reducing multitasking and improving resource allocation, in the context of civil engineering construction projects.
As per the Romanian norms, regulations for the construction projects have recommended resource requirements, including materials, workforce, and technology. The duration of a task was calculated using the formula:
where:
- -
Q represented the quantity of work from the quantity take-off.
- -
TN was the team norm, which was measured in hours and was based on the Norm Indicators for a specific process. If the Indicator did not provide this data, the manager calculated local norms.
- -
Q × TN represented the total amount of work to be performed by a specialized team for a particular task.
- -
The number of daily hours was assumed to be 8 h per working day.
- -
The number of workers was the recommended number of workers in a specialized team.
The team norm consisted of two parts: productive activity, which was effective time spent on performing the task, and non-productive activity, which included preparation time, personal needs, dependencies on predecessor tasks, adverse weather conditions on site, and other factors.
The norm served as an average duration for completing a task considering both productive and non-productive activities.
It is important to state that the norms are utilized to estimate the duration of all activities in the Work Breakdown Structure (WBS). Estimation is a crucial step in the planning phase of the project, often employed during a bidding process to secure contracts. Since these estimates are made well in advance of the project start date, planners tend to take the worst scenario, with inflated durations, based on the norms.
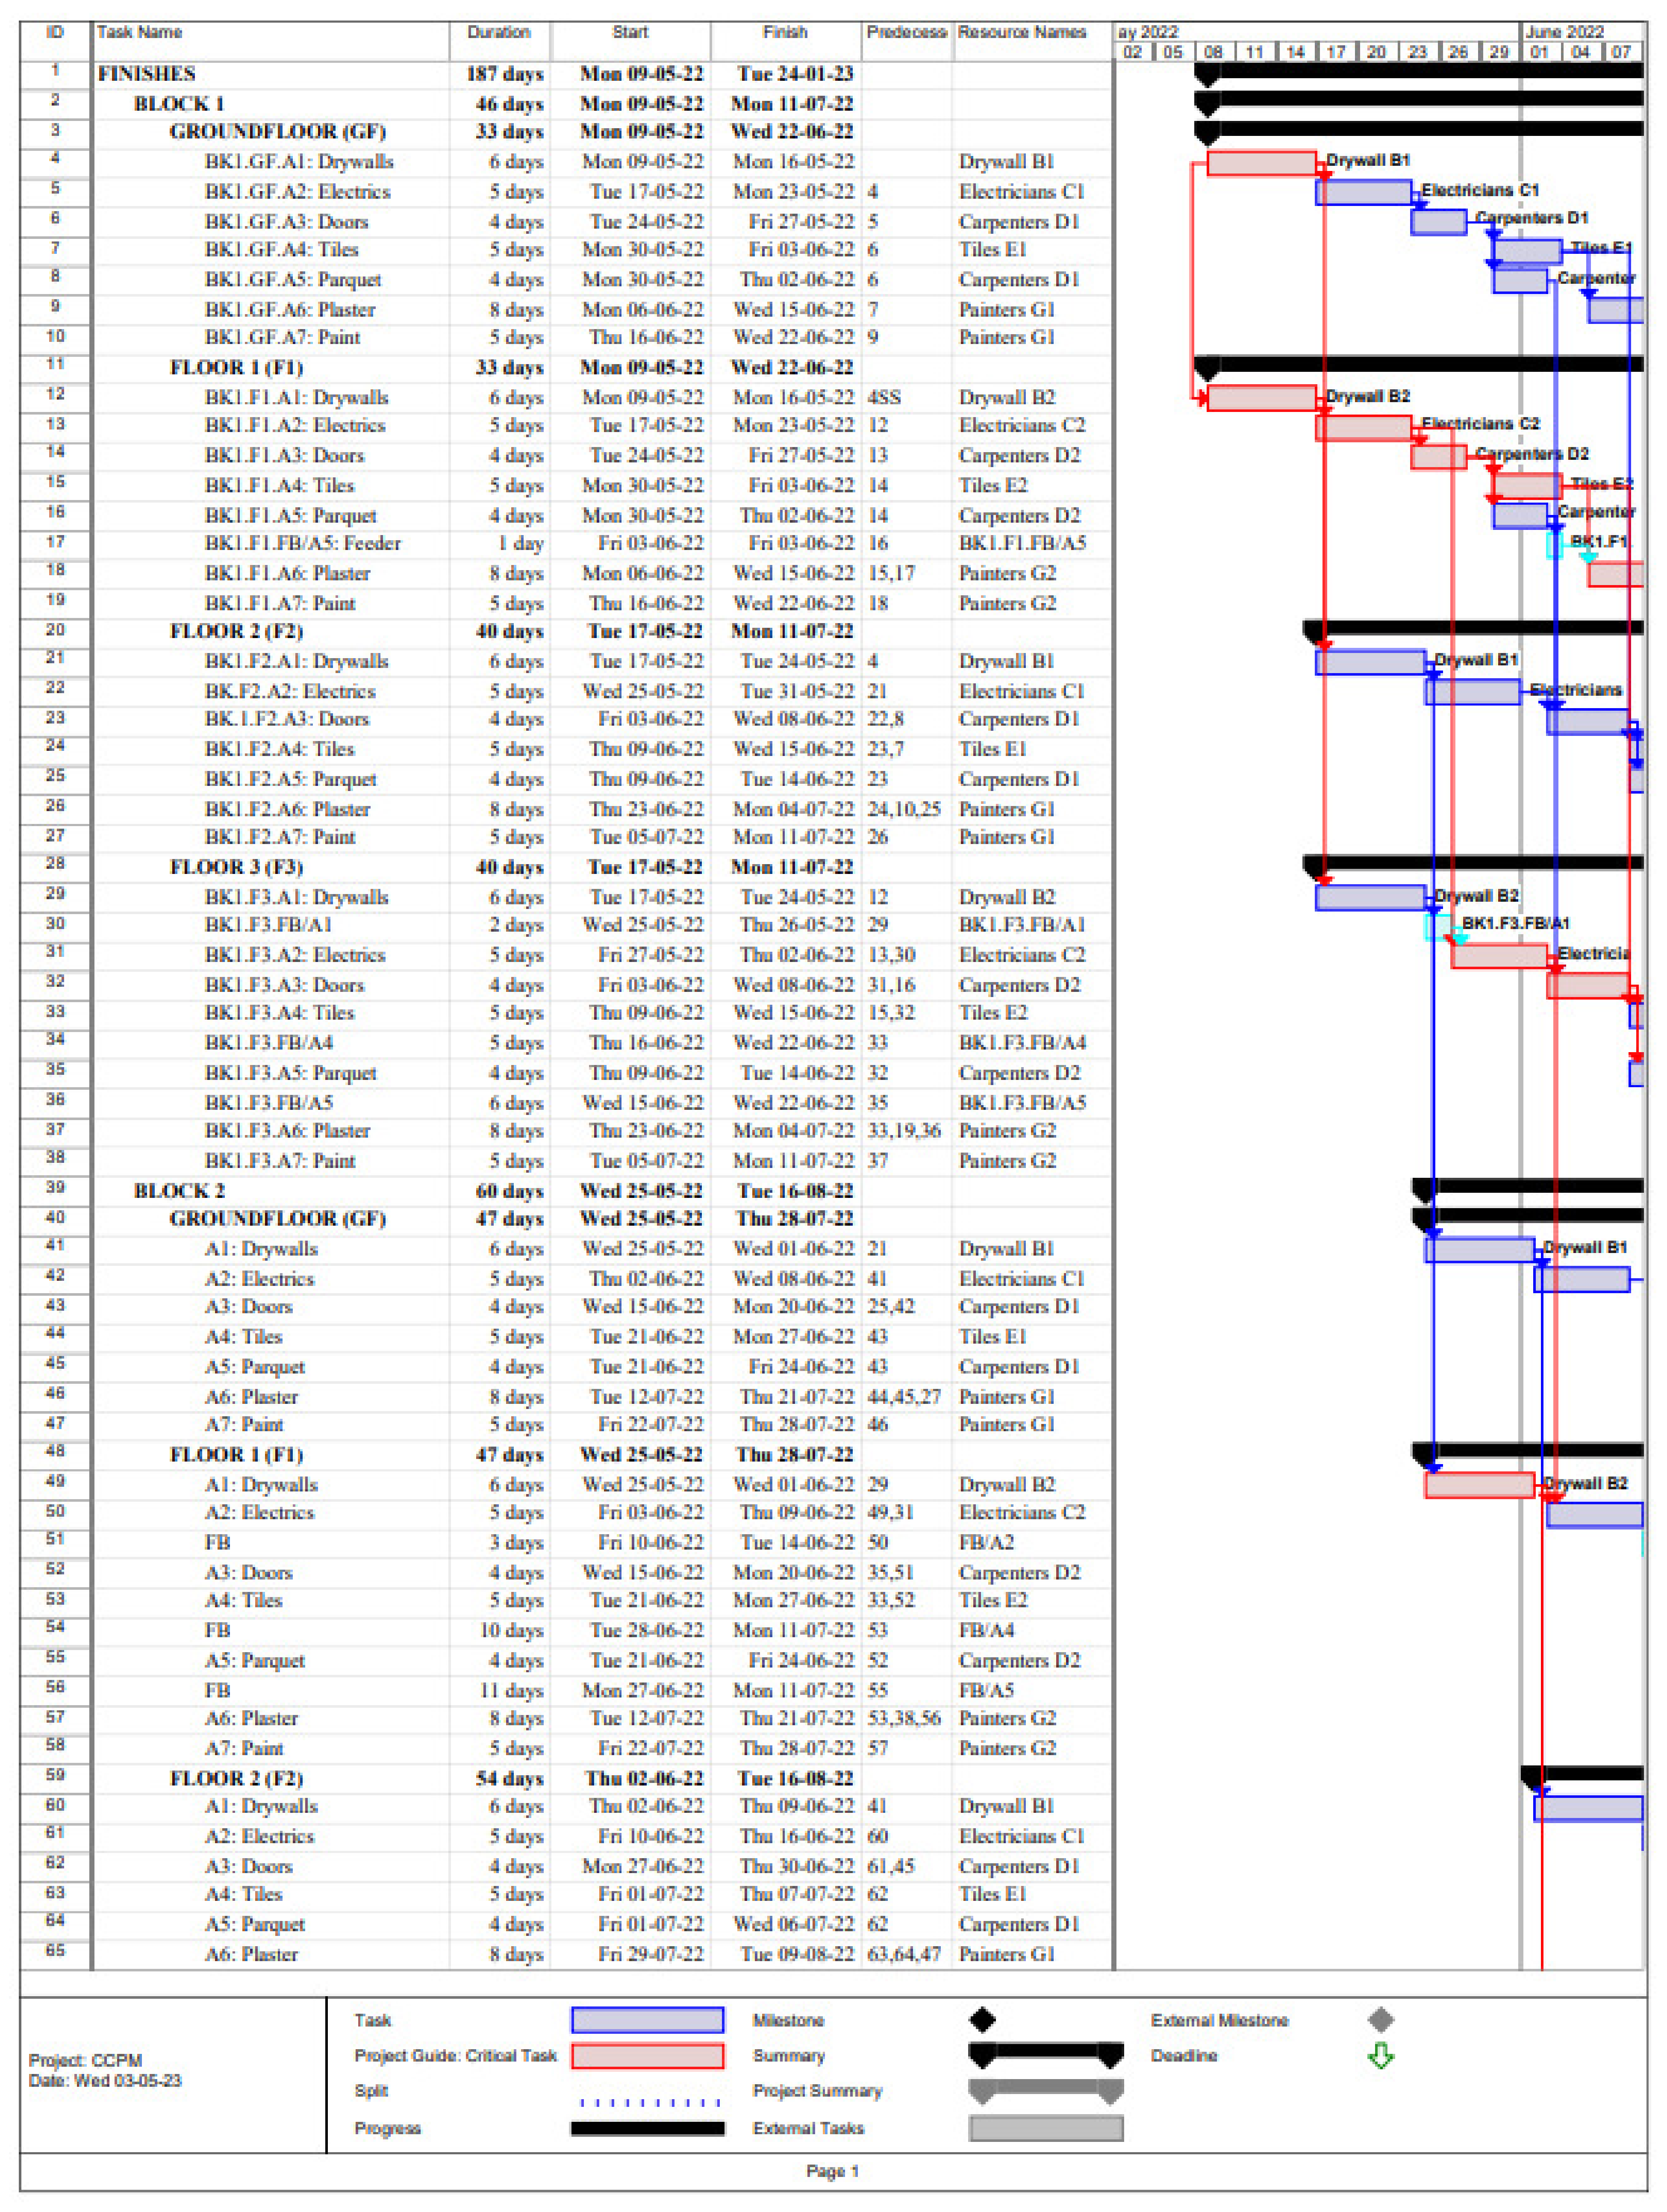
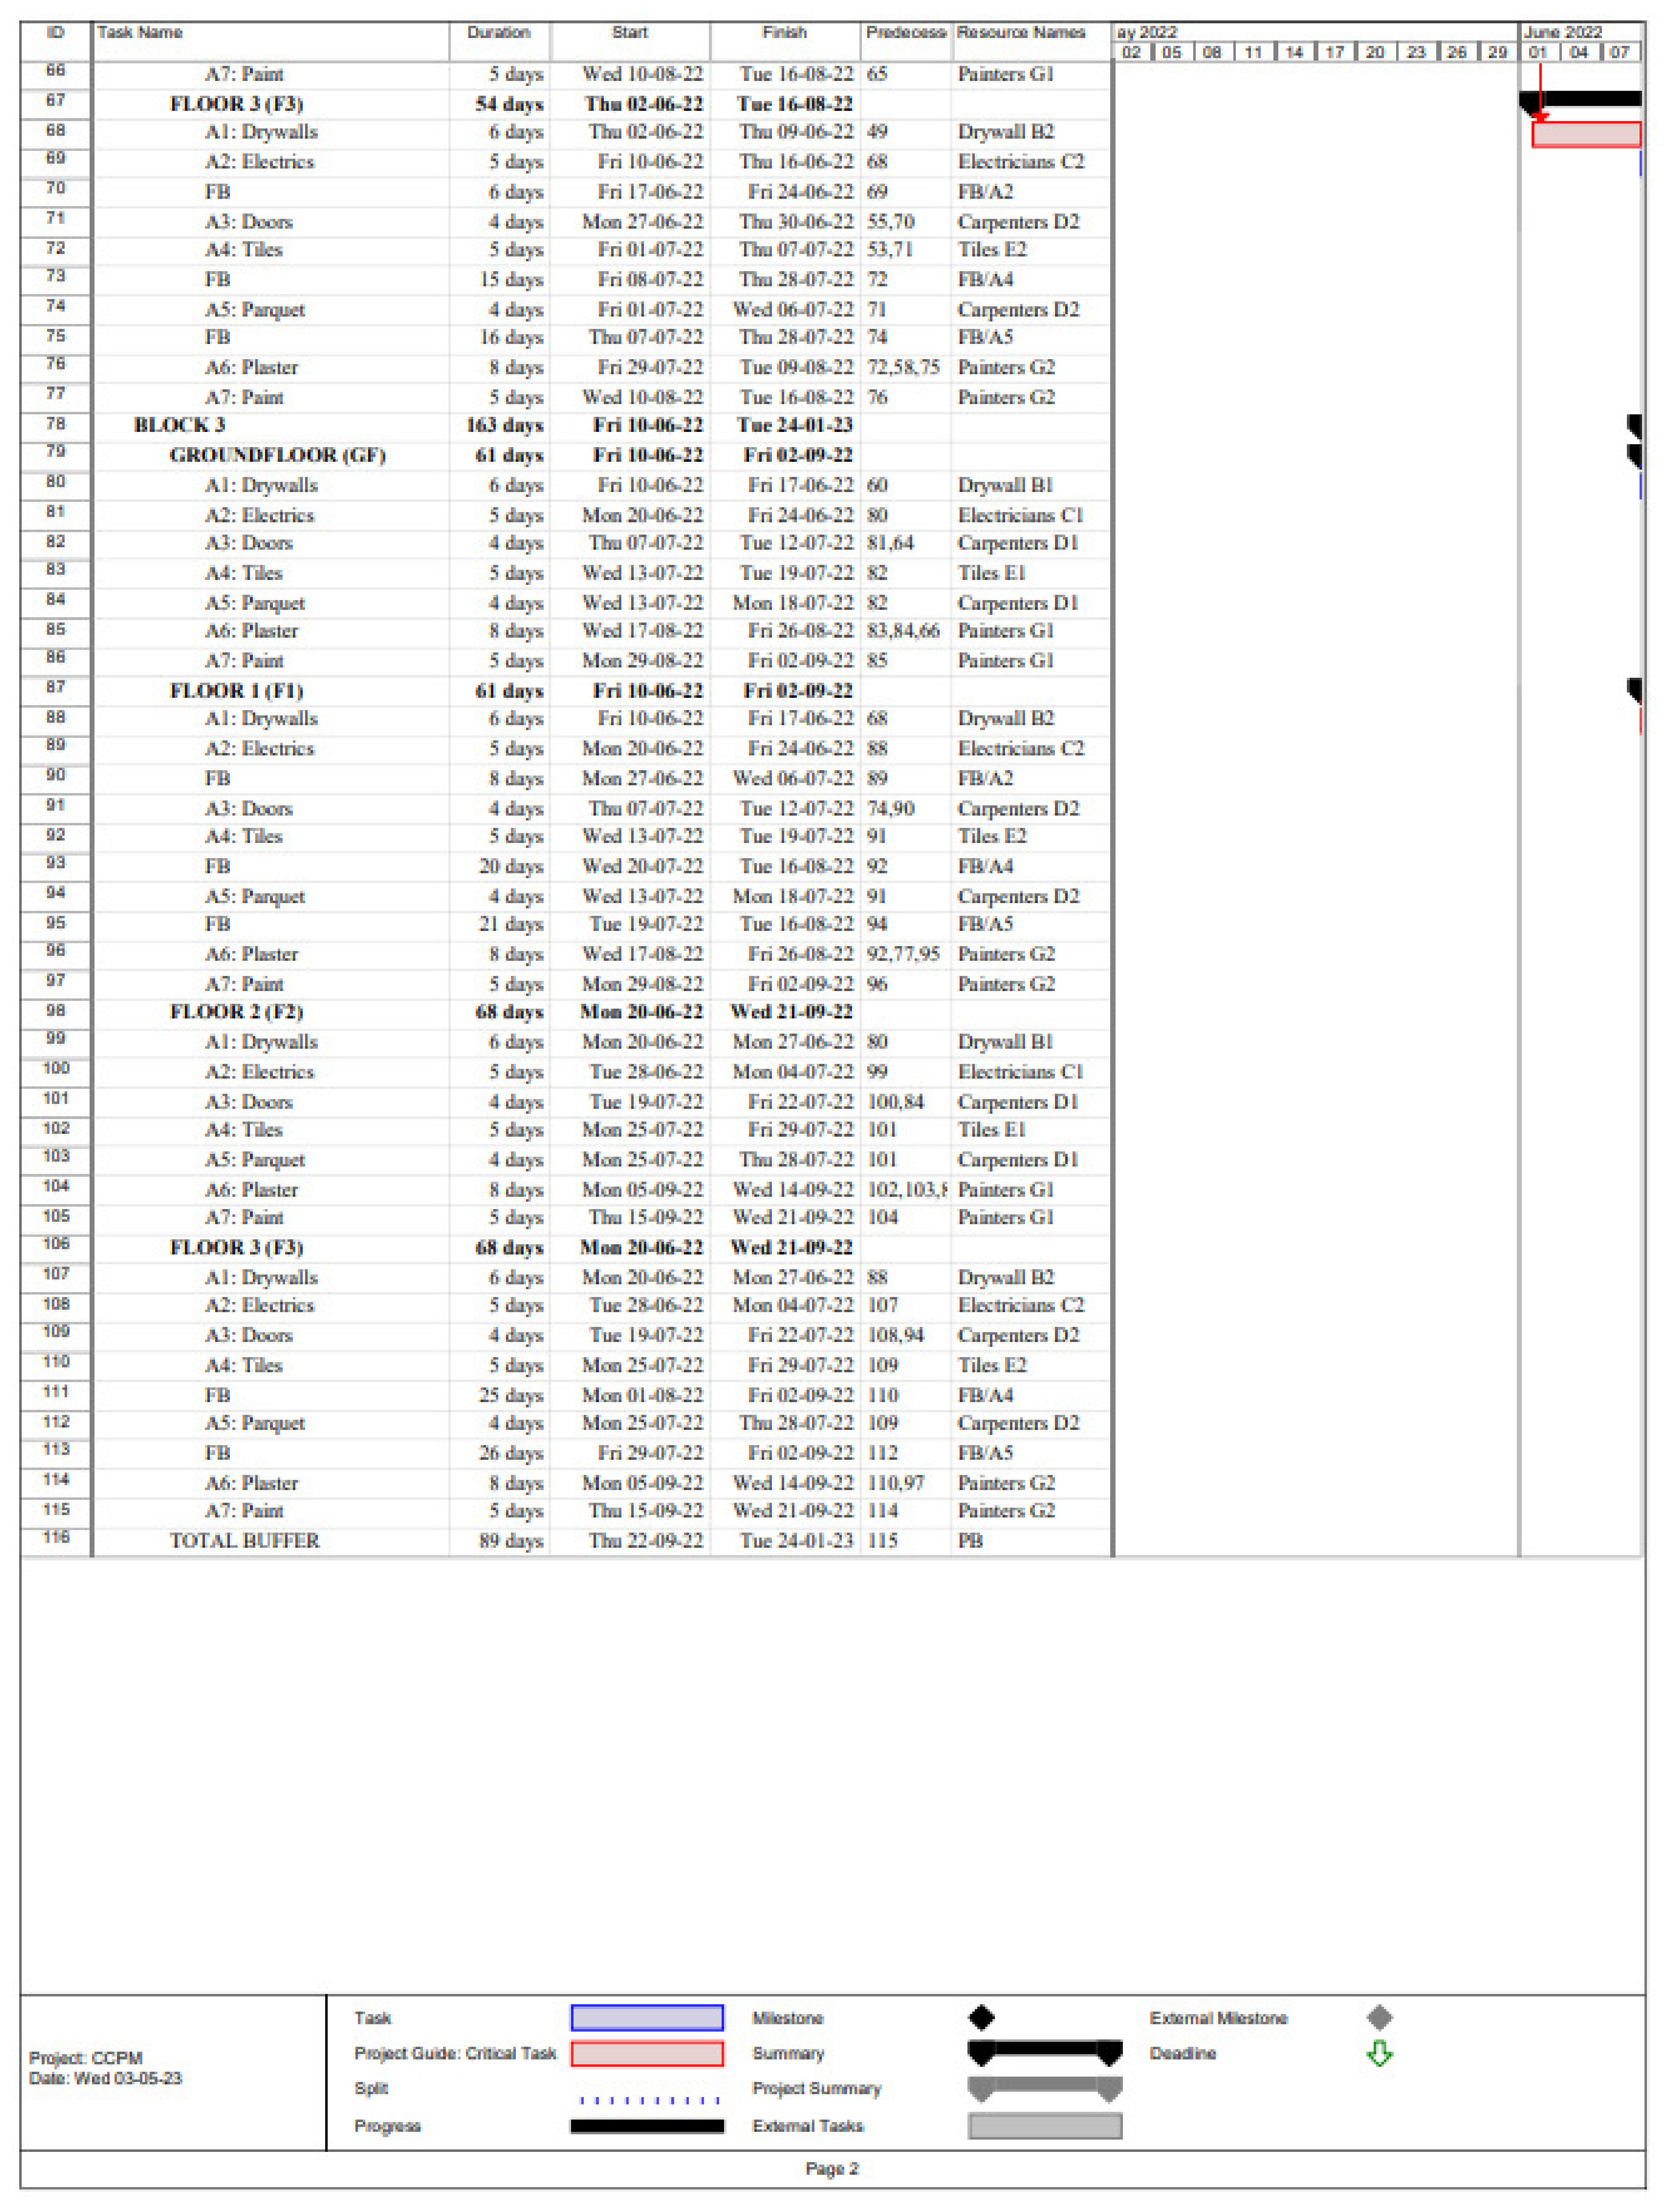
In our case study, we calculated the average time for each task using PERT (Program Evaluation Review Technique) method. We then determined the logical sequence for delivering the project, which involved constructing three identical residential buildings (BK1, BK2, BK3), with four levels each (GF, F1, F2, F3). The duration of the tasks is presented in
Table 1 and are identical for every block and floor, as the quantities are similar, and the work is performed by specialized teams with the same number of workers.
E.g., Task A6: Plastering (Team G1—Painters):
where:
a is the most optimistic time (everything goes perfectly): 10 days.
m is the most likely time: 16 days
b is the most pessimistic time (everything goes wrong): 18 days
PERT is an appropriate method for calculating task durations, as it takes into account a median value between the most optimistic and the most pessimistic scenario. This approach considers the risks identified by the planner in previous projects, including their potential effects.
By using PERT, planners can arrive at a more realistic estimate that accounts for both best-case and worst-case scenarios, taking into consideration potential risks and uncertainties. This helps in developing a more robust project schedule that can better account for potential delays and mitigate risks during the execution phase of the construction project.
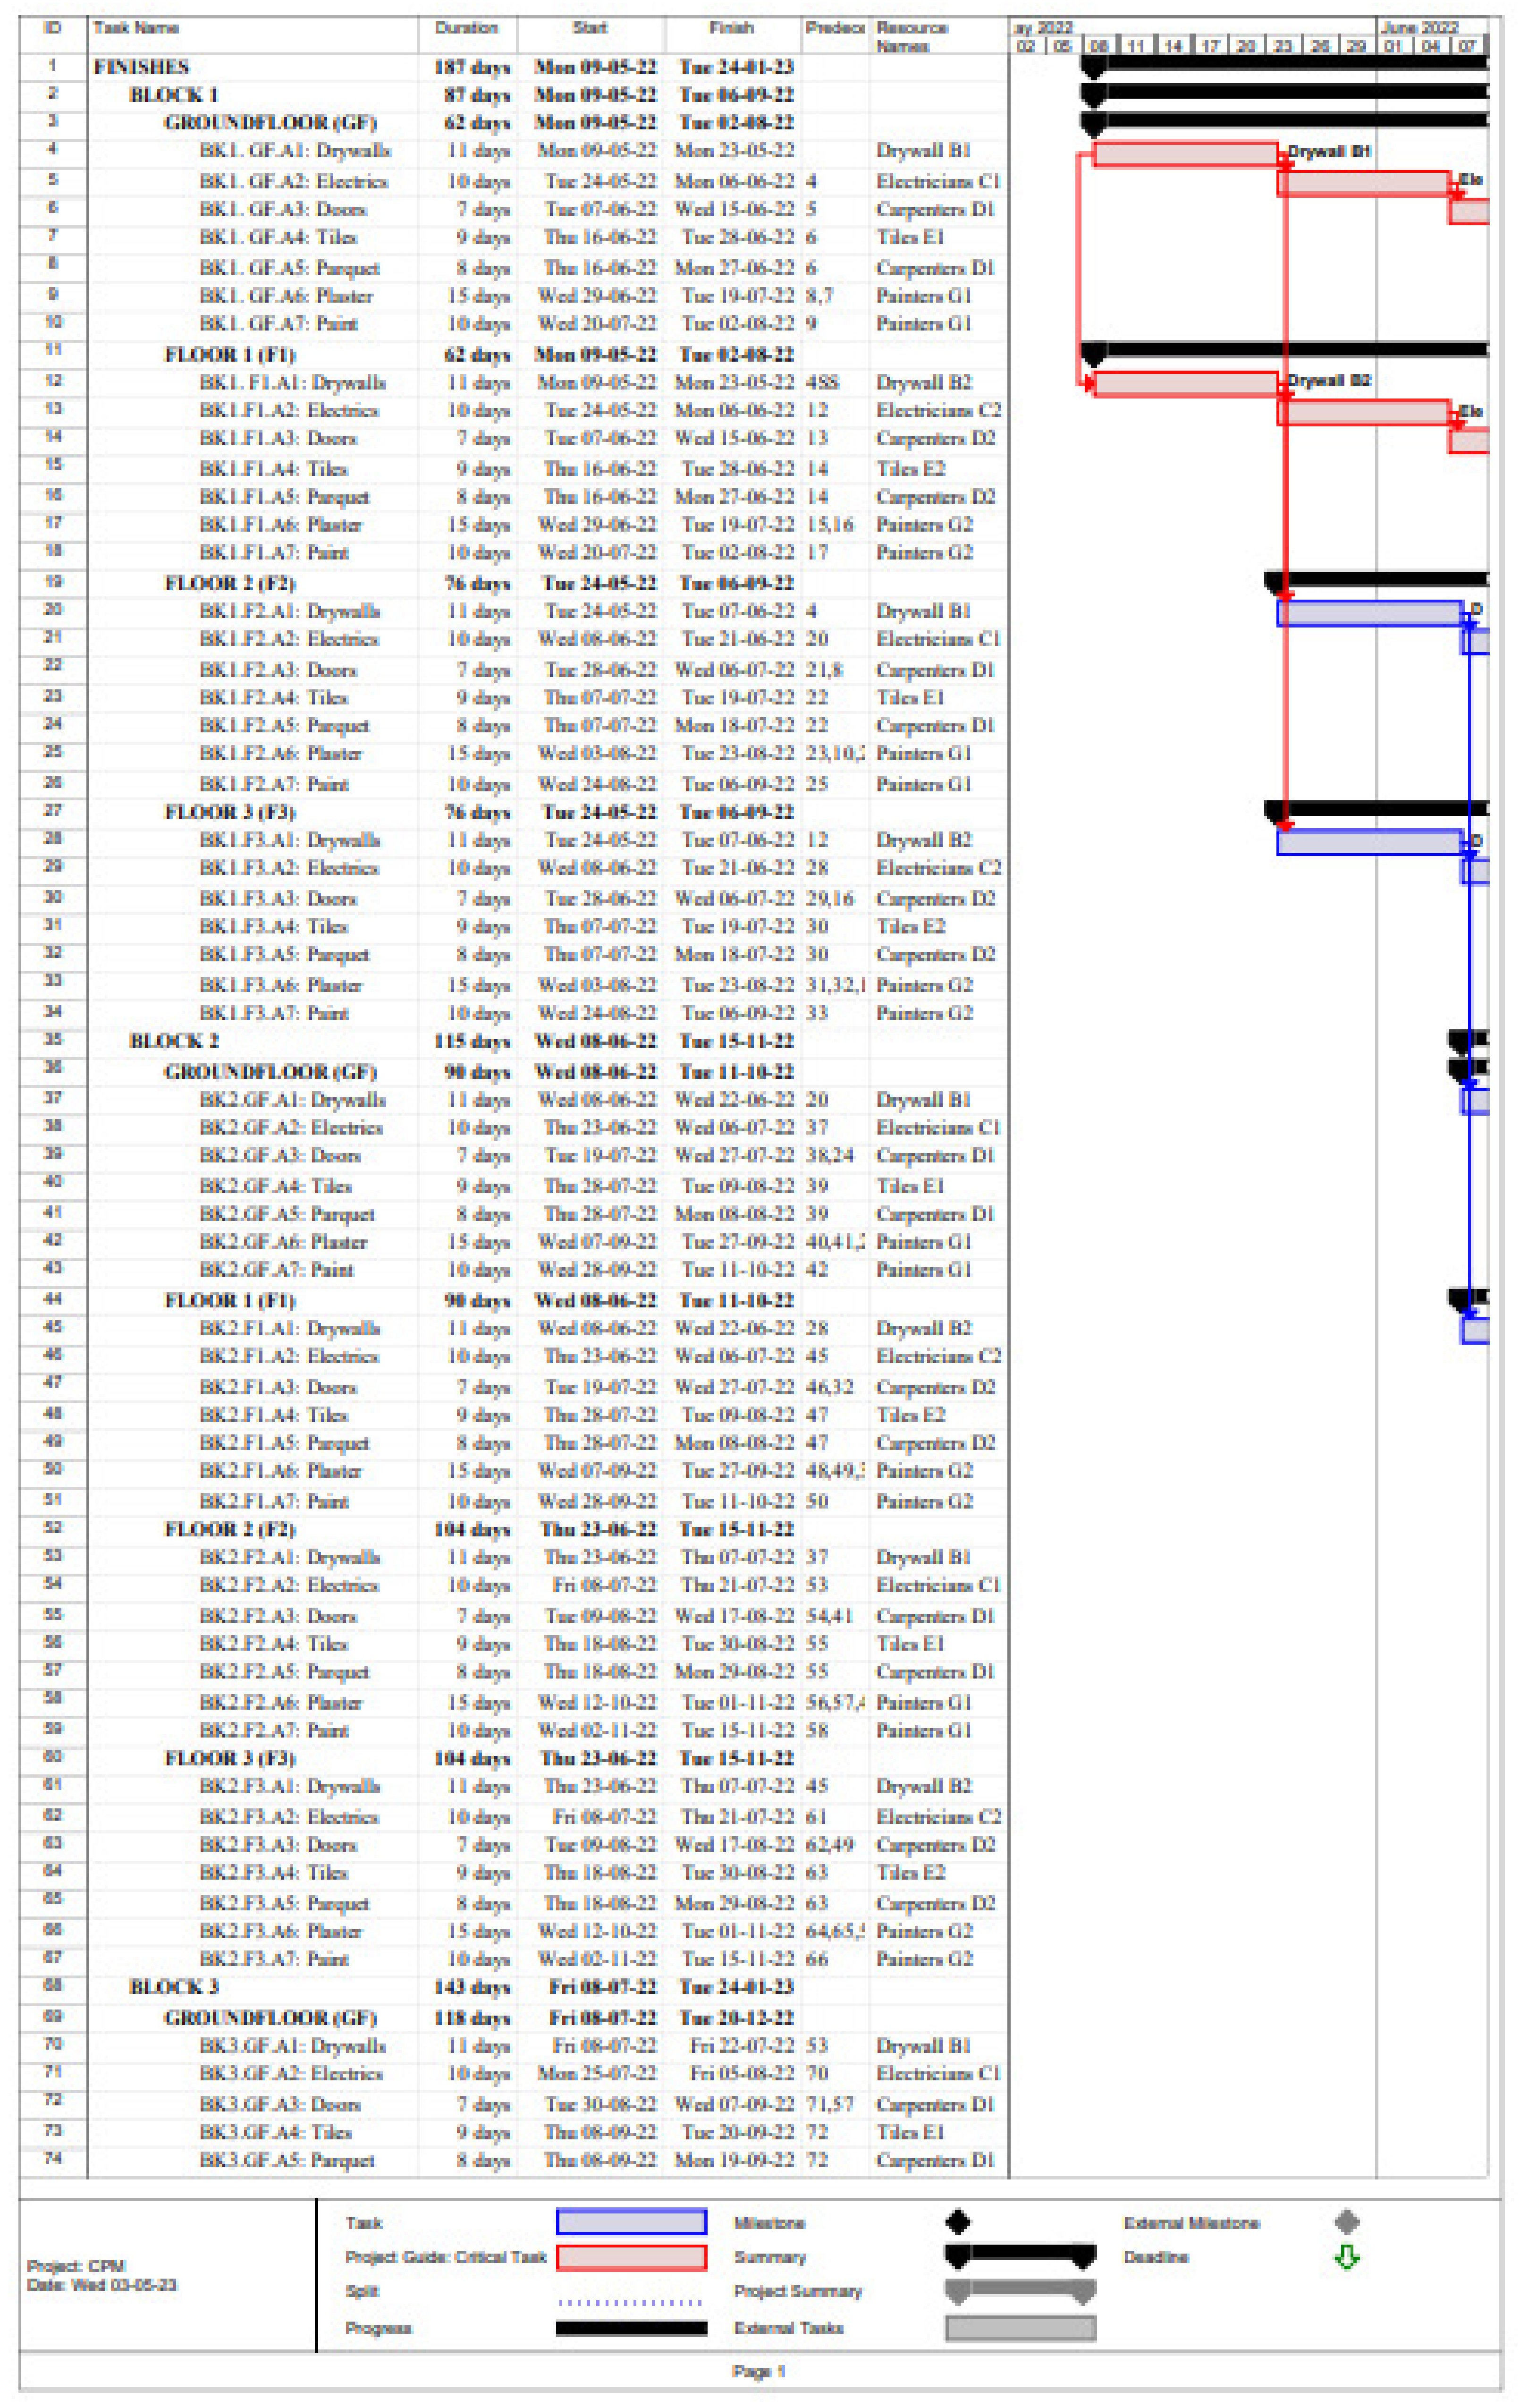
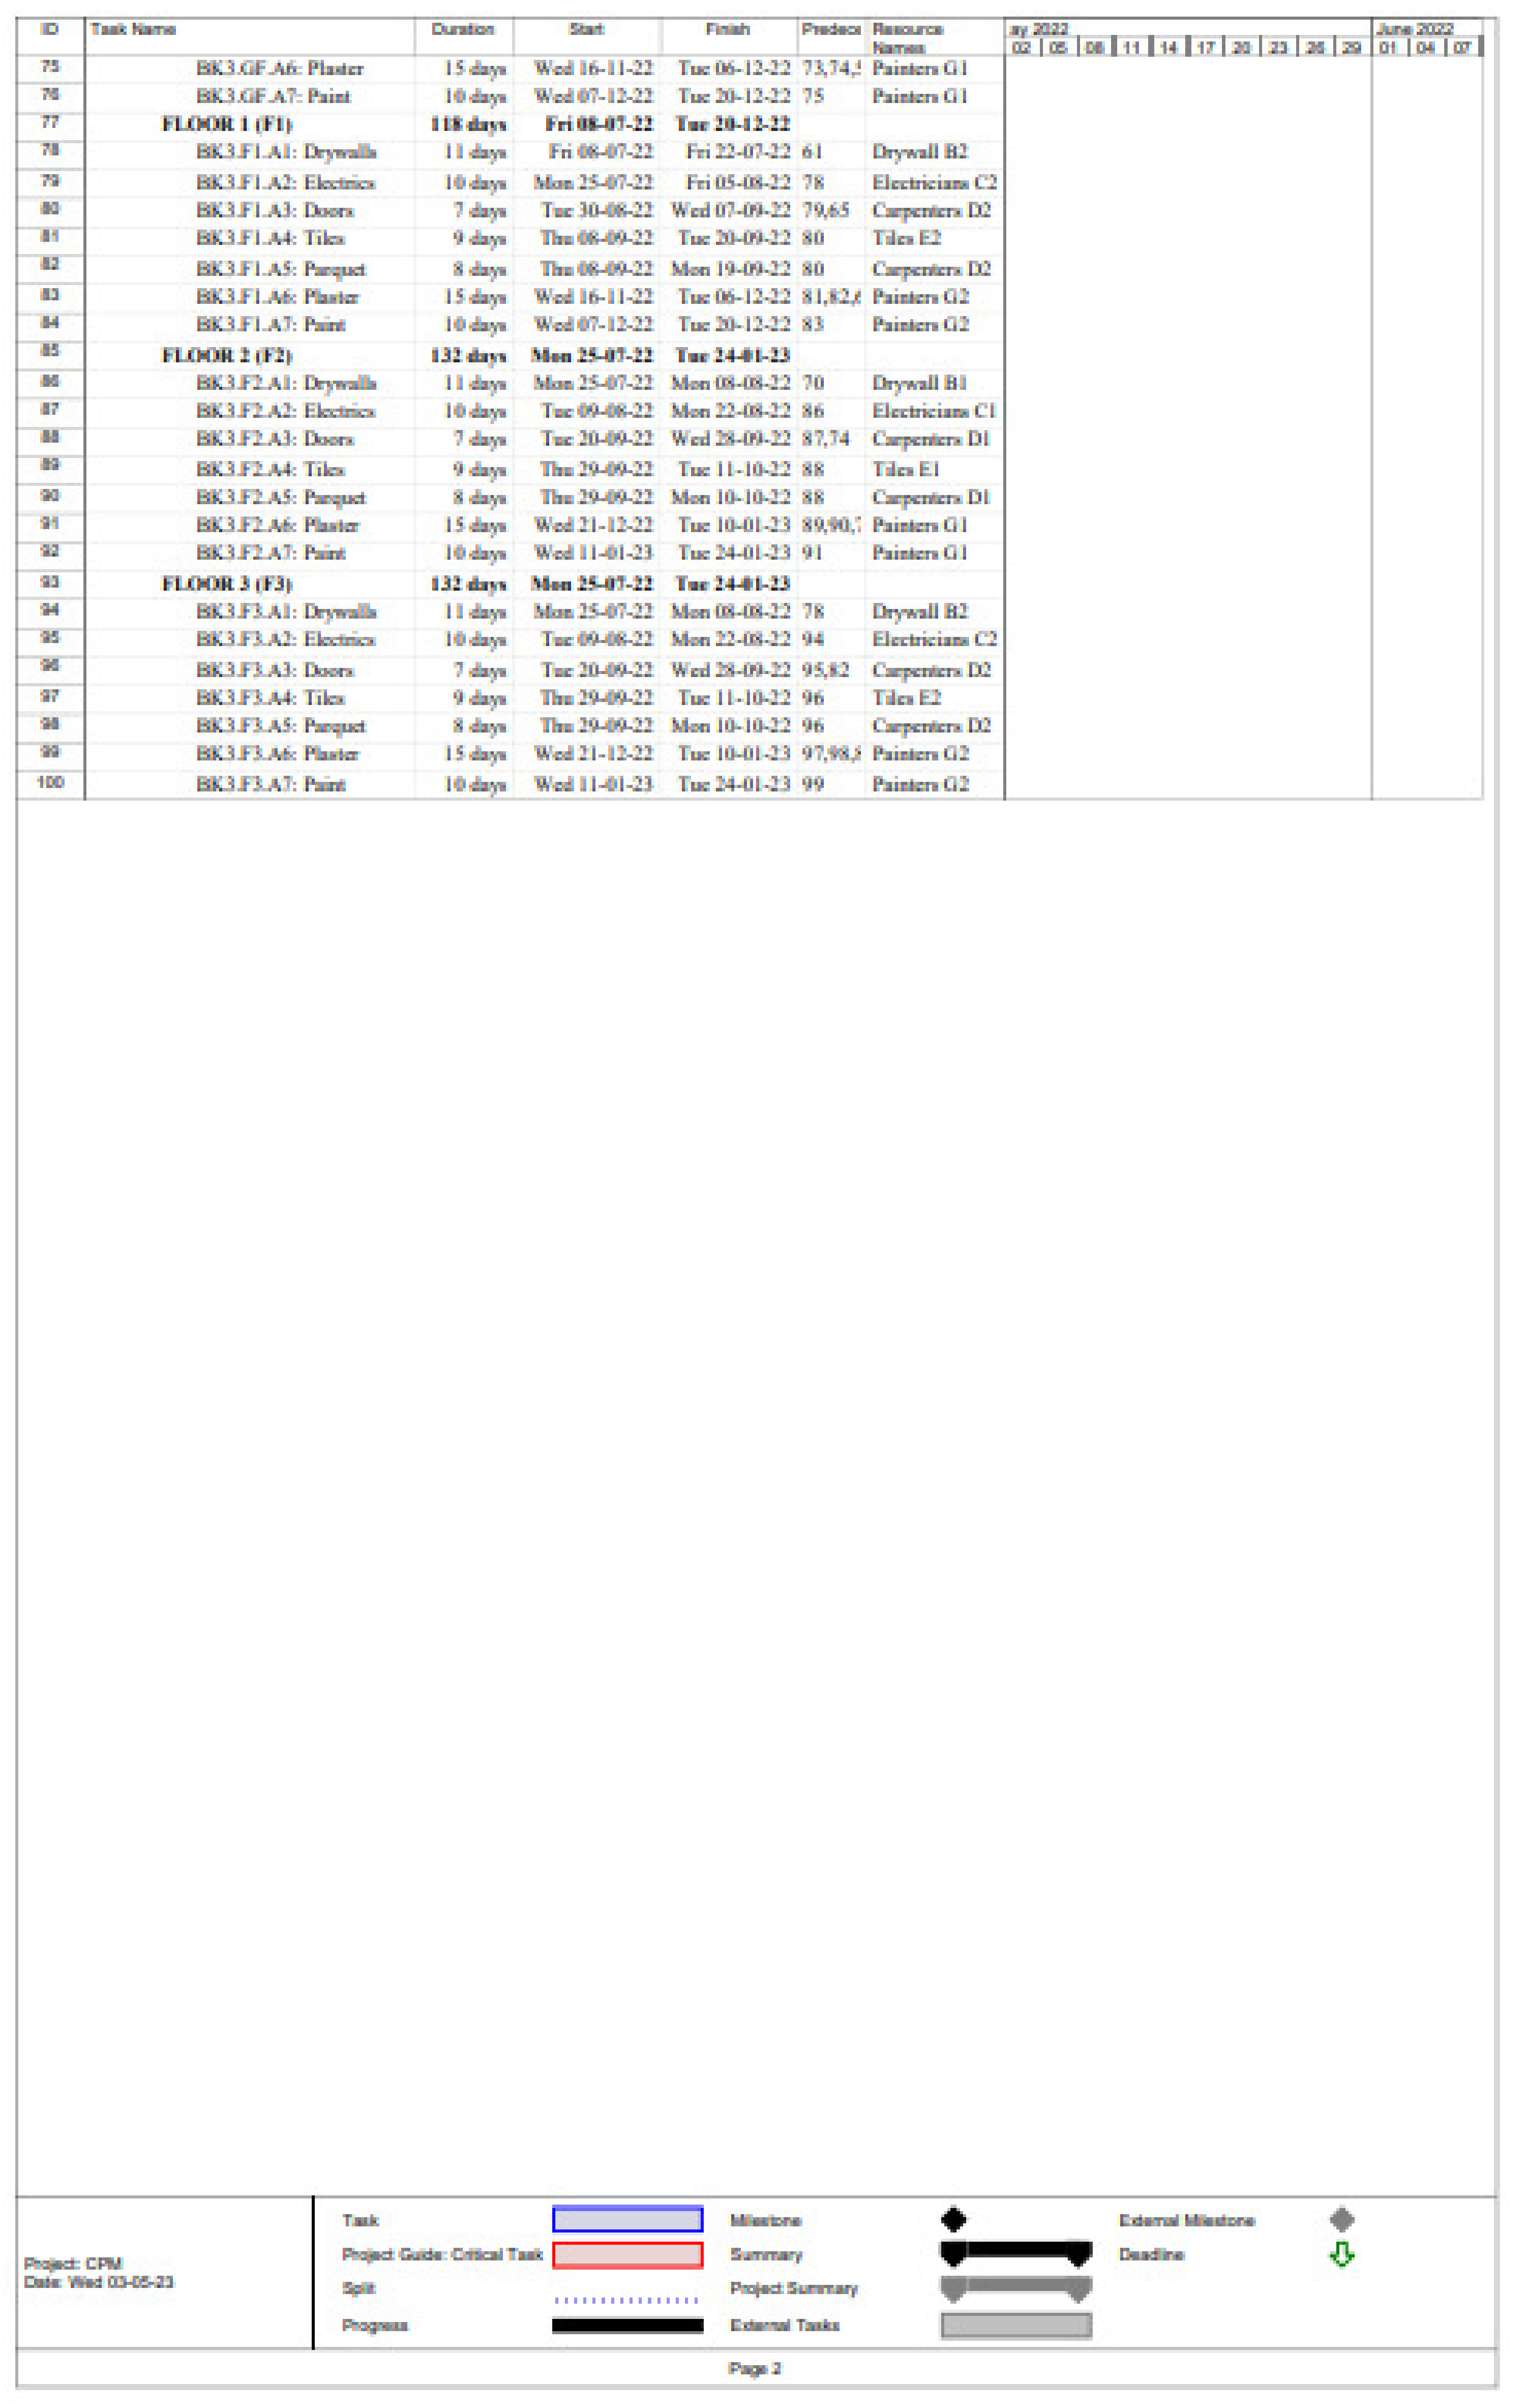
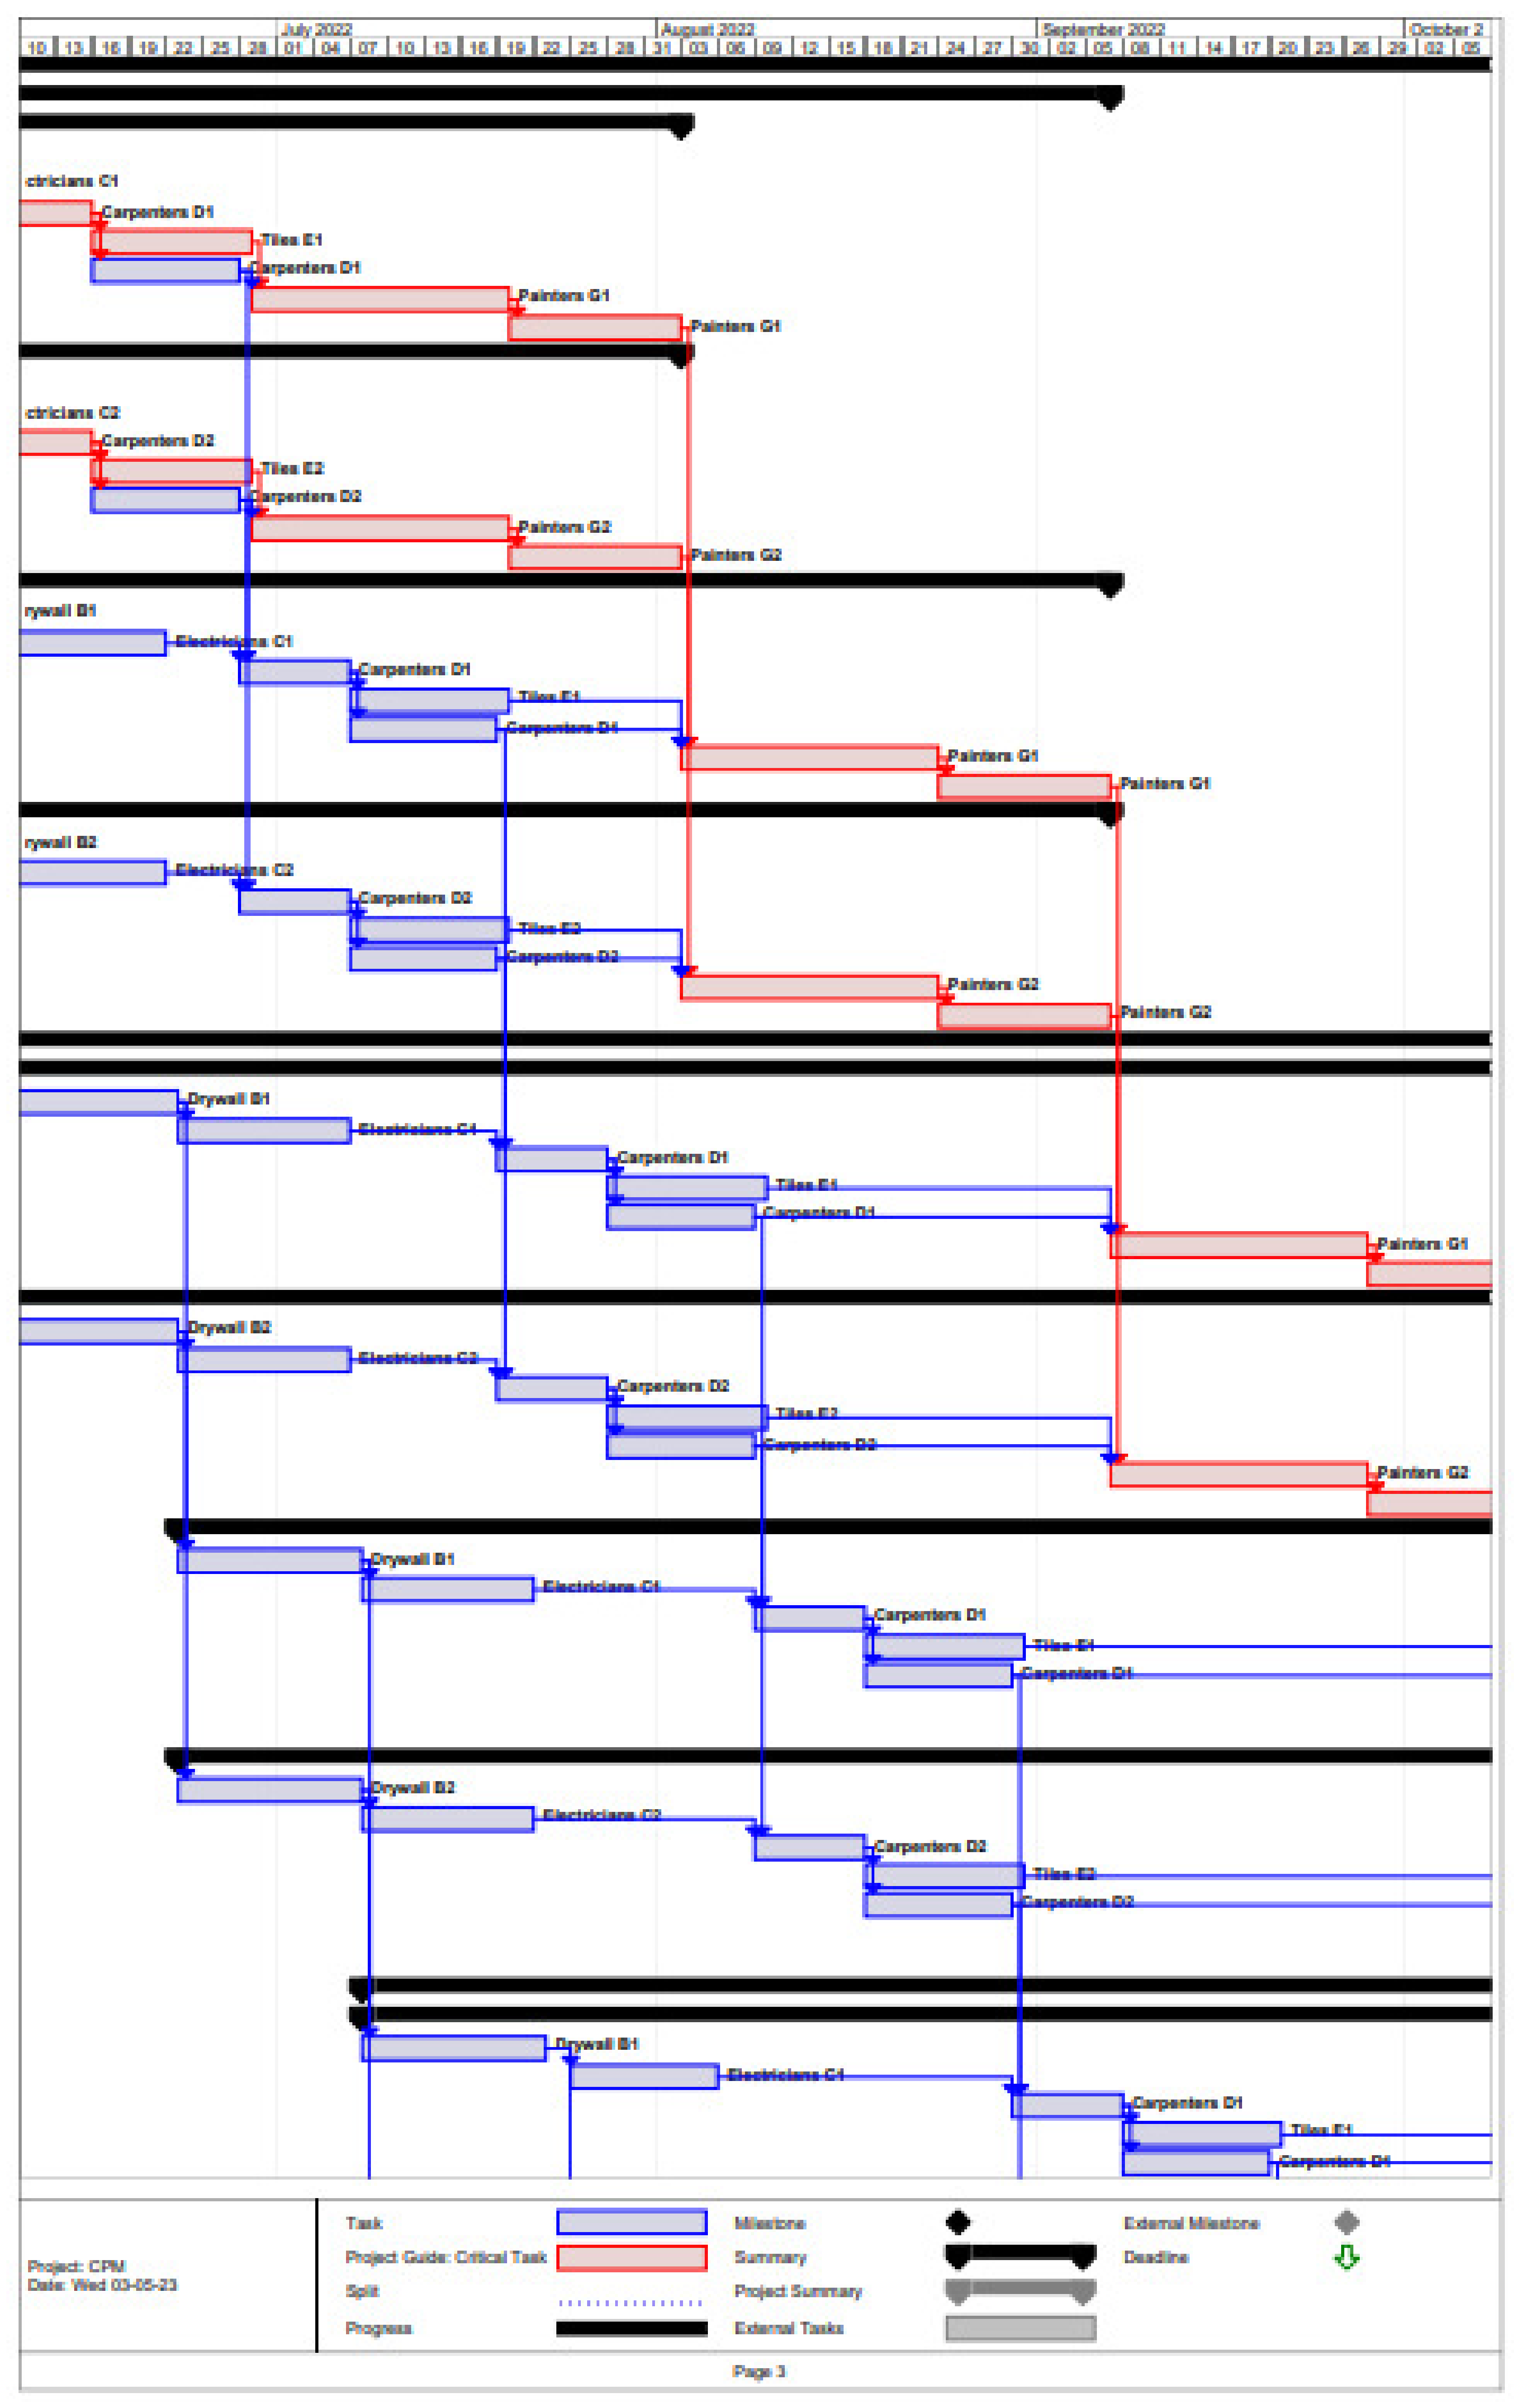
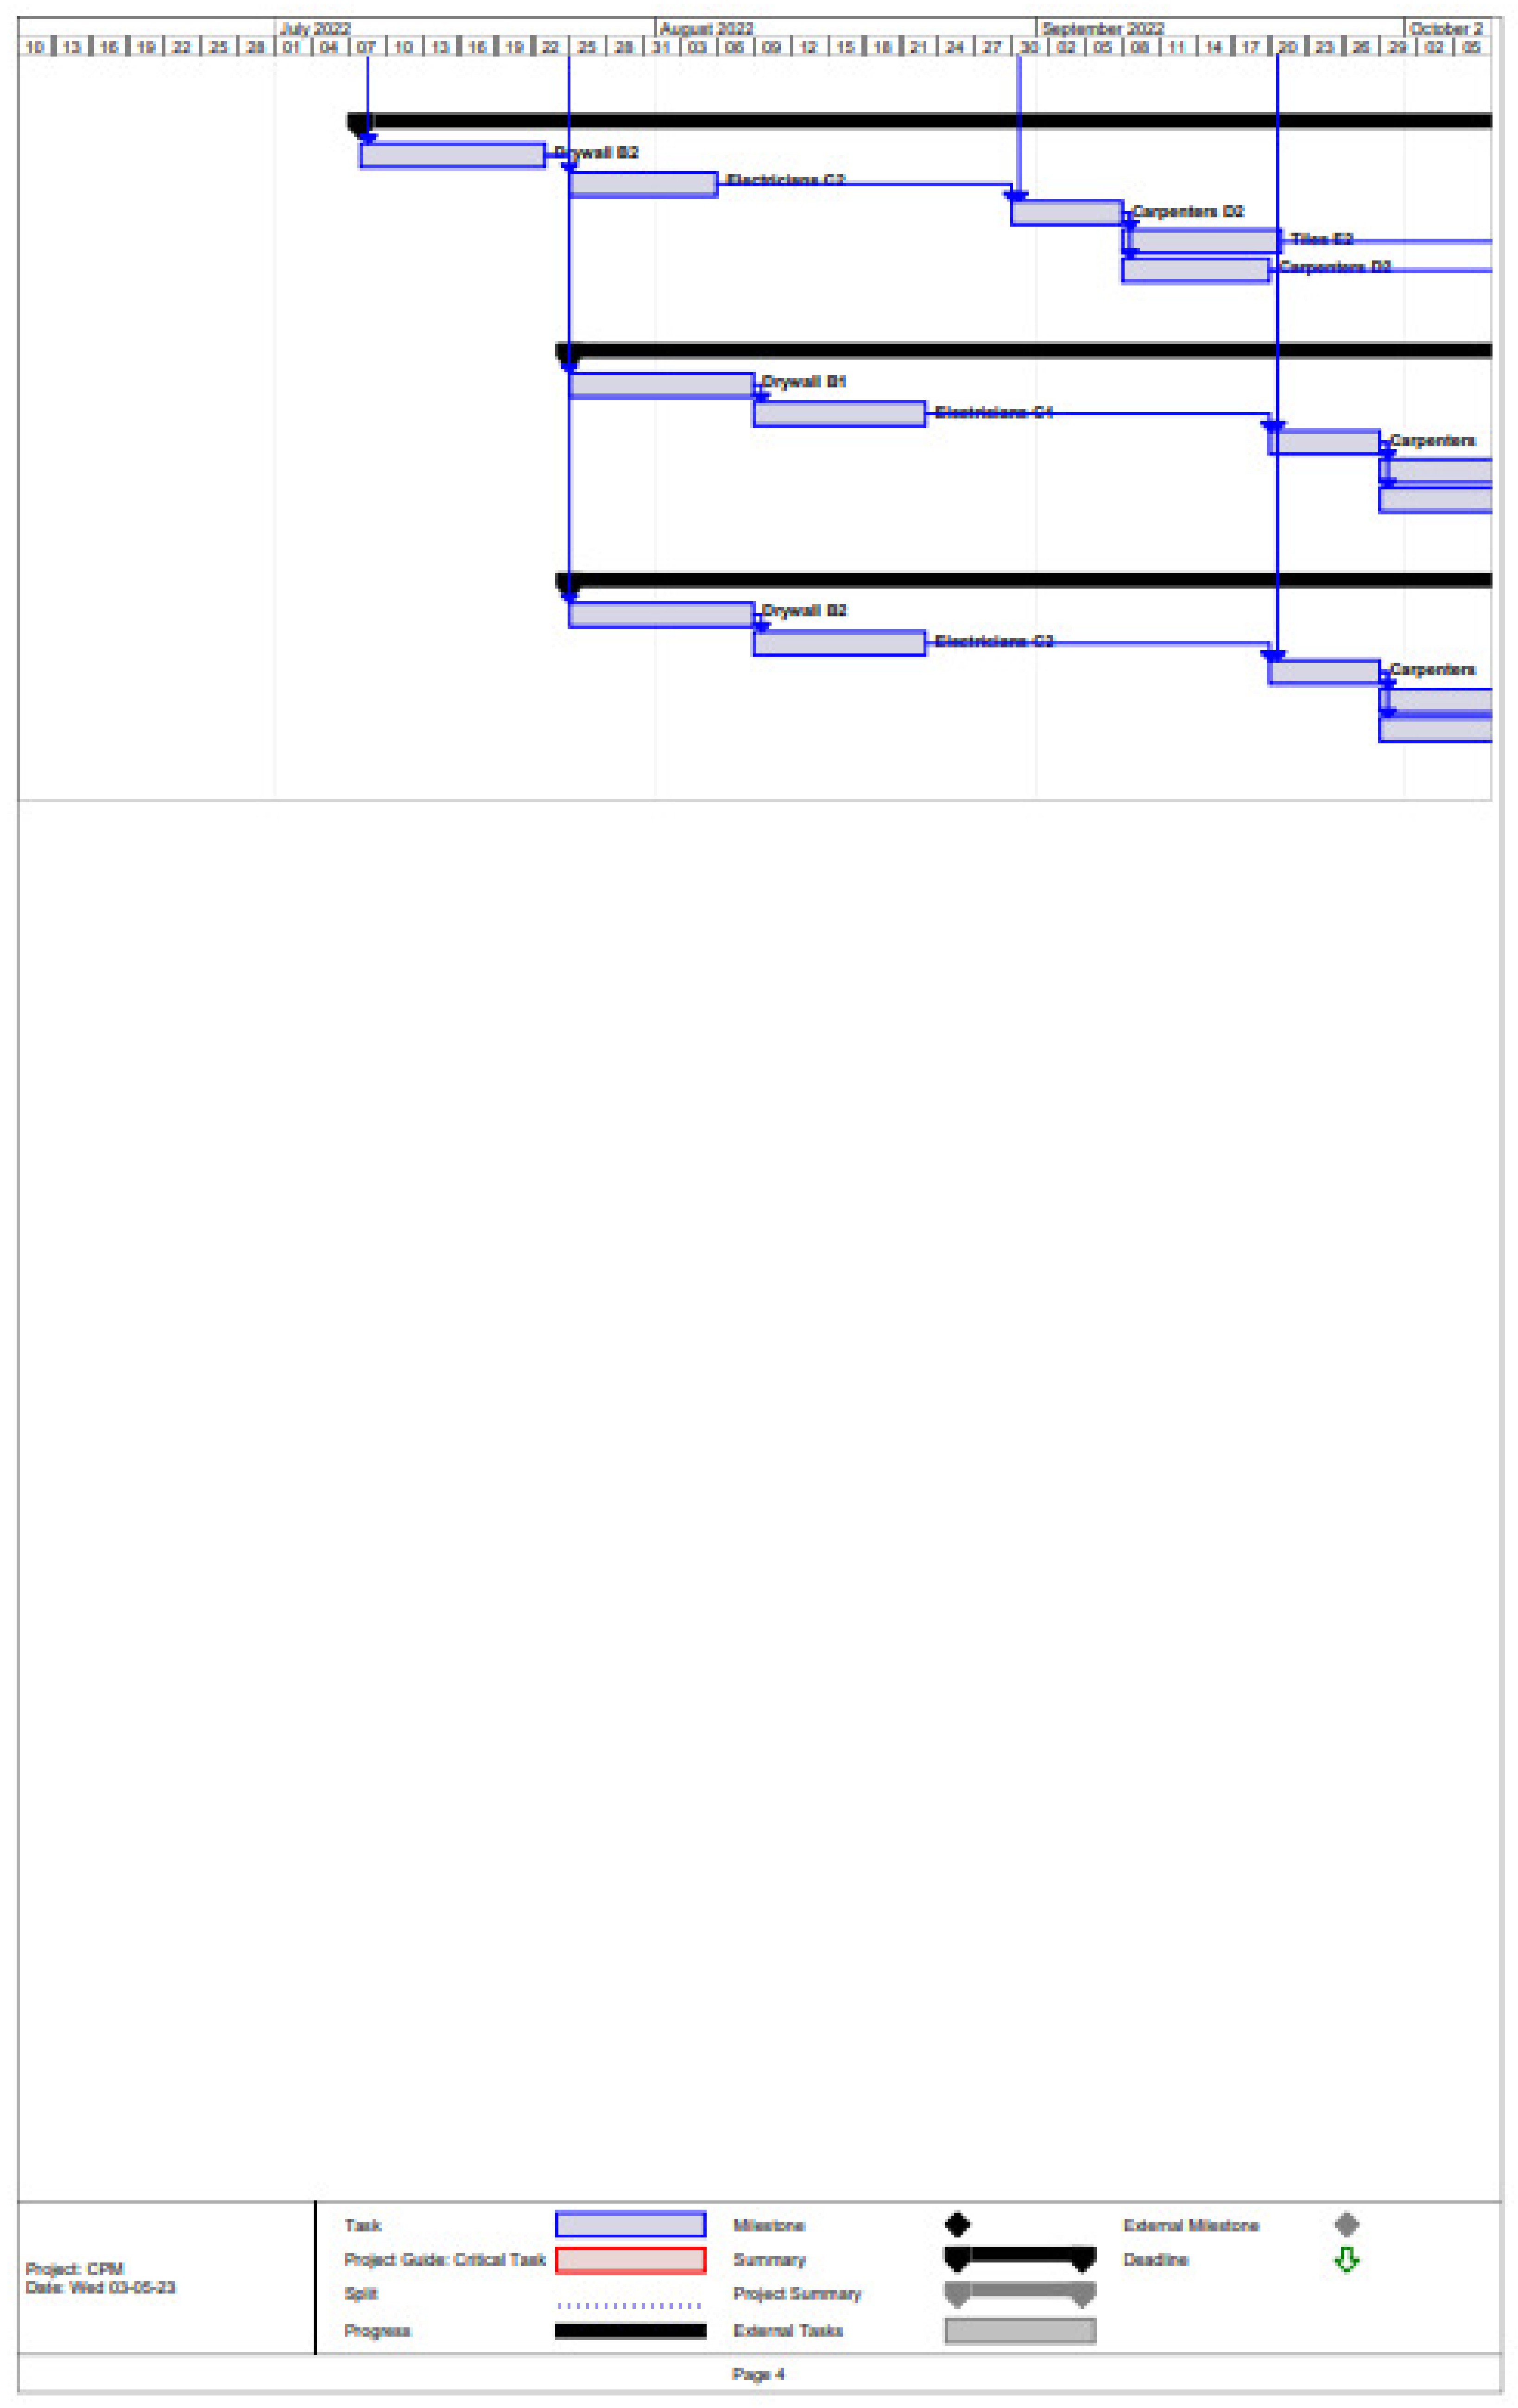
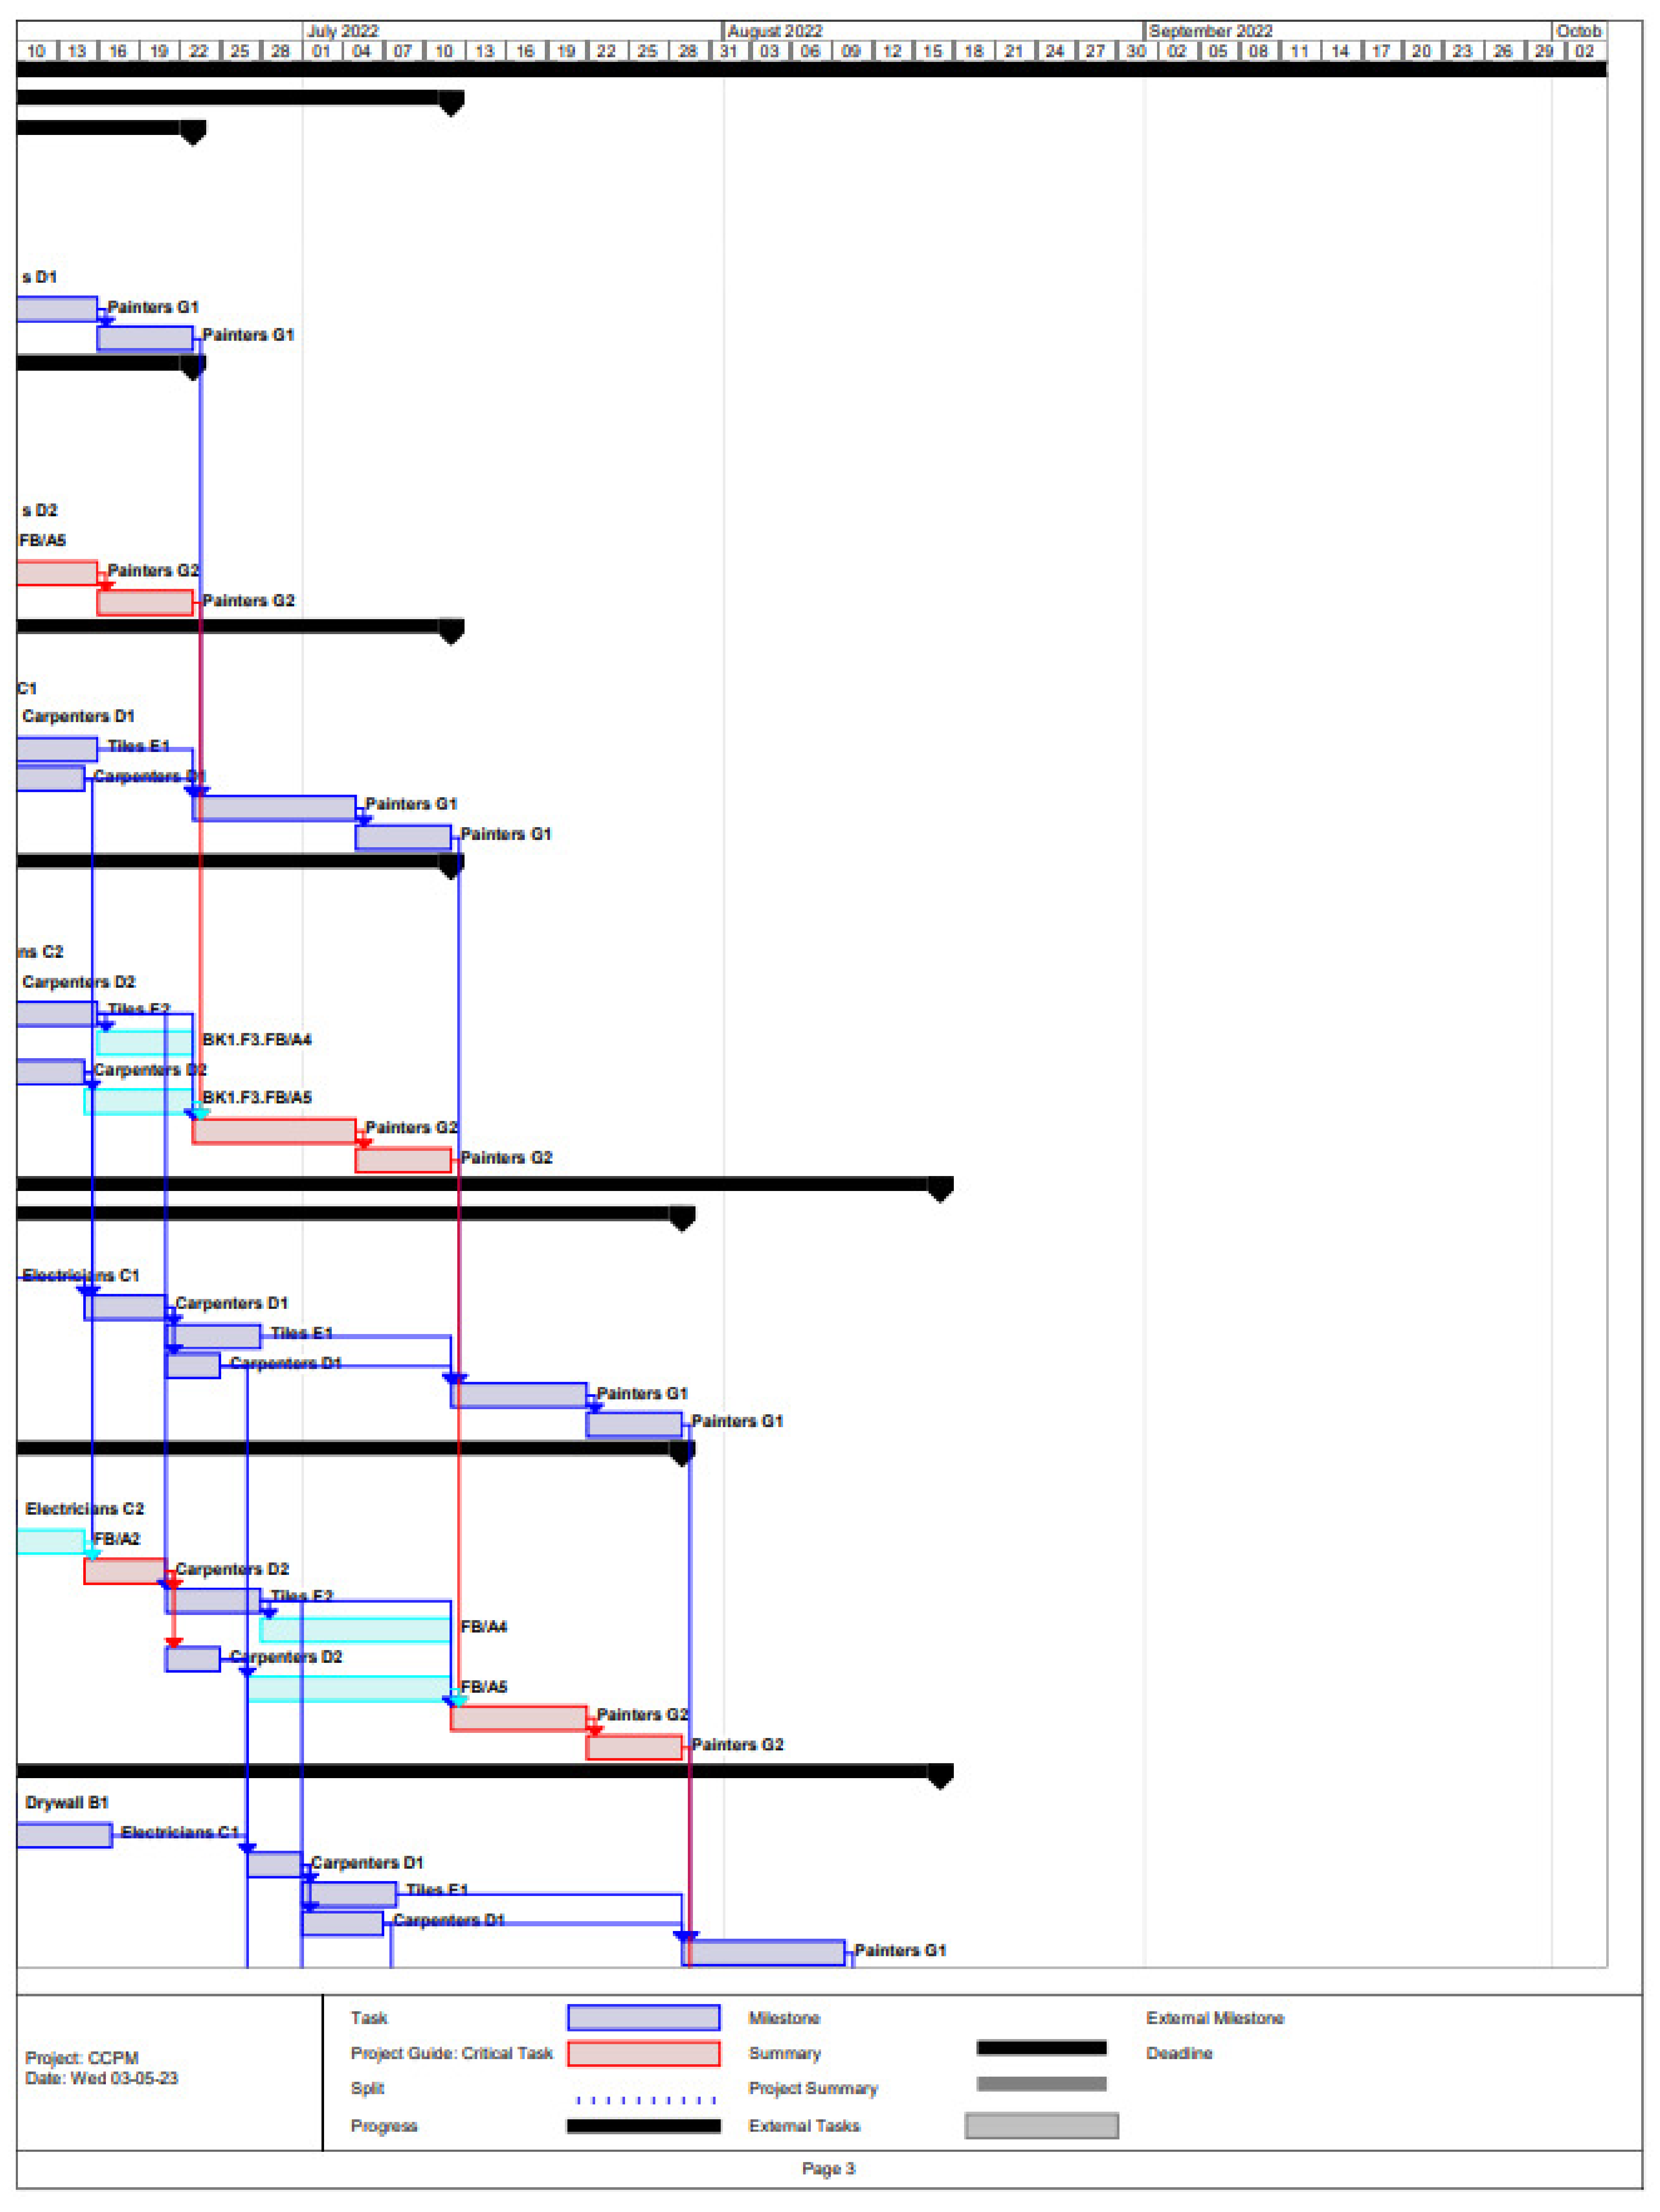
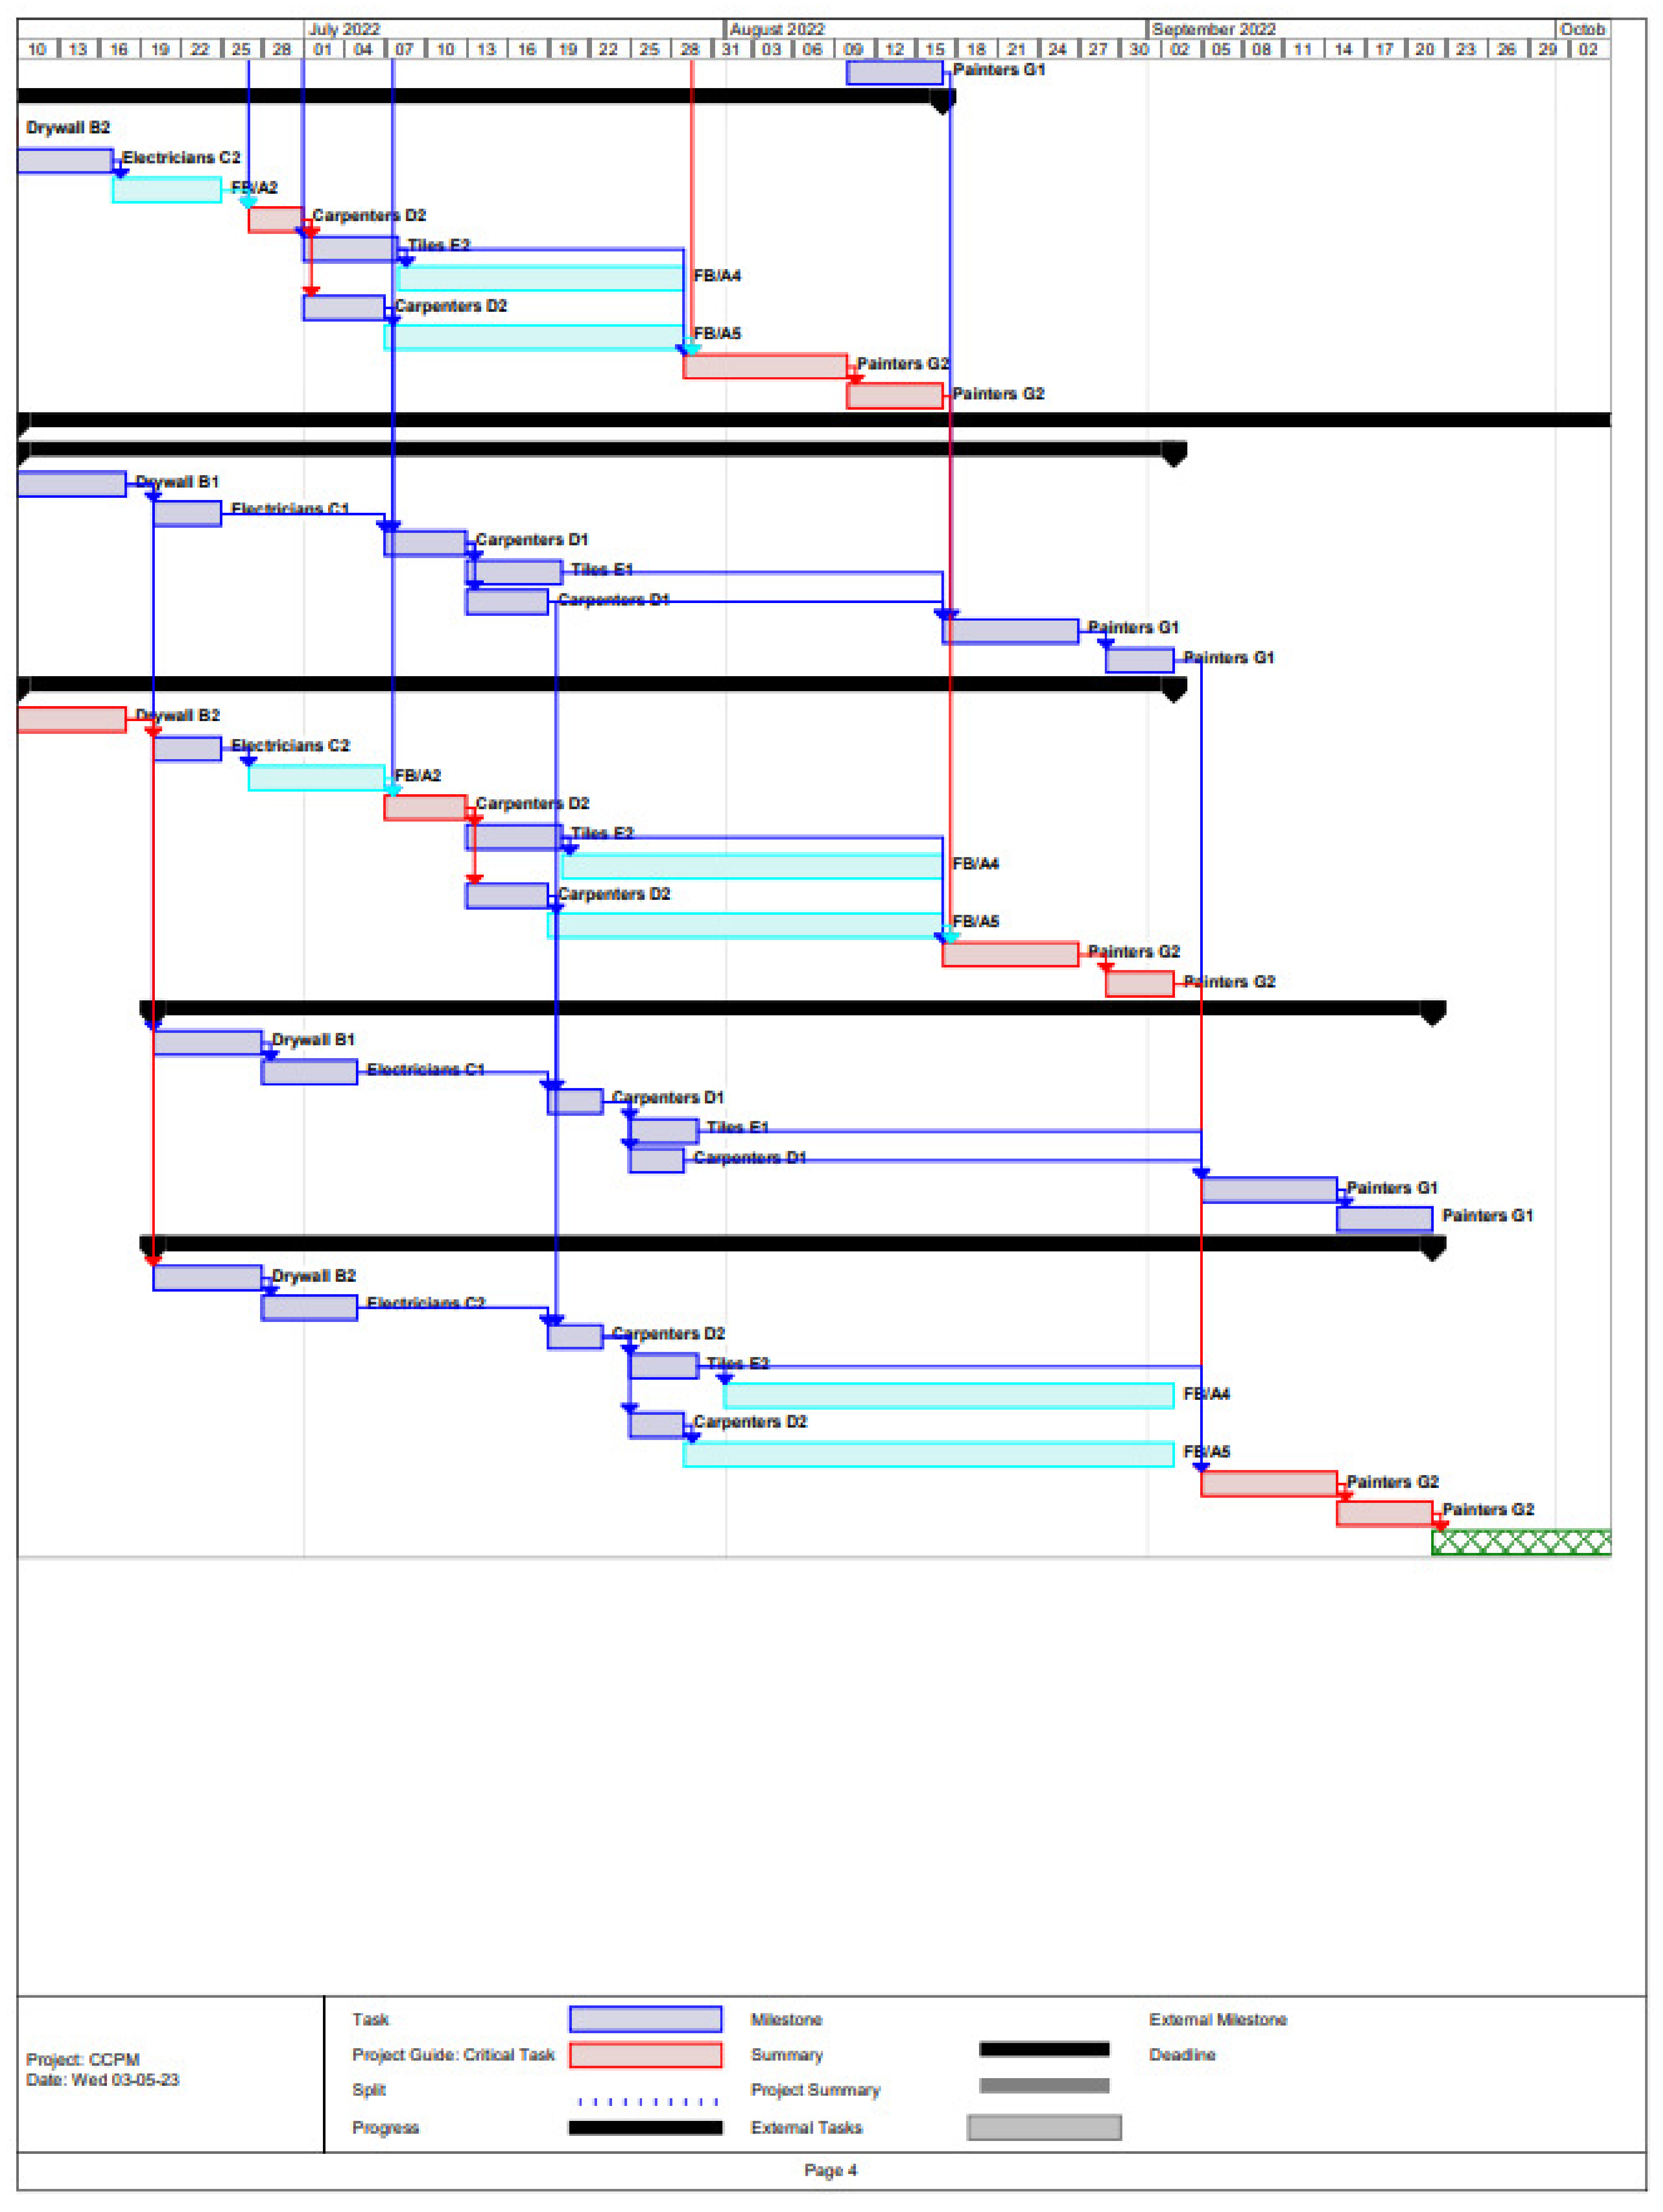
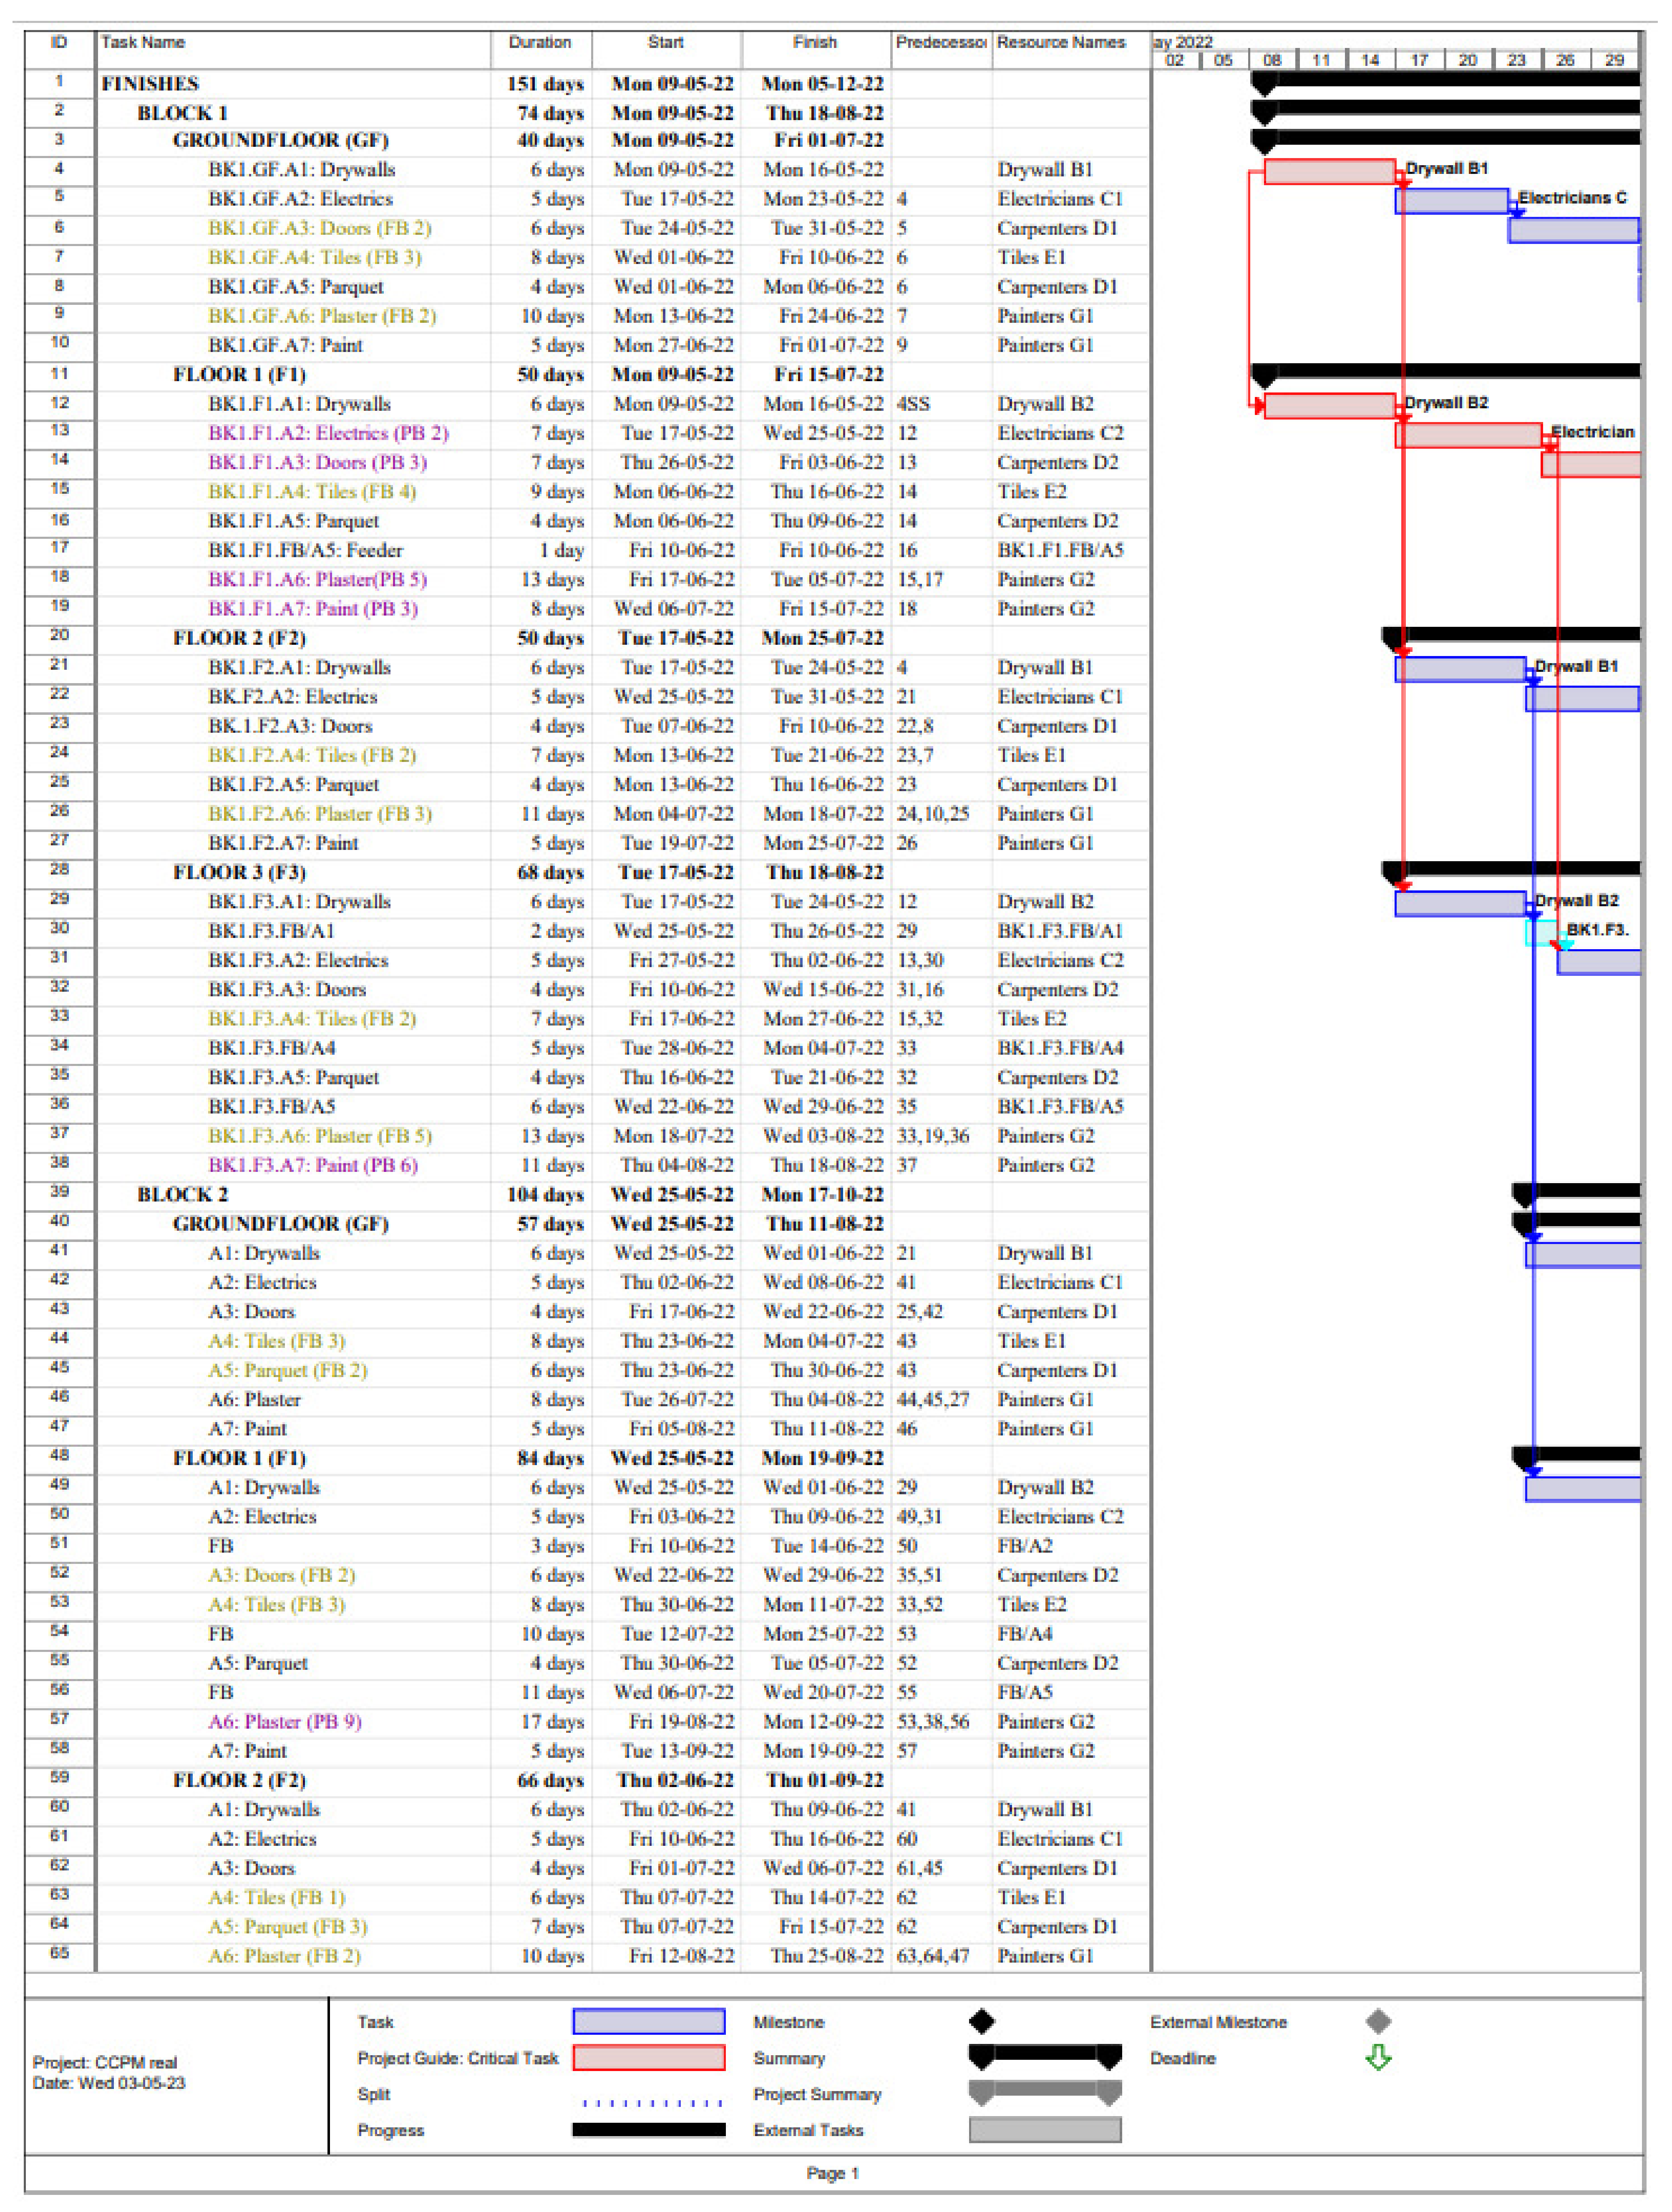
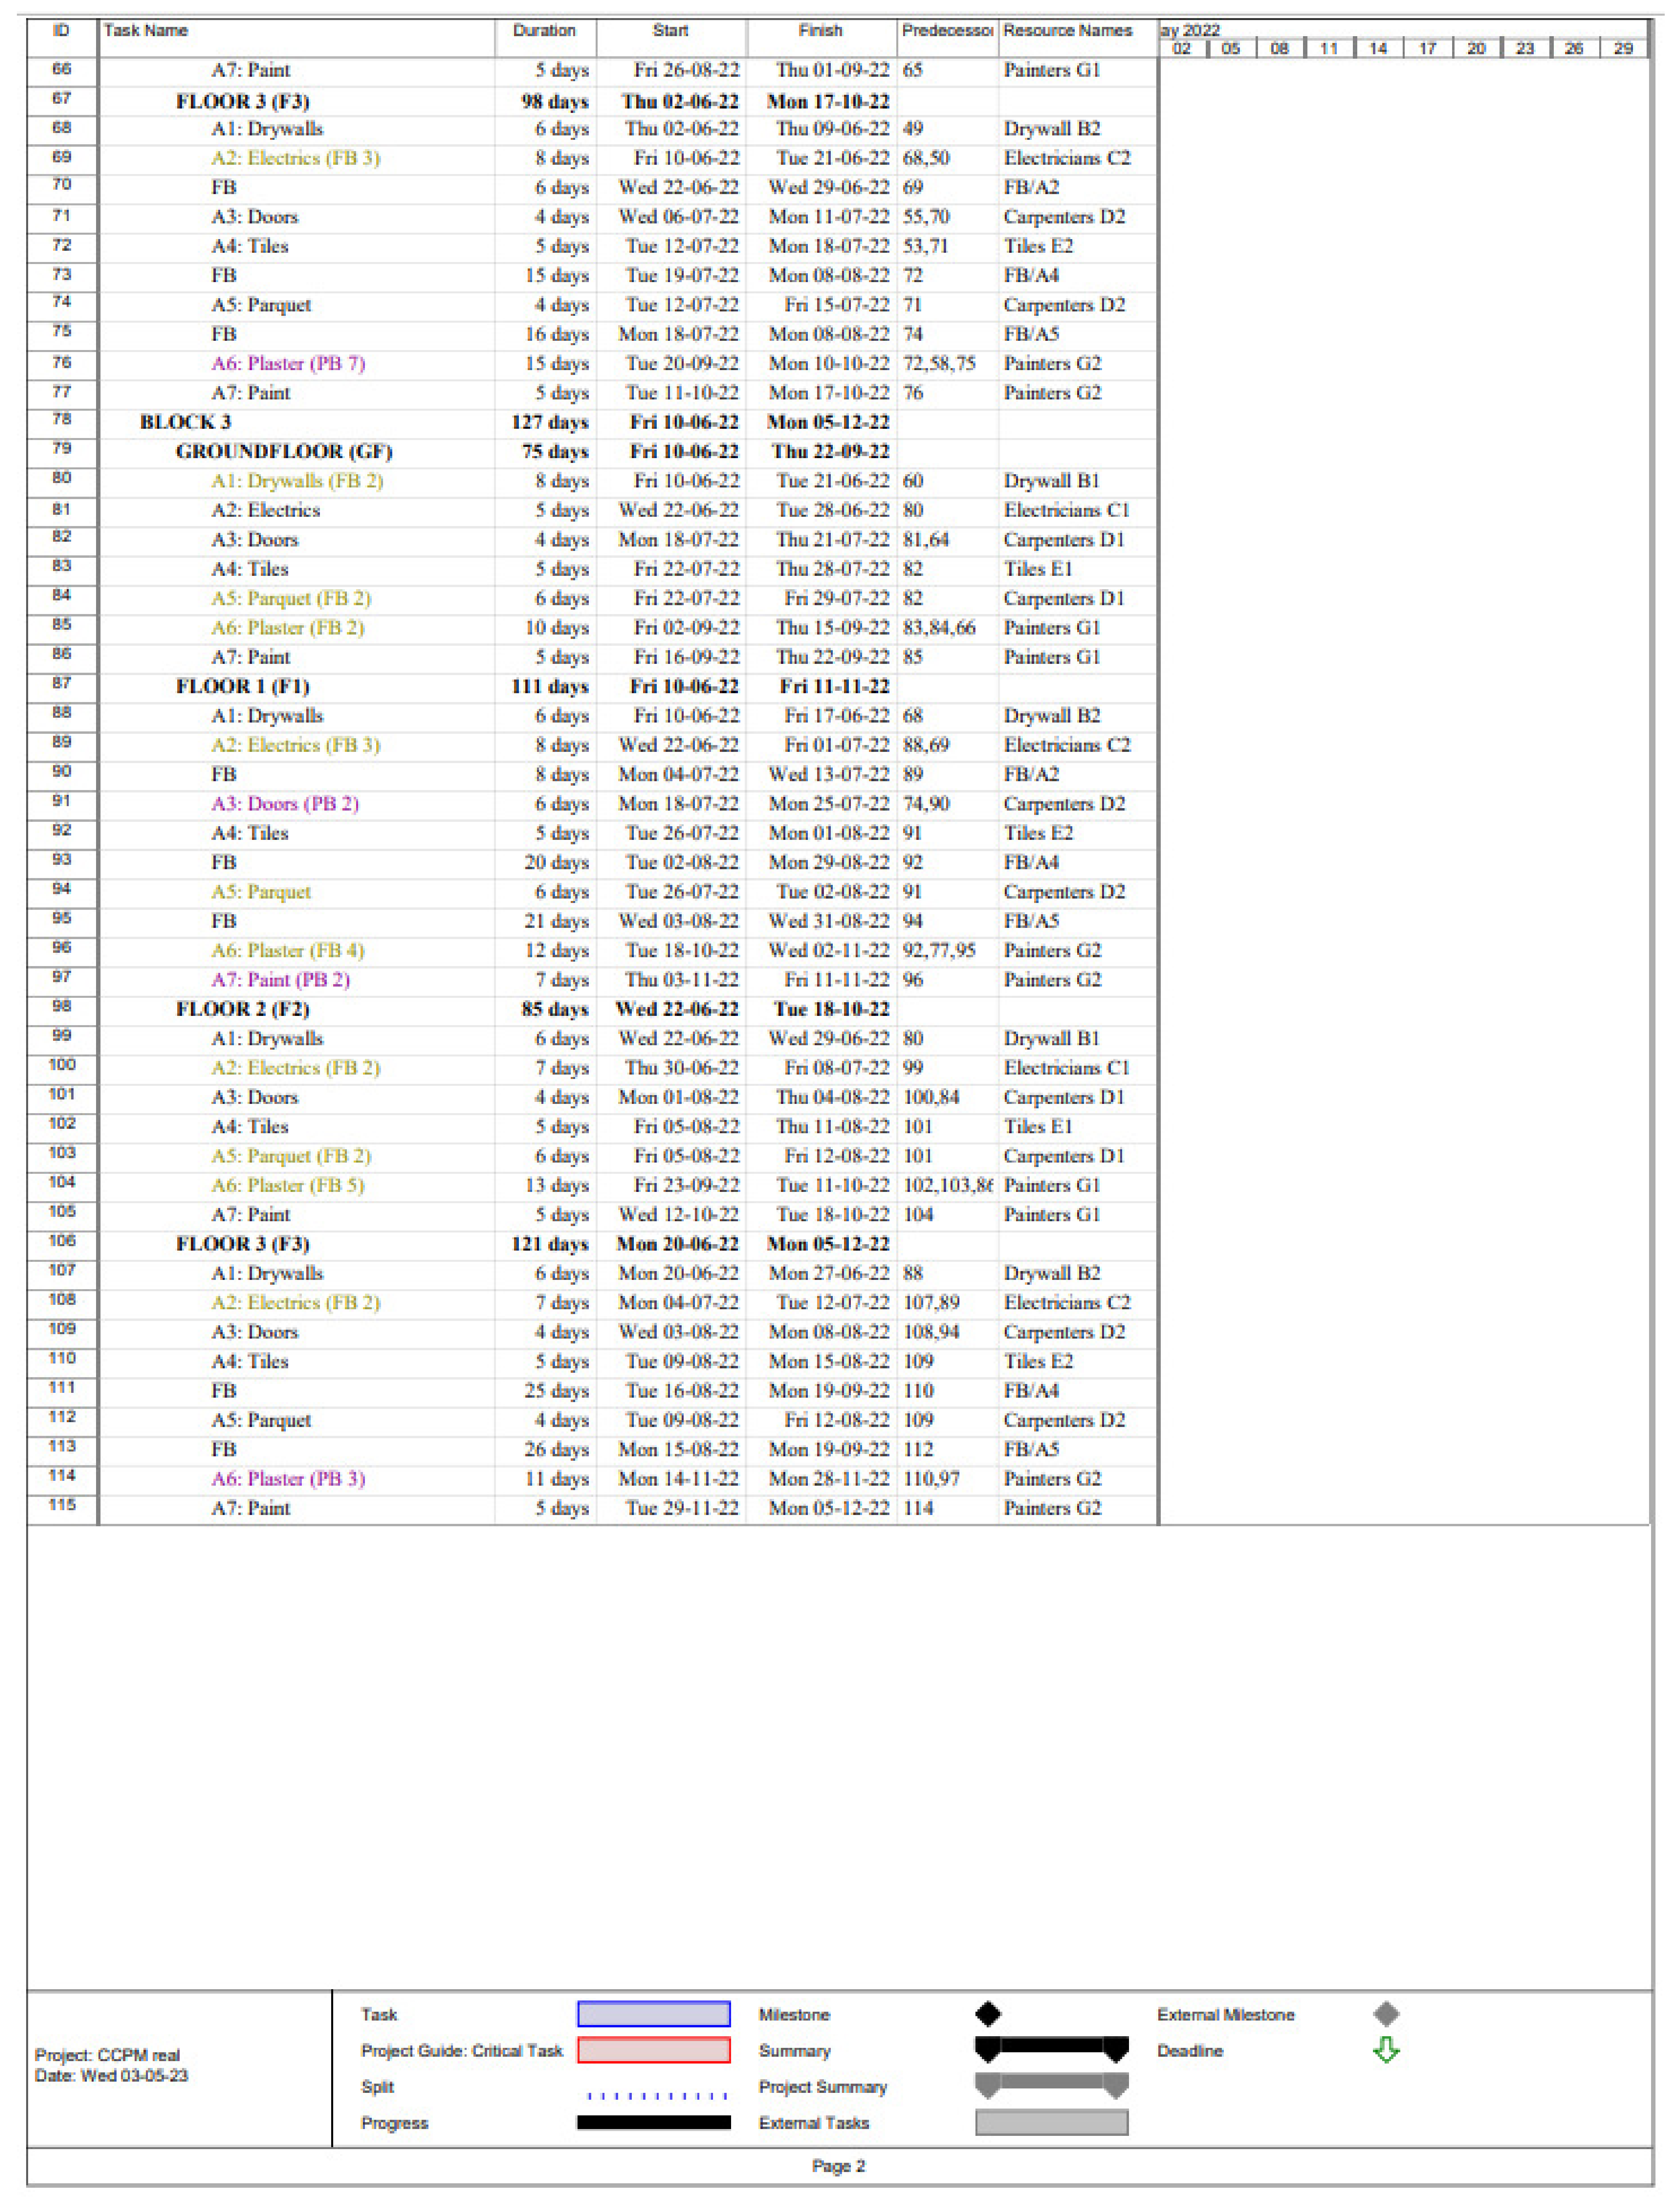
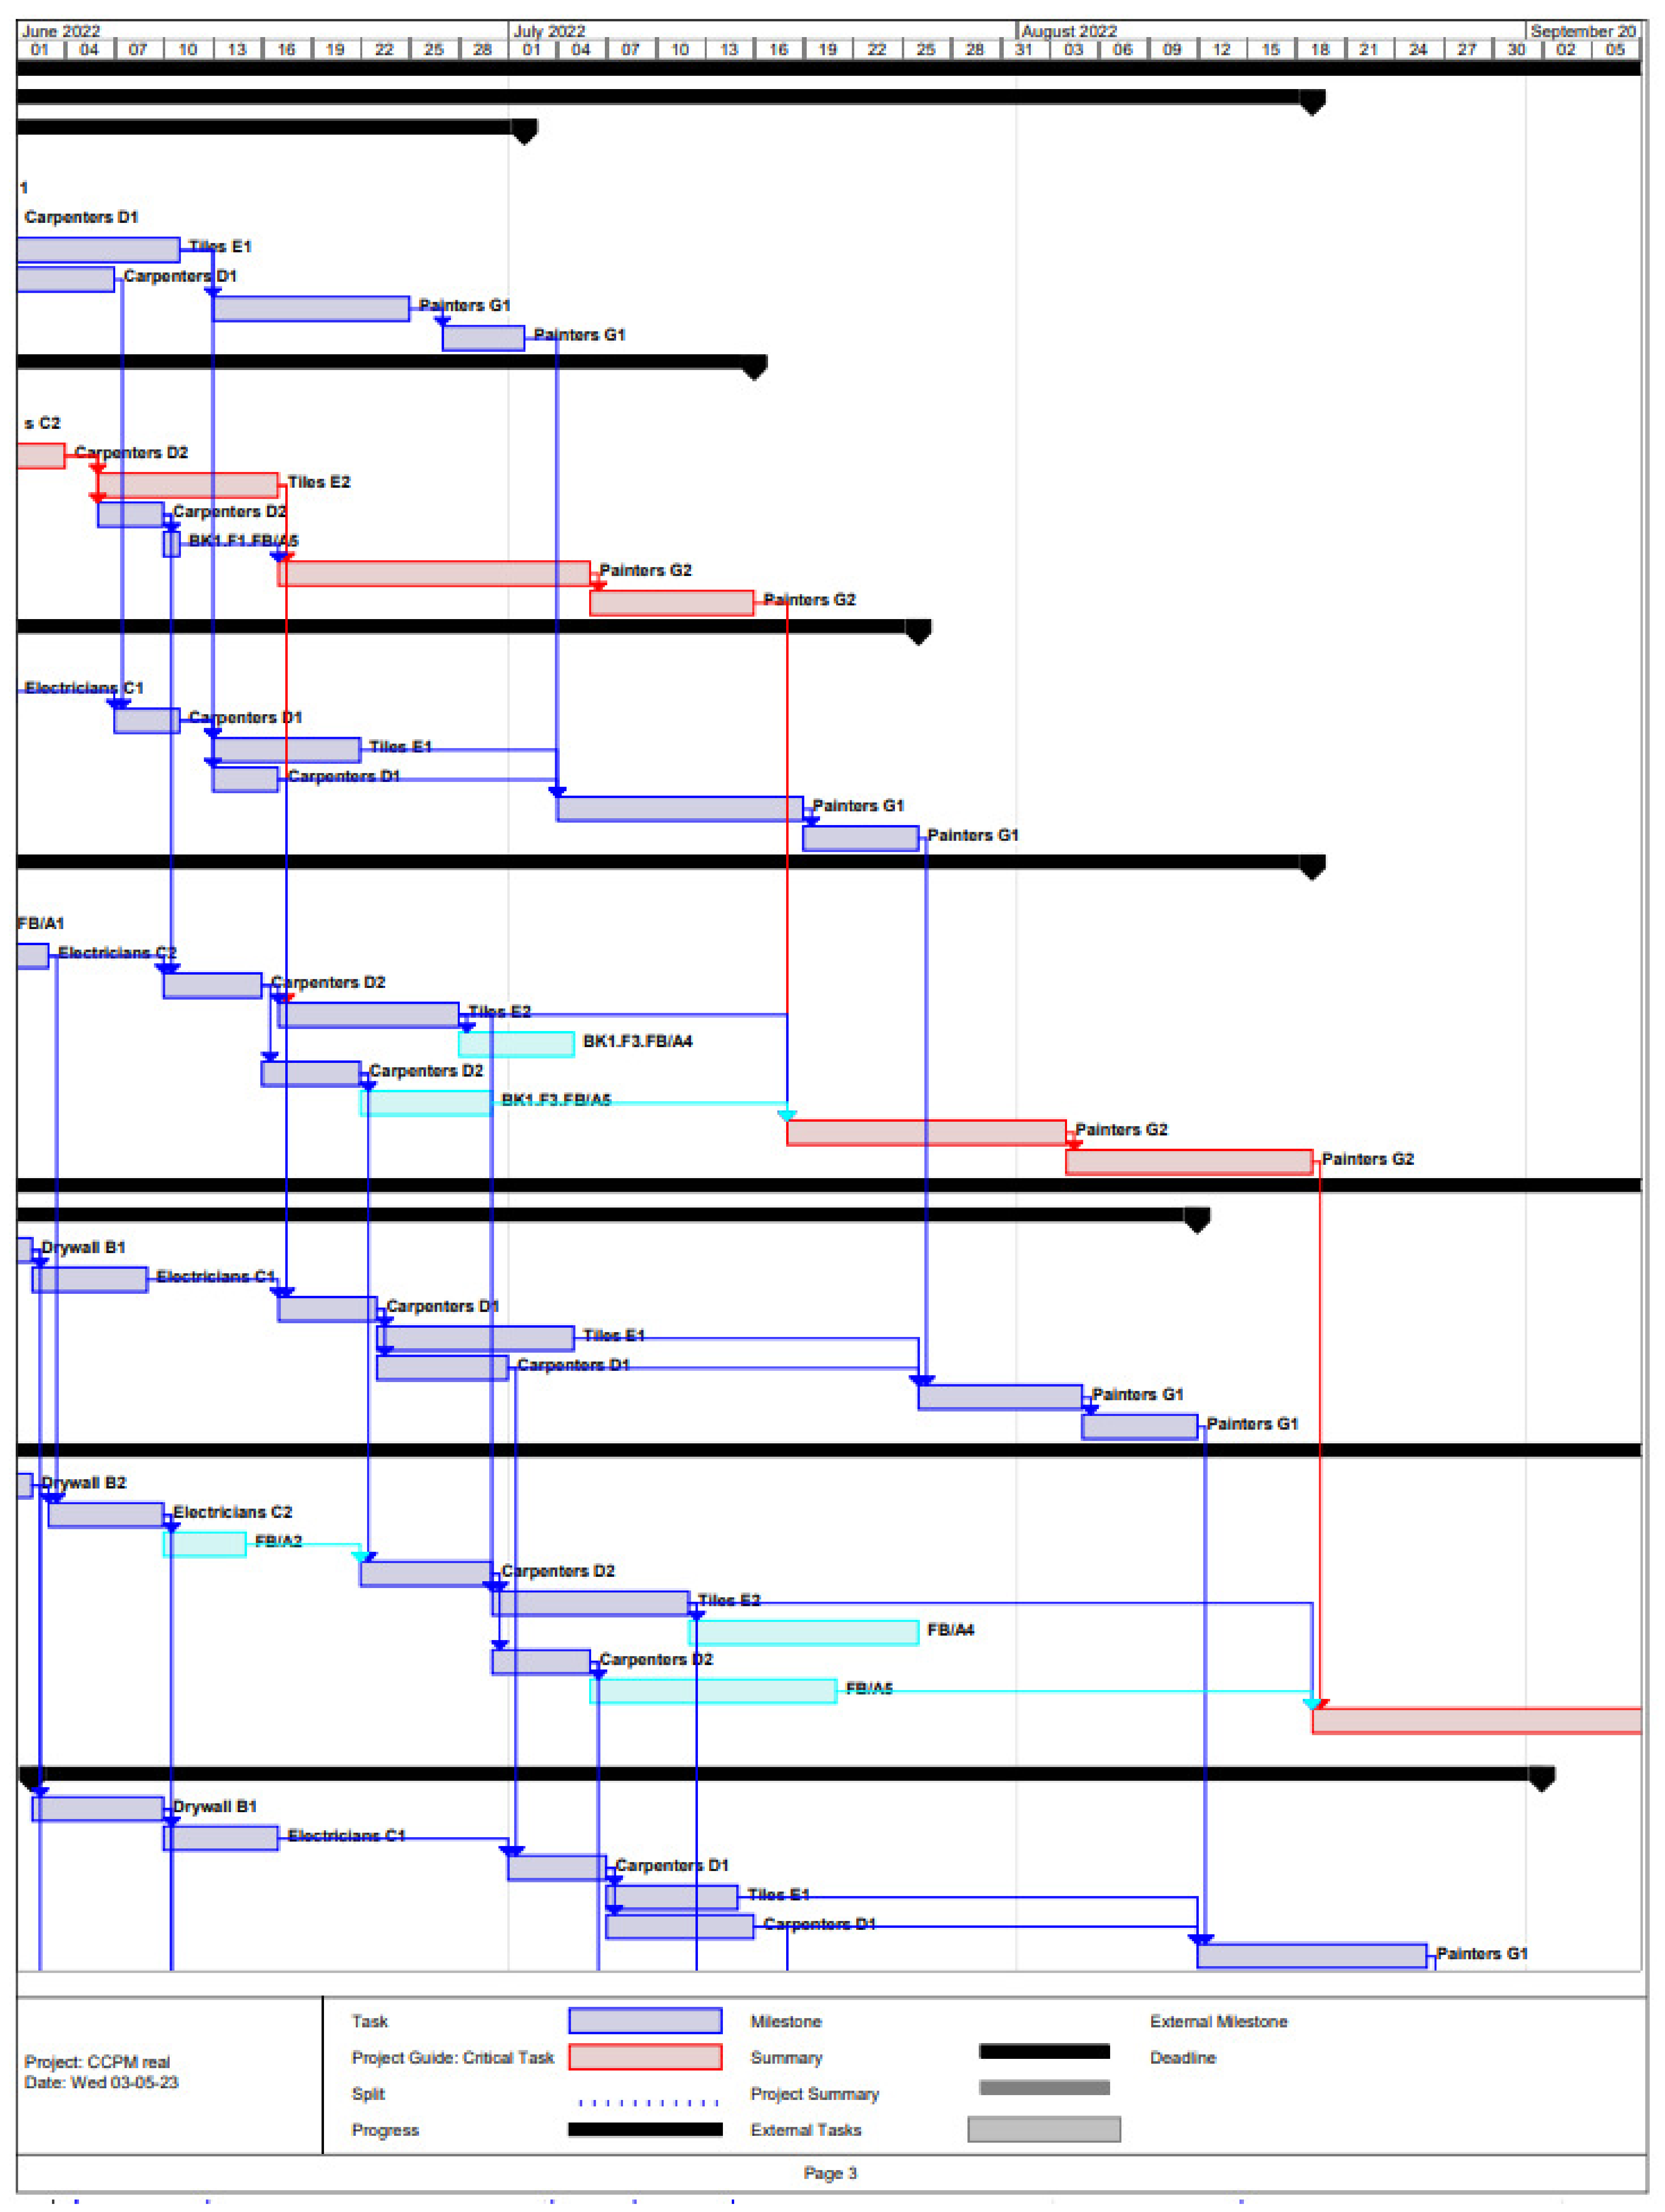
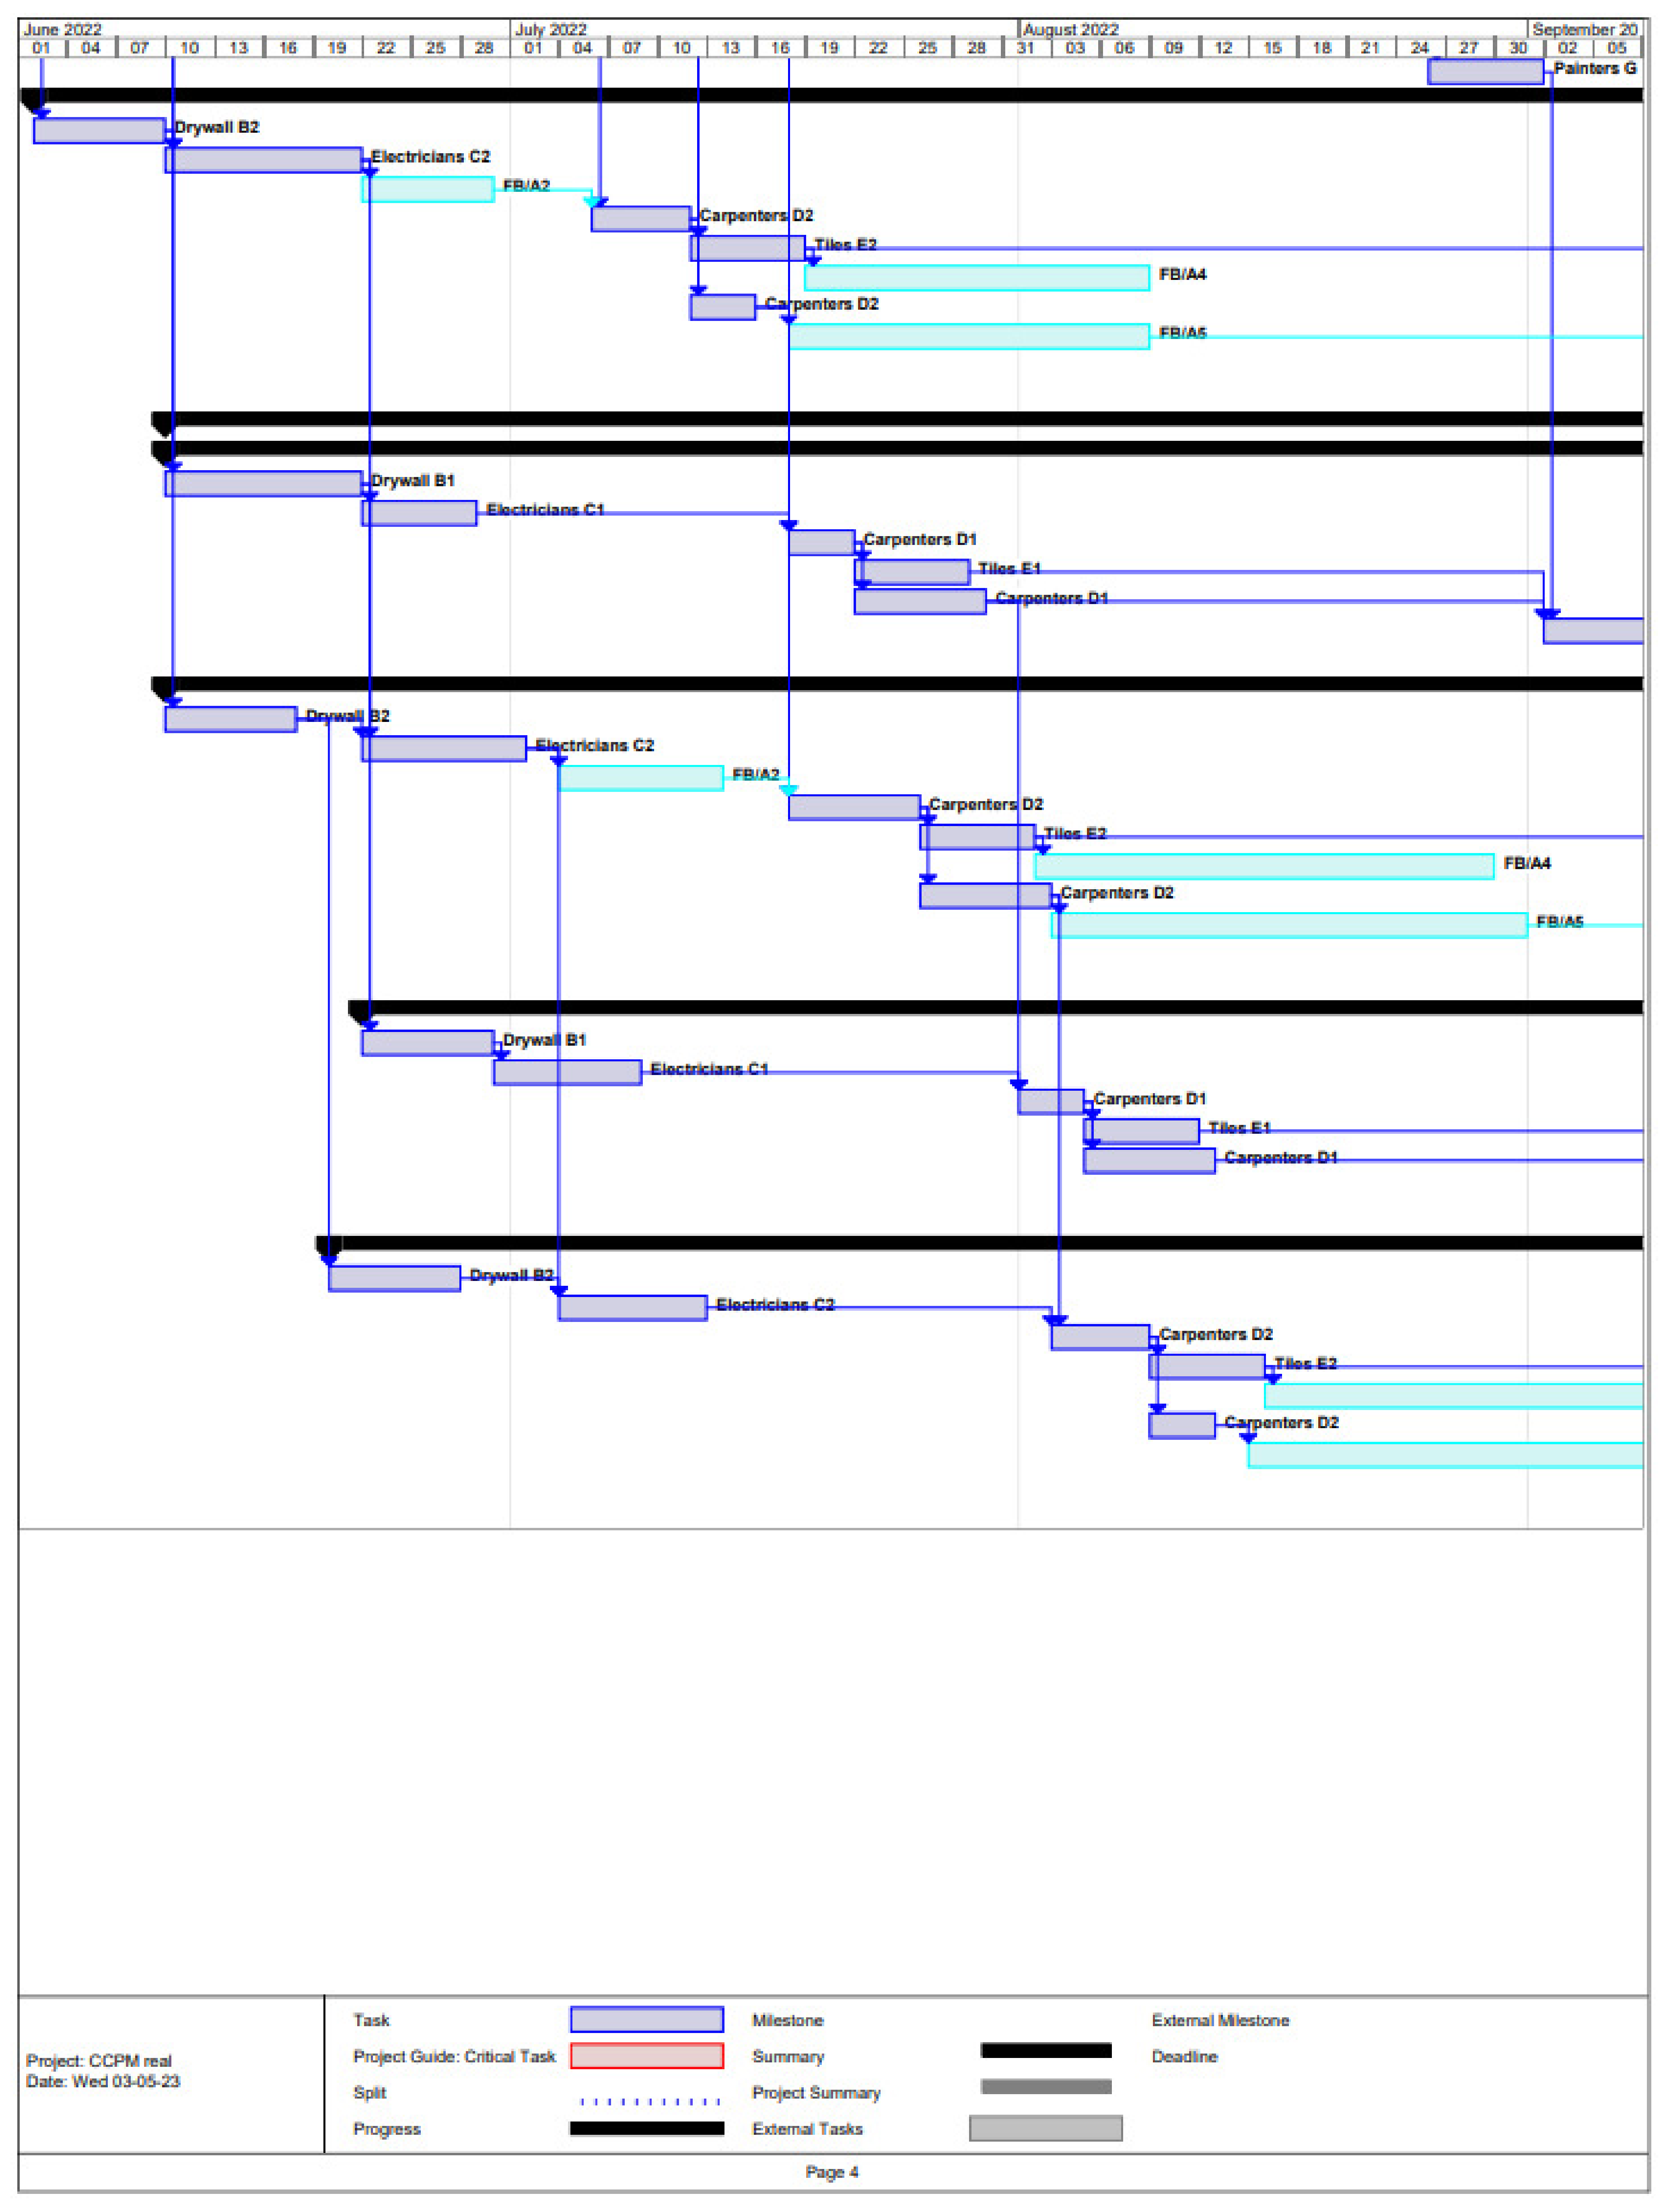
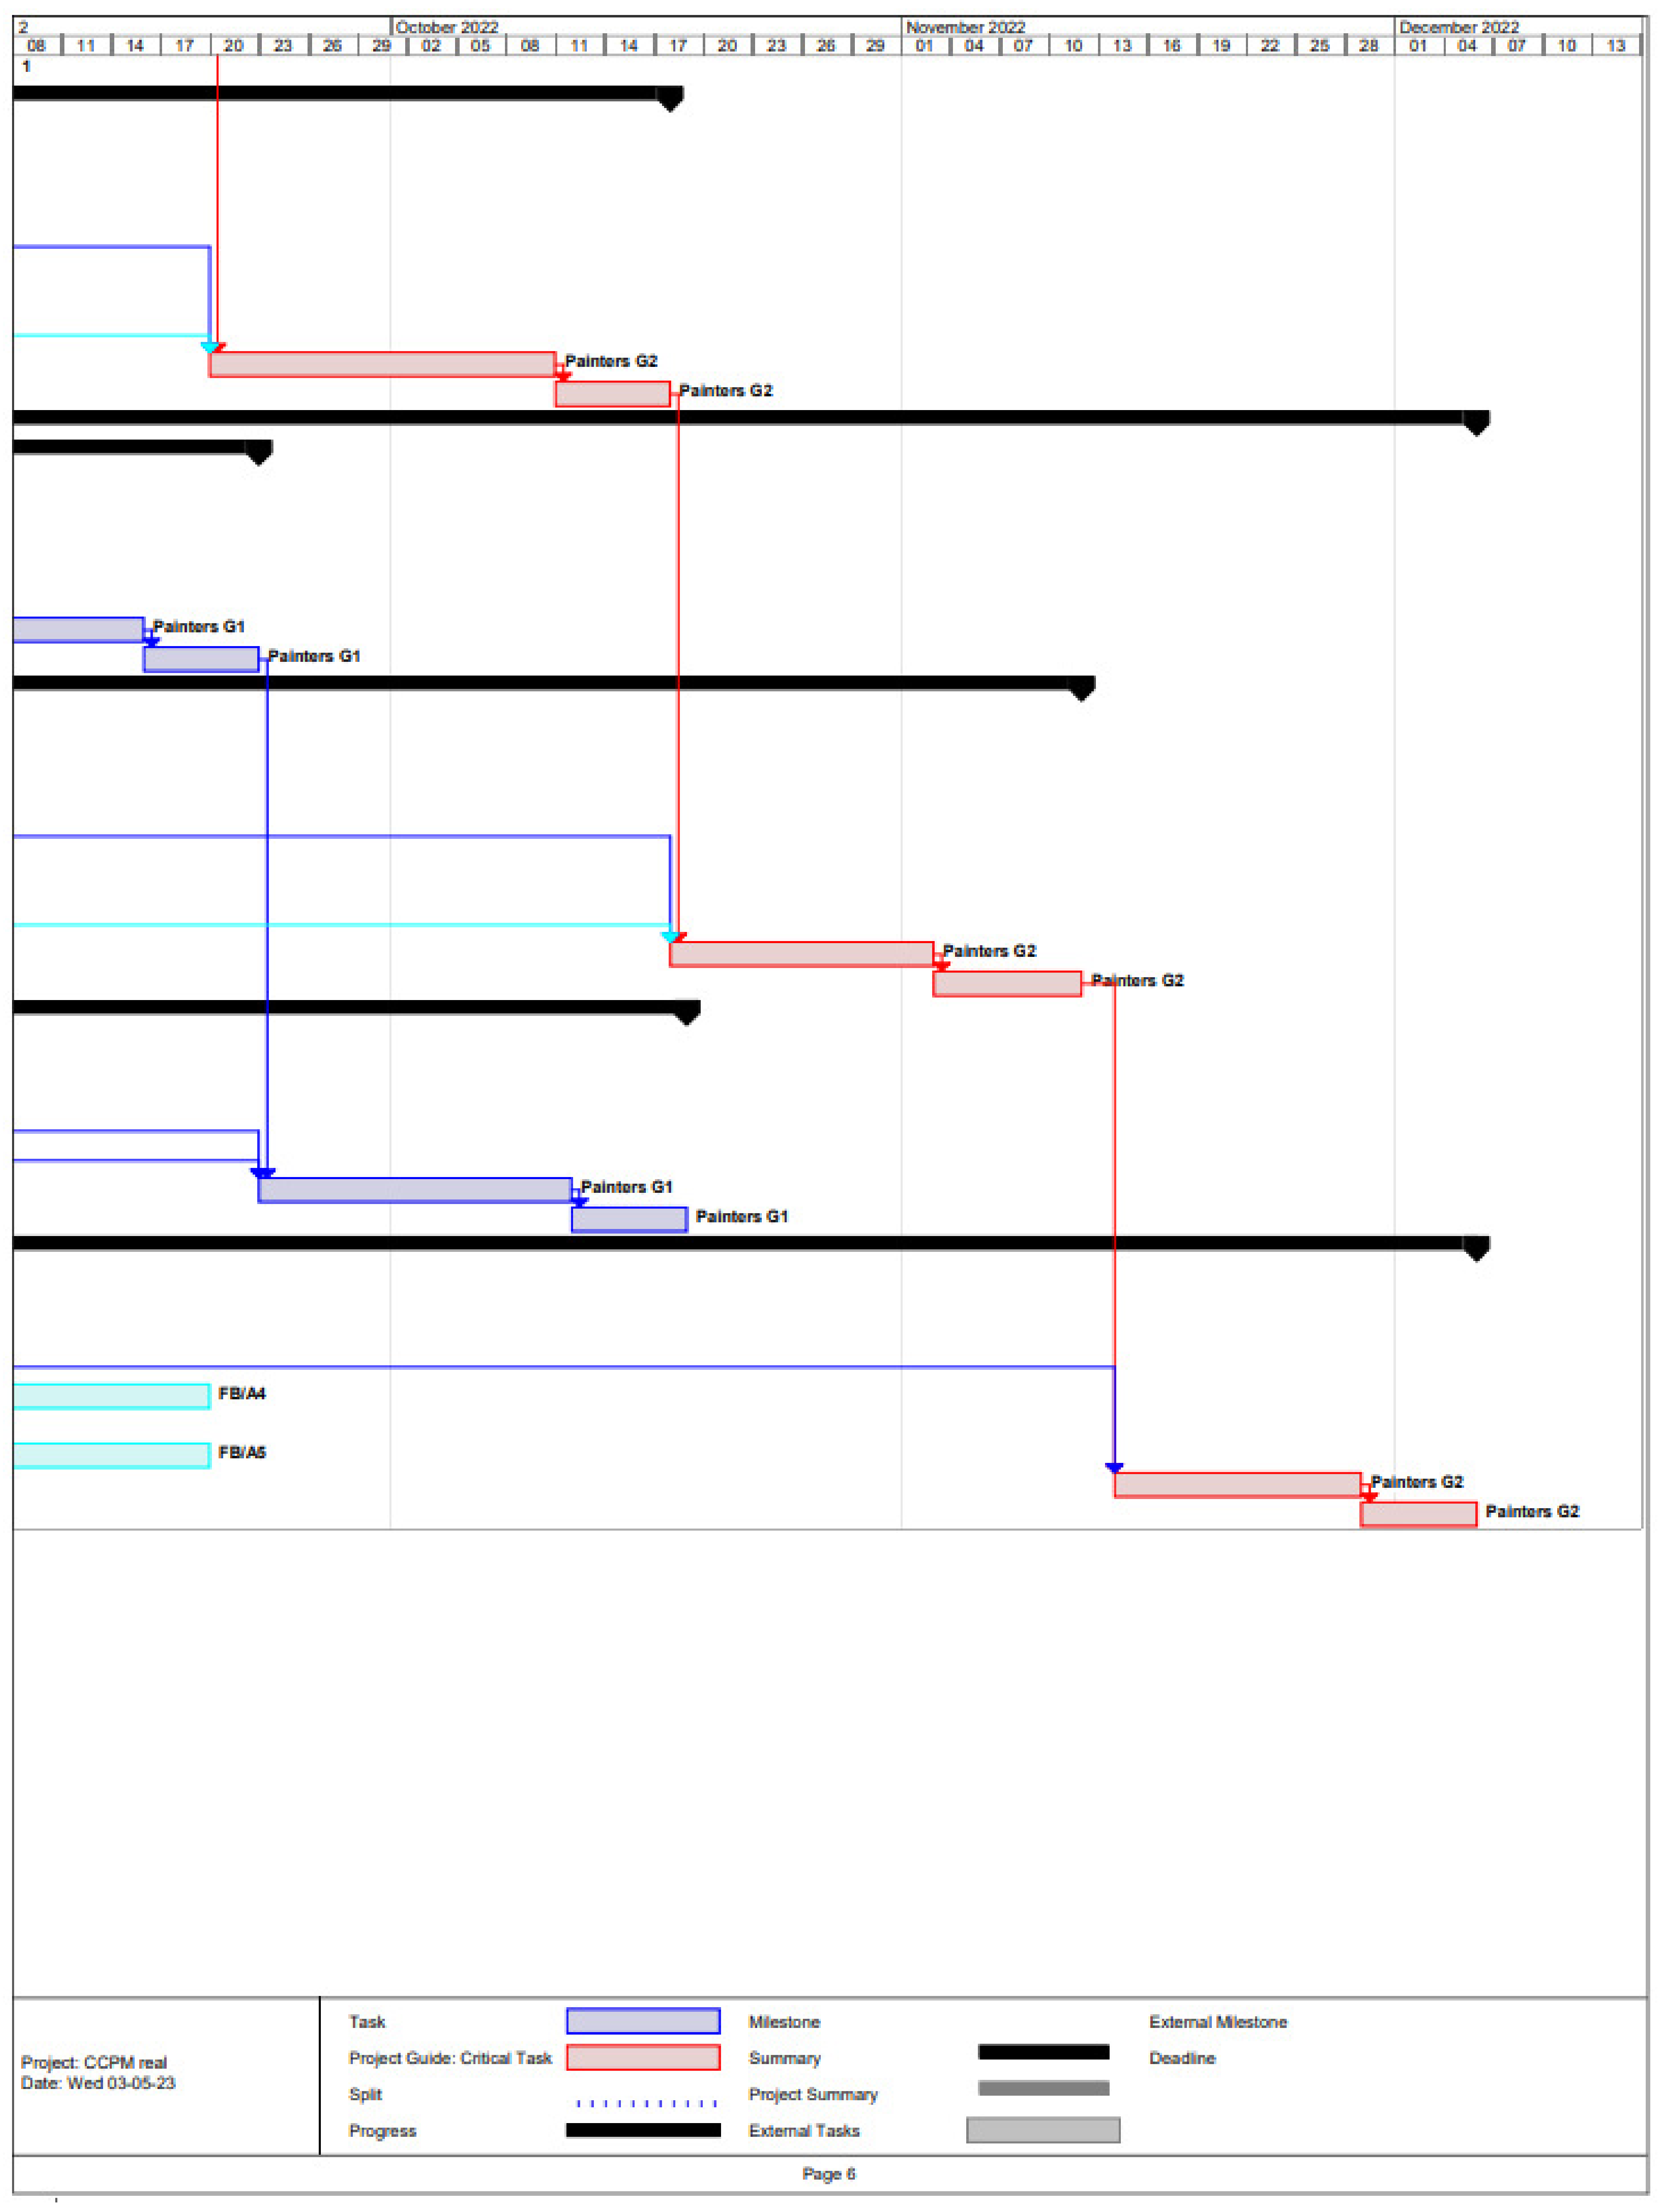
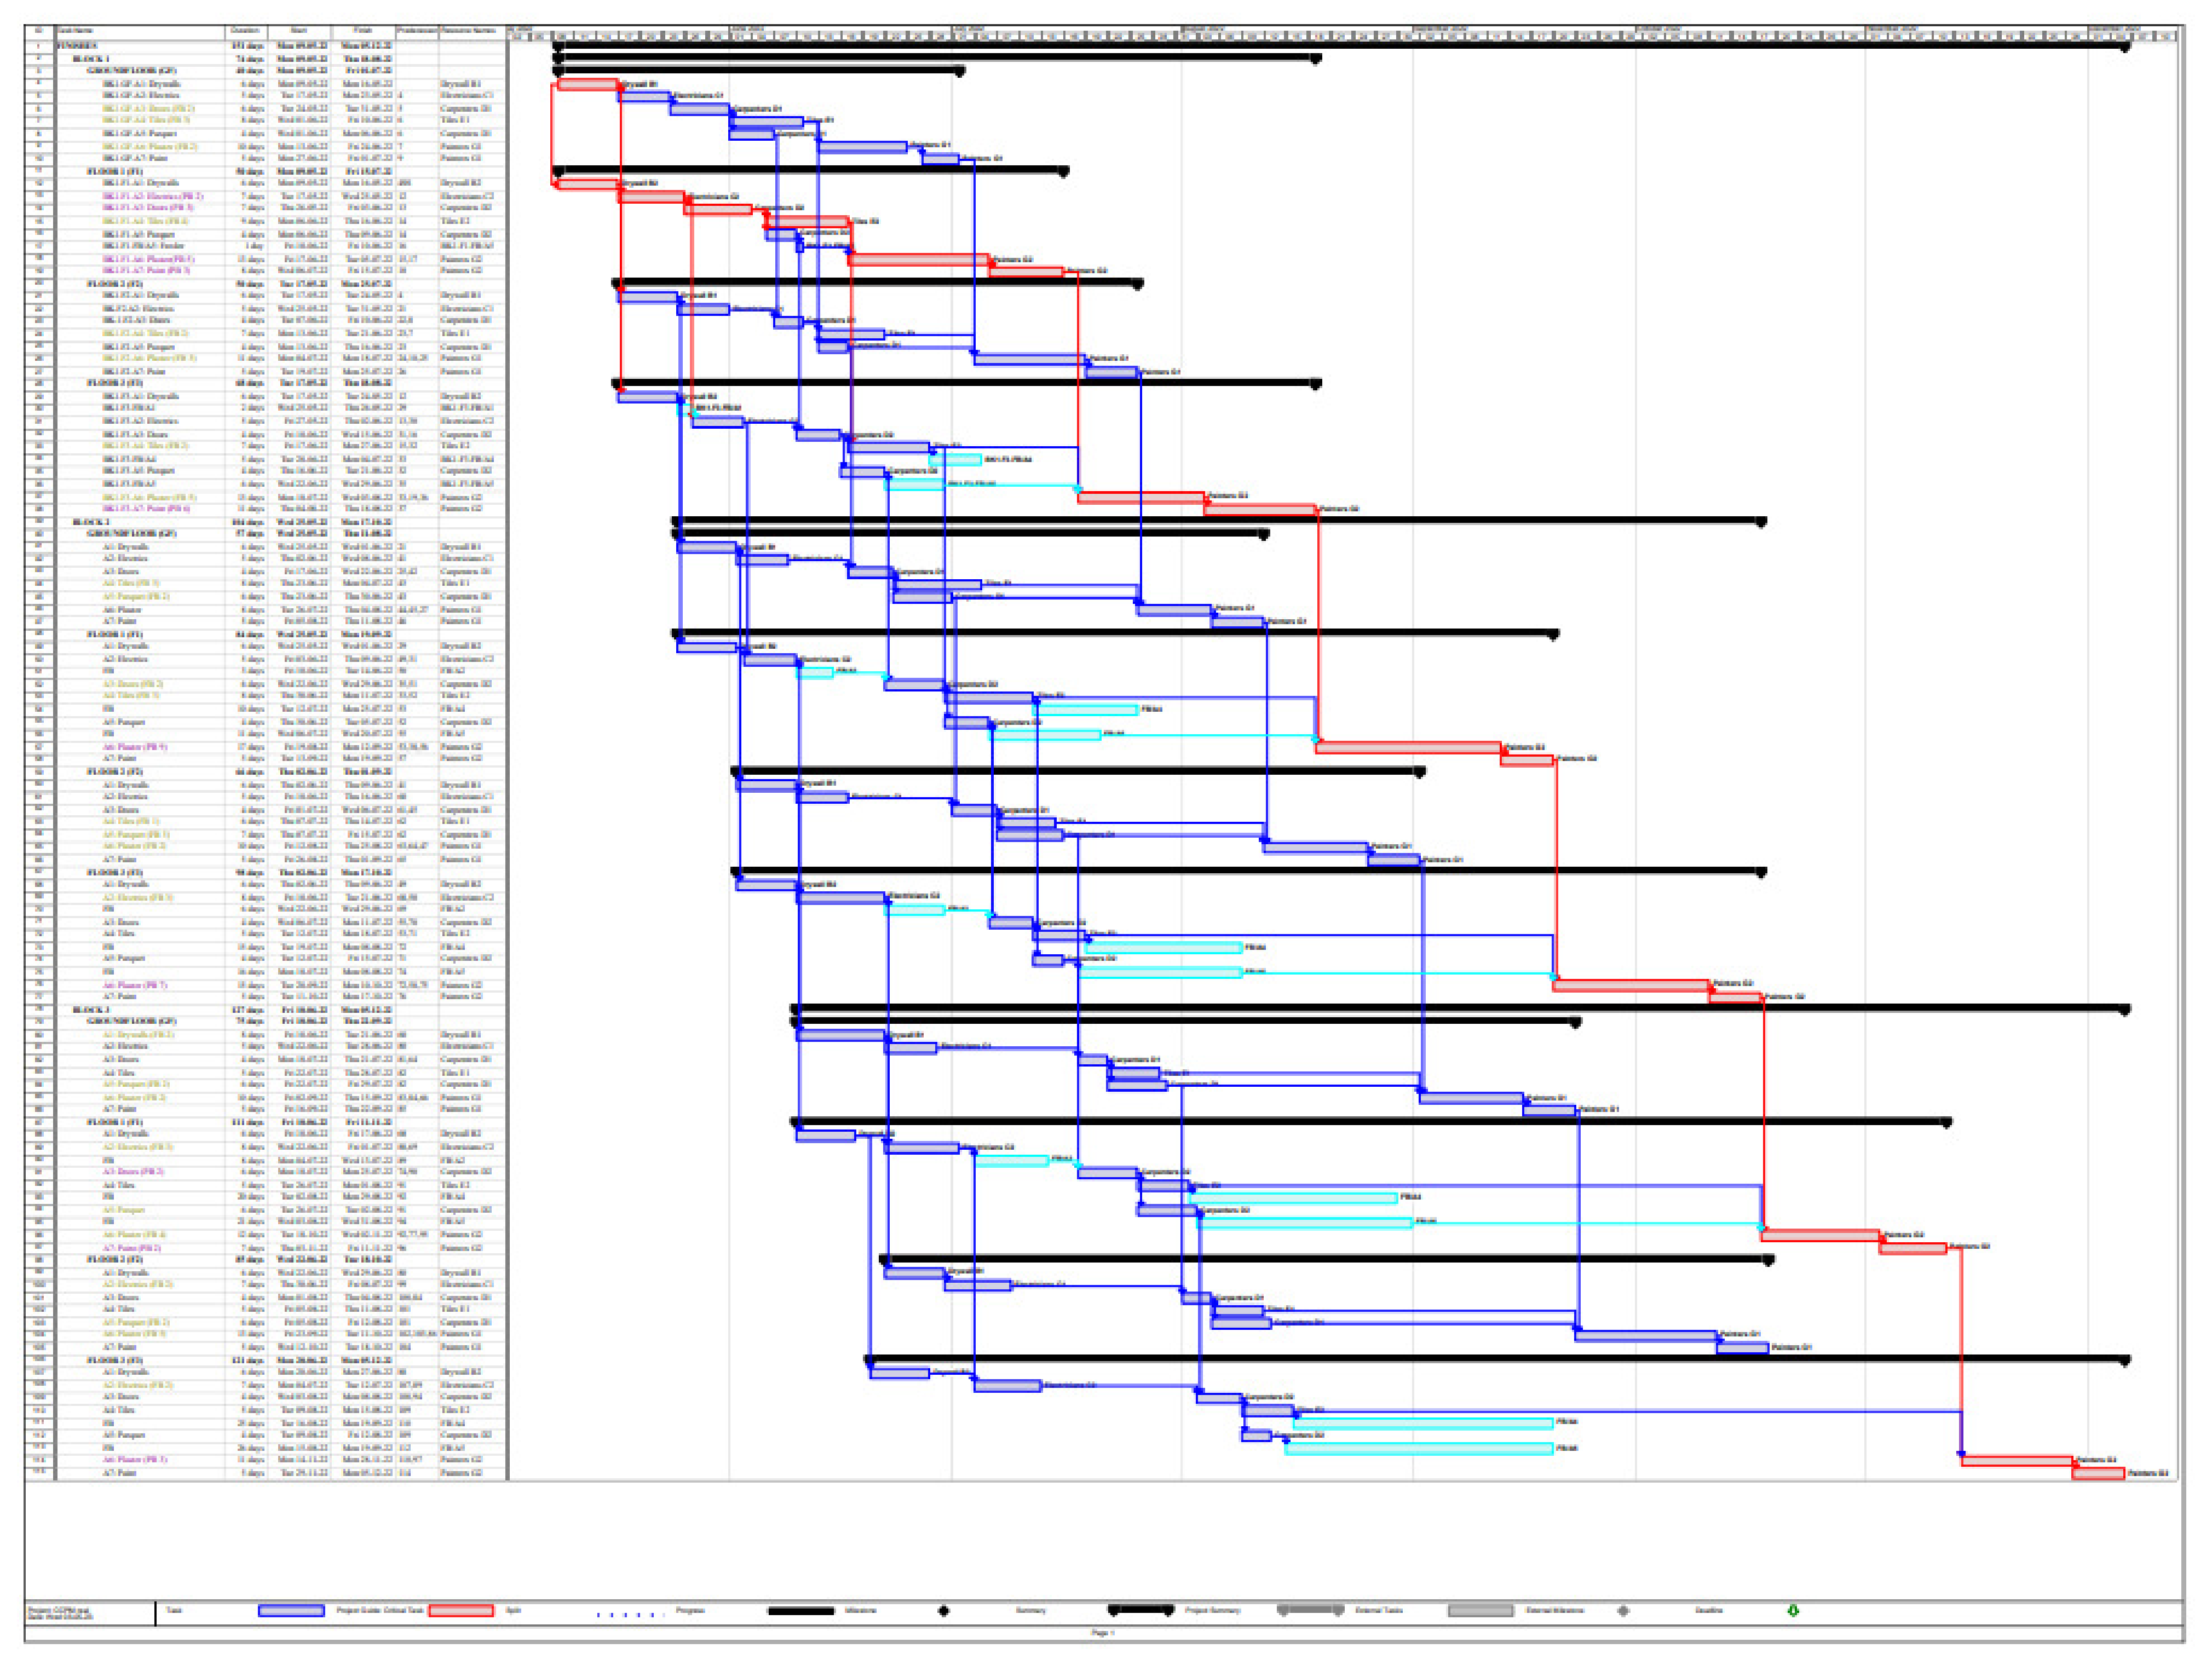
To facilitate the project scheduling and visualization, we utilized Microsoft Project to input the data and generate a Gantt chart. In
Figure 3, the critical path and critical tasks are highlighted in red while non-critical tasks are shown in blue. As the document is very extensive, we have included a detailed print screen in
Appendix A for improved clarity in understanding the tasks and team codes. The visualization provides a clear overview of the critical tasks and their interdependencies, allowing for effective project management and resource allocation.
The total duration of the project was 187 days if using CPM. The estimated schedule for each block/floors was as follows:
- -
BF1: 87 days (GF: 62 days; F1: 62 days; F2: 76 days; F3: 76 days).
- -
BF2: 115 days (GF: 90 days; F1: 90 days; F2: 104 days; F3: 104 days).
- -
BF3: 143 days (GF: 118 days; F1: 118 days; F2: 132 days; F3: 132 days).
These durations were calculated based on CPM and were subject to adjustments during the project execution.
It is important to note that the critical tasks identified in the project schedule have zero float, indicating that any delays in their completion could potentially disrupt subsequent tasks and jeopardize the overall timeline of the project. These critical tasks are crucial for the timely completion of the project, and any delays or disruptions in their execution need to be carefully managed to avoid potential project delays.
3.2. Data Analysis
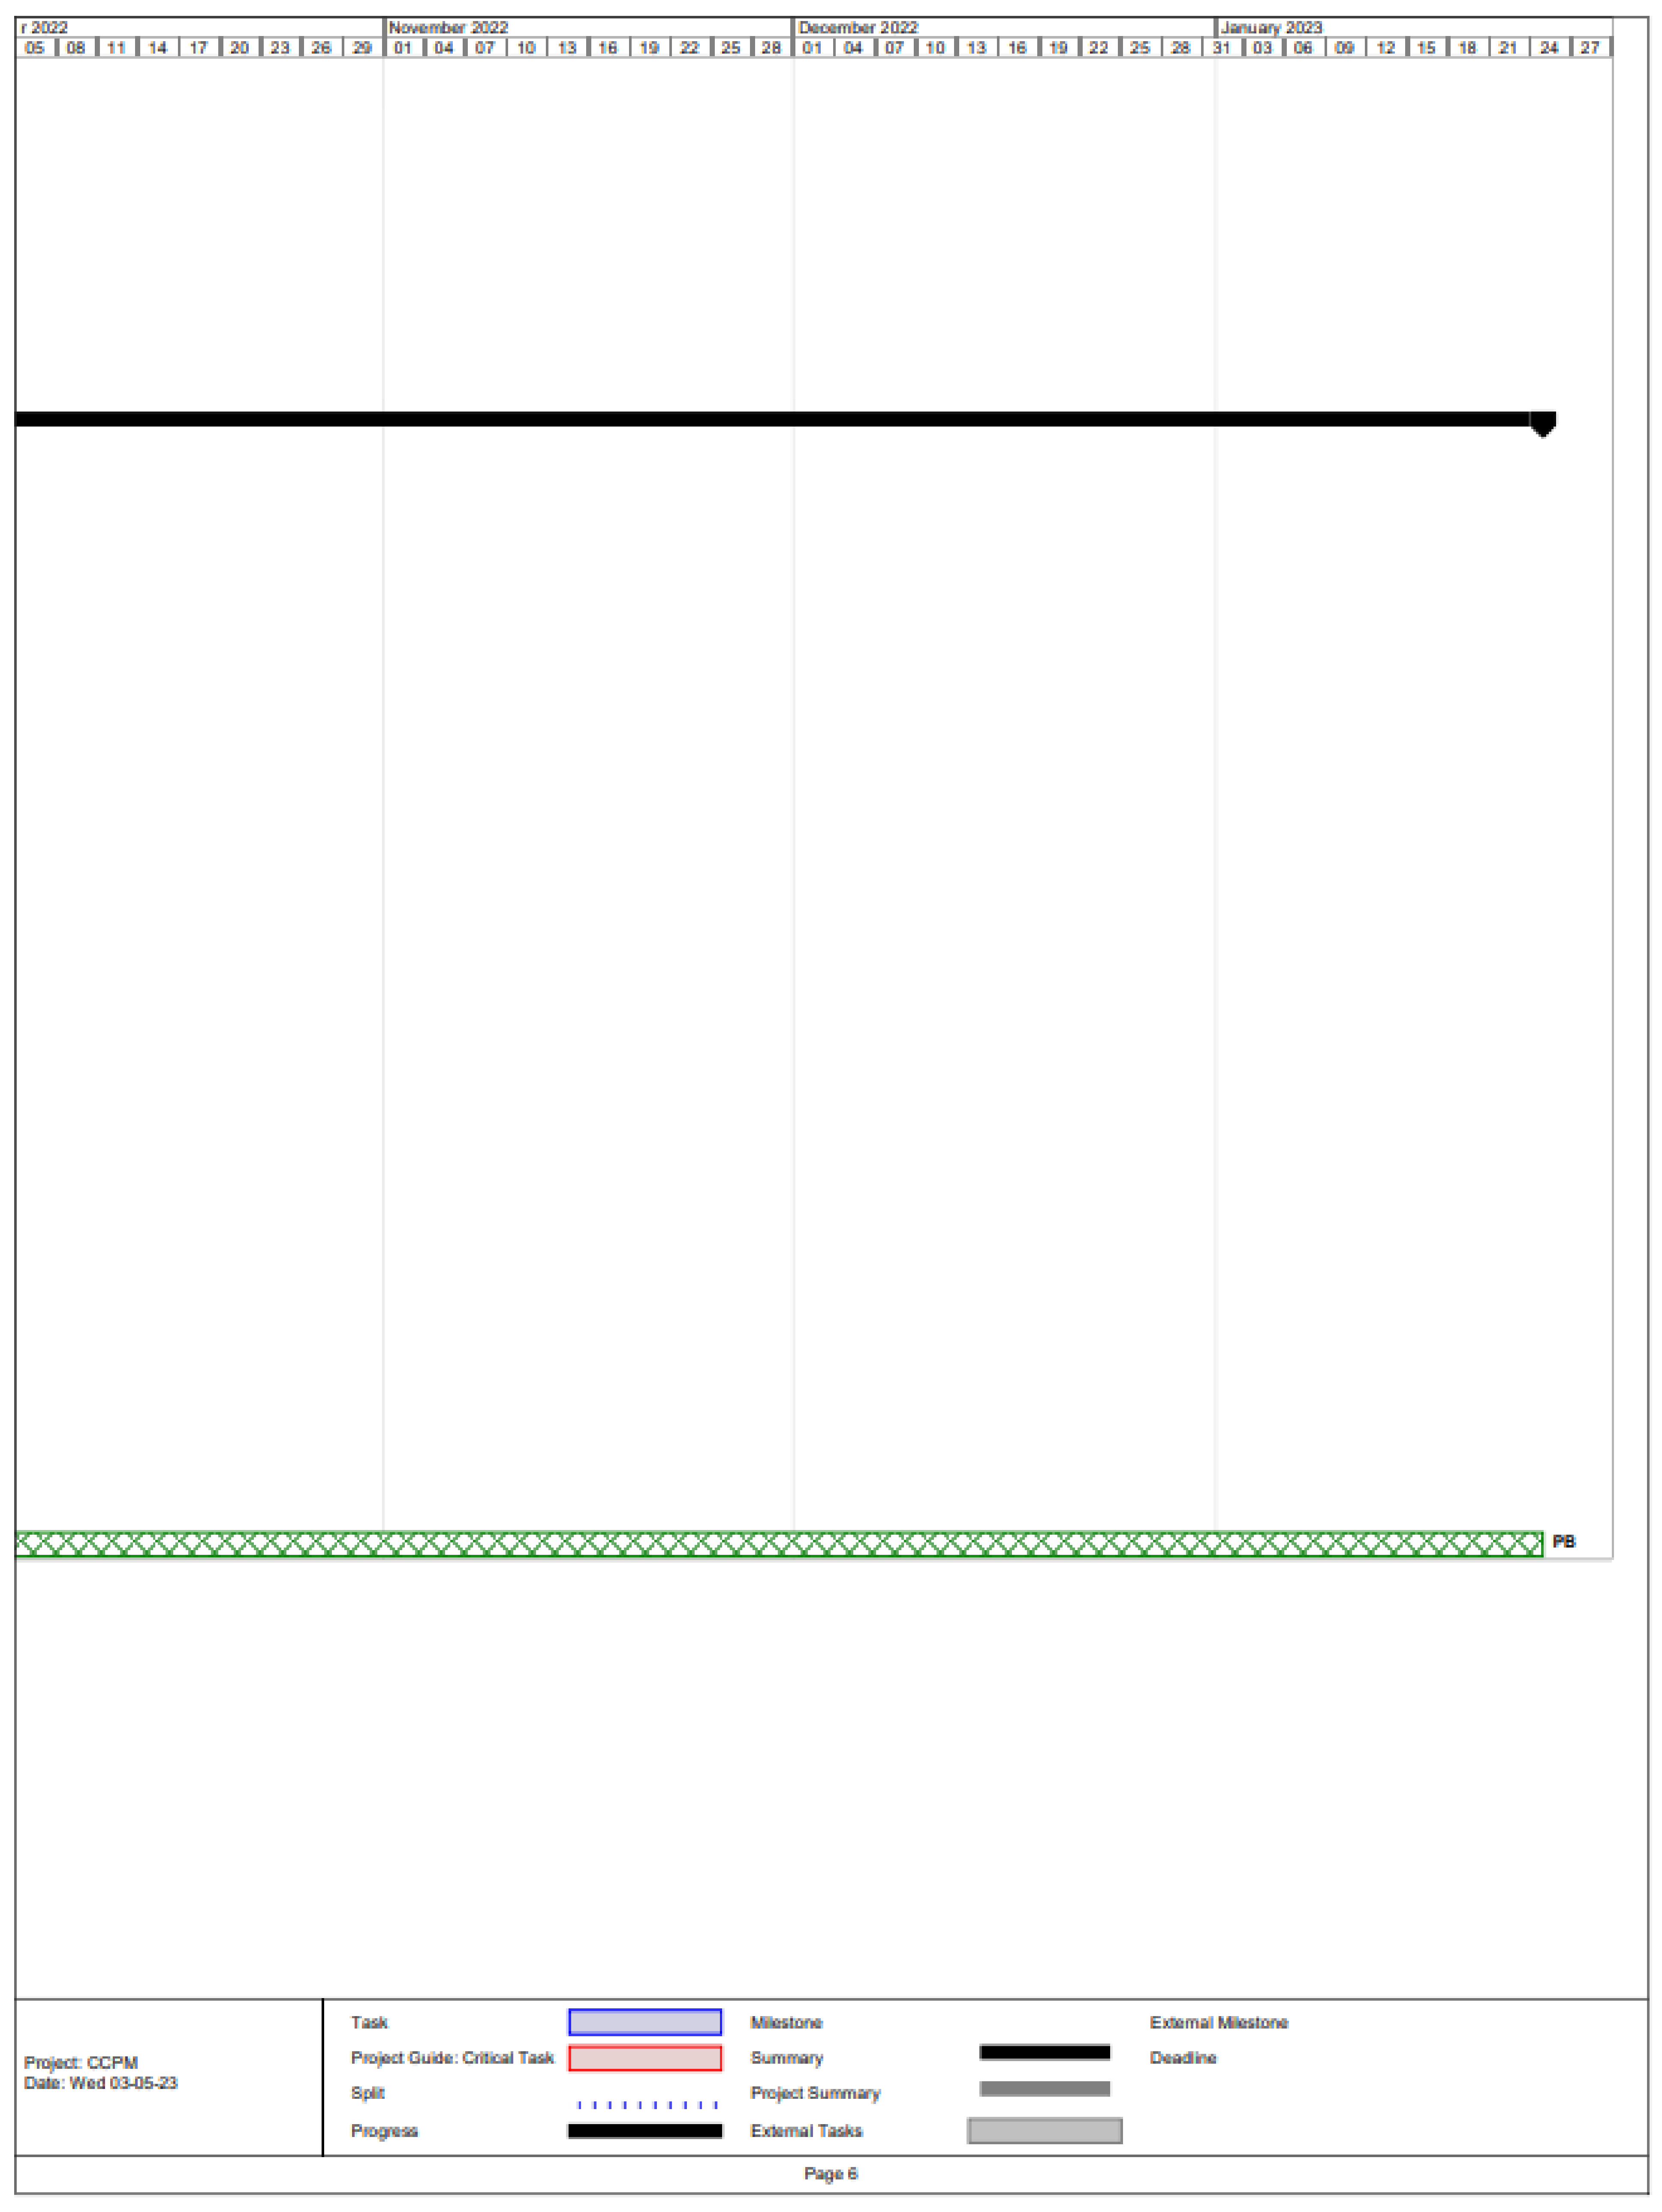
The implementation of CCPM resulted in a reduction of task duration by half, with one half of the original task duration allocated to the tasks themselves and the other half allocated as project buffer (PB) at the end of the schedule. This approach aimed to protect the tasks against the worst scenario (potential delays), mitigating the impact of worst-case scenarios.
Non-critical tasks that were meeting the critical ones were scheduled as late start activities, and a feeder buffer (FB) was allocated to each of them. The purpose of FB was to protect the critical chain from being impacted by delays in non-critical tasks.
The calculation of FB duration followed the same algorithm as the project buffer did, as shown in
Table 2. This approach helped ensure that non-critical tasks did not negatively affect the critical path and allowed for better management of potential delays in the project schedule.
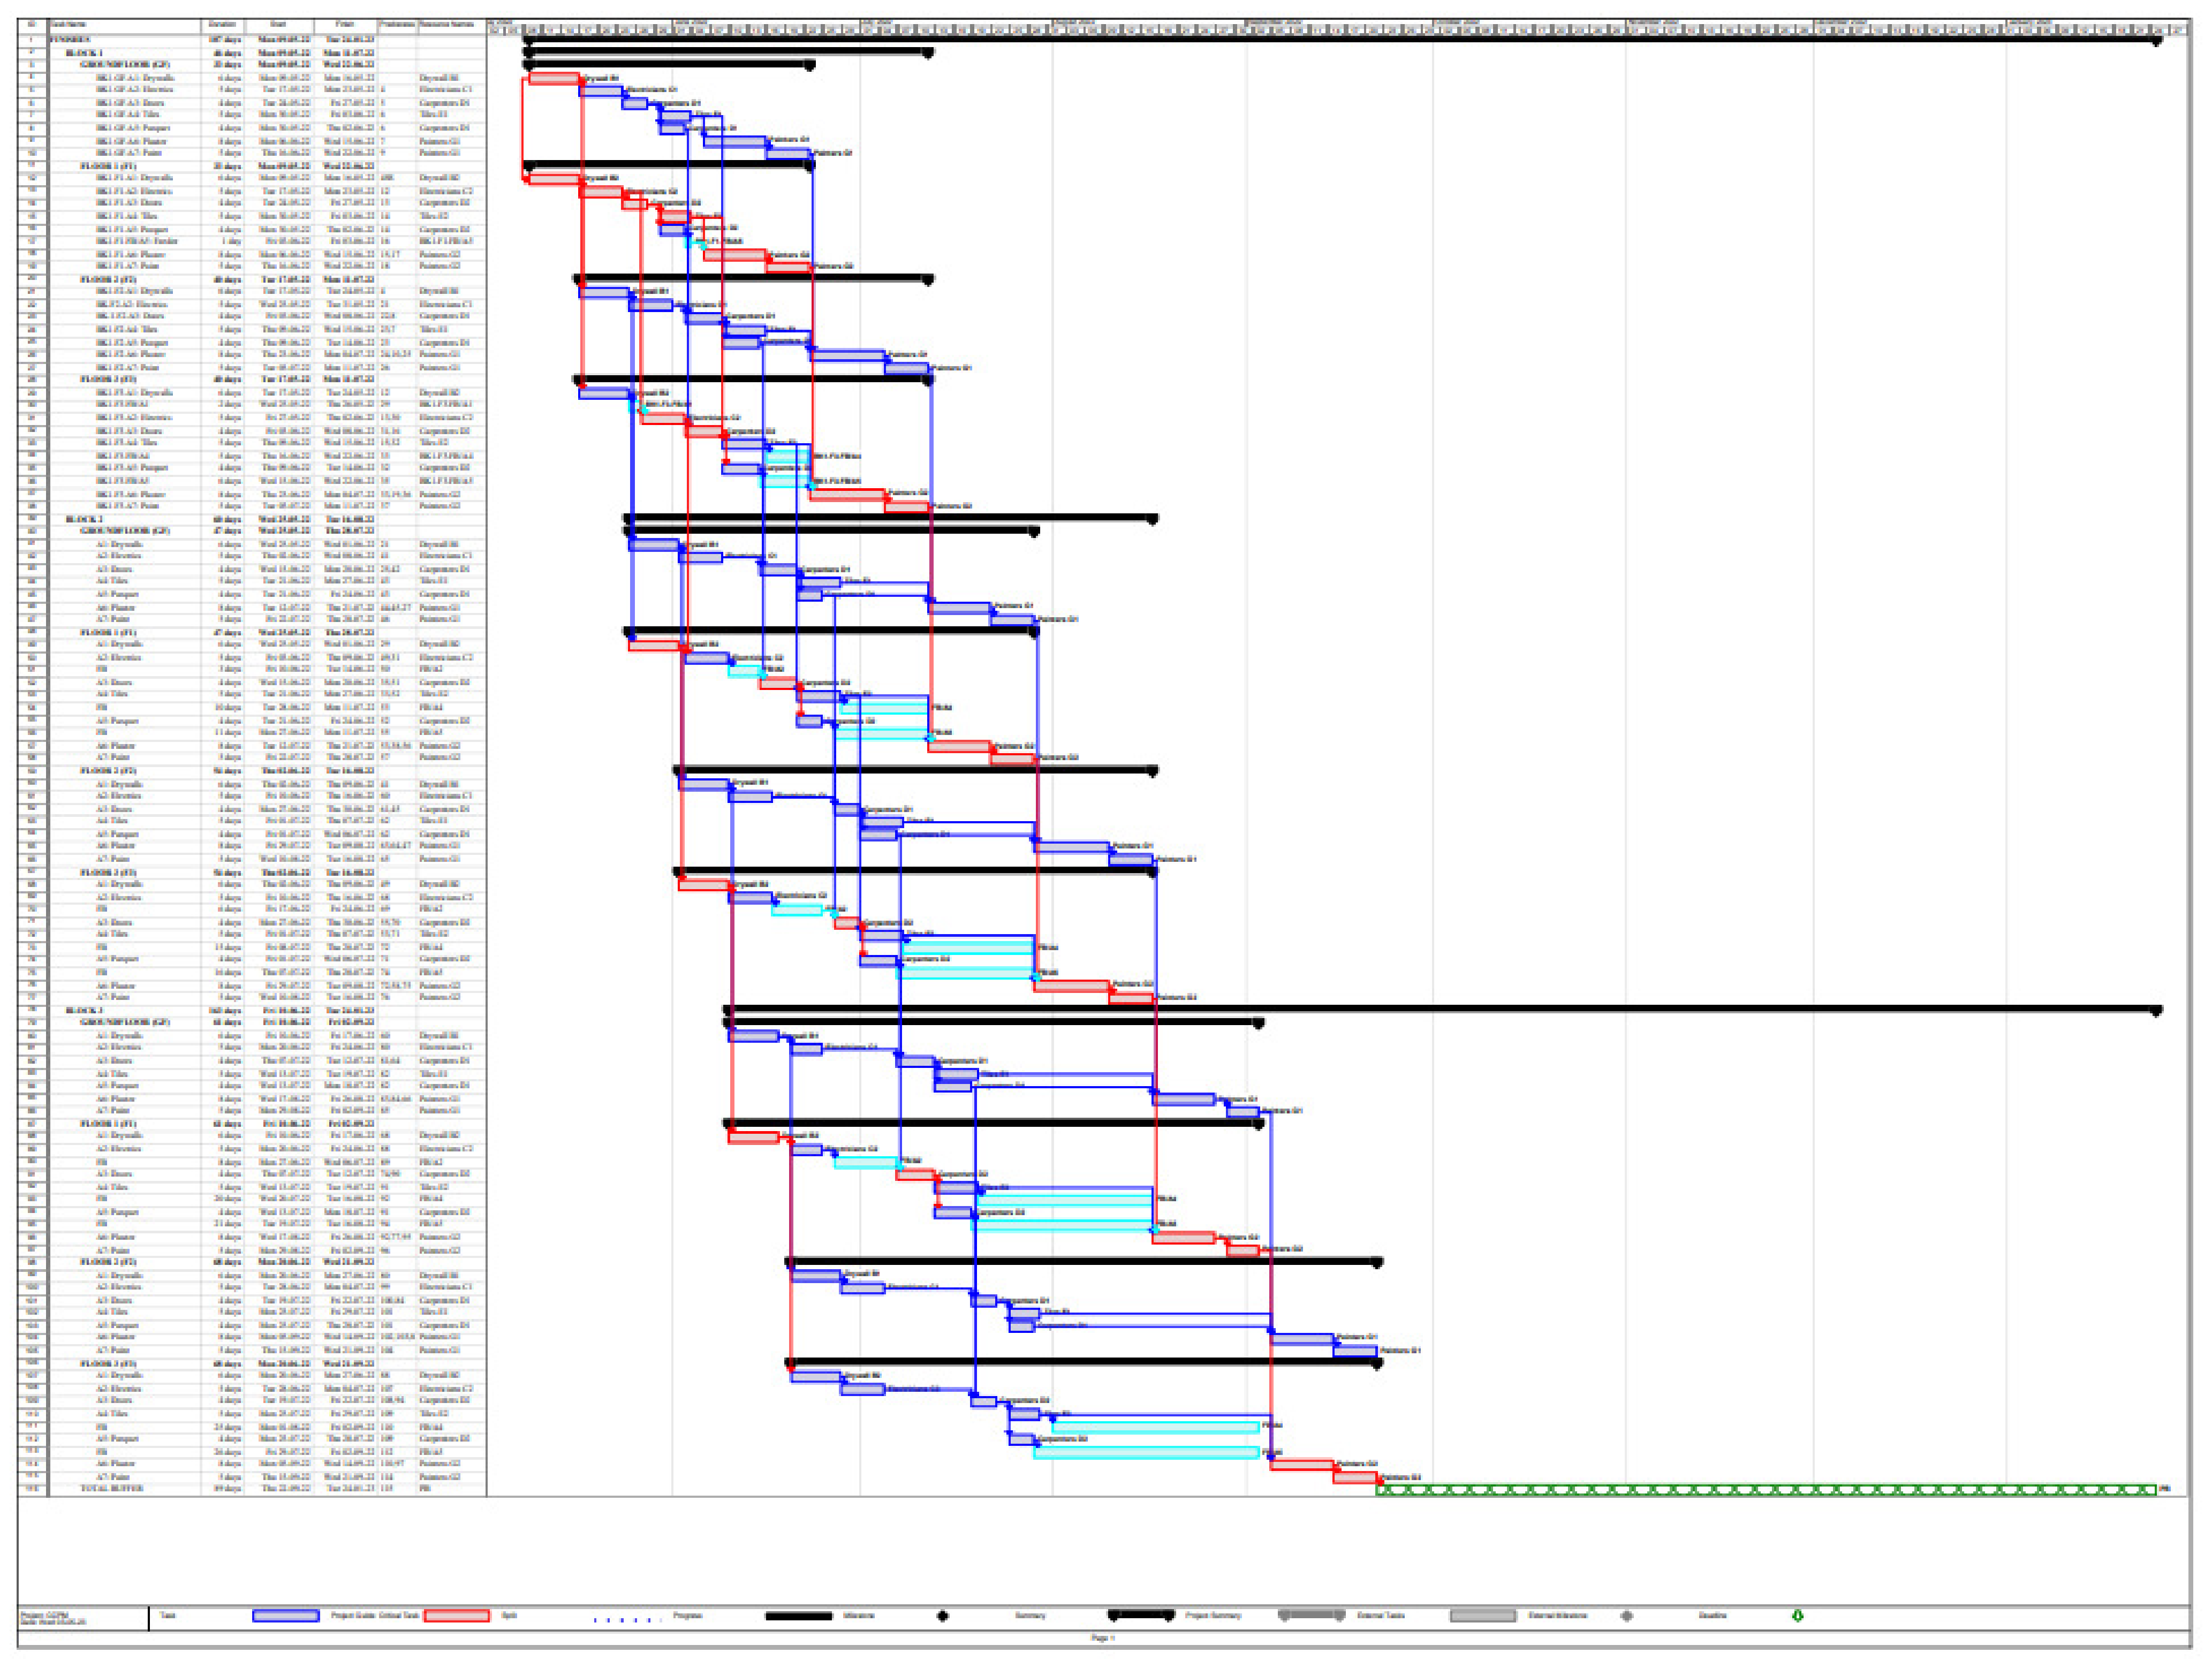
In
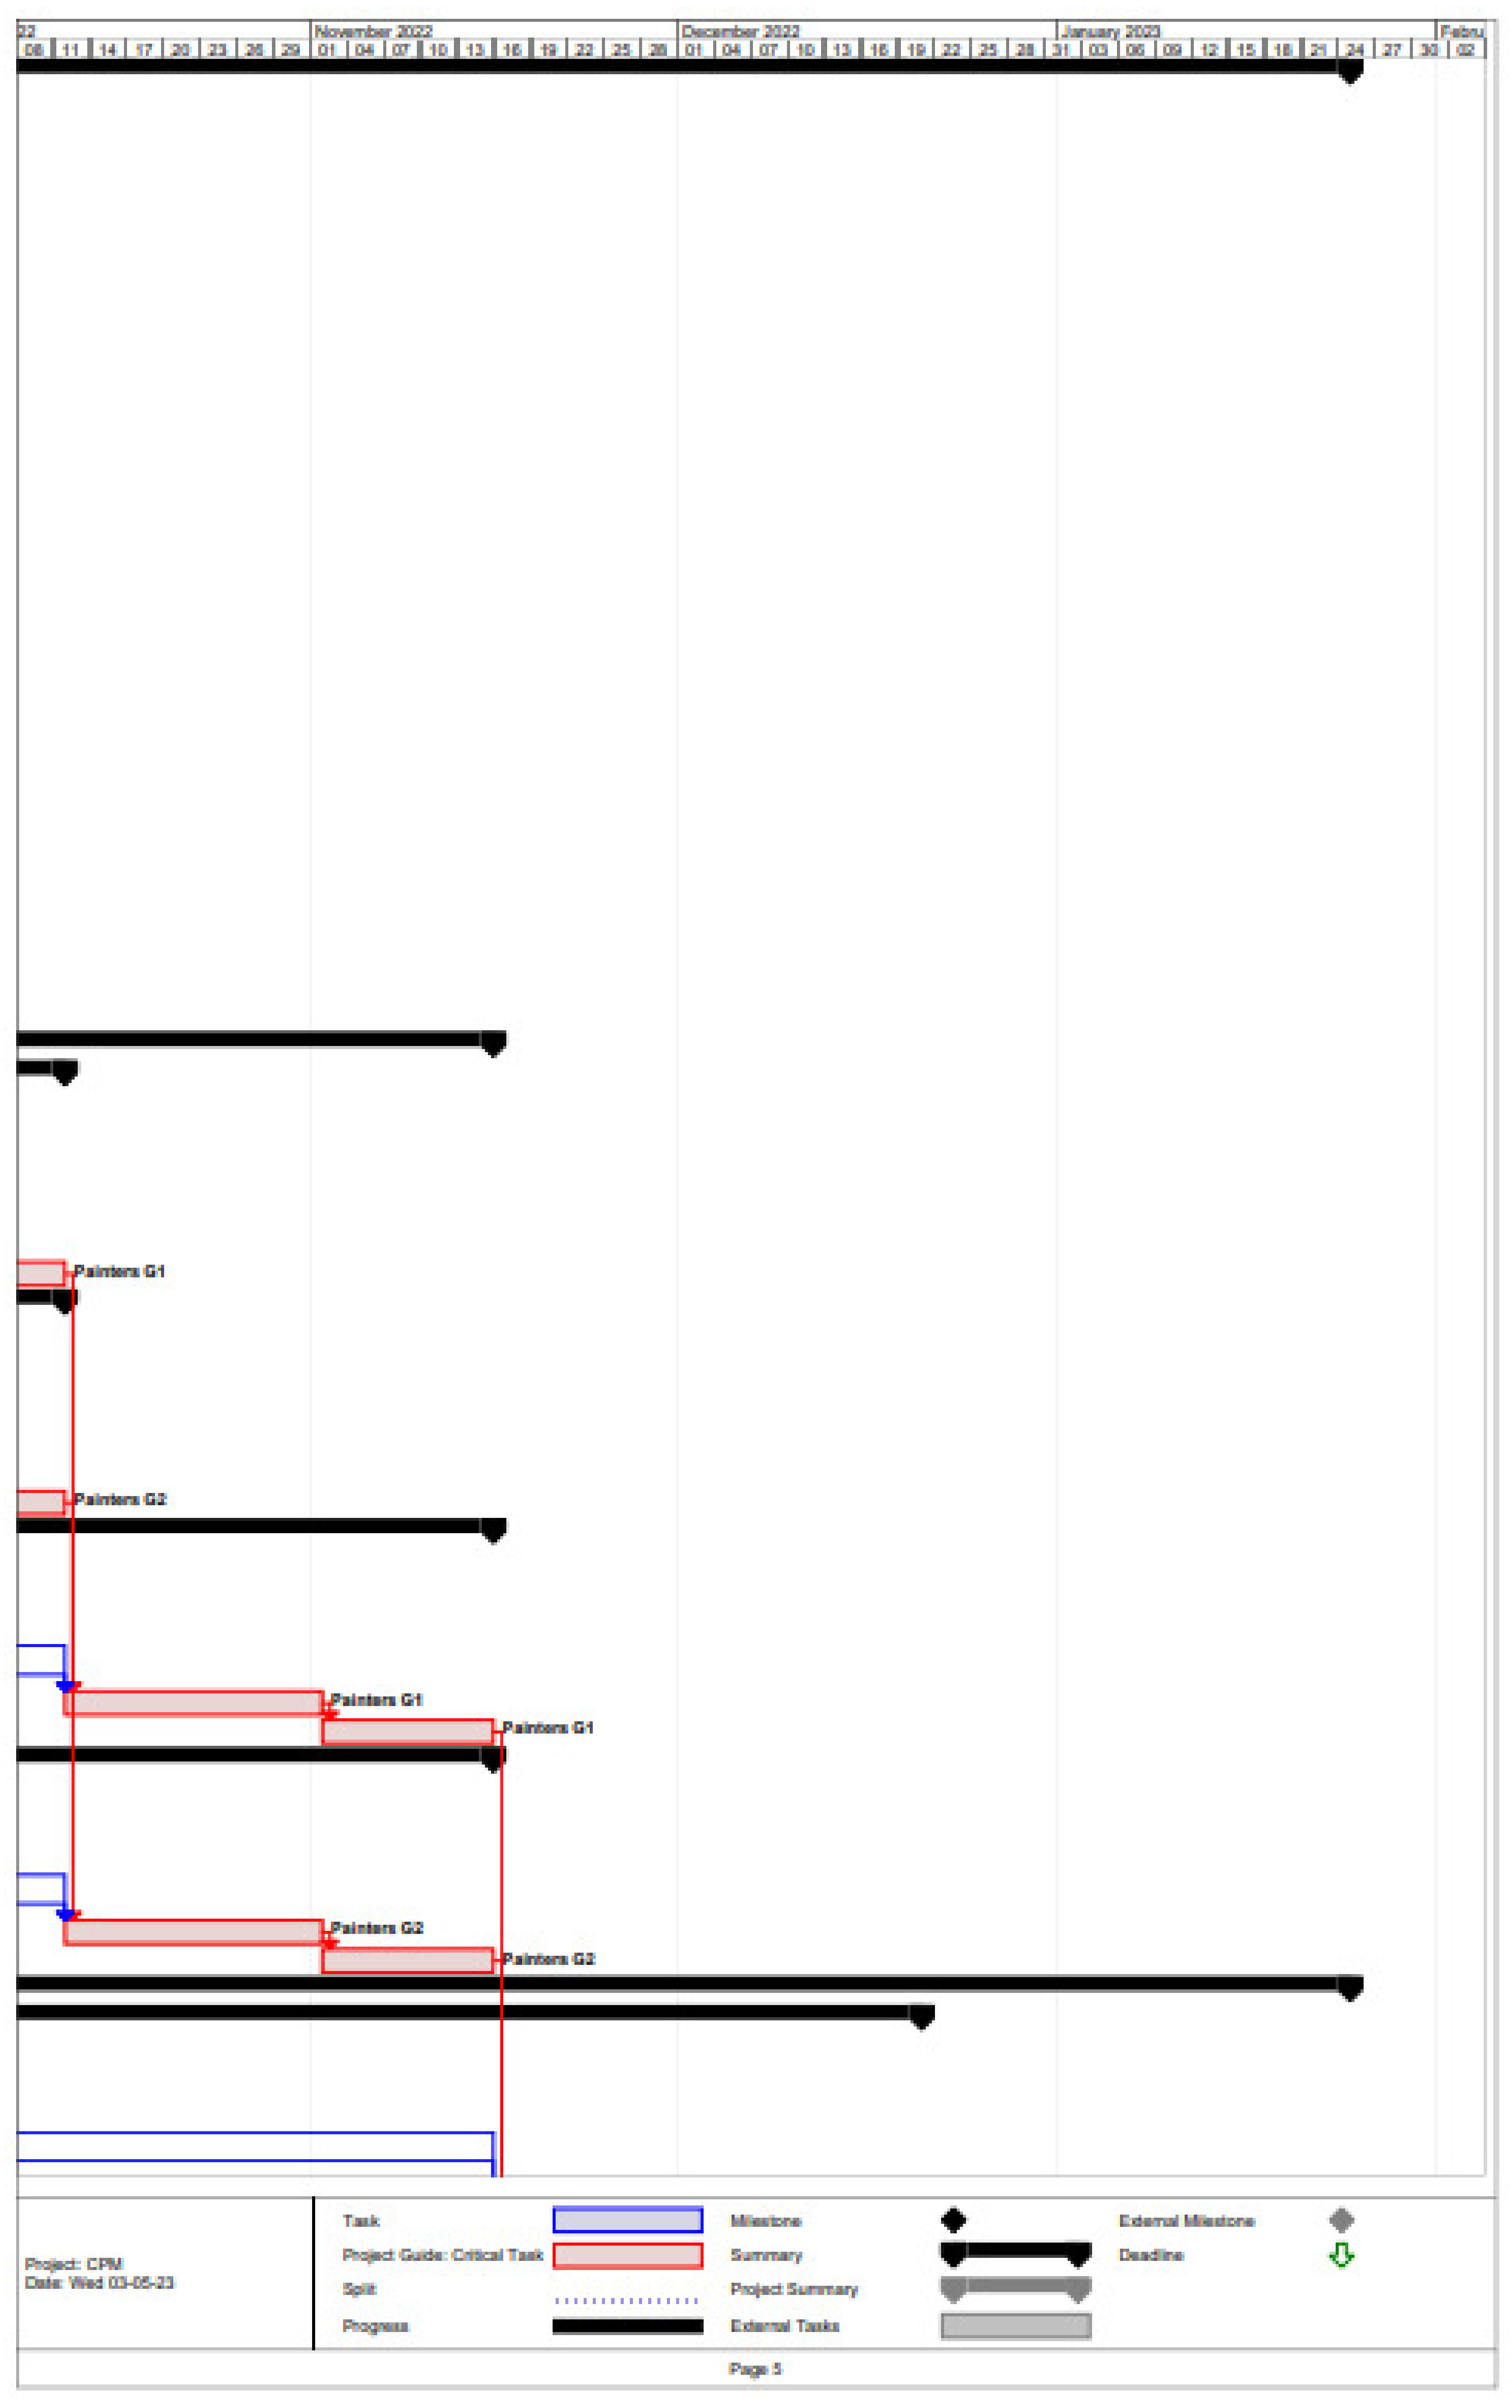
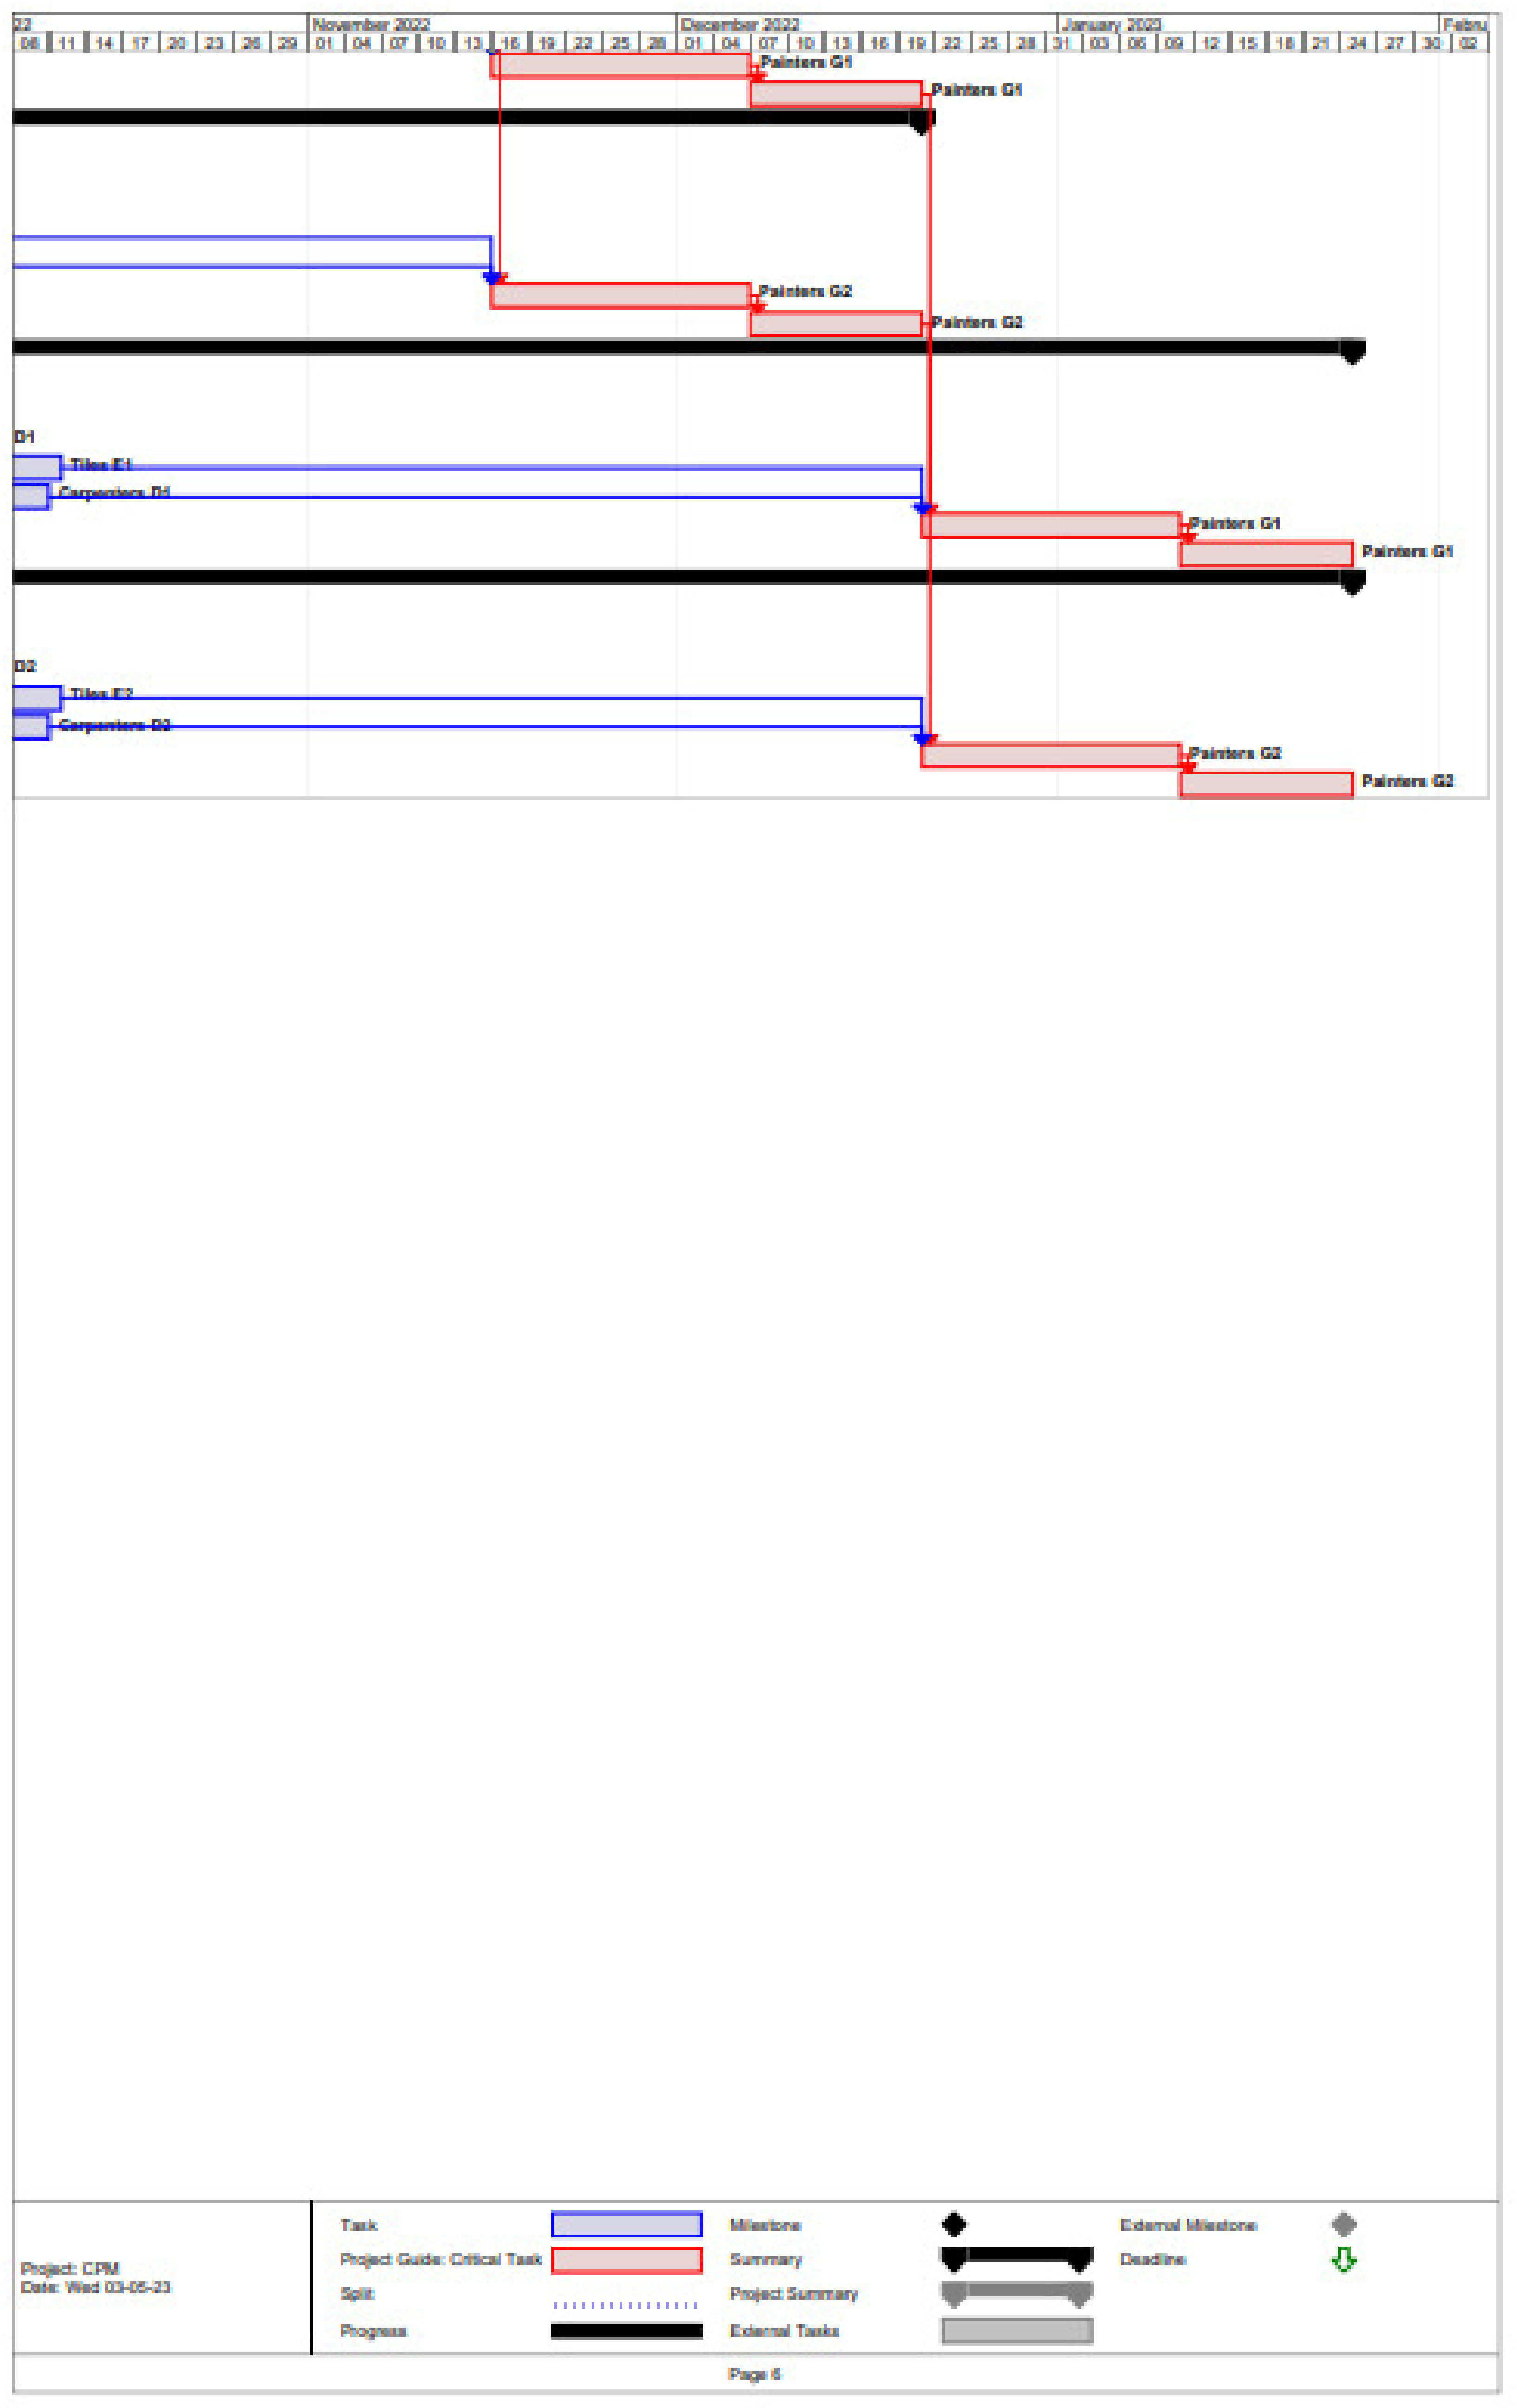
Figure 4, the ideal implementation of CCPM is depicted, where all tasks have durations reduced to half of their originally calculated values. This results in a total project duration of 98 days, with critical tasks shown in red and non-critical tasks in dark blue. The remaining 89 days are allocated at the end of the project as a Project Buffer (shown in green). The Feeder Buffer, represented in light blue, is allocated to the main activities to protect the critical chain from potential delays caused by non-critical tasks: BK1 (F1/A5, F3/A1, F3/A4, F3/A5); BK2 (F1/A2, F1/A4, F1/A5, F3/A2, F3/A4, F3/A5); BK3 (F1/A2, F1/A4, F1/A5, F3/A4, F3/A5).
As the document is very extensive, we have included a detailed print screen in
Appendix B for improved clarity in understanding the buffers of the project (FB, PB).
This visual representation helps illustrate how the implementation of CCPM can result in a more efficient and robust project schedule with reduced task durations and buffers strategically placed to manage risks and uncertainties.
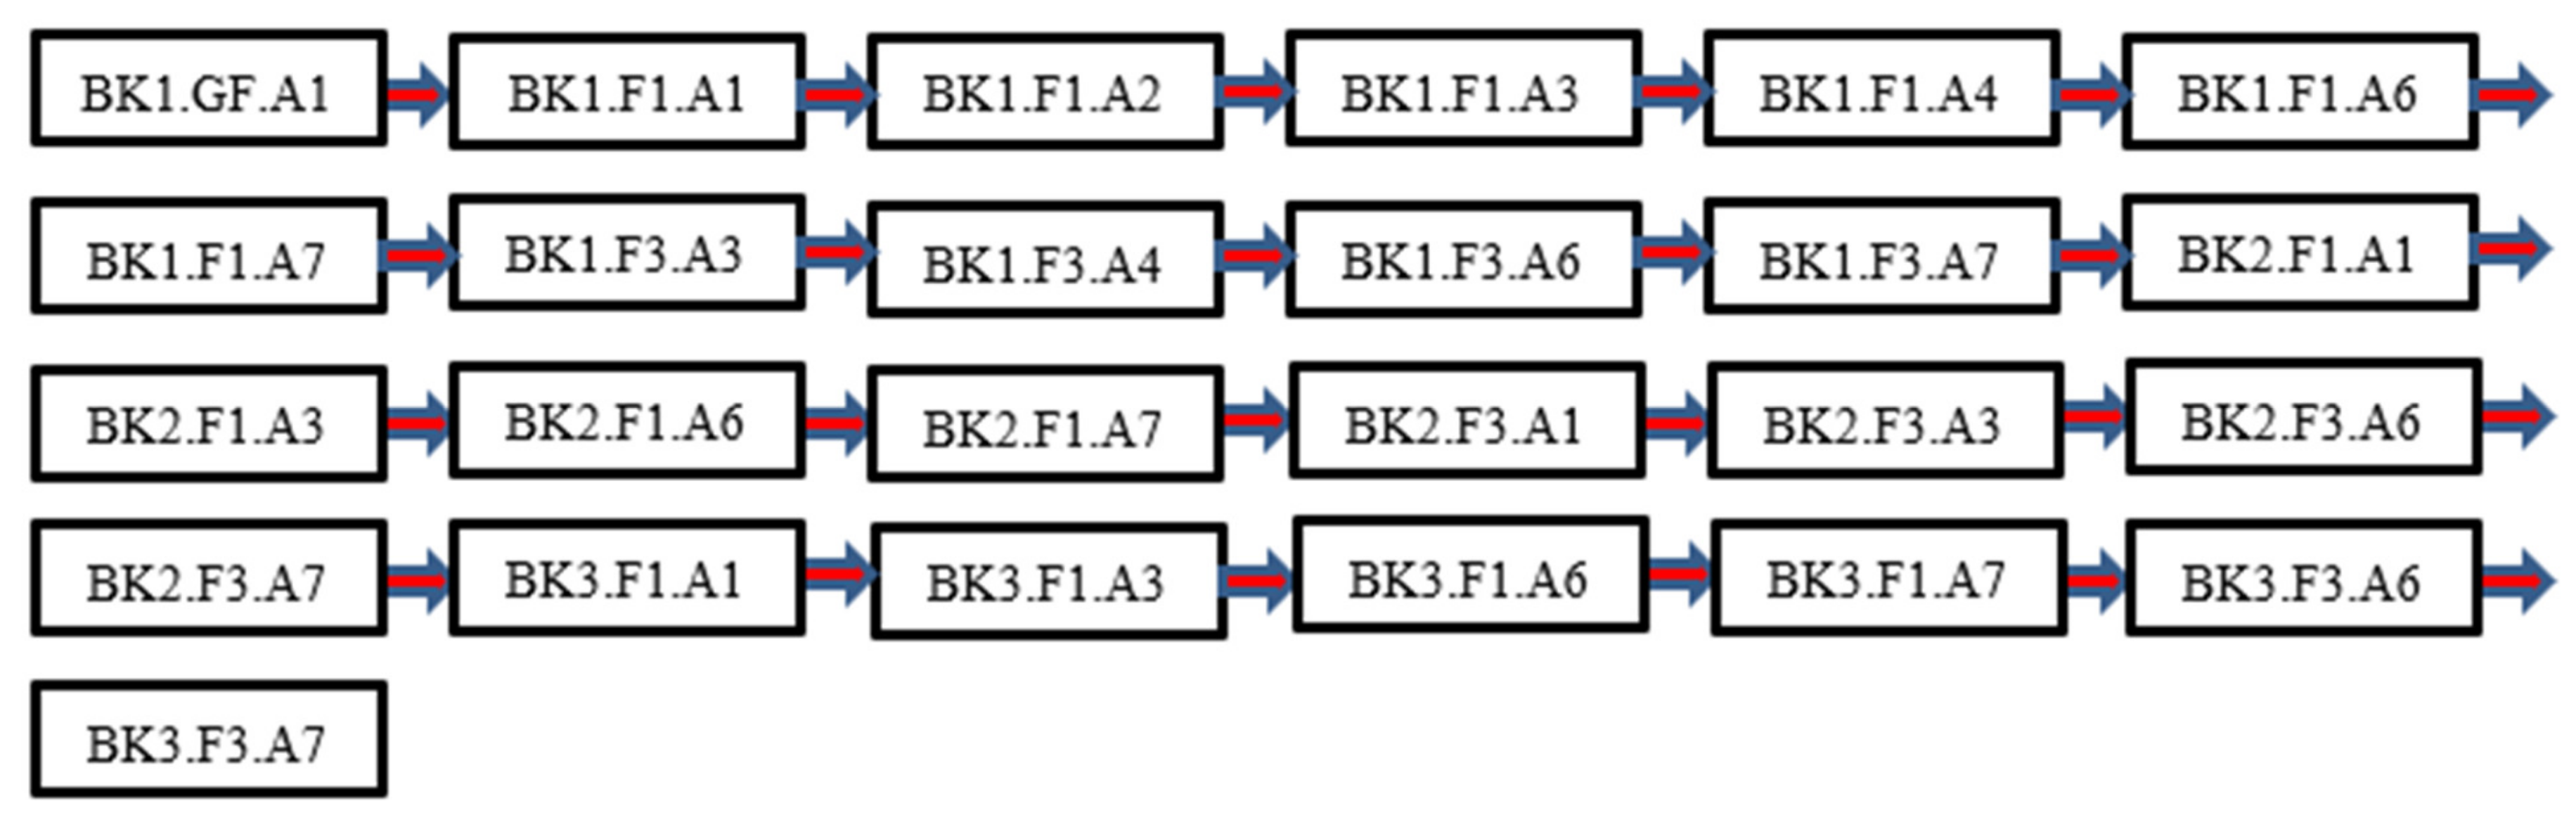
The activities belonging to the critical path of the project is like that shown in
Figure 5:
In the monitoring and evaluation process of task execution, every three days checking was performed with weekly evaluations. Delays in activities recovered from the Feeder Buffer (FB) and Project Buffer (PB) are presented in
Table 3,
Table 4 and
Table 5.
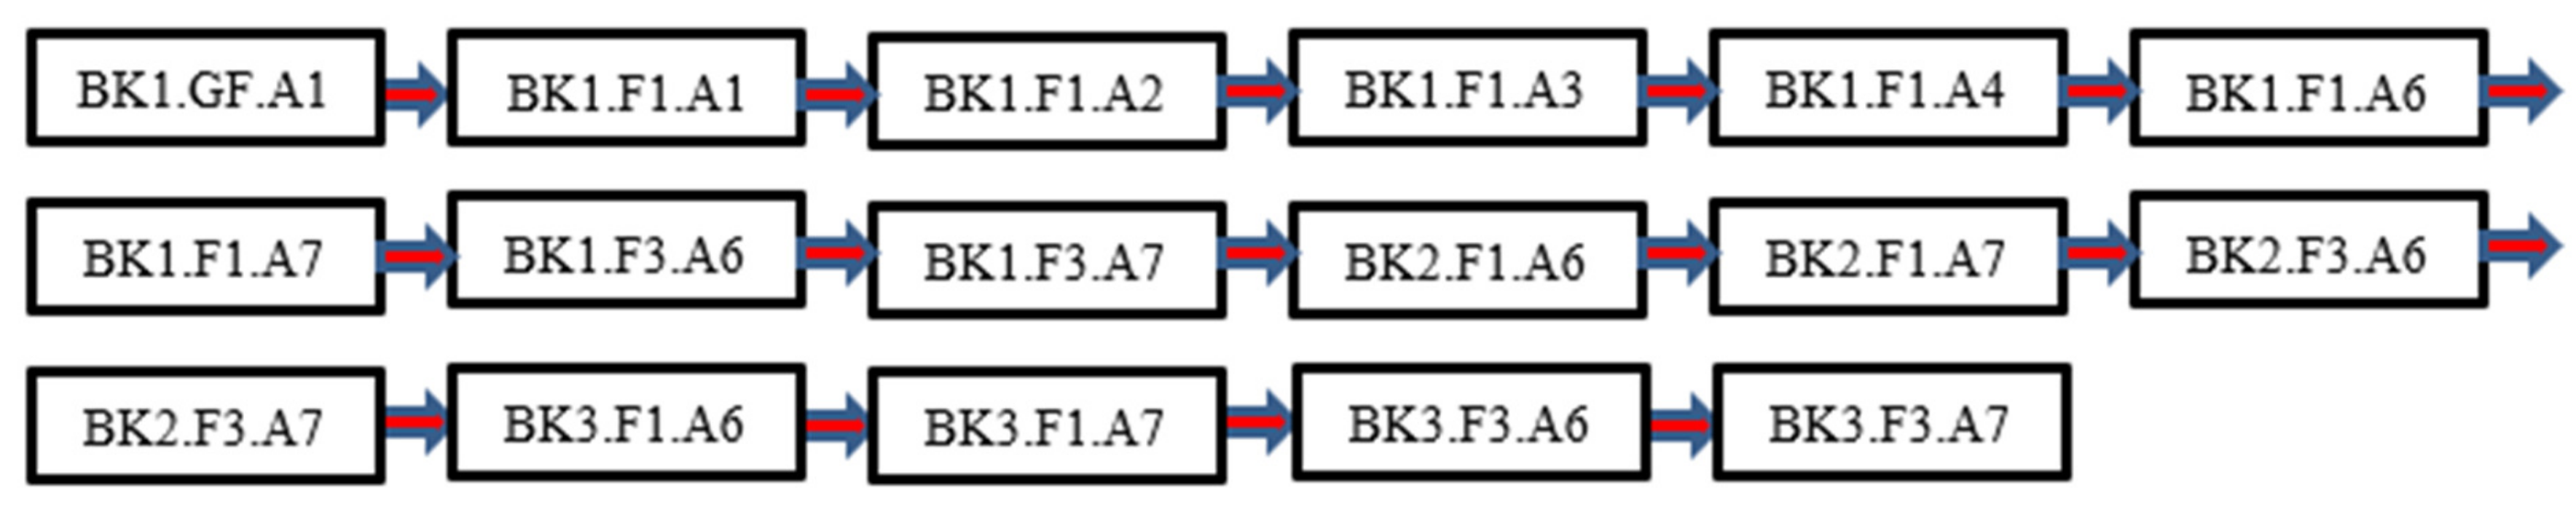
It can be noticed that the main focus was on critical activities, as the non-critical ones had free floats and feeder buffers as well.
The non-critical activities were partially protected by the feeder buffer. However, the delays of these tasks influenced the critical path of the project, as in
Figure 6.
Additional time was allocated to certain tasks during the project execution, as detailed in
Table 3,
Table 4 and
Table 5. The initial PB was set at 89 days. As tasks were completed, days were taken from the PB and allocated where needed to recover from delays. At the end of the project execution, the total schedule was reduced to 151 days, resulting in a saving of 36 days, as depicted in
Figure 7.
As the document is very extensive, we have included a detailed print screen in
Appendix C for improved clarity in understanding the allocation of the project buffer (PB) for the completion of the project.
4. Research Results
The method developed in
Section 3 involves calculating the duration of a construction project’s execution using the Critical Chain Project Management (CCPM) approach. The task duration was estimated using Program Evaluation Review Technique (PERT), which considers three entry data: optimistic scenario, median, and pessimistic scenario. The results are listed in
Table 1.
The timeline was then computed using the Critical Path Method (CPM) with Microsoft Project software, resulting in a total schedule of 187 days, as shown in
Figure 3.
The next step was to design the CCPM with buffer allocation, as depicted in
Figure 4. In this scenario, the overall duration of the project could be reduced to 98 days.
Table 2 presents the size of the buffers (Feeder Buffer (FB) and Project Buffer (PB)), with PB allocated at 89 days. The critical path for the ideal CCPM is illustrated in
Figure 5.
The construction works commenced with rigorous monitoring of the tasks every three days. Some tasks required time from the buffers, as evident in
Table 3,
Table 4 and
Table 5.
Additional time resources were allocated to tasks, resulting in changes to their criticality status, as depicted in
Figure 6.
In the experimental study, the project was monitored every three working days. The tasks with delays that required time from the buffer are listed in
Table 6.
Upon project completion, the total duration was 151 days, as opposed to the 187 days calculated by CPM. The buffer utilized amounted 53 days, instead of the initial allocation of 89 days, resulting in a significant economy of 36 days (20% economy), as illustrated in
Figure 7.
An essential aspect of CCPM is monitoring the progress of the critical chain throughout the timeline and assessing the buffer consumption. This allows the project manager to allocate more days to delayed tasks until the total duration of the activity surpasses the buffer. In such cases, appropriate measures, such as allocating additional resources, should be taken to bring the project back on track.
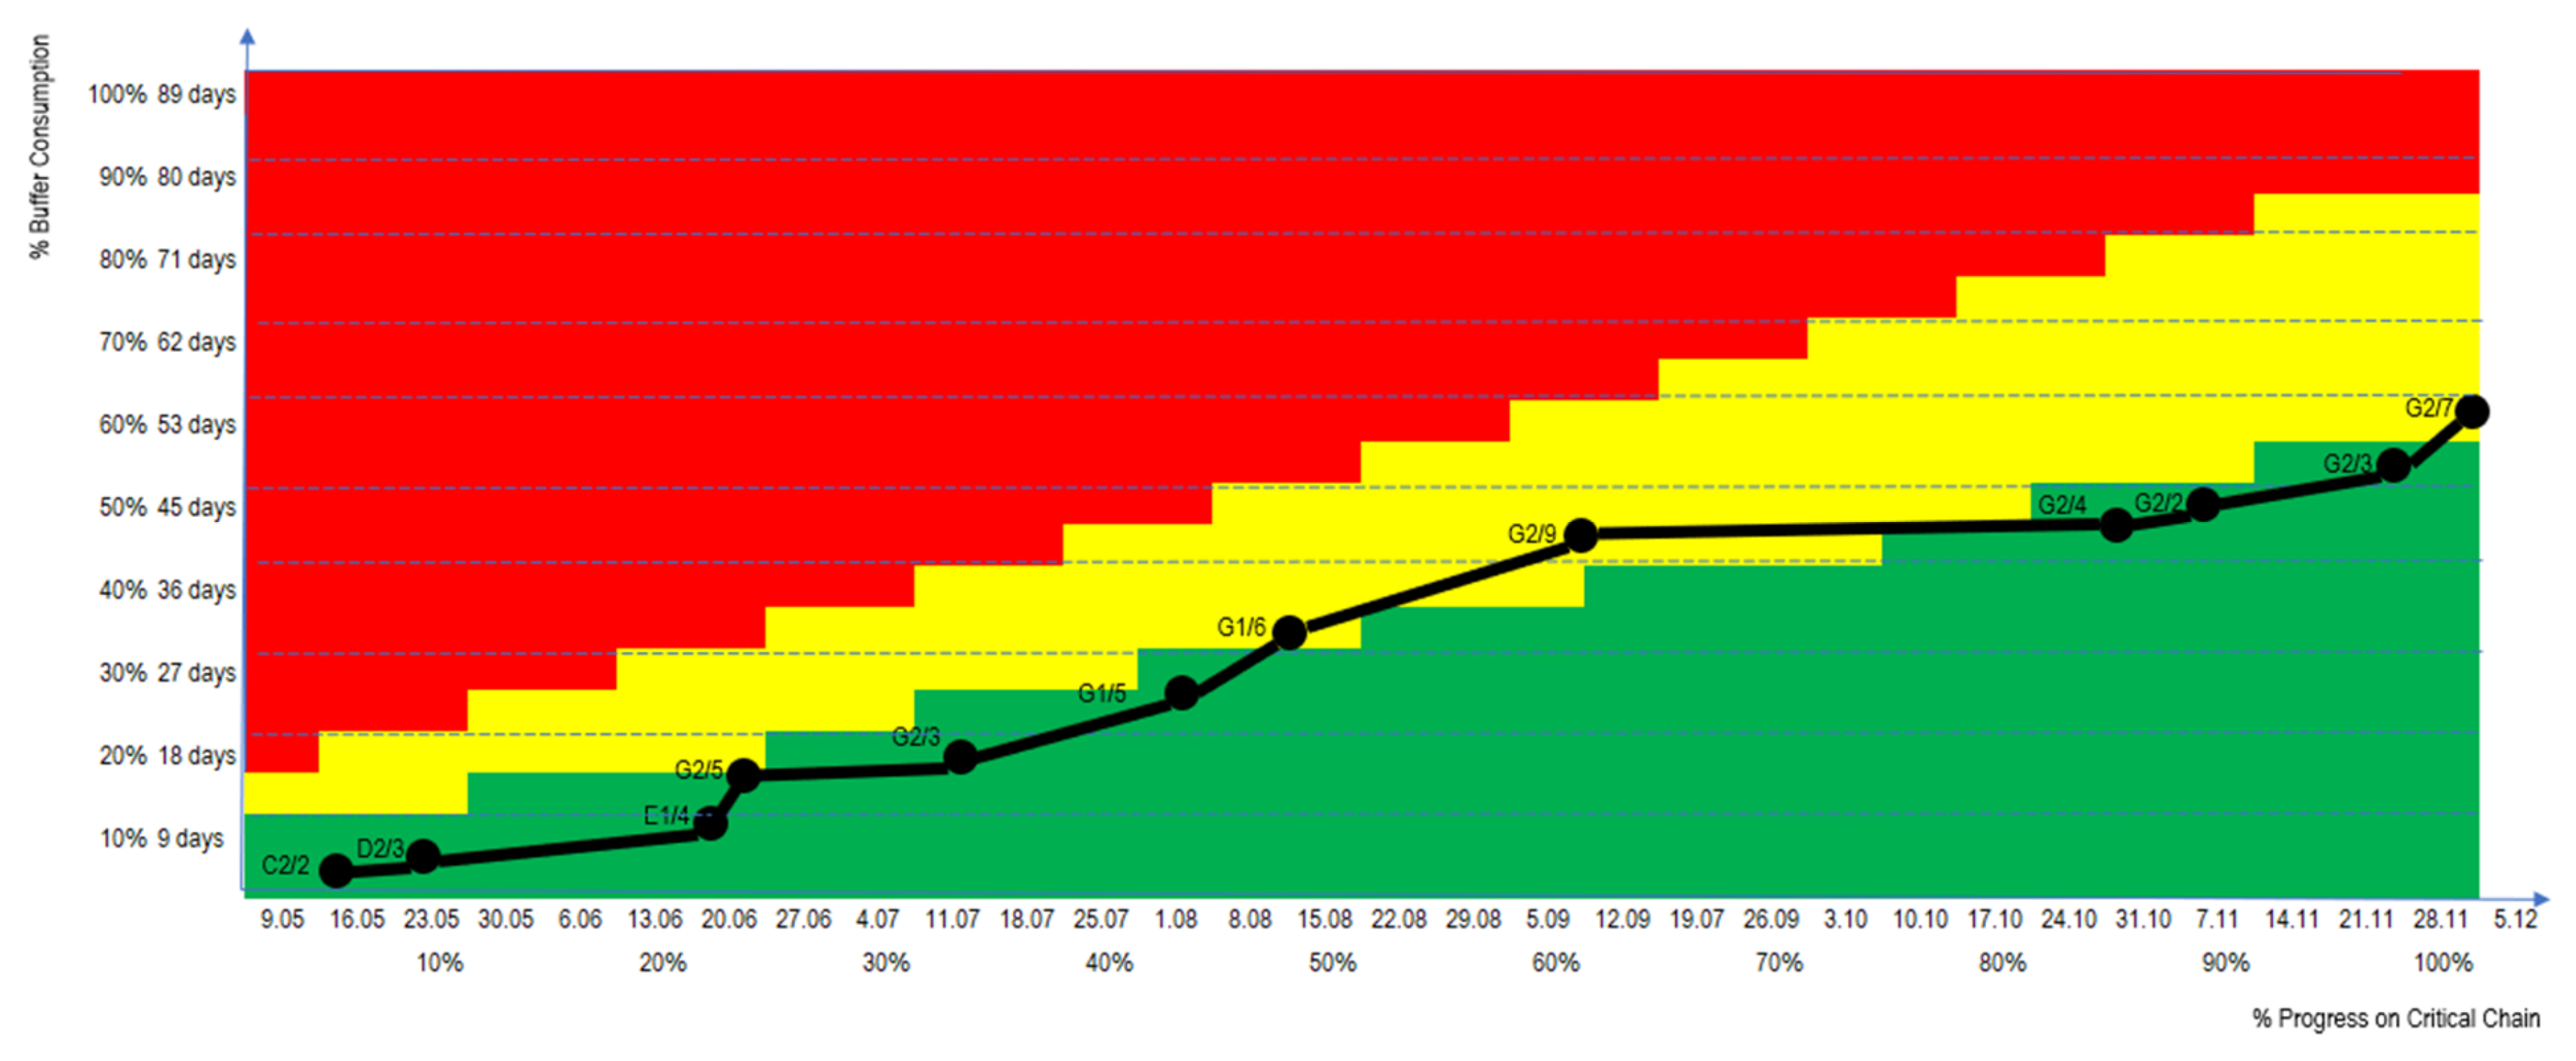
The Fever Chart is a visual and reliable diagram used to measure the consumption of the project buffer over the project timeline. It consists of three color-coded areas: green indicating no danger (buffer consumption is under control), yellow indicating the need for more attention in time allocation, and red indicating danger (project manager should take action to bring the project back to yellow or green, otherwise jeopardizing the schedule).
The Fever Chart shown in
Figure 8 gives a very suggestive visual image on what happened on the site.
During the initial two months of the project execution, a portion of the buffer was utilized. Around 45% of the project duration remained within the green zone, with 22 days consumed from the buffer, indicating that no additional actions were necessary.
Starting from Task BK1F3A7, the buffer moved into the yellow zone, prompting the project manager to closely monitor the activities. Nearly 40% of the buffer was consumed over approximately 75% of the project timeline. After this stage, the project returned to the green zone and ultimately finished 36 days ahead of schedule, with a total consumption of 53 days from the Project Buffer (PB).
5. Discussions
The construction industry faces significant challenges in time management due to a range of factors, such as outdoor work, weather conditions, community impact, and unforeseen delays [
34]. These challenges often result in project delays, which can negatively influence the profitability and reputation of construction companies in the competitive global market.
Traditional planning methods may not be effective in addressing these complexities, urging for innovative approaches to gain competitive advantage [
35].
Time is a critical constraint in constructions, and delays can have severe financial consequences for companies. Furthermore, in today’s fast-paced business environment, reputation plays a crucial role, and delays in project completion can ruin a company’s image. Therefore, effective schedule management is essential for the success of construction projects.
The ability to predict the probability of time overruns is an ongoing aspect of effective schedule management in the construction industry. By proactively identifying potential delays, project managers can take preventive or corrective actions to mitigate their impact and ensure timely project completion. Quantifying the probability of time overruns provides valuable insights that empower project managers to make decisions and manage the project timelines.
However, traditional methods of planning in the construction industry may fall short in addressing the complexities of time management. This is the reason why there are significant differences between planning and execution, and most of the times, they are expressed in delays.
The lack of confidence in the modern technologies in civil engineering may be a cause for the poor performance of the projects: cost overruns, delays in execution, and inadequate quality. For surpassing this attitude, the researchers should promote their studies, especially the ones with findings acquired from practical results.
The successful implementation of Critical Chain Project Management (CCPM) in the construction industry has been supported by the state of the art and experimental studies, such as the present one. CCPM has proven to be effective in reducing project schedules by incorporating risks through techniques such as PERT (Program Evaluation Review Technique) for task duration calculation [
36]. One of the core aspects of CCPM is the use of buffers to protect the project against delays. The size of these buffers may vary depending on factors such as project type, size, working conditions, past experience of the planner, and others [
37].
However, implementing new practices in an organization, such as CCPM, comes with associated costs and requires a change in mindset. Personnel need to be trained to work in different conditions than they may be accustomed to, and it is imperative for them to understand, agree, and accept these changes. Companies need to allocate resources, including financial ones, for this learning process [
38].
There are several construction companies that have successfully implemented CCPM as a method of planning the timeline of their projects. Examples include Skanska, PCL Construction Enterprises, Mortenson Construction, and others. These companies have recognized the benefits of CCPM in improving project scheduling and reducing project delays, leading to more efficient project delivery and improved overall performance.
The implementation of CCPM in the construction industry has the potential to bring significant benefits. By incorporating risk management techniques and using buffers to protect against delays, CCPM can help construction companies achieve more accurate and reliable project schedules [
39].
Scheduling of construction projects has attracted much attention in academic research, leading to numerous publications in the field. Time management is crucial in a construction project because it must deal with multiple interdependent activities performed by skilled workers. The experience of the planner may shorten the schedule if the tasks can be executed simultaneously, but only if the other resources (materials, equipment, and others) are available [
40]. An inaccurate time planning can increase the overall costs of the project from 10 to 30% depending on the type and size of the project [
41,
42].
A lot of methods of calculating the overall duration of a construction project were presented with their advantages or limitations by the researchers. The core of the time planning is that if the task durations are not monitored, evaluated, and controlled, the delays may lead to unbelievable cost overruns [
43].
The process of transitioning from traditional to innovative planning in Romania is still in its early stages. Therefore, this study aimed to demonstrate the suitability of Critical Chain Project Management (CCPM) in improving the project outcomes by reducing the schedules, which have implications on project costs.
The present study conducted an experimental study that compared planning the schedule of a construction project using the Critical Path Method (CPM) and execution using Critical Chain Project Management (CCPM). Specifically, three identical blocks of four floors each were monitored. For bidding, the contractor initially designed the project timeline using CPM with task duration computed using PERT. The critical path, which highlighted the tasks with zero float, was then determined, resulting in a total project duration of 187 days.
The researchers proposed the use of CCPM to the contractor as an innovative scheduling method for the project execution. The duration of each task was halved, with one half used for the calculation and determination of the critical path (98 days) while the other half was stored in the Project Buffer (PB) (89 days). The project execution commenced, and the timeline was monitored every three days, with weekly evaluation. For tasks that did not meet the ideal timeline, 53 days were allocated from PB, as shown in
Table 6. The real CCPM implementation can be visualized in
Figure 7.
The project was completed in 151 days, resulting in a time saving of 36 days (equivalent to a 20% economy) compared to the initial project duration. This outcome demonstrates the reliability and effectiveness of CCPM, as statistics show that the time savings of 20–35% can be achieved by using CCPM.
This study provides evidence that CCPM can be a valuable tool for improving the project outcomes in the construction industry and highlights the potential benefits of transitioning from traditional to innovative planning methods. Further research and implementation of CCPM in different construction projects and contexts in Romania could provide important insights and contribute to the advancement of project management practices in the country.
It is important to argue that in order to gain acceptance and facilitate the adoption of modern technologies in the construction industry, researchers need to not only build confidence among practitioners, but also change their mindset. This is particularly relevant considering the weaknesses of the construction sector, such as a high energy consumption, lack of skilled workers, and significant waste in the process. Innovative approaches like CCPM can be viable options to address these challenges.
However, it is acknowledged that the present study has some limitations, as it is based on a sole case study, which may introduce potential biases. To increase the reliability of the findings, future research could consider applying CCPM in the execution of multiple projects to allow for generalizations and a broader understanding of its applicability in different contexts.
Another limitation of the study is that it focuses only on finishing works, which can be done sequentially after the structure is built. A potential solution could be a hybrid approach, namely using CPM for the execution of the skeleton and CCPM for the closing and finishing works. This could provide a more comprehensive analysis of the effectiveness of CCPM in distinct stages of a construction project.
Furthermore, it should be noted that the tasks in this study were assumed to be performed only by skilled workers, which means that a skilled team can execute only one type of task. This may not reflect the reality of all construction projects, where multitasking and resource allocation can be complex. Further research could explore the applicability of CCPM in projects with varying levels of skill sets and resource allocation challenges.
Despite these limitations, the findings of this study provide valuable insights into the potential benefits of implementing CCPM in the construction industry. Further research and experimentation with CCPM in different project settings and contexts could contribute to the advancement of project management practices in the construction sector and help address its inherent challenges.
6. Conclusions
The article’s conclusions highlight the potential benefits of implementing Critical Chain Project Management (CCPM) as an innovative approach to scheduling and project management in the construction industry. The study presented empirical evidence that implementing CCPM led to more efficient project execution and considerable time saving of up to 20%, which can translate into cost savings for the company, such as wages, rented locations and equipment, less waste, and others.
In addition, the article emphasizes the importance of accurate time planning and the potential negative consequences of inaccurate scheduling, which can lead to cost overruns and delays.
The literature review analysed the state-of-the-art research in the field based on recent studies, most of which were published from 2021 to the present. The research findings provide evidence that CCPM can be used in the construction industry to improve project outcomes and bring benefits by transitioning from traditional to innovative planning methods.
However, the adoption of modern technologies like CCPM can be entirely effective through continuous collaboration between researchers and practitioners. Business environments will apply the results of research only if they understand the real benefits translated into profit, reputation, or short- and medium-term planning. It will be a complicated process of changes in mindsets, but it can contribute to the advancement of project management practices in the civil engineering sector and help companies stay competitive in a global market.
Moreover, the article highlights that, by utilizing advanced project management methods, such as CCPM, the construction industry can overcome the challenges of time management, improve project outcomes, and even improve the industry’s reputation.
As the father of CCPM, Goldratt pointed out that multitasking is not proven to have positive results in the project timeline, and specialized teams should be allocated to each task. Furthermore, the risk of delaying the optimistic scheduling, which halves the duration of each activity, is protected by the project buffer (PB).
In conclusion, the article’s findings provide strong support for the use of CCPM as an effective scheduling tool for construction projects. The innovative approach of CCPM, with its emphasis on resource management and buffer allocation, can lead to improved project outcomes, including reduced project duration and increased project efficiency.


