2. Literature Review
Many studies in the literature have attempted to quantify the impact of earthquakes on structures. One of the most important quantities that can describe the destructive effects of an earthquake is the seismic energy that is absorbed from the structures which respond to seismic excitation, as well as its distribution inside the structure, e.g., among its stories in the case of buildings [
5]. In addition, there is strong evidence that taking the seismic energy absorbed from structures into account leads to the development of more realistic acceleration time histories that can be used for more rigorous structural design [
6]. More recently, attempts have been made to use computational intelligence methods for predicting seismic damage on structures through energy-related measures for quantification of the seismic damage, such as the Park–Ang index [
7]. Apart from the seismic energy considerations above that apply to all earthquakes in general, a more specific presentation regarding particularly the 6 February 2023 earthquakes in Türkiye are pursued in the following paragraphs, and the results of the various studies are emphasized.
Lu [
8] attempted a preliminary assessment of the damage of the 6 February 2023 Türkiye earthquake on buildings. The author tried to explain why building damages due to this earthquake were so severe and whether Chinese structures would be strong enough to resist an earthquake of this magnitude. The RED-ACT system [
9] was used to analyze the recorded ground motion of the 1st (M
w 7.8) earthquake event which gave “collapse” results for the ground motion input of Station 3138. Following this, the earthquake ground motions were input to typical individual and urban buildings in Türkiye to assess the damage. Low- and high-rise reinforced concrete frame models were analyzed and subjected to the ground motion recorded at station 3123, and the results showed that there were large inter-story drifts at the lower stories in all cases, resulting in the collapse of all three frames analyzed.
A recent study has pointed out some noticeable facts about the buildings’ design and construction and the impact that they had on the devastation in the aftermath of the earthquake [
10], for example, (i) there was low concrete quality, inadequate reinforcement, and/or poor detailing, which led to either heavily damaged or collapsed structures [
11]; (ii) the extensive building collapse can be attributed to a variety of reasons, including the old age of buildings, some of which were built according to previous versions of the Turkish seismic code, and the improper application of the current Turkish seismic code [
10]. In addition, some peculiar phenomena have been observed, such as the fact that a newly constructed housing estate in Antakya municipality extensively collapsed killing many people, yet in nearby Erzin there were no collapses at all [
12]. It has also been argued that the ongoing war in Syria may have played its role, where conflicts have made building standards impossible to enforce and some war-damaged buildings have been rebuilt using low-quality materials or “whatever materials are available” [
13].
In another study, researchers have tried to identify the main features of the earthquake sequence and also to present various spectra of near-source ground motion data and ground motion data with pulse-like features [
14]. In this study, it was concluded that the seismic actions were generally challenging for the structures, based on the response spectra of stations close to the source. Relatively large near-source pulses were also identified, whereas their attribution to rupture phenomena (e.g., forward directivity) needs further investigation.
The generalized continuous wavelet transform (GCWT) method proposed by Chen et al. [
15] has been applied to identify pulse-like ground motions in the February 2023 earthquakes in Türkiye [
16]. This method applies three criteria for the identification of pulse components which establish lower thresholds for the following quantities: (1) PGV, (2) the ratio of the energy of the pulse part of the ground motion to the energy of the original ground motion, and (3) the Pearson correlation coefficient between the pulse part of the ground motion and the time history of the pulse model. A total of 99 pulse-like ground motions were discovered that occurred in the February 2023 Türkiye earthquakes, with two of them containing more than one pulse. In addition, by examining four intensity measures, i.e., Arias intensity, cumulative Fourier spectrum, 5% damped pseudo-spectral velocity, and 5% damped pseudo-spectral acceleration, it was concluded in the same study that the response spectra, as well as the PGA, PGV and energy-frequency parameter (defined in [
17]) values of pulse-like motions, are larger than those of non-pulse like motions.
A preliminary analysis of the acceleration time histories of the first earthquake of 6 February 2023 has appeared in [
18]. It was shown there that the different rupture episodes appeared distinctly at the recordings of the stations closest to the epicenter (e.g., TK.2712 and TK.4615), whereas at stations farther away, such as TK.4406, the different rupture episodes are no longer distinguishable, and the PGA is lower. Far-field stations, such as TK.3145 sensed the rupture episodes at a considerable time delay from the time point of their occurrence.
Another preliminary report was presented by Garini and Gazetas [
19]. Seismological and acceleration time history information was presented in this report for both earthquakes of the doublet, followed by an extensive analysis of the main reasons for the collapses of the buildings that happened. The acceleration time histories of the TK.4614 and TK.3123 recorded during the first mainshock were analyzed. In addition, their acceleration spectra were extracted, where it was observed that the TK.4614 record has increased spectral acceleration values for periods lower than roughly 0.6 s, whereas the TK.3123 record has increased spectral acceleration for periods larger than 0.6 s.
A preliminary analysis of strong ground motion characteristics has been made in [
20]. In this report, a variety of aspects of ground motions recorded during the Türkiye earthquakes of February 2023 have been addressed as follows: (1) procedures for strong motion data processing have been presented, along with the types of nonstandard errors usually met in real raw acceleration data; (2) ground motion intensity measures, such as peak ground motion amplitudes, significant duration, and Arias as well as Housner intensity values of the recordings within distance from rupture lower than 100 km, are provided. Furthermore, acceleration time histories, Fourier amplitude spectra, and the 5%-damped acceleration response spectra of the recorded accelerations at the stations TK.2708, TK.3126, TK.3138, TK.4615, and TK.4624 are presented and discussed. Besides the aforementioned ground motion data, the spatial distribution of peak and spectral accelerations and soil amplifications and Horizontal-to-Vertical Spectral Ratio (HVSR) analyses are discussed in detail.
The characteristics of the soil and geological conditions where a building is located can greatly influence the amount of shaking that the building experiences during an earthquake [
21,
22]. Parameters such as soil type (rock foundations, earth foundations, etc.), soil depth, geological features, and site amplification can significantly affect the response of a building in an earthquake event. In the case of a soil foundation, different grain gradation [
23], pore ratio, and water content [
24] will also lead to a different structural response. Sun and Huang [
23] presented a particle discrete element method that can be used to calculate the soil particle gradation, while Sun [
24] investigated soil porosity and attempted to calculate the permeability of particle soils under soil pressure.
Apart from the aforementioned factors, various additional parameters mainly of seismological nature can be considered for the evaluation of the Kahramanmaraş–Gaziantep, Türkiye M
w 7.8 earthquake on 6 February 2023. For example, in [
25], kinematic rupture models from a joint inversion of High Rate Global Navigation Satellite System (HR-GNSS) and strong motion data sets of the two events in the 6 February 2023 Türkiye earthquake doublet have been developed, and it is shown that the M
w 7.8 earthquake nucleated on a previously unmapped fault before transitioning to the East Anatolian Fault (EAF), rupturing for ~350 km; the maximum rupture speeds were estimated to be 3.2 km/s for the same event. In another study [
26], a long-period coda moment magnitude method was used to measure the moment magnitudes of the two large mainshocks. It was found that the magnitude of the first event (with one standard error of the magnitude estimation) is 7.95 ± 0.013. Results about the tectonic setting, the seismicity and its temporal evolution as well as the seismic moment release rate in the region have been presented in [
27], whereas various issues about seismic forecasting are discussed in [
28].
In the present study, various seismic parameters of the M
w 7.8 earthquake are calculated and assessed in an effort to provide some explanations about the large destructiveness of the earthquake and the devastating effects it had on buildings. A building-oriented evaluation of the earthquake impact is performed not only by extracting its various peak and cumulative parameters but also by calculating various types of linear and nonlinear (isoductile) seismic spectra. Furthermore, incremental dynamic analysis (IDA) [
29] is performed for various simplified cases of buildings in an effort to estimate the response that they would exhibit during the earthquake. To the best of the authors’ knowledge, such a detailed investigation has not been conducted in the literature for the M
w 7.8 earthquake event. It is examined if the isoductile seismic spectra, the IDA curves, and the other calculated parameters can provide some hints about the destructiveness of the earthquake and how the buildings could be designed to be able to resist such earthquakes in the future. The objective of the study is to highlight various particular characteristics of the M
w 7.8 event through the investigation of all the aforementioned strong ground motion data processing results.
3. Record Data
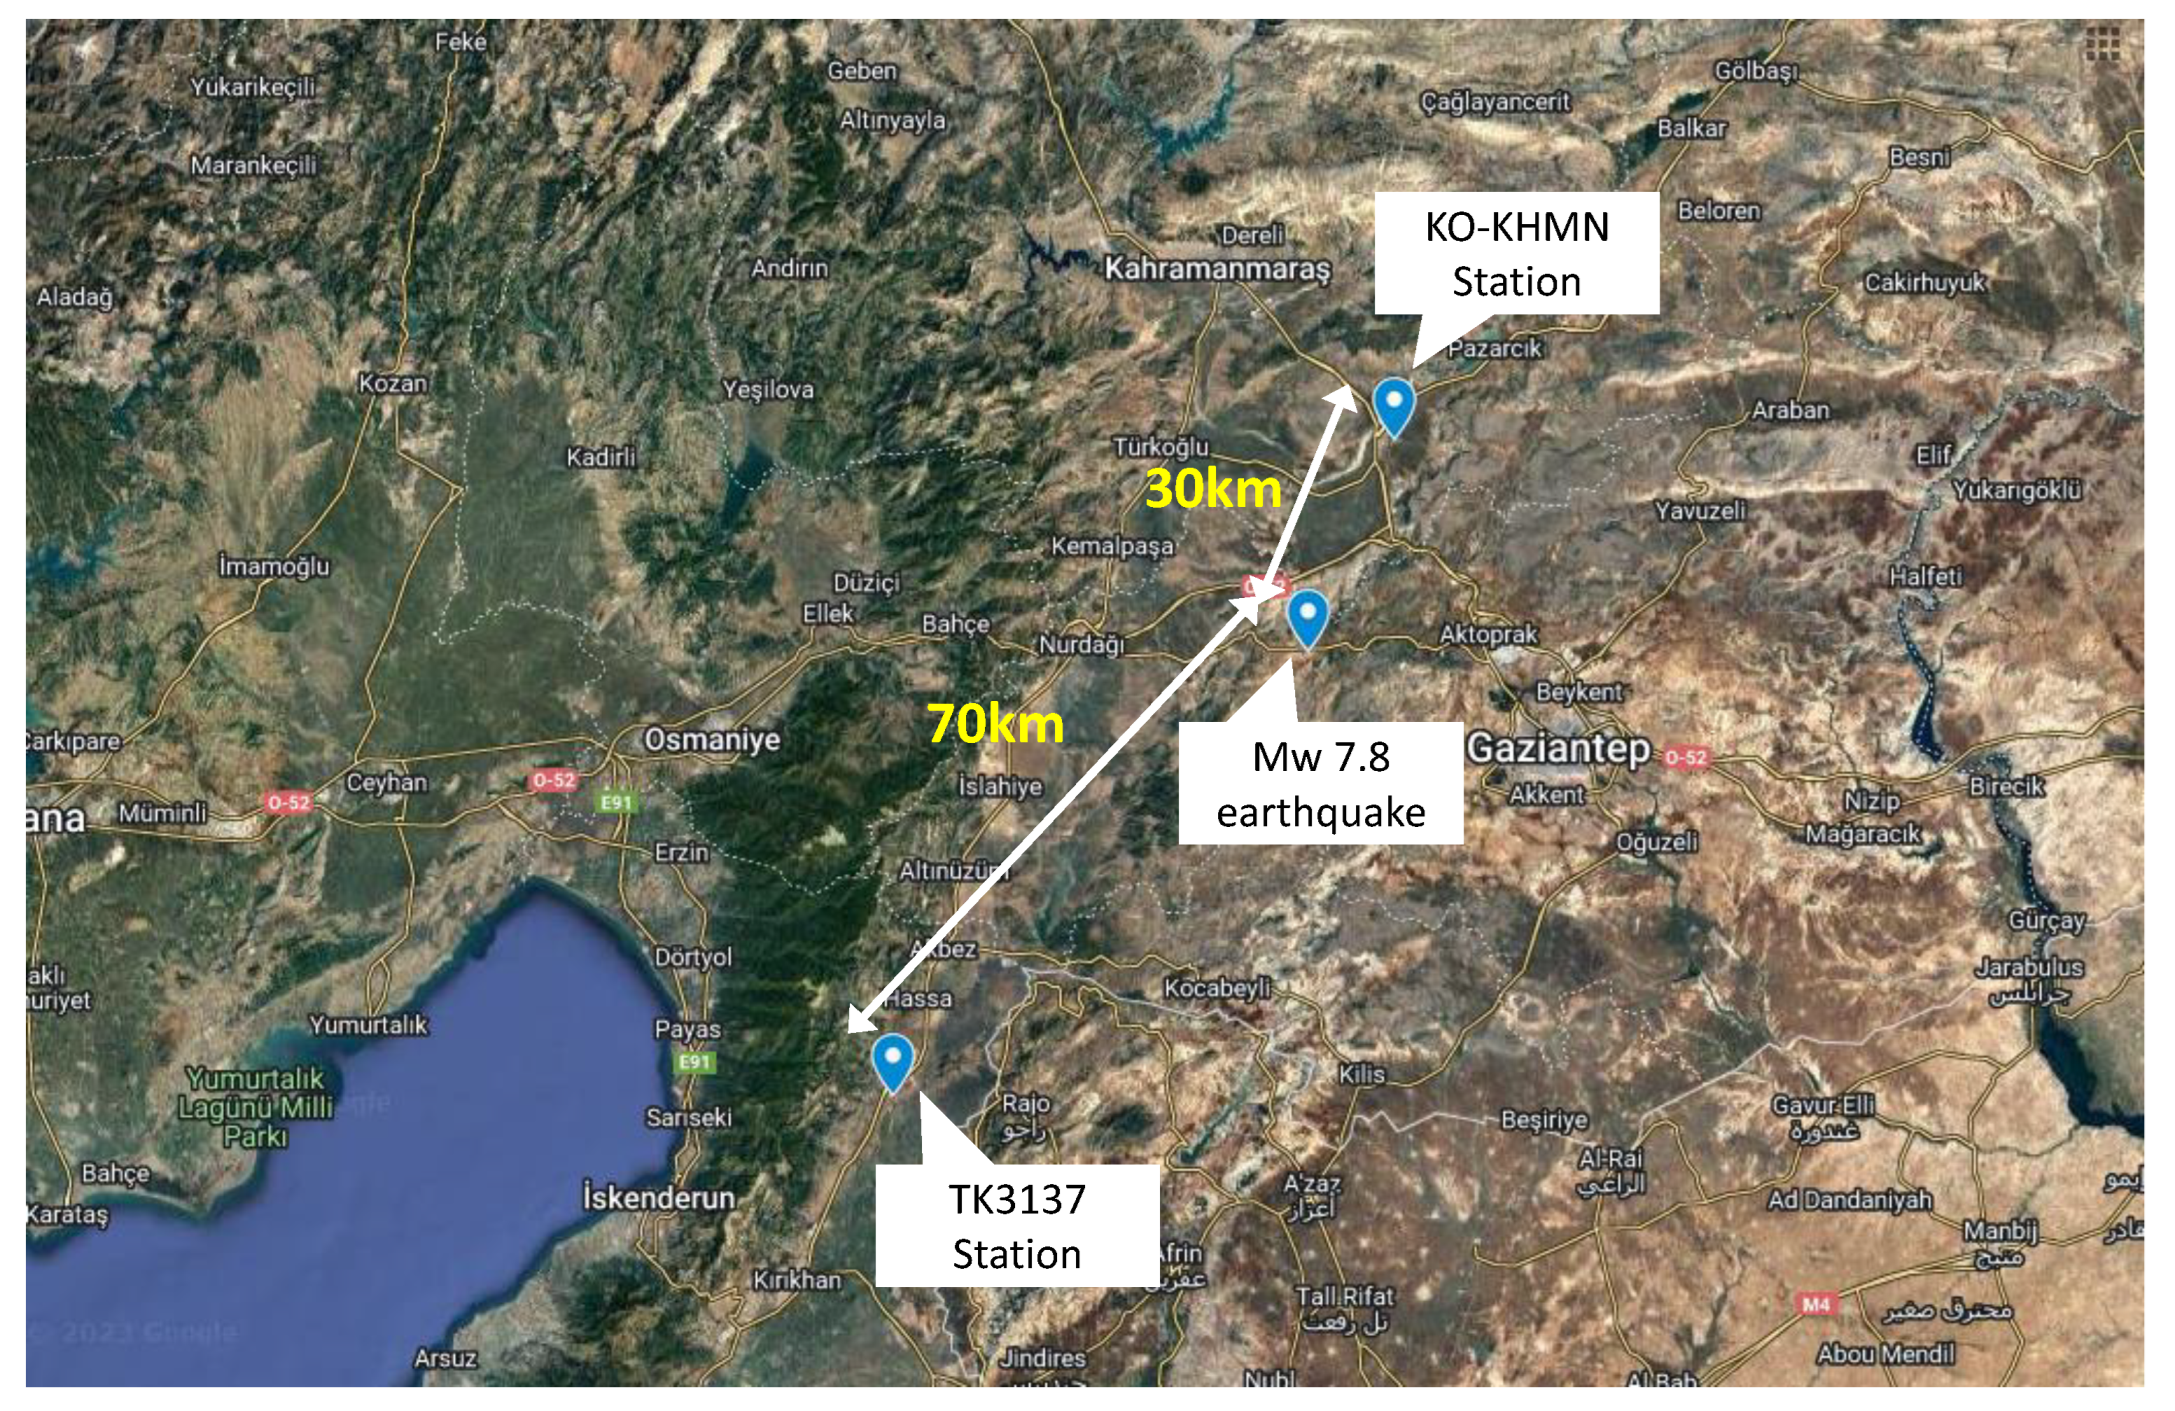
There are two main earthquake monitoring networks currently operating in Türkiye: (i) the Turkish Civil Defense Network (AFAD, Republic of Türkiye, Ministry of Interior Disaster And Emergency Management Presidency, code TK) and (ii) the Kandilli Observatory and Earthquake Research Institute (Boğaziçi University, code KO). Two representative seismic recording stations were selected for obtaining acceleration time history data of the M
w 7.8 earthquake event, one from each network: (i) Station No 3137, TK Network (Lat.: 36.69293°, Long.: 36.48852°) and (ii) KHMN Station, KO Network KO (Lat.: 37.3916°, Long.: 37.1574°); both are shown in
Figure 1, together with the epicenter of the earthquake event. For the processing of the acceleration time histories, the open-source Matlab code OpenSeismoMatlab [
30] was used, which has been developed by the authors and is quite reliable since it has been successfully verified in several cases in the literature [
31,
32,
33]. The software uses an advanced time integration algorithm first presented in [
34].
Figure 2 shows the two horizontal acceleration components of the TK.3137 station record, while
Figure 3 shows the corresponding vertical acceleration component. Similarly,
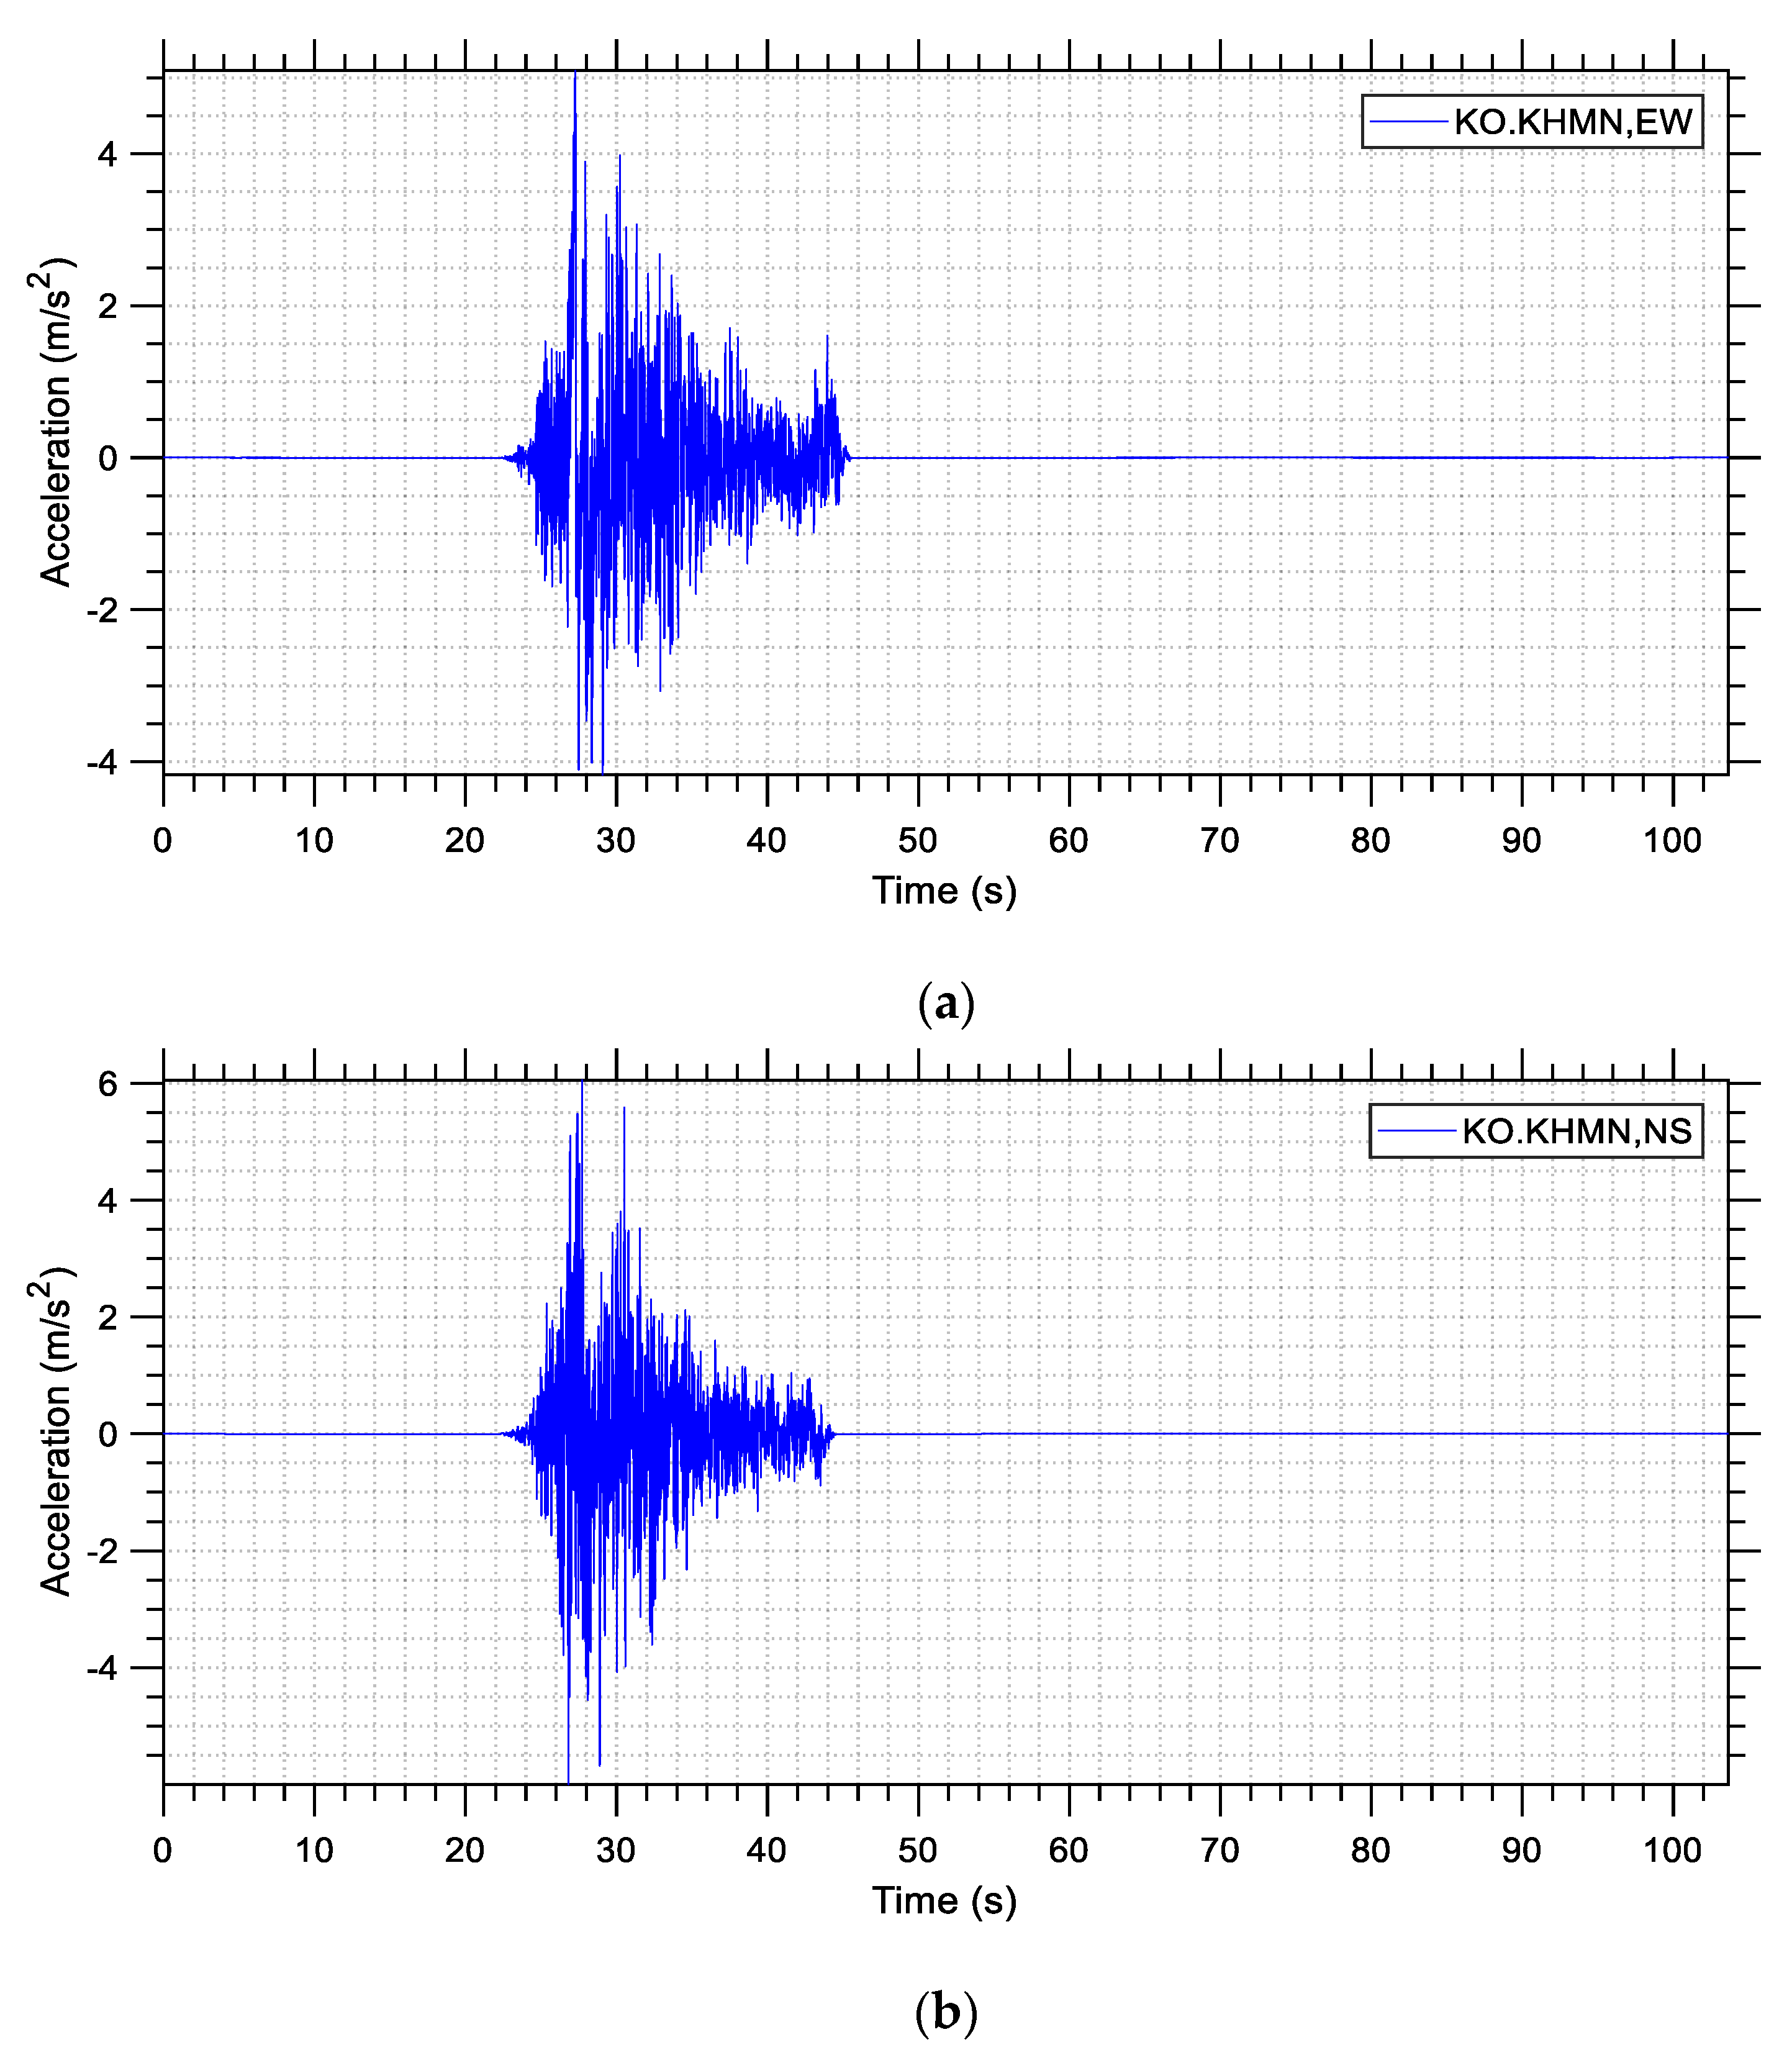
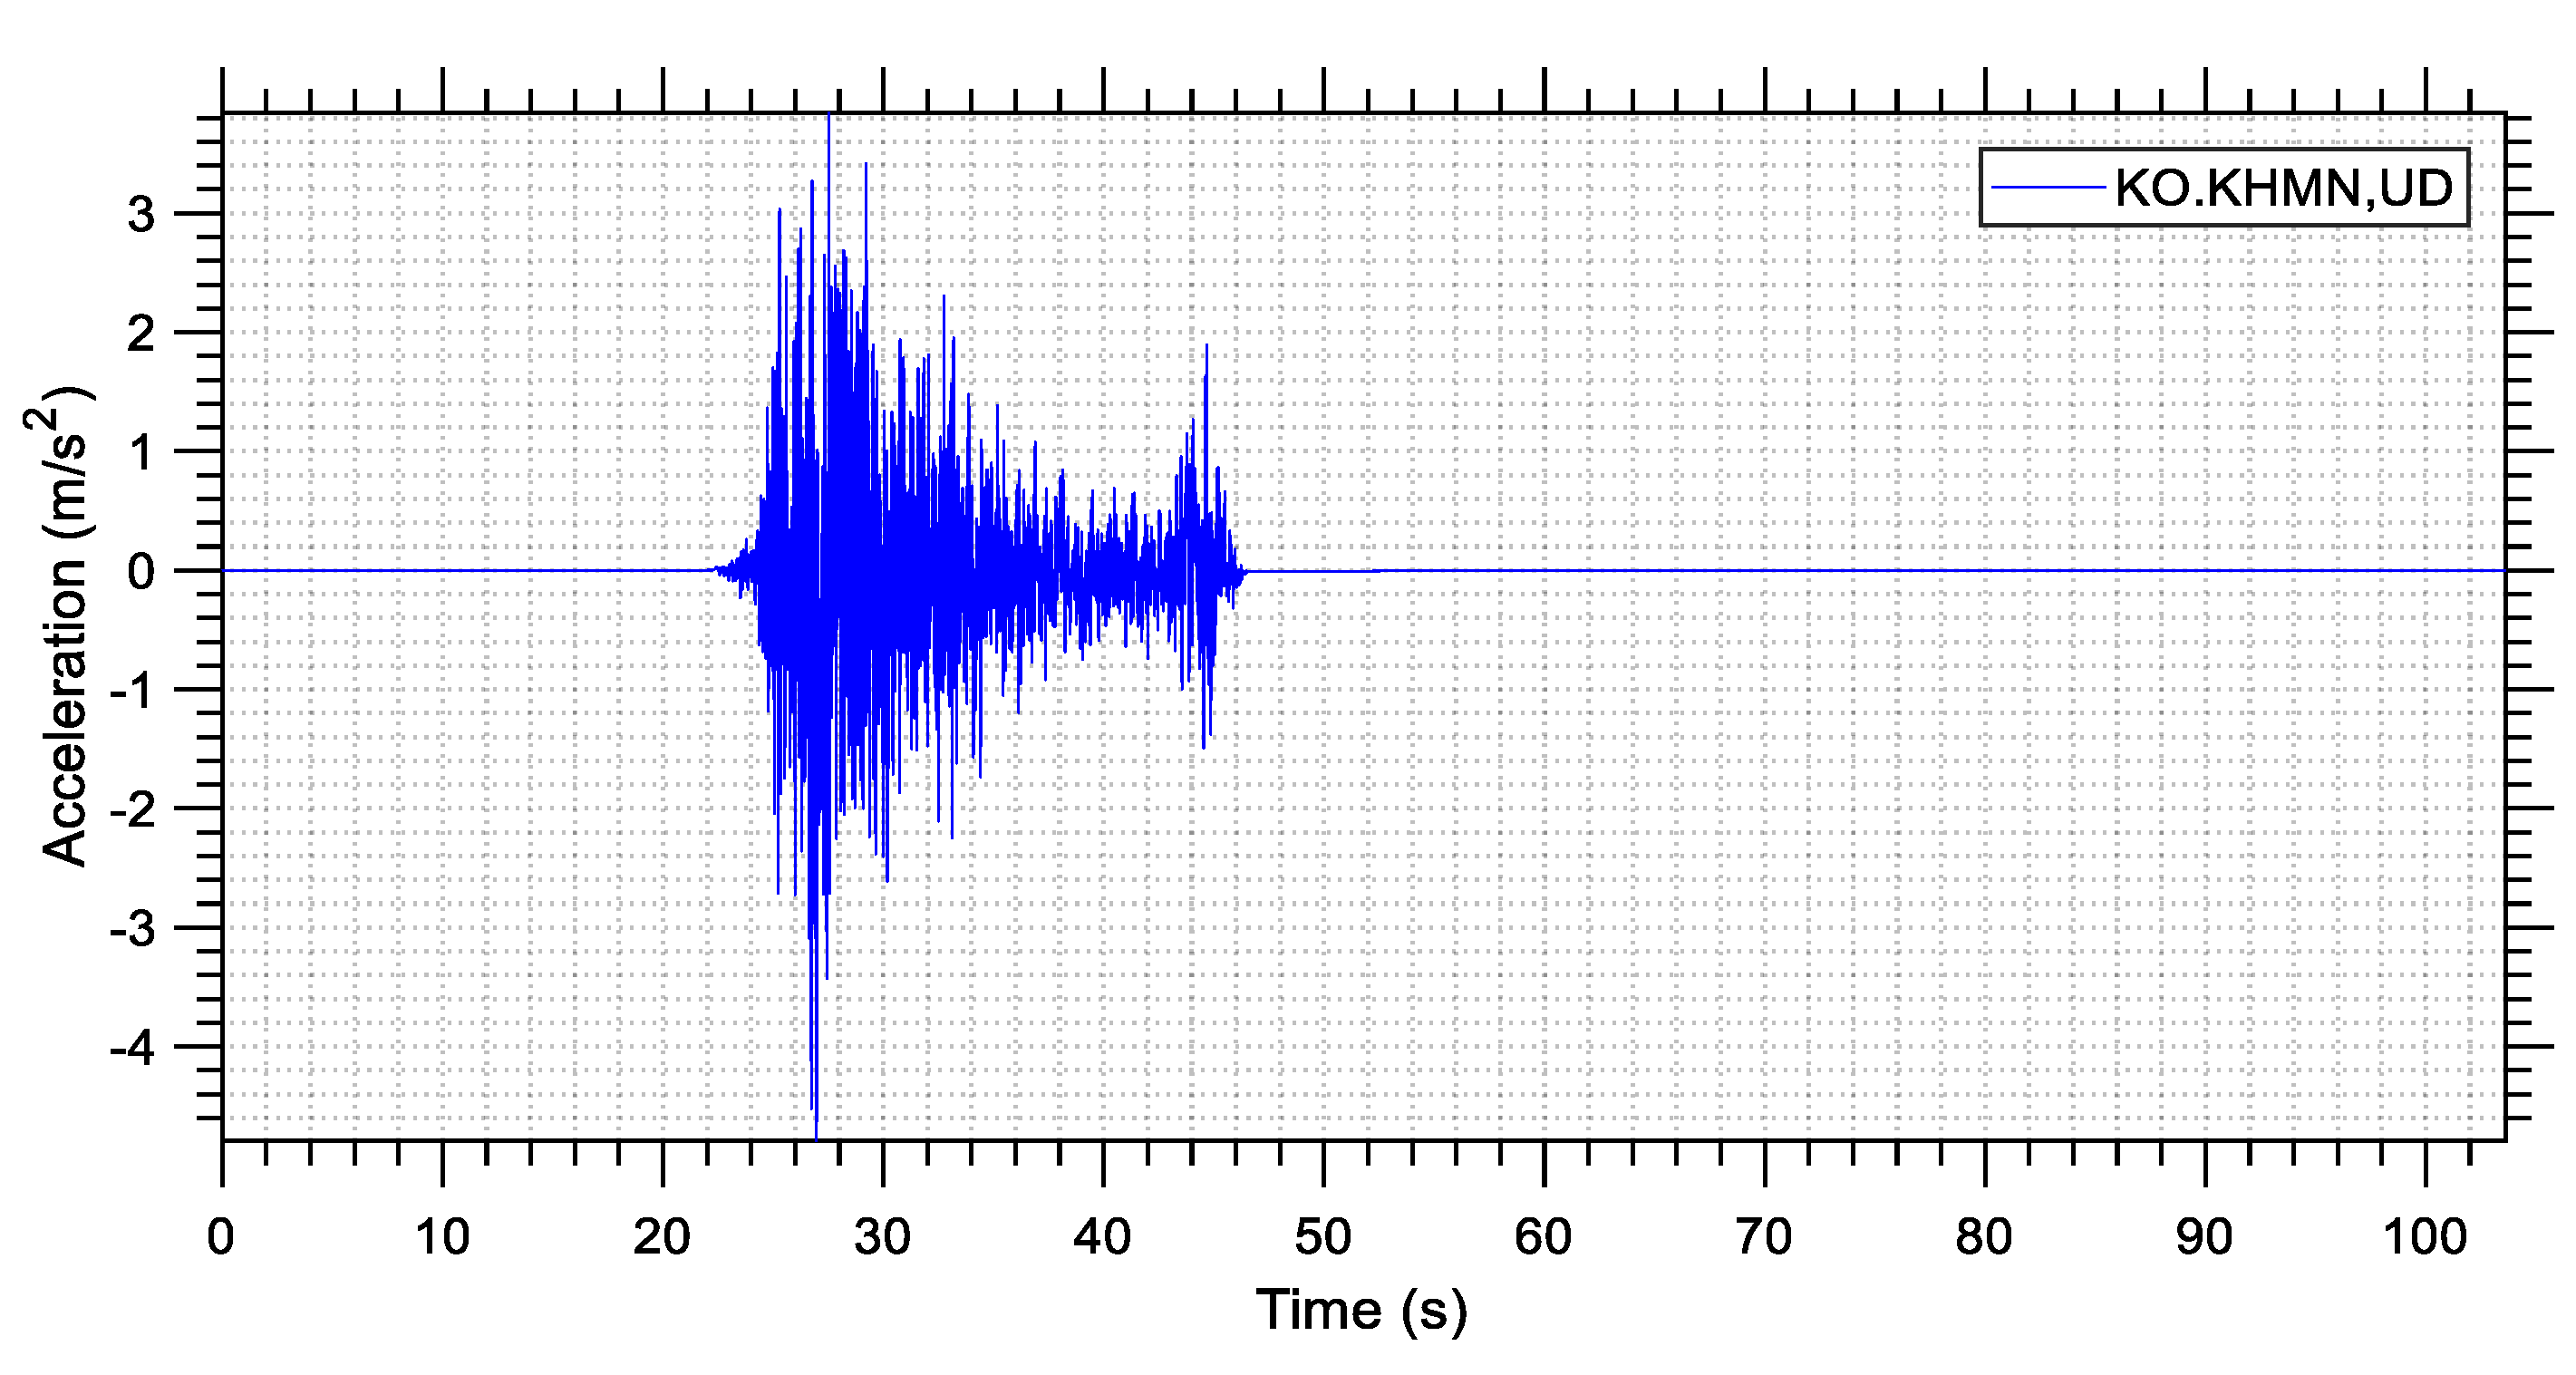
Figure 4 shows the two horizontal acceleration components of the KO-KHMN station record, and
Figure 5 shows its vertical acceleration component. The severity of the ground motions is obvious since the TK.3137 record reached a peak ground acceleration (PGA) of 0.75 g during ground shaking, whereas the KO-KHMN record reached PGA values as high as 0.60 g. Another observation is that the duration of the shaking was quite large, reaching about 1.5 min in the case of the TK.3137 station.
Table 2 shows the peak values recorded for each station, namely the PGA as well as the peak ground velocity (PGV) and the peak ground displacement (PGD) for both records, for the horizontal (EW, NS) and the vertical (UD) components.
3.1. Cumulative Energy, Arias Intensity, and Significant Duration Data
A significant measure of the destructive effect of an earthquake on structures is the amount of energy that it releases. This energy, after having been released by the earthquake, is partly absorbed by the structures in the area and this results in their gradual damage or even collapse. Energy-based design theory (EBDT), which introduces energy demand as the critical parameter to evaluate structural damage, has gained attention around the world in recent decades. According to this approach, each structure must be designed to be capable of absorbing a certain amount of energy. It is noted that the EBDT concept accounts for the cumulative damage and the effective duration of earthquakes in a theoretically sound manner. The effects of the latter factors are not taken sufficiently into account in traditional force-based design approaches. In this section, the data for the total cumulative energy, Arias intensity, and significant duration are presented for the two records.
A summary report is given in
Table 3, where
Ecum denotes the cumulative energy,
Arias denotes the Arias intensity,
td5–95 denotes the time needed for the 90% of the seismic energy to be released (5–95% interval), and
td5–75 denotes the time needed for the 70% of the seismic energy to be released (5–75% interval). These quantities are calculated using the following equations:
where
td stands for the time duration of the strong motion record of the earthquake. The time durations are given as follows:
where for
td5,
td75, and
td95 the following conditions hold:
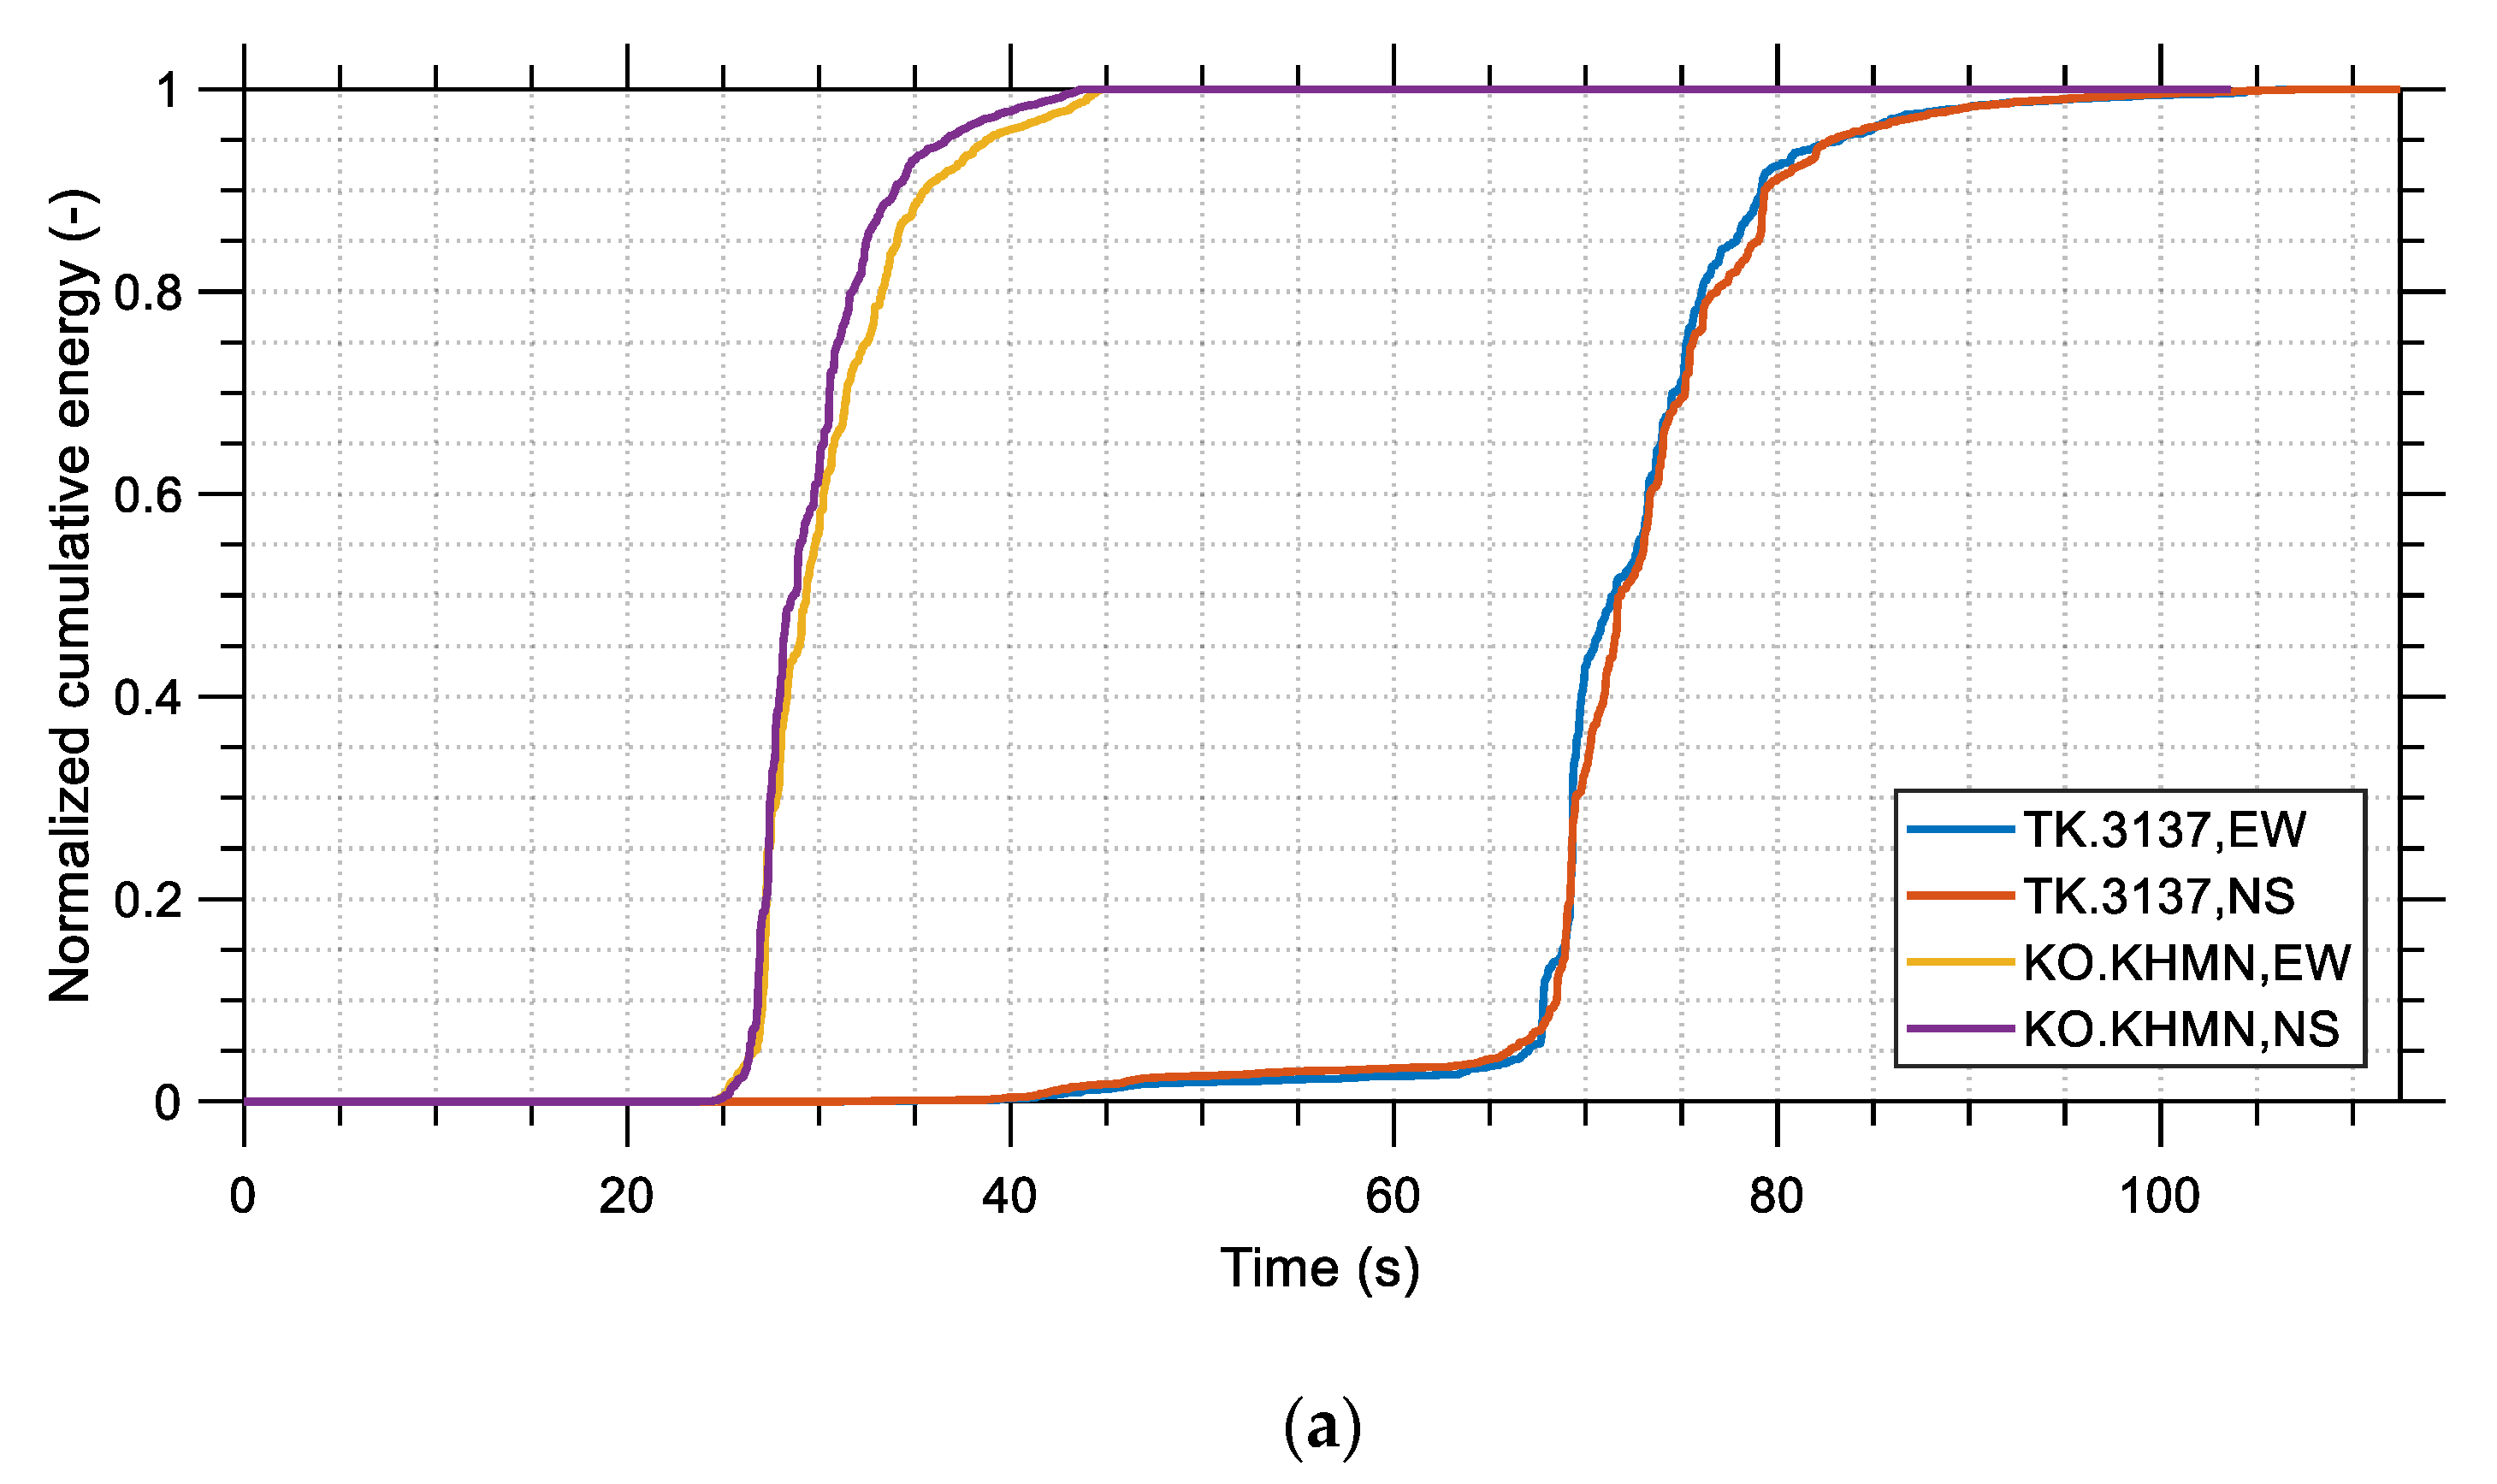
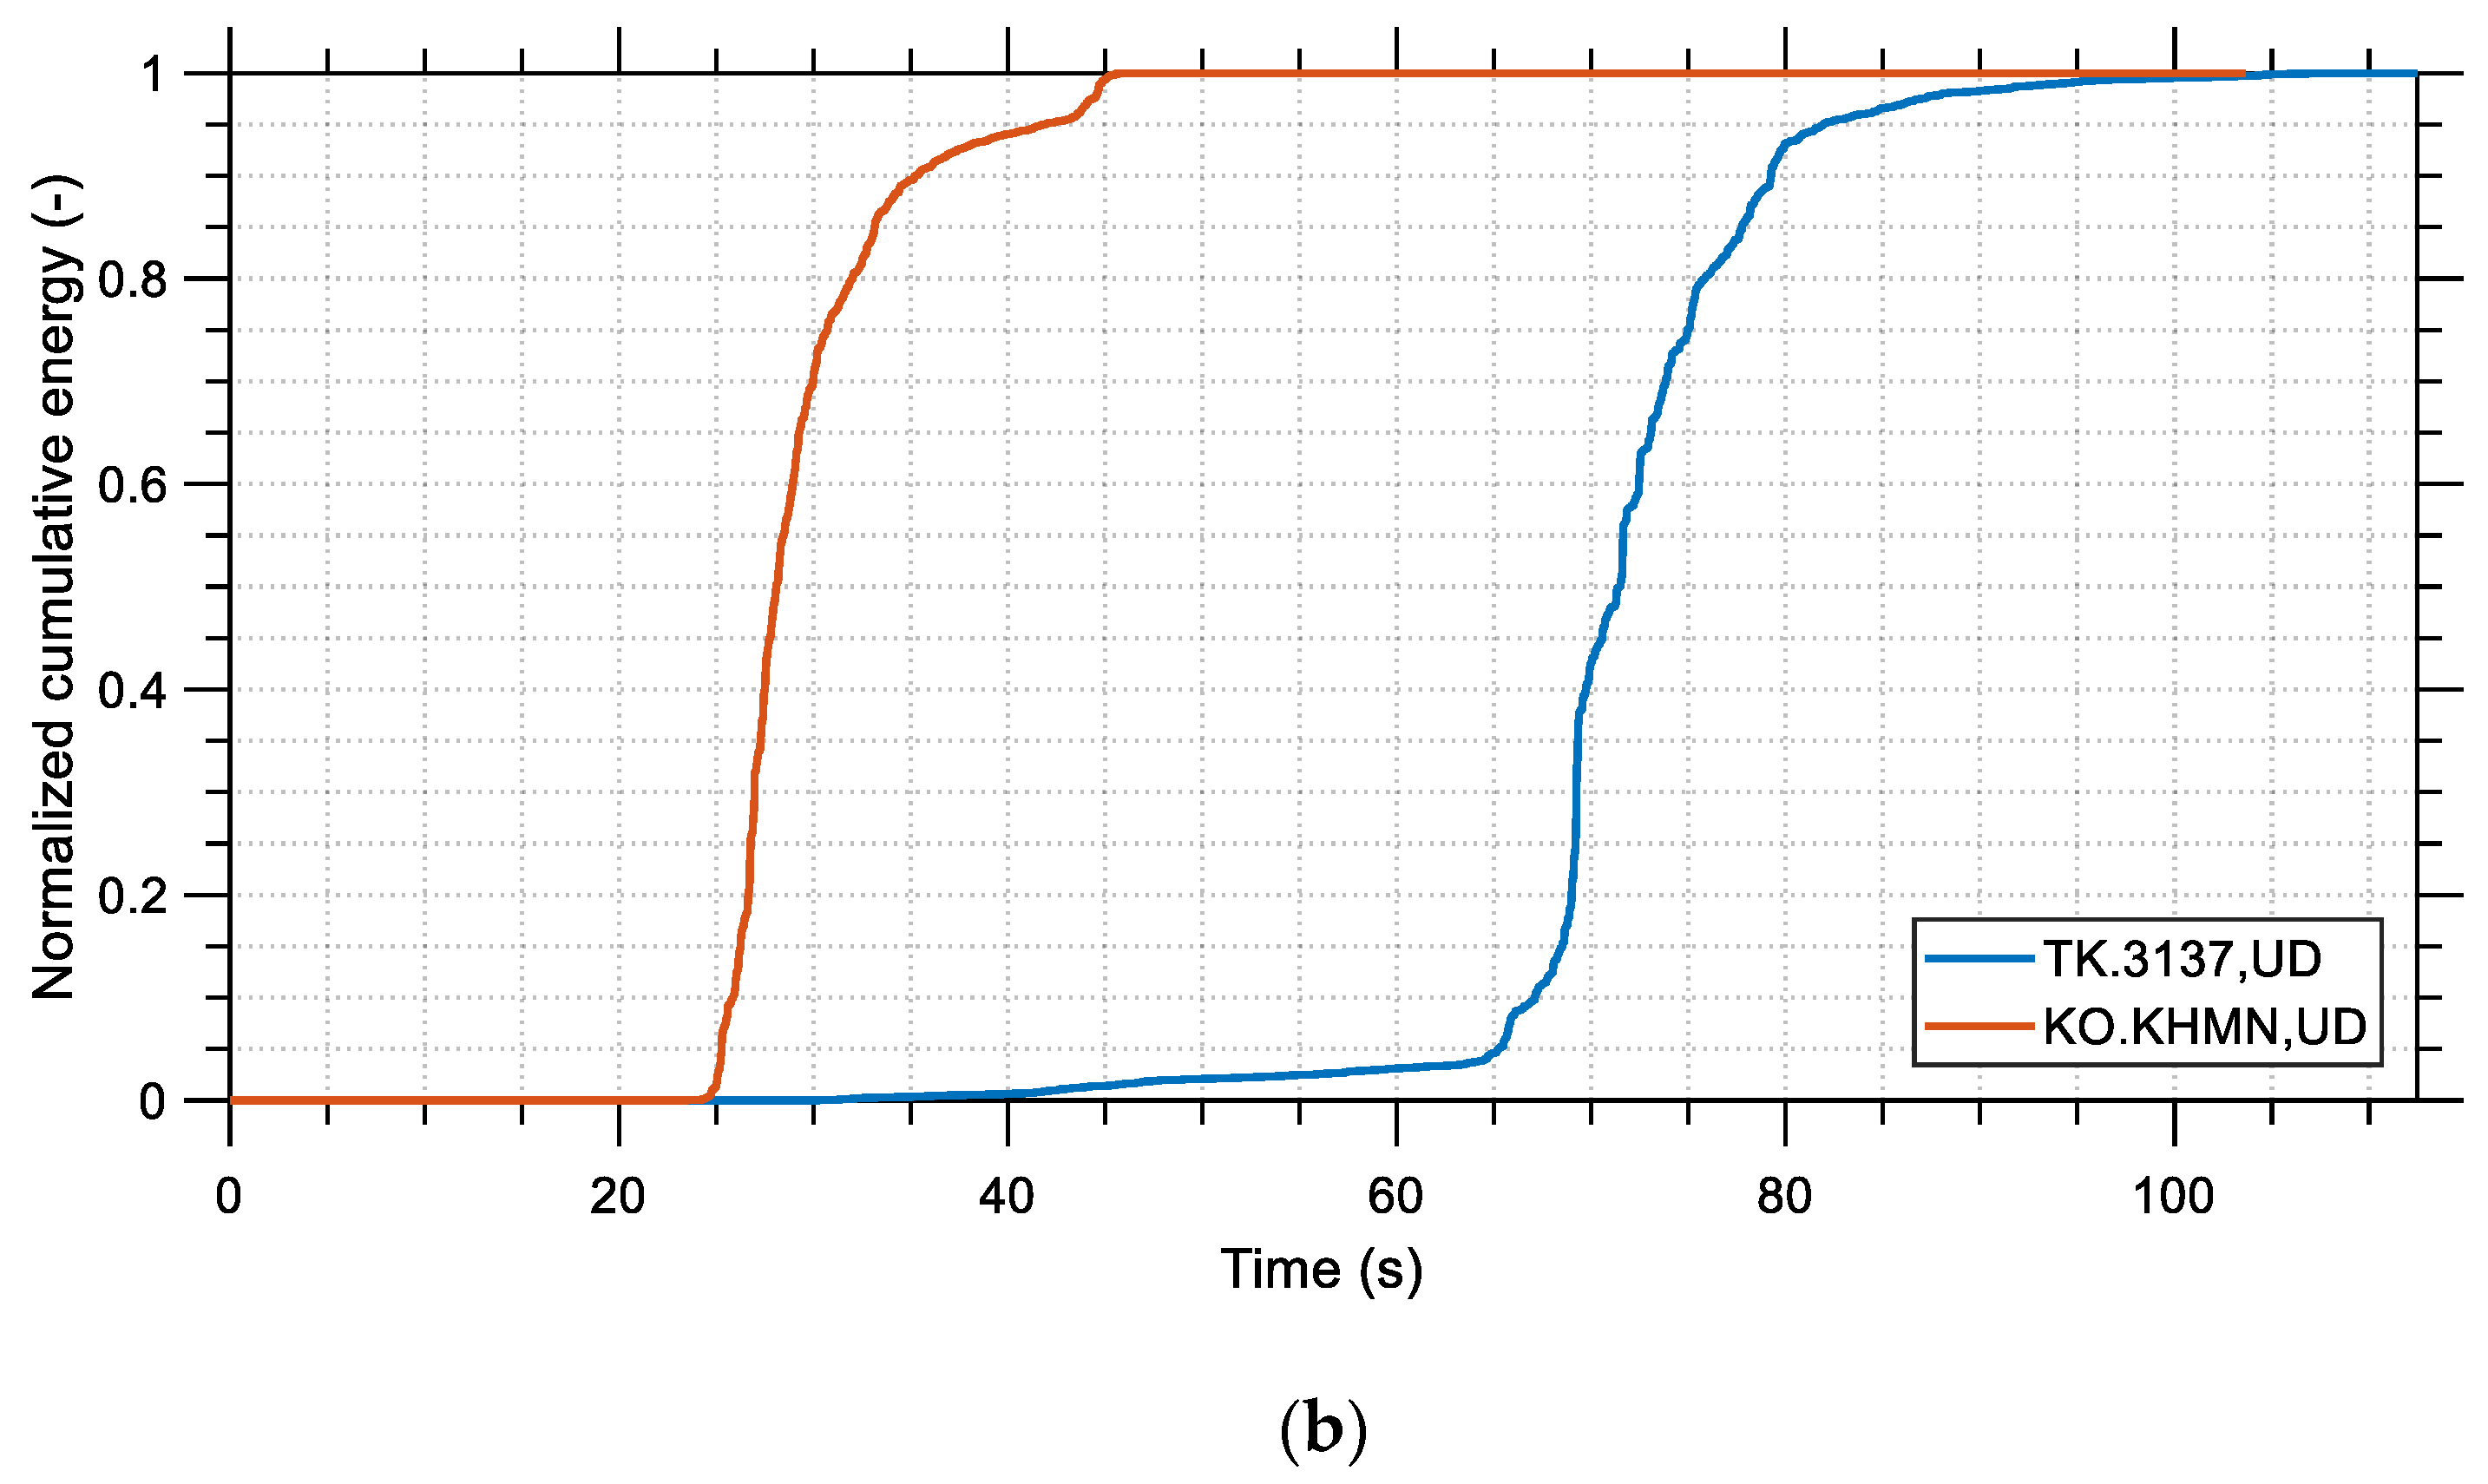
The main trend, apart from the relatively high Arias intensity and cumulative energy values, is that the seismic energy was released in a small fraction of the total duration of the earthquake. For example, for station TK.3137, it took only 16 s for 90% of the seismic energy to be released, whereas only roughly 8 s were needed for 70% of it to be released. If these time durations are compared to the total duration of the earthquake, which is larger than 80 s, it becomes apparent that the M
w 7.8 event was an event of large seismic power. This fact played a critical role in the intensity of the shaking that was experienced by structures and could provide some indirect hints explaining the large number of structural collapses. The aforementioned points become obvious by observing the normalized cumulative energy time histories shown in
Figure 6 [
35].
3.2. Elastic Response Spectra
A response spectrum is a plot that shows the maximum response of a structure to a ground motion as a function of frequency (or equivalently the period). The elastic response spectra simulate a single degree of freedom (SDOF) system and the way that it would respond to the time history of a given earthquake. We are interested both in the peak and the cumulative spectral response of an SDOF system for an earthquake. Typical spectral quantities of the first category are spectral acceleration and pseudo-acceleration, spectral velocity and pseudo-velocity, and spectral displacement. Typical spectral quantities of the latter category are the seismic input energy equivalent velocity [
36], absolute and relative. It is noted that the seismic input energy equivalent velocity is a measure of the seismic energy that is input to a structure by an earthquake, not the energy that is released by the earthquake itself. In structural analysis, response spectra are utilized in response spectrum modal analysis (RSMA), a method commonly used in the design of buildings, bridges, and other structures that are critical to public safety. By analyzing the structure’s response to different ground motion records, given the uncertainties involved, the engineers can hope that the structure will not experience excessive deformation or failure during an earthquake.
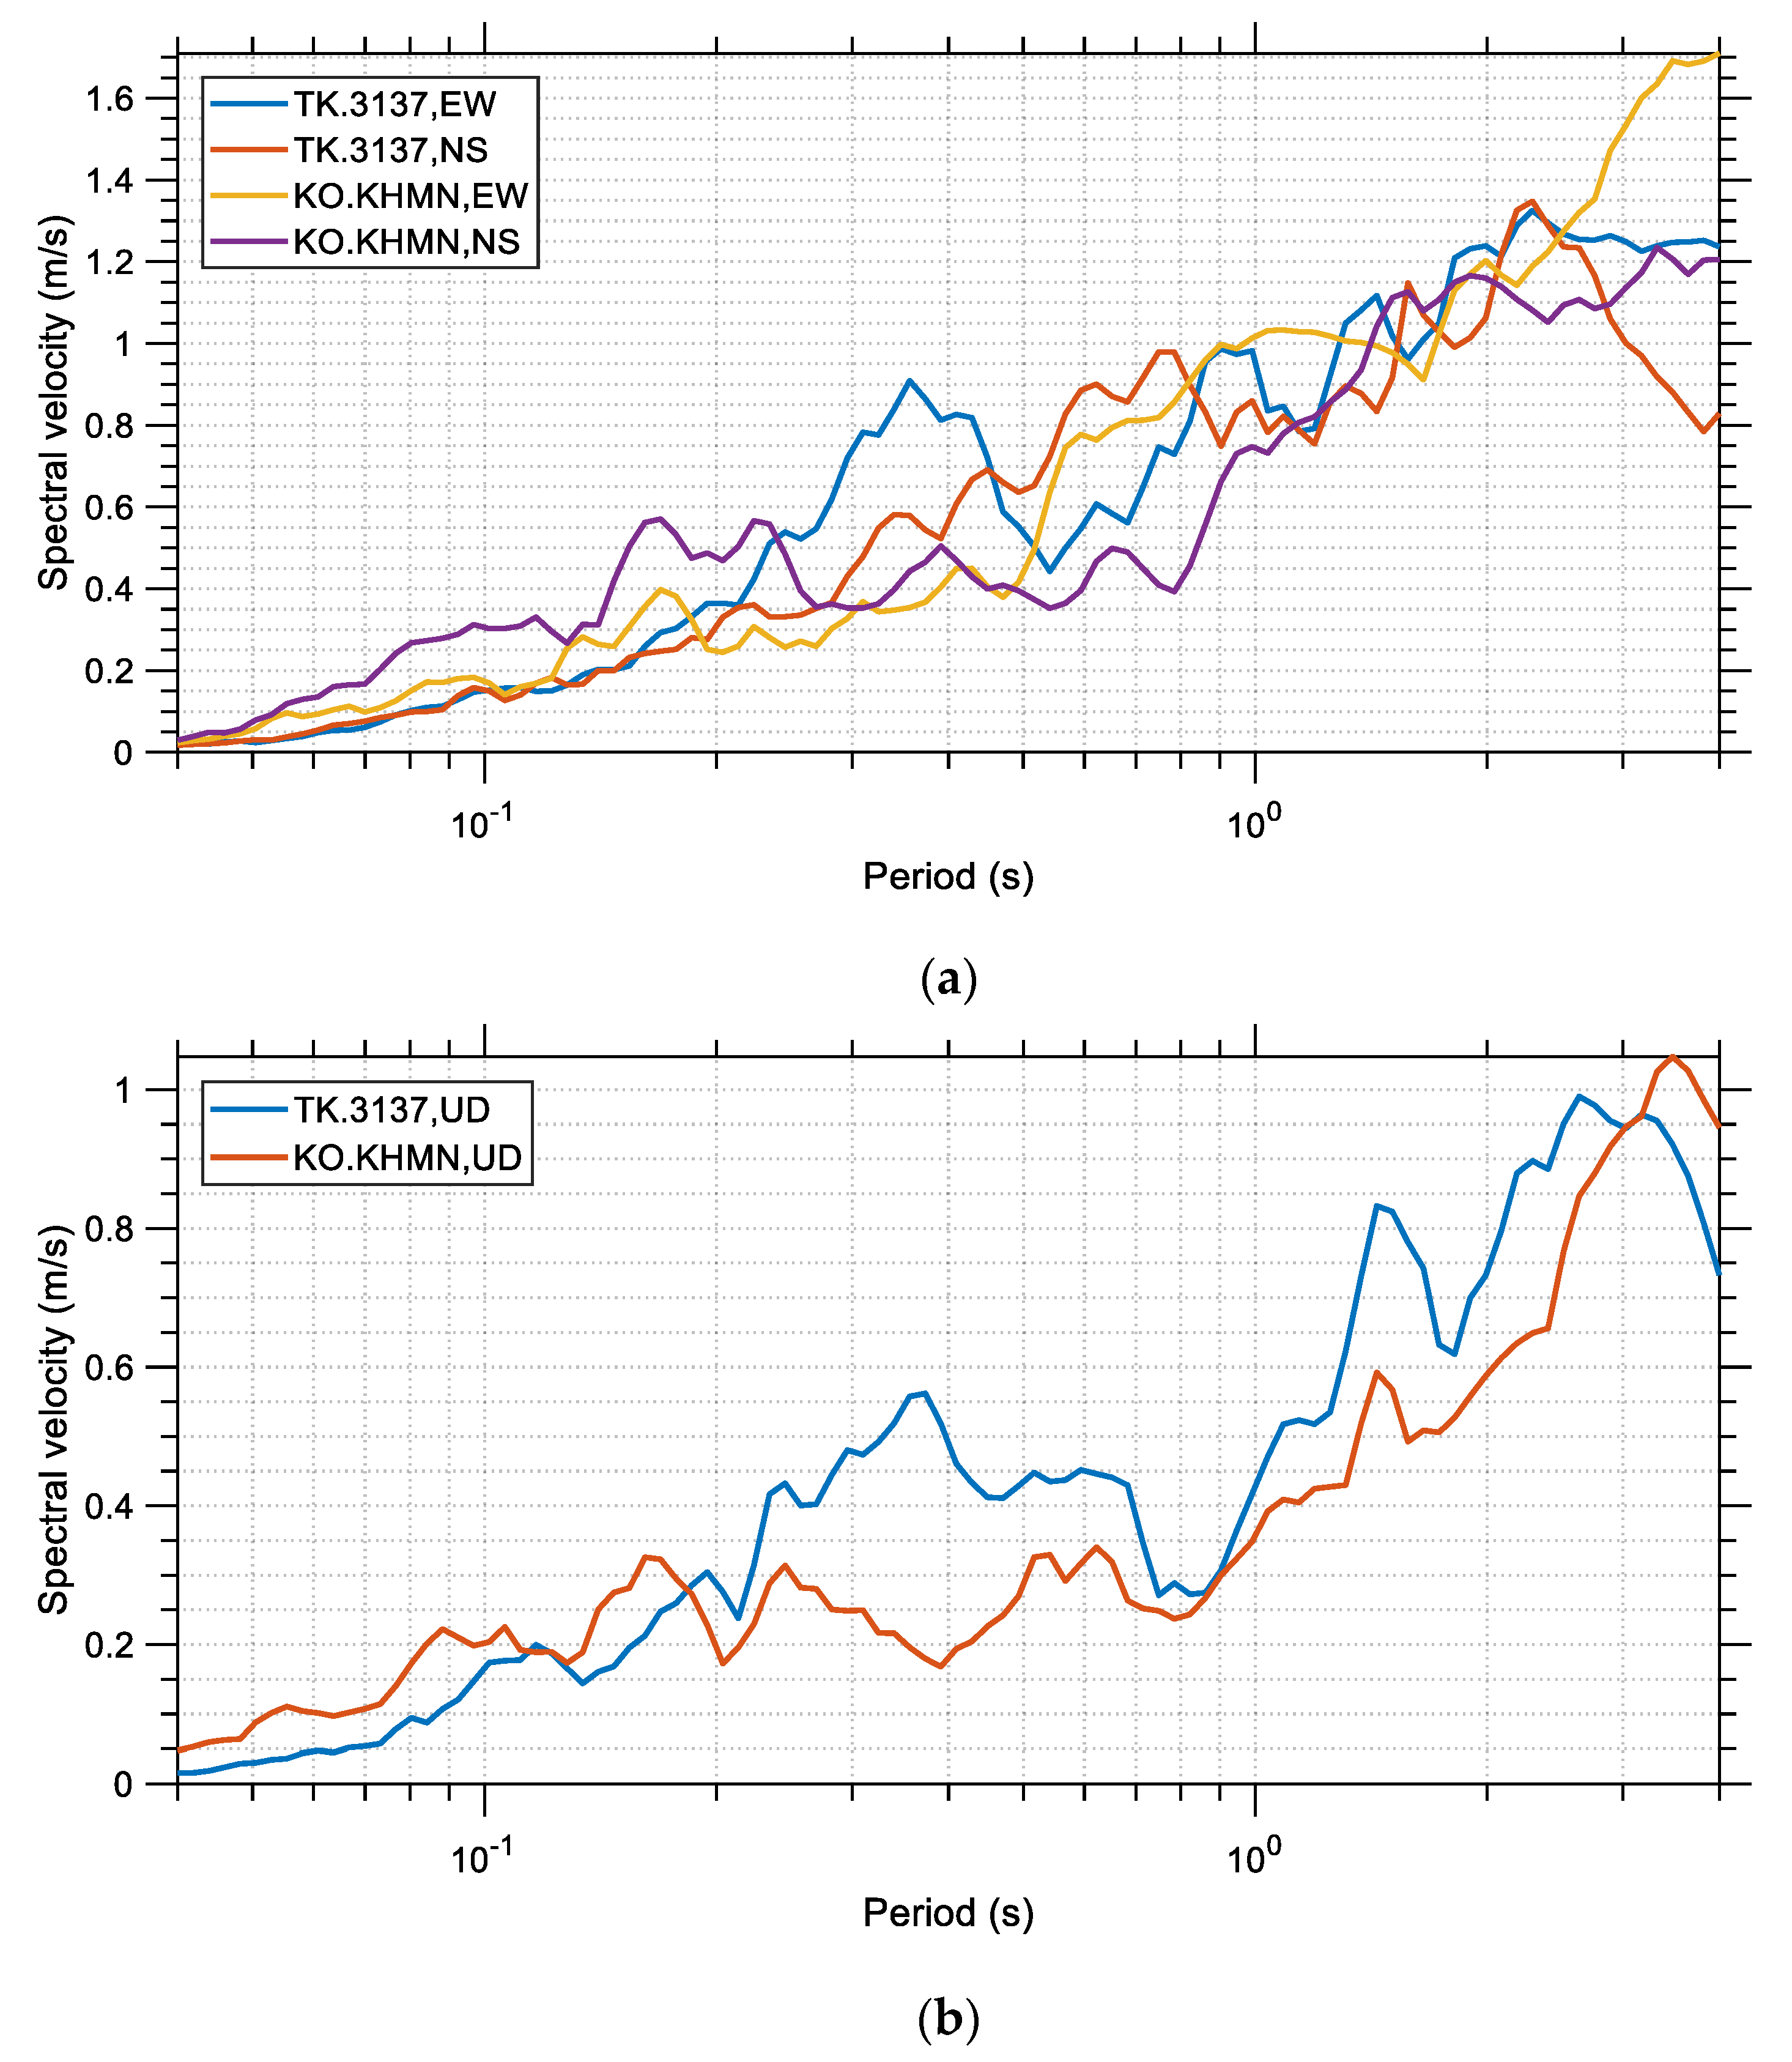
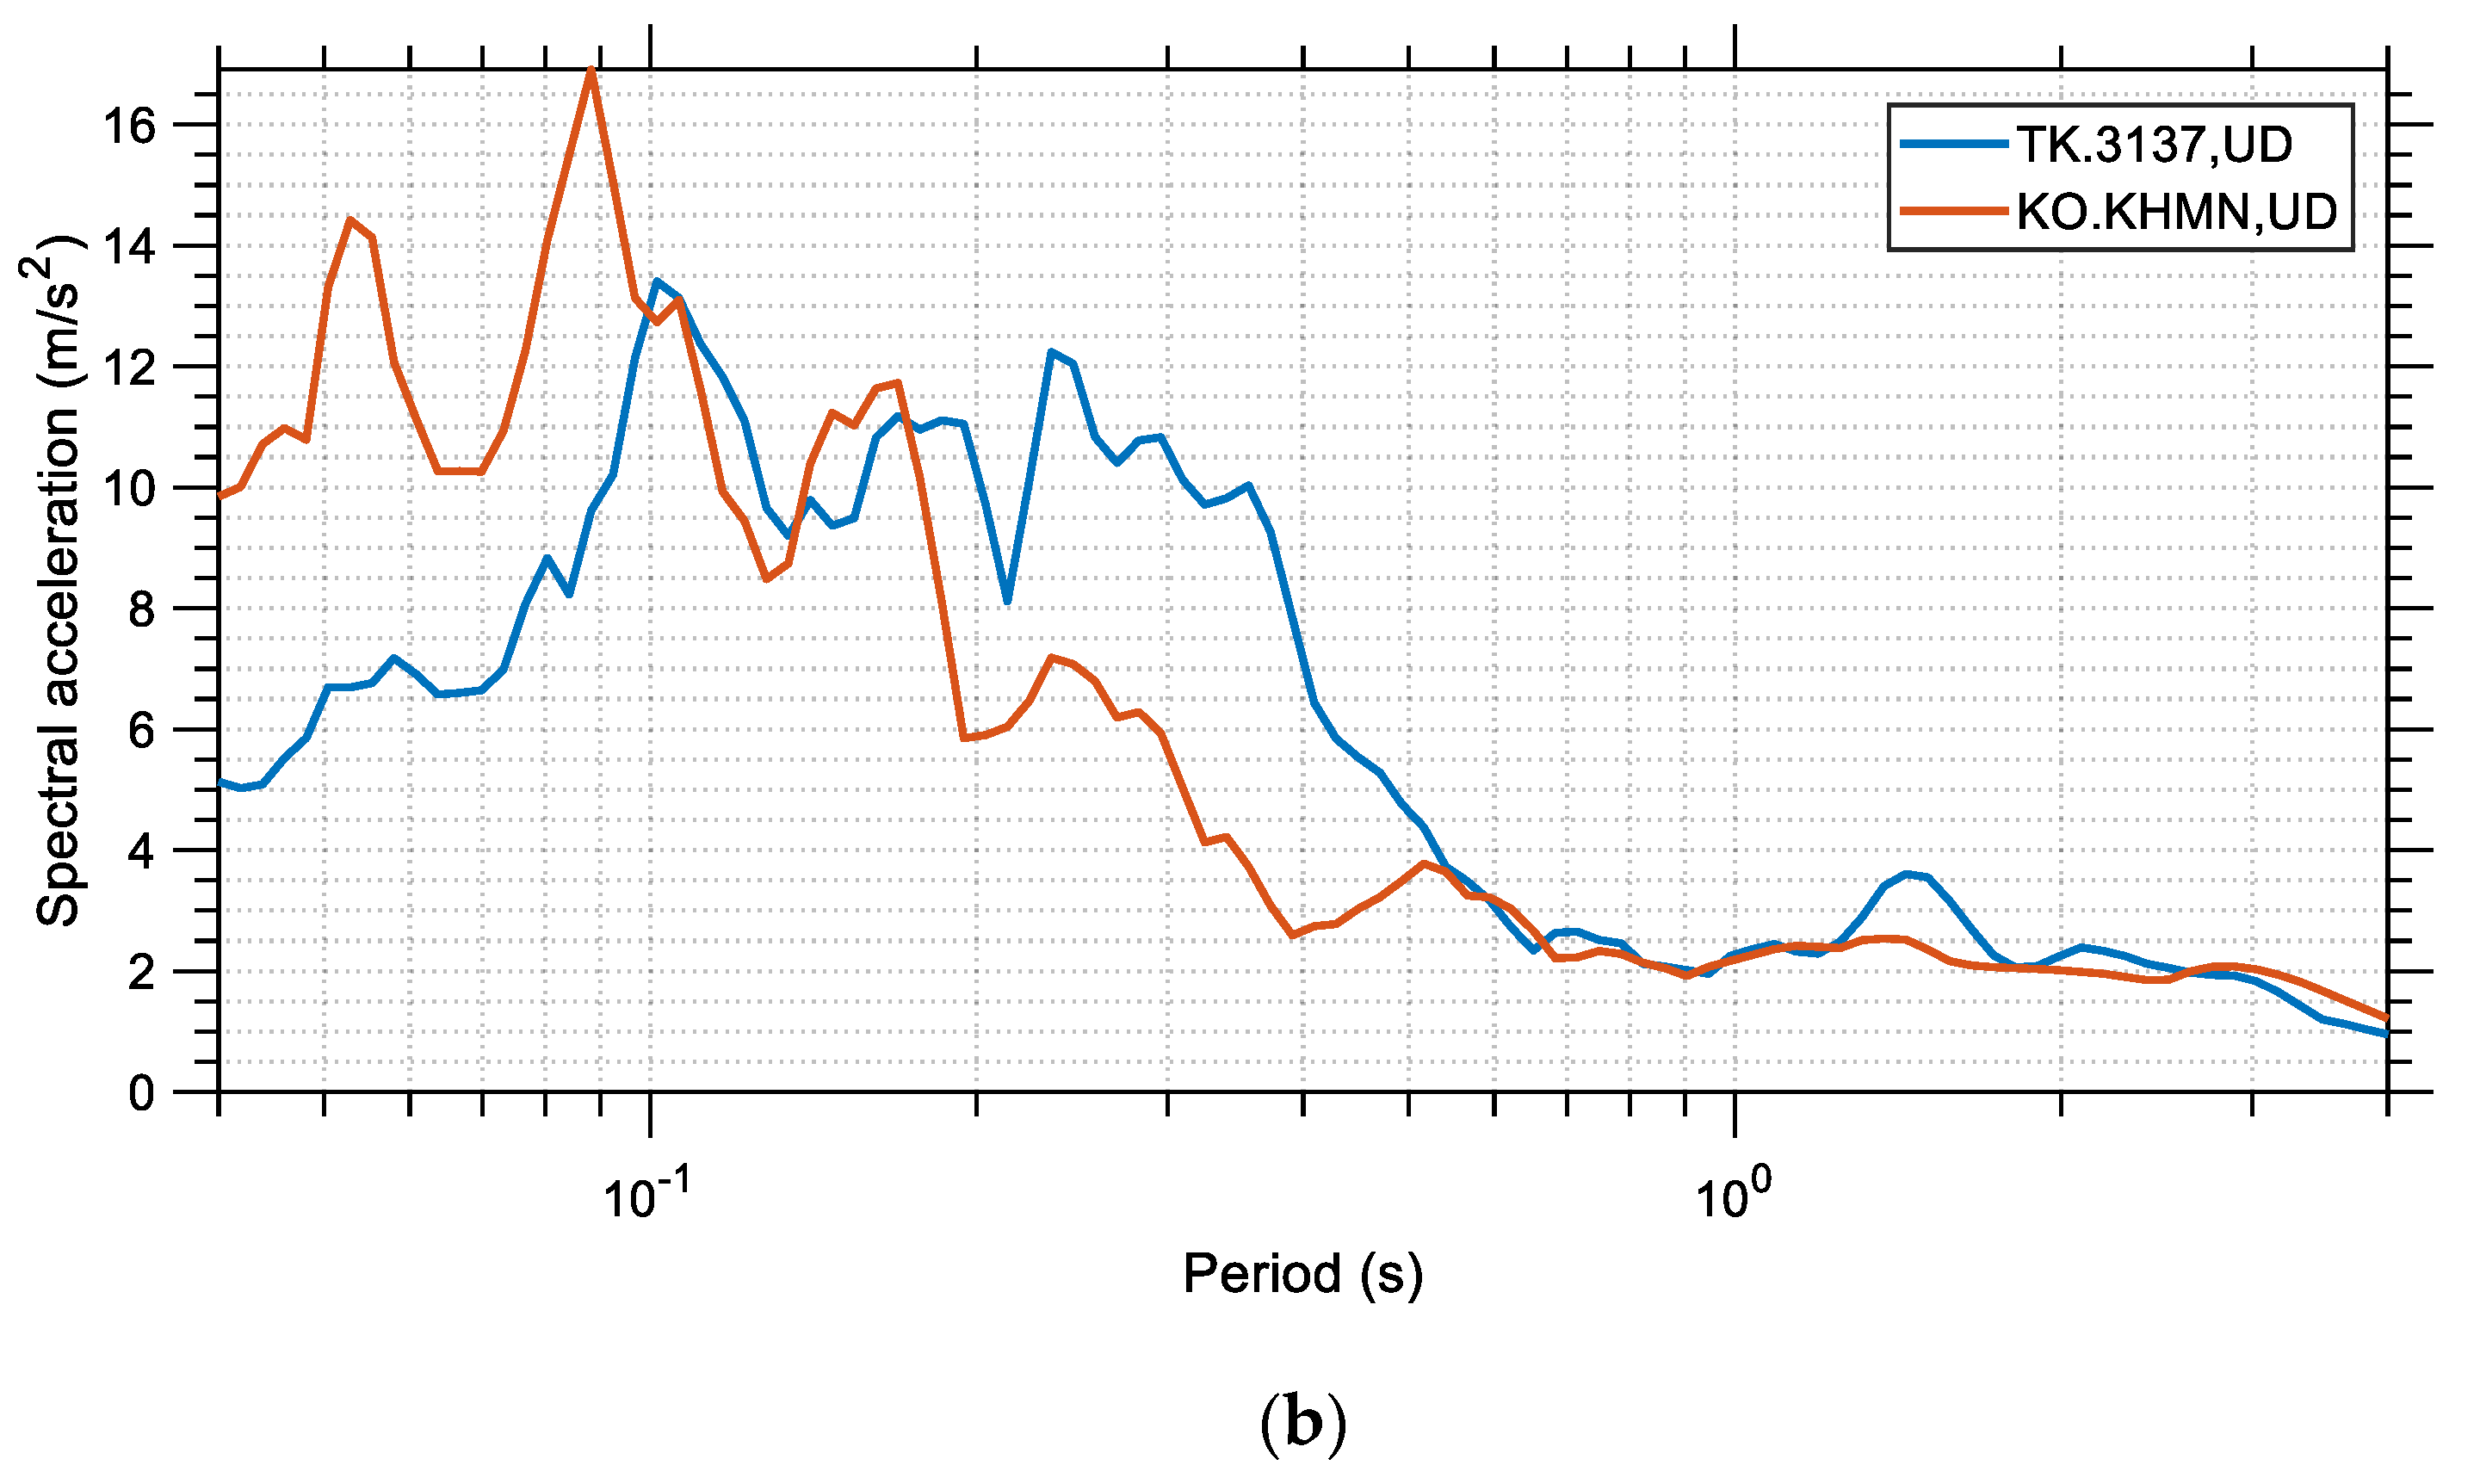
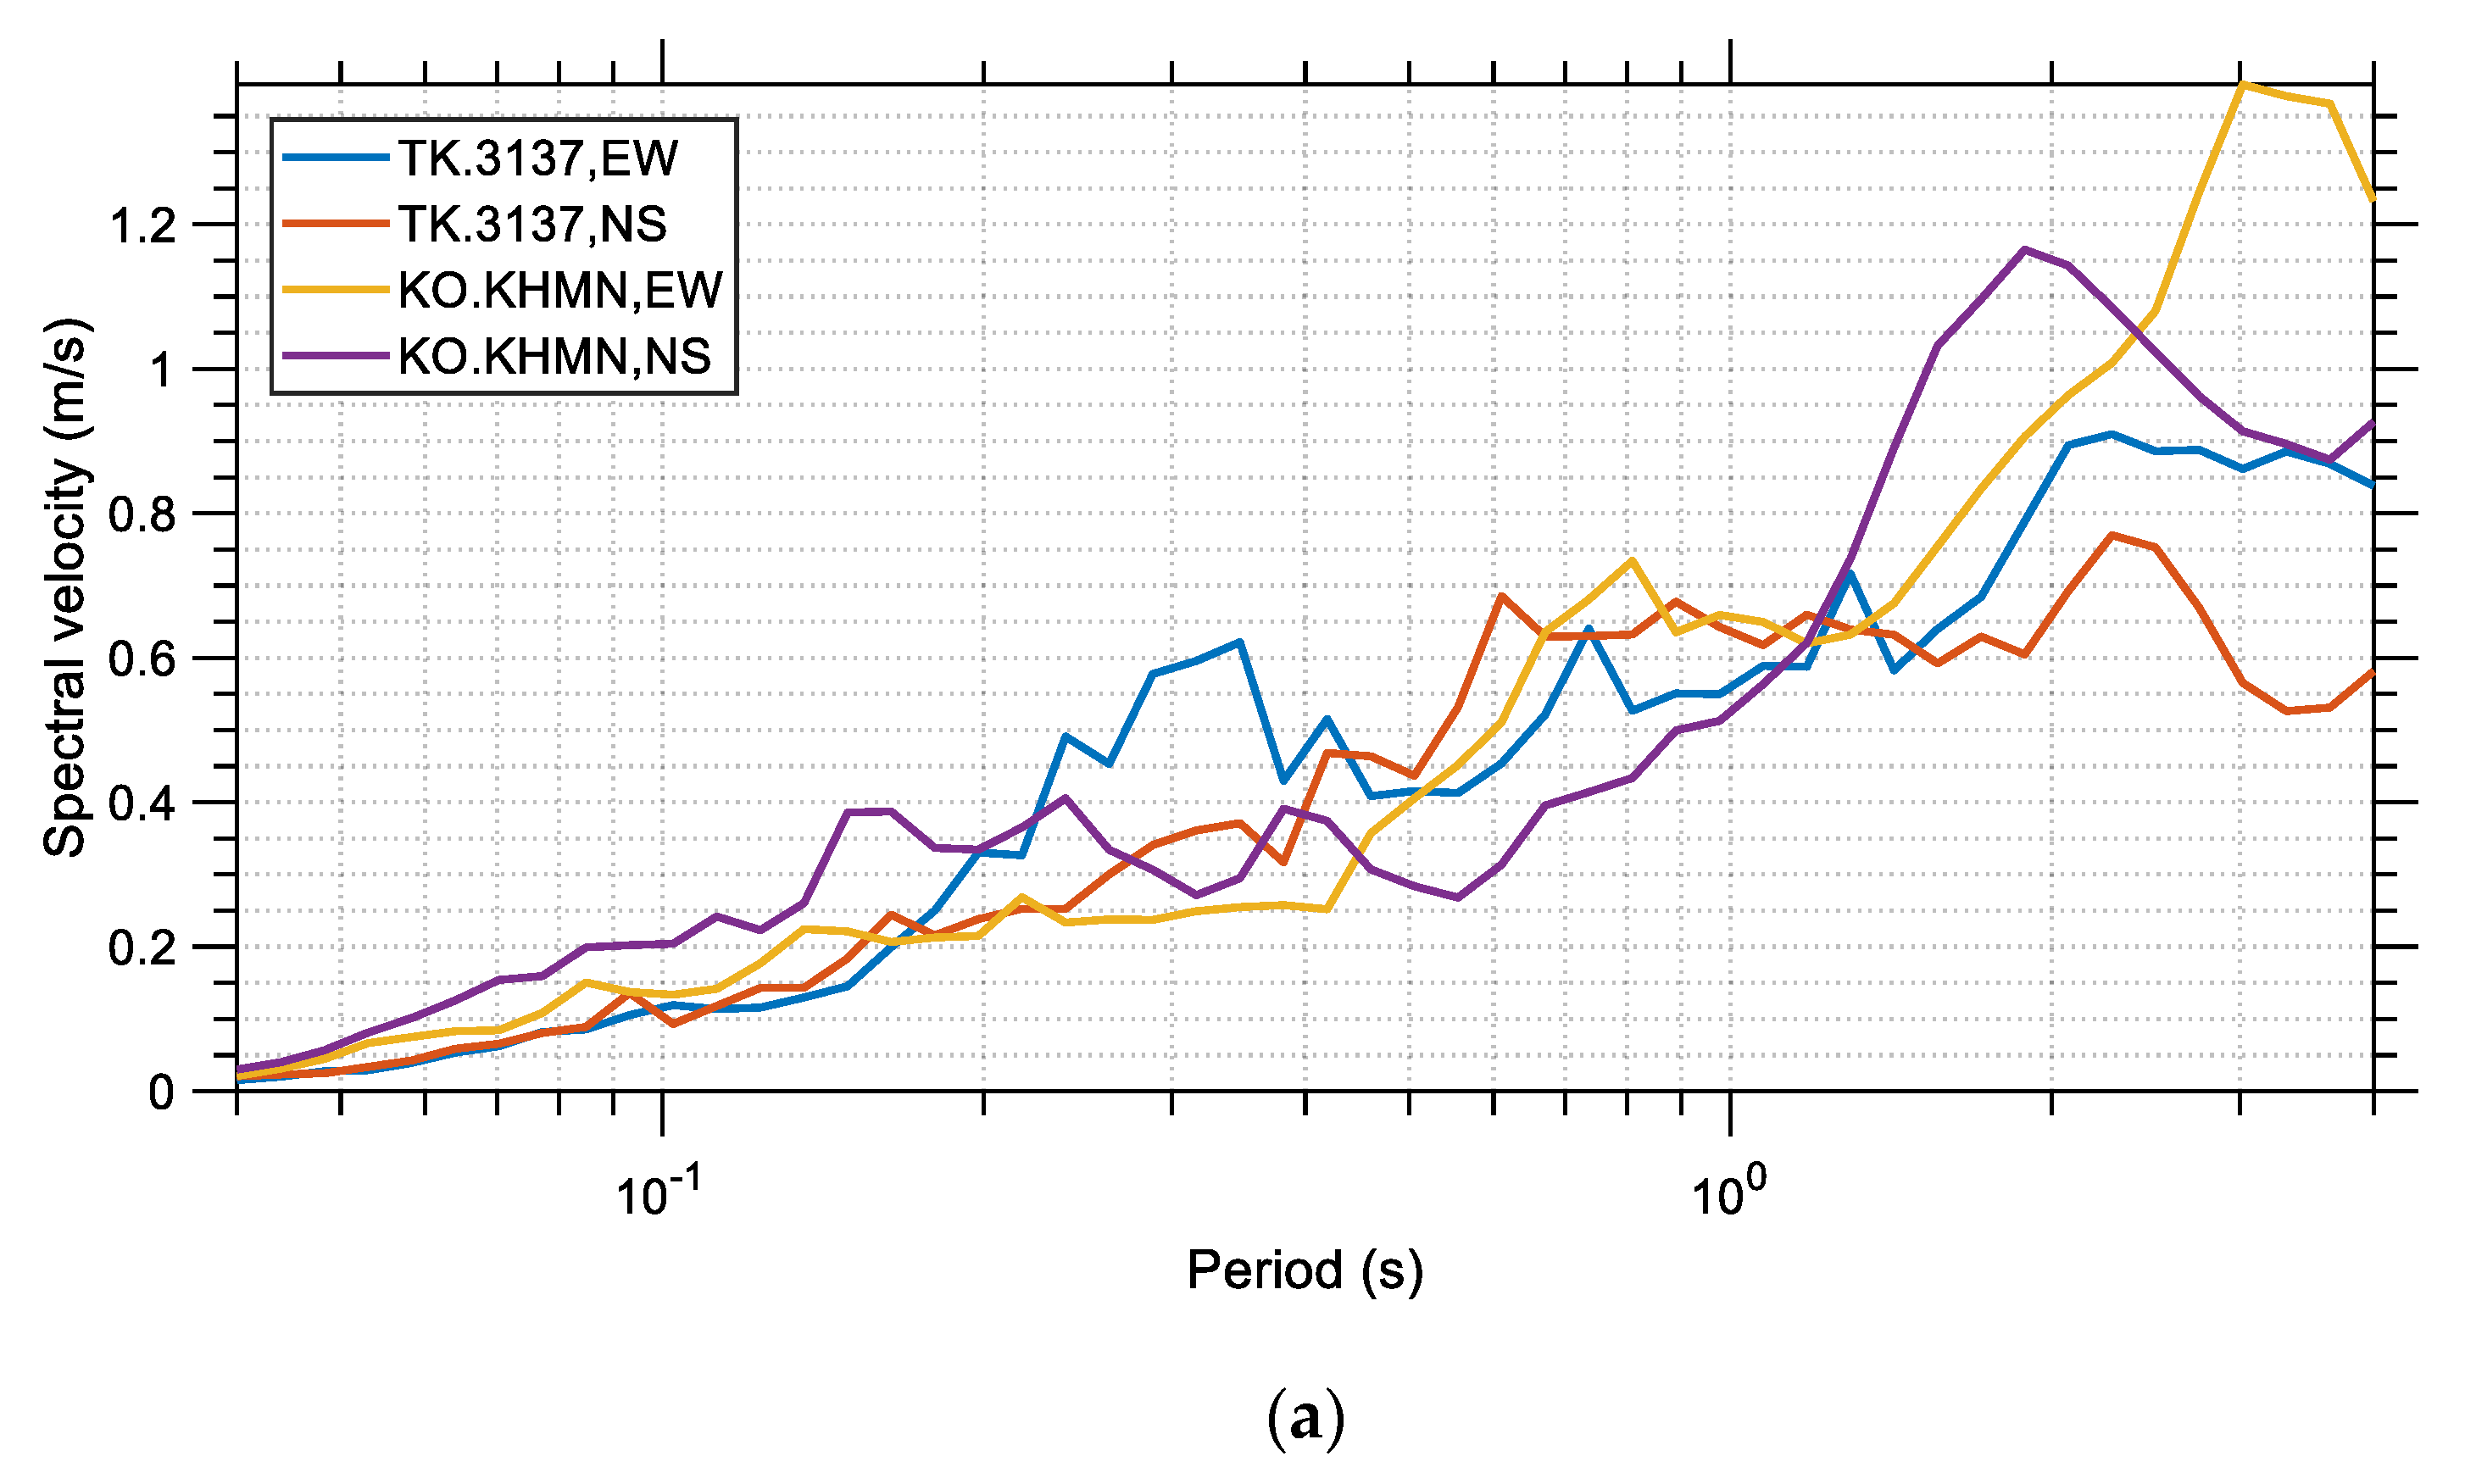
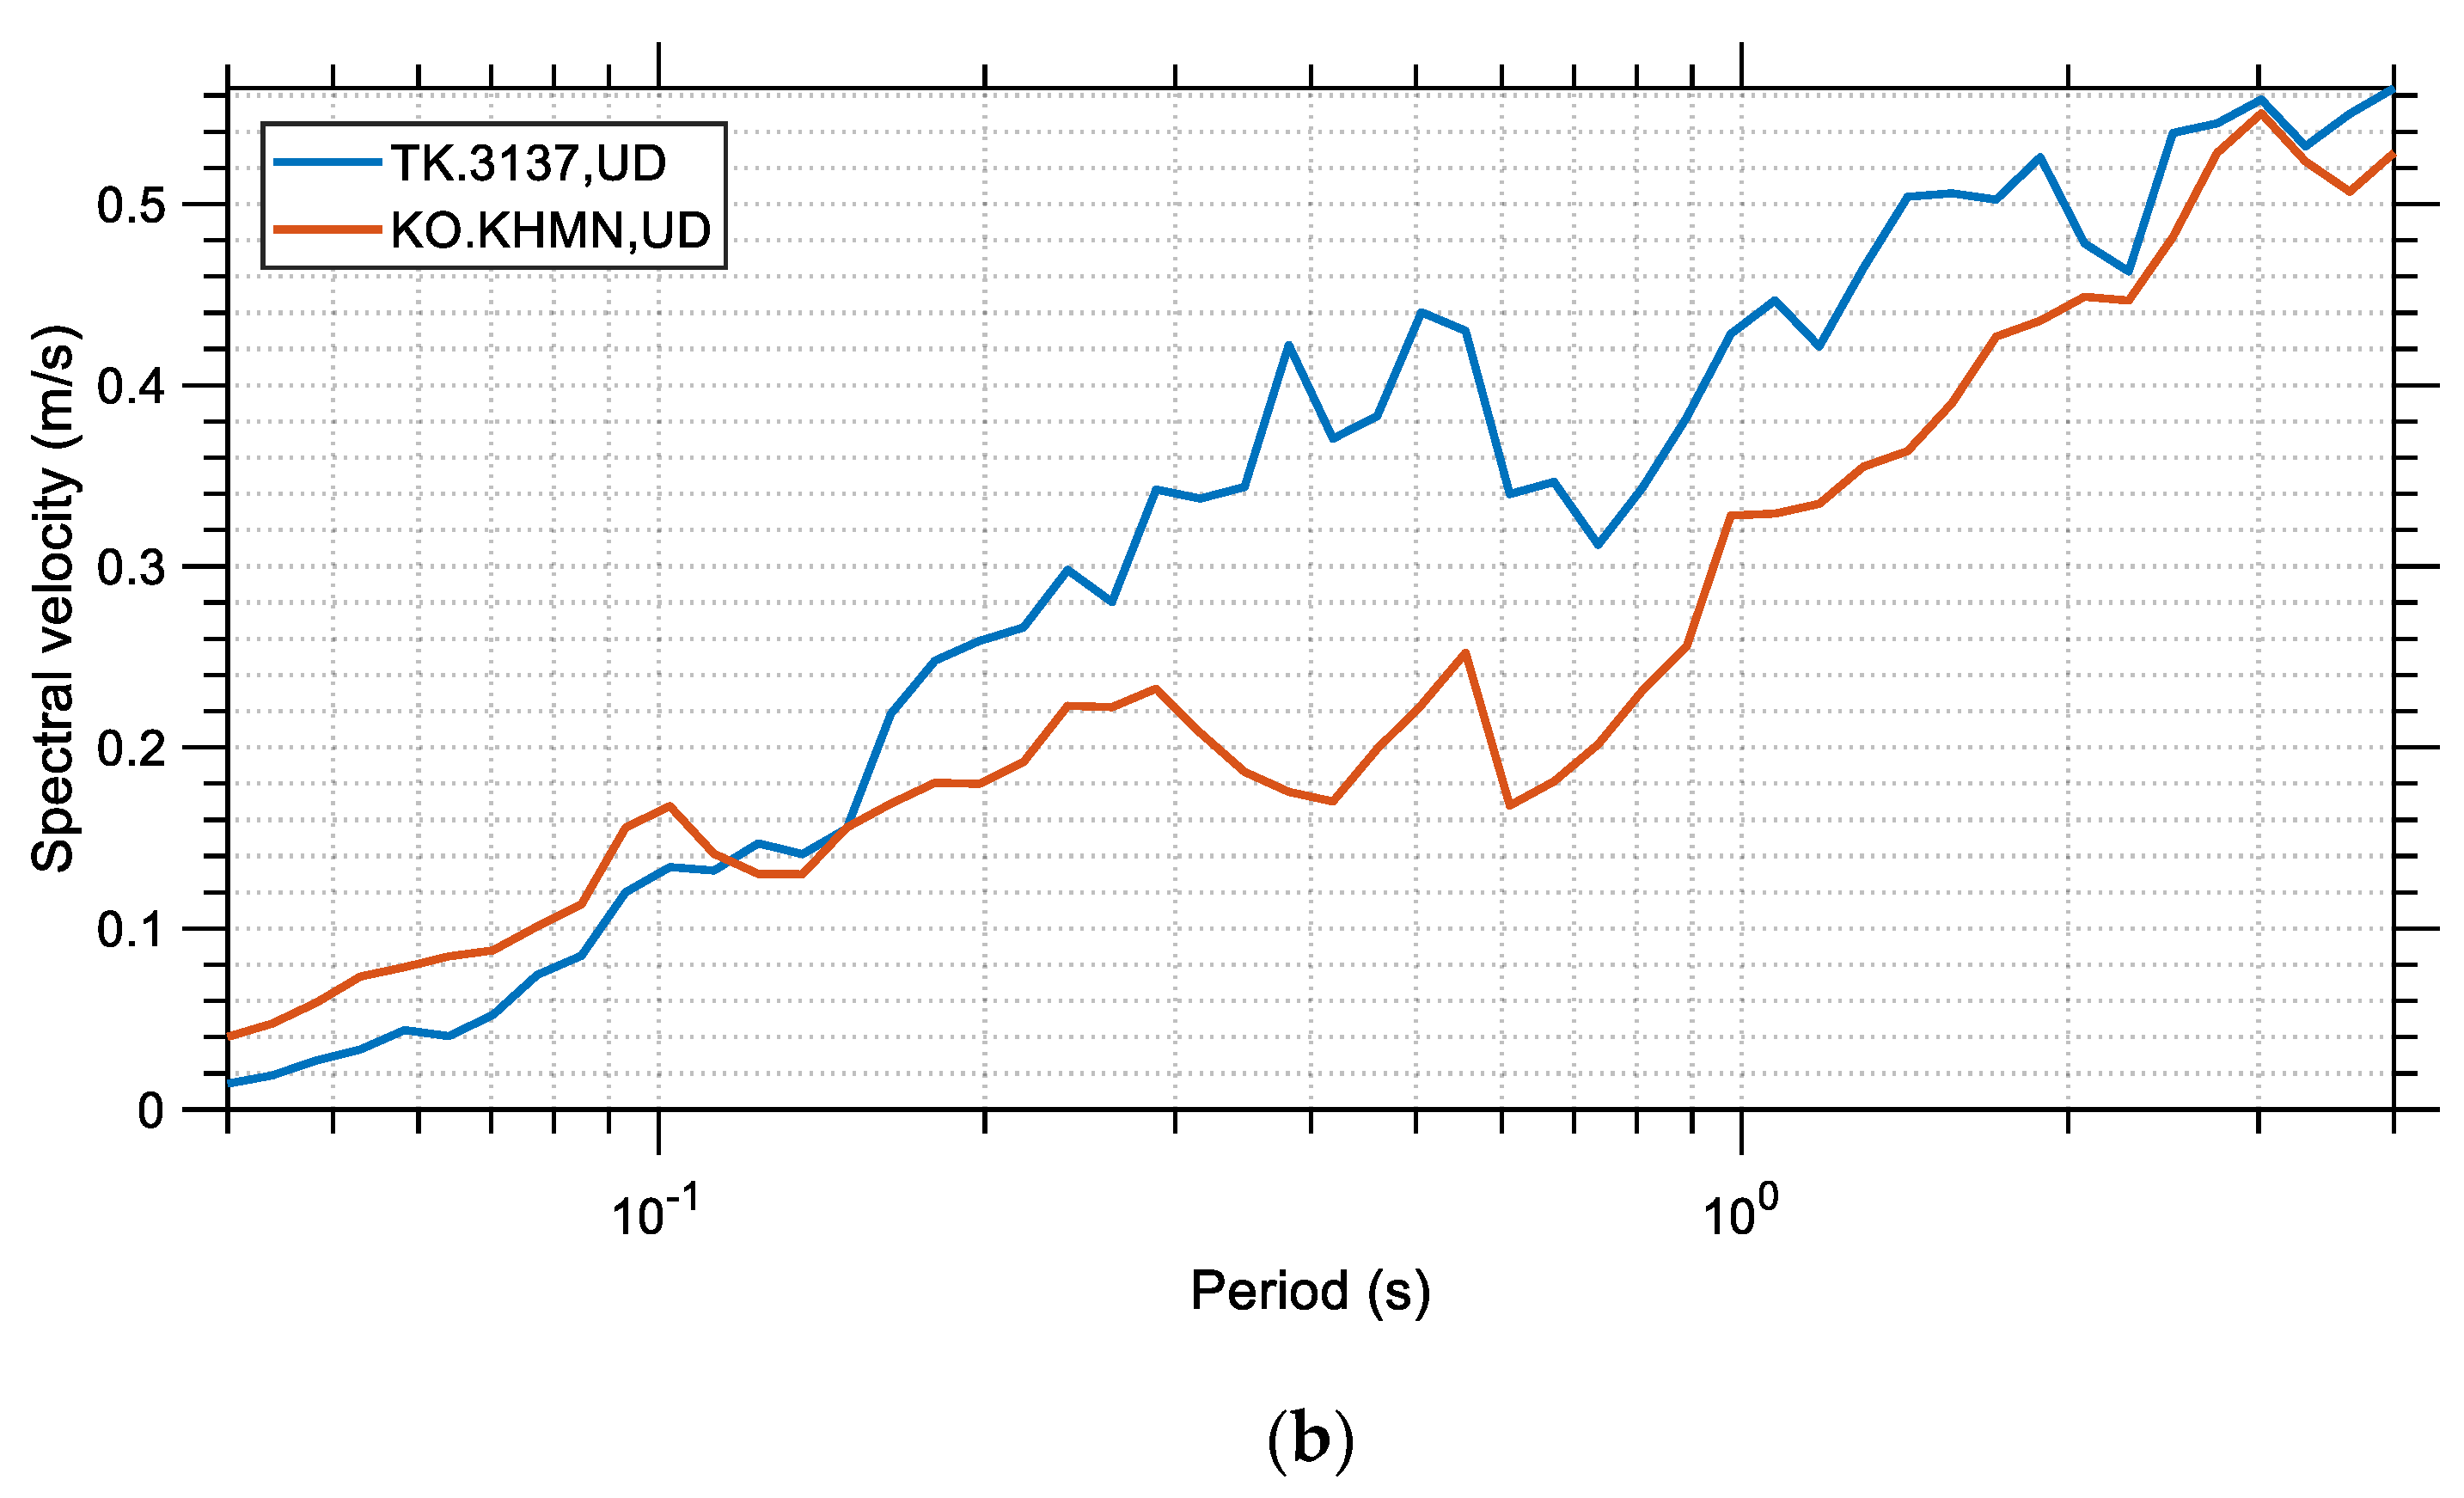
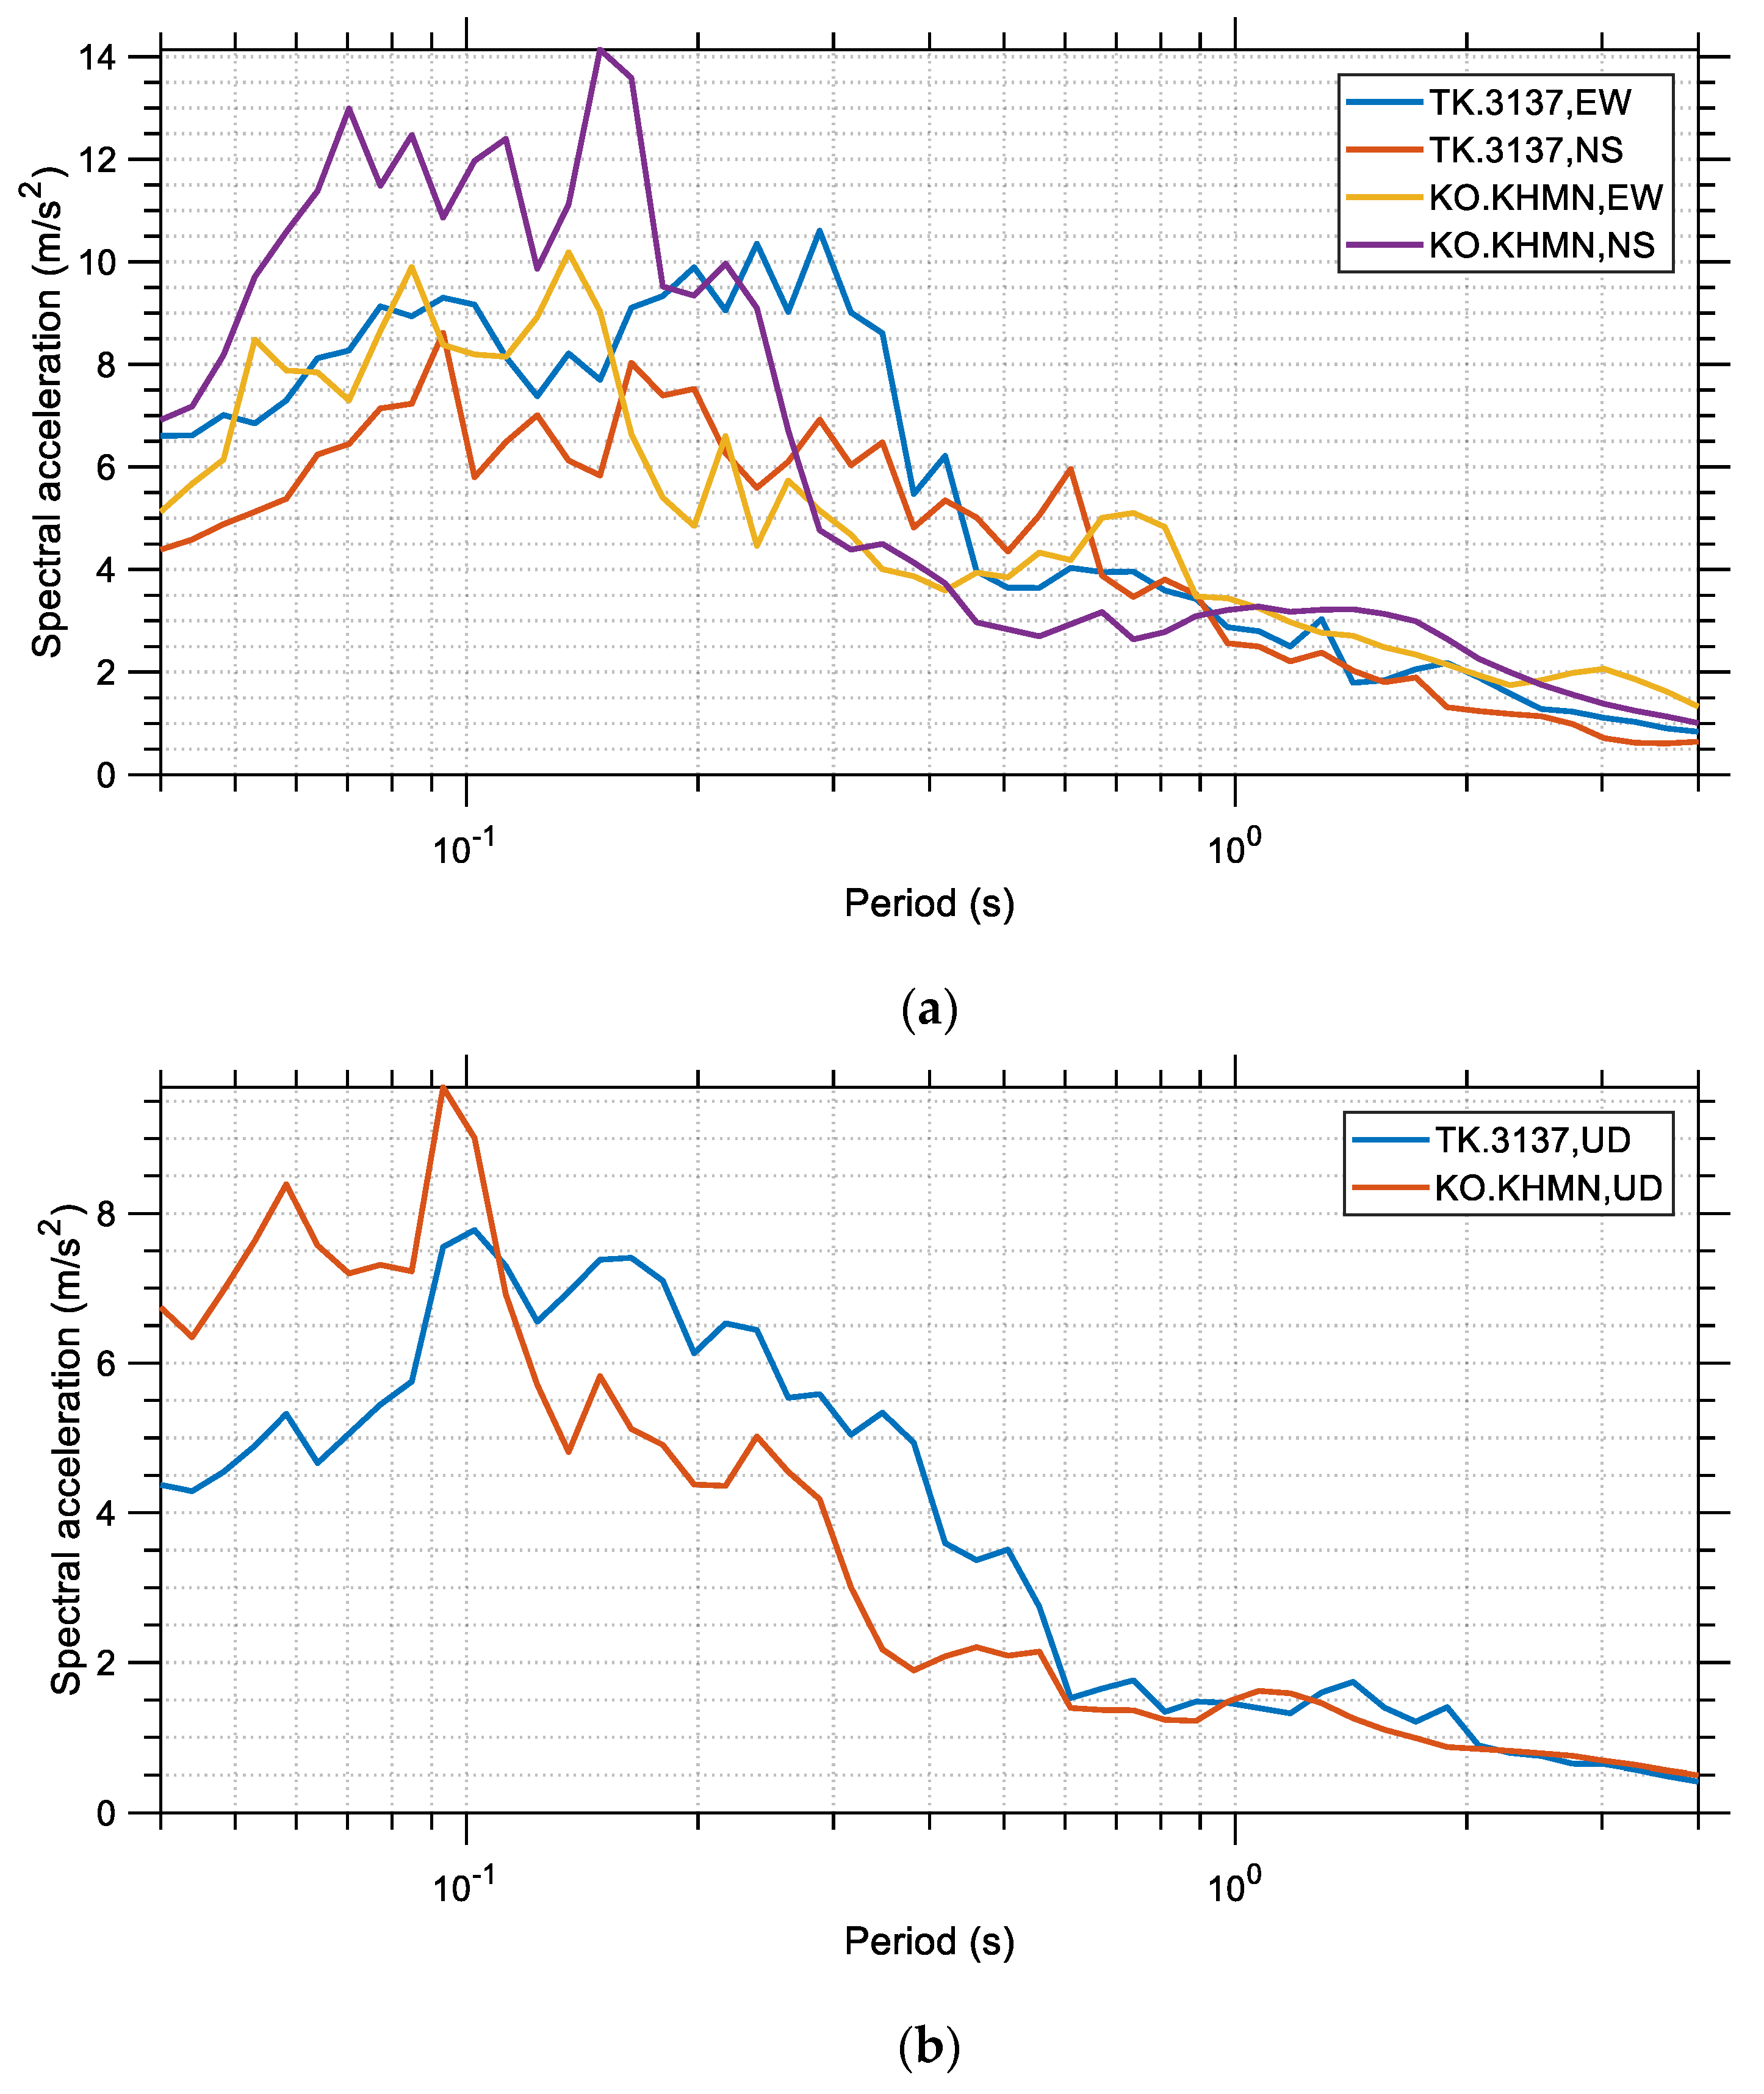
The spectral displacement, velocity, and acceleration are shown in
Figure 7,
Figure 8 and
Figure 9, respectively, for the two records and their different components (the two horizontal and the vertical). Similarly,
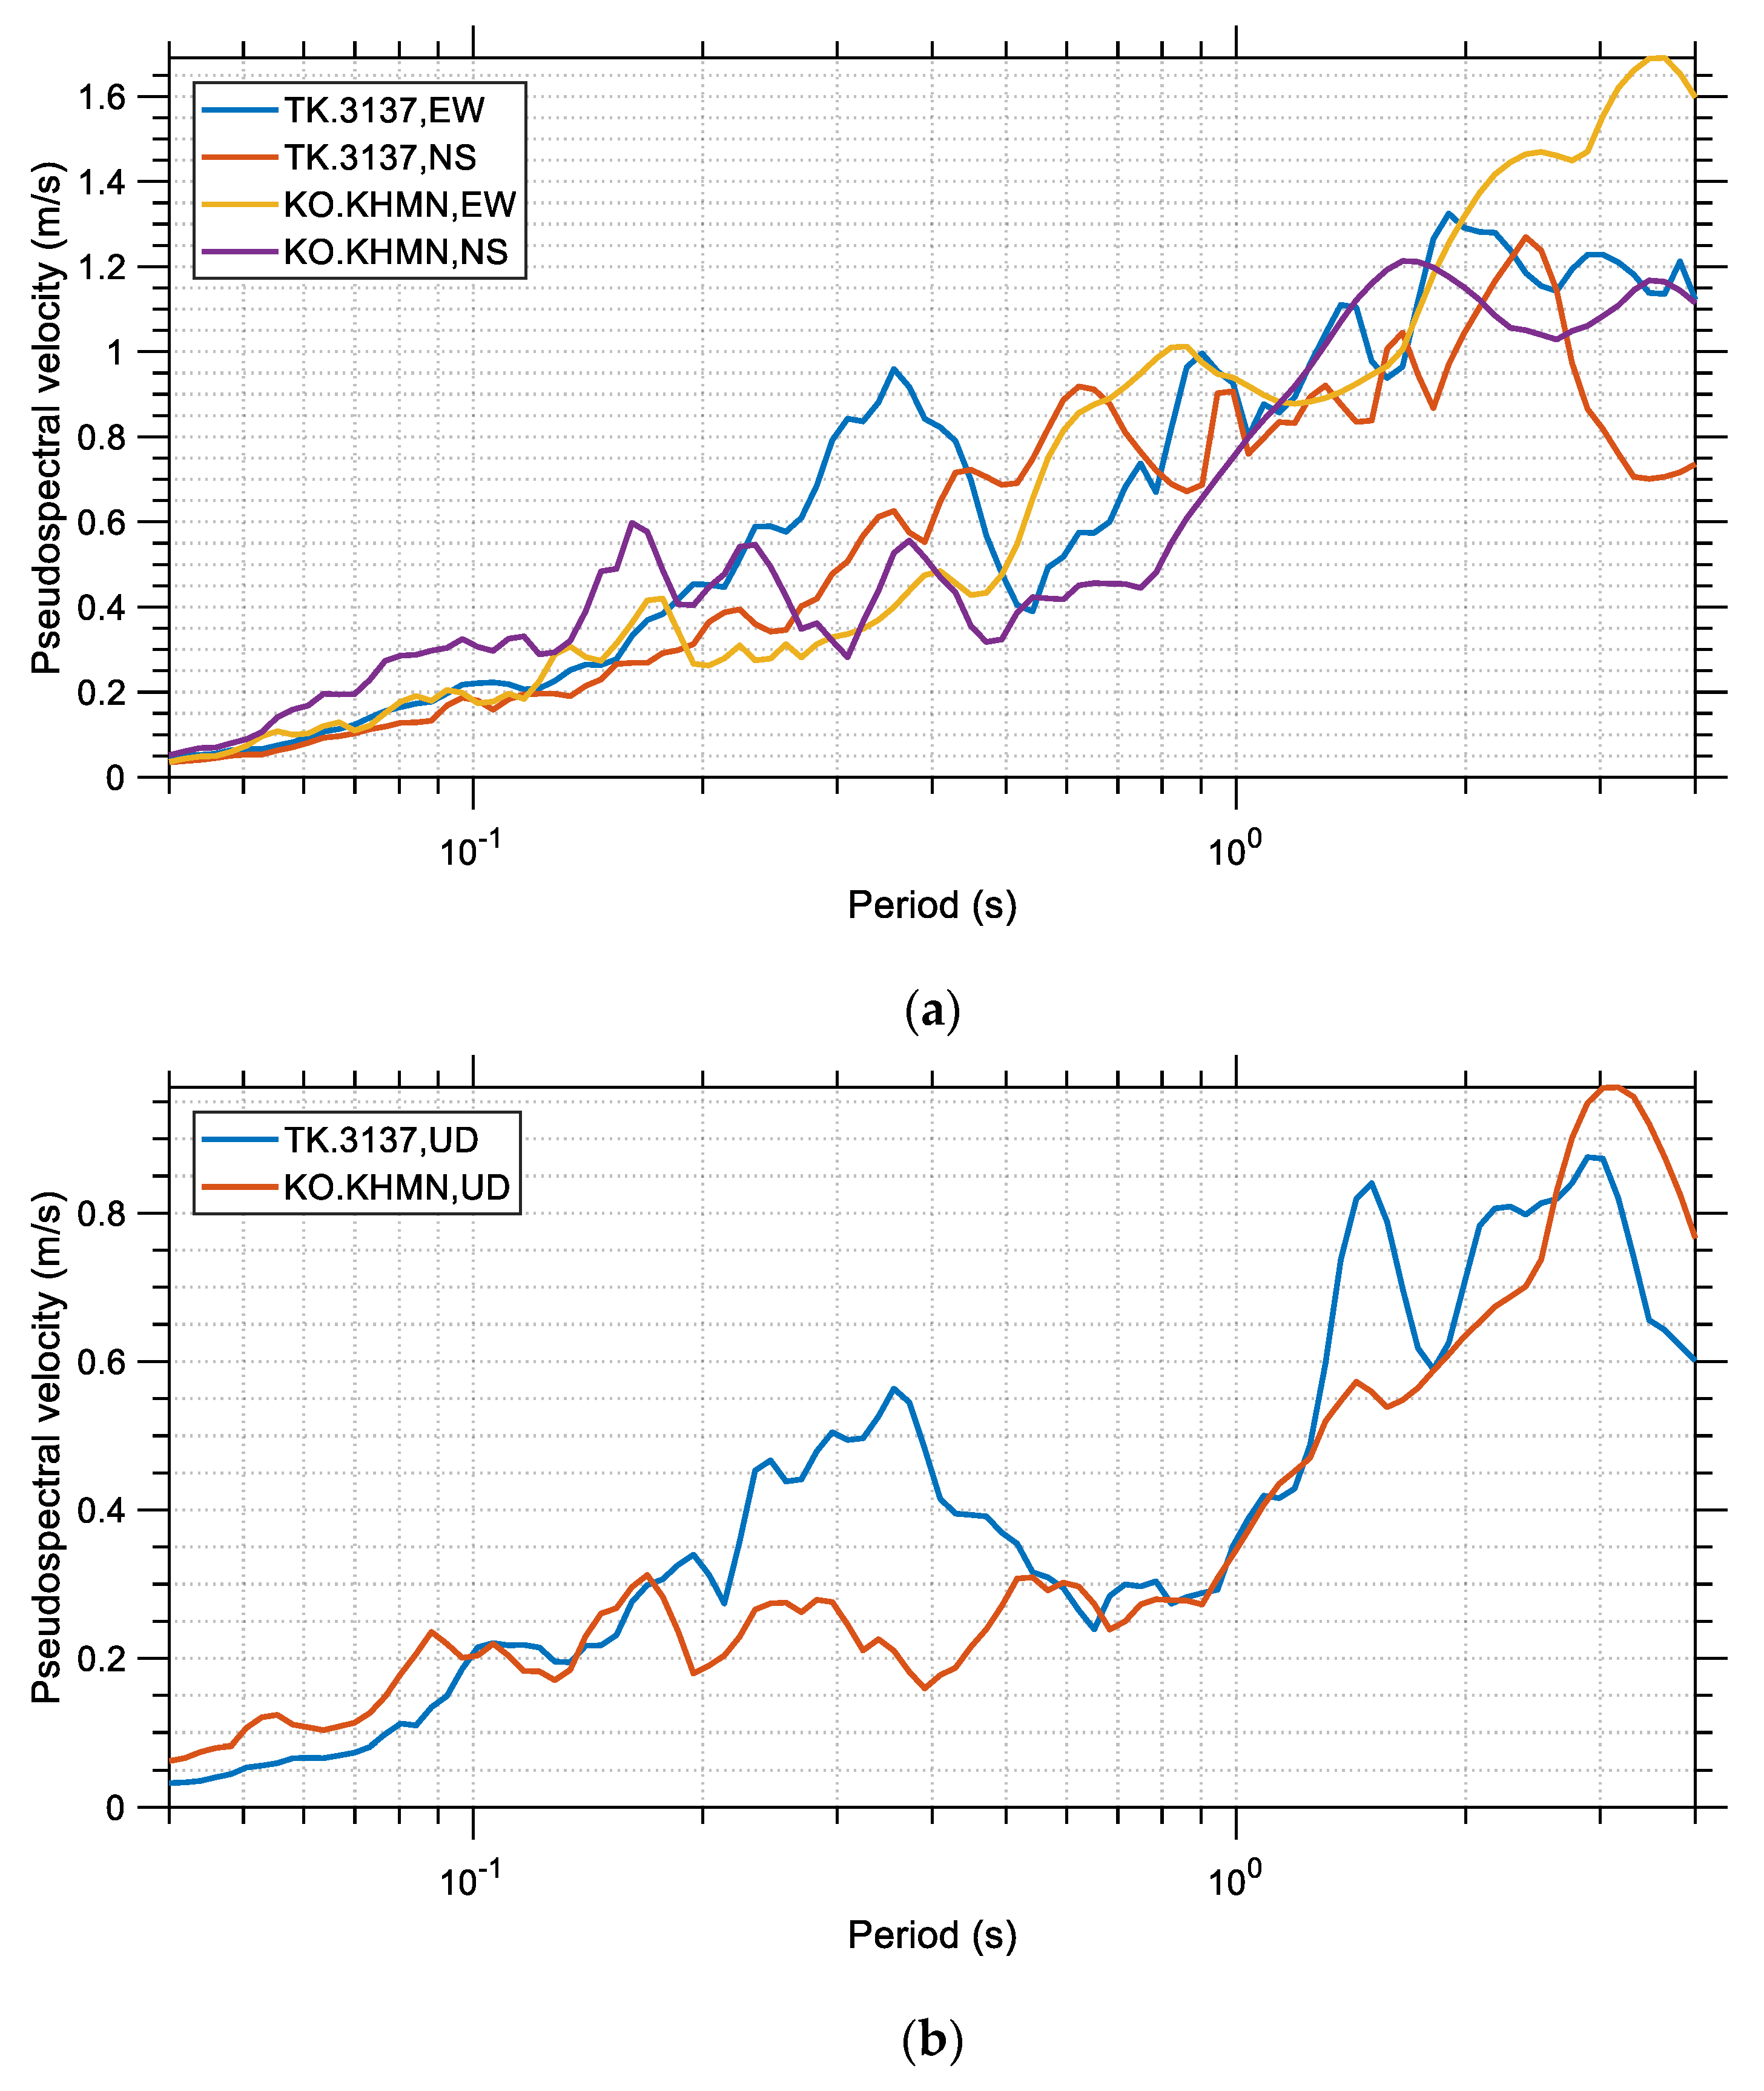
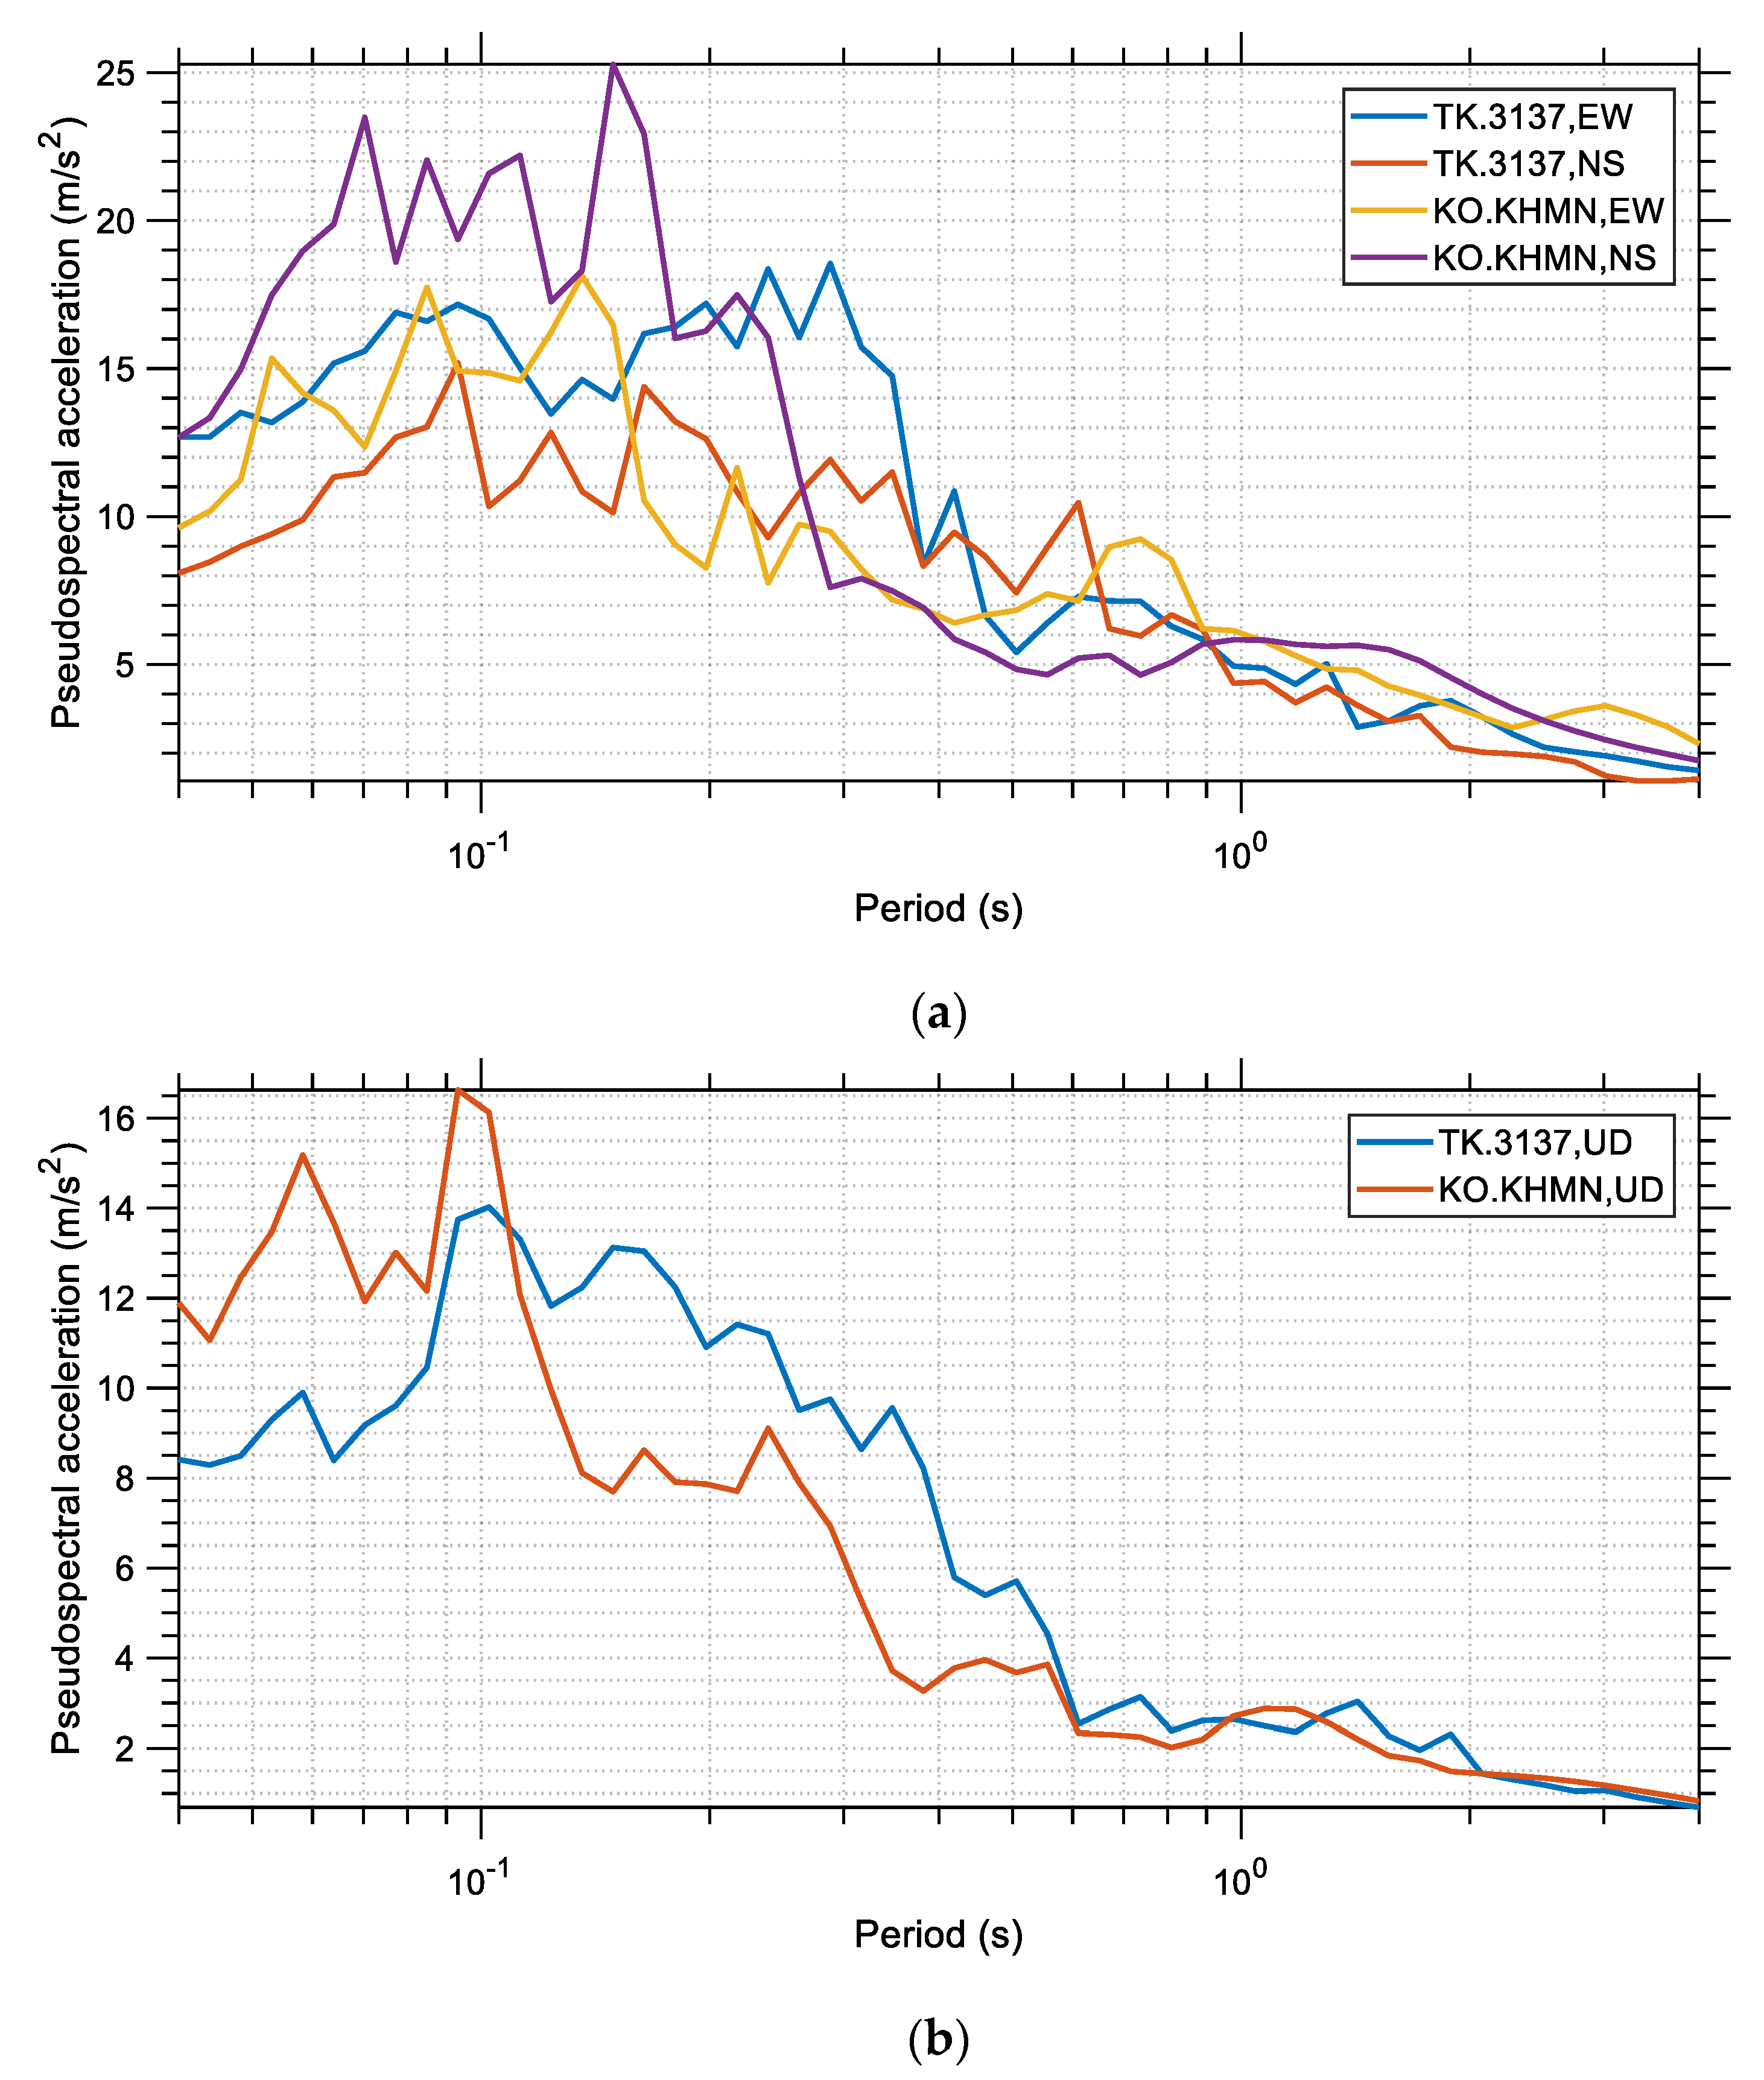
Figure 10 and
Figure 11 show the spectral pseudo-acceleration and the spectral pseudo-velocity, respectively. All diagrams have been generated for damping ratio ζ equal to 5% and their horizontal axis is in logarithmic scale. In
Figure 9, it can be observed that the NS component of the KO-KHMN station record reached very high spectral accelerations, around 2.35 g, whereas the vertical component of the same record reached a maximum spectral acceleration close to 1.7 g. These spectral acceleration values are extraordinarily high. On the other hand, it is seen from
Figure 8 that at the high period range the spectral velocity of the record of the TK.3137 station is generally larger, with some exceptions, for both its horizontal and vertical components. This is an important observation that may explain the large casualties that occurred in the Hatay region, although it is far away from the epicenter of the main earthquake, especially in comparison to Kahramanmaraş. The TK.3137 station, which gave higher spectral velocities than the KO-KHMN station, is much closer to the Hatay region, as shown in
Figure 1. This may imply a stronger relationship between the destructive effects of an earthquake and its spectral velocity rather than its spectral acceleration. While the spectral acceleration has been traditionally taken into account for the design of buildings according to various seismic norms worldwide (including the Turkish seismic code), the spectral velocity is generally ignored, although it may be a better index in determining seismic hazard for taller buildings and it can serve as a parameter from which to estimate the macroseismic intensity and structural damage [
37]. This is a well-known issue, and the M
w 7.8 earthquake may provide an incentive for further improvements to the seismic codes in this direction [
35].
3.3. Isoductile response spectra
Seismic energy can be absorbed in structures in two main forms: (i) as elastic strain energy and (i) as hysterically dissipated energy. The former approach requires that the structure remains in the elastic region and resists the entire earthquake load, as high as its peak value, elastically. The latter approach permits the design of structures based on reduced earthquake loads (lower than those of the former case, which correspond to the maximum acceleration that the structure experiences during the seismic event) by relying on ductility and over-strength of the materials used. A structure that responds in an elastoplastic way through its ductile character experiences lower acceleration during an earthquake and its design becomes more economical, although damages may be expected in case of high accelerations. The basic ductile design philosophy is that the structure should survive the main shock through controlled damage but without collapse. The constant ductility (or isoductile) spectra assume that an SDOF system responds in an elastoplastic (i.e., elastic—perfectly plastic) way with constant ductility, which is defined as the ratio of the maximum displacement to the yielding displacement. The yielding displacement is the displacement that corresponds to the yield limit of the SDOF system. In other words, we are interested in the response of SDOF systems for varying eigenperiods, similar to the elastic spectra considered in the previous section, but for a specific ductility ratio. The isoductile spectral displacement, velocity, and acceleration are shown in
Figure 12,
Figure 13 and
Figure 14, respectively, for the two records and their two components.
Similarly,
Figure 15 and
Figure 16 show the isoductile spectral pseudo-acceleration and spectral pseudo-velocity, respectively. All diagrams correspond to damping ratio
ζ equal to 5% and ductility
μ equal to 2, and their horizontal axis is in logarithmic scale. As expected, the comparison between the linear elastic and the isoductile spectra reveals that the maximum responses in the isoductile spectra are generally lower than those in the elastic spectra. For example, the maximum spectral acceleration of the horizontal components of the M
w 7.8 event is equal to 2.35 g as shown in
Figure 9, whereas the corresponding value for the isoductile spectra is equal to 1.4 g as shown in
Figure 14. The difference in the maximum spectral acceleration implies a substantial difference in the applied seismic forces, and this shows the importance of structural ductility. The collapses due to the M
w 7.8 earthquake showed in many cases a nonductile, brittle behavior, which in the case of reinforced concrete (RC) structures is closely related to under-reinforced structural elements. These structures, having limited ductility, responded in a more linear elastic-wise manner, and thus experienced much larger accelerations, which explains many of the building collapses [
35].
An important observation can be made based on the elastic and isoductile seismic response spectra: the maximum acceleration which is experienced by the elastoplastic ductile structures is substantially lower than that experienced by elastic structures. For example, in
Figure 14, the maximum isoductile spectral acceleration for ductility
μ = 2 is roughly 1.4 g and 0.97 g for the horizontal and vertical components, respectively. The corresponding values for linear elastic nonyielding structures can be seen in
Figure 9, which are 2.35 g and 1.7 g for the horizontal and vertical components, respectively. In the horizontal direction, an increase from 1.4 g to 2.35 g accounts for 68% higher horizontal acceleration values for the nonductile structures. Low accelerations are directly related to low seismic forces, through Newton’s second law, and thus lower requirements on behalf of the structure to resist these forces. Therefore, it becomes evident that ductility is an important aspect of seismic design since reduced seismic loads result in more economical designs. Apart from this, a structure of increased ductility is generally safer since it can accommodate large deformations which cannot go unnoticed by the occupants and act as a warning for the imminent failure of the structure. This can save some critical time in difficult situations for the occupants when evacuation is required and could potentially save their lives.
3.4. What Does the Turkish Seismic Code Provide?
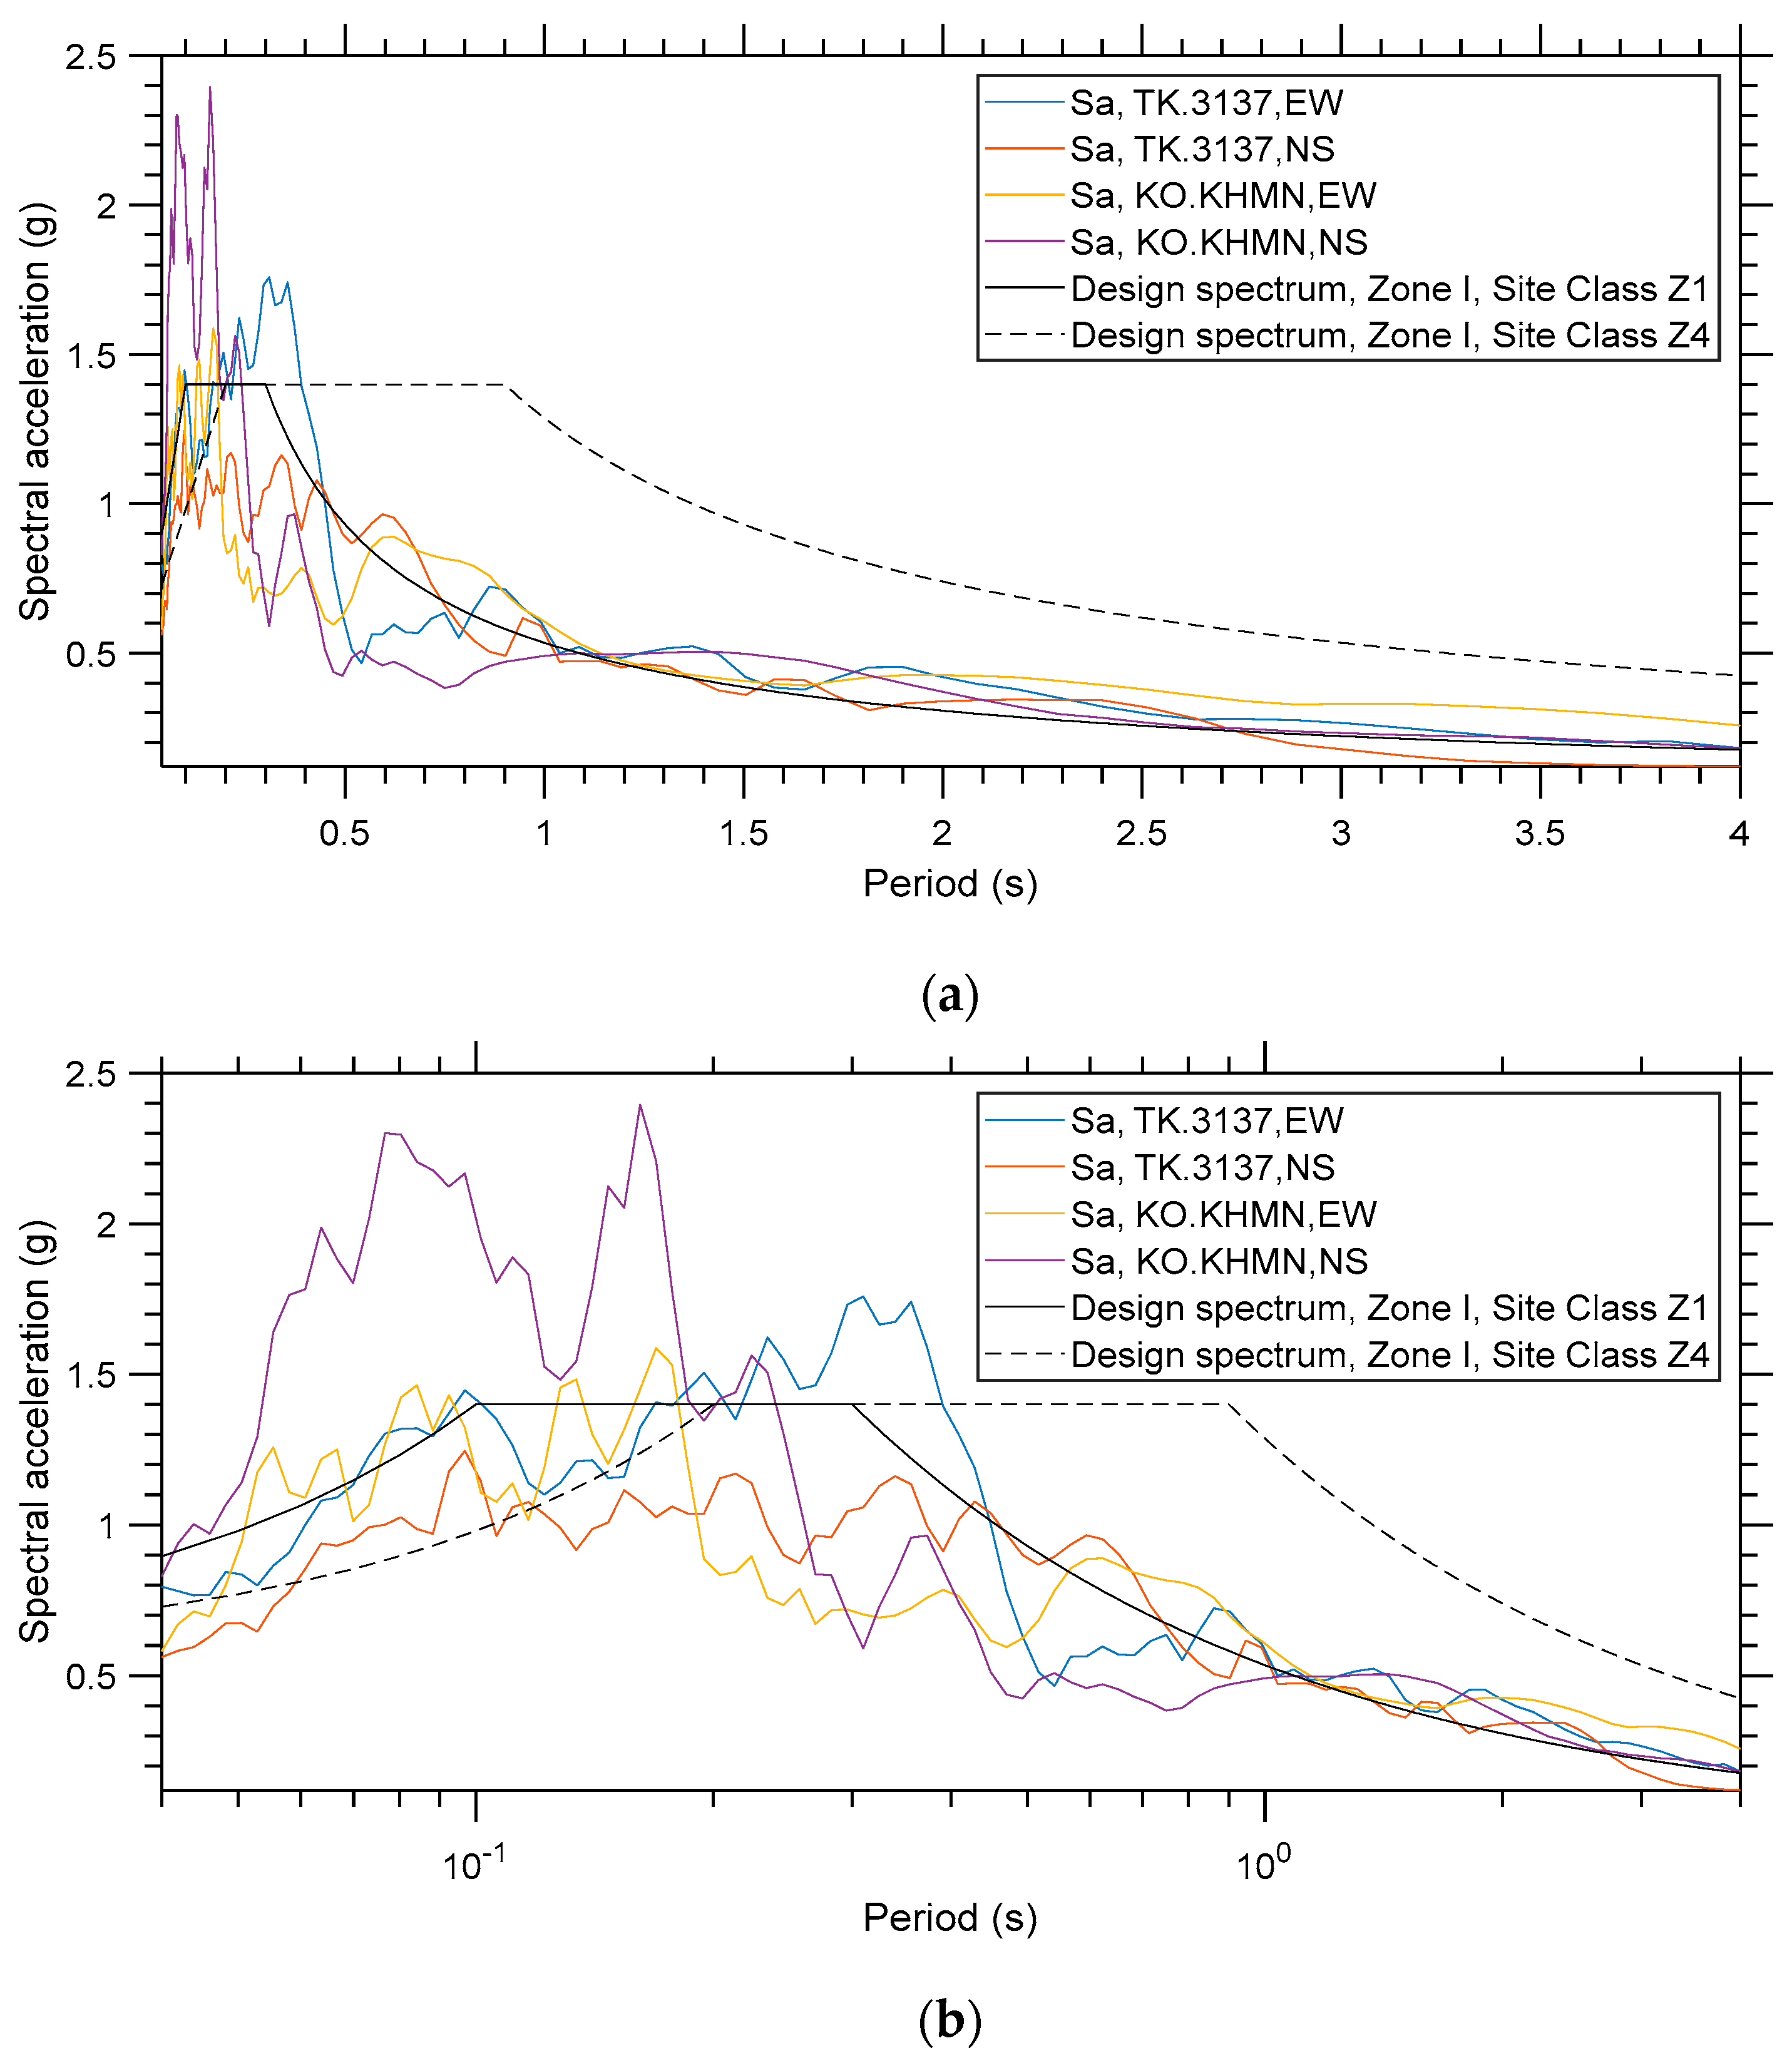
It is interesting to compare the effect of the earthquake event on the structures with the requirements of the Turkish seismic code in the region. The comparison is made with reference to the records of the TK.3137 and the KO-KHMN stations and it is shown in
Figure 17 for the cases of linear elastic response spectra. Based on the comparison, the major conclusion is that the earthquake struck mainly at the low period range, where the design acceleration was 1.4 g and the maximum acceleration observed was roughly equal to 2.4 g. This is a significant difference, not only in the acceleration magnitude but also in its period content. Even for site class I, which contains the lowest period content (i.e., corresponds to stiff rock), there was a significant acceleration below the lowest reference period. Therefore, suitable adjustments need to be made in the design spectrum of the Turkish code so that rare events, such as the one (M
w 7.8) considered in this study, can be taken into account.
3.5. Does the High Spectral Acceleration in the Low Period Range Occur Only for the Two Examined Records or Is It a General Trend?
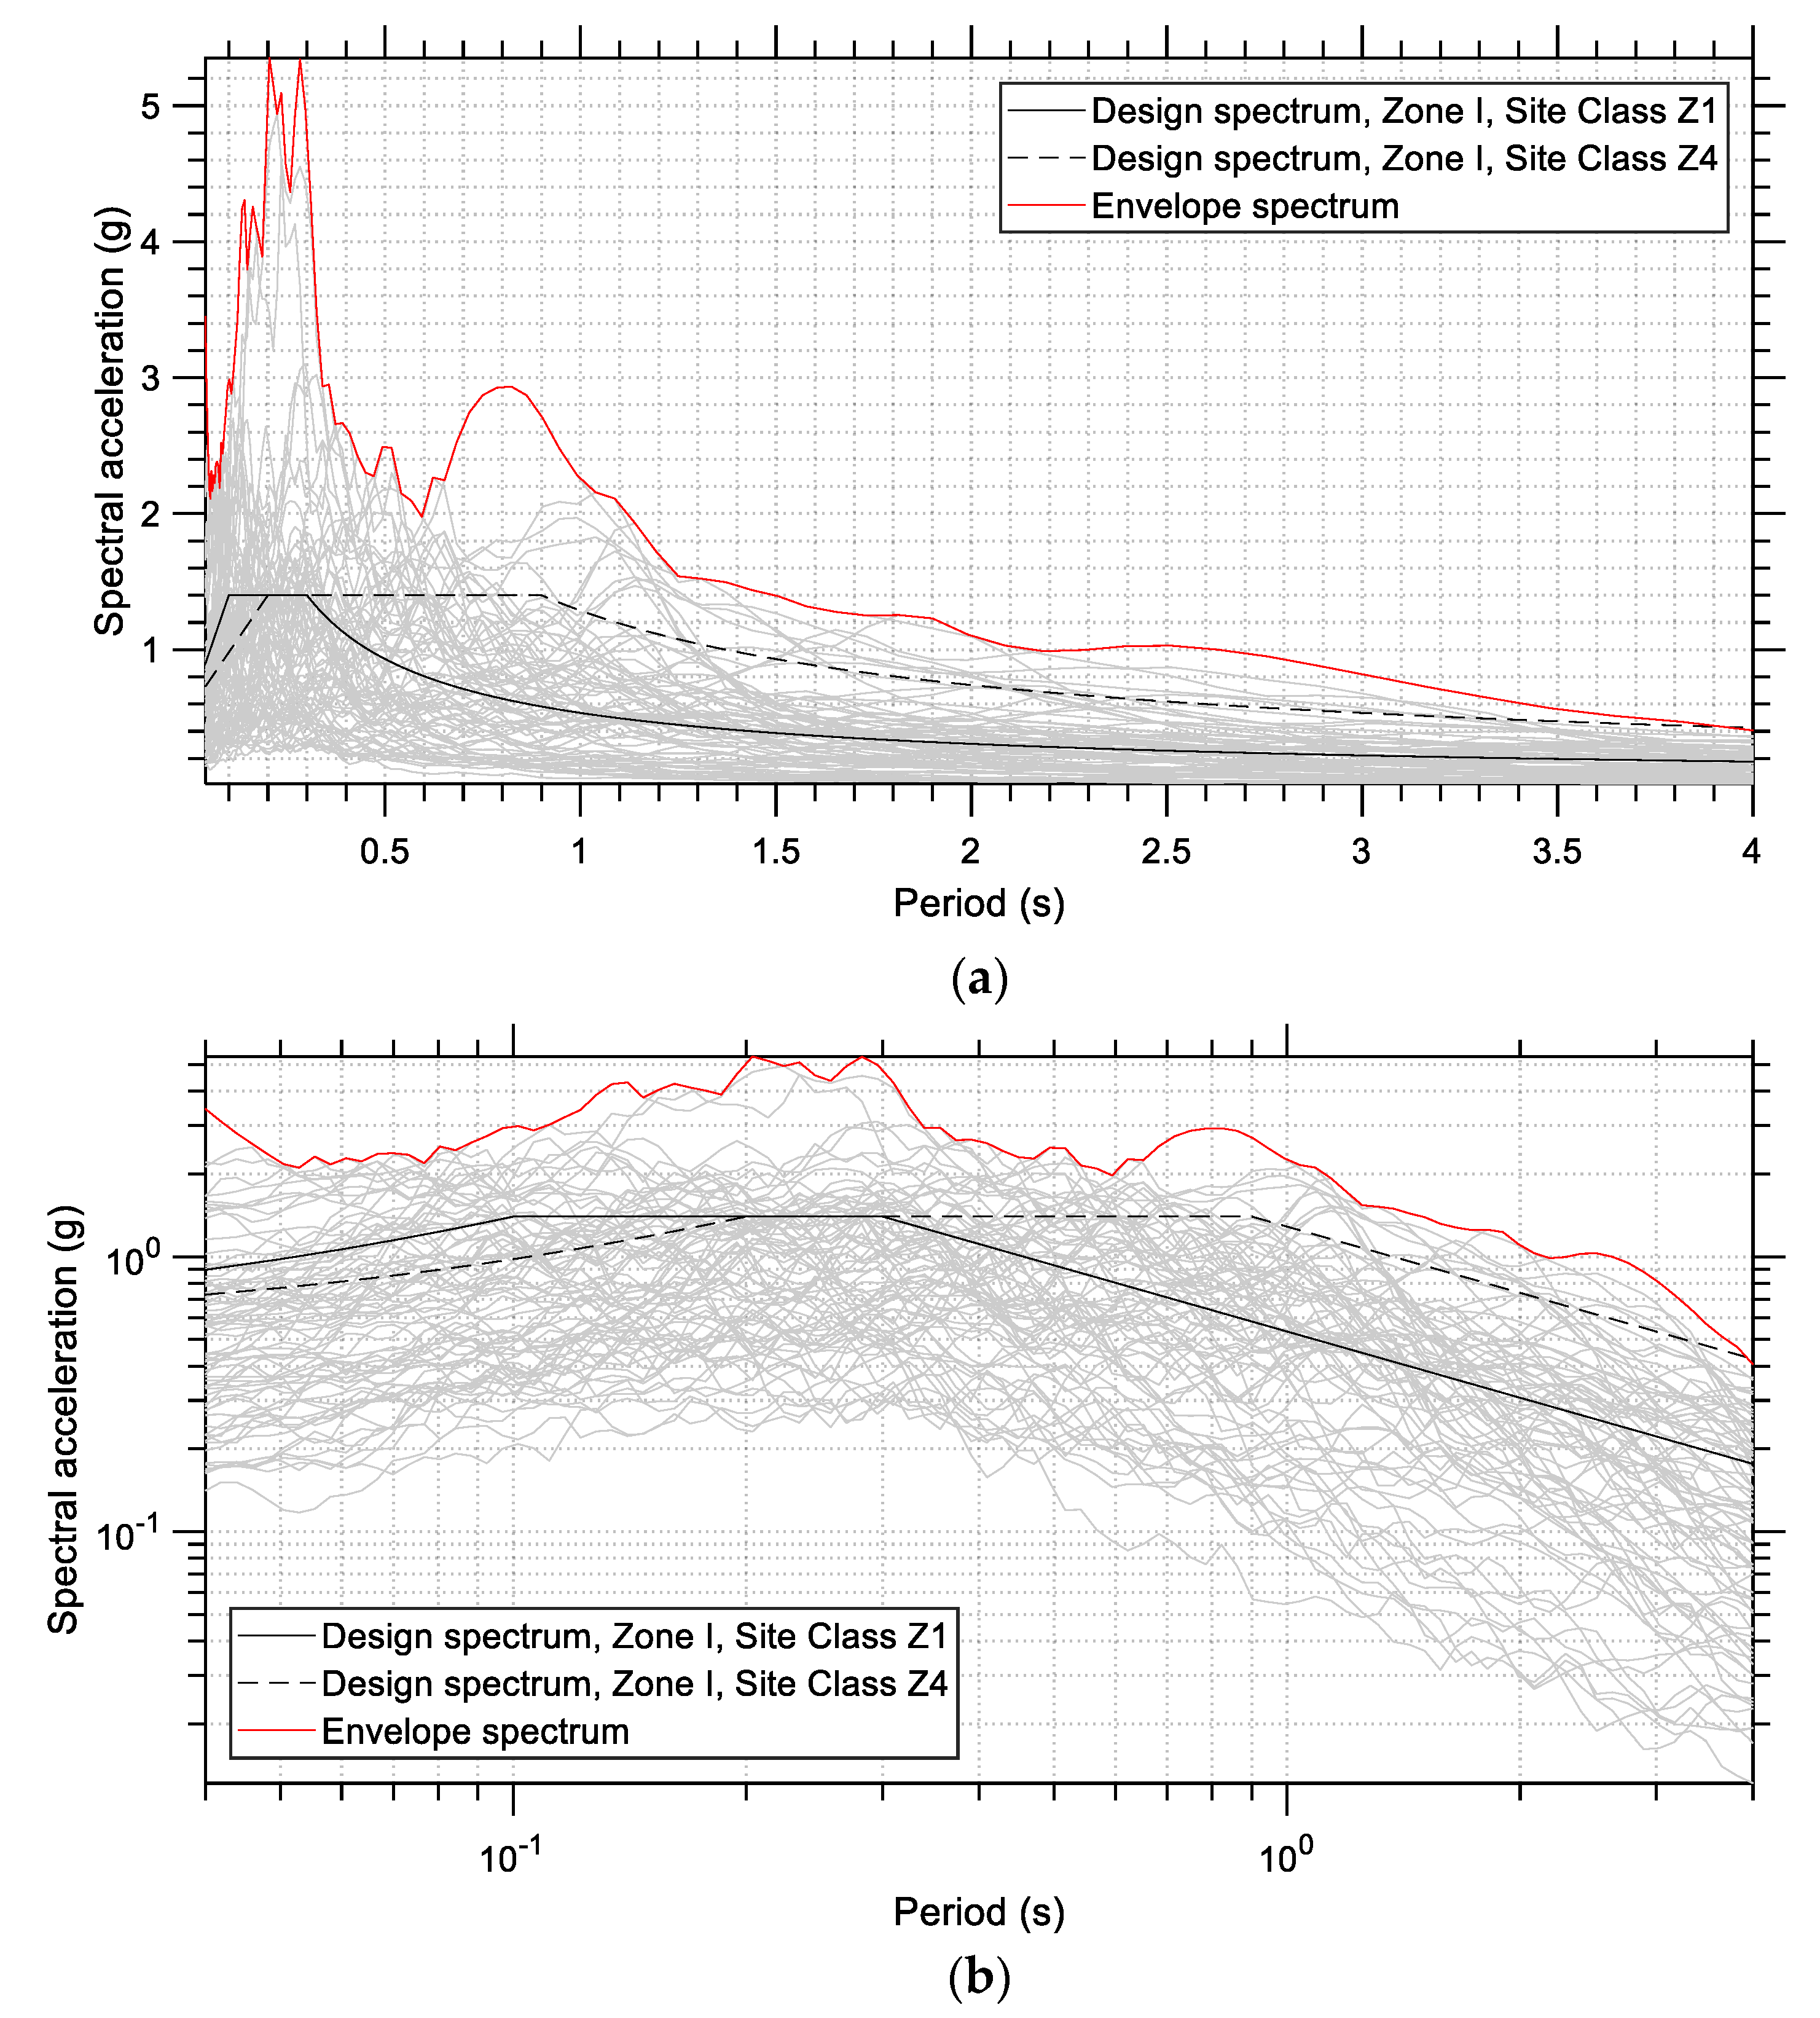
At this point, we need to check whether the trend that appears in
Figure 17 is a general trend or if it is specific only to these two recordings. For this purpose, more earthquake acceleration records need to be taken into account. In
Figure 18 the acceleration spectra of several earthquake records are shown and compared to the provisions of the Turkish seismic code (linear elastic response spectra). It is shown that there are higher spectral acceleration values for a broader range of eigenperiods for many of the recordings. Based on the envelope spectrum, a maximum spectral acceleration of 5.35 g is observed, which is extremely high and is responsible for the many collapses due to the earthquake event. A need for a revision of the seismic code standards seems to exist, i.e., higher acceleration values for the design spectra must be proposed [
35].
In
Figure 18, 76 recordings have been taken into account in total, namely the two horizontal components (EW and NS) from the following 38 stations: TK_0201, TK_0213, TK_1213, TK_2308, TK_2708, TK_2715, TK_2718, TK_3115, TK_3117, TK_3123, TK_3124, TK_3125, TK_3126, TK_3129, TK_3131, TK_3132, TK_3133, TK_3134, TK_3135, TK_3136, TK_3137, TK_3138, TK_3139, TK_3141, TK_3142, TK_3143, TK_3145, TK_3146, TK_4617, TK_2703, TK_2712, TK_4615, TK_4616, TK_4624, TK_4629, TK_4630, TK_4632, and TU_NAR.
5. Distributions of Several Earthquake Characteristics
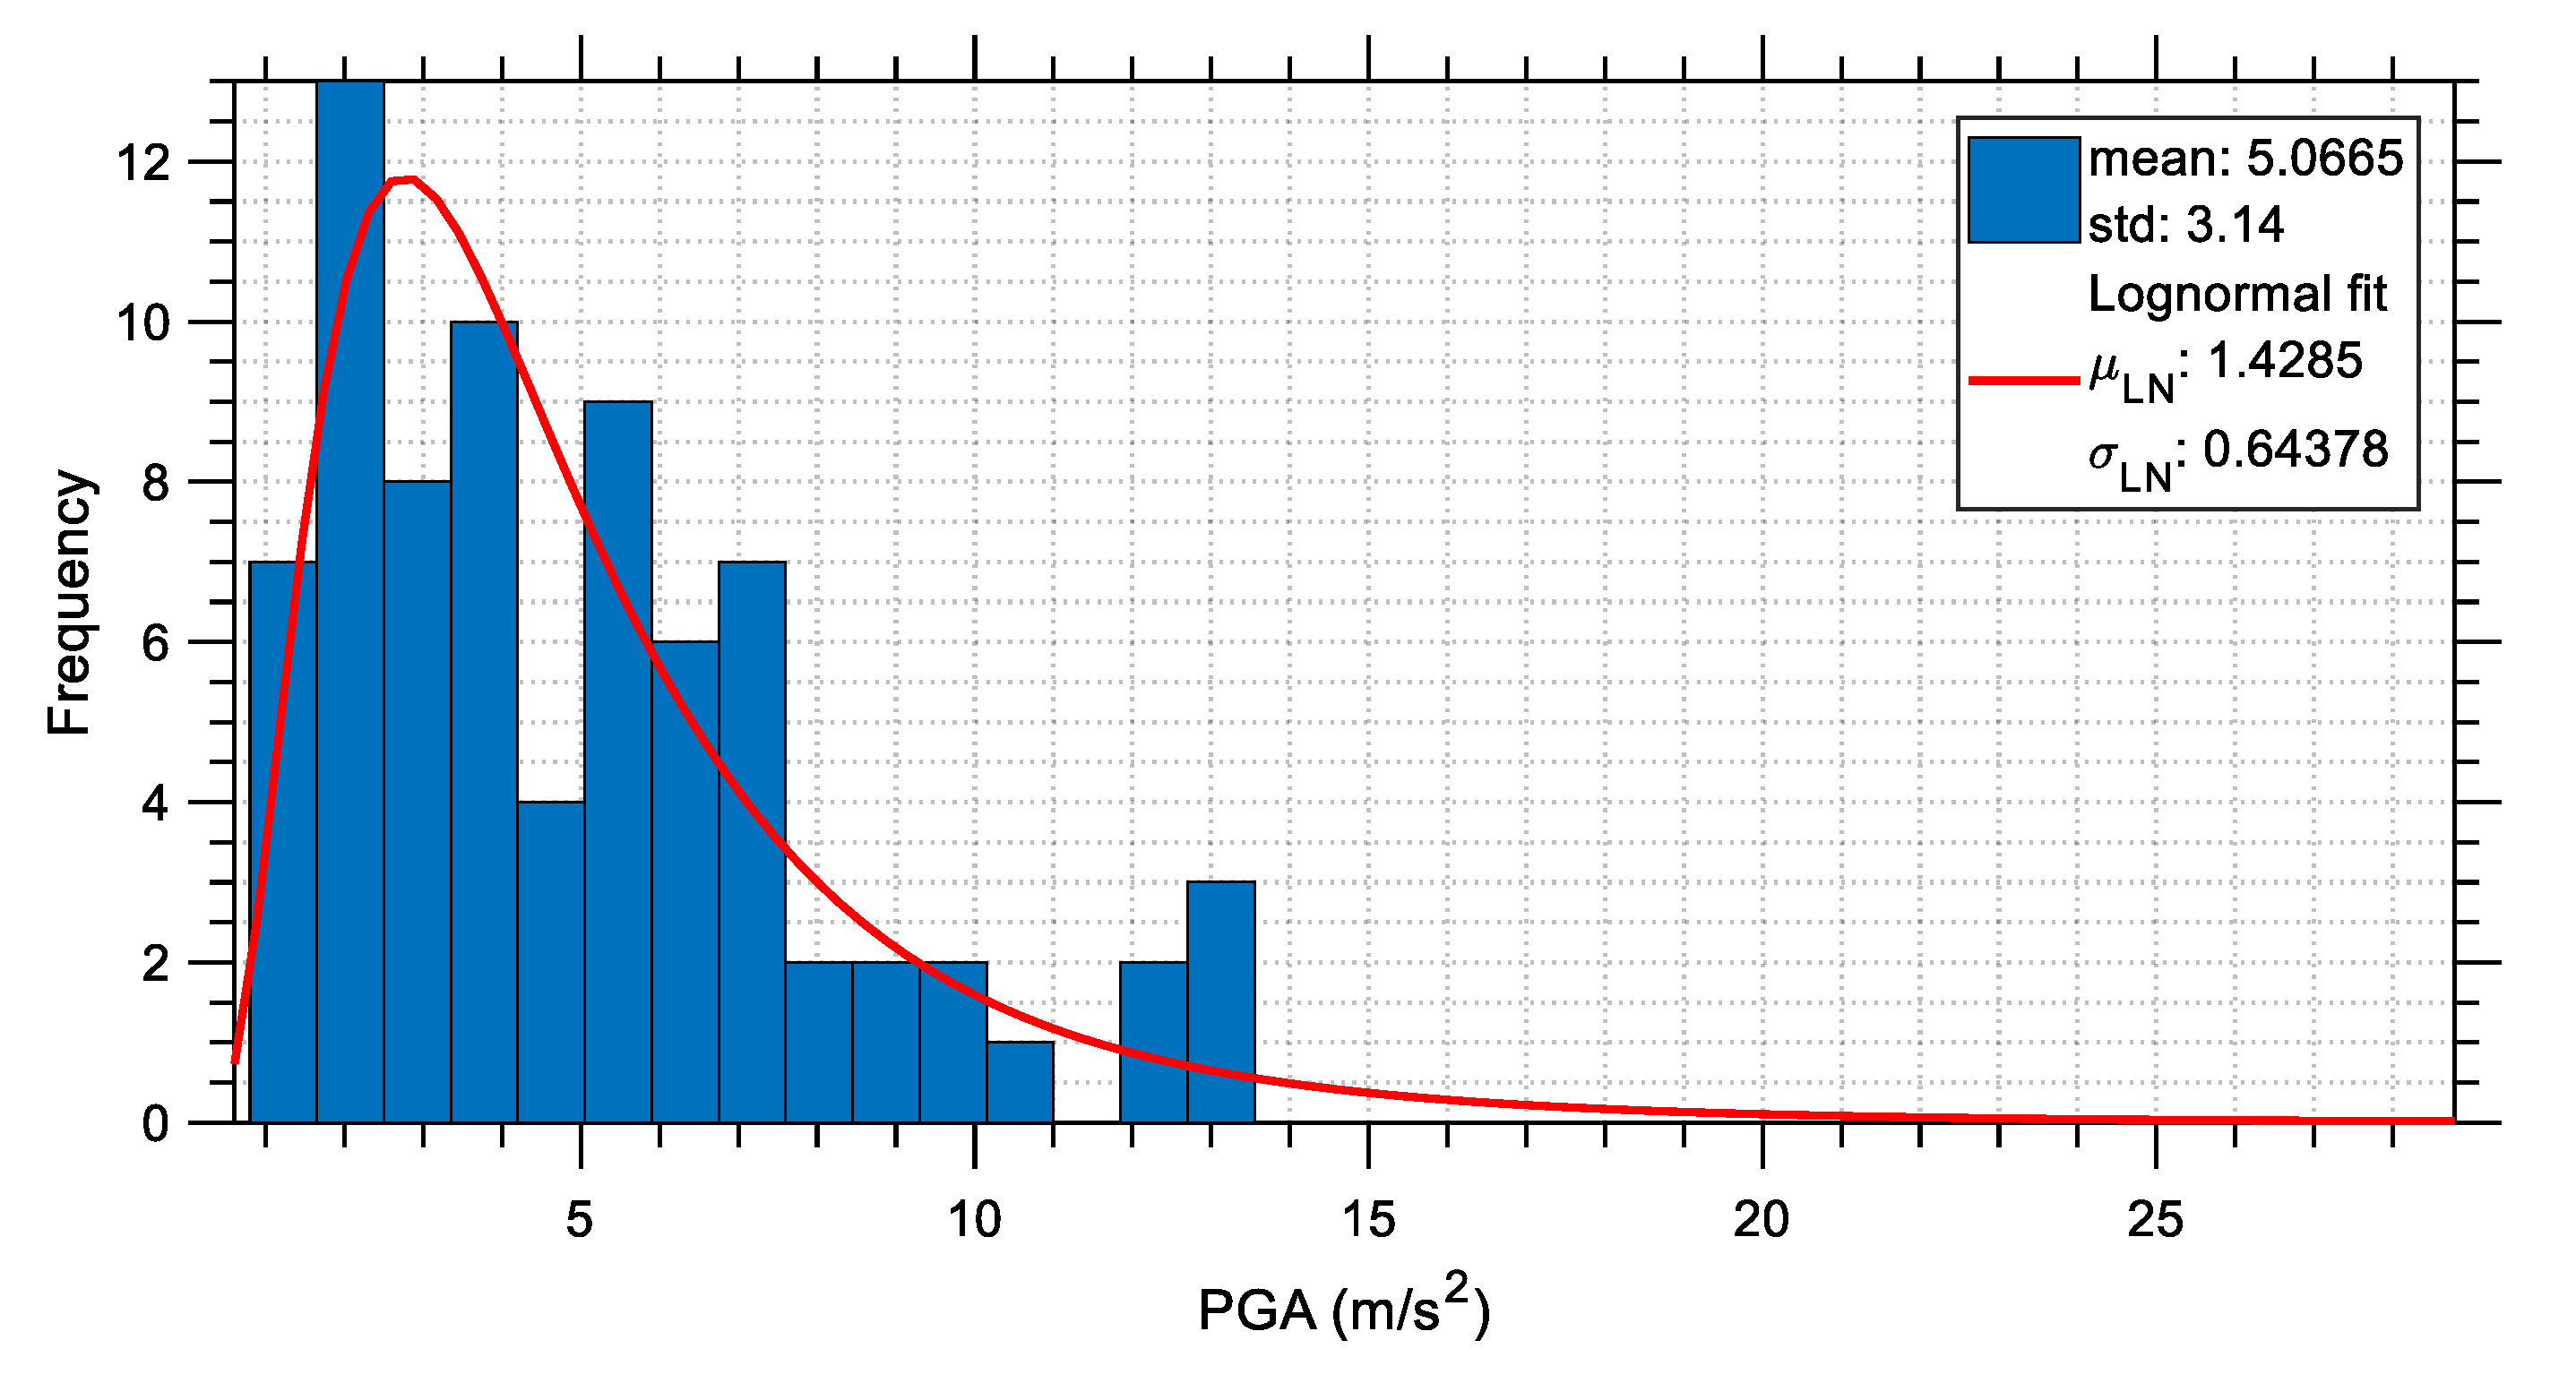
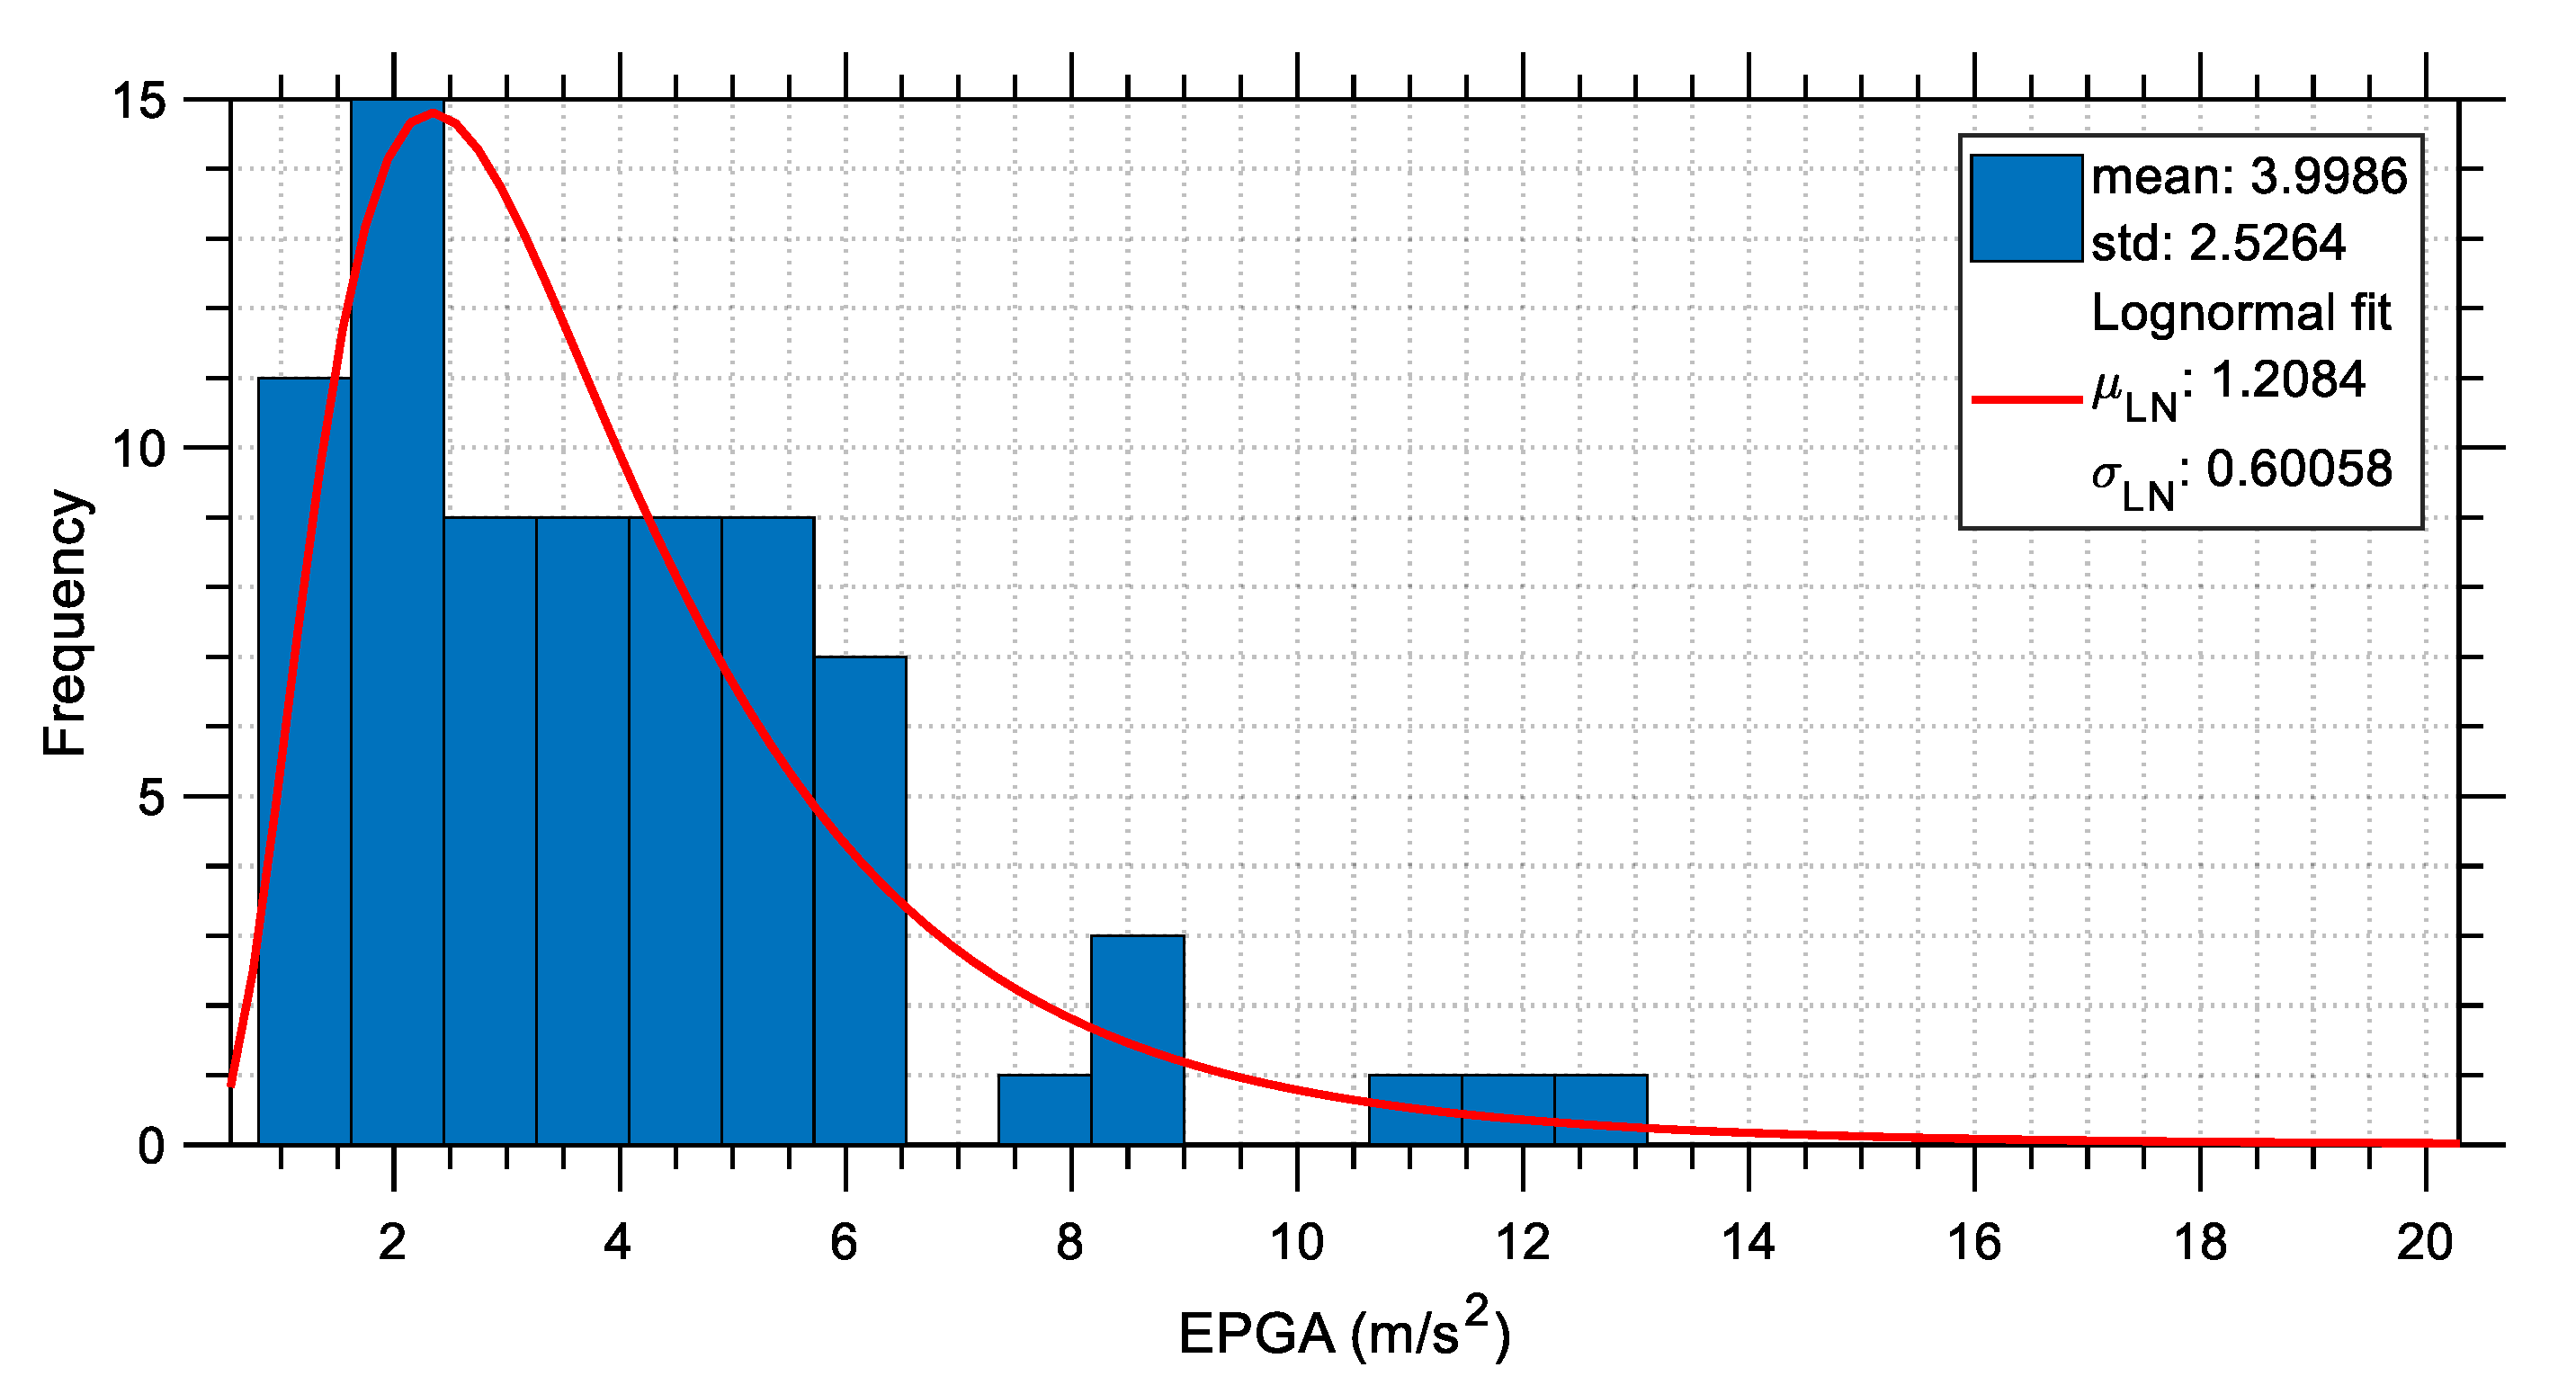
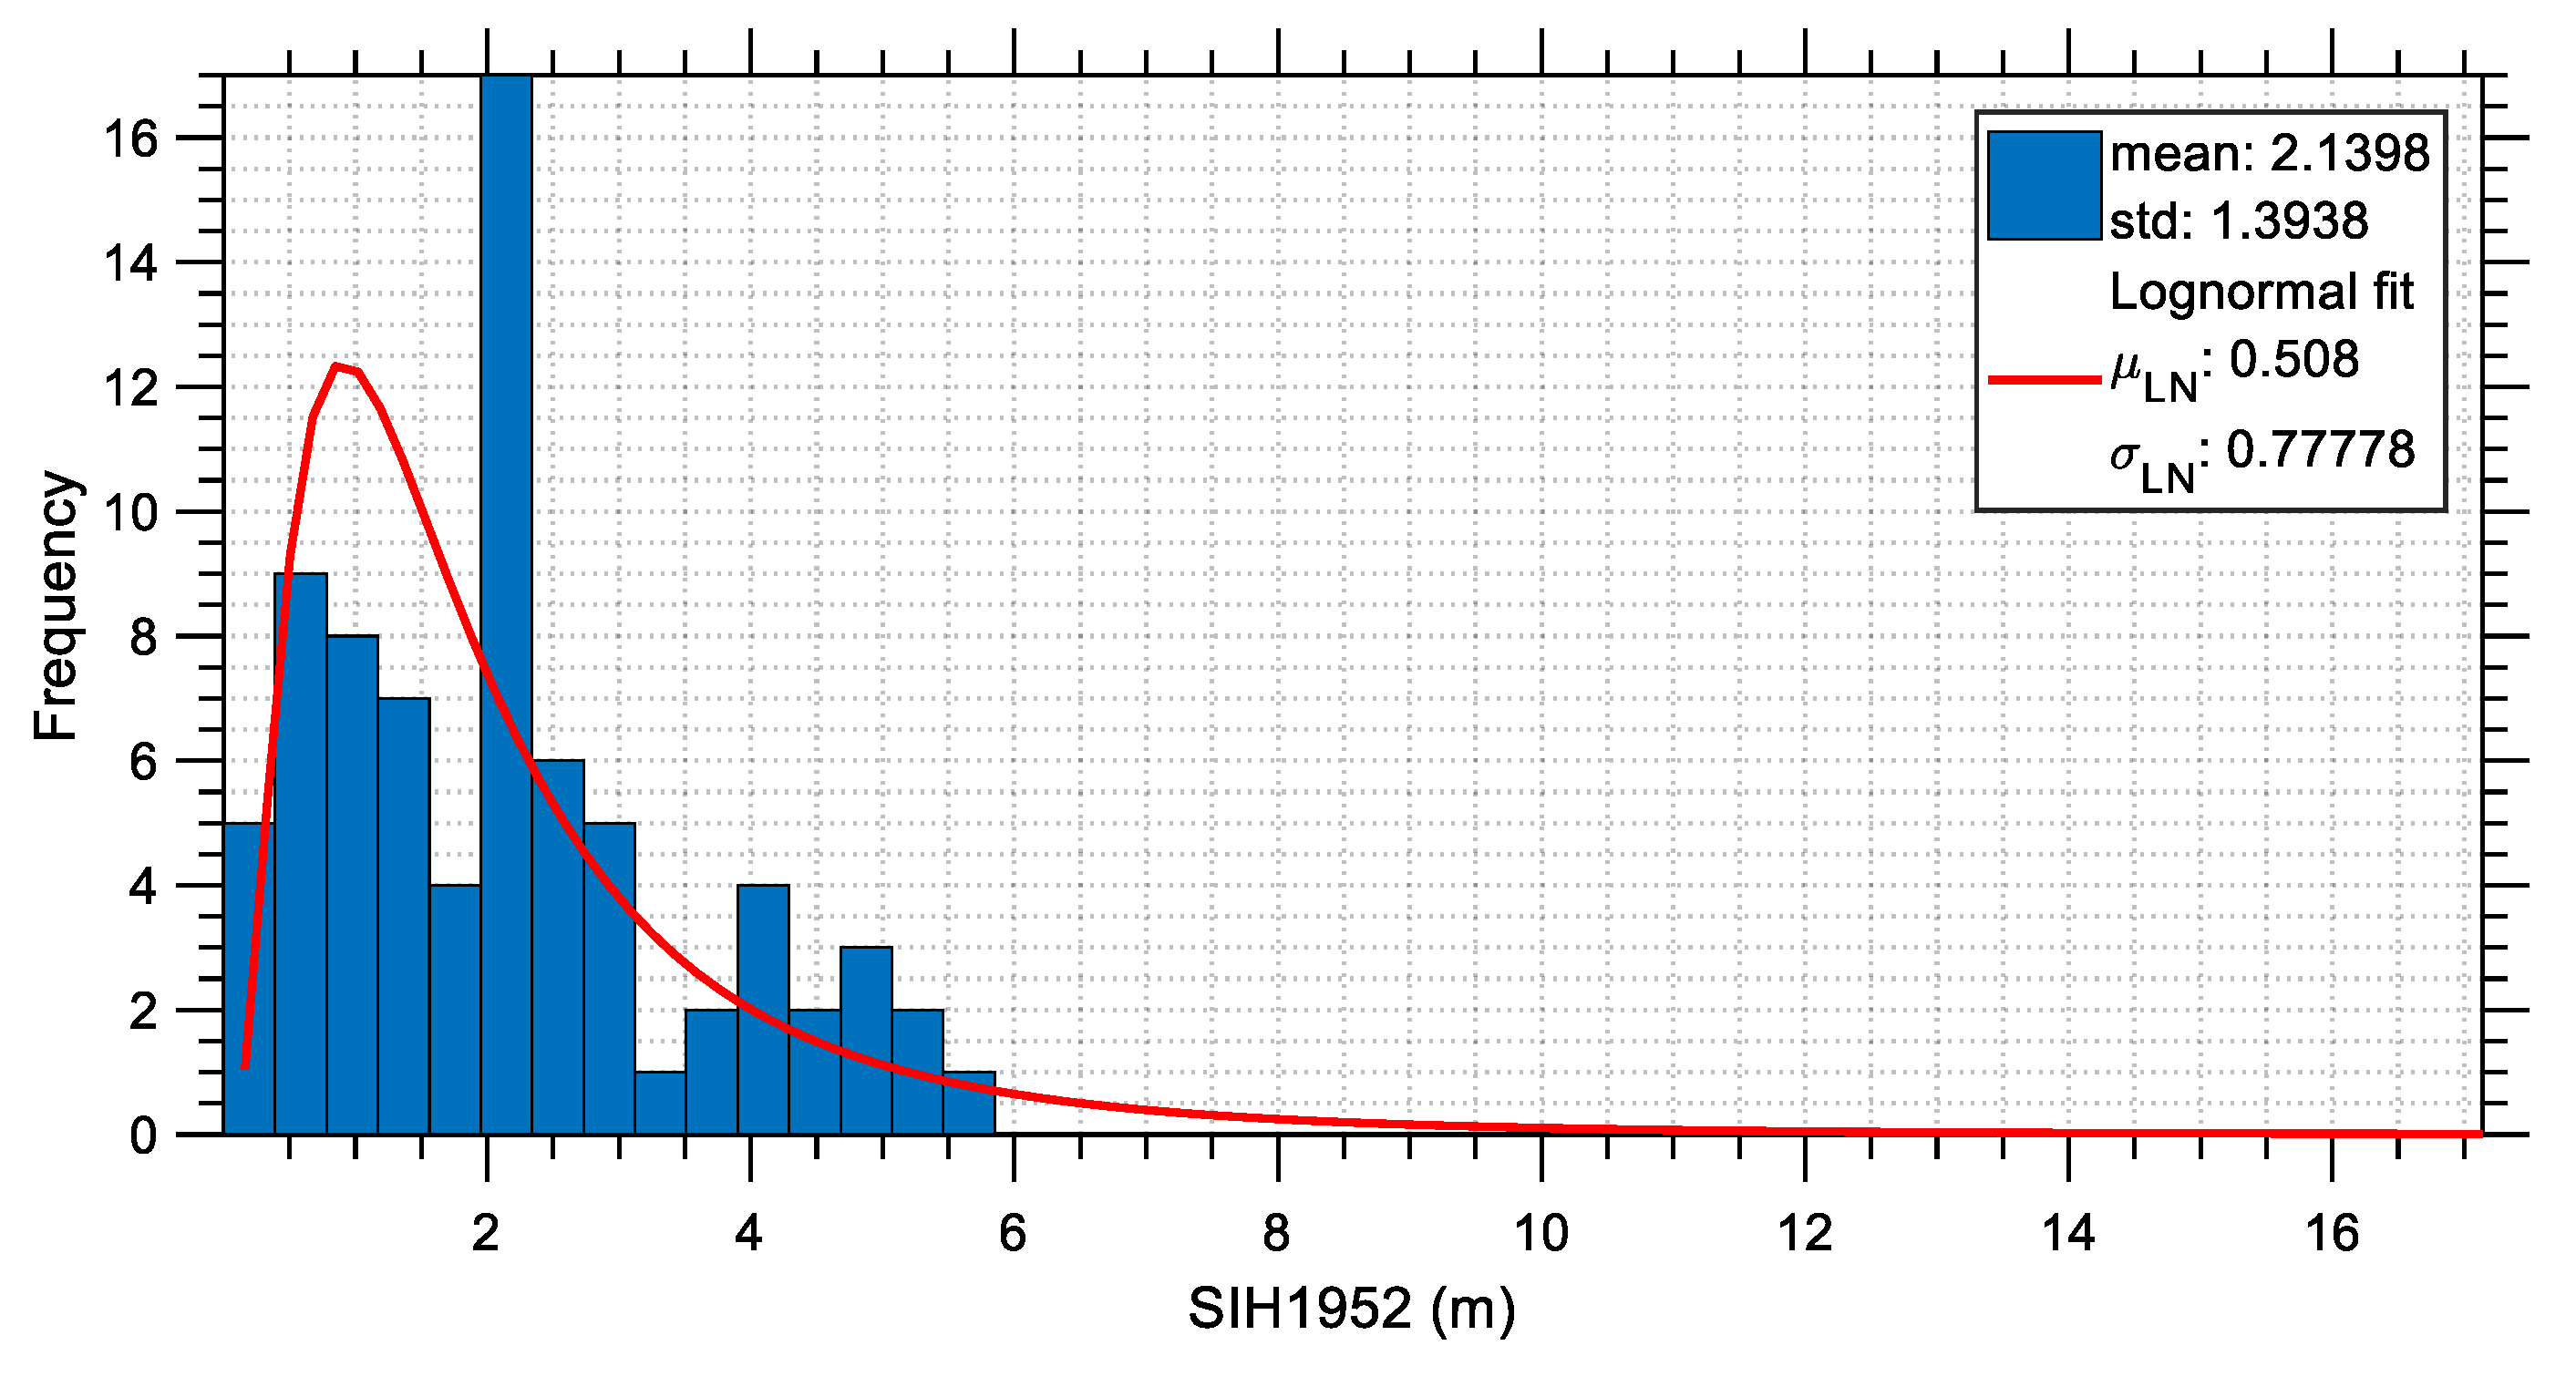
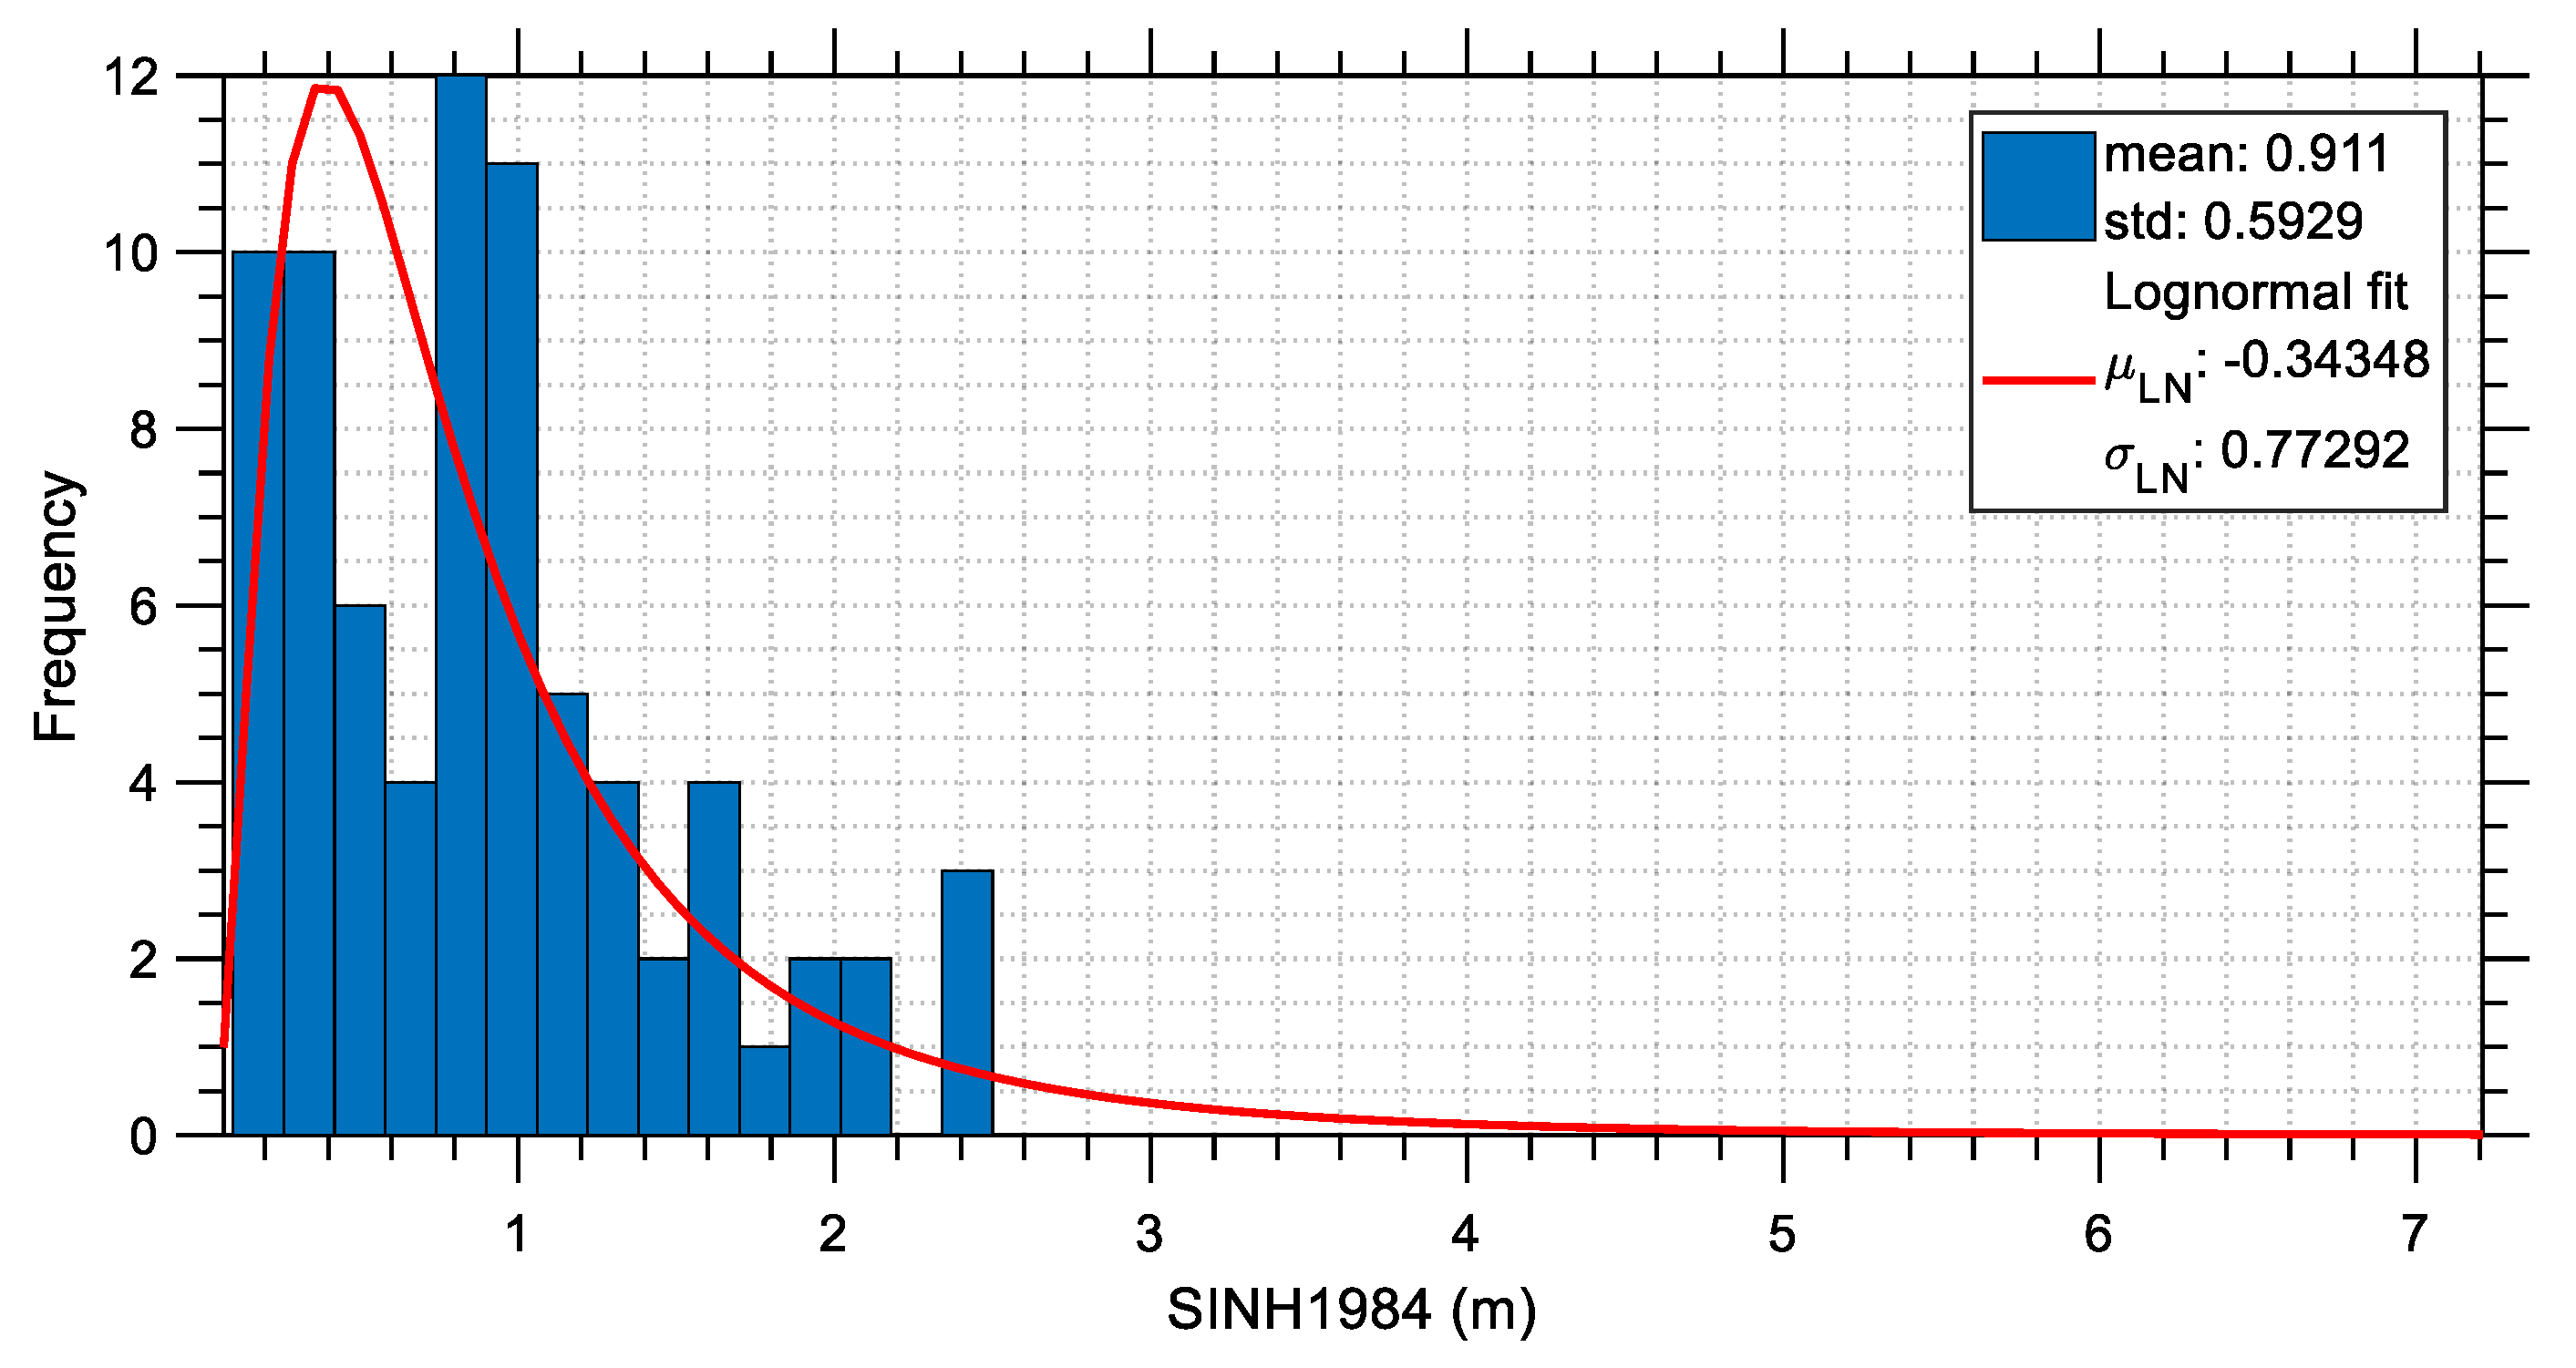
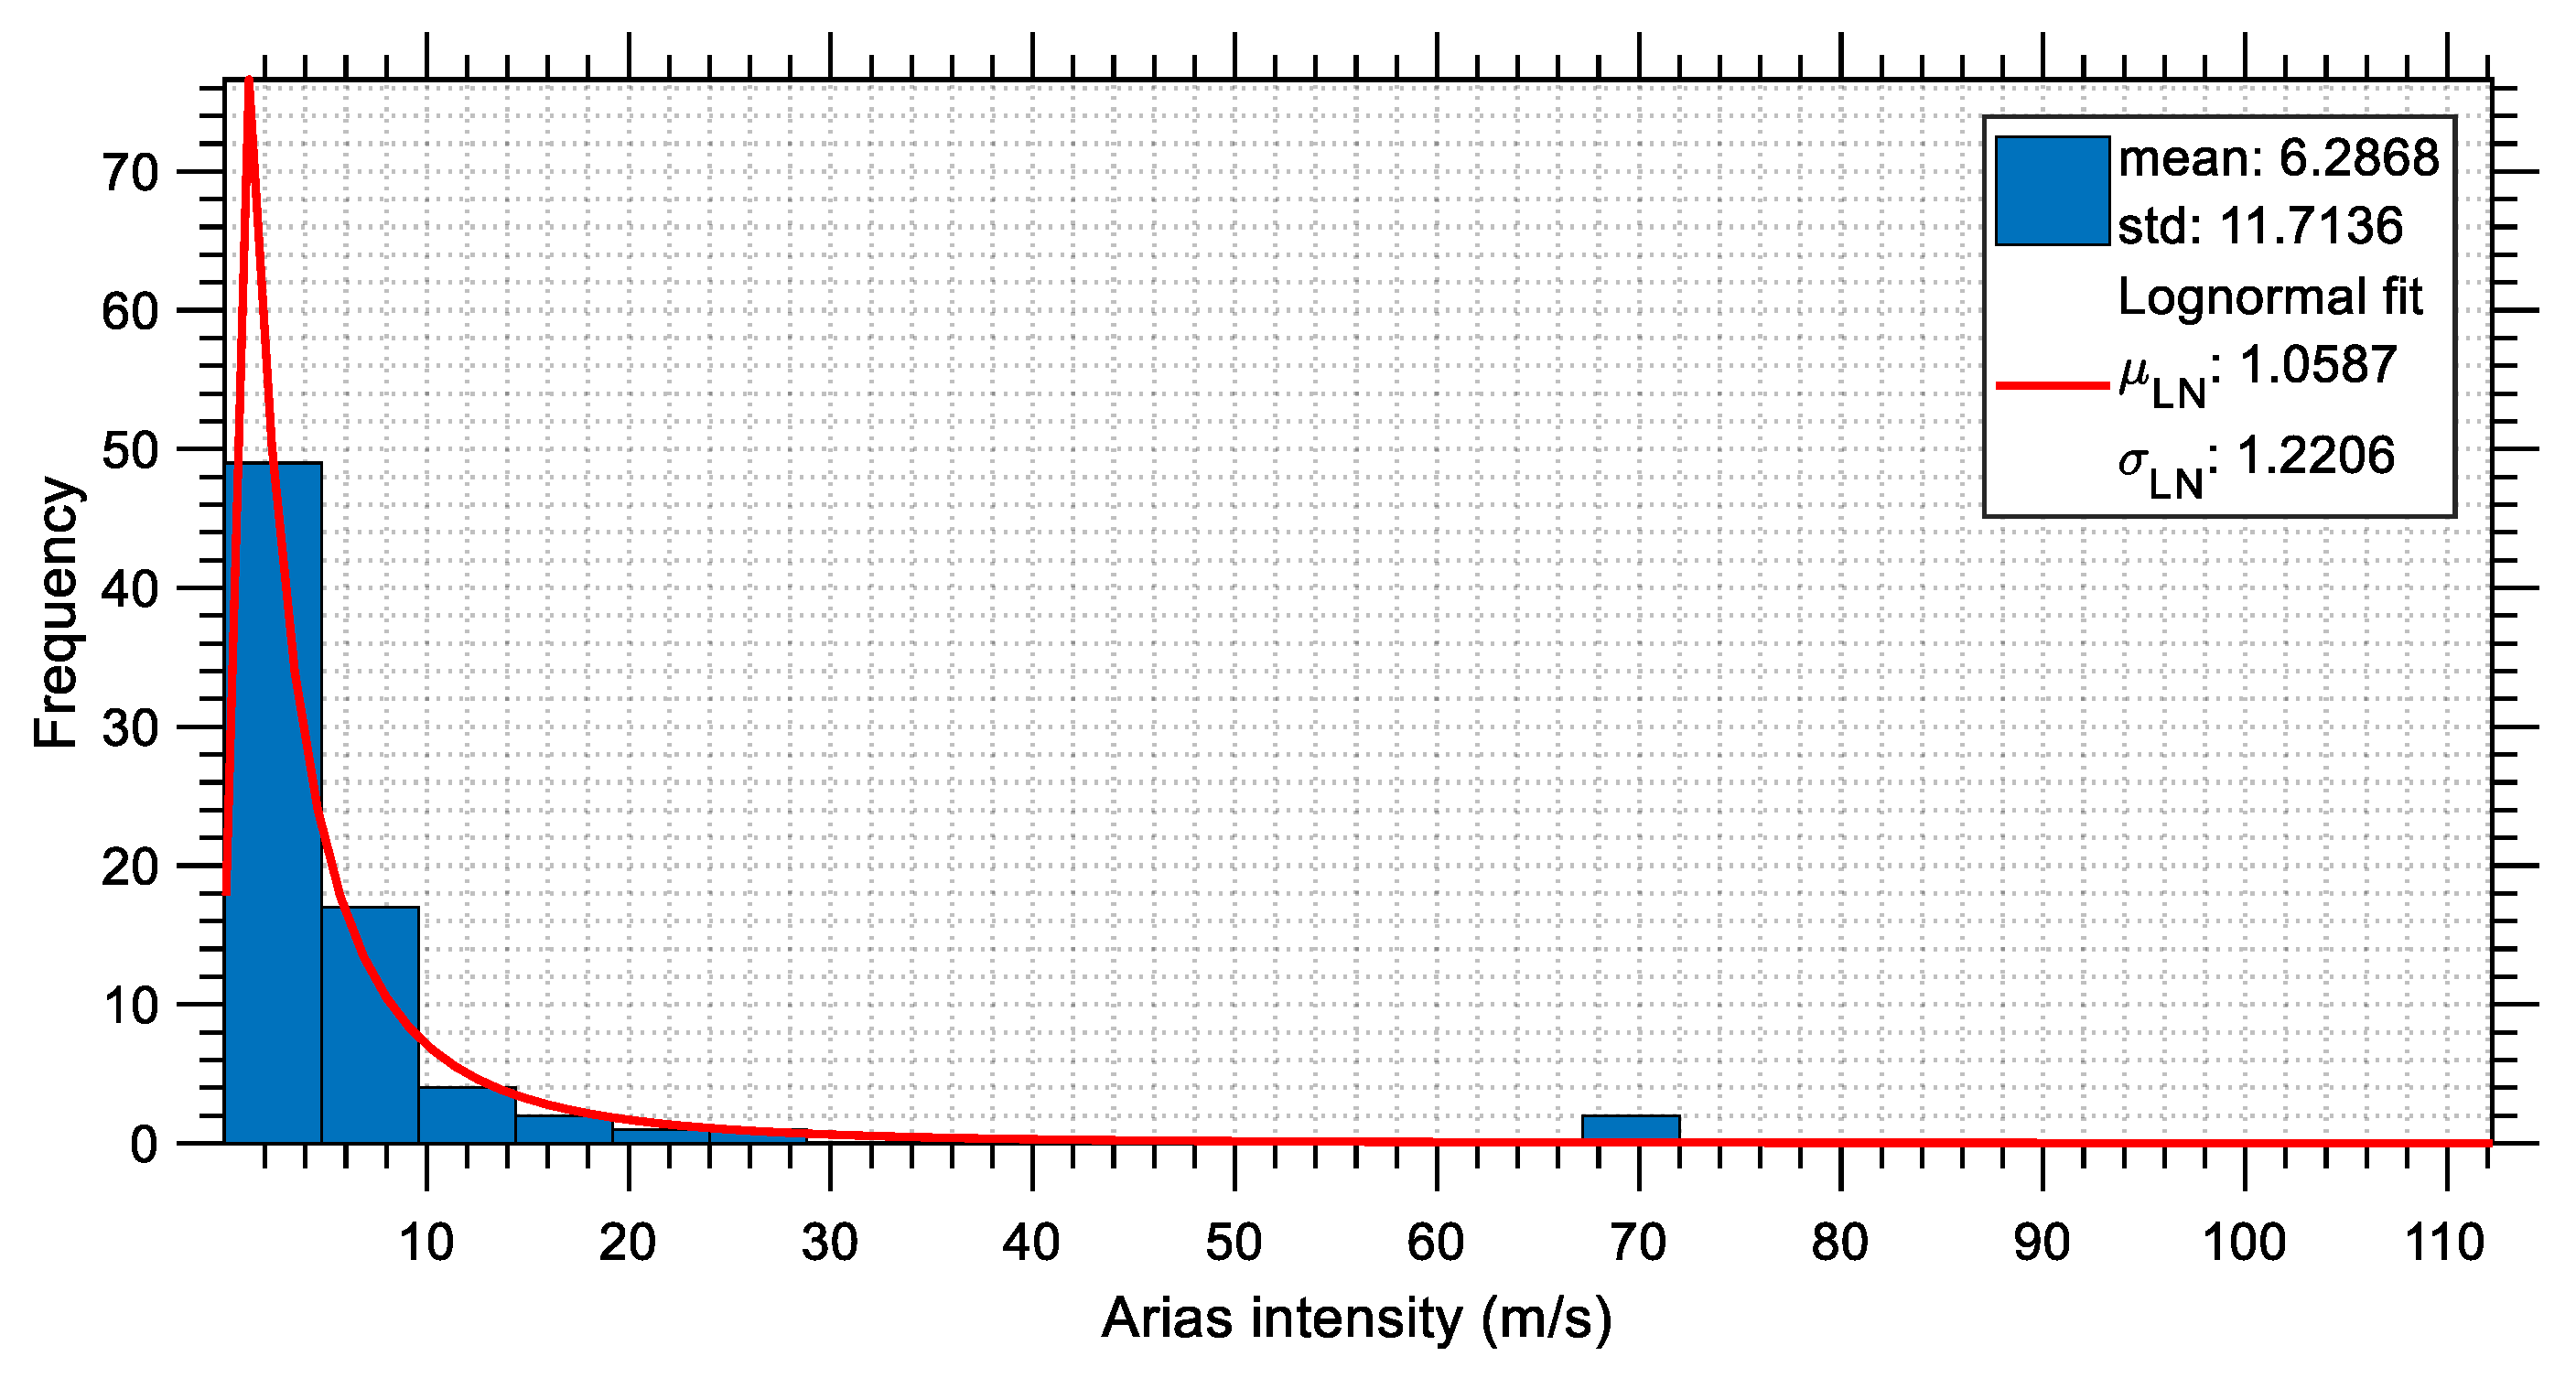
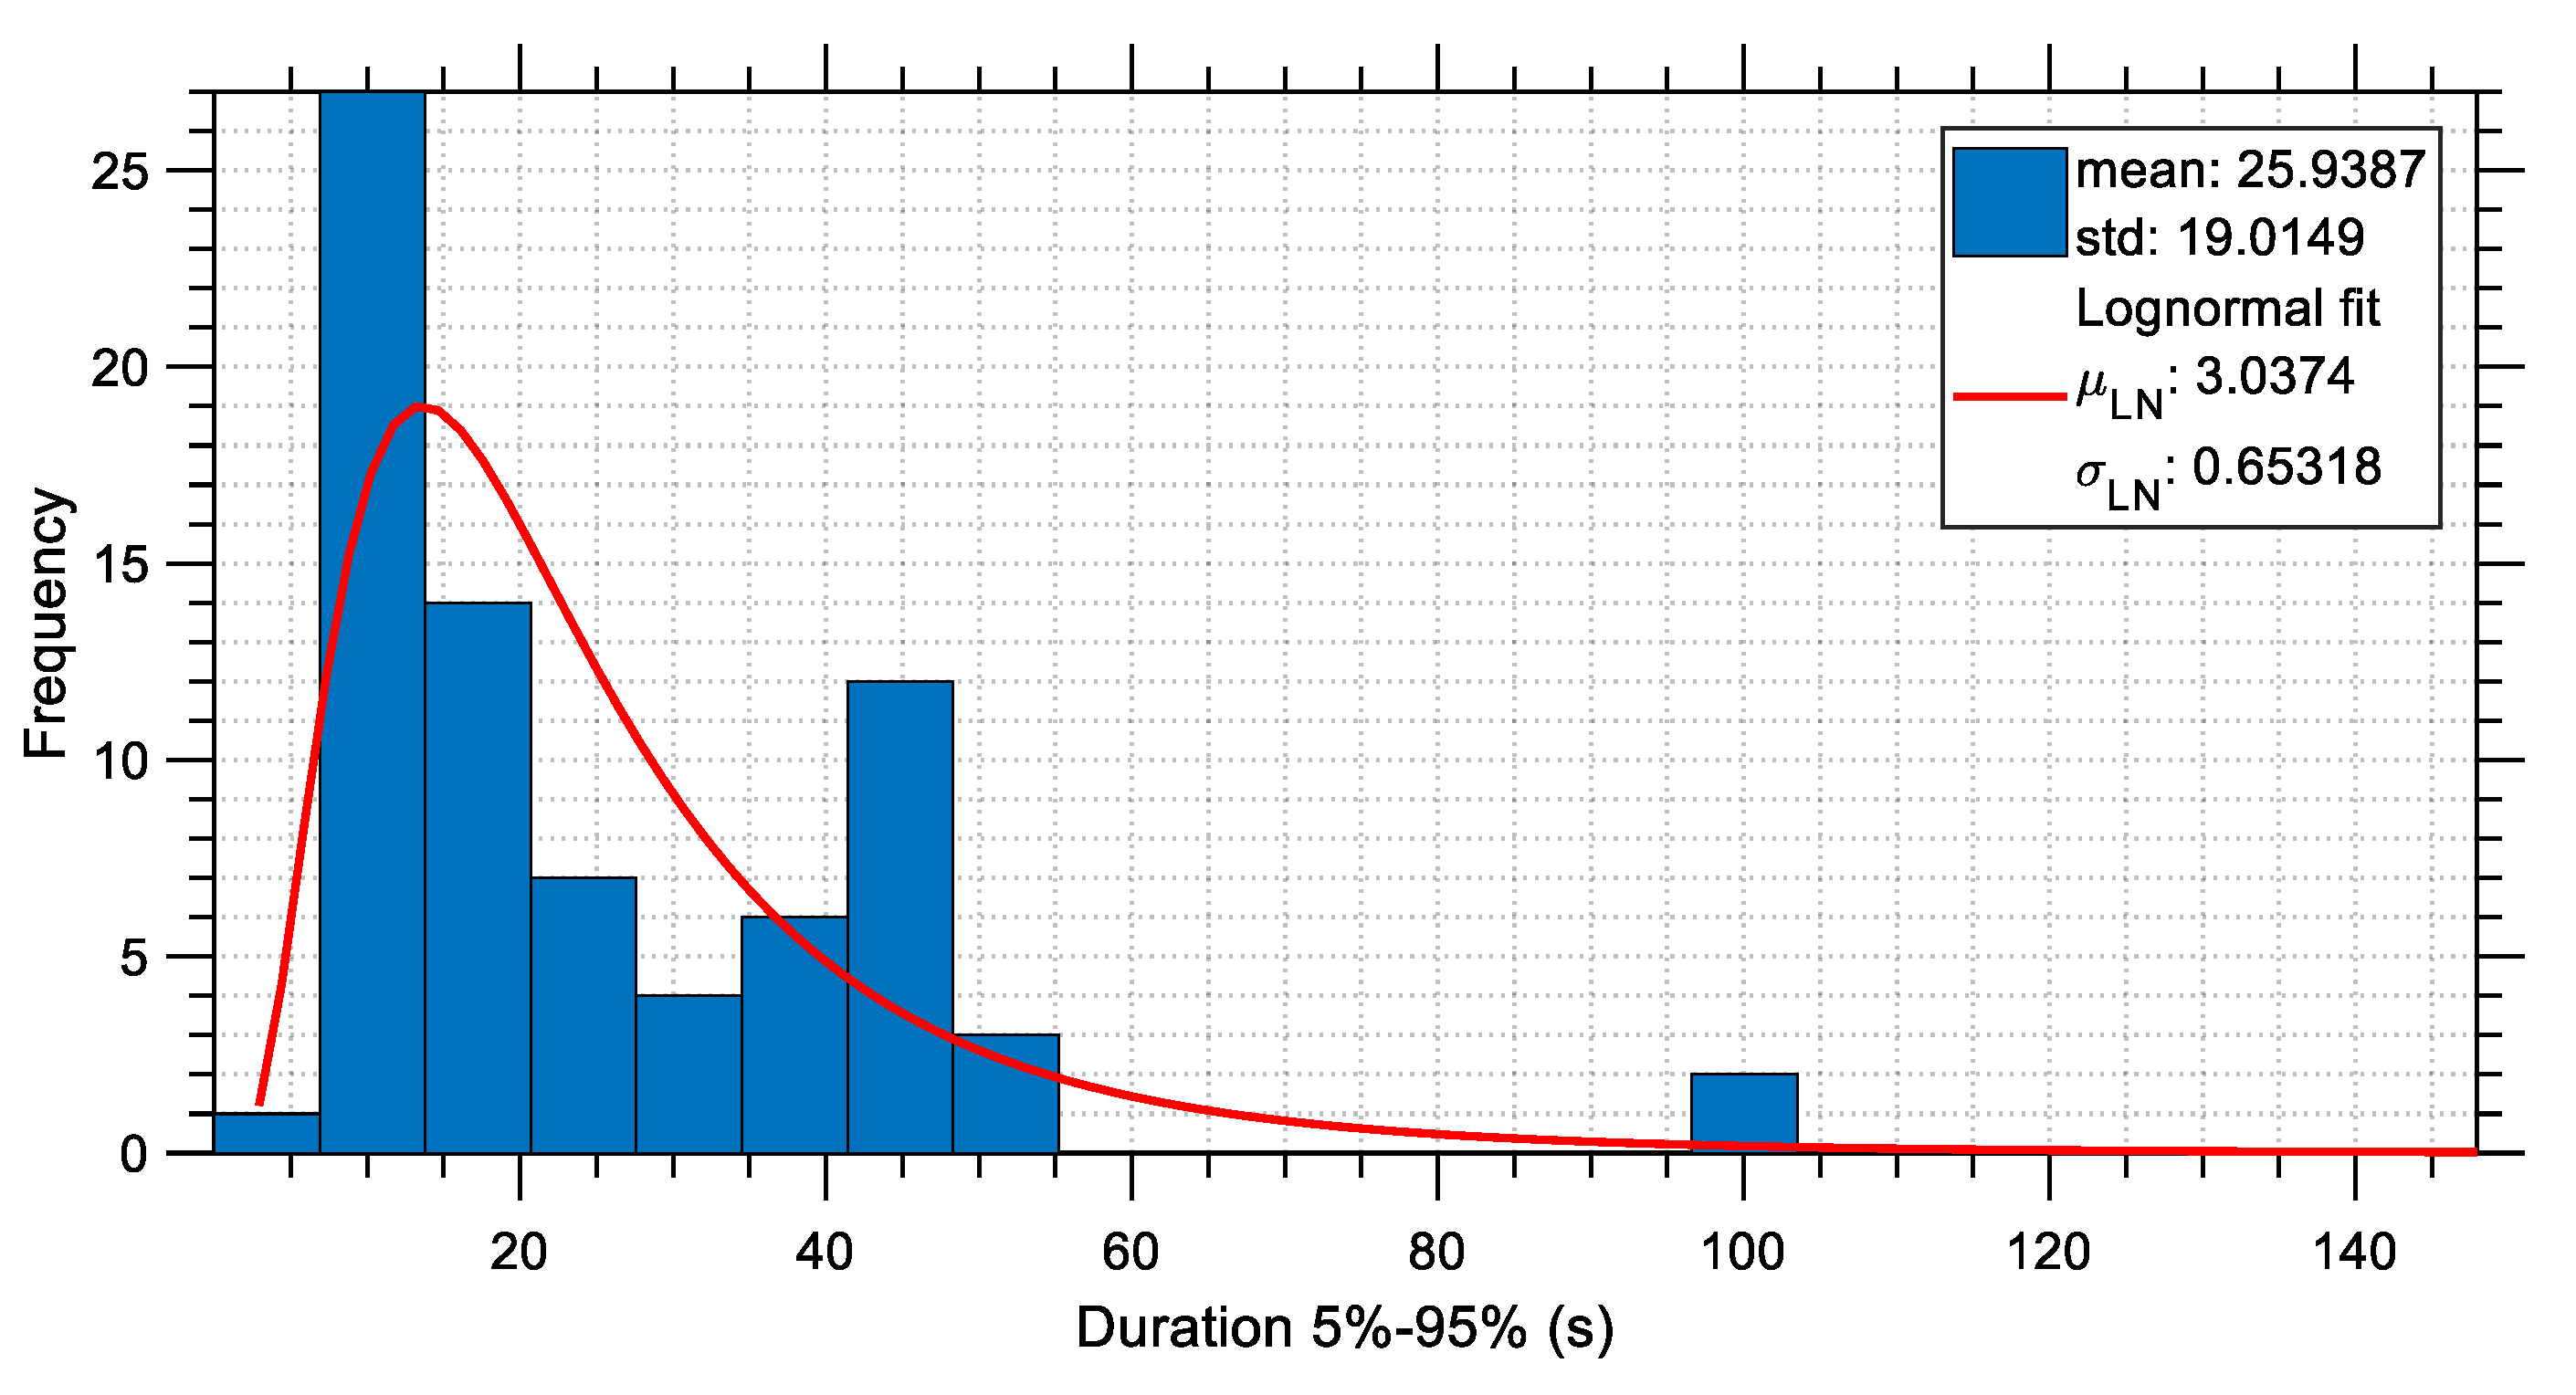
The distributions of several characteristic seismic parameters are investigated in this section. For this purpose, the previously mentioned 76 acceleration time histories (i.e., the two horizontal components from 38 stations) are considered and their seismic parameters are calculated and then plotted in the form of statistical distributions. These distributions demonstrate the severity of the earthquakes that occurred on 6 February 2023 in Türkiye and indirectly may provide some explanations about the increased number of buildings that collapsed. The seismic parameters that are plotted include peak measures as well as cumulative measures. These are the PGA (plotted in
Figure 23), effective PGA (EPGA, according to [
43], plotted in
Figure 24), PGV (plotted in
Figure 25), spectral intensity defined according to [
44] (plotted in
Figure 26), spectral intensity according to [
45] (plotted in
Figure 27), Arias intensity (plotted in
Figure 28), and significant duration (plotted in
Figure 29). All the aforementioned parameters have been calculated using the OpenSeismoMatlab software [
30], only for horizontal strong ground motion components. It is noted that the μ
LN and σ
LN parameters of the lognormal distribution that appear in the legends of the histogram plots are different from the mean value and standard deviation of the data being plotted. The increased mean values of the plotted seismic parameters denote the increased impact of the 6 February 2023 Türkiye M
w 7.8 earthquake event.
More specifically, it is apparent from
Figure 26 that the spectral intensity calculated according to [
43] has average and maximum values equal to 2.14 m and 6 m, respectively. Comparison of these values with the Housner intensities that are calculated for major earthquake events in the past reveals the severity of the M
w 7.8 earthquake event that occurred in Türkiye on 6 February 2023. For example, from
Figure 5 of the work of Garini and Gazetas [
46], where 99 recorded ground motions are selected to cover many of the well-known accelerograms from earthquakes of the last 30 years, and to include motions bearing near-fault characteristics (directivity and fling effects), it can be deduced that the Housner intensity values ranges roughly from 1 m to 6 m. In the study of Massumi and Gholami [
47], a set of 85 far-field ground motion records from 17 earthquake events with moment magnitudes ranging from 5.9 to 7.6 and recorded for type II soil (Vs = 360–750 m/s) were processed.
Figure 2 of this study shows the Housner spectral intensity ranging from 0 to 2.5 m. Since the range of the Housner intensities of the earthquake considered in this study is closer to that of [
46], it is concluded that it can be highly possible that the earthquake considered in this study contains directivity and fling step phenomena, whereas it is confirmed that it was a severely strong event.
In addition, when the Arias intensities of the earthquake under consideration in this study and of various other major earthquakes are compared, similar observations can be made, as described above. For example, in
Figure 2 of [
46], it is observed that the Arias intensity values range roughly from 0.5 m/s to 12 m/s, whereas the mean and average values of the Arias intensity of the 6 February 2023 M
w 7.8 Türkiye earthquake are noted from
Figure 28 to be equal to 6.29 m/s and 70 m/s, respectively. The fact that the average value falls into the middle of the aforementioned range shows the severity of the M
w 7.8 earthquake once again.
Similar observations can be made about the other seismic measures that are presented in this section.
6. Conclusions
The earthquake with the magnitude of M
w 7.8 that hit the Kahramanmaraş–Gaziantep regions in southern Türkiye on 6 February 2023, was a rare event of extremely large seismic power; as shown in
Section 3.1, where the total cumulative energy as well as its time history are calculated. This fact played a critical role in the intensity of the shaking that was experienced by structures and could provide some indirect hints explaining the large number of structural collapses. The acceleration spectral values of the seismic records that are calculated in
Section 3.2 were found to be substantially larger than the design acceleration spectrum values according to the Turkish seismic code. Moreover, this difference between the design and the actual response spectra covered a large interval of periods, which includes the eigenperiods of most common buildings.
It has been shown in this study that the maximum spectral acceleration of isoductile spectra is much lower than that of the corresponding linear elastic spectra, which implies a substantial difference in the seismic forces experienced by the structures and shows the importance of structural ductility for proper seismic design. Many post-earthquake surveys have shown that many concrete buildings were under-reinforced, which denotes that they had low ductility and therefore responded in a more linear elastic-wise manner, thus experiencing much higher accelerations and forces, which may have led to their collapse.
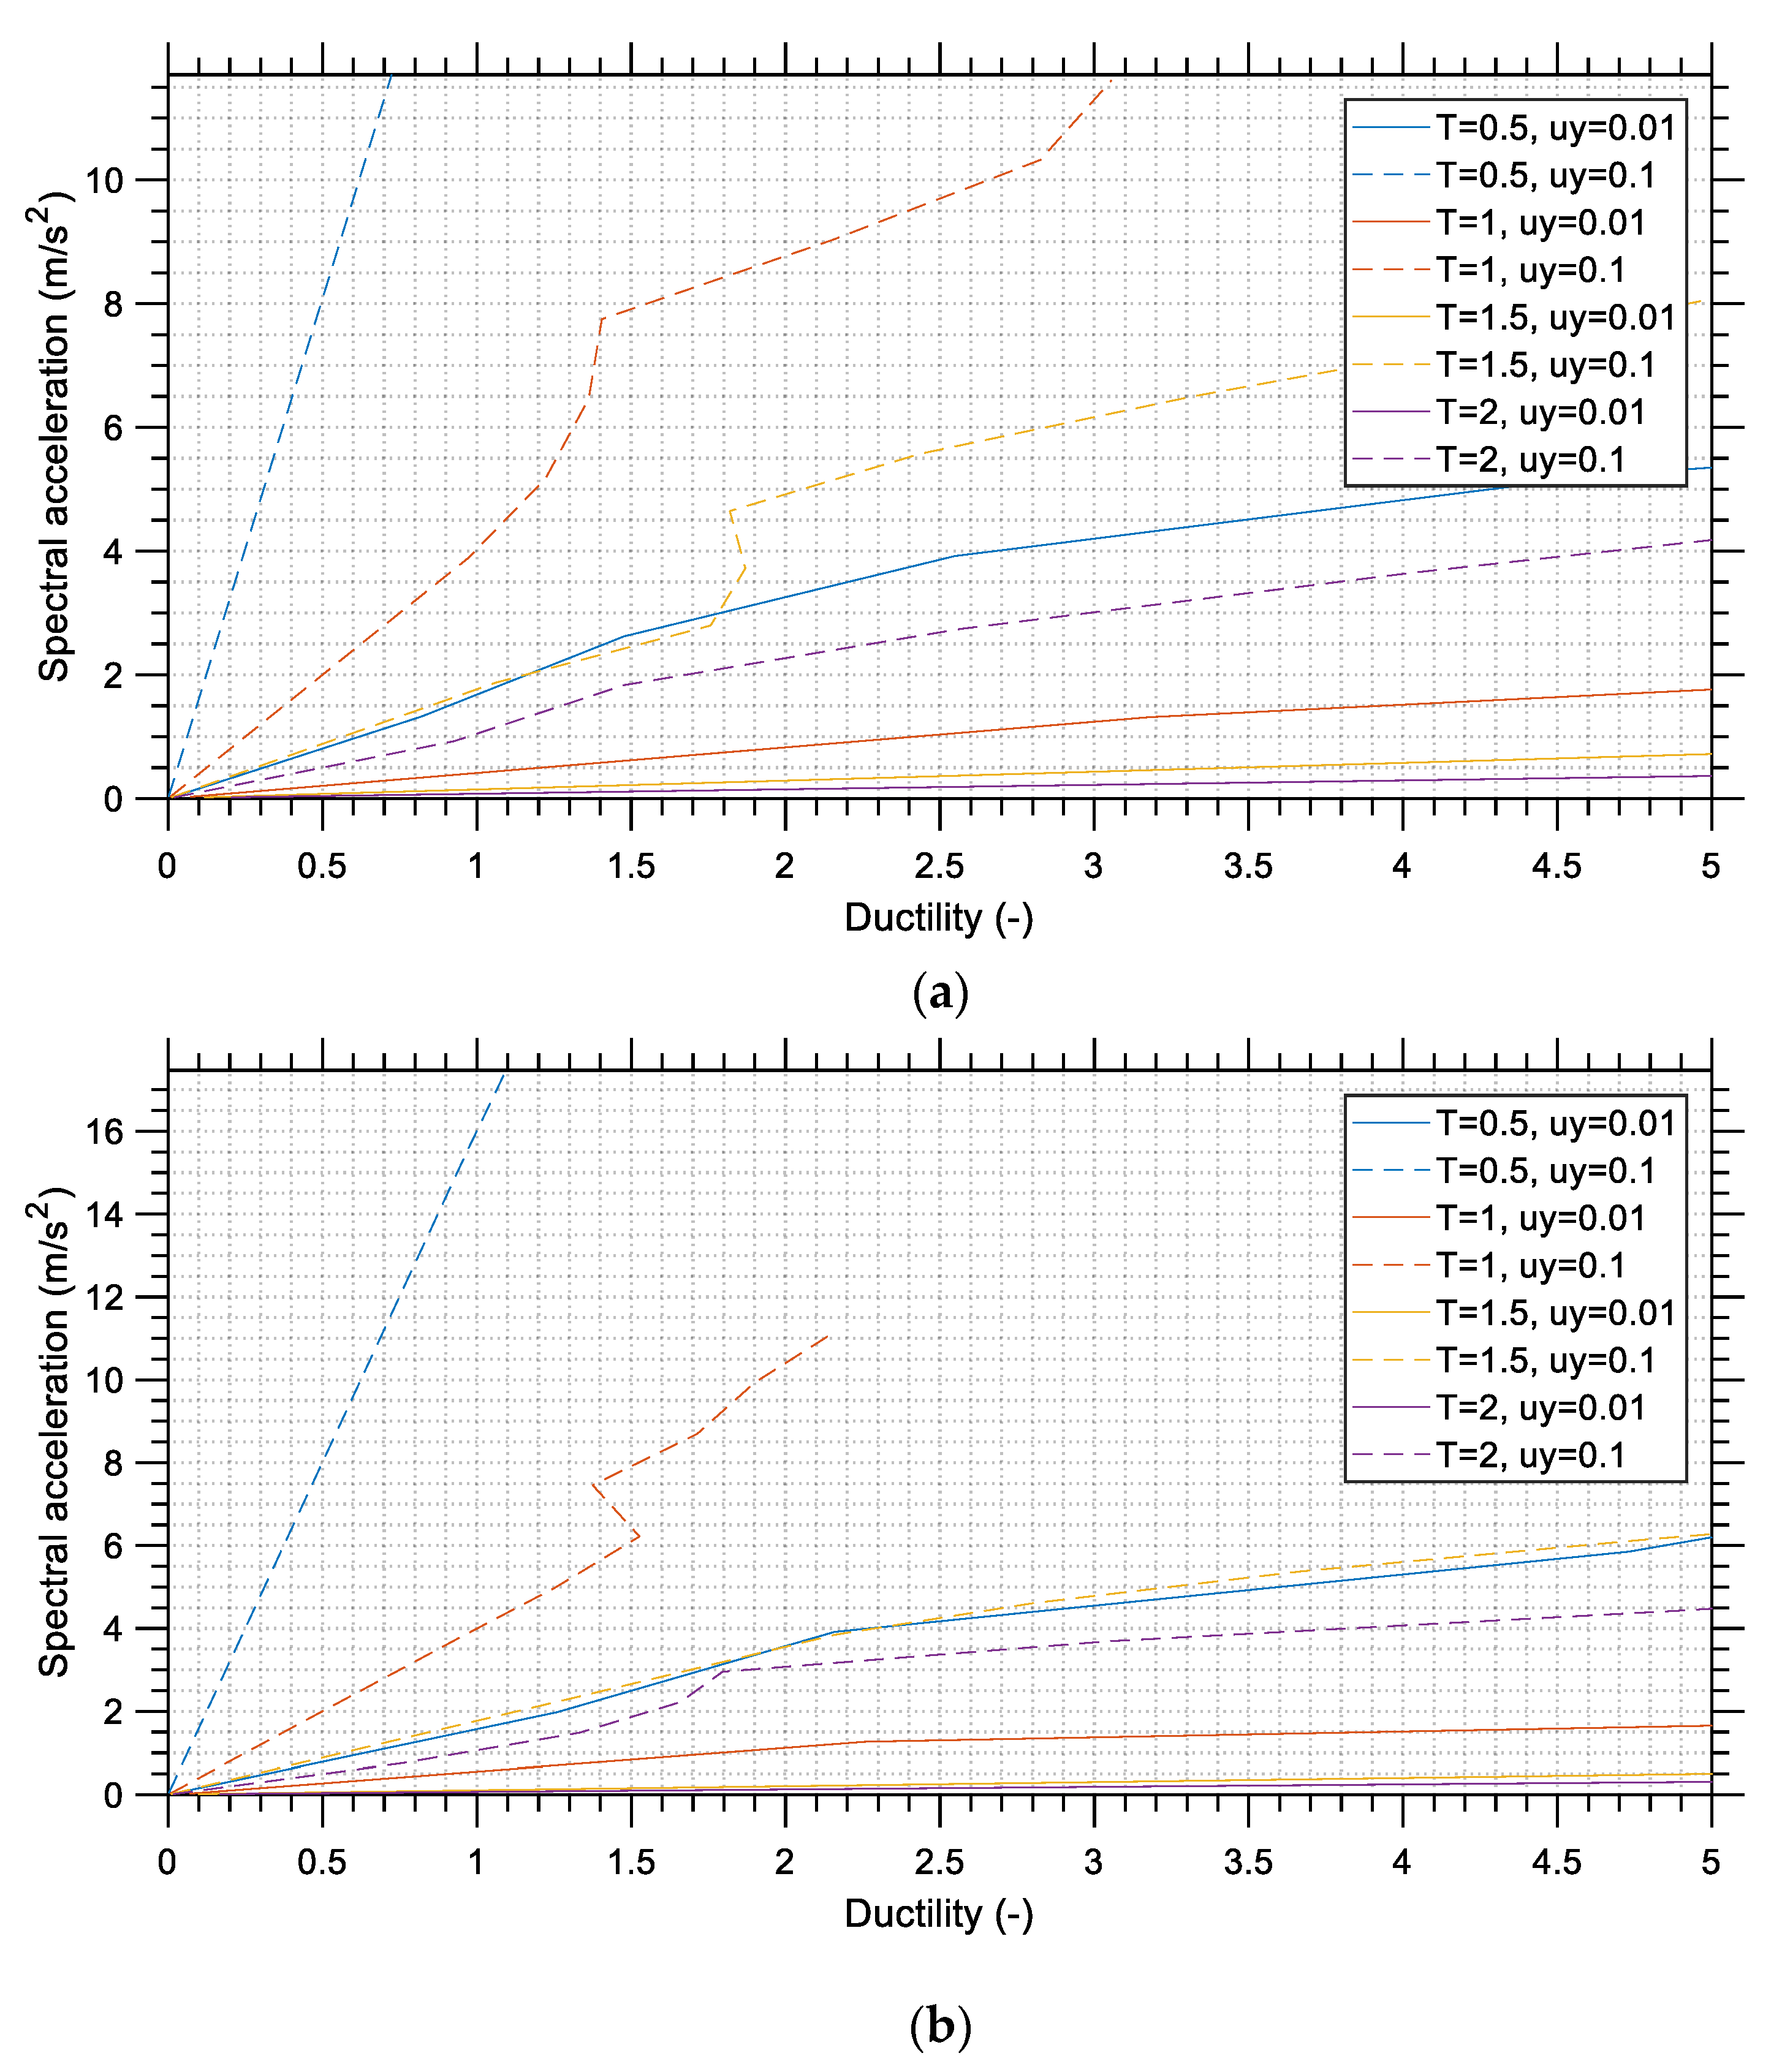
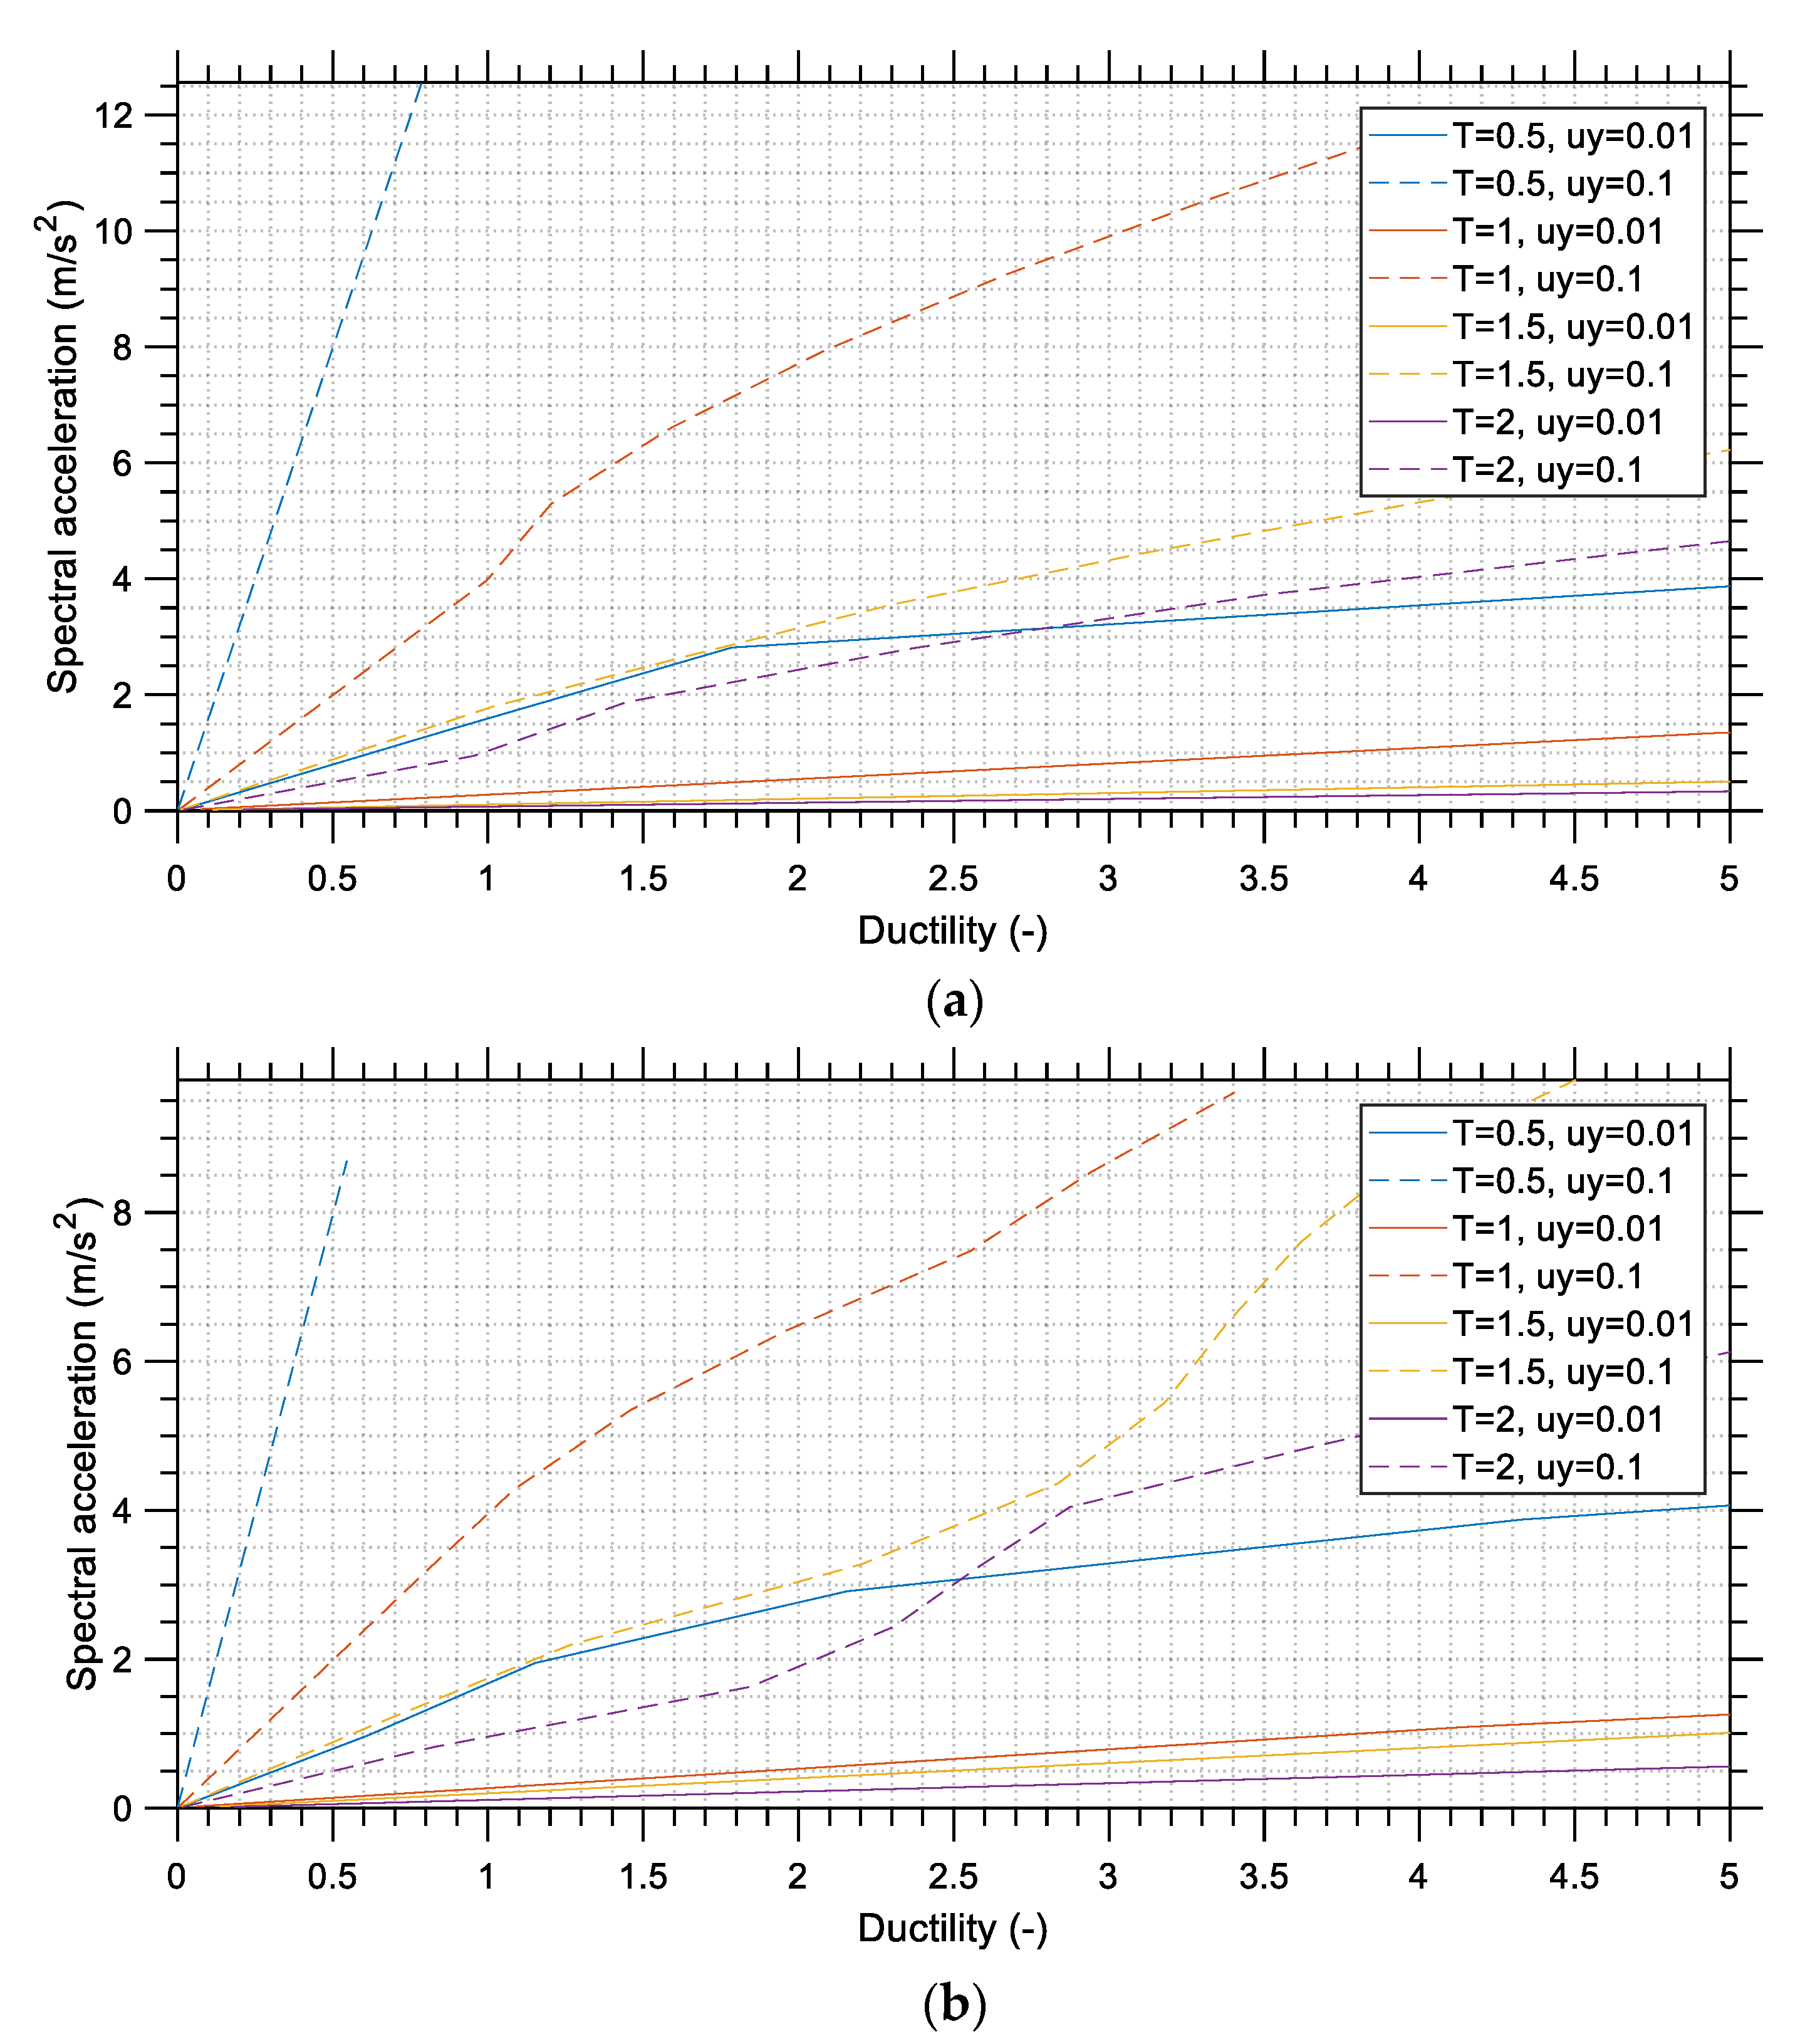
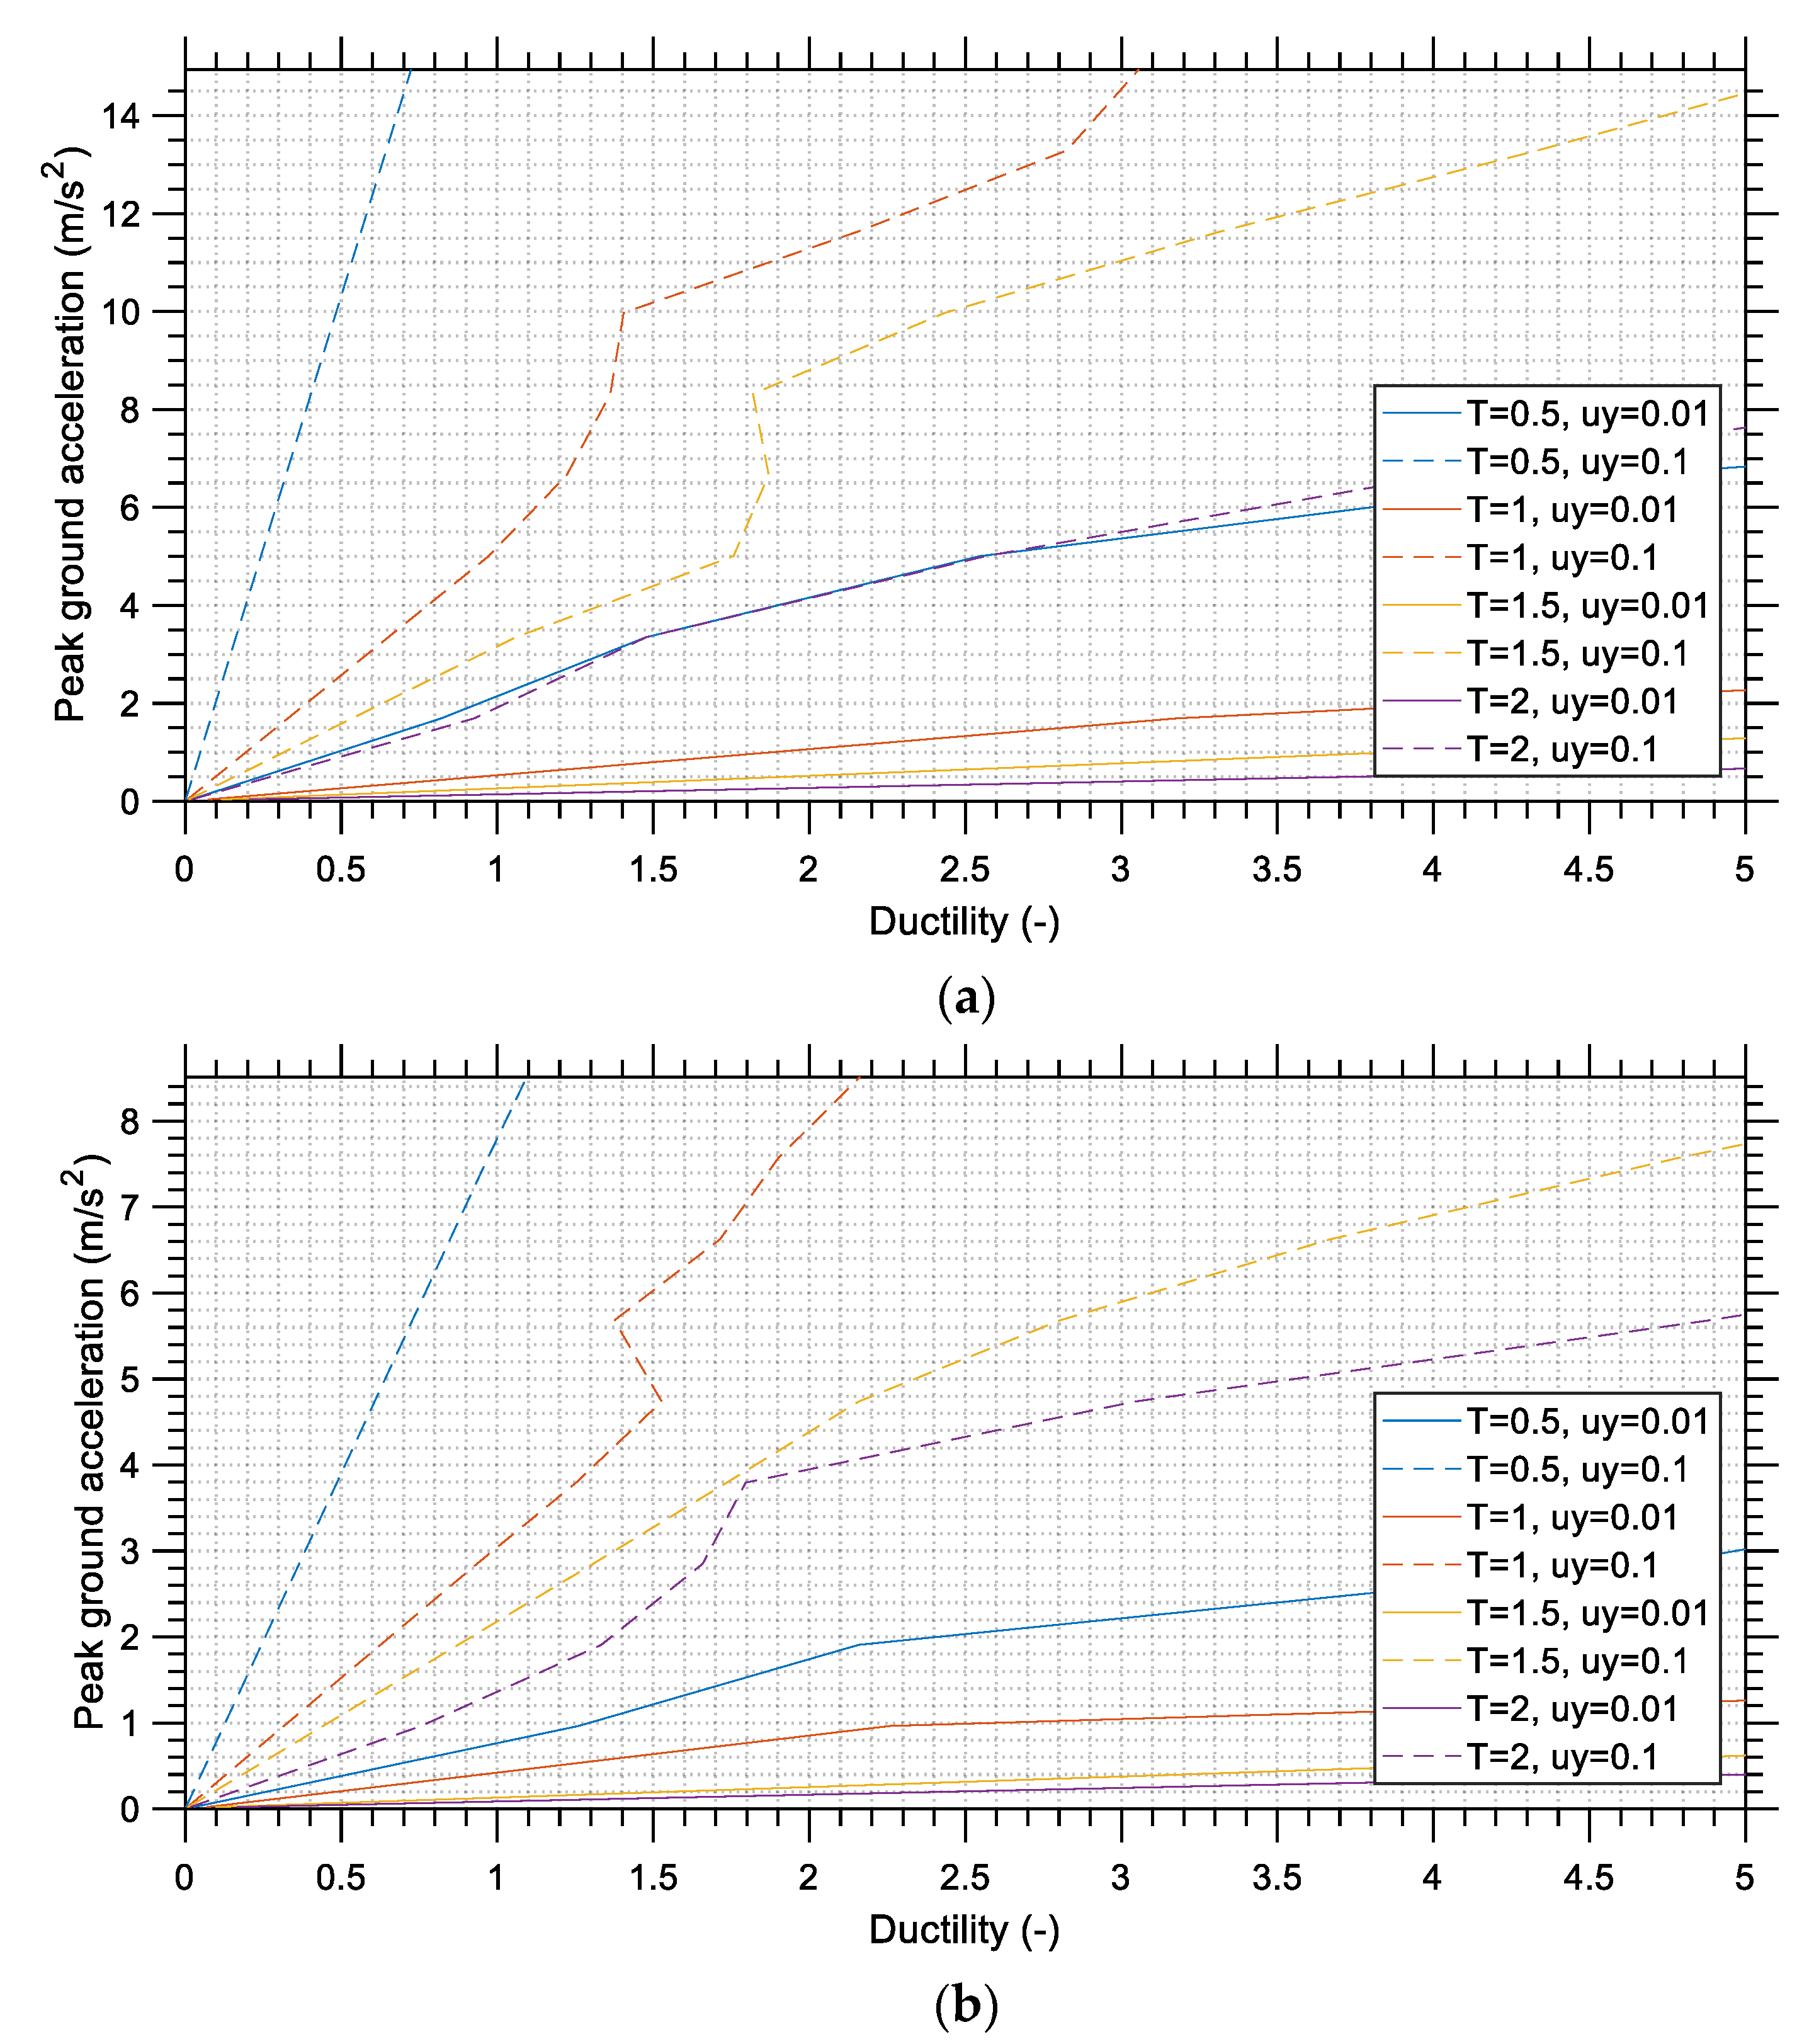
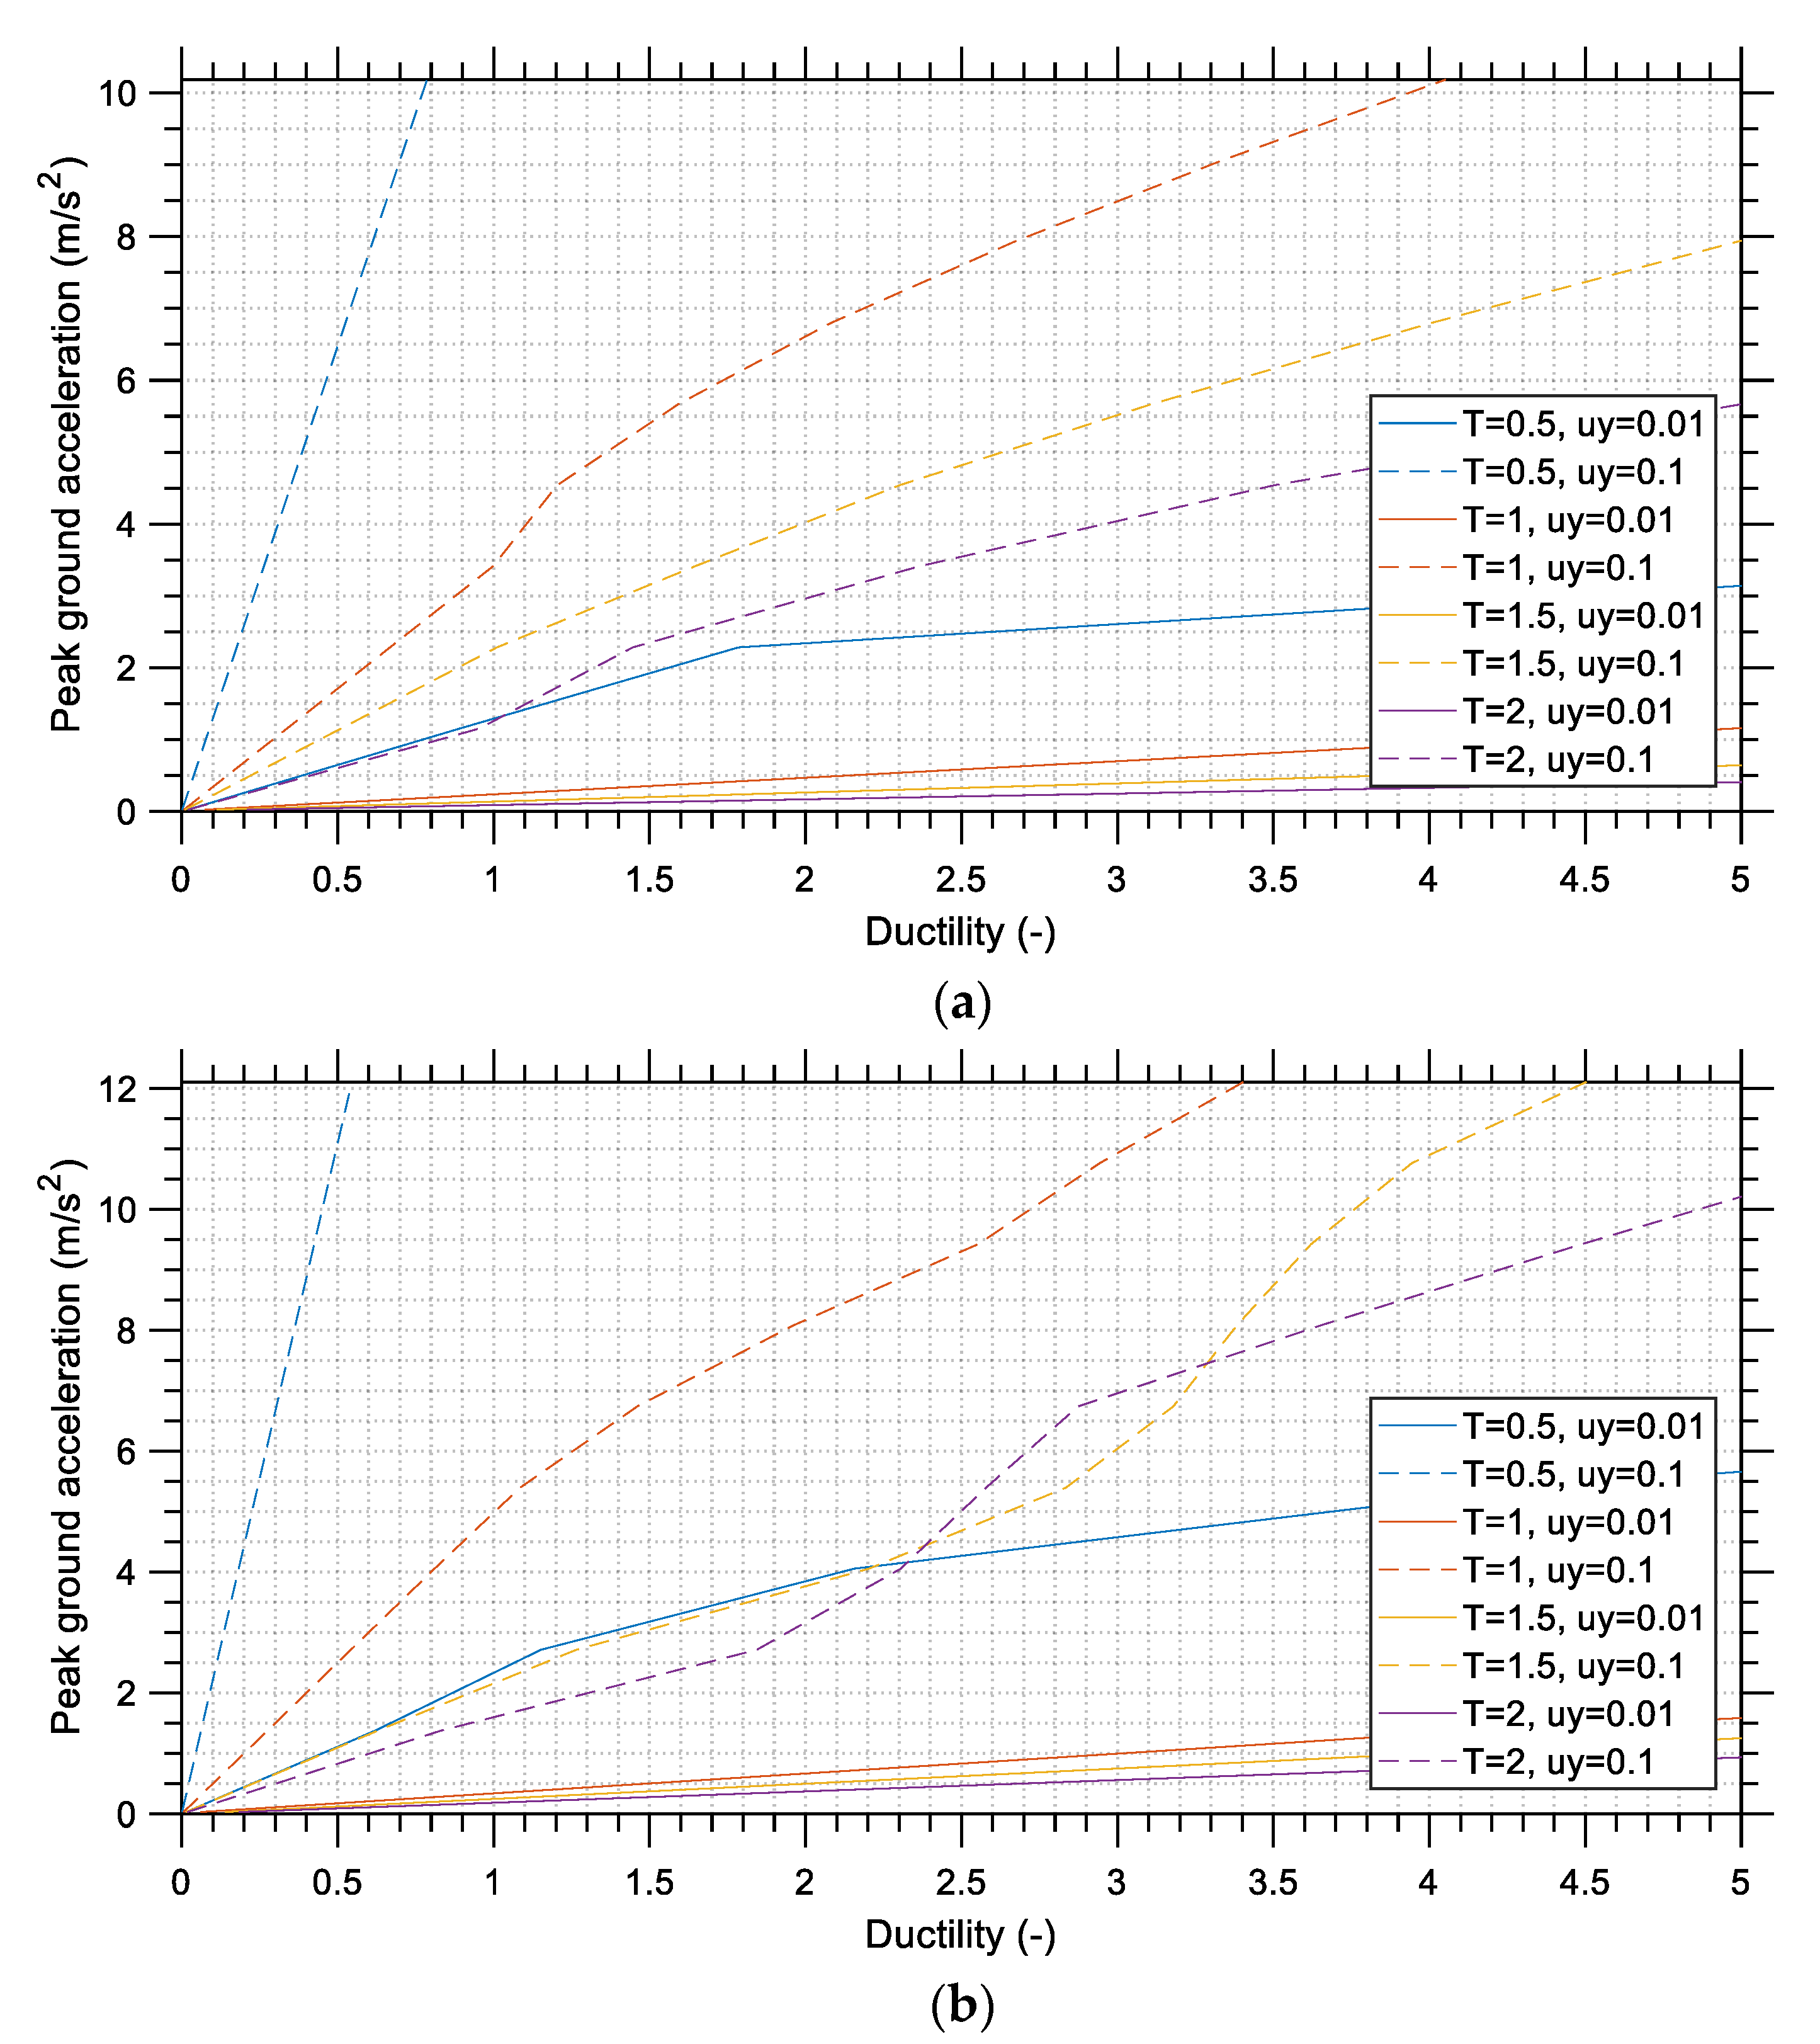
A close examination of the IDA curves that exhibit the seismic demand of the M
w 7.8 earthquake on SDOF structures can provide strong evidence that a relatively stiff structure with low yield deformation could be equivalent to a flexible structure with moderate yield deformation. This implies that reduced structural stiffness, which is the usual outcome of pursuing a more economical design, should be accompanied by moderate and not low levels of yield deformation to ensure that the structure will be able to withstand high earthquake acceleration levels. Under-reinforced concrete structures possess a low lateral stiffness combined with a low yield deformation, and this could explain the large number of collapses during the earthquake event when considering the much larger seismic damage imposed on SDOF systems with similar characteristics that are obvious in the various IDA curves presented in
Section 4.
Spectral velocity appears to be an important parameter describing the destructive effects of an earthquake, as shown in
Section 3, apart from the spectral acceleration which is adopted in most seismic codes worldwide (including the Turkish seismic code) for structural design against earthquake loading.
In
Section 5 of this study, it has been shown that the M
w 7.8 earthquake was indeed severely strong by comparing its various peak and cumulative seismic parameters to the corresponding seismic parameters of strong motion datasets from other major earthquakes in the past.
