Abstract
Heating, ventilation, and air-conditioning (HVAC) systems play a significant role in building energy consumption, accounting for around 50% of total energy usage. As a result, it is essential to explore ways to conserve energy and improve HVAC system efficiency. One such solution is the use of economizer controls, which can reduce cooling energy consumption by using the free-cooling effect. However, there are various types of economizer controls available, and their effectiveness may vary depending on the specific climate conditions. To investigate the cooling energy-saving potential of economizer controls, this study employs a dry-bulb temperature-based economizer control approach. The dry-bulb temperature-based control strategy uses the outdoor air temperature as an indicator of whether free cooling can be used instead of mechanical cooling. This study also introduces an artificial neural network (ANN) prediction model to optimize the control of the HVAC system, which can lead to additional cooling energy savings. To develop the ANN prediction model, the EnergyPlus program is used for simulation modeling, and the Python programming language is employed for model development. The results show that implementing a temperature-based economizer control strategy can lead to a reduction of 7.6% in annual cooling energy consumption. Moreover, by employing an ANN-based optimal control of discharge air temperature in air-handling units, an additional 22.1% of cooling energy savings can be achieved. In conclusion, the findings of this study demonstrate that the implementation of economizer controls, especially the dry-bulb temperature-based approach, can be an effective strategy for reducing cooling energy consumption in HVAC systems. Additionally, using ANN prediction models to optimize HVAC system controls can further increase energy savings, resulting in improved energy efficiency and reduced operating costs.
1. Introduction
The building sector represents one of the largest consumers in the US [1]. Energy consumption for heating, ventilation, and air-conditioning (HVAC) systems is approximately 50% of the total energy consumption of the building sector [2]. Therefore, to reduce building energy, it is essential to reduce heating and cooling energy consumption. To do so, the American Society of Heating, Refrigerating, and Air-Conditioning Engineers (ASHRAE) continuously improves the insulation performance of buildings by lowering the U-value of walls and windows every three years. However, in the case of enhanced insulation performance, such improvements are introduced through retrofitting or in new buildings. It is important to control the HVAC systems that are already installed in the existing building for building energy savings without retrofitting. However, since most of the existing control methods of the HVAC system are time-based control, optimal control may not be achieved. Therefore, the existing HVAC control method is difficult to predict for the control of the future state of HVAC systems by simultaneously considering variables that affect building energy consumption [3,4,5]. To predict and control the future state of the HVAC system, an artificial neural network (ANN)-based HVAC control is required [3,4,5]. In addition, ANNs enable accurate prediction through adaptability to external changes. They enable accurate and efficient control [5]. Previous studies using predictive models to properly control HVAC systems are described as follows.
Mba et al. predicted indoor air temperature and relative humidity using an ANN to save cooling energy in residential buildings. According to their findings, the correlation coefficient between the outcomes of their developed ANN prediction model and the actual data was 98% [6]. Zhao and Liu proposed a load-predicting method using regression analysis and artificial intelligence [7]. Chae et al. proposed a data-driven forecasting model for one-day-ahead energy consumption of commercial buildings at 15-min resolution. They used a short-term building energy usage forecasting model based on an ANN algorithm [8]. Ding et al. proposed genetic algorithm-based short-term and ultra-short-term prediction models to predict cooling load in office buildings [9]. Luo proposed an ANN model to forecast a day-ahead cooling demand in an office building. The researcher argued that the proposed method can be implemented in the building to predict cooling demand [10]. Nasruddin et al. argued that the ANN-based HVAC control method performed better than the conventional HVAC control method regarding thermal comfort and energy efficiency [11].
Additionally, Yilmaz and Atik used the ANN model for modeling a cooling system with variable cooling capacity [12] and Moon et al. developed an ANN model that can estimate the time needed to restore the indoor temperature from a setback period to the normal set-point temperature in accommodation buildings during the cooling season [13]. Jani et al. used an ANN model for predicting the performance of the hybrid desiccant cooling systems [14].
There have been many studies conducted on the appropriate control of the HVAC system, verification of the accuracy of the predictive model, and HVAC system performance through predictive control to reduce building energy consumption.
However, few studies have dealt with cooling energy savings through the economizer system itself.
An economizer system that has a free-cooling effect while introducing outside air into the room is used to reduce cooling energy and improve indoor air quality. An economizer system is a cooling system that can reduce energy consumption by introducing outdoor air into the building. Depending on the outdoor conditions, such as in humid, dry, hot, or cold regions, control of the economizer should be considered to properly use the economizer. The following outlines previous studies on economizer systems.
Ezzeldin and Rees conducted a performance evaluation of various cooling strategies in office buildings in four climates using the EnergyPlus simulation program. The main results indicated that economizers for free cooling have the advantage of reducing plant energy consumption while maintaining indoor thermal comfort when compared with a typical HVAC system. Furthermore, the application of the economizer needs to be considered in dry climate conditions [15]. Hong et al. proposed an optimal outdoor air fraction using the economizer control to reduce cooling energy consumption in a hospital building. The main result was that 6–14% of the cooling energy consumption could be saved by differential dry-bulb temperature-based control and 17–27% of the cooling energy consumption using differential enthalpy-based control compared to no economizer [16]. Lee and Chen examined the potential cooling energy consumption savings through the free-cooling technology with differential enthalpy control for data centers in 17 climate zones. The results of this study showed that for every 2 °C decrease in the indoor air temperature in the data center, the cooling energy consumption can be reduced by 2.8 to 8.5%, depending on the climate zones. Furthermore, this study revealed significant potential for free cooling in data centers located in mixed-humid, warm-marine, and mixed-marine climate zones [17]. Yao et al. conducted simulation research to reduce cooling energy consumption by controlling the air-side economizer system in an office building. Dry-bulb temperature-based control operates on a shorter time scale than enthalpy-based control, but can produce more cooling energy savings than enthalpy-based control. However, in the south of China, dry-bulb temperature-based control operates on a longer time scale and saves more cooling energy than economizer-based control systems [18]. Chowdhury and Khan analyzed economizer control strategies using the EnergyPlus simulation program. Measured chiller energy consumption is compared with TRNSYS simulation results, finding that economizer control can save 72 kW/m2 per month in cooling loads [19]. Wang and Song proposed an optimal AHU supply air set-point temperature to minimize energy consumption while maximizing the economizer effect. Wang and Song accounted for a balance between cooling consumption savings and the increased supply airflow rate when setting a higher supply air set-point temperature [20]. Yiu et al. conducted an experimental study to verify an air-side economizer system in an office building in Hong Kong. The main result was 12.1% of the existing annual cooling energy consumption using the air-side economizer system [21]. Bulut and Aktacir conducted a detailed analysis of economizers in climate conditions present in Turkey. The free-cooling potential of the economizer was determined using actual hourly dry-bulb temperatures. The main result was that the free-cooling potential is dependent on the supply air temperature and season, and significant energy savings were achieved, especially in the transition period [22].
In summary, most of the research on economizer systems has focused on how to control the economizer itself depending on the climatic conditions. Some studies were conducted by combining the air supply temperature and the economizer control, but the air supply temperature was not proposed in consideration of the internal and external environment.
This study aims to confirm the free-cooling effect of the economizer system in office buildings. It also aims to confirm additional energy consumption reduction through ANN-based optimal air-handling unit (AHU)-discharge air temperature (DAT) control. To understand the cooling effect of the economizer and ANN-based optimal AHU-DAT control, a cooling dominant region and differential dry-bulb temperature-based control were selected due to the climate characteristics. To analyze the cooling effect of the economizer system, a prototype office building simulation model was used. To propose the ANN-based optimal AHU-DAT control, the ANN-based load prediction model was established through Python code.
The primary research inquiries addressed in this paper are as follows:
- (1)
- What is the potential cooling energy savings through the use of ANN-based control?
- (2)
- Does ANN-based control result in greater cooling energy savings compared to the current rule-based economizer control?
2. Simulation Method
2.1. Simulation Program
Two software programs are used in this study: EnergyPlus version 9.1 for making simulation models and Python ver. 3.6 for developing the ANN model.
EnergyPlus is a software for building energy simulation, developed by the U.S. Department of Energy (USDOE). It uses the recommended heat balance calculation method from ASHRAE and can analyze simulations using both heat and mass balance calculations, which is not possible in other existing simulation programs [5,23,24]. Using the “Controller: Outdoor air” function in the EnergyPlus simulation program, the economizer system is controlled.
Python is an interpreted language developed by Amsterdam’s Guido Van Rossum in 1990. Python has been widely used in many areas of social computing, such as web programming, data analysis, numerical computation, object-oriented programming, graphic user interface programming, and system utility building [5,25].
2.2. Description of the Simulation Model
The simulation model was implemented using the EnergyPlus simulation program. Figure 1 shows the building simulation model. In this study, an office building model, developed based on ASHRAE 90.1-2004, is used as a baseline when analyzing energy consumption, was selected. The size of the building is 52.3 m × 35.2 m (1841 m2), and the floor-to-floor height is 3.96 m. The building is a three-story office building with a 40% window-to-wall ratio. The space to be analyzed in this study is the core zone on the second floor that is not directly affected by the external environment, and the size of the core zone is 43.7 m × 26.1 m (1140.6 m2).

Figure 1.
Simulation model.
2.3. Simulation Conditions
Table 1 provides details on the simulation model’s construction and material properties, which are based on ASHRAE Standard 90.1-2004 for climate zone 3. The cooling set-point temperature for the model is 26 °C, and Table 2 shows the internal heat gains of the model. The values for material, construction, and internal heat gains are based on ASHRAE 90.1-2004 [26]. For this study, an AHU-based variable air volume (VAV) system commonly used in office buildings [3] was selected as the HVAC system. Figure 2 shows that the HVAC system of the simulation model is an AHU-based VAV system that consists of a hot water coil and reheating coil receiving hot water from a district heating system, and a cooling coil receiving chilled water from a district cooling system. The HVAC system operates from 7 a.m. to 10 p.m.

Table 1.
Construction properties.

Table 2.
Internal heat gain condition.
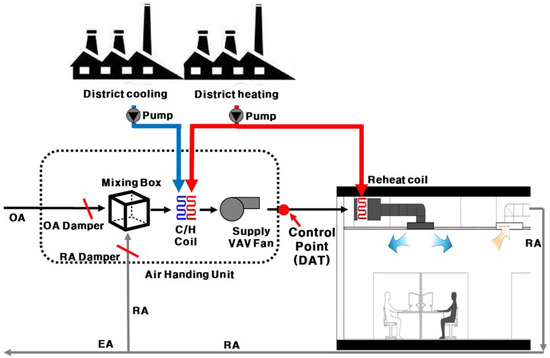
Figure 2.
System diagram.
2.4. Economizer System
The economizer system regulates the outdoor air damper located in the mixing box, based on its control type, to introduce outdoor air into the mixing box. By comparing the dry-bulb temperature or enthalpy of the return air from the zone with fresh air from outside, the economizer system can reduce the cooling coil’s load while maintaining AHU-DAT. The outdoor air volume is adjusted by an outdoor air damper, depending on the economizer controls, such as dry-bulb temperature, and enthalpy. Dry-bulb temperature-based control is used to determine the outdoor air volume by comparing the outdoor air’s dry-bulb temperature with that of the return air from the zone. During cooling periods, such as in the intermediate and summer season, if the outdoor air temperature is lower than the return air temperature, the amount of outdoor air is increased. Conversely, if the outdoor air temperature is higher than the return air temperature, the minimum amount of outdoor air set is applied.
The dry-bulb temperature-based control method only accounts for sensible heat, whereas the enthalpy-based control method considers both sensible and latent heat. In the enthalpy-based control method, the enthalpy of the return air and outdoor air is compared. If the outdoor air enthalpy is lower than the return air enthalpy, the outdoor air volume is increased. Conversely, if the outdoor air enthalpy is higher than the return air enthalpy, the minimum set outdoor air volume is used [27].
2.5. Simulation Cases
This study has three simulation cases. Case 1 is the base case in which the economizer system is not installed, using a fixed AHU-DAT of 12 °C. Case 2 is Case 1 with the economizer system. Case 3 is Case 2 with AHU-DAT control based on an ANN. Cooling energy consumption savings due to the installation of the economizer system can be analyzed by comparing Case 1 and Case 2. Further cooling energy consumption savings due to ANN-based AHU-DAT control can be analyzed by comparing Case 2 and Case 3.
2.6. Artificial Neural Network (ANN) Modeling
In this study, we used the Numerical Python and Scientific Python libraries of Python to develop an ANN model, following previous research [5]. Two crucial factors when designing the ANN model are the selection of the activation function and the learning method. For the activation function, we used a sigmoid function implemented in non-linear programs such as energy consumption prediction. This function calculates results using input values between 0.00 and 1.00 [5].
Regarding the learning method, we used a supervised learning method, commonly employed in prediction models. This method requires both the input value and the ground truth. The ground truth is used to determine the reliability of the ANN model against the predicted result value from the ANN prediction model. The supervised learning method includes an update process of the weight factors to enhance the ANN model’s reliability.
To elaborate, the input value is multiplied by the weight factor, added to each neuron, and passed to the input value of the activation function. If the input values are within the range of a particular threshold, the activation function does not output anything. Conversely, if the input values are outside the threshold range, the neuron is activated to transmit data to the next step. Hence, the ANN generates results by taking into account the data, weight factors, and activation function [5].
2.7. Development Process of the Predictive ANN Model
The predictive ANN model comprises two main components: the ANN component and the control logic component. The ANN component is responsible for predicting output datasets and uses a three-step process, illustrated on the left side of Figure 3 [5].
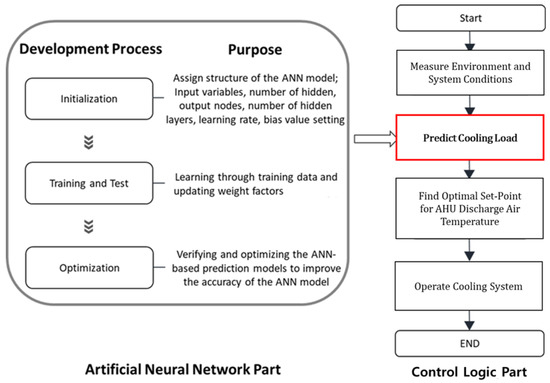
Figure 3.
Processes in the predictive ANN model.
The first step involves selecting highly correlated variables with the ground truth. To achieve this, a correlation analysis of variables is performed to identify input variables that are highly correlated with the ground truth, using objective indicators such as . This helps to increase the training efficiency [3,4,5,28].
The second step is training and testing, when training the ANN, weight factors are initialized and updated during the learning process to minimize the error rate between the ANN output and the simulation results. The activation function is applied to the input data and weight factors to generate a prediction, which is compared to the correct answer to calculate the error rate [3,4,5]. This process is repeated for a certain number of iterations, called epochs, to obtain the weight factors at which the error rate is minimized. To evaluate the performance of the trained ANN, a separate set of data, called test, or validation data, is used to measure the accuracy of the model [5]. The test data should be new and unseen during the training process to ensure the generalization ability of the model [5,28]. The error rate between the ANN output and the ground truth labels is calculated for the test data, but the weight factors are not updated during this process [28].
Optimizing the ANN involves tuning hyperparameters such as bias, learning rate, number of hidden neurons, and number of hidden layers to minimize error rates [5,25]. This is an iterative process that involves training the model multiple times with different hyperparameters until the desired performance is achieved [5,28].
The coefficient of variance of the root mean square error (cv(RMSE)) is used to ensure the reliability of the ANN model, with lower values indicating better prediction performance. The ASHRAE guideline 14-2014 suggests a tolerance of 30% for the cv(RMSE) value for hourly data [29], and the user should modify the hyperparameter values and repeat the process until the cv(RMSE) value is less than 30%. Equations (1) and (2) display the formulas for RMSE and cv(RMSE), respectively, and Equation (3) shows how to calculate the measurement period average [30]. The control logic sequence comprises four steps, as demonstrated on the right side of Figure 3. The first step is to collect input data through an experimental or simulation study. The second step is to predict the output from the input datasets, which is linked with the ANN part. The output datasets in this research are the cooling coil total cooling loads. The third step is to determine the optimal values for the parameters to be controlled to suggest optimal control after the optimization process concludes. In this research, the parameters to be controlled are the AHU-DAT to lower cooling energy consumption. The final step is to operate the cooling system using the optimal control suggested by the ANN model.
where
- = ANN model prediction value,
- = EnergyPlus simulation results,
- = Number of EnergyPlus results, and
- = Measurement period average.
2.7.1. ANN Model Development
The dataset was partitioned into two distinct sets for different purposes: the training dataset and the test dataset. During the training stage, the ANN model uses the training dataset, while the test dataset is employed for testing. To determine the predictive performance of the ANN model, it is essential to use different datasets for training and testing. In this study, EnergyPlus simulation results from April to October, 5136 h, were randomly shuffled and 70%, 3596 h, were selected as the training data set and 30%, 1540 h, as the test data set.
Seven input variables that displayed a high correlation with the cooling coil’s total cooling load were selected for the model. The seven input variables are outdoor air dry-bulb temperature, outdoor air relative humidity, direct solar radiation rate per area, diffuse solar radiation rate per area, occupancy schedule, lights schedule, and electric equipment schedule.
The initial ANN prediction model structure and input values are presented in Figure 4 and Table 3. The ANN model was initialized with seven input nodes, one hidden layer, 10 hidden nodes, and one output node. The learning rate was set to 10%, and the epoch value indicated the number of times learning was repeated. The cv(RMSE) of the initial ANN prediction model was 24.07%, which falls within the acceptable tolerance range of 30% specified in ASHRAE guideline 14-2014 [29].
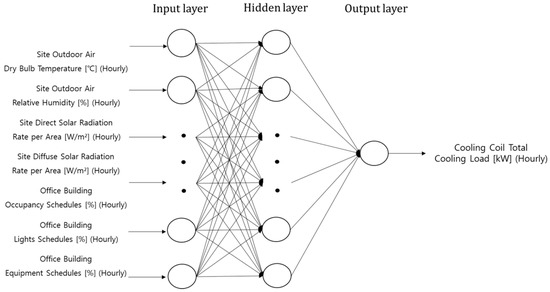
Figure 4.
ANN-based predictive model input data list and structure.

Table 3.
Initial ANN structure and parameter values.
The optimization of the ANN prediction model involves identifying the ideal values for hyperparameters such as learning rate, hidden nodes, epochs, and the number of hidden layers to improve prediction accuracy. Currently, there are no established methods for determining optimal hyperparameter values, and it is best to adjust these values iteratively based on the results. In this study, around 160,000 attempts were made to optimize the ANN prediction model. Python was used to conceptualize the optimization process, and the combination with the lowest cv (RMSE) value was chosen based on a comparison of EnergyPlus simulation results with the cooling coil total cooling load predicted by the ANN model. Table 4 shows the optimized hyperparameter values and their input range, with the cv (RMSE) value decreased from 24.07% to 8.44%. Therefore, it was determined that the optimized ANN prediction model is suitable for HVAC optimal control. Figure 5 shows the structure of Python programming code for the optimization process and Figure 6 illustrates a comparison of the simulation results and those predicted by the ANN prediction model.

Table 4.
Optimal ANN structure and parameter values.
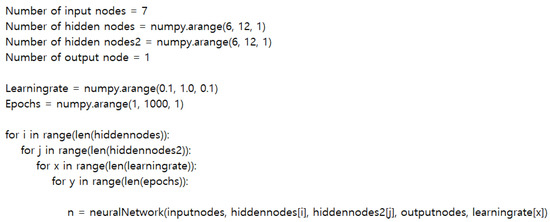
Figure 5.
Structure of the Python programming code for the optimization process.
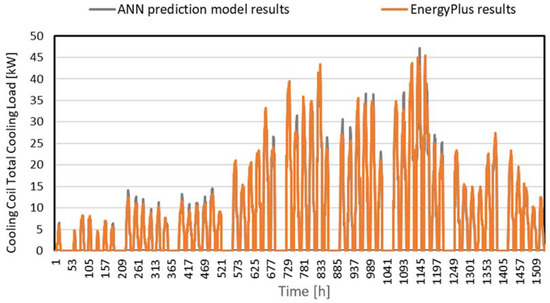
Figure 6.
Comparison of simulation data and ANN results.
2.7.2. Initial ANN Model Development Optimized Performance Analysis of the ANN Model Heating, Ventilation, and Air-Conditioning Control Strategy Based on the ANN Results
In this study, a method for determining the appropriate AHU-DAT using the ANN-based cooling coil total cooling load prediction model was developed. The method involves determining an AHU-DAT within the range of 12 to 16 °C through linear interpolation based on the cooling coil total cooling load predicted by the ANN prediction model during the operating hours of the HVAC system. Thus, the predicted cooling coil total cooling load is used to determine the appropriate AHU-DAT when cooling is required.
3. Analysis and Results
3.1. Weather Conditions
This study used weather data provided by EnergyPlus from the Brown Field Municipal Airport, one of the cooling-dominated regions. Brown Field Municipal Airport is in Southern San Diego, CA, USA. The analysis period in this study is the intermediate and cooling seasons, which is from April to October, to understand the free cooling and cooling effect of the economizer. April, May, September, and October are selected as the intermediate season, and June, July, and August are selected as the cooling season. Figure 7 shows the outdoor air dry-bulb temperature and relative humidity in San Diego, CA, USA. The range of the outdoor air dry-bulb temperature during the analysis period is 10.8–31.2 °C, and the range of the outdoor air relative humidity during the analysis period is 7–100%. The analysis period is 5136 h. Observing the outdoor air relative humidity, 4831 h is more than 50% of the outdoor air relative humidity, which is 94% of the total analyzed period.
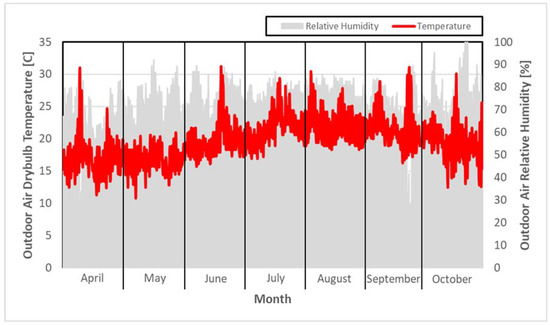
Figure 7.
Outdoor air dry-bulb temperature and relative humidity in San Diego, CA, USA.
3.2. Analysis of Representative Days of the Intermediate and Cooling Season
3.2.1. Comparison of the Pattern for Cooling Coil Total Cooling Load and Air-Handling Units with Discharge Air Temperature in the Representative Days of the Intermediate and Cooling Season
This paper uses 15 May as a representative day of the intermediate season and 11 August as a representative day of the cooling season. Representative days were chosen because they represent the average outdoor air temperature in the intermediate and cooling seasons. Figure 8 shows the change in AHU-DAT according to the cooling coil’s total cooling load during the representative days in the intermediate and cooling seasons. The cooling load pattern is similar to outdoor air temperature in all three cases. Since the cooling system operates from 7 a.m. to 10 p.m. in all cases, there is no cooling load from 11 p.m. to 6 a.m. In the case of the AHU-DAT value, it was found that Cases 1 and 2 were tightly controlled at 12 °C regardless of changes in the cooling load, and in Case 3, AHU-DAT is controlled by fluctuating within the range of the maximum of 16 °C to the minimum of 12 °C as the cooling load changes.

Figure 8.
Comparison of the cooling coil total cooling load and AHU-DAT pattern in the representative days.
When comparing the cooling load of each case on the representative day of the intermediate season, compared to Case 1, Case 2 showed a maximum reduction in cooling load of 53% at 7 a.m. when the outside temperature was relatively low, and Case 3 showed 99% less cooling load.
Considering the average daily data, Case 2 showed 35% less cooling load than Case 1, and Case 3 showed 61% less cooling load than Case 1. The explanation of the difference in the cooling load of each case is as follows. In both Cases 1 and 2, the AHU-DAT is the same at 12 °C, but in Case 2, the cooling load is lower than that of Case 1, which introduces only the minimum amount of outdoor air. This is because the economizer system performs free cooling when the outside air temperature is lower than the return air temperature. In addition, in Case 3, free cooling is performed through an economizer in the same manner as in Case 2, but since AHU-DAT is controlled according to the cooling load, less cooling load is required compared to Case 2.
When comparing the cooling load of each case on a representative day in the cooling season, Case 2 required more cooling load than Case 1, contrary to the results of the representative day in the intermediate season. In addition, Case 3 showed a relatively higher cooling load than Case 1 from 9 a.m. to 5 p.m. Comparing this with daily average data, compared to Case 1, Case 2 showed an average of about 18% and Case 3 an average of about 3% more cooling load. This can be explained in Figure 9, which compares the enthalpy of the outdoor air and mixed air of the representative days, where OA is outdoor air, MA is mixed air, and RA is return air. The blue box in Figure 9 is the enthalpy of the outdoor air and mixed air of Cases 2 and 3. The red box in Figure 9 is the enthalpy of the return air from the zone in Case 1, and the grey box is the mixed air of Case 1.

Figure 9.
Comparison of the enthalpy in the representative days.
The average value of the outdoor air enthalpy from 7 a.m. to 10 p.m. on the representative day of the intermediate season is about 41 kJ/kg, the return air enthalpy of Case 1 is 48 kJ/kg, and the mixed air enthalpy is 45 kJ/kg. In the case of the representative day in summer, the average value of the outdoor air enthalpy is about 54 kJ/kg, the return air enthalpy of Case 1 is 49 kJ/kg, and the mixed air enthalpy is 45 kJ/kg.
The reason that the enthalpy of the outdoor air and the enthalpy of mixed air of Cases 2 and 3 are similar on the representative day of both intermediate and cooling seasons is that the economizer system performs free cooling because the outdoor air temperature is lower than the cooling set temperature of 26 °C. In addition, the reason the enthalpy of the mixed air in Case 1 is higher than that in the other two cases in the intermediate season is that Case 1 introduces only the minimum outdoor air when cooling is needed. Because the enthalpy of the outside air is relatively lower than that of the return air, the enthalpy of the mixed air in Case 1 is higher than that of the other two cases where 100% outdoor air is introduced.
In contrast, in the case of the cooling season, the economizer system performs free cooling using outdoor air, which has higher enthalpy than that of return air. Even if the AHU-DAT of Case 2 is the same as Case 1, the enthalpy of the mixed air in Case 2 is higher than that of Case 1, in which only the minimum outdoor air is introduced. Due to the higher enthalpy, more cooling load is required in Case 2 compared to Case 1.
In addition, in Case 3, free cooling is performed through outdoor air in the same manner as in Case 2; however, the AHU-DAT of Case 3 is relatively higher than that of Case 2 by controlling the AHU-DAT according to the cooling load. As a result, it is judged that relatively less cooling load is required compared to Case 2.
3.2.2. Comparison of the Fan Flow Mass Rate in the Representative Days of the Intermediate and Cooling Season
Figure 10 shows the fan mass flow rate in each case in the representative days. In all cases, the fan was operated only from 7 a.m. to 10 p.m., when the HVAC system operates. On the representative day of the intermediate season, Cases 1 and 2 showed the same fan mass flow rate of 1.54 kg/s at all times, and Case 3 showed the maximum fan air volume of 2.06 kg/s at 5 p.m., the minimum fan mass flow rate of Case 3 was 1.5393 kg/s, the same as Cases 1 and 2 at 8 a.m. and from 6 p.m. to 10 p.m. Comparing the fan mass flow rate of Case 3 to the other two cases, Case 3 required an average of 19% greater fan mass flow rate per day.

Figure 10.
Comparison of the fan flow mass rate in the representative days.
Cases 1 and 2 showed the same fan mass flow rate because the temperature difference between the indoor cooling set-point temperature and AHU-DAT was fixed at 12 °C regardless of the cooling coil’s total cooling load. In addition, the reason that the fan mass flow rate was the same at all times is that the outside air temperature was lower than the indoor set temperature of 26 °C due to the characteristics of the intermediate season. That is why the cooling load can be handled with only the minimum fan mass flow rate under the condition that the AHU-DAT is set to 12 °C.
However, in Case 3, the temperature difference between the cooling set-point temperature and the AHU-DAT changes continuously because the AHU-DAT changes according to the cooling coil’s total cooling load. In accordance with this, the fan mass flow rate is also increased or decreased to handle the cooling load. Therefore, although the cooling loads of all the cases are the same, a relatively high fan mass flow rate is required because the temperature difference between the AHU-DAT of Case 3 and the cooling set-point temperature is smaller than in the other two cases.
On the representative day of the cooling season, the maximum fan mass flow rate of 1.68 kg/s was reached at 5 p.m. in Case 1 and Case 2, and the minimum fan air volume of 1.54 kg/s at 8 a.m. and from 6 p.m. to 10 p.m. Case 3 showed the maximum fan mass flow rate of 1.85 kg/s at 4 p.m. and the minimum fan air volume of 1.54 kg/s at 8 a.m. and from 7 p.m. to 10 p.m. Comparing the fan mass flow rate of Case 3 to the other two cases, Case 3 required 7% more fan mass flow rate per day.
On the representative day of the cooling season, Case 3 shows that the AHU-DAT is controlled at a lower temperature compared to the intermediate season, as a result of the higher cooling load. Due to the lower temperature provided to the zone, the supply air flow rate is decreased. In addition, the fan mass flow rate of Cases 1 and 2 is increased or decreased according to the cooling load pattern. This is because the outside air temperature in the cooling season is relatively high compared to the intermediate season, which is why the cooling load cannot be handled with only the minimum fan mass flow rate.
3.2.3. Comparison of the Cooling Energy Consumption in the Representative Days
Table 5 shows the cooling energy consumption on the representative days. In the case of the representative day in the intermediate season, Through the installation of the economizer system, fan electric energy is the same as in Case 1 due to the same AHU-DAT; however, electric energy for the chiller and pump is decreased. Additionally, 31.4% of total cooling electric energy can be saved through the installation of the economizer system. By optimal AHU-DAT control, electric energy for the chiller and pump can be reduced; however, fan electric energy is increased due to the higher temperature of the AHU-DAT than that of Case 1 and Case 2: 52.3% of total electric energy for cooling can be saved. In the cooling season, Case 2 consumes 17.0% more cooling energy than Case 1 due to introducing more outdoor air than Case 1. Case 3 consumes less cooling energy than Case 2; however, it still consumes 5.3% more cooling energy than Case 1.

Table 5.
Comparison of the cooling energy consumption in each case on the representative days.
3.3. Analysis of Cooling Energy Consumption in the Intermediate and Summer Seasons
Table 6 shows the cooling energy consumption in each component for each case in the intermediate and cooling seasons. Case 2, with an economizer system with differential dry-bulb temperature-based control, uses 25,292 kWh of district cooling energy and saves 18.9% of district cooling energy compared to Case 1. As analyzed above, even if an economizer is installed, AHU-DAT is equal to 12 °C for Cases 1 and 2. Therefore, since Cases 1 and 2 are the same as the temperature supplied to the room for cooling at 12 °C, the fan electric energy consumption is the same regardless of the presence of an economizer system. Due to the free-cooling effect of the economizer system, the pump electric energy used to circulate chilled water in the cooling coil is 186 kWh, which uses 13.5% less electricity than Case 1. When comparing the total cooling energy, it consumes 10.6% less cooling energy than Case 1 due to the economizer installation. When AHU-DAT is controlled, 45.8% of the district cooling energy can be saved when compared to Case 1, and 33.2% of the district cooling energy can be saved when compared to Case 2. In the case of fans, Case 3 uses more fan electrical energy than the other two cases. This is because a higher air volume is required since AHU-DAT, which is relatively higher than the other two cases, is supplied to the zone. The total amount of electric energy used for cooling is 4088 kWh, which is 41.1% less than Case 1 and 34.2% less than Case 2.

Table 6.
Cooling energy consumption in the intermediate and summer seasons.
In the case of the cooling season, the district cooling energy and pump electricity consumption increase due to the installation of the economizer system, unlike during the intermediate season. This is because of the enthalpy of the mixing air, which is described in the analysis of a representative day. As with the intermediate season, the fan electric energy consumption is the same regardless of the economizer system installation. Due to the installation of the economizer, the total electric energy consumption used for cooling is 6799 kWh, which is a 2.5% increase compared to Case 1. In Case 3, only the electric energy used in the fan increases, and the district cooling energy and pump electric energy use decreases, as in the intermediate season. The total electricity consumption used for cooling is reduced by 17.7% when compared to Case 1 and by 19.7% when compared to Case 2.
Figure 11 shows the amount of electric energy used for cooling in the intermediate and cooling seasons. The total amount of electric energy for cooling in Figure 9 is under the assumption that a chiller with a coefficient of performance (COP) of 5 is used. Case 2 consumes 12,539 kWh/year for cooling. Compared with Case 1, installation of the economizer system can save 7.6% of electricity energy. The amount of electric energy in the cooling season is increased due to the installation of the economizer system, but the free-cooling effect of the economizer system reduces the electric energy in the intermediate season. For this reason, the total electric energy consumption for cooling is reduced. Case 3 consumes 9545 kWh/year of electricity for cooling is used during a year. Compared with Case 1, electric energy of 29.7% can be saved, and compared with Case 2, 23.9% of electric energy can be saved.
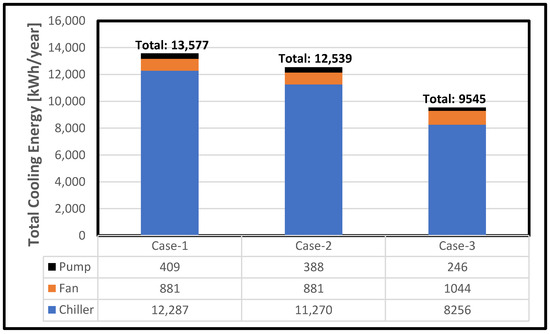
Figure 11.
Comparison of the total cooling energy consumption.
Figure 12 shows the cumulative time and hourly average cooling coil total cooling load per hour for each range of AHU-DAT in Case 3. For the analysis of the AHU-DAT in Case 3, the data were divided into five ranges. In Case 3, the AHU-DAT changes according to the cooling coil’s total cooling load. The cumulative time when the AHU-DAT is controlled by 15 °C is the maximum, and the cumulative time decreases in the order of 14, 16, 13, and 12 °C. Since AHU-DAT of Case 3 is usually controlled higher than the other two cases whereas AHU-DAT is fixed at 12 °C, the cooling load of the cooling coil is reduced, therefore reducing cooling energy consumption.
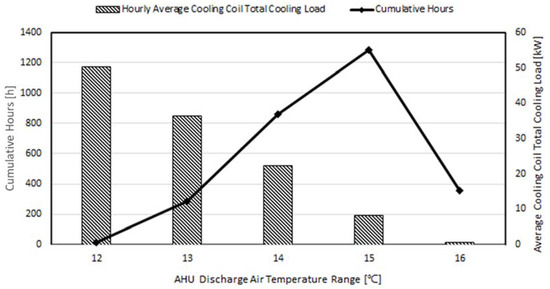
Figure 12.
Cumulative operation hours and hourly average cooling coil total cooling load in each AHU-DAT range.
4. Conclusions
In this research, an ANN prediction model is used to propose an optimal AHU-DAT control approach in an office building that implements differential dry-bulb temperature-based economizer control. The results of the study demonstrate that the AHU-DAT optimal control can lead to an additional cooling energy savings of approximately 23.9% in an office building with an economizer control within the temperature range of 12 to 16 °C. The installation of the economizer system showed a reduction in cooling energy consumption due to the free-cooling effect in the intermediate season; however, it resulted in increased cooling energy consumption in the summer season due to the higher enthalpy of the introduced outside air. When comparing the annual cooling energy consumption, the reduction of the cooling energy consumption in the intermediate seasons is larger than the increase in the cooling energy consumption in the summer season, resulting in annual cooling energy savings by installing the economizer system. Moreover, this research confirms that further cooling energy savings can be attained through optimal AHU-DAT control. Although this study focuses on hot and humid climates, future studies aim to analyze the change in cooling energy consumption via the installation of an economizer system and optimal control of AHU-DAT in different climate conditions. Furthermore, a future study will analyze an enthalpy-based economizer with the on/off control strategy.
Author Contributions
Conceptualization, Y.Y.; Methodology, Y.Y. and S.C.; Software, Y.Y. and B.S.; Formal analysis, Y.Y. and B.S.; Investigation, B.S. and S.C.; Writing—original draft, Y.Y. and B.S.; Writing—review & editing, Y.Y., B.S. and S.C.; Visualization, Y.Y.; Supervision, S.C. All authors have read and agreed to the published version of the manuscript.
Funding
This research received no external funding.
Data Availability Statement
Not applicable.
Conflicts of Interest
The authors declare no conflict of interest.
Nomenclature
| Abbreviations | |
| HVAC | Heating, ventilation, and air conditioning |
| ANN | Artificial neural network |
| ASHRAE | American Society of Heating, Refrigerating, and Air-Conditioning Engineers |
| AHU | Air-handling unit- |
| DAT | Discharge air temperature |
| USDOE | U.S. Department of Energy |
| VAV | Variable air volume |
| cv (RMSE) | Coefficient of variance of the root mean square error |
| COP | Coefficient of performance |
| OA | Outdoor air |
| MA | Mixed air |
| RA | Return air |
| Units | |
| m | Meter |
| m2 | Square meter |
| W/m2·K | Watts per square meter-Kelvin |
| kg/s | Kilogram per second |
| person/m2 | Number of people per square meter |
| W/m2 | Watts per square meter |
| °C | Degree Celsius |
| kJ/kg | Kilojoule per kilogram |
| % | Percentage |
| kWh | Kilowatt-hour |
| Symbol | |
| S | ANN model prediction value, |
| M | EnergyPlus simulation results |
| Ninterval | Number of EnergyPlus results |
| Aperiod | Measurement period average |
References
- EIA. Energy Consumption by Sector. Energy. 2015. Available online: http://www.eia.gov/totalenergy/data/monthly/pdf/sec2_3.pdf (accessed on 28 December 2020).
- Roth, K.W.; Westphalen, D.; Kieckmann, J. Energy Consumption Characteristics of Commercial Building HVAC Systems Volume III: Energy Savings Potential. In Building Technologies Program; TIAX LLC.: Cambridge, MA, USA, 2002. [Google Scholar]
- Lee, J.M.; Seo, B.M.; Hong, S.H.; Lee, K.H. Application of Artificial Neural Networks for Optimized AHU Discharge Air Temperature Set-point and Minimized Cooling Energy in VAV System. Appl. Therm. Eng. 2019, 153, 726–738. [Google Scholar] [CrossRef]
- Yeon, S.H.; Yu, B.; Seo, B.M.; Yoon, Y.B.; Lee, K.H. ANN Based Automatic Slat Angle Control of Venetian Blind for Minimized Total Load in an Office Building. Sol. Energy 2019, 180, 133–145. [Google Scholar] [CrossRef]
- Seo, B.M.; Yoon, Y.B.; Song, S.; Cho, S. ANN-based thermal load prediction approach for advanced controls in building energy systems. In Proceedings of the Conference for ARCC 2019 International Conference, Toronto, ON, Canada, 29 May–1 June 2019. [Google Scholar]
- Mba, L.; Meukam, P.; Kemajou, A. Application of artificial neural network for predicting hourly indoor air temperature and relative humidity in modern building in humid region. Energy Build. 2016, 121, 32–42. [Google Scholar] [CrossRef]
- Zhao, J.; Liu, X. A hybrid method of dynamic cooling and heating load forecasting for office buildings based on artificial intelligence and regression analysis. Energy Build. 2018, 174, 293–308. [Google Scholar] [CrossRef]
- Chae, Y.T.; Horesh, R.; Hwang, Y.; Lee, Y.M. Artificial neural network model for forecasting sub-hourly electricity usage in commercial building. Energy Build. 2016, 111, 184–194. [Google Scholar] [CrossRef]
- Ding, Y.; Zhang, Q.; Yuan, T. Research on short-term and ultra-short-term cooling load prediction models for office buildings. Energy Build. 2017, 154, 254–267. [Google Scholar] [CrossRef]
- Luo, X.J. A novel clustering-enhanced adaptive artificial neural network model for predicting day-ahead building cooling demand. J. Build. Eng. 2020, 32, 101504. [Google Scholar] [CrossRef]
- Nasruddin; Scholahudin; Satrio, P.; Mahlia, T.M.I.; Giannetti, N.; Saito, K. Optimization of HVAC system energy consumption in a building using artificial neural network and multi-objective genetic algorithm. Sustain. Energy Technol. Assess. 2019, 35, 48–57. [Google Scholar]
- Yilmaz, S.; Atik, K. Modeling of a mechanical cooling system with variable cooling capacity by using artificial neural network. Appl. Therm. Eng. 2007, 27, 2308–2313. [Google Scholar] [CrossRef]
- Moon, J.W.; Kim, K.; Min, H. ANN-based prediction and optimization of cooling system in hotel rooms. Energies 2015, 8, 10775–10795. [Google Scholar] [CrossRef]
- Jani, D.B.; Mishra, M.; Sahoo, P.K. Performance prediction of solid desiccant–vapor compression hybrid air-conditioning system using artificial neural network. Energy 2016, 103, 618–629. [Google Scholar] [CrossRef]
- Ezzeldin, S.; Rees, S.J. The potential for office buildings with mixed-mode ventilation and low energy cooling systems in arid climates. Energy Build. 2013, 65, 368–381. [Google Scholar] [CrossRef]
- Hong, G.; Kim, C.; Hong, J. Energy Conservation Potential of Economizer Controls Using Optimal Outdoor Air Fraction Based on Field Study. Energies 2020, 13, 5038. [Google Scholar] [CrossRef]
- Lee, K.; Chen, H. Analysis of energy saving potential of air-side free cooling for data centers in worldwide climate zones. Energy Build. 2013, 64, 103–112. [Google Scholar] [CrossRef]
- Yao, Y.; Wang, L. Energy analysis on VAV system with different air-side economizers in China. Energy Build. 2010, 42, 1220–1230. [Google Scholar] [CrossRef]
- Chowdhury, A.A.; Rasul, M.G.; Khan, M.M.K. Modelling and Analysis of Air-Cooled Reciprocating Chiller and Demand Energy Savings Using Passive Cooling. Appl. Therm. Eng. 2009, 29, 1825–1830. [Google Scholar] [CrossRef]
- Wang, G.; Song, L. An energy performance study of several factors in aireconomizers with low-limit space humidity. Energy Build. 2013, 64, 447–455. [Google Scholar] [CrossRef]
- Yiu, J.; Wang, S.; Yik, F.W.H. Assessment of practical applications of outdoor air economiser in Hong Kong. Build. Serv. Eng. 2000, 21, 187–198. [Google Scholar] [CrossRef]
- Bulut, H.; Aktacir, M.A. Determination of free cooling potential: A case study for Istanbul, Turkey. Appl. Energy 2011, 88, 680–689. [Google Scholar] [CrossRef]
- The U.S. DOE. Getting Started. In EnergyPlus, Version 9.1.0 Documentation; The U.S. DOE: Washington, DC, USA, 2019. [Google Scholar]
- The U.S. DOE. EnergyPlus Engineering Reference. In The Reference to EnergyPlus Calculations, Version 9.1; The U.S. DOE: Washington, DC, USA, 2019. [Google Scholar]
- Seo, B.M.; Lee, K.H. Detailed analysis on part load ratio characteristics and cooling energy saving of chiller staging in an office building. Energy Build. 2016, 119, 309–322. [Google Scholar] [CrossRef]
- OpenStudio Official Hompage. Available online: https://nrel.github.io/OpenStudio-user-documentation/help/finding_model_data/ (accessed on 28 December 2020).
- Lim, S.H. A Study on the Energy Efficient Control Strategies of Outdoor Air Introduction in Office Building. Ph.D. Thesis, Konkuk University, Seoul, Republic of Korea, 2002. [Google Scholar]
- Rashid, T. Make Your Own Neural Network; CreateSpace Independent Publishing Platform: North Charleston, SC, USA, 2016. [Google Scholar]
- ASHRAE. Guideline 14-2014; Measurement of Energy and Demand Savings; American Society of Heating, Refrigerating, and Air Conditioning Engineers: Atlanta, Georgia, 2014. [Google Scholar]
- Seo, B.M.; Yoon, Y.B.; Moon, J.H.; Cho, S. Application of Artificial Neural Network for the Optimum Control of HVAC Systems in Double-Skinned Office Buildings. Energies 2019, 24, 4754. [Google Scholar] [CrossRef]
Disclaimer/Publisher’s Note: The statements, opinions and data contained in all publications are solely those of the individual author(s) and contributor(s) and not of MDPI and/or the editor(s). MDPI and/or the editor(s) disclaim responsibility for any injury to people or property resulting from any ideas, methods, instructions or products referred to in the content. |
© 2023 by the authors. Licensee MDPI, Basel, Switzerland. This article is an open access article distributed under the terms and conditions of the Creative Commons Attribution (CC BY) license (https://creativecommons.org/licenses/by/4.0/).