Abstract
Due to the expansion of the education industry in Dubai, universities have built many dormitories. Even though Dubai has a robust indoor air quality (IAQ) stipulation for public and educational buildings, dormitories must be included. IAQ in newly constructed university dormitories can be significantly influenced by emissions from furniture made from materials such as plywood, medium-density fiberboard (MDF), or particle board (PB) that contains formaldehyde (HCHO). This study aimed to investigate and improve the IAQ in a newly constructed university dormitory. As a methodology, the study measured the concentrations of total volatile organic compound (TVOC) and HCHO in three identical rooms on different floors of a newly constructed dormitory. The experiment results showed that TVOC and HCHO were generally high, ranging from 0.23 to 18.4 ppm, up to two months after in the new dormitory, but they tended to decrease over time. The two primary factors contributing to the decrease in these pollutants were increased ventilation and reduced occupancy. Comparing the three rooms provided valuable insights into the factors influencing indoor air quality, such as the amount of infiltration through the window gaps, cooling temperatures, and humidity. The study suggests that the air quality in indoor environments can be improved by increasing ventilation, reducing occupancy, and managing the use of household items that emit pollutants. The findings can inform strategies to enhance building IAQ, promoting occupant health and well-being. From these findings, TVOC concentrations in room 1A decreased from 6.57 ppm at the first measurement to 0.13 ppm at the third measurement, while room 3B showed a decrease from 18.4 ppm to 1.16 ppm, and room 5C showed a decrease from 12.5 ppm to 0.93 ppm. HCHO concentrations also decreased, with room 1A decreasing from 2.56 ppm to 0.22 ppm, room 3B decreasing from 4.50 ppm to 2.82 ppm, and room 5C decreasing from 6.88 ppm to 2.15 ppm over the same period.
1. Introduction
A university dormitory is a residential system accommodating students pursuing higher education [1,2]. Due to the limited living space in these facilities, it is expected that the indoor air quality (IAQ) in dormitories will be significantly influenced by emissions from the furniture [3,4]. This expectation is particularly true for newly constructed dormitories where new furniture is commonly utilized, exacerbating the impact on IAQ [5,6,7,8]. Furthermore, the prefabricated furniture in these dormitories is often constructed using plywood, medium-density fiberboard (MDF), or particle board (PB), made by bonding small wood or fiber pieces to create large panels. Formaldehyde (HCHO) is used in the adhesive processes for these wood products, and it can adversely affect IAQ [9,10,11].
The impact of IAQ on human health and productivity has been widely studied in various building types [12,13]. In school buildings, poor IAQ has been shown to lead to increased absenteeism, reduced cognitive performance, and respiratory issues among students [14]. Other research has demonstrated the importance of IAQ in the workplace, as it can affect employee productivity and overall well-being [15]. As dormitories accommodate students for extended periods, it is crucial to address IAQ issues in these environments to ensure students’ well-being and academic success [12].
In 2013, the Public Health and Safety Department of Dubai Municipality initiated an assessment of IAQ in public buildings, including educational institutions, universities, schools, nurseries, kindergartens, and healthcare centers [16,17,18]. As a result, a strict IAQ stipulation was established, which mandates that HCHO levels should not exceed 0.08 ppm (parts per million), total volatile organic compound (TVOC) levels should not exceed 300 micrograms/m3, and suspended particulates (less than 10 microns) should not exceed 150 micrograms/m3 during 8 h of continuous monitoring before occupancy [19,20,21]. Dormitories are classified as educational institutions or universities under this IAQ regulation, effective 1 January 2016 [22]. However, despite this regulatory framework, the management of IAQ in dormitories still needs to be improved in practice since housing and educational facilities are two different building types [23,24].
The body of research related to university dormitories has primarily focused on architectural planning and space design, living behaviors, and facility conditions [25,26]. A limited number of studies have investigated IAQ in university dormitories, with some examining the effects of ventilation systems on IAQ [27]. Other research has explored the impacts of pollutant sources on dormitory IAQ, identifying factors that contribute to poor air quality [28]. Consequently, there needs to be more understanding regarding the IAQ conditions in newly built university dormitories [29]. The research gap lies in the limited understanding of IAQ conditions in newly built university dormitories. While existing research has addressed architectural planning, space design, living behaviors, and facility conditions in dormitories [25,26], only a few studies have investigated IAQ in these settings [27,28]. Furthermore, research on IAQ in university dormitories has been confined to only three dormitories constructed in different time frames [30].
The novelty of this study is the investigation of IAQ in a newly constructed university dormitory, which has not been extensively explored in previous research. To address the identified research gap, this study aims to measure the concentrations of TVOC and HCHO in the dormitory, identifying the concentration levels and contributing factors of TVOC and HCHO in university dormitories. By doing so, this study will provide valuable insights that can inform strategies to improve IAQ in newly built dormitories, ultimately promoting students’ well-being and academic success.
2. Materials and Methods
The present study entailed conducting on-site measurements to evaluate the actual levels of HCHO and VOCs in newly renovated studio-type rooms at a female dormitory constructed in 2016 at Ajman University in the United Arab Emirates (UAE) [31]. The measurements were conducted after the occupants’ relocation to the dormitory (Table 1) [32].

Table 1.
Overview of Research Methods.
The focus of the measurements was the female dormitory (Figure 1) at Ajman University, with each of the lower, middle, and upper floors targeted, provided that the occupants consented to participate in the study (Figure 2) [33,34]. In selecting the studio-type rooms (Figure 3) to be measured, two factors were considered: the status of new renovation with new building materials and the occupants’ willingness to participate in the study [35,36,37].
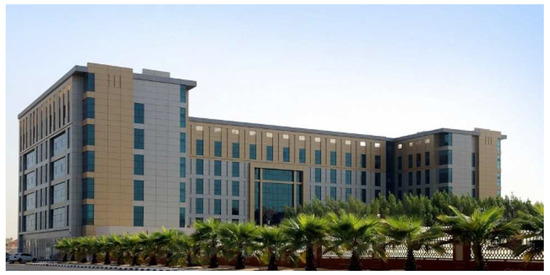
Figure 1.
Female Dormitory at Ajman University.
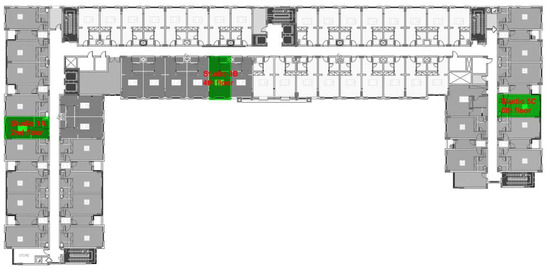
Figure 2.
Three Measured Units in the Typical Plan of the Female Dormitory.
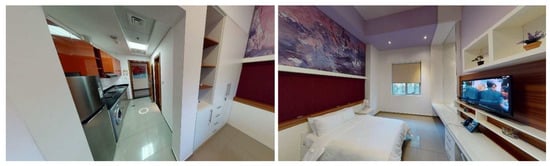
Figure 3.
Studio-type Rooms in the Female Dormitory.
Measurements were taken for the three selected newly renovated rooms at 4-week intervals following the occupants’ move-in. The second measurement was conducted approximately 3–4 weeks after the first, and the third was performed after 8 eight weeks [38,39]. The measurement procedure and methodology adhered to the IAQ test method outlined in the indoor air quality fair test standard and followed the guidelines stipulated by the WHO for IAQ regulations [40]. Ventilation was maintained for the first 30 min (8:30 to 9:00 a.m.) and subsequently for 5 h (9:00 a.m. to 2:00 p.m.), after which measurements were taken between 2:00 p.m. and 5:00 p.m. [41,42]. Although measures were obtained after the occupants’ move-in, the measurement process was conducted in the absence of most residents on the measurement day [43]. However, in line with the WHO IAQ regulations, samples are typically collected twice for 30 min between 1:00 and 5:00 p.m., with 20 measurements taken at 10-min intervals over 3 h [44]. The field measurement data obtained from the TVOC and HCHO measurements were compiled into tables for each room. Then, the factors influencing VOC concentrations were analyzed by comparing the data across measurement periods and spaces [45,46,47].
Sick building syndrome (SBS), a condition primarily attributed to HCHO and volatile VOCs emitted from building materials, has garnered significant attention from researchers over the past decade [48,49,50]. The symptoms of SBS are numerous and include irritation of the eyes, nose, and throat; headaches; lethargy; difficulty concentrating; and in some cases, dizziness, nausea, and chest tightness [51,52,53]. A comprehensive overview of the effects of each hazardous substance on the human body is presented in Table 2.
Table 2.
The Effects of Hazardous Substances on the Human Body.
The release of hazardous chemicals, such as HCHO and VOCs, is commonly observed in buildings constructed or refurbished with substandard materials, including adhesives, varnishes, paints, and tiles [54,55,56]. Even at low concentrations, these chemicals can significantly impact human health [57]. The emission of HCHO is attributed to materials, such as wood, plywood, and furniture, whereas VOCs are typically released by textile products and household appliances, as highlighted in Table 3 [58,59].
Table 3.
Hazardous Substance Sources and Pollutants.
Table 4 provides a comprehensive overview of the IAQ standards established by the most advanced countries worldwide, detailing the respective regulations [60,61]. In compliance with the World Health Organization’s (WHO) guidelines, the standards also specify the average exposure time, offering a detailed perspective on the guidelines based on the exposure duration [62,63]. The Air Quality Guidelines for Europe, which align with the WHO standards, were established in 1987 [64]. Similarly, in the United States, the Environmental Protection Agency (EPA) and the American Society of Heating, Refrigerating, and Air Conditioning Engineers (ASHRAE) have set ventilation regulations aimed at maintaining optimal indoor air quality [65,66].
Table 4.
Global Standards for Indoor Air Quality.
3. Results
3.1. Characteristics of the Target Rooms
The characteristics of the targets are shown in Table 5, and the targets were three renovated rooms at different locations in the female dormitory completed in January 2016 [61]. The building structure is reinforced concrete, and the cooling system is a central air-conditioning system that can be individually controlled for each room [67]. However, there is no ventilation system present aside from the windows.
Table 5.
Characteristics of Target Rooms.
The on-site measurements were conducted in a studio-type measurement room, and each room contains a bathroom and kitchen facilities [68,69]. The ceiling is finished with gypsum board tiles, the walls are covered with paint and wood tiles, and the floor is adorned with marble tile flooring. The bed is of the independent type, and the desk, chair, and wardrobe are of the built-in type. We inquired about these furniture and finishing materials based on the building materials-related system, specifically seeking information on environmentally friendly products and harmful substance emissions levels [70,71,72]. However, the construction company’s employees could not provide us with the required details [73]. As an alternative approach, we contacted the furniture company directly and requested specific information from it [74,75,76]. Regrettably, we are still awaiting a response from the furniture company.
3.2. The Results of On-Site Measurements
The field measurement results and influencing factors are presented in Table 6 [77]. It was observed that the concentrations of TVOC and HCHO outside were negligible, confirming the absence of chemical pollutants in the outdoor environment [78].
Table 6.
On-site Measurements Results.
3.2.1. Room 1A
On the second floor, facing northwest, is room 1A, with aluminum-framed windows that were observed to have a small amount of wind leakage. Additionally, the room’s location on the lower floor obstructs sunlight due to landscaping trees outside the window.
The first measurement was conducted 1 week after the room’s occupancy. The resident ventilated the space twice per week by opening half of the window and allowing ventilation for an hour. At the time of measurement, the room temperature ranged from 21.7 to 22.2 °C, with an average of 22.0 °C; the relative humidity ranged from 37 to 40%, with an average of 39%; and only one occupant was present. As a result, the TVOC concentration observed in the room was between 6.14 to 7.03 ppm, with an average of 6.57 ppm (26.8 µg/m3). Furthermore, the HCHO concentration measured in the room was between 2.30 to 3.01 ppm, with an average of 2.57 ppm, approximately 32.1 times higher than the recommended standard of 0.08 ppm set by the UAE.
After an interval of 4 weeks from the initial measurement, a subsequent evaluation was conducted. During this period, the occupants intermittently opened one-half of all the windows three to four times per week for 2–3 h each. At the time of the second measurement, the ambient temperature within the room ranged from 22.7 to 23.3 °C, averaging 23.2 °C; and the relative humidity ranged from 38 to 39%, averaging 38.2%. The room housed only one occupant. The TVOC concentration measured between 0.63 to 0.76 ppm, averaging at 0.69 ppm (2.82 µg/m3). The HCHO concentration measured between 0.26 and 0.42 ppm, averaging 0.32 ppm. This concentration was almost 3.9 times the recommended limit.
Following the second measurement, a third round of evaluation was conducted after a 4-week interval. During this period, the resident consistently ventilated the room by intermittently opening one-half to all the windows five to six times per week throughout the day. At the time of the third measurement, the ambient temperature in the room ranged between 22.9 to 23.1 °C, averaging 23.0 °C. The relative humidity ranged from 45 to 48%, averaging 46%, with only one occupant present. The TVOC concentration measured between 0.10 and 0.17 ppm, averaging 0.13 ppm (0.53 µg/m3). The HCHO concentration measured 0.17 to 0.32 ppm, averaging 0.22 ppm. This concentration was about 2.7 times the recommended limit in the UAE.
3.2.2. Room 3B
Room 3B is located on the fourth floor facing southwest. The initial measurement was conducted one week after moving in. During that week, the residents ventilated the room four times by opening a quarter of the window for 30-min intervals. At the time of measurement, the ambient temperature ranged between 24.0 and 25.3 °C, with an average of 24.7 °C, while the relative humidity was recorded between 36% and 47%, with an average of 42%. Only one occupant was present during the measurement period, and the cooling system was set at a higher temperature, contributing to the higher ambient temperature. The TVOC concentration was measured at 16.6 to 20.0 ppm, with an average of 18.4 ppm (15.4 µg/m3). The concentration of HCHO ranged from 3.86 to 5.23 ppm, with an average of 4.50 ppm, exceeding the UAE standard value of 0.08 ppm by about 56 times.
Following the initial evaluation, a second measurement was conducted after 3 weeks. During this period, the occupants ventilated the room by opening windows halfway or fully four to five times per week for 2–3 hours each time. The ambient temperature during the measurement was observed to be between 21.0 and 21.6 °C, with an average of 21.3 °C, while the relative humidity was recorded between 43% and 49%, with an average of 46%. At the start of the measurement, only one occupant was present. The TVOC concentration was determined to be 3.64 to 3.88 ppm, with an average of 3.76 ppm (15.4 µg/m3). The concentration of HCHO ranged from 2.26 to 2.89 ppm, with an average of 2.59 ppm, which is approximately 32 times higher than the recommended standard.
The third measurement was conducted 5 weeks after the second assessment. During this period, residents ventilated the room by opening windows halfway or fully 4–5 times per week for 5–6 hours each time. At the time of measurement, the ambient temperature ranged between 22.0 and 22.5 °C, with an average of 22.3 °C, while the relative humidity was recorded between 55% and 57%, with an average of 56%. Only one occupant was present during the measurement.
Before the measurement commenced, a strong perfume smell was present in the room, persisting despite the ventilation. Upon inquiry, the resident revealed that she regularly utilized fabric deodorants and perfumes. It is essential to elaborate on the possible impact of these products on the recorded air quality measurements. Perfumes and fabric deodorants contain volatile organic compounds (VOCs), which can contribute to increased indoor TVOC concentrations [1,2]. As these products were regularly used in the room, it is possible that they significantly influenced the elevated TVOC levels observed during the measurements.
The TVOC concentration ranged from 0.99 to 1.28 ppm, with an average of 1.16 ppm (4.7 µg/m3). The concentration of HCHO was measured to be between 2.68 and 2.98 ppm, with an average of 2.82 ppm. This value exceeded the recommended standard in the UAE by approximately 35 times, indicating that additional sources of HCHO, such as furniture off-gassing, could also be present. However, it is essential to consider that the regular use of perfumes and fabric deodorants may have contributed to the elevated TVOC and HCHO concentrations observed in this measurement.
3.2.3. Room 5C
Room C is located on the 11th floor, facing southeast, and it benefits from unobstructed sunlight. The first measurement was taken a week after move-in, during which the residents opened half of the window each day for a week, ventilating the room for 30 min to 1 h. At the time of measurement, the room temperature was 22.5 to 22.8 °C (average 22.6 °C), relative humidity was 59 to 63% (average 61%), and one occupant was in the room with a wet towel drying. The TVOC concentration was between 11.2 to 13.7 ppm, with an average of 12.5 ppm (51.1 µg/m3). The concentration of HCHO was between 6.46 to 7.21 ppm, with an average of 6.89 ppm, which is approximately 86 times higher than the recommended standard.
The second measurement was conducted 3 weeks after the first, during which the residents opened the windows 5–6 times per week for 2–3 h each time. At the time of measurement, the room temperature was 21.6 to 21.8 °C (average 21.7 °C), relative humidity was 49 to 51% (average 50%), and one occupant was in the room. The TVOC concentration was between 3.77 to 4.40 ppm, with an average of 4.12 ppm (16.8 µg/m3). The concentration of HCHO was between 2.42 to 3.04 ppm, with an average of 2.67 ppm, which is approximately 8.9 times higher than the recommended standard.
The third measurement was conducted 5 weeks after the second measurement. The residents continued ventilating the room during the day by opening the windows 5–6 times per week. At the time of measurement, the room temperature was 23.4 to 23.8 °C (average 23.6 °C), relative humidity was 51 to 58% (average 55%), and one occupant was in the room. The TVOC concentration was between 0.75 to 1.10 ppm, with an average of 0.93 ppm (3.8 µg/m3). The concentration of HCHO was between 1.94 to 2.38 ppm, with an average of 2.15 ppm, which is approximately seven times higher than the recommended standard.
3.2.4. Comparison between Measurement Periods
The results for TVOC and HCHO among the first, second, and third measurements showed a significant decrease in concentration levels over time in all three rooms. For example, in room 1A, the TVOC concentration decreased from 6.57 ppm to 0.13 ppm, and the HCHO concentration decreased from 2.56 ppm to 0.22 ppm over 8 weeks. This significant reduction may be due to increased ventilation and the absence of occupants in the room during the third measurement (Figure 4).
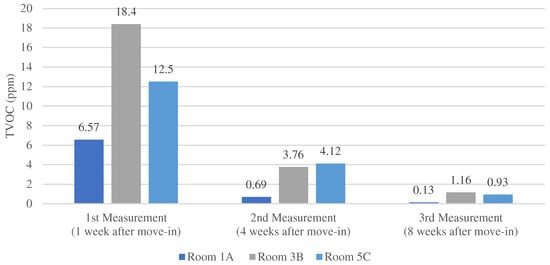
Figure 4.
Comparison of TVOC Concentration Measurement Periods and Rooms.
Similarly, in room 3B, the TVOC concentration decreased from 18.4 ppm to 1.16 ppm, and the HCHO concentration decreased from 4.50 ppm to 2.82 ppm over 8 weeks. In addition, the degree of ventilation increased in this room, and the number of occupants decreased from 1 to 0 during the second measurement.
In room 5C, the TVOC concentration decreased from 12.5 ppm to 0.93 ppm, and the HCHO concentration decreased from 6.88 ppm to 2.15 ppm over 8 weeks. The degree of ventilation remained the same, but the number of occupants decreased from 1 to 0 during the third measurement. Overall, the results suggest increased ventilation and reduced occupancy can significantly decrease TVOC and HCHO in indoor environments (Figure 5).
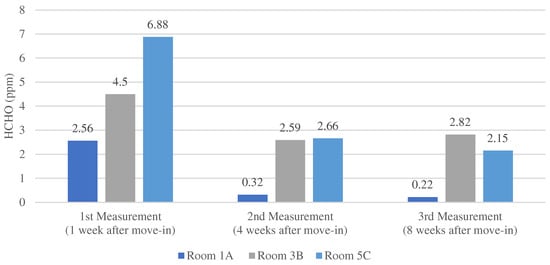
Figure 5.
Comparison of HCHO Concentration Measurement Periods and Rooms.
3.2.5. Comparison among Room 1A, Room 3B, and Room 5C
The present study compared the concentrations of TVOC and HCHO in three measurement rooms (1A, 3B, and 5C) located on the first, third, and fifth floors. These rooms were ventilated and occupied on the same day after moving in. The finishes and furnishings in these rooms were identical.
As shown in Table 6, the first measurement showed that the TVOC concentration was the lowest in room 1A, followed by rooms 5C and 3B. However, when comparing the degree of ventilation from move-in to the first measurement, it was found that room 5C had the most ventilation, followed by rooms 1A and 3B. This finding suggests that factors other than ventilation by residents may have influenced the low TVOC concentration in room 1A. In addition, the amount of infiltration through the window gap was also considered a potential factor affecting the TVOC concentration due to the significant indoor and outdoor temperature differences during the winter weather in Dubai at the time of completion.
In room 3B, the highest TVOC concentration was observed, which could be attributed to the highest heating temperature (about 21.3–24.7 °C) among the three rooms. This factor increased the amount of TVOCs released, while the ventilation was the least in room 3B. On the other hand, the concentration of HCHO was the lowest in room 1A, followed by rooms 3B and 5C, which could be due to factors similar to TVOC.
In the second measurement, the TVOC concentration was the lowest in room 1A, followed by rooms 3B and 5C. Room 3B exhibited the highest TVOC reduction compared to the first measurement. The highest heating temperature during the first measurement could explain the increase in TVOC concentration in room 3B.
The study observed that the concentration of HCHO was the lowest in room 1A, followed by rooms 3B and 5C, in the same order as the first measurement. Finally, the decrease in HCHO concentration was observed in the order of room 5C, room 1A, and room 3B. Room 5C, which had the highest concentration of HCHO during the first measurement, exhibited the most significant decrease, which can be attributed to increased ventilation. The high humidity in room 5C during the first measurement could have resulted in the release of a considerable amount of HCHO, which then decreased due to increased ventilation.
In the third measurement, TVOC and HCHO were the lowest in room 1A, followed by rooms 5C and 3B. In room 5C, which had the highest degree of ventilation, the decrease in TVOC and HCHO was more significant in the third and second measurements. However, in room 3B, the concentration of HCHO increased more during the third measurement than during the second measurement. The study also observed a perfume odor during the measurement in room 3B, and interviews with residents revealed that they frequently used perfume and fabric deodorants. This fact could be attributed to cosmetics, shampoos, disinfectants, and other household items potentially being indoor sources of HCHO.
Overall, the study suggests that the factors influencing the concentration of TVOC and HCHO include the amount of ventilation, infiltration, cooling temperature, humidity, and the use of household items. The comparison among the three rooms in the same building, with the same finishing materials and furniture, provides valuable insights into the impact of these factors on indoor air quality. These findings can inform strategies to improve indoor air quality and promote occupant health in buildings.
4. Discussion
The results of our study demonstrate a significant decrease in TVOC and HCHO concentrations over time in all three rooms, with increased ventilation and reduced occupancy being the two main factors contributing to the reduction in these pollutants. In particular, our findings suggest that, when the degree of ventilation increased, and the number of occupants decreased, the TVOC and HCHO concentrations decreased significantly.
These findings are critical considering the importance of IAQ in university dormitories. Research has shown that poor IAQ is linked to increased absenteeism, reduced cognitive performance, and respiratory issues among students in school buildings [14]. Likewise, IAQ can impact the well-being and academic success of students living in dormitories for extended periods [12]. Therefore, it is crucial to address IAQ issues in dormitories.
The high initial concentrations of HCHO observed in our study can be explained by the dormitory being newly constructed, and the prefabricated furniture used in these dormitories is often built using materials containing HCHO in their adhesives [9,10,11]. This fact highlights the need for adherence to IAQ regulations, such as those established by the Public Health and Safety Department of Dubai Municipality, which mandate HCHO levels not exceeding 0.08 ppm and TVOC levels not exceeding 300 micrograms/m3 [19,20,21].
Previous research on university dormitories has mainly focused on architectural planning, space design, living behaviors, and facility conditions [25,26]. Limited studies have investigated IAQ in university dormitories, with some examining the effects of ventilation systems on IAQ [27] and others identifying factors contributing to poor air quality [28]. Our study contributes to addressing this gap by investigating the IAQ in a newly constructed dormitory, focusing on TVOC and HCHO concentrations.
The results of this study provide valuable insights into the factors affecting IAQ in university dormitories, including ventilation, occupancy, temperature, and humidity. These findings emphasize the importance of improving IAQ in university dormitories to ensure students’ well-being and academic success.
Future research should continue to explore IAQ in university dormitories, investigating the long-term effects of interventions such as increased ventilation and reduced occupancy, as well as the impact of other factors, such as building materials, outdoor air pollution, and seasonal variations on IAQ. Additionally, studies investigating the effectiveness of specific interventions, such as air purifiers or low-emission building materials, could further optimize IAQ in university dormitories and other residential settings.
5. Conclusions
This study aimed to improve indoor air quality and reduce sick house syndrome in newly constructed dormitories. The concentrations of TVOC and HCHO were measured three times—1 week, 4 weeks, and 8 weeks after the residents moved in—in three identical rooms. In addition, the relationship between the actual conditions and living factors was analyzed, and the following results were obtained.
TVOC and HCHO were generally high, ranging from 0.23 to 6.89 ppm, up to 2 months after moving into the new dormitory. Subsequently, the concentrations exceeded the recommended standard but tended to decrease over time. The factors influencing the concentration of TVOC and HCHO were ventilation, including the amount of infiltration; heating temperature; humidity; and the use of household items.
Based on these results, several suggestions can be made. First, the dormitory supplier should refrain from using pollutant-emitting building materials that significantly exceed the recommended standard. The constructor should also plan the process to allow sufficient ventilation before the students move in. Second, the dormitory operator needs to raise awareness among students about the harmful effects of chemical pollutants and the importance of ventilation. Students tend to overlook the importance of ventilation, which can lead to SBS symptoms. Third, although dormitories are subject to VOC measurements after students move in, unlike other educational institutions and healthcare centers, it is necessary to impose compulsion. In other words, it is proposed to institutionalize the suspension of use approval when the recommended standards still need to be met by including dormitories in the Dubai IAQ stipulation.
Overall, this study provides valuable insights into the impact of various factors on indoor air quality in dormitories. These findings can inform strategies to improve indoor air quality and promote occupant health in buildings.
This study focused on the effects of various substances on the human body under controlled conditions maintained consistently across three rooms in Dubai. Experiments were conducted during one period to account for potential seasonal variations. By maintaining these standardized conditions, the experiment aimed to reduce the impact of external factors, such as air quality, humidity, and high temperatures, on its results. However, the research limitations include the lack of real-time air quality, humidity, and temperature measurements and the restricted focus on the January to March period. Future studies could further explore the impact of external factors on building ventilation and human health by incorporating real-time measurements and monitoring in various geographical locations. Doing so would help to provide a more comprehensive understanding of the interaction between these factors and the effects of various indoor air substances on human health. Additionally, expanding research to cover the remaining three periods of the year would capture potential seasonal variations, contributing to a complete understanding of the annual trends and impacts on human health.
Author Contributions
All authors contributed significantly to this study. C.J. and G.E.S. identified and secured the example buildings used in the study. The data acquisition system and installations of the sensors were designed and installed by C.J. and G.E.S. G.E.S. was responsible for the data collection. Data analysis was performed by C.J. The manuscript was compiled by C.J. and reviewed by G.E.S. All authors have read and agreed to the published version of the manuscript.
Funding
This research received no external funding.
Data Availability Statement
New data were created or analyzed in this study. The data will be shared upon request and consideration of the authors.
Acknowledgments
The authors would like to express their gratitude to Ajman University for APC support and to the Healthy & Sustainable Built Environment Research Center at Ajman University for providing an excellent research environment.
Conflicts of Interest
The authors declare no conflict of interest.
References
- Kim, J.; Kwon, J.; Lee, K. Impact of indoor environmental quality on students’ productivity in university dormitories. Sustainability 2019, 11, 517. [Google Scholar]
- Lee, S.H.; Yoo, S.Y.; Kim, H.S. Analysis of indoor environment quality and its impact on sick building syndrome in dormitories of a Korean university. Build. Environ. 2014, 80, 145–152. [Google Scholar]
- Xu, M.; Shen, X.; Zhang, J.; Qian, X. Investigation of VOCs emission characteristics of furniture used in university dormitories. Indoor Built Environ. 2021, 30, 432–443. [Google Scholar]
- Huang, R.; Chen, Y.; Yu, Y. Impact of furniture emissions on indoor air quality in a university dormitory. J. Environ. Sci. 2019, 81, 146–155. [Google Scholar]
- Wang, T.; Zhang, J.; Cheng, H.; Wu, W. Influence of new furniture on the indoor air quality of a university dormitory room. Int. J. Environ. Res. Public Health 2016, 13, 499. [Google Scholar]
- He, Q.; Sun, W. Investigation of the indoor air quality of a newly constructed university dormitory in China. Indoor Built Environ. 2017, 26, 1049–1056. [Google Scholar]
- Li, H.; Liu, Y.; Zhang, L.; Wang, W.; Li, Y. VOC emission characteristics and IAQ evaluation for university dormitory room with new decoration materials. Indoor Air 2018, 28, 900–913. [Google Scholar]
- Jung, C.; Al Qassimi, N. Investigating the emission of hazardous chemical substances from mashrabiya used for indoor air quality in hot desert climate. Sustainability 2022, 14, 2842. [Google Scholar] [CrossRef]
- Jia, Y.; Zhang, J.; Gao, J. Characteristics of formaldehyde emission from prefabricated wood-based furniture and influence of temperature and humidity. Int. J. Environ. Res. Public Health 2019, 16, 456. [Google Scholar]
- Liu, X.; Li, Z.; Zhao, Y. The release of formaldehyde from medium density fiberboard and plywood used in Chinese typical furniture and the corresponding influencing factors. J. Clean. Prod. 2017, 165, 707–715. [Google Scholar]
- Leith, D.; Hargreaves, M.; Parsonage, B. Indoor air quality and thermal comfort in student halls of residence. Build. Environ. 2016, 106, 61–69. [Google Scholar]
- Yang, W.; Zhu, Y.; Zhang, M.; Zhang, Y.; Chen, Z.; Yao, Y. Study on the effects of indoor environmental quality in dormitory buildings on occupants’ satisfaction: A university case study in China. Build. Environ. 2022, 203, 109434. [Google Scholar] [CrossRef]
- Salthammer, T.; Uhde, E.; Schripp, T.; Schieweck, A.; Morawska, L.; Mazaheri, M.; Clifford, S.; He, C.; Buonanno, G. Children’s well-being at schools: Impact of climatic conditions and air pollution. Build. Environ. 2015, 92, 196–207. [Google Scholar] [CrossRef] [PubMed]
- Kim, D.; Kim, D.; Yeo, M. Indoor air quality in mechanically ventilated school buildings depending on the outdoor air control method: Case study of five primary schools in South Korea. Atmosphere 2022, 13, 1941. [Google Scholar] [CrossRef]
- Zheng, J.; Gao, Y.; Zhang, Y.; Fang, Z.; Wang, H.; Zhao, Z.; He, Y.; Liu, S.; Zou, Y.; Zhu, T.; et al. Effects of an air filtration system on absenteeism and learning performance in a high school: A short communication. Build. Environ. 2018, 138, 102–106. [Google Scholar] [CrossRef]
- Jung, C.; Awad, J. The improvement of indoor air quality in residential buildings in Dubai, UAE. Buildings 2021, 11, 250. [Google Scholar] [CrossRef]
- Awad, J.; Jung, C. Evaluating the indoor air quality after renovation at the Greens in Dubai, United Arab Emirates. Buildings 2021, 11, 353. [Google Scholar] [CrossRef]
- Arar, M.; Jung, C.; Qassimi, N.A. Investigating the influence of the building material on the indoor air quality in apartment in Dubai. Front. Built Environ. 2022, 7, 804216. [Google Scholar] [CrossRef]
- Guo, Z.; Cheng, X.; Zhang, L. Measurement and evaluation of indoor air quality in a new test building with different ventilation methods. Int. J. Environ. Res. Public Health 2015, 12, 7422–7439. [Google Scholar]
- Prasad, B.; Kumar, R.; Srivastava, A.; Joshi, H.M. Indoor air quality assessment in selected government buildings of Nainital, India. Indoor Built Environ. 2015, 24, 789–795. [Google Scholar]
- Shen, Y.; Li, F.; Cao, J.; Li, X.; Li, B.; Li, J. Particle size distribution and indoor particle-related exposure assessment in university classrooms. Build. Environ. 2015, 94, 852–861. [Google Scholar]
- Huang, Y.; Lin, J.; Lai, C. A study of indoor environmental quality in student dormitories in Taiwan. Sustainability 2016, 8, 927. [Google Scholar]
- Li, J.; Lu, X.; Chen, C.; Chen, J. Application of spatial interpolation methods to assess indoor air quality in dormitory rooms. Build. Environ. 2016, 106, 28–38. [Google Scholar]
- Niu, J.; Wei, X.; Wang, S.; Lin, Z.; Cai, C.; Fu, F. Survey on indoor air quality in student dormitories in universities in Hefei, China. Build. Environ. 2021, 194, 107633. [Google Scholar]
- Ebeid, M.E.; Mostafa, M.M.; El-Salam, M.M.A. Indoor air quality and occupants’ satisfaction in university dormitory rooms. Build. Environ. 2018, 133, 57–65. [Google Scholar]
- Kapsalaki, P.; Tsakalof, A.; Vasilatos, C. Student preferences for university dormitories’ indoor environmental quality. Build. Environ. 2016, 106, 70–77. [Google Scholar]
- Gładyszewska-Fiedoruk, K.; Górka, M. Indoor air quality in naturally ventilated primary school classrooms: The effect of CO2 concentration on students’ performance. Build. Environ. 2017, 122, 280–286. [Google Scholar] [CrossRef]
- Smedje, G.; Norbäck, D. New ventilation systems at select schools in Sweden—Effects on asthma and exposure. Build. Environ. 2000, 35, 981–987. [Google Scholar] [CrossRef]
- Tian, L.; Li, X. Investigating the indoor environment quality of student dormitories in different regions of China: Taking Hainan province as a case study. J. Environ. Manag. 2019, 248, 109329. [Google Scholar]
- Lee, M.H.; Kim, D.H.; Kim, D.Y.; Kim, Y.J. Monitoring of indoor air quality and occupant behavior in university dormitories. Sustainability 2020, 12, 3723. [Google Scholar]
- Al Haddad, H.; Anabtawi, M.; Abu-Khader, M. Indoor air quality of new university dormitory in UAE: Role of CO2, VOCs, and PM2.5. Int. J. Environ. Res. Public Health 2020, 17, 8314. [Google Scholar]
- Alshehhi, A.A.; Elhadidy, H. Performance of HVAC systems on IAQ in student dormitory in UAE. Build. Environ. 2021, 195, 107730. [Google Scholar]
- Dang, W.; Sun, X.; Wang, Z.; Qian, H.; Zhang, Y. Evaluating the performance of a passive sampler for measuring indoor air pollutants in dormitories. Int. J. Environ. Res. Public Health 2021, 18, 941. [Google Scholar]
- Hu, X.; Chen, J.; Chen, J.; Luo, Y.; Zhang, G. Comprehensive analysis of indoor air quality and thermal comfort in university classrooms in China. Int. J. Environ. Res. Public Health 2019, 16, 1186. [Google Scholar]
- Arar, M.; Jung, C. Improving the indoor air quality in nursery buildings in United Arab Emirates. Int. J. Environ. Res. Public Health 2021, 18, 12091. [Google Scholar] [CrossRef]
- Liu, L.; Zhu, Y.; Qin, Y. Performance of a new fresh air supply system with thermal storage for university classrooms in the hot summer and cold winter zone in China. Build. Environ. 2019, 148, 516–531. [Google Scholar]
- Jung, C.; Awad, J. Improving the IAQ for learning efficiency with indoor plants in university classrooms in Ajman, United Arab Emirates. Buildings 2021, 11, 289. [Google Scholar] [CrossRef]
- Hsiao, T.; Tung, T. Indoor air quality evaluation of an elementary school in Taiwan. Build. Environ. 2019, 159, 106150. [Google Scholar]
- Zhong, Y.; Liu, J.; Li, M.; Chen, H. Effects of indoor air pollution on health in rural households in developing countries: A review. Sci. Total Environ. 2019, 650, 1349–1359. [Google Scholar]
- Choi, W.; Kim, K. Indoor air quality evaluation of newly built apartments in Korea. Int. J. Environ. Res. Public Health 2019, 16, 2383. [Google Scholar]
- Baek, S.O.; Kim, J.Y.; Chung, Y.H.; Lim, Y.W. Indoor air quality assessment in elementary schools in Korea. Environ. Monit. Assess. 2017, 189, 94. [Google Scholar]
- Stabile, L.; D’Alessandro, N.; Mabilia, R.; Zanoni, S.; Zambon, G. Influence of outdoor and indoor environmental factors on asthma hospitalizations in children: A review and meta-analysis. J. Environ. Sci. Health. Part C Environ. Carcinog. Ecotoxicol. Rev. 2016, 34, 84–110. [Google Scholar]
- Xie, H.; Yao, Z.; Zhang, Y. Indoor air quality investigation of an office building with mechanical ventilation system in Shanghai, China. Environ. Sci. Pollut. Res. 2019, 26, 12056–12067. [Google Scholar]
- Pitarma, R.; Marques, G.; Viegas, C.; Ramos, N.M. A review on building information modeling (BIM) and indoor air quality: Integrating to improve construction and building operations. J. Clean. Prod. 2021, 305, 127222. [Google Scholar]
- Ding, G.; Sun, Y.; Huang, Y. A study of the relationships among indoor air quality, perceived air quality, and sick building syndrome in residential buildings. Int. J. Environ. Res. Public Health 2020, 17, 1795. [Google Scholar]
- Shu, Y.; Zhang, H.; Lu, Y.; Zhao, W.; Zhang, J. Indoor air quality assessment and source apportionment of TVOCs in university classrooms in Northeast China. Sustainability 2019, 11, 5584. [Google Scholar]
- Ding, L.; Zhang, Q.; Wang, S.; Xu, Y.; Tian, Y. Exposure and risk assessment of volatile organic compounds in kindergartens in a Chinese city. Indoor Air 2020, 30, 3–16. [Google Scholar]
- Wu, J.; Chen, Y.; Sun, Y. Research on the influences of building materials on indoor environmental quality in green buildings. Sustainability 2021, 13, 4854. [Google Scholar]
- Lee, M.; Lee, Y.; Lee, H.; Seo, J. An investigation of indoor air quality in elementary school classrooms in Korea. Int. J. Environ. Res. Public Health 2019, 16, 1785. [Google Scholar]
- Wang, H.; Lu, Z.; Yan, Y.; Guo, X. Study on the potential relationship between VOCs and SARS-CoV-2 transmission by considering indoor air quality. Build. Environ. 2020, 180, 107022. [Google Scholar]
- Kephalopoulos, S.; Sarigiannis, D.; de Oliveira Fernandes, E. Health-based ventilation guidelines: A review and recent developments. Buildings 2019, 9, 149. [Google Scholar]
- Argyropoulos, G.; Kalogeropoulos, K.; Assimakopoulos, M.N.; Karagiannidis, A. Assessment of indoor air quality in workplaces of Greek commercial buildings: A pilot study. Int. J. Environ. Res. Public Health 2021, 18, 1577. [Google Scholar]
- Kang, S.H.; Baek, S.O.; Lee, S.J. Investigation of volatile organic compounds in indoor air of apartment houses in Korea. Build. Environ. 2014, 82, 137–144. [Google Scholar]
- Kuo, C.Y.; Chen, H.W.; Lai, C.C. Improvement of indoor air quality in a renovated public building by identifying and removing potential sources of indoor air pollution. Indoor Air 2019, 29, 251–263. [Google Scholar]
- Agapiou, A.; Yiannakou, A. Investigation of indoor air quality and exposure to formaldehyde and acetaldehyde in Cyprus primary schools. Indoor Built Environ. 2018, 27, 955–967. [Google Scholar]
- Ma, T.; Zhang, X.; Guo, H.; Wang, C.; Liu, X.; Zhang, H. Volatile organic compounds in indoor and outdoor air of a university library and their relationship with building materials. Build. Environ. 2021, 191, 107389. [Google Scholar]
- Yiin, L.M. Indoor air quality and its determinants in a university building. Indoor Built Environ. 2018, 27, 219–229. [Google Scholar]
- Vujcic, V.; Ferreira, P.; Oliveira, M.; Fernandes, A.P.; Madureira, J. Influence of the use of gas cookers and ovens on indoor air quality: A review. Atmosphere 2021, 12, 96. [Google Scholar]
- Kim, K.H.; Szulejko, J.E.; Brown, R.J. A review of volatile organic compound (VOC) source apportionment by receptor models. Environ. Sci. Pollut. Res. 2016, 23, 20254–20273. [Google Scholar]
- Nazir, S.; Vargo, J. A review of indoor air quality guidelines and standards for PM2.5, ozone, and nitrogen dioxide. J. Air Waste Manag. Assoc. 2016, 66, 555–570. [Google Scholar]
- Cho, H.J.; Kim, K.W.; Kim, Y.H. A review of the development of indoor air quality standards in Korea. Build. Environ. 2016, 103, 71–78. [Google Scholar]
- Valbuena, A.L.; Hernandez, L.P.; Martinez, J.L.C. Indoor air quality during COVID-19 lockdown: An approach based on VOCs, CO2 and CO monitoring in an office building. Sustainability 2021, 13, 6351. [Google Scholar]
- Mukhtar, A.; Malik, A.H.; Bhatti, M.T. Investigation of air quality in indoor university classrooms in Pakistan: Analysis of VOCs and carbonyls levels. Environ. Sci. Pollut. Res. 2020, 27, 29106–29116. [Google Scholar]
- Duan, Y.; Liu, X.; Xie, Y.; Hao, X. Experimental and numerical study of indoor air quality in multi-family residential buildings in China. Build. Environ. 2020, 168, 106523. [Google Scholar]
- Abou Rafee, S.A.; Mohamed, N.A.; Abdel-Satar, A.M. Assessment of indoor air quality in a university classroom in Egypt: A case study. Atmosphere 2021, 12, 938. [Google Scholar]
- Niu, J.; Tian, Y.; Zhao, Y. Indoor air quality assessment of the new campus library of Tsinghua University, Beijing, China. J. Build. Eng. 2018, 18, 73–81. [Google Scholar]
- Lin, T.P.; Yang, C.Y.; Lou, S.H. The influence of age on the indoor environment and occupants’ comfort in different Asian cities. Archit. Sci. Rev. 2019, 62, 13–24. [Google Scholar]
- Edun, A.O.; Ismail, T.E.; Ismail, N.A.; Osman, N.A. Monitoring of indoor air quality and thermal comfort in energy-efficient buildings in tropical climate. Indoor Built Environ. 2020, 29, 835–847. [Google Scholar]
- Njoku, C.S.; Omole, D.O.; Omojola, T.O. Assessment of indoor air quality in selected administrative buildings in a Nigerian university campus. Indoor Built Environ. 2021, 30, 226–236. [Google Scholar]
- Meo, S.A.; Al-Khalaf, M.S.; Alhomoud, S.A.; Al-Masri, A.A. Association between indoor and outdoor air pollution and lung function of Saudi schoolchildren. Indoor Built Environ. 2018, 27, 1007–1013. [Google Scholar]
- Wu, J.; Liu, S.; Liu, Y.; Zhang, Y.; Song, W. Emission characterization and toxicity assessment of VOCs from different decorative materials in indoor environments. Atmosphere 2020, 11, 1289. [Google Scholar]
- Ye, Z.; Yang, X.; Wang, X.; Xu, Q.; Chen, Y.; Yu, H. A novel self-cleaning photocatalytic wall panel for reducing indoor volatile organic compounds (VOCs). Materials 2018, 11, 1148. [Google Scholar]
- Dong, X.; Gao, Y.; Li, S. Improvement of air quality and thermal comfort in a dormitory by optimizing natural ventilation: A case study in Northeast China. Build. Environ. 2020, 185, 107224. [Google Scholar]
- Ma, X.; Ma, Y.; Qi, X.; Yang, Y.; Zhang, L.; Li, Q. Investigation of volatile organic compounds in newly decorated households and their exposures for residents in Shanghai, China. Environ. Sci. Pollut. Res. 2017, 24, 3097–3106. [Google Scholar]
- Kurnaz, A.; Özdeniz, M.B. A methodology for the selection of building materials with low volatile organic compound emissions. Indoor Built Environ. 2015, 24, 422–436. [Google Scholar]
- Gan, W.; Zhang, Y.; Liu, H. Characterization of VOC emissions from wall paint and their impacts on indoor air quality in a model room. Indoor Air 2018, 28, 973–985. [Google Scholar]
- Luo, S.; Jiao, W.; Liao, W.; Liu, Y. Indoor air quality investigation in urban-rural transitional residences in Chongqing, China. Int. J. Environ. Res. Public Health 2019, 16, 4786. [Google Scholar]
- Kim, J.; Kim, K. Indoor air quality assessment of preschool facilities: An exploratory study. J. Environ. Manag. 2018, 207, 1–8. [Google Scholar]


Disclaimer/Publisher’s Note: The statements, opinions and data contained in all publications are solely those of the individual author(s) and contributor(s) and not of MDPI and/or the editor(s). MDPI and/or the editor(s) disclaim responsibility for any injury to people or property resulting from any ideas, methods, instructions or products referred to in the content. |
© 2023 by the authors. Licensee MDPI, Basel, Switzerland. This article is an open access article distributed under the terms and conditions of the Creative Commons Attribution (CC BY) license (https://creativecommons.org/licenses/by/4.0/).