Article

Risk Propagation Model and Simulation of an Assembled Building Supply Chain Network

1
School of Management Engineering and Business, Hebei University of Engineering, Handan 056038, China
2
School of Architecture and Art, Hebei University of Engineering, Handan 056038, China
*
Author to whom correspondence should be addressed.
Buildings 2023, 13(4), 981; https://doi.org/10.3390/buildings13040981
Submission received: 10 March 2023 / Revised: 26 March 2023 / Accepted: 3 April 2023 / Published: 7 April 2023
(This article belongs to the Special Issue Tradition and Innovation in Construction Project Management)

Abstract

:
In recent years, the prefabricated building supply chain has received strong support from the government and has developed rapidly, but there are various risks in the operation process. In this paper, on the basis of considering asymptomatic infections and relapse, this paper establishes a risk transmission model that considers a recurrent Susceptible–Exposed–Asymptomatic–Infectious–Recovered (abbr. SEAIR) model, systematically analyses the risks in the supply chain, and calculates the risk balance point to conclude that the risks can exist in the supply chain for a long time. By drawing a causal circuit diagram, the relationship between the influencing factors in the process of risk transmission is found, establishing a stock flow map to explore the law of risk propagation. The simulation results using Vensim PLE software show that the five influencing factors of infection rate, transmission rate, government financial support, government policy supervision, and immunity loss ratio have an important impact on the number of risk-unknown enterprises, risk-latent enterprises, risk transmission enterprises, and infection rehabilitation enterprises in risk transmission, and relevant countermeasures to deal with risk transmission in the supply chain are proposed. Theoretically, this paper broadens the ideas for improving infectious disease models. From the management point of view, it reveals how the prefabricated building supply chain enables enterprises to improve their ability to deal with risks through the risk propagation model, providing reference and helping to manage the risks faced by the prefabricated building supply chain.

1. Introduction

In recent years, the supply chain of prefabricated buildings has been widely considered by society in shortening the construction period, saving labour, and improving the quality of construction enterprises. At the same time, states have successively issued relevant policies to encourage and support the development of the supply chain of prefabricated buildings, which has brought prefabricated construction industrialization to a new level [1]. According to the statistics of the prefabricated building industry, the market size of China’s prefabricated buildings in 2011 was about CNY 4.3 billion, reached CNY 262.3 billion in 2017, and soared to CNY 1.02 trillion by 2022, with a compound growth rate of more than 100%, and the national prefabricated buildings accounted for more than 22%. Supply chain management is chosen as a management mode for prefabricated buildings to enhance their strength, integrating the advantages of various related enterprises, connecting all the enterprise nodes in the supply chain, and forming a chain network with the owner’s demand as the guide and the general contractor as the core. Through the commercial interaction among the enterprises of each node, information flow, resource flow, cash flow, and logistics run through the design and construction units, material purchasing units, logistics and transportation units, assembly and construction units, and structural design units, thus promoting the functional operation of the overall construction chain [2]. However, with the continuous improvements of the technology of prefabricated building supply chains, the number of node enterprises is increasing, and the types of nodes are increasing from the initial single type to the present full coverage. The prefabricated links involved are more complicated, and the suppliers are more diverse, which leads to increasing risks in the supply chain. External environmental factors, such as natural environmental changes, policies and regulations, and internal factors, such as the planning stage, purchasing stage, manufacturing stage, transportation stage, and assembly stage, all affect the change in risks [3]. While the risks in the supply chain increase, the stability of the supply chain worsens, and the changes in these risks affect the normal construction and transportation of the node enterprises in the supply chain [4]. On the other hand, after being affected by the risks, the node enterprises will further spread the risks through the propagation path of the supply chain, which will have an impact on the normal operation of the whole supply chain. Therefore, the risk problem in the supply chain of prefabricated buildings has become an urgent problem in supply chain management.
Risk research on supply chains was first influenced by enterprise risk, and the connection between enterprises increased, so risk arose. A supply chain is a network composed of many enterprises to meet the needs of customers, and the risks among enterprises are bound to affect the risks of the whole supply chain. However, the prefabricated building supply chain has many participants, complicated strategic relationships, and opaque information among enterprises, so it is difficult for the traditional supply chain to meet the development of the prefabricated building supply chain. Therefore, research on the risk of prefabricated building supply chains has gradually attracted people’s attention, and many scholars have explored and studied the risks of prefabricated building supply chains from different perspectives. Considering the risks in all stages of the whole life cycle of prefabricated building projects, in Zhang and Qiao [5] an index system was constructed, a risk evaluation model is formed, and relevant suggestions are put forward for the risk management of the prefabricated building supply chain. Chan et al. used a literature review, structured discussion, and multi-attribute group decision models to explore the benefits and challenges of modular integrated architecture [6]. Wang et al.’s factor analysis was used to identify the key points of risk control in the supply chain of prefabricated buildings, and the relationship and weight of risk factors in each stage are quantitatively analysed. It is concluded that the risk mainly exists in the manufacturing stage, and the risk in the delivery stage is the lowest [7]. Zhang refers to the information dissemination model, identifies the relationship among 19 risk dissemination factors, and introduces blockchain technology to construct the information flow model of the assembled supply chain [8]; Gu identified and analysed the risk factors for the supply chain based on the Supply Chain Operations Reference model (abbr. SCOR) theory, reduced the dimension of risk factors by principal component analysis, and simulated and analysed it by system dynamics [9]; Zhang evaluated the risk of a prefabricated concrete supply chain by using a cloud model under an engineering procurement construction (abbr. EPC) general contracting project [10]; An et al. established a Structural Equation Model (abbr. SEM) by multivariate data analysis and obtained the order of influencing factors for the research objective of supply chain integration [11]; Wang et al. introduced the idea of interface management, analysed the risk mechanism of supply chain integration interface, and used a Combination Ordered Weighted Averaging (abbr. C-OWA) operator weighting and grey clustering evaluation method to build a risk evaluation model [12]; Al-Hussein M. H. Al-Aidrous analysed the relationship between the influencing factors of ground-floor housing in prefabricated buildings, and proposed relevant measures to promote the development of prefabricated buildings in Malaysia [13]; Kristopher Orlowski analysed the manufacturing principles of special weatherproof seals for prefabricated buildings and evaluated their influencing factors [14]; Luo et al. analysed the supply chain risk network of stakeholders by using social network, to explore the supply chain network risks of prefabricated houses in Hong Kong and help employees to deal with these risks more effectively [15]; Ibrahim Yahaya Wuni et al. identified the risk factors of modular integrated buildings by using the fuzzy comprehensive evaluation method [16]; Syed Saad examined the key factors for success in Malaysia’s construction industry from five areas: stakeholder understanding, resource availability, process management, issues and perceptions, and future needs [17]. Most of these studies adopted quantitative research methods and explored the risk generation mechanism in different ways, defined the risk propagation angle, and constructed a risk propagation model.
The infectious disease model is a typical transmission dynamics model in mathematical engineering, and the research on the infectious disease dynamics model has great practical significance, mainly including the following three aspects: establishing a mathematical model to simulate the process of infectious disease transmission, analysing the spread trend of the infectious disease model, and studying targeted prevention and control strategies. Typical infectious disease models include the Susceptible–Infected (abbr. SI) model, the Susceptible–Infected–Susceptible (abbr. SIS) model, the Susceptible–Infected–Recovered (abbr. SIR) model [18], and the Susceptible–Exposed–Infected–Recovered (abbr. SEIR) model [19]. Since then, many scholars have improved on the basis of the above classical models based on different considerations: Yiping Tan built a stochastic Susceptible–Infected–Susceptible (abbr. SIS) dynamics model from the perspective of media coverage and used dynamics for research [20]; Ayse Peker Dobie studied a Susceptible–Infectious–Susceptible (SIS) model with virus mutation in a variable population size, calculating equilibrium points [21]; Wonhyung Choi studied a spatial Susceptible–-nfected–Susceptible epidemic model with a free boundary [22]; Jianhua Chen considered that the possibility of infected people becoming removed after treatment is very small, and improved the Susceptible–Infected–Recovered (abbr. SIR) model to analyse the emergency supply chain transmission mechanism [23]; Di Liang studied supply chain risk propagation based on the Susceptible–Infected–Recovered (abbr. SIR) epidemic model [24]. Based on the Susceptible–Exposed–Infected–Recovered (abbr. SEIR) model, Guanhua Ni proposed a Susceptible–Contacts–Exposed–Infected–Recovered (abbr. SCEIR) model that incorporates close contacts (C) and self-protectors (P) into a Parameters Sensitivity Analysis of COVID-19 [25]; Isa Abdullahi Baba studied the transmission dynamics of the disease by incorporating the saturated incidence rate into the model, and the Caputo sense was constructed for studying the risk balance point [26]; Mauro Aliano proposed a time delay differential system describing risk diffusion among companies inside an economic sector by means of a Susceptible–Infected–Recovered (abbr. SIR) dynamics [27]; based on the Bo Li epidemiological model, the stability of discrete time and local bifurcation were considered, and the dynamic behaviour of the infectious disease model was analysed [28]. Tchavdar T. Marinov proposed an adaptive susceptible infection-removal (abbr. A-SIR) epidemic model with time-dependent transmission and clearance rates and applied it to address COVID-19 in Latin America [29].
At present, research on prefabricated building supply chains mainly focuses on risk evaluation and risk generation mechanisms. Most of these studies regard risk factors as independent individuals and identify and evaluate related risk factors by using factor analysis and grey cluster evaluation methods, but there are few studies on the spread of risk factors in the supply chain. At the same time, the wide spread of risks in the supply chain can easily break the safe operation of the supply chain, making it unable to achieve the expected goal of supply chain management, resulting in a decrease in supply chain efficiency and an increase in the cost of each subject in the supply chain. Therefore, it is crucial to study risk transmission from the perspective of the prefabricated building supply chain. Due to the similarities between virus transmission and risk transmission in terms of spread object, spread process, and spread environment, scholars have applied basic virus transmission models such as SI, SIS, SIR, SEIR, and so on to the field of risk transmission. However, the traditional virus model fails to take into account the symptoms of enterprises in the supply chain after being eroded by risk, and asymptomatic infected enterprises have no obvious characteristics after risk erosion and are easy to ignore, thereby underestimating the harm brought by risk and making it difficult to comprehensively solve the corresponding problems caused by risk transmission. At the same time, the performance of diseases caused by virus transmission after enterprises in the supply chain are eroded by risk is similar, and some disease problems cannot be completely solved at one time and recur after treatment; enterprises in the supply chain may not be able to completely solve the risk problem once after being eroded by risk, and may reappear after a period of time, forming a secondary diffusion. Focusing on the problem of risk propagation in the prefabricated building supply chain, this paper uses the Vensim PLE software of system dynamics to identify the causes and consequences of the prefabricated building supply chain risk, determine the key risk factors, innovatively introduce the SEAIR model in the complex network infectious disease transmission dynamics model to establish the risk transmission model, and study the risk transmission process. Table 1 shows the relationship between the existing literature on risk in the prefabricated building supply chain and the virus model improvement perspective and this study.
The contributions of this article are as follows:
  • Focusing on the problem of supply chain risk transmission, this paper establishes a supply chain network model and innovatively introduces the recurrent SEAIR model when considering asymptomatic infections and relapses, adding two situations: asymptomatic characteristics and symptomatic characteristics.
  • Considering both of these scenarios, the asymptomatic infection enterprise and the symptomatic infection enterprise are jointly defined as risk transmission enterprises based on the actual supply chain, and are regarded as one of the main bodies of the risk transmission model.
  • The SEAIR supply chain risk propagation model considering recurrence is established, and the computer simulation method based on system dynamics is combined with the propagation dynamics idea to simulate and analyse the risk propagation process, seek risk mitigation strategies, and provide decision support for better reducing supply chain risks.
The remainder of this paper is organized as follows: Section 2 identifies risk factors associated with the prefabricated building supply chain. Section 3 establishes a SEAIR model that considers relapse. In Section 4, based on the recurrent SEAIR model, a supply chain risk propagation model was established and simulated for research. Finally, in Section 5, the relevant conclusions provide some directions for further research.

2. Identification and Dissemination of Prefabricated Building Supply Chain Risk

The assembled building supply chain is guided by the owner’s demand, and the general contractor is responsible for the coordination and scheduling of each node enterprise, such as the designer, the manufacturer, the transporter, and the assembly formula, to meet the needs of the owner, the general contractor, and the government. Different stakeholders are faced with different risks in the five working stages of design, procurement, manufacturing, transportation, and assembly. At the same time, the risks are mutually restricted, and the problems of one party will drive the whole supply chain to produce a linkage effect.

2.1. Assembled Supply Chain Risk Identification

The prefabricated building supply chain is guided by the needs of the owner, and the general contractor is responsible for the coordination and scheduling of various node enterprises, such as the designer, manufacturer, transportation, and assembly party, to meet the needs of the owner, the general contractor, and the government. Different stakeholders face different risks in the five stages of design, procurement, manufacturing, transportation, and assembly, and at the same time, each risk is mutually restricted, and the problem of one problem will drive the entire supply chain to have a linkage effect. As the first step in the construction activities of various stakeholders, the formulation of the plan directly affects the work arrangement of the subsequent procurement, manufacturing, transportation and assembly stages; the raw material standards procured by the owner and general contractor also affect the component manufacturing and later assembly work; the manufacturer’s control of the delivery time and quality of prefabricated components will affect the transportation arrangement and assembly quality; as transportation is an indispensable part of construction activities, its safety will also affect the progress of engineering assembly. Based on this, the relevant literature at home and abroad and prefabricated building accidents are analysed and summarized, and the risk factors of the five stages of design, procurement, manufacturing, transportation, and assembly and the perspective of the external environment are preliminarily formed, and then experts in the field of prefabricated building are invited to summarize the relevant risks based on the characteristics of the prefabricated building supply chain [30,31,32,33,34]:
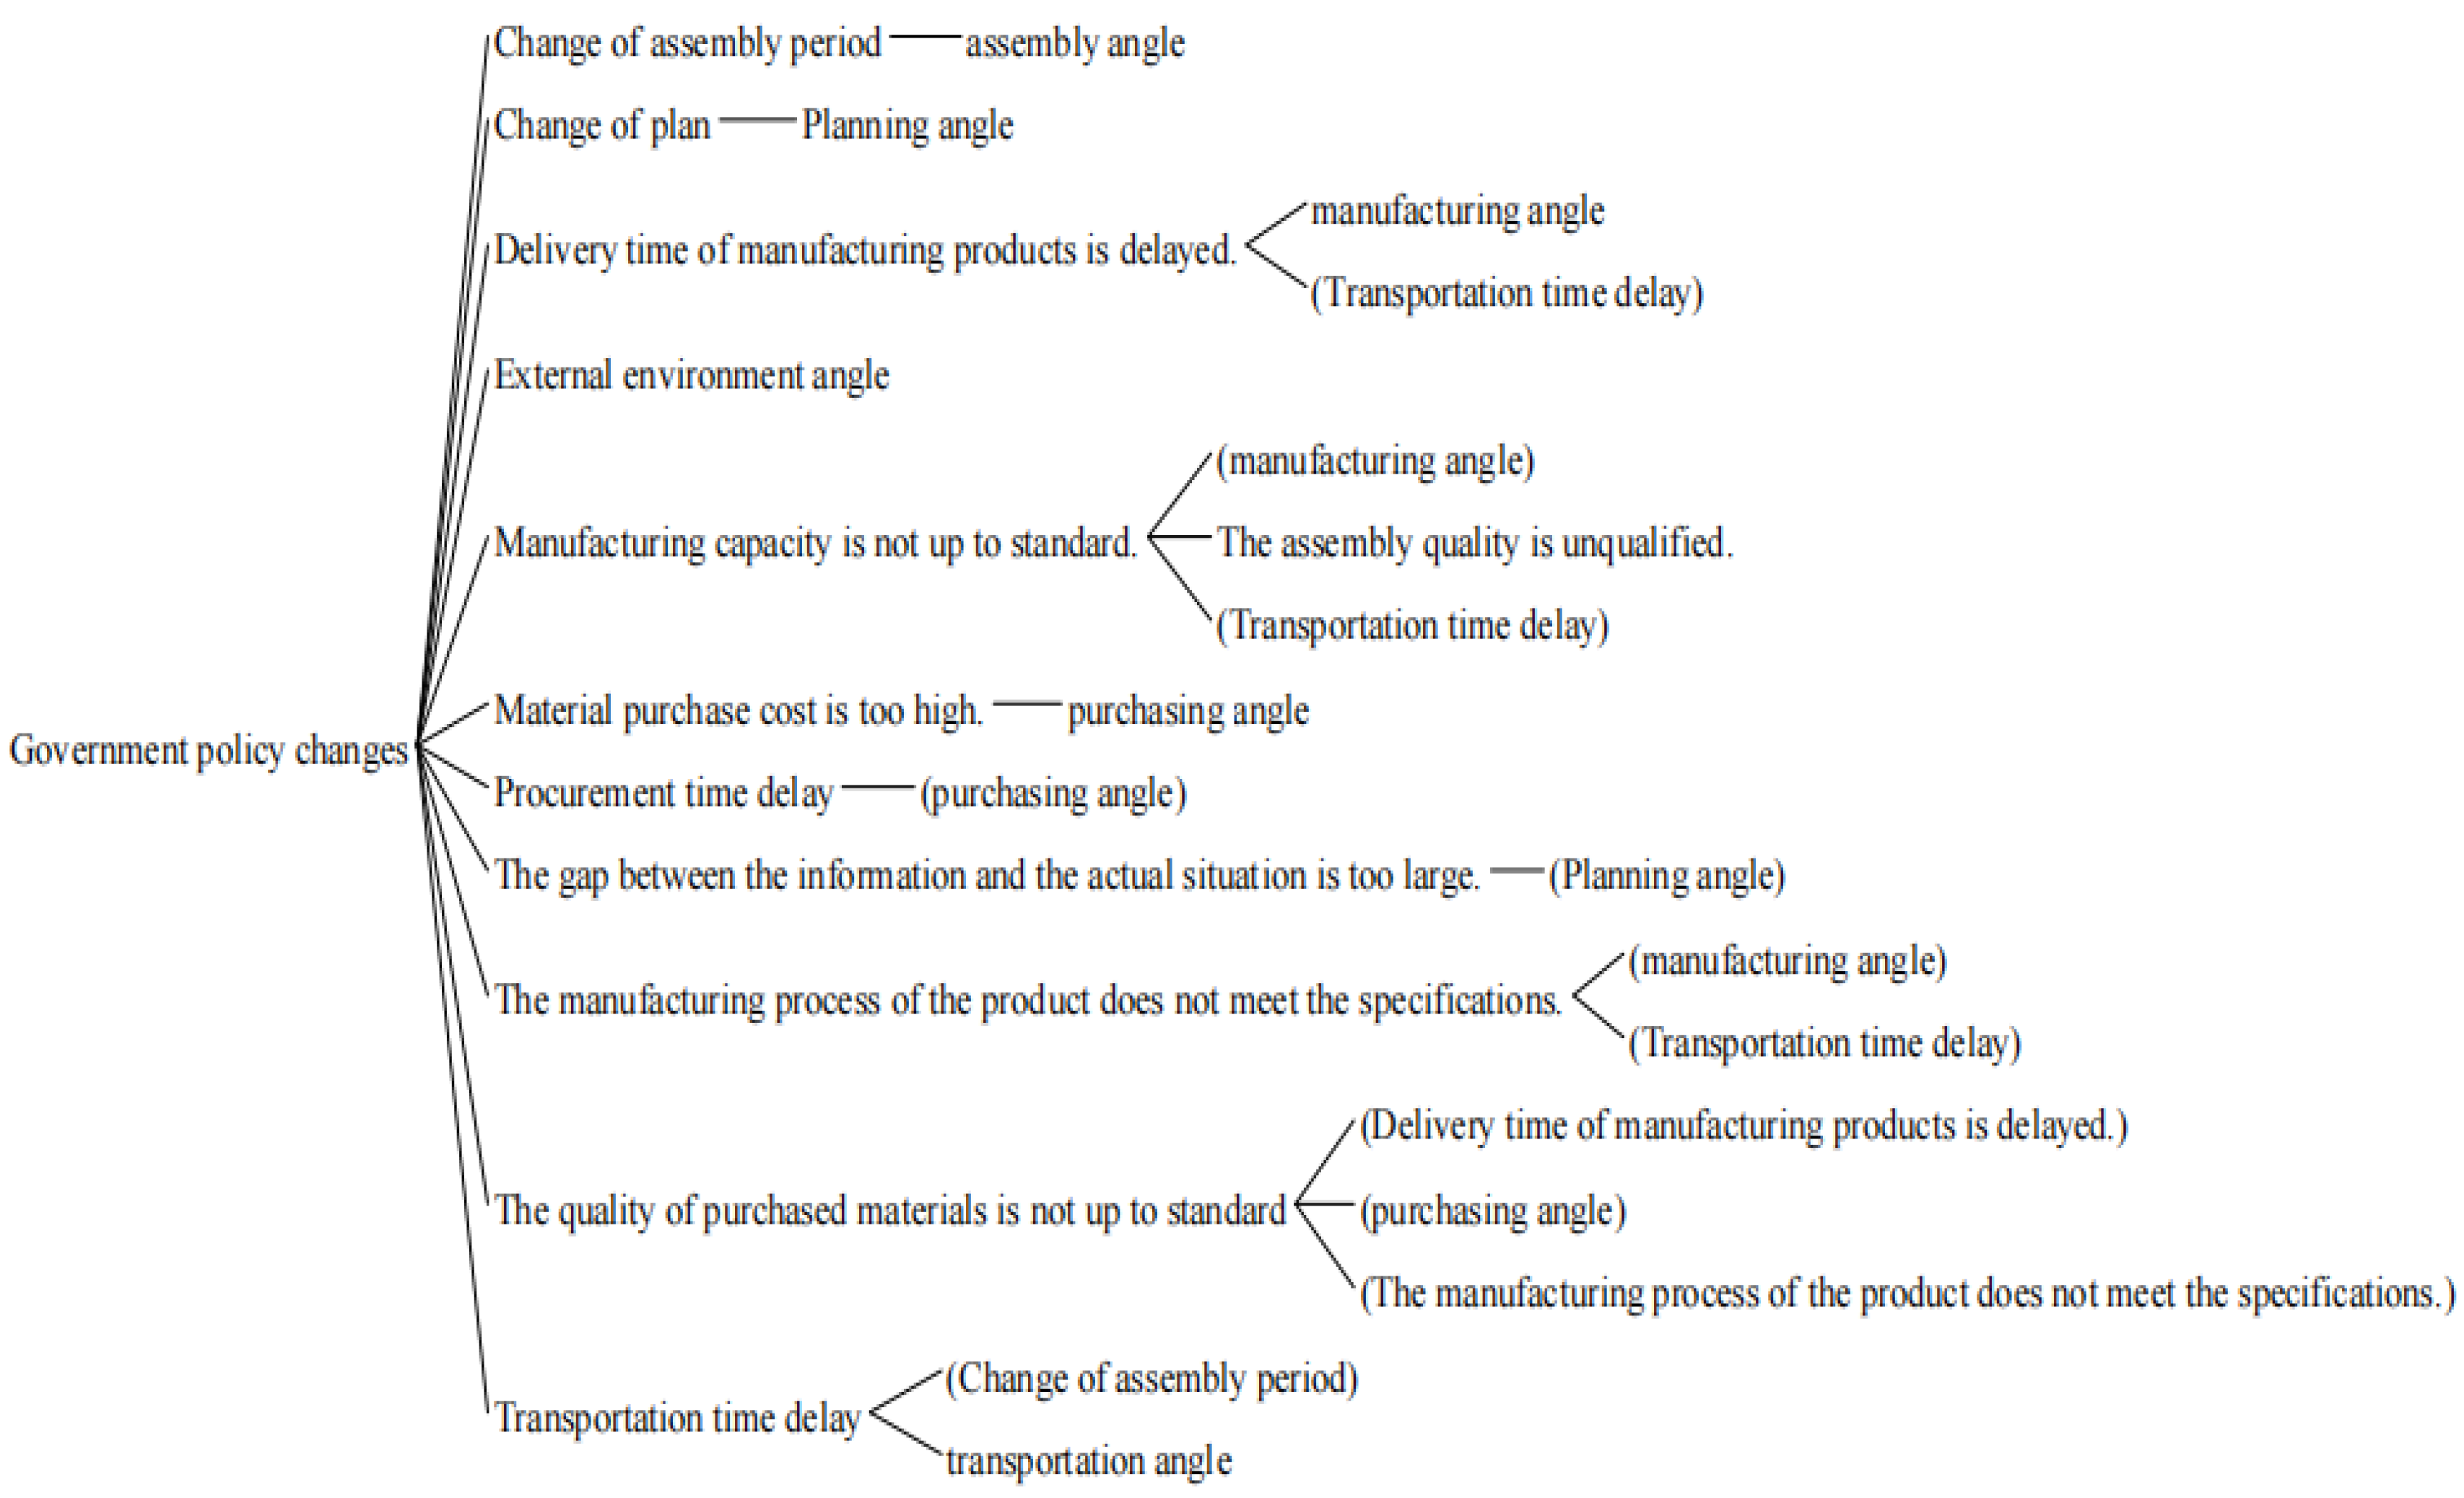
  • From the perspective of the external environment, the risk factors are changes in government policies, sudden changes in the natural environment, and the impact of the economic environment.
  • From the perspective of planning, the planning objectives are inaccurate; the difference between the change plan and the plan information and the actual situation is too large.
  • From the purchasing point of view, the cost of purchased materials is too high, the quality of purchased materials is not up to standard, and the purchasing time is delayed.
  • From the manufacturing point of view, the process of manufacturing products does not meet the specification requirements, the delivery time of manufactured products is delayed, and the capacity of manufacturing products is not up to standard.
  • From the perspective of transportation, materials are damaged during transportation, transportation time is delayed, transportation schemes are not perfect, and the transportation company is reliable.
  • From the perspective of assembly, the risk factors are changes in the assembly period, safety accidents at assembly sites, a low technical operation level of assembly personnel, and unqualified quality of assembly parts.

2.2. Risk Transmission Mechanism of the Prefabricated Building Supply Chain

At the planning level, the accuracy of the target of the plan affects the time of purchasing materials and the transportation time of products, and the standards for manufacturing will also be limited. At the purchasing level, the quality grade of purchased materials limits the assembly results and the quality of manufactured products. At the manufacturing level, the time of manufacturing products and the delivery time limit the transportation of products, and the qualified rate of manufactured products has an impact on assembly. At the transportation level, unreasonable transportation planning leads to changes to the supply chain structure and delays the progress of the project. At the level of assembly, the quality of assembly parts is unqualified, which cannot meet the assembly standards and delays the construction period; at the same time, it may lead to accidents in production safety. At the external risk level, sudden weather changes delay the progress of supply chain projects, and some policies issued by the government restrict parts of the products, which will have an impact on the subsequent manufacturing of products and assembly materials. The risk transmission mechanism of the prefabricated building supply chain is shown in Figure 1.

3. Establishment of the Model

3.1. Establishment of Recurrent SEAIR Models

The recurrent SEAIR model divides the population into five categories: S—susceptible, E—latent, A—asymptomatic, I—symptomatic, and R—recovering. In the recurrent SEAIR model, the population always keeps a constant Q, and at time T, the number of susceptible people is S(t), the number of latent people is E(t), the number of asymptomatic people is A(t), the number of symptomatic people is I(t), and the number of recovered people is R(t). A class of SEAIR models with asymptomatic infection and secondary recurrence was established.
The law of infection is as follows: (1) After contacting the infected person, the susceptible person will be infected with a certain probability, from a healthy state to a latent state and then to an infected state. (2) The state of infected people includes two types: one is symptomatic infection and the other is asymptomatic infection. (3) After these two infected people recover their health, they will develop their own immunity. However, over time, it is possible that this immunity will disappear and the person will again be vulnerable to infection. The mechanism of infection of the recurrent SEAIR risk transmission model is shown in Figure 2.
In the recurrent SEAIR model, it is assumed that (1) the natural mortality is μ, regardless of factors such as birth population and floating population; (2) the infection rate of symptomatic infected persons is α1 and that of asymptomatic infected persons is α2; (3) the probability of transmission from latent to infected persons is b; (4) the mortality rate of asymptomatic infected persons is c1 and that of symptomatic infected persons is c2; and (5) the recovery rate of asymptomatic infected persons is d1 and that of symptomatic infected persons is d2; (6) the probability of latent patients entering the asymptomatic period is β, and the probability of latent patients entering the symptomatic period is 1 − β. Those who recover will recover to latent patients with the probability of β; (7) H represents the recurrence rate of the disease.
The infectious disease model is as follows:
{ d S ( t ) d t = Q α 1 S ( t ) A ( t ) α 2 S ( t ) I ( t ) μ S ( t ) d E ( t ) d t = α 1 S ( t ) A ( t ) + α 2 S ( t ) I ( t ) μ E ( t ) b β E ( t ) b ( 1 β ) E ( t ) + H R ( t ) d A ( t ) d t = b β E ( t ) ( c 1 + μ ) A ( t ) d 1 A ( t ) d I ( t ) d t = b ( 1 β ) E ( t ) ( c 2 + μ ) I ( t ) d 2 I ( t ) d R ( t ) d t = d 1 A ( t ) + d 2 I ( t ) μ R ( t ) H R ( t )

3.2. Analysis of the Applicability of the Network Model and Virus Model of a Prefabricated Building Supply Chain

  • The objects of diffusion are similar: In the process of risk propagation in the supply chain of prefabricated buildings, the main enterprises in the supply chain suffer from risk erosion, and each enterprise is an independent whole with its own ability to resist risks. Enterprises with a strong ability to resist risks are ultimately less affected by risks; in contrast, enterprises with a weak ability to resist risks are greatly affected by risks. For virus transmission, the infected individual is the object of transmission, and the transmission effect is affected by individual immunity [23].
  • The process of diffusion is similar: In the supply chain risk of prefabricated buildings, the spread of risk is disorderly. When the manufacturer receives the erosion of risk, the affected risk will spread in the supply chain network, and the upstream raw material suppliers, downstream transporters, and packaging formulas will be affected. In the supply chain, one node enterprise affected by the risk will spread to another node enterprise in contact with it, and the spread results will worsen. In the process of virus transmission, the virus that comes into contact with the infected virus is the first to be affected, and then it spreads in all directions in a radial way. Without being stopped, the impact is even more serious [35].
  • The diffusion environment is similar: The risk of the prefabricated building supply chain is diffused through the business dealings between node enterprises. When the quality of the products produced by the manufacturer does not meet the requirements of the owner, the downstream transportation faces the risk of delay in transportation time, which leads to the failure to complete the equipment installation on schedule, resulting in compensation for a contract breach by the general contractor. The main body of virus transmission is the cells in the body of the virus, and the virus carried in the cells is spread to other places through the flow of blood [36].

3.3. The Existence of a Risk Balance Point

In the infectious disease model, there are two modes: disease-free equilibrium and endemic equilibrium. The disease-free equilibrium is the extinction of the disease, and the endemic equilibrium means that the disease will develop in the population for a long time, forming a normalization [37]. Because this paper studies and analyses risk transmission based on the infectious disease model, it redefines the disease-free equilibrium point as the risk extinction point and the endemic equilibrium point as the long-term risk existence point. The risks in the supply chain can only be controlled but do not completely disappear. Therefore, this paper only explores the spread of the endemic equilibrium point, that is, the long-term existence point of risks, defined according to the supply chain:
In Model (1), there is always a disease-free equilibrium P 0 ( μ Z , 0 , 0 , 0 , 0 ) . According to the method of the regeneration matrix in the literature [38], the basic regeneration number is obtained:
R 0 = α 2 Q b β μ M 1 M 2 + α 1 Z b ( 1 β ) μ M 0 M 2 + H b β M 2 d 1 + H b ( 1 β ) M 1 d 2 M 0 M 1 M 2 ( H + β )
among M 0 = b + μ , M 1 = μ + d 1 + c 1 , M 2 = μ + d 2 + c 2 . There are the following conclusions about the existence of the equilibrium point of the model:
Theorem 1.
When  R 0 > 1 , Model (1) has a unique endemic equilibrium  P * ( S * , E * , A * , I * , R * )
It is proven that if the right side of Model (1) is equal to 0 and an endemic equilibrium P * exists, the algebraic equations are satisfied:
{ Q α 1 S * A * α 2 S * I * μ S * = 0 α 1 S * A * + α 2 S * I * μ E * b β E * b ( 1 β ) E * + H R * = 0 b β E * ( c 1 + μ ) A * d 1 A * = 0 b ( 1 β ) E * ( c 2 + μ ) I * d 2 I * = 0 d 1 A * + d 2 I * μ R * H R * = 0
The following can be obtained from the third and fourth formulas of the equations:
  b β E * = ( c 1 + μ ) A * + d 1 A * = M 1 A * b ( 1 β ) E * = ( c 2 + μ ) I * + d 2 I * = M 2 A *
Therefore,
A * = b β M 1 E * , I * = b ( 1 β ) M 2 E * .
Substituting (3) into (2) yields
d 1 b β M 1 E * + d 2 b ( 1 β ) M 2 E * = ( H + μ ) R * ,
Therefore,
R * = 1 H + μ ( d 1 b β M 1 + d 2 b ( 1 β ) M 2 ) .
Combining Equation (4) and bringing the second equation in equation group (2) into the first equation, we obtain Q M 0 E * + H H + μ ( d 1 b β M 1 + d 2 b ( 1 β ) M 2 ) E * = μ S *
So
S * = Q μ ( H + μ ) M 0 M 1 M 2 d 1 b β H M 2 d 2 b ( 1 β ) H M 1 μ ( H + μ ) M 1 M 2 E *
Substituting (3), (4), and (5) into the second equation set of equation set (2) gives
α 1 S * A * + 2 S * I * μ E * b β E * b ( 1 β ) E * + H R * = 0   ( α 1 b ( 1 β ) M 2 + α 2 b β M 1 ) E * × { Q μ ( H + μ ) M 0 M 1 M 2 d 1 b β H M 2 d 2 b ( 1 β ) H M 1 μ ( H + μ ) M 1 M 2 E * } M 0 E * + H H + μ ( d 1 b β M 1 + d 2 b ( 1 β ) M 2 ) E * = 0 .
Therefore,
E * = μ M 0 M 1 2 M 2 2 ( H + μ ) { ( H + μ ) M 0 M 1 M 2 [ H b 1 β M 2 d 1 + H b 2 ( 1 β ) M 2 d 2 ] } [ α 1 b 1 M 1 ( 1 - β ) + α 2 b 2 M 2 β ] ( R 0 1 )
Therefore, this paper needs to prove
{ ( H + μ ) M 0 M 1 M 2 [ H b 1 β M 2 d 1 + H b 2 ( 1 β ) M 2 d 2 ] } > 0 Just do it.
The specific steps are as follows:
{ ( H + μ ) M 0 M 1 M 2 [ H b 1 β M 2 d 1 + H b 2 ( 1 β ) M 2 d 2 ] } > H b M 1 M 2 [ H b 1 β M 2 d 1 + H b 2 ( 1 β ) M 2 d 2 ] } = H b [ ( β M 1 M 2 β d 1 M 1 M 2 ) + ( 1 β ) M 1 M 2 ( 1 β ) d 2 M 1 ] > 0
It can be proven that there is an endemic equilibrium point, so this situation will form a long-term risk in enterprises, that is, the risk that a supply chain will exist for a long time.

4. Based on the Establishment and Simulation Analysis of Supply Chain Risk Propagation Model Considering the Recurrent SEAIR Model

4.1. Identification of the Causes and Results of Supply Chain Risks of Prefabricated Buildings

From the perspective of system theory, the prefabricated building supply chain is a complex and huge system, and this paper analyses the risk factors affecting the prefabricated building supply chain from two aspects: the external system and the internal system. The stakeholders involved in the prefabricated construction supply chain include planners, purchasers, fabricators, transporters, and assemblers. This paper classifies these five stakeholders as internal systems that affect the risk propagation of the prefabricated building supply chain, and the external environment as external systems. System dynamics are used to analyse the influencing factors of external and internal systems in combination with Vensim PLE software, and identify the key factors affecting risk, that is, the main causes of risk.

4.1.1. Causality Diagram Analysis

The causal circuit diagram includes six systems, namely, external environment stage system, planning stage subsystem, procurement stage subsystem, manufacturing stage subsystem, transportation stage subsystem, and assembly stage subsystem; these six systems affect each other, interconnect, and ultimately affect the spread of risk in the entire prefabricated building supply chain. A causal analysis of the supply chain risk of prefabricated buildings is shown in Figure 3.

4.1.2. Result Tree Analysis

Set each risk factor as the current state and use the analysis tool uses tree to analyse the results brought by each risk factor. It is concluded that when the government policy changes, it has the widest impact on other stages. The result trees of other factors are not introduced here. The result tree of government policy changes is shown in Figure 4.

4.2. Based on the Establishment of the Supply Chain Risk Propagation Model Considering the Recurrent SEAIR Model

Through the above analysis, this paper concludes that changes in government policies have the greatest impact on the other stages of the supply chain of prefabricated buildings. Therefore, the government is regarded as the main body of the supply chain of prefabricated buildings, and it is introduced into the SEAIR model to explore the impact of relevant government policies on the supply chain of prefabricated buildings.

4.2.1. Definition of the System Boundary

In the management and operation of the prefabricated building supply chain, one or more enterprises will be involved, which will influence each other. One of them will be affected by risks, and the whole supply chain may be affected. Under the supply chain of prefabricated buildings, the risk spread can be divided into unknown risk enterprises (susceptible to infection), latent risk enterprises (latent persons), risk transmission enterprises (symptomatic and asymptomatic infection), and infection rehabilitation enterprises (recovered persons). When the node enterprises in the assembled supply chain are disturbed by risks, they change from unknown risk enterprises to latent risk enterprises. Under the influence of a certain transfer rate, latent enterprises turn into risk transmission enterprises, and risk transmission enterprises turn into infection rehabilitation enterprises under the influence of the government. When the node enterprises become infection rehabilitation enterprises, they may lose their immunity to risks and then continue to become unknown risk enterprises. It is found that the system in this process includes six subjects: enterprises with unknown risks, enterprises with latent risks, enterprises with risk transmission, enterprises with infection rehabilitation, enterprises without risk immunity, and the government.

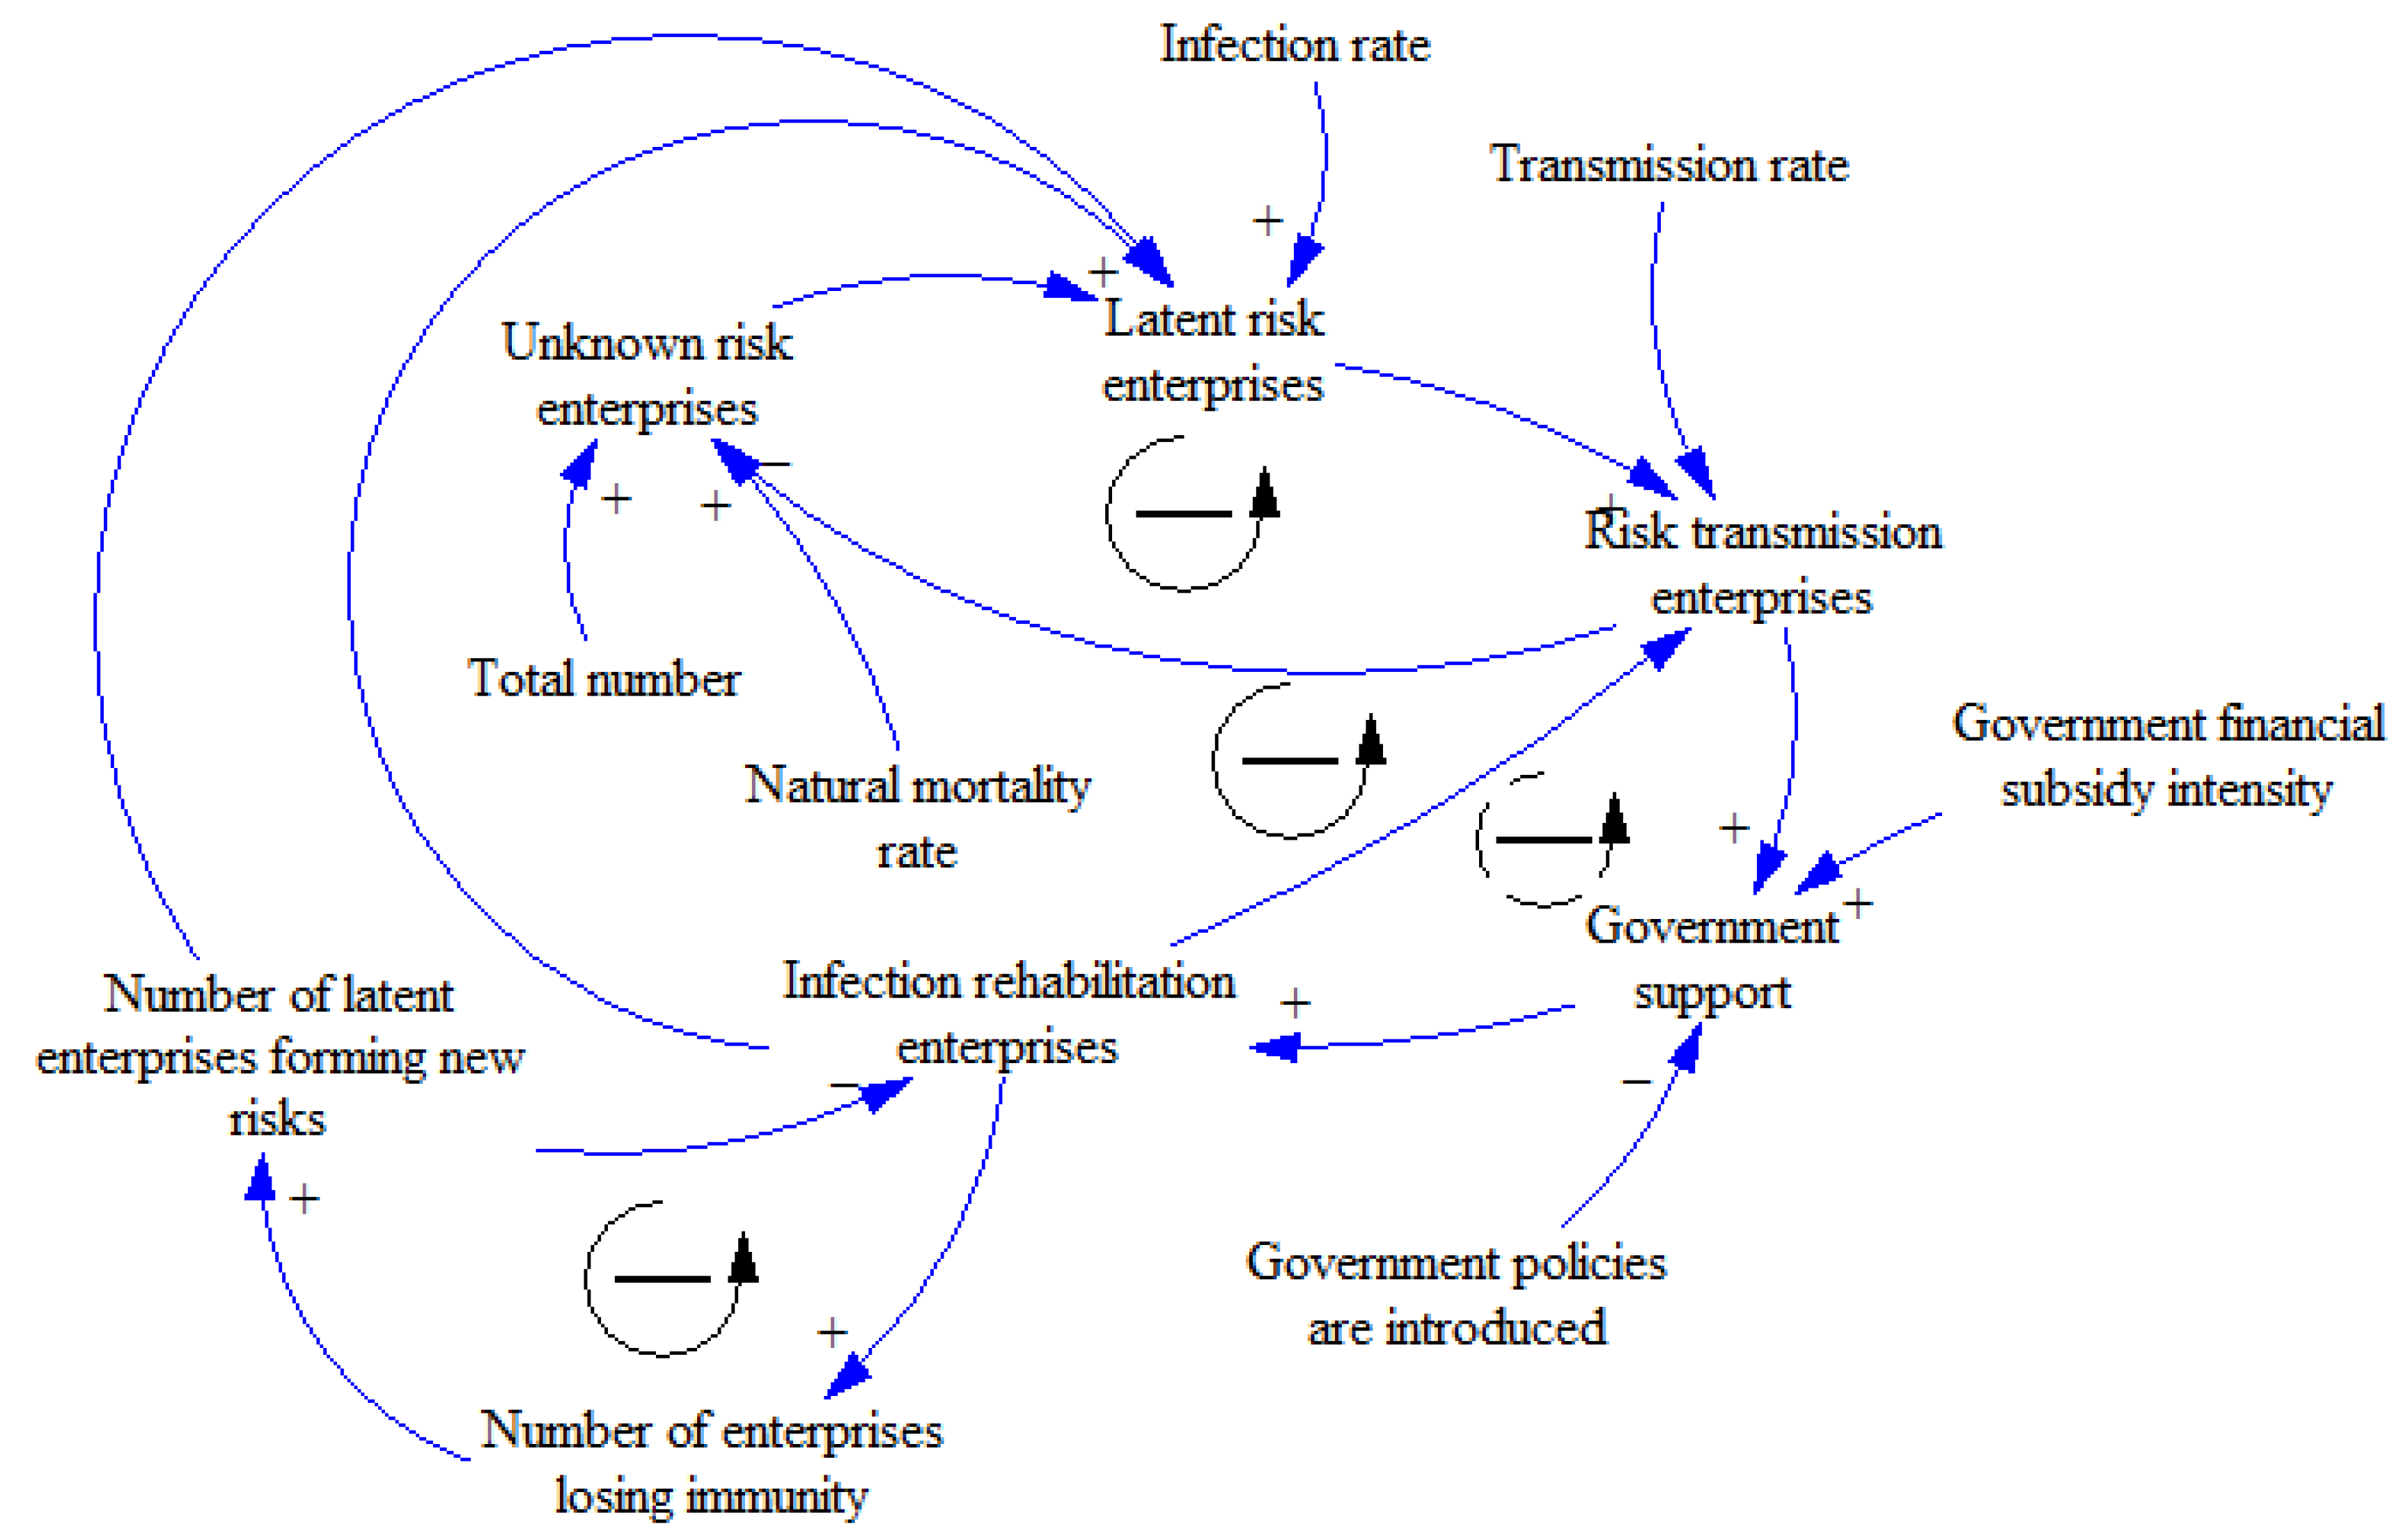
4.2.2. Causality Analysis of Risk Communication

After determining the boundary of system research, through the analysis of the relationship between the internal factors of the boundary, the system causality diagram can be obtained. The risk communication system is no longer a single linear relationship but an intricate nonlinear system, which is a dynamic system under the action of many factors. Through the analysis of the risk propagation mechanism and the risk system of the prefabricated building supply chain, the system causal loop diagram is constructed based on the SEAIR model considering recurrence, and the feedback analysis theory of system dynamics is applied to describe the system structure of the risk propagation of the prefabricated building supply chain by the feedback loop, as shown in Figure 5:
The main circuits included in the figure are explained as follows:
  • Positive feedback loop R1: enterprises with latent risks → enterprises with risk transmission → government support → enterprises with infection and rehabilitation → enterprises with lost immunity → enterprises with new latent risks →enterprises with latent risks.
    The increase in the number of enterprises with latent risks leads to an increase in the number of risk transmission enterprises. When the number of communication enterprises is large, the government is urged to take measures to reduce the number of unstable enterprises affected by risks in the industry so that the number of infection and rehabilitation enterprises will increase, and the number of enterprises losing immunity in the later period will also rise, becoming new enterprises with latent risks.
  • Negative feedback loop B1: latent risk enterprise → risk-spreading enterprise → infection rehabilitation enterprise → latent risk enterprise.
  • Negative feedback loop B2: enterprises with unknown risks → enterprises with latent risks → enterprises with risk transmission → government support → enterprises with infection rehabilitation → enterprises with unknown risks.
    An increase in the number of enterprises with latent risks thus increases the number of enterprises with risk transmission. The increase in the number of communication enterprises is bound to attract the attention of the government, and the enterprises with risk communication should be guided and planned. Under the government’s measures, the number of infection and rehabilitation enterprises in the industry has increased. When the number of enterprises in the industry is fixed, the number of enterprises with latent risks eventually decreases.
  • Negative feedback loop B3: risk communication enterprises → government support → infection rehabilitation enterprises → risk communication enterprises.
    With an increase in the number of risk communication enterprises, the government has strengthened risk control, and some risk communication enterprises will become risk rehabilitation enterprises, which will increase the number of risk rehabilitation enterprises and reduce the number of risk communication enterprises to a certain extent.
  • Negative feedback loop B4: infection rehabilitation enterprises → number of enterprises losing immunity → number of enterprises with latent new risks → infection rehabilitation enterprises.
    With an increase in the number of infection rehabilitation enterprises, to some extent, the number of enterprises that have lost their immunity increases; thus, the number of enterprises with latent new risks will increase, and the number of infection rehabilitation enterprises will be reduced to a certain degree.

4.2.3. Flow Chart Analysis of Risk Communication

According to the causality diagram, a complete system flow diagram is constructed by using the system dynamics Vensim software, as shown in Figure 6:
As shown in Figure 6, the model contains four horizontal variables: enterprises with unknown risks, enterprises with latent risks, enterprises with risk transmission, and enterprises with infection rehabilitation. There are five rate variables: the number of unknown enterprises forming new risks, the number of infections, the number of transmissions, government support, and the number of enterprises losing immunity. There are five constants: infection rate, transmission rate, government financial support, government policy supervision, and the proportion of lost immunity. Through consultation with actual construction personnel and researchers in the field of prefabricated buildings, combined with the research literature in related fields [24,39], each constant is assigned to determine the parameter expression, as shown in Table 2:

4.3. Analysis of Model Simulation Results

As seen from Figure 5, the four main bodies involved in risk communication are risk-unknown enterprises, risk-latent enterprises, risk communication enterprises, and infection rehabilitation enterprises, and the number of the two main bodies of risk communication enterprises and infection rehabilitation enterprises directly reflects the intensity of risk communication. Among them, enterprises with unknown risks are affected by the number of infections, and the number of infections is determined by the infection rate. Latent enterprises are affected by the number of infections, the number of transmissions, and the number of latent enterprises forming new risks, and the number of transmissions is determined by the transmission rate. The number of risk communication enterprises is affected by the amount of communication and government support, and government support is determined by financial support and policy supervision. The number of rehabilitation enterprises is affected by the number of enterprises that have lost their immunity and government support, while the number of enterprises that have lost their immunity is determined by the proportion of those that have lost their immunity. Therefore, in the process of risk spread, the infection rate, spread rate, government financial support, government policy supervision, and the value of the proportion of lost immunity play an important role. Through the analysis of the above factors, combined with the actual participants in the supply chain, the change in the number of risk-spreading enterprises in the component manufacturers and the change in the number of risk rehabilitation enterprises in the transporters are taken as examples to study. Vensim software was used to simulate this, and the influence of the infection rate, transmission rate, government financial support, government policy supervision, and the change in the proportion of losing immunity on risk transmission is explored.

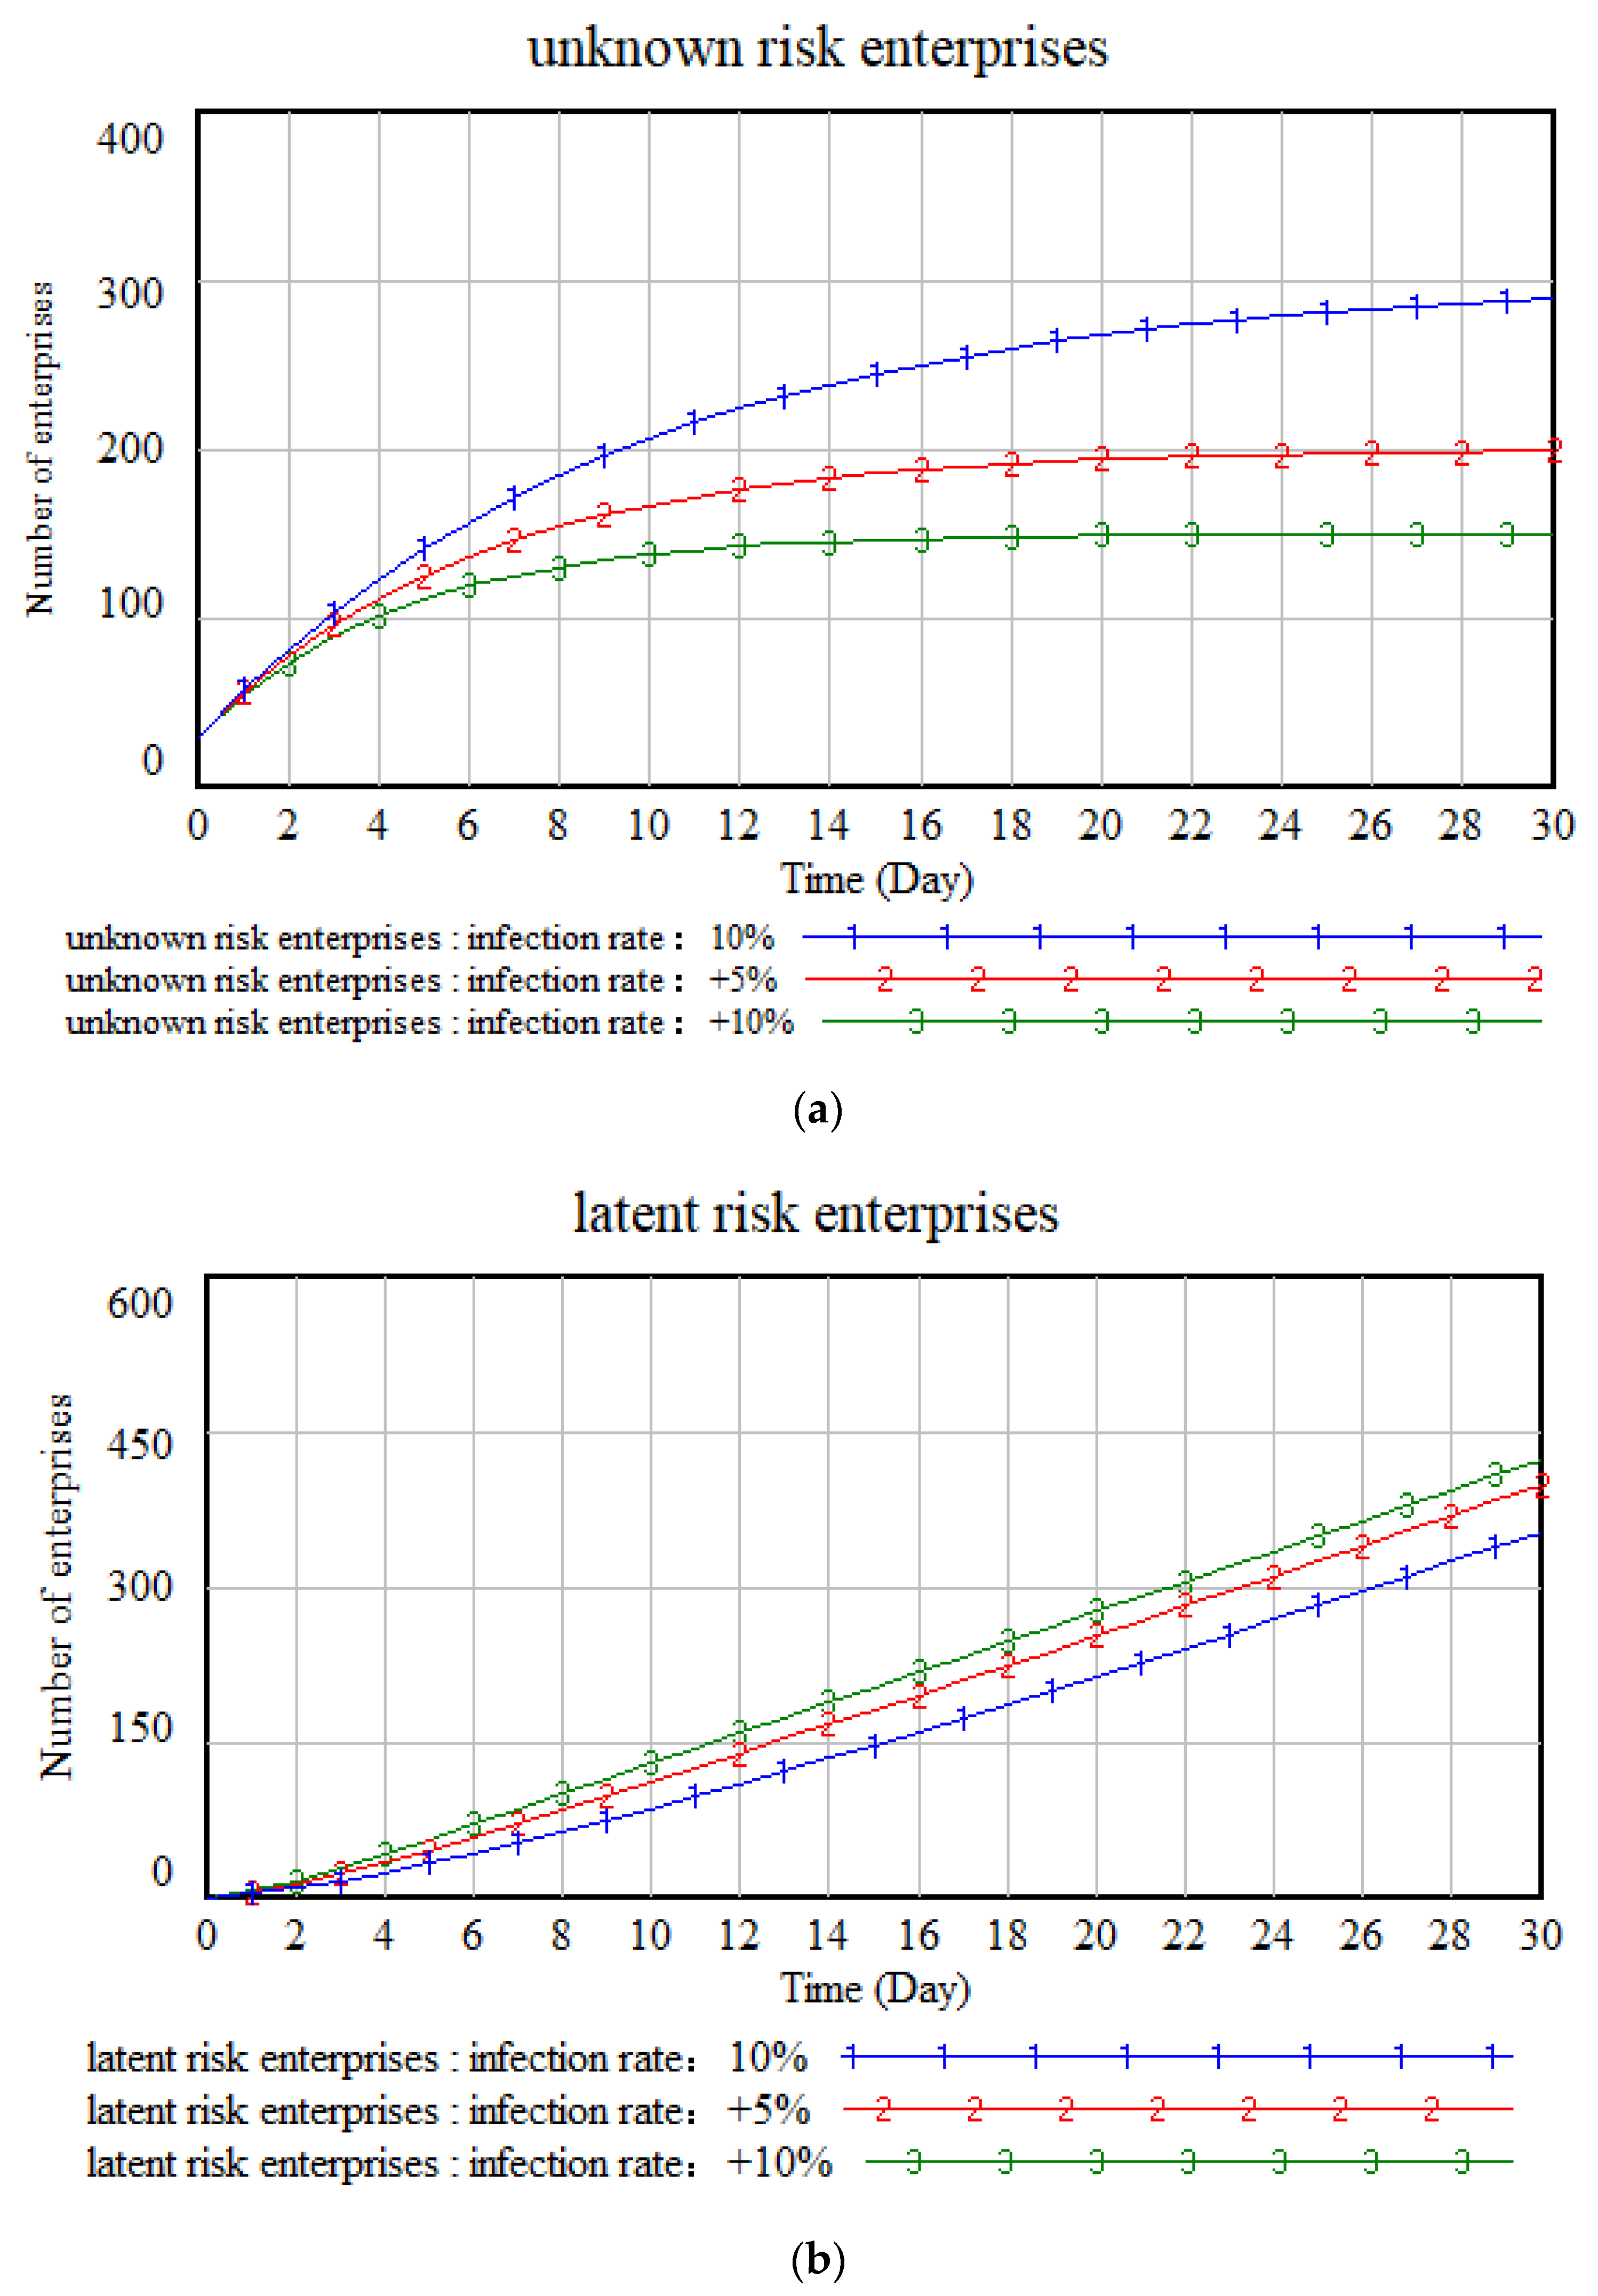
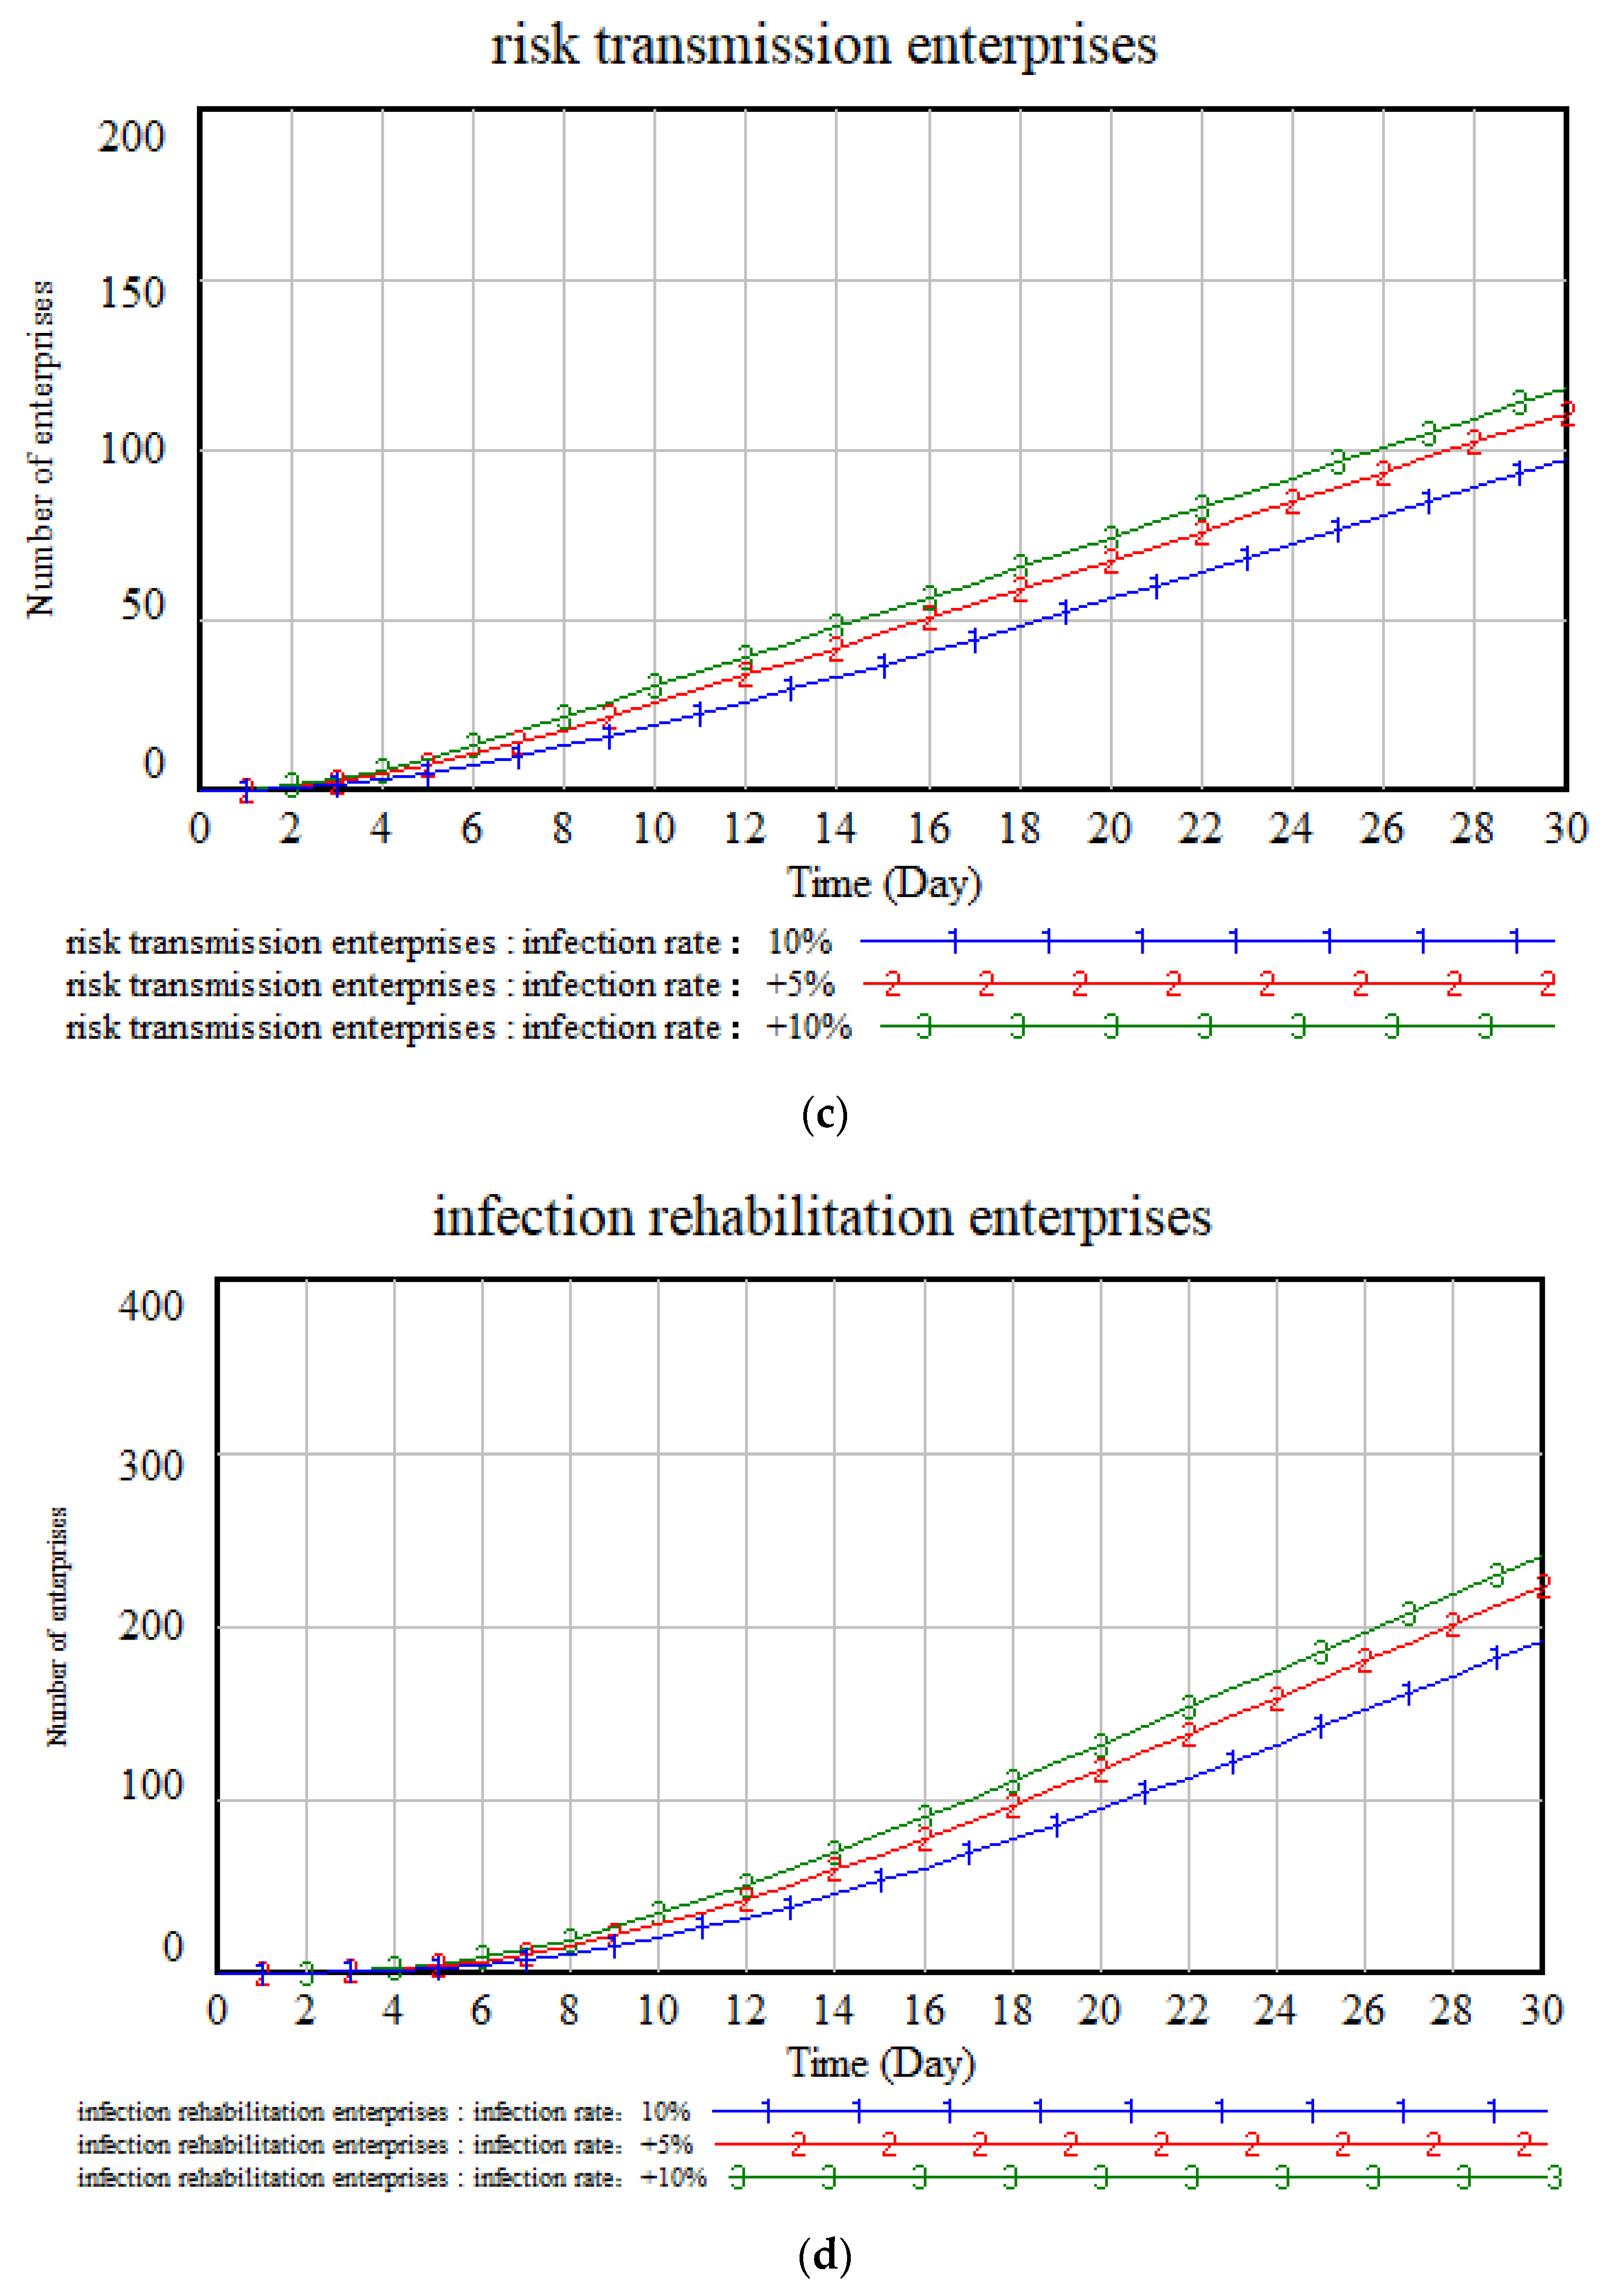
4.3.1. Impact of Change in Infection Rate on Risk Transmission

Set the initial infection rate at 10%, increase the infection rate by 5% and increase by 10%, and observe the change in the number of companies affected by risks. Figure 7 shows that, under the premise of infection rate as an influencing factor, the number of enterprises in the process of risk transmission shows significant changes.
With the increase in infection rate, the number of enterprises with unknown risks gradually increased, showing an overall increasing trend. The greater the initial infection rate, the smaller the number of businesses with unknown risk and the greater the number of businesses affected by the risk.
With the increase in infection rate, the number of risk-latent enterprises gradually increases, the infection rate is greater, and the number of risk-latent enterprises is greater; the greater the initial infection rate is, the greater the number of businesses with latent risk. On the thirtieth day, the number of risk-latent companies was as high as about 400.
The number of companies that spread the risk gradually increases with the increase in the infection rate, and the greater the infection rate, the greater the number of enterprises affected by the risk and the faster the growth rate. The number of enterprises showed a steady growth trend overall.
With the increase in infection rate, under the influence of risks, the number of infection rehabilitation enterprises gradually showed a slow growth trend from the fifth day, and the growth trend accelerated after that; in general, the greater the infection rate, the greater the infection, and the greater the number of rehabilitation enterprises. The study by Chen, J. et al. found a similar problem [23].

4.3.2. Impact of Change in Transmission Rate on Risk Transmission

The initial transmission rate is set to 15%, and the change in the number of companies in the process of risk transmission is observed under the premise that the transmission rate is observed as an influencing factor by 5% in Figure 8.
Under the influence of the transmission rate, the number of enterprises with unknown risk gradually increases, but a certain increase or decrease in the transmission rate of 15% will not affect the image transformation of enterprises with unknown risk. This is because in the context of considering relapse, infection rehabilitation enterprises become risk-latent enterprises after losing immunity to risks, and then continue to become risk transmission enterprises and infection rehabilitation enterprises with the spread of risks, and will not become risk-unknown enterprises. In this context of risk transmission, changes in transmission rate will have an impact on risk-latent enterprises, risk transmission enterprises, and infection recovery enterprises, and will not affect the change in the number of enterprises with unknown risks.
With the increase in transmission rate, the number of risk-latent enterprises has shown an increasing trend. Under different transmission rates, the number of latent enterprises increased in the first two days in line with the level of growth; the greater the transmission rate, the smaller the number of companies with latent risks; the smaller the transmission rate, the greater the number of companies with latent risks. Research by Subrata Paul et al. found a similar problem [40].
With the increase in the transmission rate, the number of risk communication companies showed an increasing trend from the fourth day. The greater the transmission rate, the greater the number of businesses affected by the risk; under the influence of different transmission rates, the initial difference in the number of risk transmission enterprises is small, and the number gap gradually increases over time.
With the increase in the transmission rate, the number of recovered enterprises showed an increasing trend from the sixth day. The transmission rate is proportional to the number of infected recovery enterprises, and the larger the transmission rate, the higher the number of infection rehabilitation enterprises; under the influence of different transmission rates, the initial difference in the number of risk transmission enterprises is small, and the quantitative gap gradually increases with the change in time.

4.3.3. Impact of Changes in Government Financial Support on Risk Communication

The initial government financial support is set at 25%, and the probability of increasing or decreasing by 10% is based on this basis, and the number of companies in the process of risk transmission is changed by the government support obtained in Figure 9.
Under the influence of government financial support, the number of enterprises with unknown risks gradually increases, but a certain increase or decrease in the ratio of 20% will not affect the image transformation of enterprises with unknown risks. This is because in the context of considering relapse, infection rehabilitation enterprises become risk-latent enterprises after losing immunity to risks, and then continue to become risk transmission enterprises and infection rehabilitation enterprises with the spread of risks and will not become risk-unknown enterprises. In the context of this risk transmission, changes in government financial support will have an impact on risk-latent enterprises, risk transmission enterprises, and infection recovery enterprises, and will not affect the change in the number of enterprises with unknown risks.
Under the change of government support, the number of enterprises with latent risks has shown an increasing trend. With different government support, the number of latent enterprises increased in the first 14 days in line with the level of growth; the greater the government support, the greater the number of companies with latent risks; the smaller the government support, the smaller the number of companies with latent risks.
Under the change in government support, the number of risk communication enterprises has shown an increasing trend. The financial support of the government is inversely proportional to the number of risk communication enterprises, and the greater the government support, the smaller the number of risk communication enterprises under the state of being affected by risk; with the passage of time, the initial difference in the number of risk-propagating enterprises under different government support is small, and the number gap gradually increases over time.
The degree of government support is directly proportional to the number of enterprises recovering from infection, and the number of rehabilitation enterprises has increased. With the increase in government financial support, the number of enterprises recovering from infection first showed a slow growth, and then increased the range of change.

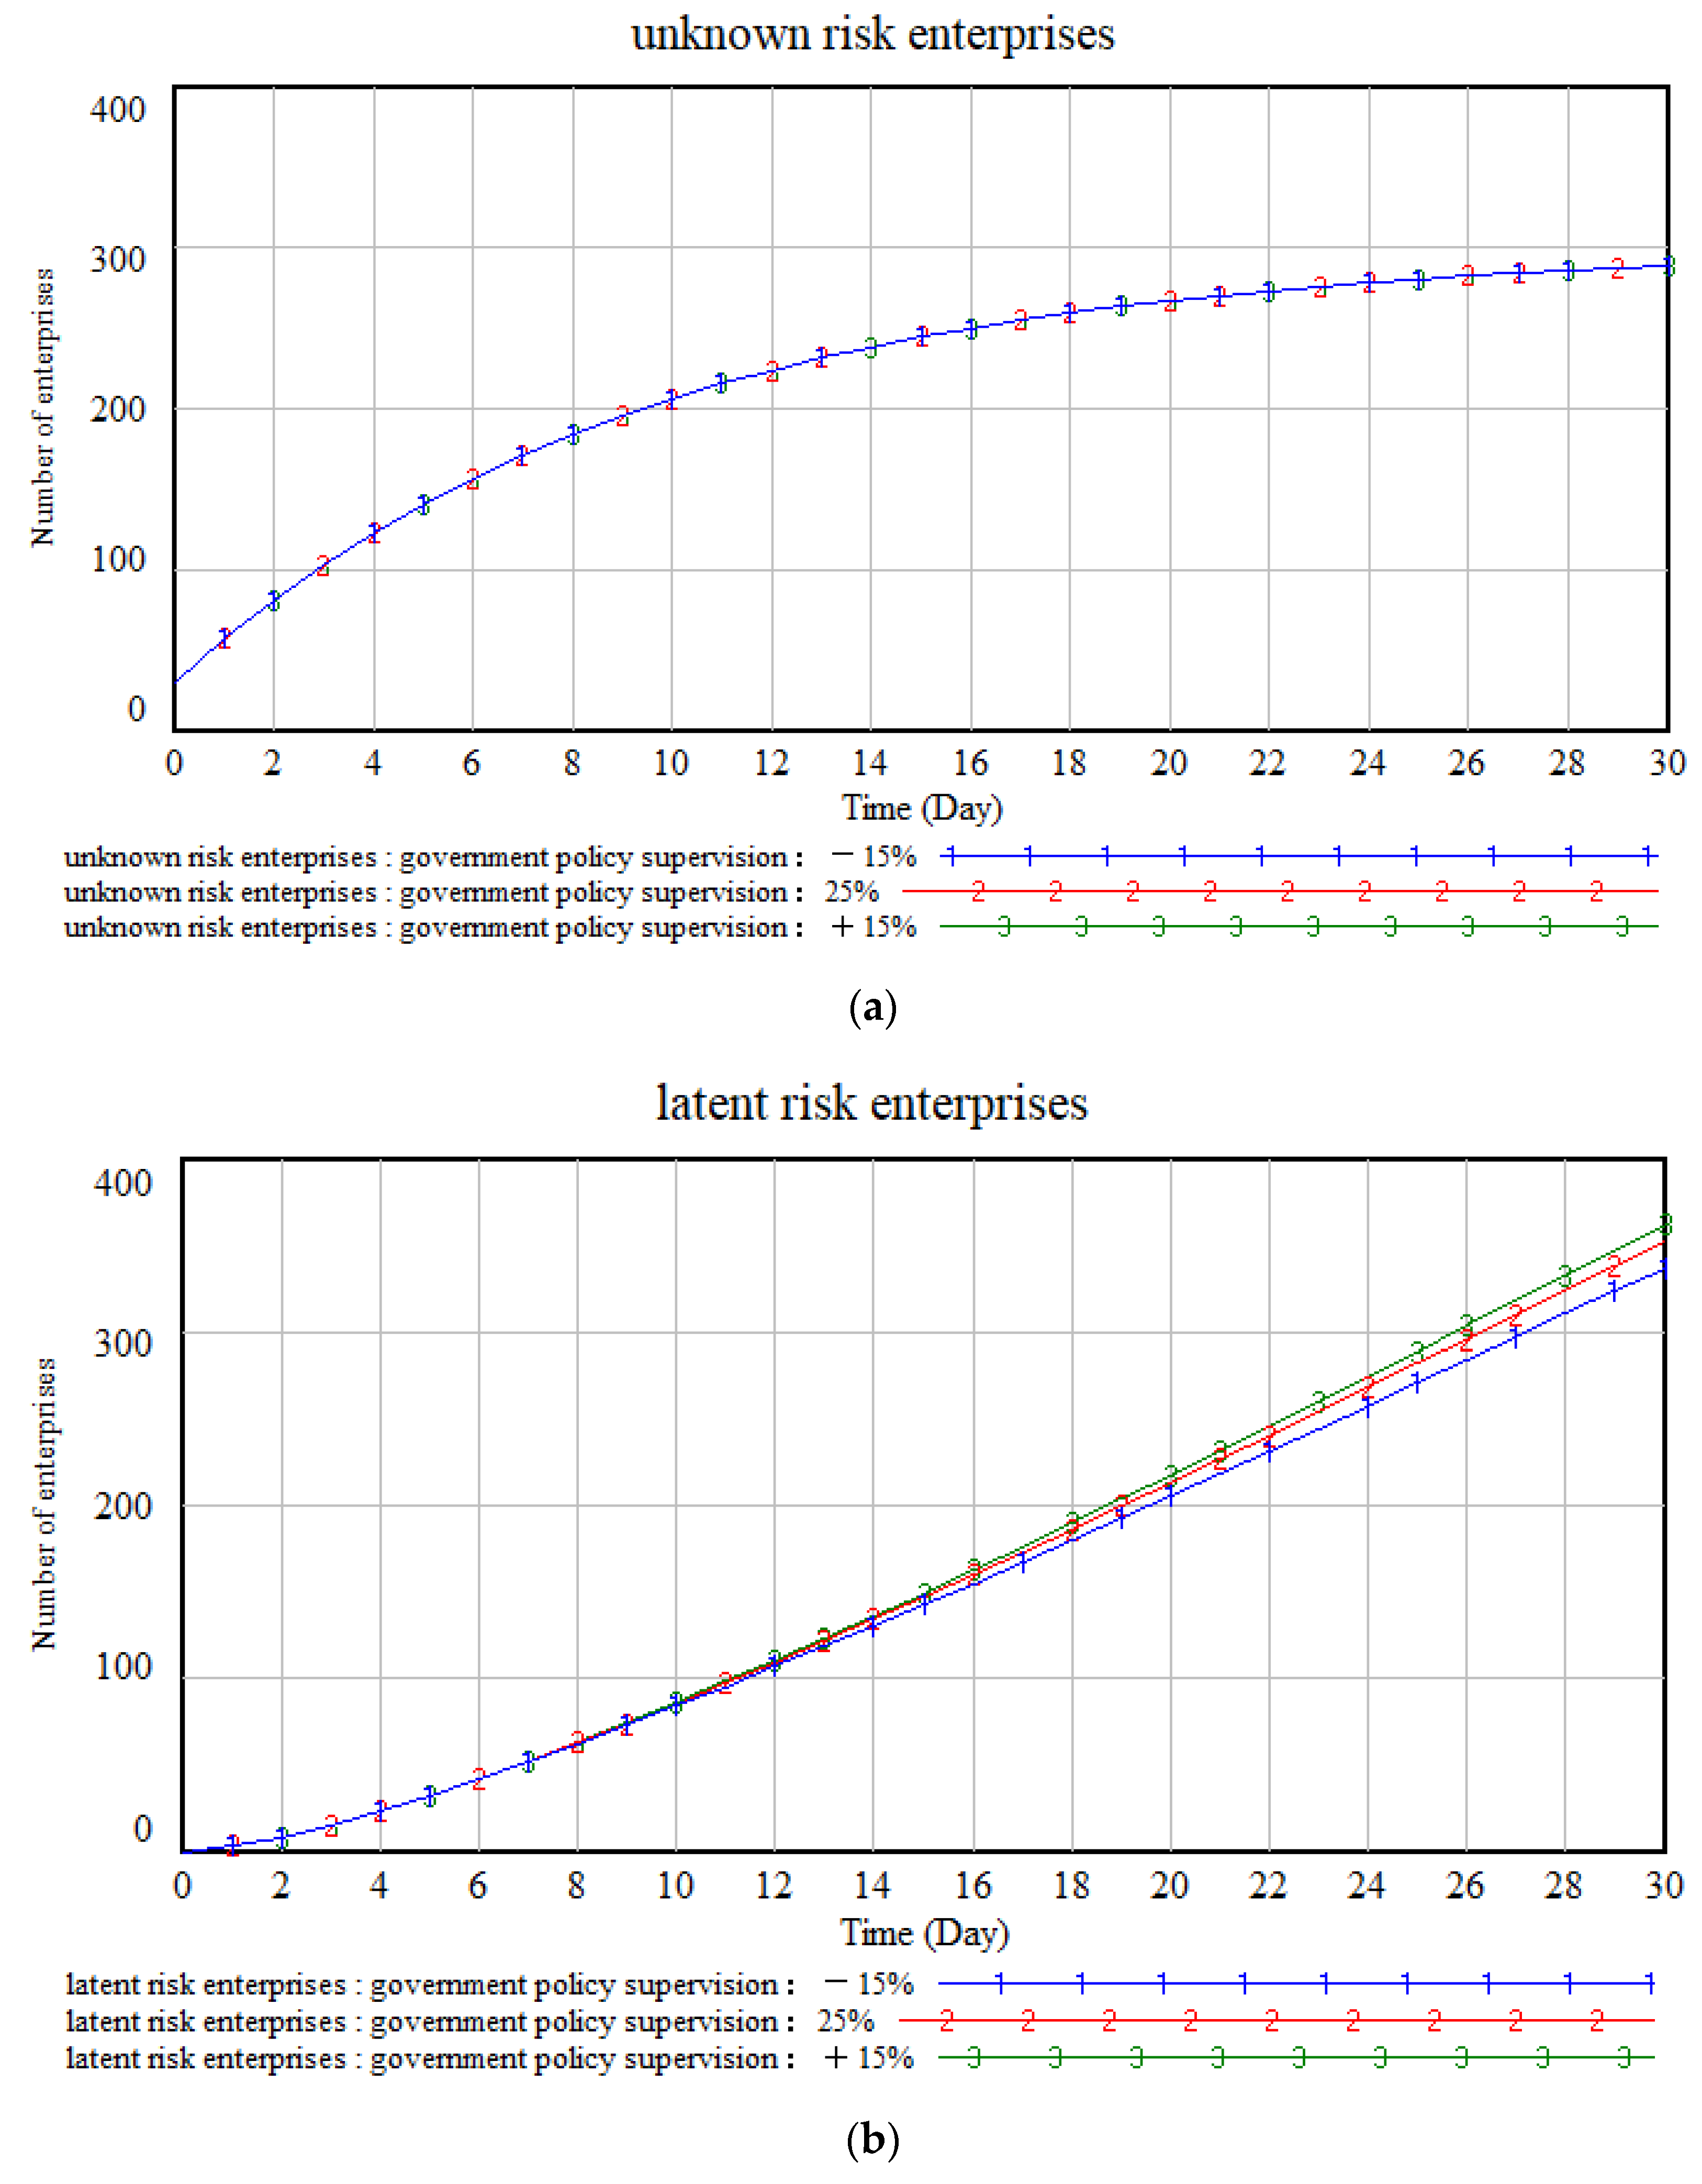
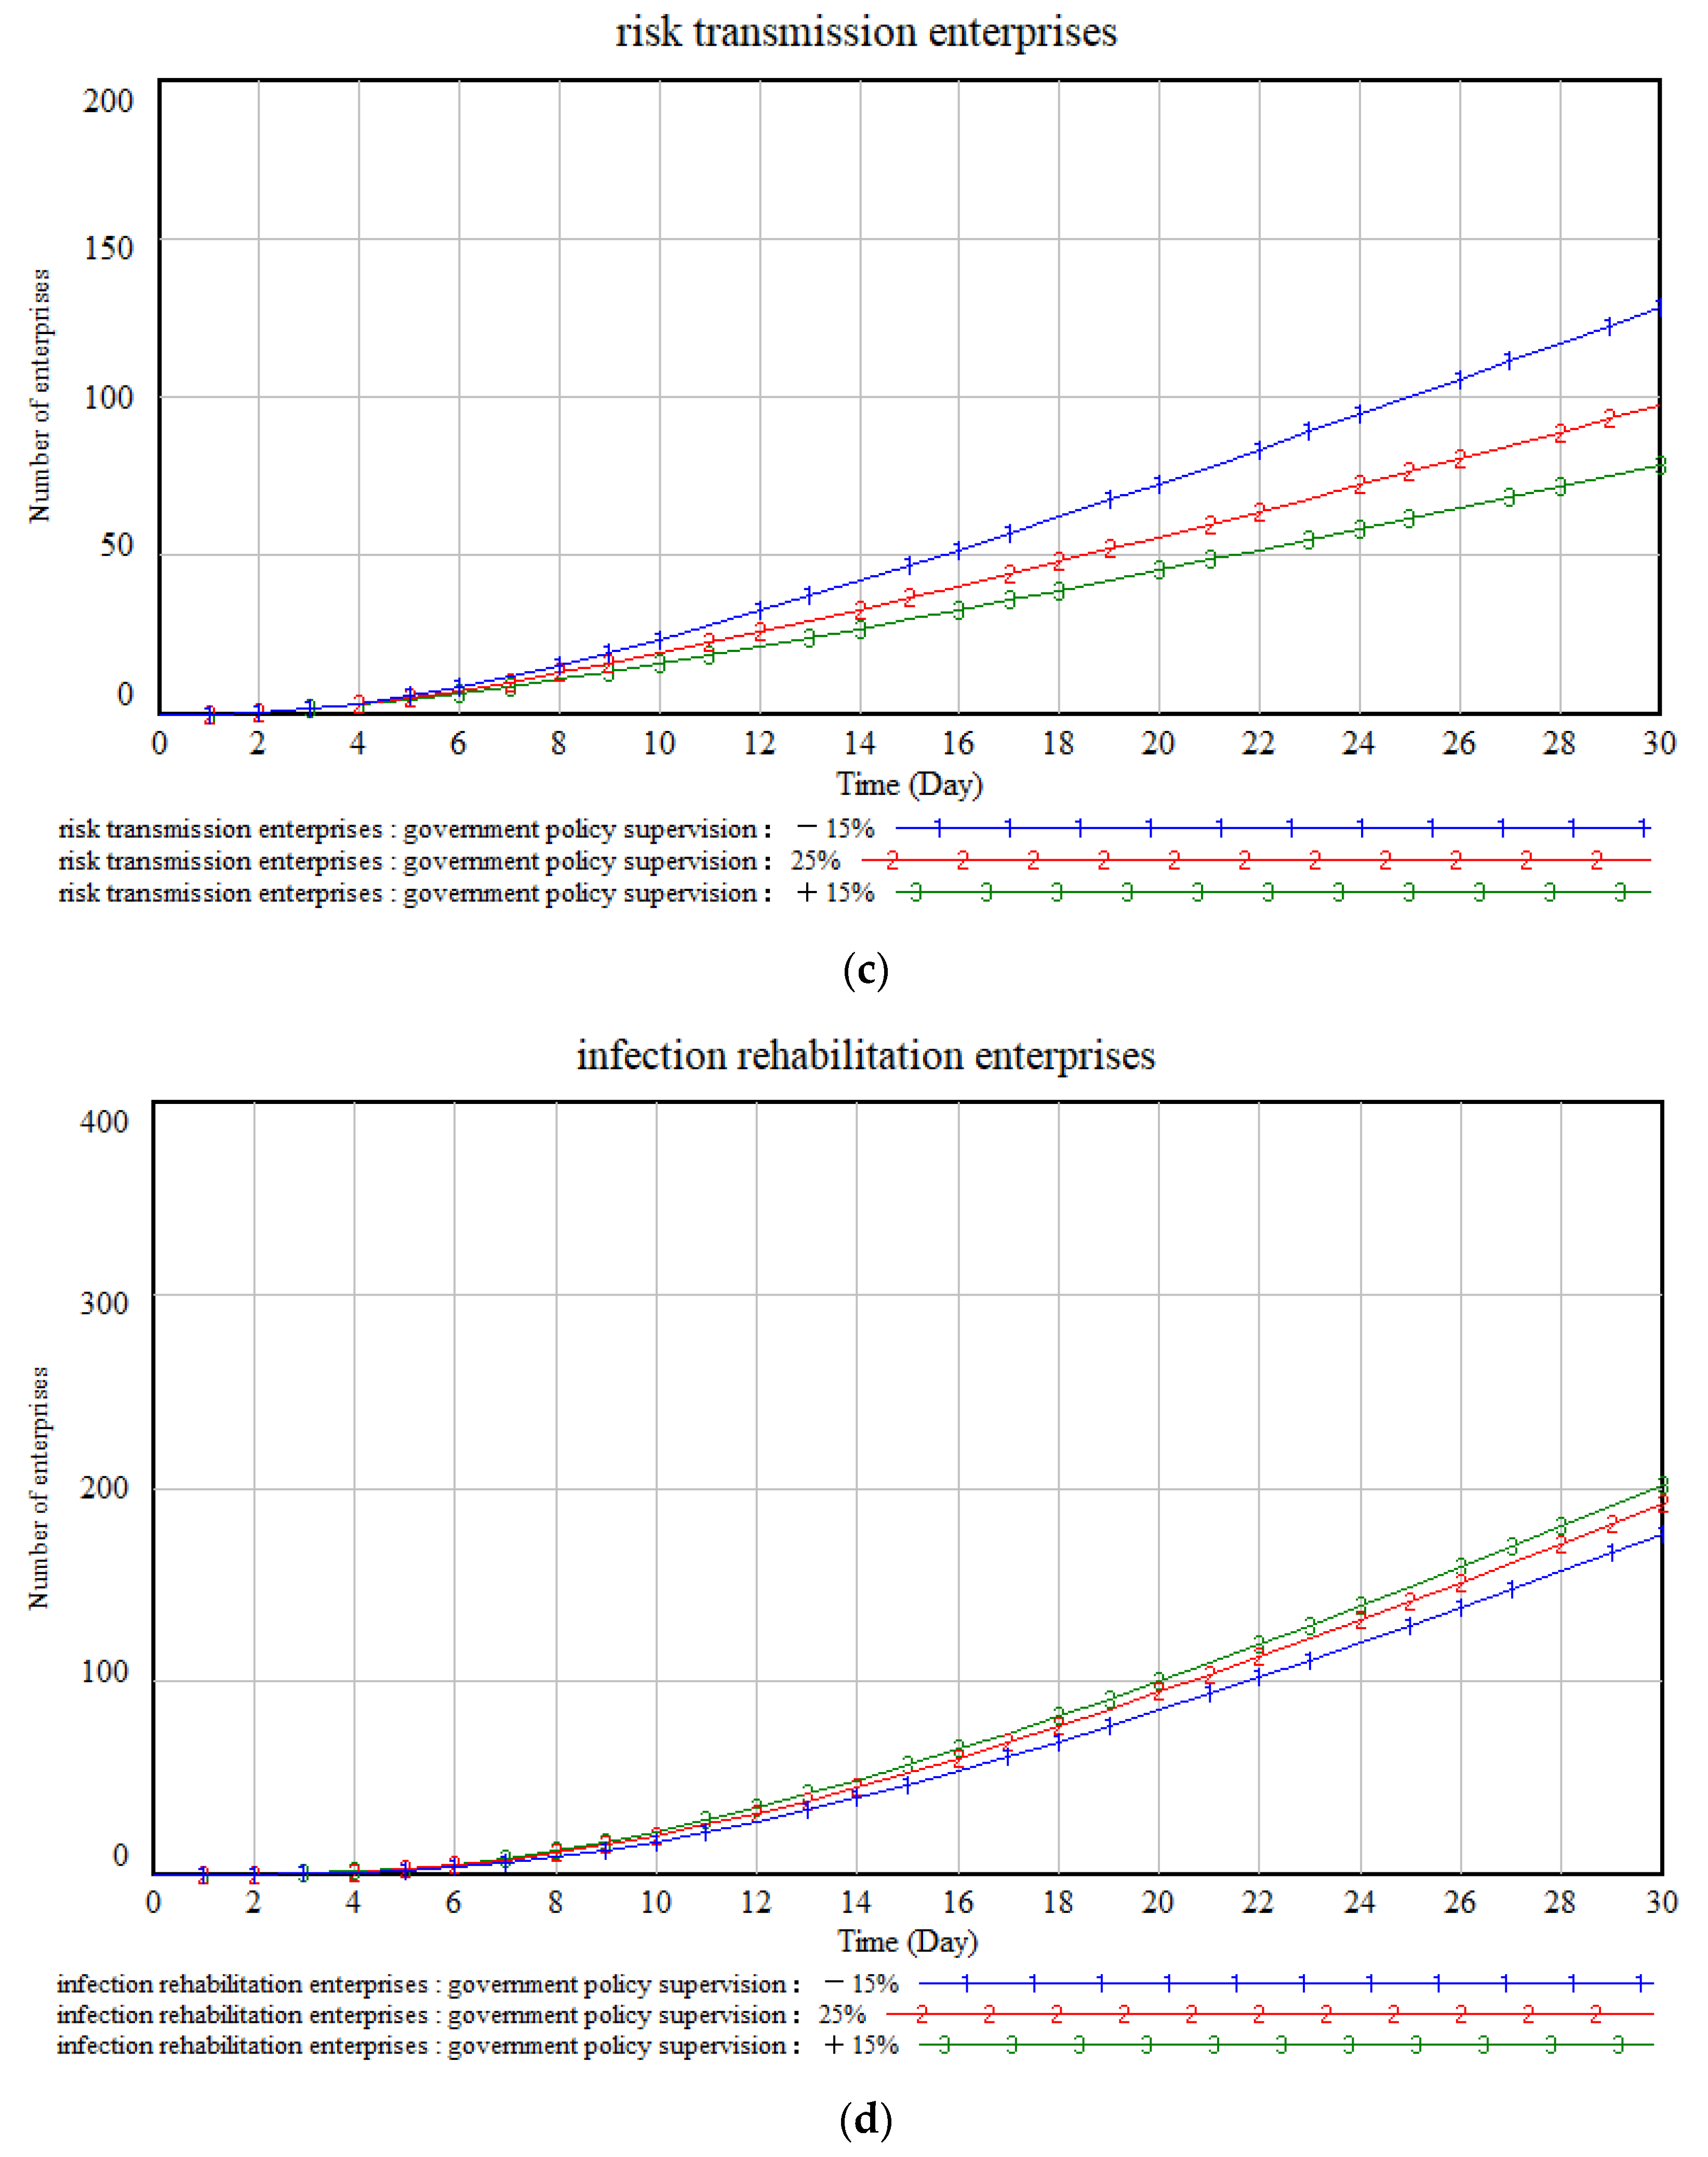
4.3.4. Impact of Changes in Government Policy Supervision on Risk Communication

The initial value of government policy supervision is set to 25%, and on this basis, a change of 15% is made, and Figure 10 shows the change in the number of enterprises in the process of risk transmission under government supervision.
Under the influence of government policies and supervision, the number of enterprises with unknown risks gradually increases, but a certain increase or decrease in the ratio of 15% will not affect the image transformation of enterprises with unknown risks. This is because in the context of considering relapse, infection rehabilitation enterprises become risk-latent enterprises after losing immunity to risks, and then continue to become risk transmission enterprises and infection rehabilitation enterprises with the spread of risks, and will not become risk-unknown enterprises. Under this background of risk transmission, changes in government policies and supervision will have an impact on risk-latent enterprises, risk transmission enterprises, and infection recovery enterprises, and will not affect the change in the number of enterprises with unknown risks.
The impact of government policies and supervision on the number of enterprises with latent risks is to increase slowly at first, and then increase the growth range. However, on the whole, the impact of changes in government supervision on the number of enterprises with latent risks has not changed much. Under different policies and supervision, the number of enterprises affected by risk all increased from the first 0, and then with the increase in supervision, the number of enterprises with latent risks gradually increased.
The stronger the government supervision, the greater the number of risk transmission enterprises and infection rehabilitation enterprises, but in general, the impact of government supervision on the number of risk transmission enterprises and rehabilitation enterprises gradually increases over time. Under the influence of government policies and supervision, the number of risk transmission enterprises and infection recovery enterprises gradually showed an upward trend since the previous days, and the number growth changed little, and then the quantitative gap gradually increased.

4.3.5. Impact of Change in the Proportion of Lost Immunity on Risk Transmission

The initial immunity loss ratio is set to 20%, the increase is set to 25%, and the decrease is set to 15%, and the change in the number of companies in the process of risk transmission is obtained from Figure 11.
Under the influence of government policies and supervision, the number of enterprises with unknown risks gradually increases, but a certain increase or decrease in the ratio of 20% will not affect the image transformation of enterprises with unknown risks. This is because in the context of considering relapse, infection rehabilitation enterprises become risk-latent enterprises after losing immunity to risks, and then continue to become risk transmission enterprises and infection rehabilitation enterprises with the spread of risks, and will not become risk-unknown enterprises. In the context of this risk transmission, the change in the proportion of loss of immunity will have an impact on risk-latent enterprises, risk transmission enterprises, and infection recovery enterprises, and will not affect the change in the number of risk-unknown enterprises.
Enterprises with lurking risks are generally showing a growth trend. The change in the proportion of loss of immunity has a direct impact on the number of risk-latent enterprises, and the larger the proportion of loss of immunity, the greater the number of risk-latent enterprises.
With the increase in the proportion of loss of immunity, the number of risk transmission enterprises gradually increases, which is directly proportional to the two; a lower number of recovered enterprises is inversely proportional to the two.

5. Conclusions

Based on the consideration of the SEAIR model, this paper established the risk propagation model of the prefabricated building supply chain and studied the impact of each influencing factor on the supply chain risk propagation by simulating each enterprise, increase and decrease in the virus transmission model, and used Vensim simulation software to set the initial value of related factors. Based on the above results, relevant suggestions are made:
  • With the increase in infection rate, the number of enterprises in the supply chain that are not affected by risk will be greatly reduced, and the number of risk transmission enterprises and the number of risk-latent enterprises will increase significantly. With the increase in transmission rate, the change trend of risk transmission enterprises, risk-latent enterprises, and infection recovery enterprises in the supply chain is roughly the same as the change in the number of enterprises brought about by the increase or decrease in infection rate, but the change in transmission rate will not affect the change in the number of enterprises with unknown risk. Through the above simulation, it can be seen that this is because, while considering the recurrence, some of the risk rehabilitation enterprises may continue to form new risk-latent enterprises, and with the spread of risks, new risk-latent enterprises become risk transmission enterprises and infection rehabilitation enterprises, which will not affect the number of risk-unknown enterprises.
    In order to effectively control the number of enterprises affected by risks, it is necessary to take certain measures to reduce the infection rate, which requires enterprises to actively seek the cooperation of other manufacturers when producing products, find enterprises eroded by risks, avoid risks in time, and reduce infection from the root. The enterprise itself actively takes anti-risk measures, understands the enterprises it contacts to prevent itself from being infected, understands the potential risk factors of the department of the enterprise affected by the risk in the production process of the product, assesses its risk level, prepares emergency plans in advance, reduces the business dealings between the department affected by the risk and other departments that are not affected, and avoids the expansion of the risk infection rate.
  • With the strengthening of government financial support and government policy supervision, the number of risk-spreading enterprises in some manufacturers affected by risks in the supply chain began to decline, and the ability of enterprises to eliminate risks was enhanced. Therefore, to reduce the number of risk-spreading enterprises in manufacturers affected by risks, the government can appropriately introduce relevant policies, such as giving appropriate financial subsidies to help the trapped manufacturing enterprises get rid of the risks as soon as possible and resume production. A series of targeted measures can be taken to reduce the tax ratio and reduce the burden on enterprises.
  • With the increase in the proportion of enterprises losing immunity in the supply chain, the ability of enterprises to mitigate risks decreases, and they are easily eroded by risks, resulting in an increase in the number of risk-spreading enterprises affected by risks. Therefore, to reduce the spread of risks in the supply chain, enterprises should gradually improve their ability to cope with risks, avoid the impact of risks, strengthen contact with other enterprises in the supply chain, and enhance their ability to cope with risks. As the information flow, capital flow, logistics, and other aspects among manufacturing enterprises in the supply chain are interconnected and closely related, one party will be implicated in many parties when it receives the risk impact, and the enterprises affected by the risk should actively inform the relevant business enterprises of their own information affected by the risk to provide a reference for the risk prevention of other enterprises. In the process of dealing with risks, each node enterprise should help each other and avoid fighting alone. Enterprises that have not been affected by risks should actively face risks while assisting those affected by risks to reduce the impact of risk erosion on the supply chain.
    This paper studies the mechanism of supply chain risk transmission from a macro perspective. In this study, enterprises without obvious symptoms are easily ignored after risk erosion, so asymptomatic infected enterprises are increased, a virus transmission model is established, and the impact of risk transmission in the supply chain on enterprises is analysed. Taking the risk impact of unknown risk enterprises, risk-latent enterprises, risk transmission enterprises, and infection recovery enterprises as examples, suggestions for dealing with supply chain risks are put forward from three perspectives: reducing the infection rate and transmission rate, strengthening government support, and coping with risk erosion. At the same time, because the SEAIR model is a typical model for studying virus transmission, with the development of society, human beings have more diverse ways to deal with virus transmission, and the model for studying virus transmission also needs to be improved. The research process of this paper does not consider the time lag between the measures taken by enterprises and their effects after suffering from risk erosion, that is, the transmission process of enterprises affected by risks and solving risk problems has a time transmission process. The length of the time transmission process has a certain impact on the number of risk transmission enterprises and infection recovery enterprises. Therefore, future studies will improve on the basis of the SEAIR model and increase the time delay for analysis.

Author Contributions

Conceptualization, X.G. and R.S.; methodology, Y.W.; software, Y.W.; validation L.R. and Y.W.; formal analysis, L.L. and X.W.; investigation. L.R.; resources. Y.W.; data curation, L.R.; writing—original draft preparation, R.S.; writing—review and editing, X.G. and Y.W. visualization, L.R.; supervision L.L. and X.W. All authors have read and agreed to the published version of the manuscript.

Funding

This research was funded by the State Key Program of National Social Science Foundation of China (Grant no. 19AGL030) and Research Subject of Social Science Development of Hebei (Grant no. 20210201118).

Data Availability Statement

We declare that all data, models, and code generated or used during the study appear in the submitted article.

Acknowledgments

In this study, I would like to thank Wang Yingchen for his careful guidance and strong support and the students on the team for listening and exchanging ideas so that the research paper could be successfully published.

Conflicts of Interest

The authors declare no conflict of interest.

References

  1. Masood, R.; Lim, J.B.P.; González, V.A.; Roy, K.; Khan, K.I.A. A Systematic Review on Supply Chain Management in Prefabricated House-Building Research. Buildings 2022, 12, 40. [Google Scholar] [CrossRef]
  2. Zhu, T.; Liu, G. A Novel Hybrid Methodology to Study the Risk Management of Prefabricated Building Supply Chains: An Outlook for Sustainability. Sustainability 2023, 15, 361. [Google Scholar] [CrossRef]
  3. Zhang, K.; Tsai, J.-S. Identification of Critical Factors Influencing Prefabricated Construction Quality and Their Mutual Relationship. Sustainability 2021, 13, 11081. [Google Scholar] [CrossRef]
  4. Liu, K.; Su, Y.; Zhang, S. Evaluating Supplier Management Maturity in Prefabricated Construction Project-Survey Analysis in China. Sustainability 2018, 10, 3046. [Google Scholar] [CrossRef] [Green Version]
  5. Zhang, C.; Qiao, M. Risk assessment of prefabricated building supply chain based on BP neural network. Proj. Manag. Technol. 2022, 20, 28–33. (In Chinese) [Google Scholar]
  6. Wai, C.T.; Yi, P.W.; Olanrewaju, O.I.; Abdelmageed, S.; Hussein, M.; Tariq, S.; Zayed, T. A critical analysis of benefits and challenges of implementing modular integrated construction. Int. J. Constr. Manag. 2021, 23, 656–668. [Google Scholar] [CrossRef]
  7. Wang, X.; Zhou, S.; Guo, Y.; Duan, Y. Research on supply chain risk of prefabricated buildings based on EFA and CFA. Pract. Underst. Math. 2021, 51, 286–299. (In Chinese) [Google Scholar]
  8. Zhang, M. Research on the Risk of Prefabricated Building Supply Chain from the Perspective of Information Dissemination. Master’s Thesis, Tianjin University of Technology, Tianjin, China, 2021. (In Chinese). [Google Scholar]
  9. Gu, L. Research on the Supply Chain Risk Management of Prefabricated Concrete Buildings Based on System Dynamics. Master’s Thesis, Yangzhou University, Yangzhou, China, 2020. (In Chinese). [Google Scholar]
  10. Zhang, F. Study on the Risk Assessment of EPC Prefabricated Concrete Building Supply Chain Based on Cloud Model. Master’s Thesis, Jiangxi University of Science and Technology, Ganzhou, China, 2020. (In Chinese). [Google Scholar]
  11. An, H.; Kuang, Y.; Yang, W.; Song, L. Analysis on the motivation of supply chain integration of prefabricated buildings based on SEM. J. Civ. Eng. Manag. 2020, 37, 50–56. (In Chinese) [Google Scholar]
  12. Wang, J.; Zhu, X.; Song, Z. Risk identification and evaluation of supply chain integration of prefabricated buildings based on interface management. J. Qingdao Univ. Technol. 2020, 41, 41–49. [Google Scholar]
  13. Al-Aidrous, A.-H.M.H.; Shafiq, N.; Al-Ashmori, Y.Y.; Al-Mekhlafi, A.-B.A.; Baarimah, A.O. Essential Factors Enhancing Industrialized Building Implementation in Malaysian Residential Projects. Sustainability 2022, 14, 11711. [Google Scholar] [CrossRef]
  14. Orlowski, K.; Shanaka, K.; Mendis, P. Manufacturing, Modeling, Implementation and Evaluation of a Weatherproof Seal for Prefabricated Construction. Buildings 2018, 8, 120. [Google Scholar] [CrossRef] [Green Version]
  15. Luo, L.; Shen, G.Q.; Xu, G.; Liu, Y.; Wang, Y. Stakeholder-Associated Supply Chain Risks and Their Interactions in a Prefabricated Building Project in Hong Kong. J. Manag. Eng. 2019, 35, 05018015. [Google Scholar] [CrossRef]
  16. Wuni, I.Y.; Shen, G.Q.; Osei-Kyei, R.; Agyeman-Yeboah, S. Modelling the critical risk factors for modular integrated construction projects. Int. J. Constr. Manag. 2022, 22, 2013–2026. [Google Scholar] [CrossRef]
  17. Saad, S.; Alaloul, W.S.; Ammad, S.; Altaf, M.; Qureshi, A.H. Identification of critical success factors for the adoption of Industrialized Building System (IBS) in Malaysian construction industry. Ain Shams Eng. J. 2021, 13, 101547. [Google Scholar] [CrossRef]
  18. Daley, D.J.; Kendall, D.G. Epidemics andrumours. Nature 1964, 204, 11–18. [Google Scholar] [CrossRef] [PubMed]
  19. Anderson, R.; May, R. Infectious Diseases of Humans: Dynamics and Control; Oxford University Press: Oxford, UK, 1991. [Google Scholar]
  20. Tan, Y.; Cai, Y.; Wang, X.; Peng, Z.; Wang, K.; Yao, R.; Wang, W. Stochastic dynamics of an SIS epidemiological model with media coverage. Math. Comput. Simul. 2023, 204, 1–27. [Google Scholar] [CrossRef]
  21. Dobie, A.P. Susceptible-infectious-susceptible (SIS) model with virus mutation in a variable population size. Ecol. Complex. 2022, 50, 101004. [Google Scholar] [CrossRef]
  22. Choi, W.; Lin, Z.; Ahn, I. SIS reaction–diffusion model with risk-induced dispersal under free boundary. Nonlinear Anal. Real World Appl. 2022, 67, 103605. [Google Scholar] [CrossRef]
  23. Chen, J.; Yin, T. Transmission Mechanism of Post-COVID-19 Emergency Supply Chain Based on Complex Network: An Improved SIR Model. Sustainability 2023, 15, 3059. [Google Scholar] [CrossRef]
  24. Liang, D.; Bhamra, R.; Liu, Z.; Pan, Y. Risk Propagation and Supply Chain Health Control Based on the SIR Epidemic Model. Mathematics 2022, 10, 3008. [Google Scholar] [CrossRef]
  25. Ni, G.; Wang, Y.; Gong, L.; Ban, J.; Li, Z. Parameters Sensitivity Analysis of COVID-19 Based on the SCEIR Prediction Model. COVID 2022, 2, 1787–1805. [Google Scholar] [CrossRef]
  26. Baba, I.A.; Humphries, U.W.; Rihan, F.A. A Well-Posed Fractional Order Cholera Model with Saturated Incidence Rate. Entropy 2023, 25, 360. [Google Scholar] [CrossRef] [PubMed]
  27. Aliano, M.; Cananà, L.; Cestari, G.; Ragni, S. A Dynamical Model with Time Delay for Risk Contagion. Mathematics 2023, 11, 425. [Google Scholar] [CrossRef]
  28. Li, B.; Eskandari, Z.; Avazzadeh, Z. Dynamical Behaviors of an SIR Epidemic Model with Discrete Time. Fractal Fract. 2022, 6, 659. [Google Scholar] [CrossRef]
  29. Marinovg, T.T.; Marinovag, R.S. Inverse problem for adaptive SIR model: Application to COVID-19 in Latin America. Infect. Dis. Model. 2022, 7, 134–148. [Google Scholar] [CrossRef]
  30. Karmaker, C.L.; Al Aziz, R.; Palit, T.; Bari, A.M. Analyzing supply chain risk factors in the small and medium enterprises under fuzzy environment: Implications towards sustainability for emerging economies. Sustain. Technol. Entrep. 2023, 2, 100032. [Google Scholar] [CrossRef]
  31. Kumar, S.; Barua, M.K. Modeling and investigating the interaction among risk factors of the sustainable petroleum supply chain. Resour. Policy 2022, 79, 102922. [Google Scholar] [CrossRef]
  32. Arshad, H.; Zayed, T. Critical influencing factors of supply chain management for modular integrated construction. Autom. Constr. 2022, 144, 104612. [Google Scholar] [CrossRef]
  33. Sunmola, F.; Burgess, P.; Tan, A.; Chanchaichujit, J.; Balasubramania, S.; Mahmud, M. Prioritising Visibility Influencing Factors in Supply Chains for Resilience. Procedia Comput. Sci. 2023, 217, 1589–1598. [Google Scholar] [CrossRef]
  34. Xu, M.; Cui, Y.; Hu, M.; Xu, X.; Zhang, Z.; Liang, S.; Qu, S. Supply chain sustainability risk and assessment. J. Clean. Product. 2019, 225, 857–867. [Google Scholar] [CrossRef]
  35. Yi, C.-Q.; Meng, S.-D.; Zhang, D.-M. Studies on the Supply Chain Risk Management Using Complex Network. In Liss 2012; Springer: Berlin/Heidelberg, Germany, 2013; pp. 181–187. [Google Scholar]
  36. Sun, Q.; Yang, G.; Zhou, A. An Entropy-Based Self-Adaptive Node Importance Evaluation Method for Complex Networks. Complexity 2020, 2020, 4529429. [Google Scholar] [CrossRef]
  37. Batistela, C.M.; Ramos, M.M.; Cabrera, M.A.; Dieguez, G.M.; Piqueira, J.R. Vaccination and social distance to prevent COVID-19. IFAC-PapersOnLine 2021, 54, 151–156. [Google Scholar] [CrossRef]
  38. Liu, P.; Tan, X. Dynamics Analysis of a Class of Stochastic SEIR Models with Saturation Incidence Rate. Symmetry 2022, 14, 2414. [Google Scholar] [CrossRef]
  39. Wu, Z.; Wang, Y.; Gao, J.; Song, J.; Zhang, Y. A Multistage Time-Delay Control Model for COVID-19 Transmission. Sustainability 2022, 14, 14657. [Google Scholar] [CrossRef]
  40. Paul, S.; Mahata, A.; Ghosh, U.; Roy, B. Study of SEIR epidemic model and scenario analysis of COVID-19 pandemic. Ecol. Genet. Genom. 2021, 19, 100087. [Google Scholar] [CrossRef] [PubMed]
Figure 1. Risk transmission mechanism of a prefabricated building supply chain.
Buildings 13 00981 g001
Figure 2. Recurrent SEAIR model.
Buildings 13 00981 g002
Figure 3. Causal analysis of the supply chain risk of prefabricated buildings.
Buildings 13 00981 g003
Figure 4. Result tree of government policy changes.
Buildings 13 00981 g004
Figure 5. Causal circuit diagram of risk propagation.
Buildings 13 00981 g005
Figure 6. Flow chart of risk propagation.
Buildings 13 00981 g006
Figure 7. Impact of changes in infection rates on the number of enterprises in the process of risk transmission: (a) the impact of infection rates on businesses with unknown risks; (b) the impact of infection rates on businesses with latent risks; (c) the impact of infection rates on businesses where risk spreads; (d) impact of infection rate on infection recovery businesses.
Buildings 13 00981 g007aBuildings 13 00981 g007b
Figure 8. The impact of changes in transmission rate on the number of enterprises in the process of risk transmission: (a) the impact of transmission rates on businesses with unknown risks; (b) the impact of transmission rates on businesses with latent risks; (c) the impact of transmission rates on businesses where risk spreads; (d) impact of transmission rate on infection recovery businesses.
Buildings 13 00981 g008aBuildings 13 00981 g008bBuildings 13 00981 g008c
Figure 9. The impact of changes in government financial support on the number of enterprises in the process of risk propagation: (a) the impact of government financial support on enterprises with unknown risks; (b) the impact of government financial support on enterprises with latent risks; (c) the impact of government financial support on risk communication enterprises; (d) the impact of government financial support on enterprises recovering from infection.
Buildings 13 00981 g009aBuildings 13 00981 g009b
Figure 10. The impact of changes in government policy supervision on the number of enterprises in the process of risk propagation: (a) the impact of government policy support on enterprises with unknown risks; (b) the impact of government policy support on enterprises with latent risks; (c) the impact of government policy support on risk communication enterprises; (d) the impact of government policy support on enterprises recovering from infection.
Buildings 13 00981 g010aBuildings 13 00981 g010b
Figure 11. The impact of changes in the proportion of lost immunity on the number of enterprises in the process of risk transmission: (a) the impact of the proportion of immunity loss on enterprises with unknown risk; (b) the impact of the proportion of loss of immunity on risk-latent enterprises; (c) the impact of the proportion of immunity loss on enterprises that spread risk; (d) impact of the proportion of lost immunity on enterprises recovering from infection.
Buildings 13 00981 g011aBuildings 13 00981 g011bBuildings 13 00981 g011c
Table 1. Shows a summary of the existing research on risk in the prefabricated building supply chain and virus model improvement perspectives.
Au (Year)Research PerspectiveResearch Method/Used ModelsWhether to Consider Asymptomatic InfectionWhether Recurrent Is Considered
Zhang and Qiao [5]Risk assessment of prefabricated building supply chainThe whole life cycle of a construction projectNONO
Chan Tsz Wai [6]Benefits and critique of modular integrated architectureMulti-attribute group decision makingNONO
Wang et al. [7]The relationship between risk factors in the prefabricated building supply chainFactor analysisNONO
Zhang [8]The relationship between risk transmission factors in the prefabricated building supply chainBlock chain technologyNONO
Gu [9]Supply chain risk factor identification and analysisSCOR, Principal component analysisNONO
Zhang [10]Risk assessment of prefabricated concrete supply chainCloud modelNONO
An et al. [11]Rank supply chain influencersSEMNONO
Wang et al. [12]Risk assessment of prefabricated building supply chainC-OWA operator weighting and grey clustering evaluation methodsNONO
Al-Hussein M. H. Al-Aidrous [13]The relationship between the influencing factors of ground-floor housing in prefabricated buildingsStatistical Package of Social Science (SPSS)NONO
Kristopher Orlowski [14]Evaluation of influencing factors of special weatherproof seals for prefabricated buildingsNeo-Hookean ModelNONO
Luo et al. [15]Explore the supply chain cyber risks of prefabricated housing projectsSocial network analysisNONO
Ibrahim Yahaya Wuni [16]Identify risk factors for modular integrated construction [16]Fuzzy comprehensive evaluationNONO
Syed Saad [17]Analysis of the key factors required for success in the Malaysian construction industryData analysis methodsNONO
Yiping Tan [20]Risk propagationA stochastic SIS dynamics modelNONO
Ayse Peker Dobie [21]Risk propagation, risk balancing pointsSIS model with virus mutation in a variable population sizeNONO
Wonhyung Choi [22]Risk propagationA spatial SIS epidemic model with a free boundaryNONO
Jianhua Chen [23]Emergency supply chain transmission mechanismImprove SIRNONO
Di Liang [24]Supply chain risk propagationSIRNONO
Guanhua Ni [25]Parameters Sensitivity Analysis of COVID-19Propose a SCEIR modelNONO
Isa Abdullahi Baba [26]Risk balancing pointThe transmission dynamics of the disease are studiedNONO
Mauro Aliano [27]Dynamic risk propagation modelTime delay is considered on the basis of the SIR modelNONO
Bo Li [28]Analyse the dynamic behaviour of infectious disease modelsA discrete-time SIR epidemic modelNONO
Tchavdar T. Marinov [29]Infectious disease models applied to COVID-19 in Latin America.Presents an Adaptive Susceptible–Infected–Removed (A-SIR) epidemic model with time-dependent transmission and removal ratesNONO
This paperRisk propagation in the supply chain of prefabricated buildingsConsider the recurrent SEAIR modelYesYes
Table 2. Variable expression and constant assignment in the table flow graph.
Serial NumberExpression Assignment
1Unknown enterprise at risk = INTEG (30 − Number of infections, 30)
2Latent risk enterprises = INTEG (Number of infections-Spread quantity + number of latent enterprises forming new, 0)
3Risk transmission enterprises = INTEG (spread quantity − government support, 0)
4Infection rehabilitation enterprises = INTEG (Government support − number of enterprises losing immunity, 0)
5Number of latent enterprises forming new = number of enterprises losing immunity.
6Number of infections = unknown risk enterprises × infection rate
7Spread quantity = latent risk enterprises × Transmission rate
8Government support = risk transmission enterprises × (Government financial support + government policy supervision)
9Number of enterprises losing immunity = Loss of immunity ratio × infection rehabilitation enterprises
10Infection rate = 0.10
11Transmission rate = 0.15
12Government financial support = 0.25
13Government policy supervision = 0.25
14Loss of immunity ratio = 0.20
Disclaimer/Publisher’s Note: The statements, opinions and data contained in all publications are solely those of the individual author(s) and contributor(s) and not of MDPI and/or the editor(s). MDPI and/or the editor(s) disclaim responsibility for any injury to people or property resulting from any ideas, methods, instructions or products referred to in the content.

