Abstract
A steel plate shear wall (SPSW) is a useful component for resisting lateral action. To improve the performance of frame columns, some studies focus on a two-side connected SPSW, in which the wall plate is not connected with the frame columns. However, few studies conducted on a two-side connected SPSW consider the effect of frame constraints or the connections between the infill plates and frame beams. In this study, by using finite element modeling (FEM), two unstiffened SPSW models with two-side fixed connections and six unstiffened SPSW models with two-side bolt connections were simulated. Their performance under the presence of out-of-plane frame beam flange constraints and different numbers of bolts between the infill plates and frame beams was analyzed. The mechanical performances such as hysteretic behaviors, the capacity of energy dissipation and the out-of-plane deformation of the members were investigated by applying monotonic and cyclic loading. The results revealed that non-negligible deformation would be generated at the lateral border of the bolt connections and that the out-of-plane deformation of the frame could be significantly affected by constraints. These findings can guide the engineering design of SPSWs in the future.
1. Introduction
Steel plate shear walls (SPSWs) have been adopted worldwide as novel lateral force-resisting members in the field of high-rise structural engineering. Since the invention of the new component, many studies on SPSWs have focused on their overall comprehensive performance, such as SPSW hysteresis. In addition, the influence of the stiffness of one component on the performance of other components in an SPSW [1,2,3] and simplified analysis models of SPSWs [4,5,6,7,8,9,10,11] have also been studied.
Good connections ensure the transmission of force under an external load to guarantee the safety and reliability of steel structural buildings, which is not an exception for SPSWs. Therefore, researchers focused on improving the connections between the infill plates and boundary members of SPSWs. Elgaaly et al. [10,12] designed welding models and four types of SPSW models having different connection conditions at the same component size. Experiments on the above models under cyclic loading revealed that the slippage of bolt connections between the infill plate and frame members could cause the yielding of the model. Therefore, the yielding bearing capacity and stiffness of the model having bolt connections were slightly lower than those of the welding model. They also found that increasing the bolt spacing from 4 times to 8 times the bolt diameter had little effect on the failure mode of the SPSW. Ma [13] studied the mechanical mechanism and seismic behavior of an SPSW consisting of two-side connections. The influence of the out-of-plane force of the infill plate on the frame beam was determined. A formula, proposed by Ma [13] to calculate the tension in the bolts at this location, was later adopted by JGJ/T380-2015 [14]. Schumacher et al. [15] fabricated four specimens of unstiffened SPSWs welded to steel plates and frames under different structural conditions. These specimens were tested under quasi-static loading. The tearing was suppressed more in the infill plate connection directly welded to the boundary members than the connection using fish plates. Paslar et al. [16] used the ratios of the connection lengths between the infill plate and boundary components as a variable to perform finite element modeling (FEM) and analysis. The results indicated that the stiffness, ductility, ultimate bearing capacity and energy absorption of the SPSW whose infill plates were connected only to columns were all slightly lower than those of the wall with the infill plates connected only to beams. Choi et al. [17] established five types of three-story single-span SPSW models for loading tests. The results showed that the initial stiffness of bolt-connected SPSWs could be improved by increasing the number of bolts; however, it displayed little effect. In addition, the bearing capacity and energy dissipation of bolt-connected SPSWs could not be improved via this measure. In addition, scholars have developed a variety of novel connections between the infill plates and boundary components of SPSWs [18,19,20]. It can be found that the frames of SPSW models in many quasi-static tests are often subjected to out-of-plate constraints to prevent the excessive out-of-plane deformation of the frame during loading. However, in engineering practice, the frame of the SPSW system is often not completely constrained in the out-of-plane direction. However, the effect of changing the constraint conditions of the boundary components on the performance of bolt-connected SPSWs is not considered in most studies.
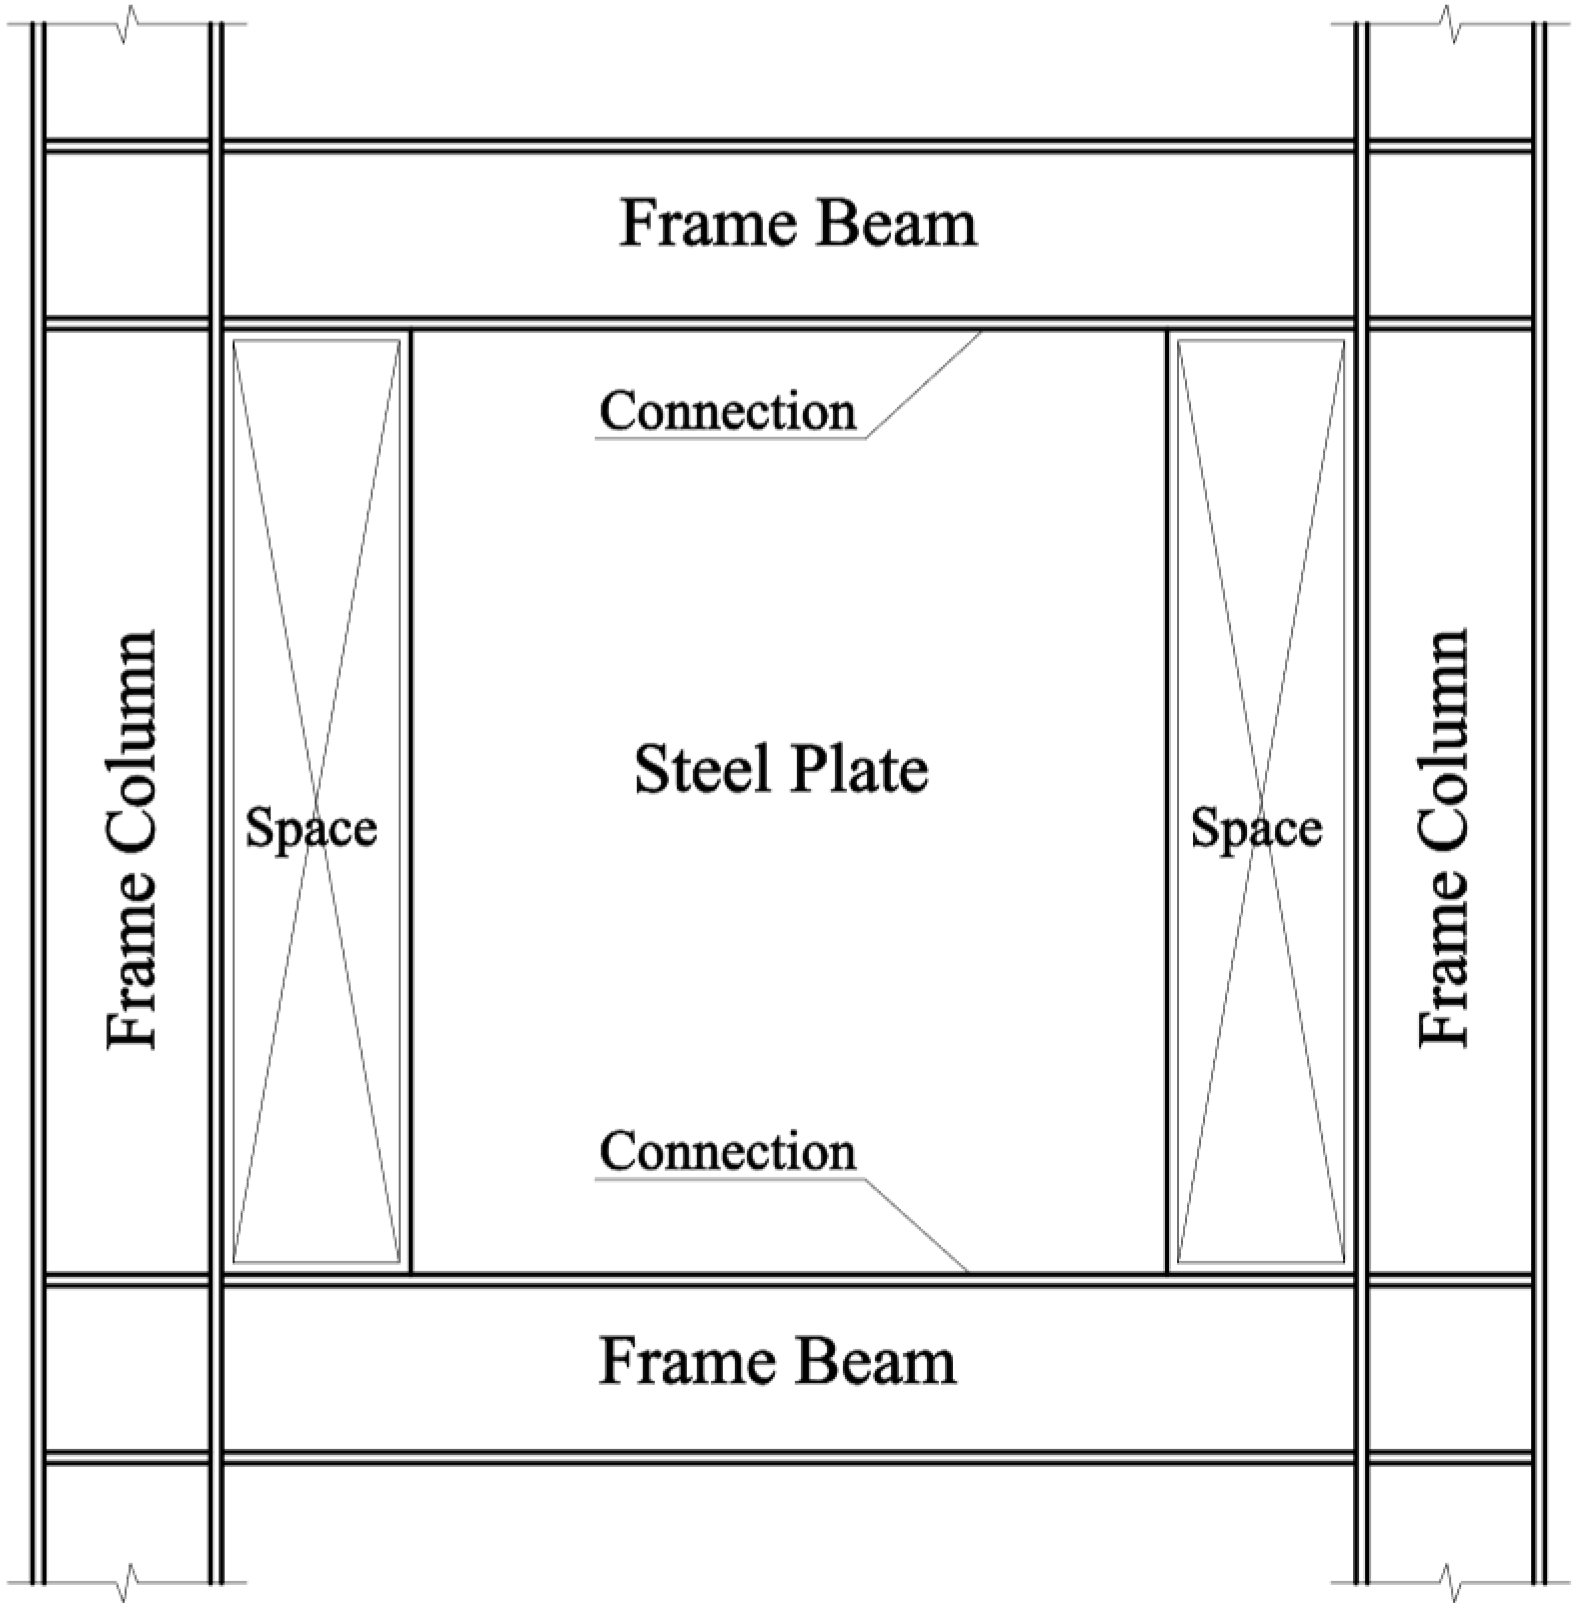
All column failures occur easily in SPSWs with four-side connections. Therefore, an SPSW with two-side connections has been developed [21]. The infill plate of the SPSW only connects with the frame beams and not with the columns (Figure 1), which can effectively prevent the damage inflicted by the reaction force of the infill plate on the columns. In addition, a two-side connection SPSW is convenient for pipe laying and building doors and windows. Some studies have been conducted on SPSWs with two-side connections. Miu [22] analyzed the elastic and elastic-plastic buckling behaviors of SPSWs with two-side connections under three different stiffening situations and explored the influences of the initial imperfection and residual stress on this SPSW. Ma [13] and Xu et al. [23] studied the forced mechanism and failure modes of two-side connected SPSWs under different stiffening situations.
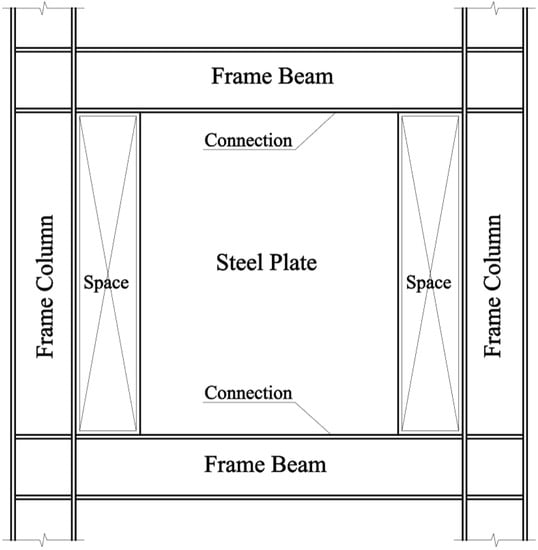
Figure 1.
Steel plate shear walls (SPSWs) with two-side connections.
Unlike welded connections, bolt connections possess advantages, such as good ductility, no mechanical defects caused by residual stress in the weld and the easy replacement of assembled joints (for post-earthquake repair). In a word, exploring the specific performance of two-side bolt-connected SPSWs considering top-seat constraints with frame beams is of practical significance.
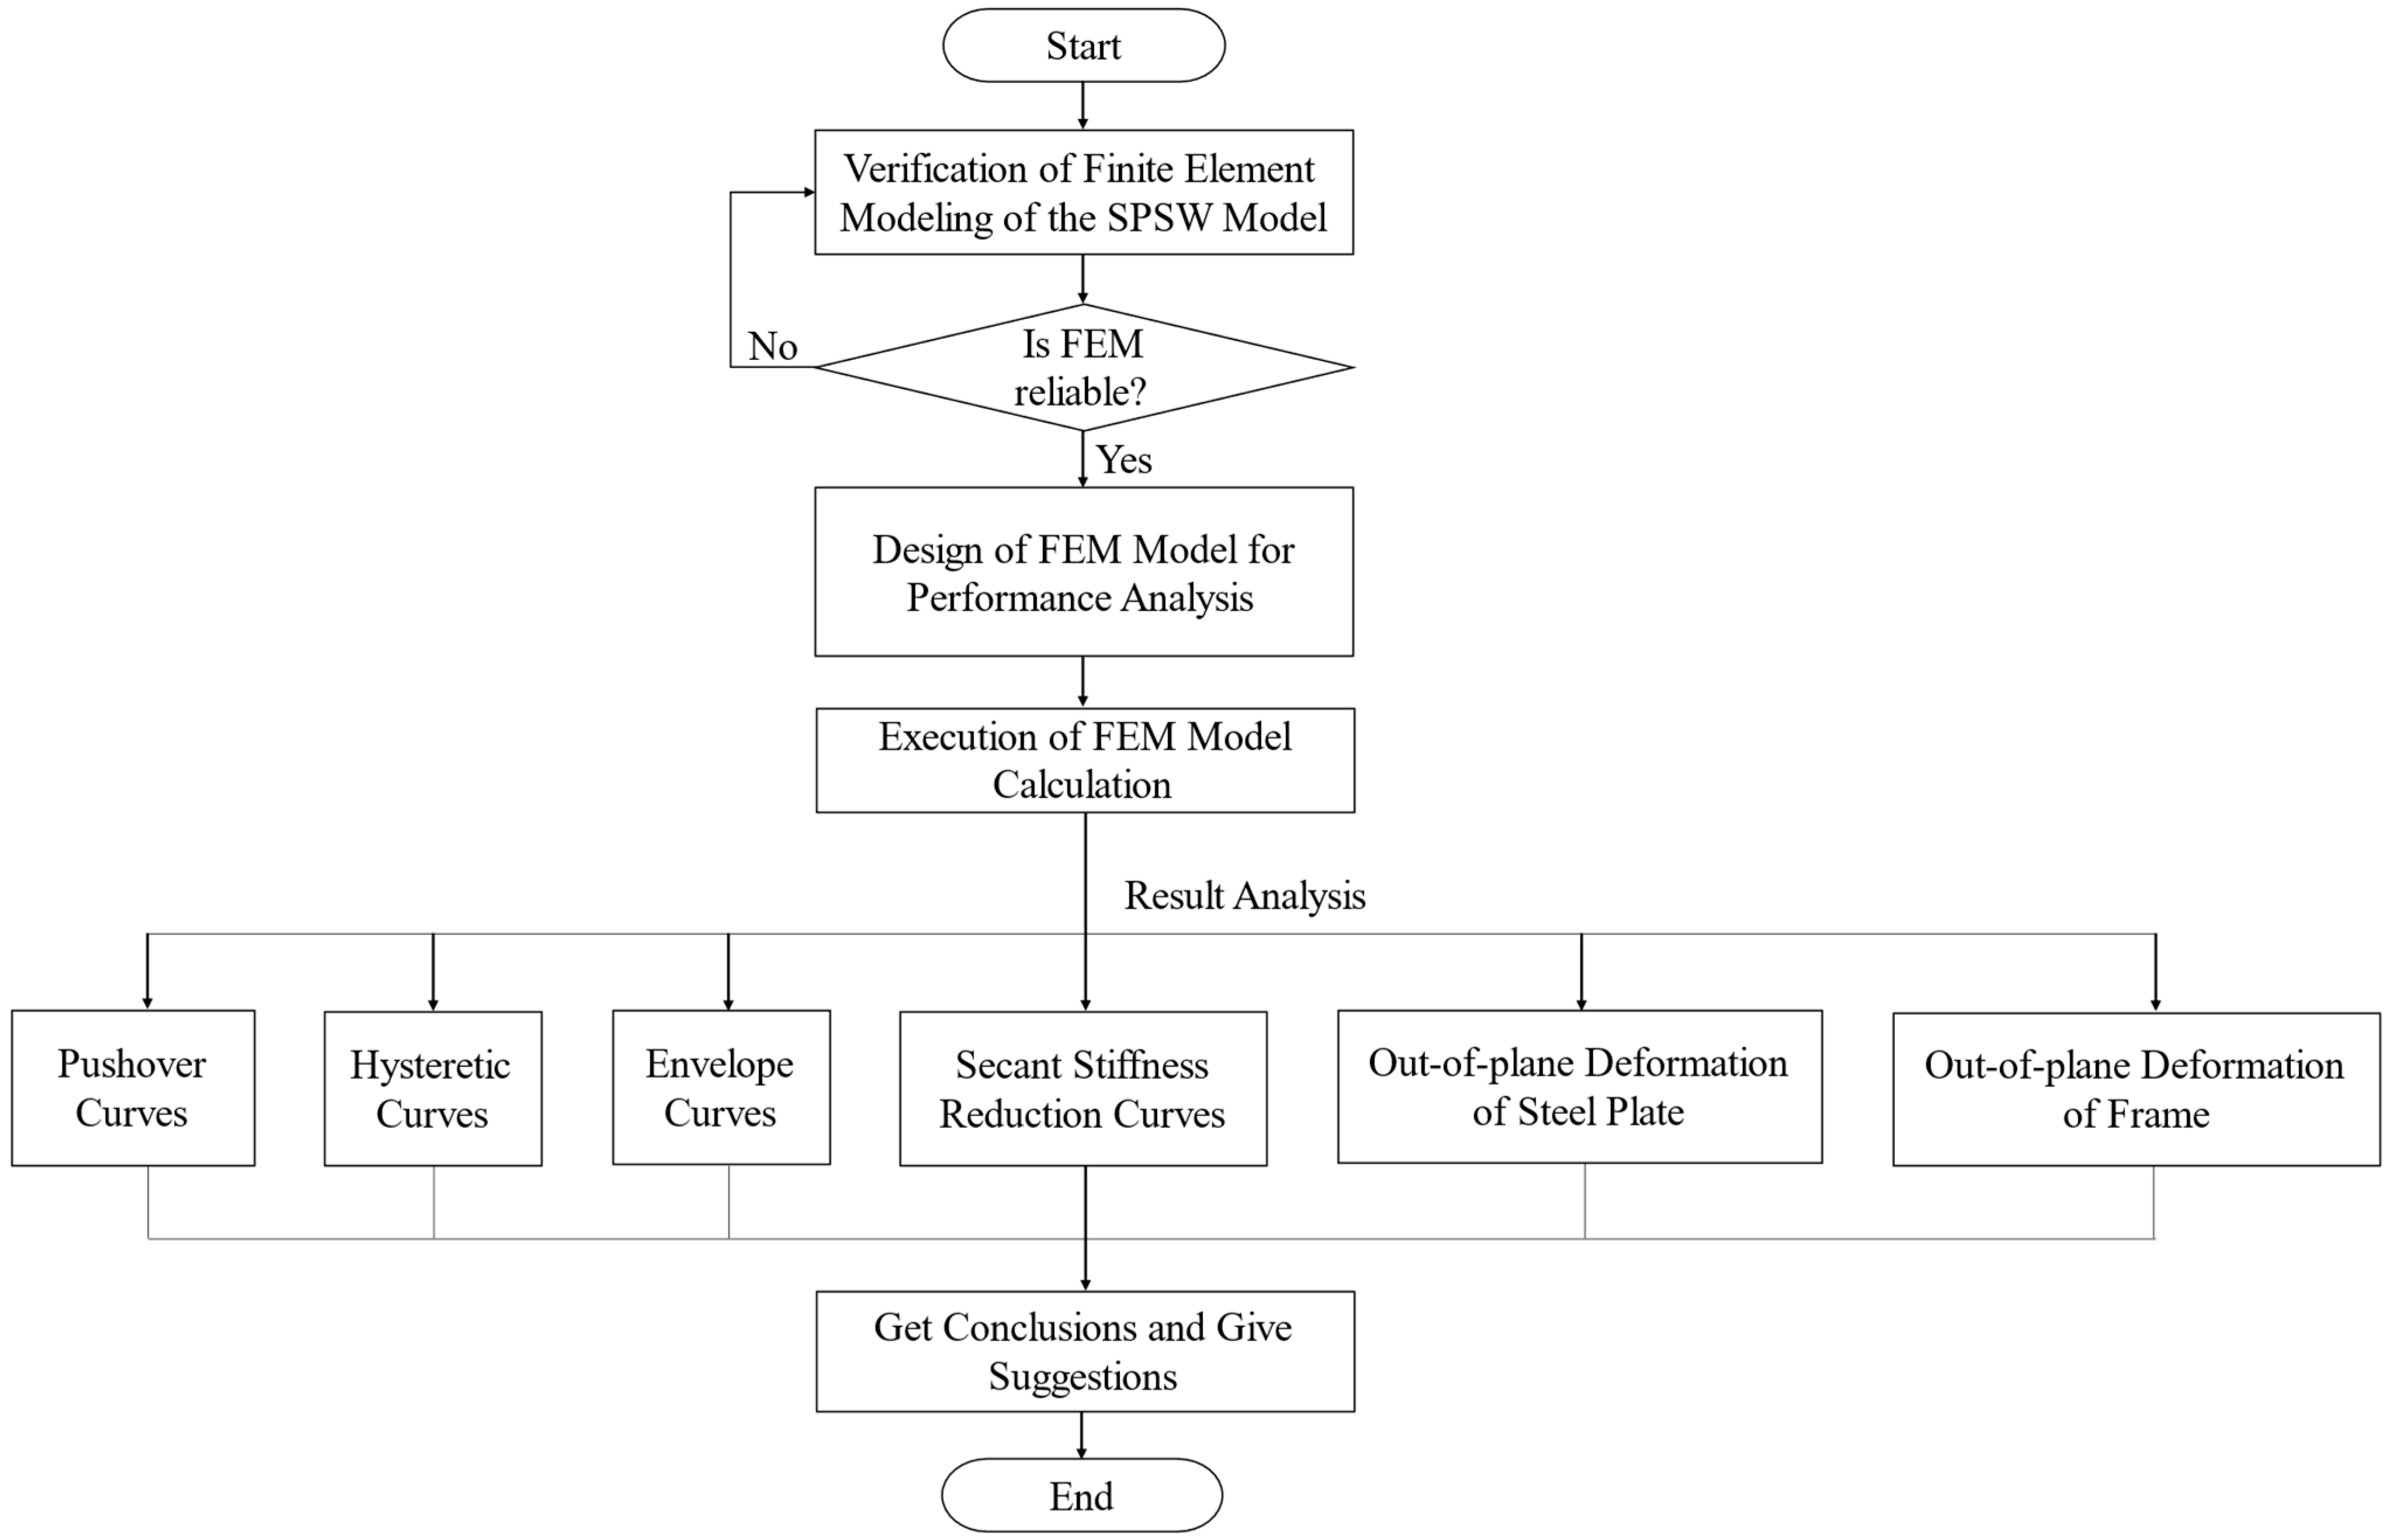
Various simulation methods for the analysis of steel structures have been proposed and their reliabilities have been verified [24,25,26,27,28]. In the present study, several two-side bolt-connected SPSW models with a different number of bolts were established using the FEM method to explore the seismic performances of these models. While analyzing these models, the constraints of the upper-frame beam flanges were considered as one of the controlling conditions. The key characteristics of the mechanical performances of these models were examined and compared. In addition, the out-of-plane deformation of the frames and steel plates of these models was also investigated. Finally, some conclusions with certain reference significance for engineering design were obtained. The flow chart (Figure 2) shows the structure of this article.
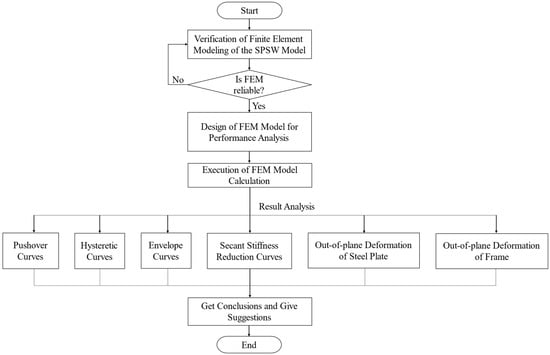
Figure 2.
Structure of this article.
2. Research Method
2.1. Verification of FEM Model
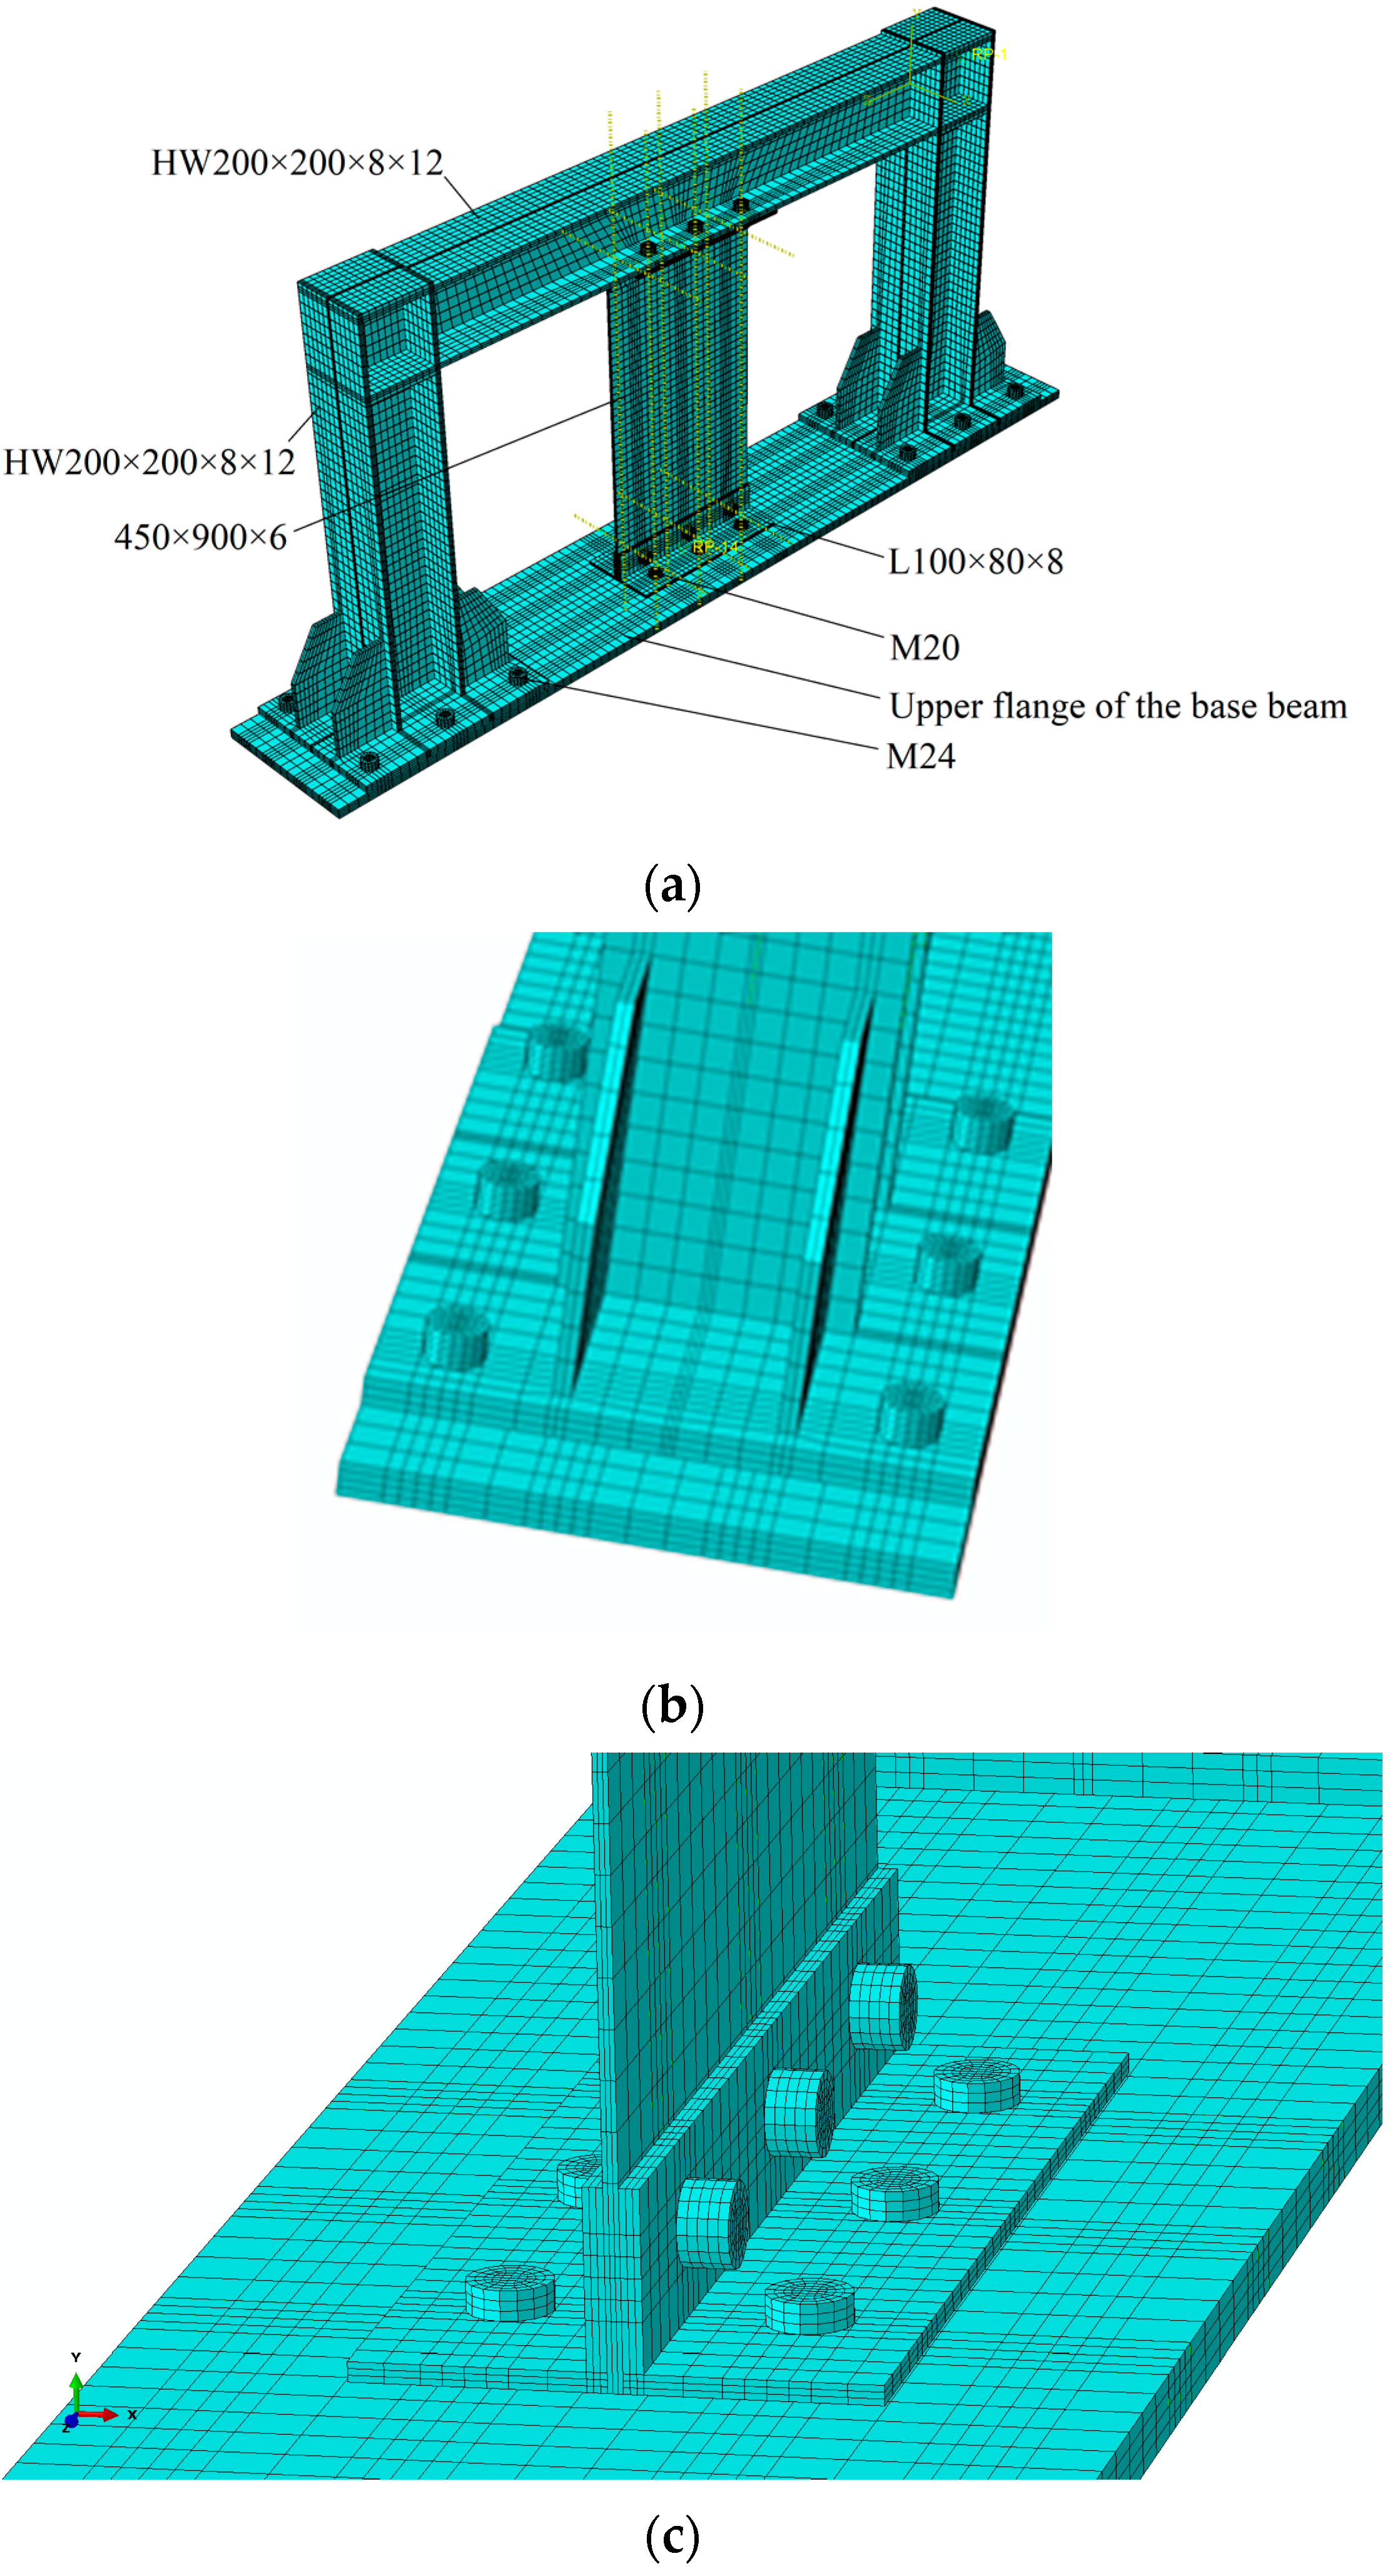
An experimental model from the test by Jiang et al. [29,30] was considered for verifying the FEM methodology in ABAQUS 2020 [31]. The FEM model for simulating the model SPWF-A is shown in Figure 3. Each component in the FEM model was dimensioned and placed according to its size and location in the experimental model, without considering the cover plates of the beam–column joints. Only the upper flange of the base beam was modeled as a rigid body.
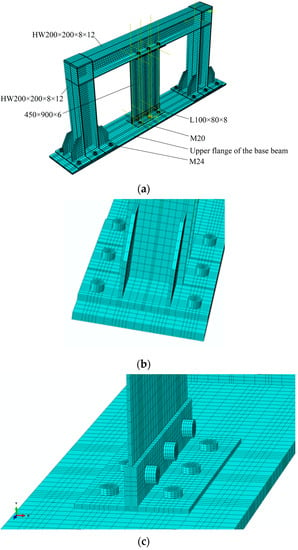
Figure 3.
Finite element modeling (FEM) for verification: (a) whole model; (b) bolts on the column foot; (c) bolts on the steel plate and the base.
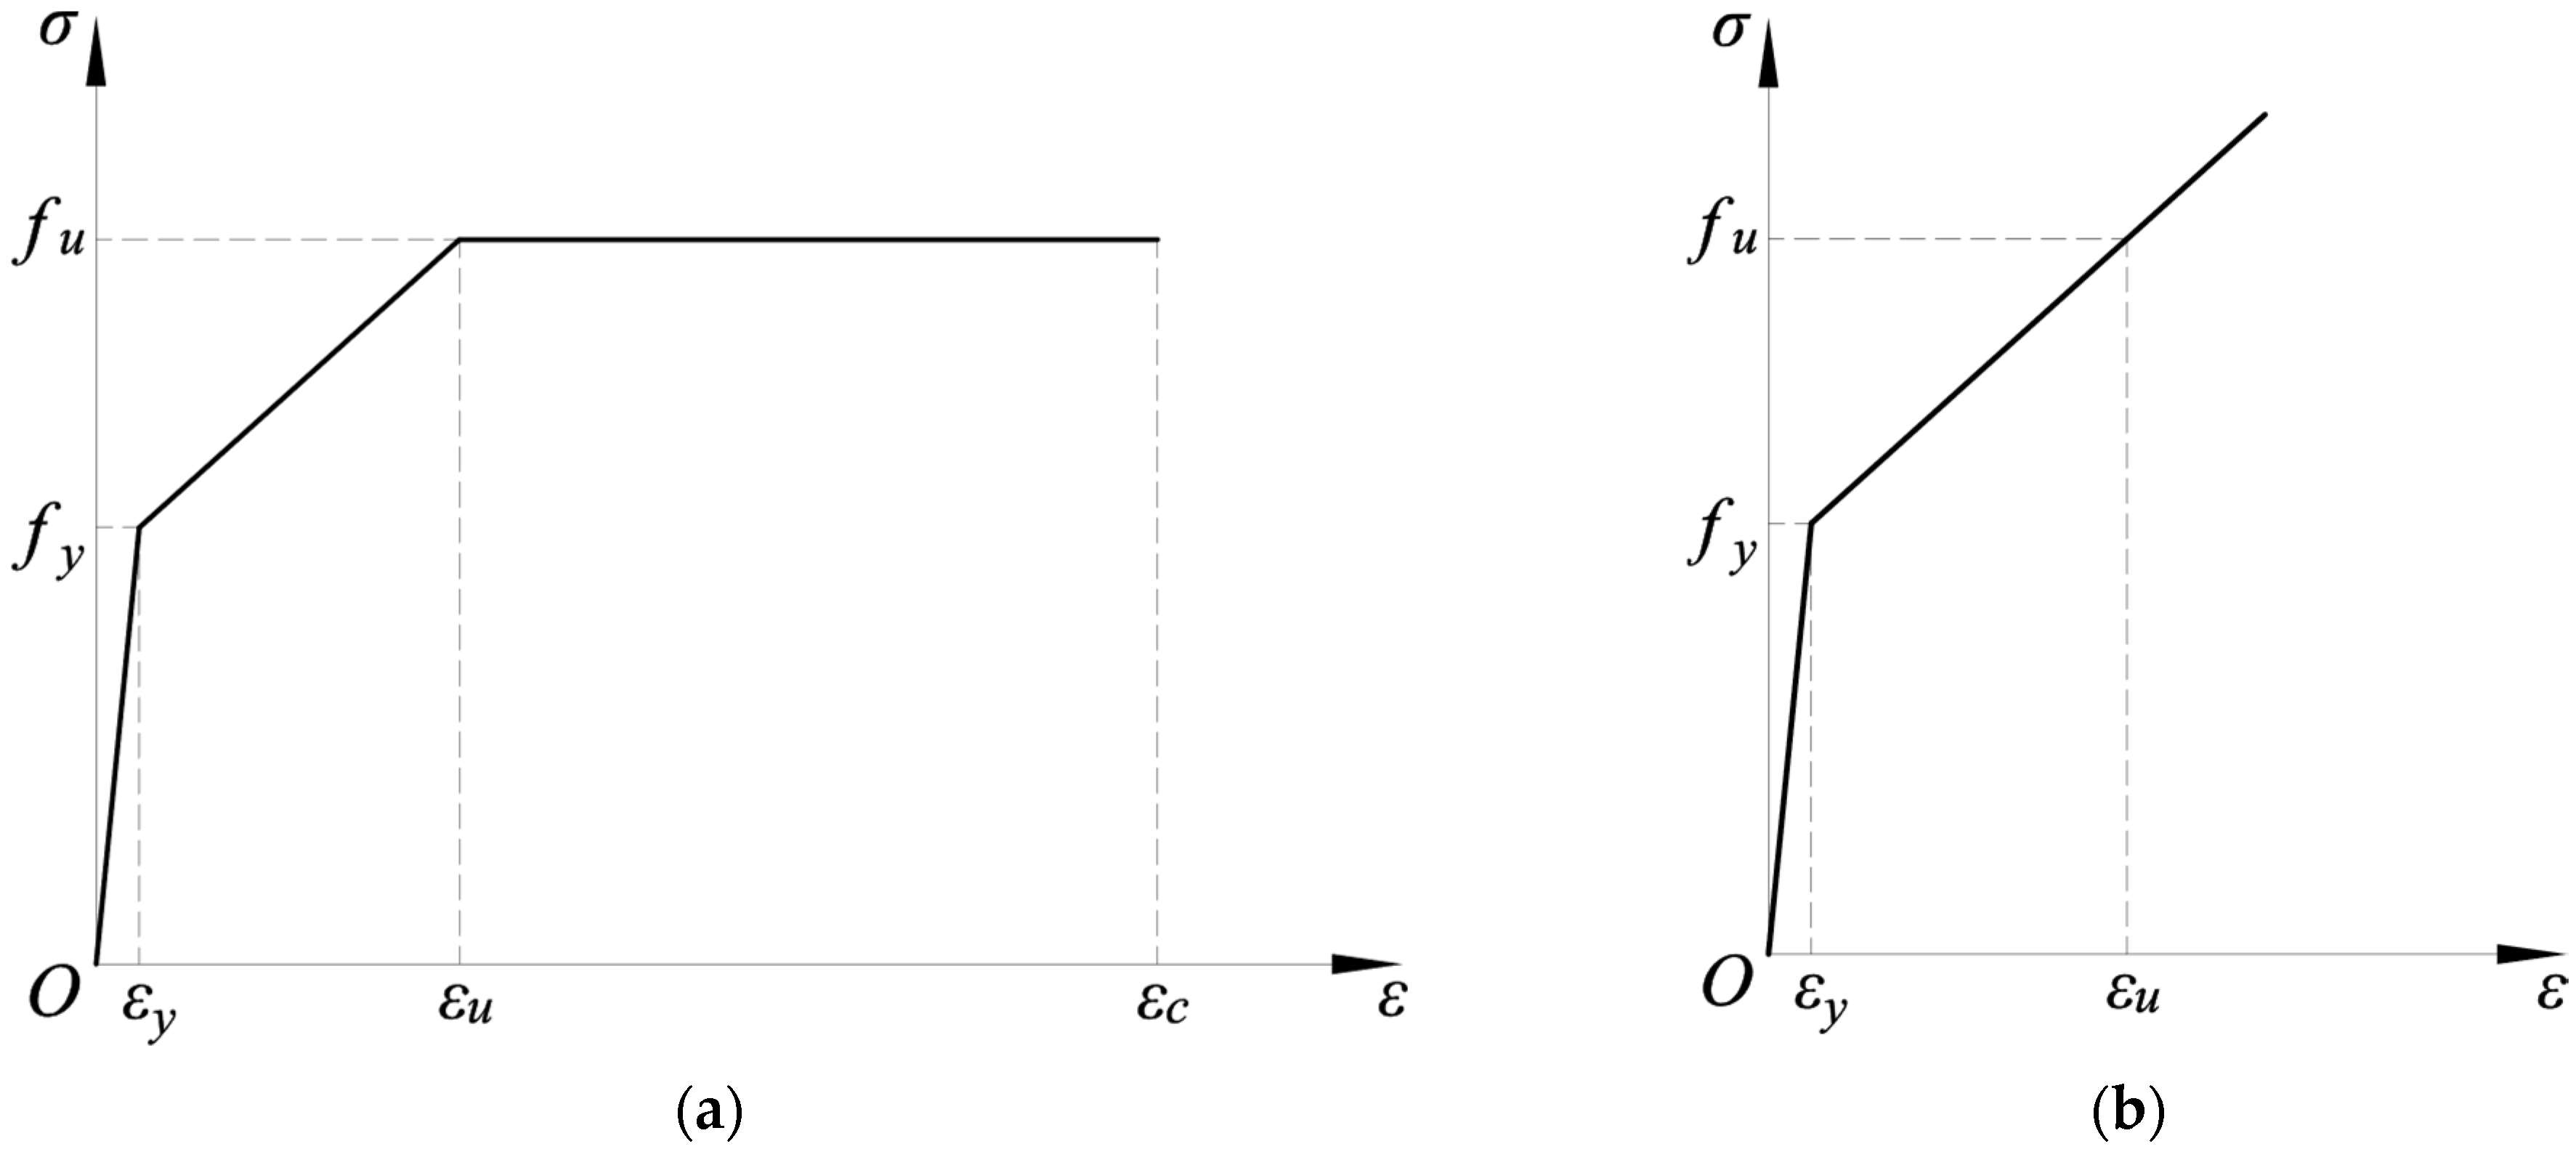
The values of the material properties of the members in the model, except for the breaking elongation rate, were borrowed from [29,30]; the values are shown in Table 1. The material properties of all steel members, except the upper flange of the base beam and bolts, were defined using a trilinear model, in which the tangent modulus in the elastic-plastic stage was 3% of the elastic modulus E (Figure 4a). The real stress–strain data were derived and imported into the ABAQUS software [31] according to the relationship between the nominal and true stresses and strains, as shown in Equations (1) and (2) [31]:
where , , and denote the true stress, nominal stress, nominal strain and real plastic strain, respectively.

Table 1.
Constitutive relationship of steel in FEM model for verification.
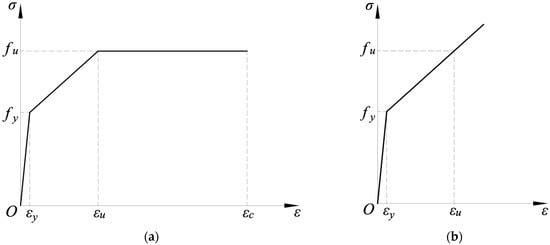
Figure 4.
Stress–strain curve of steels in FEM model: (a) trilinear model (applied to members except bolts or base beam); (b) bilinear model (applied to bolts).
The material properties of the grade 8.8 high-strength bolt were defined using a bilinear model (Figure 4b). Its true stress at the ultimate strength and the corresponding actual plastic strain were derived according to the nominal stress and strain at the ultimate strength (830 MPa, 0.12 [32]); the values are listed in Table 2. The Poisson’s ratios of all the components were defined as .

Table 2.
Constitutive relationship of grade 8.8 high-strength bolt in FEM model for verification.
The welded connections in beam-to-column joints, stiffeners and column footings were not tied but rather merged directly into a member. The friction between the steel plate wall, angles and beam flanges was defined by surface-to-surface contact. The tangential interaction was defined as a penalty function in which the friction coefficient was 0.35. Normal interaction was defined as “hard contact”. A reference point was created to couple the loading end to the outside flange of the right column, and a displacement-controlled cyclic load was applied at this point.
The element type C3D8R was chosen for all members in the model. The global mesh sizes of the members are listed in Table 3. There is only one integral point in each C3D8R grid, which is easy to produce hourglass mode, that is, the bending deformation of the grid does not produce strain energy. To prevent the sandglass problem, the element meshes of the steel plate wall and column flanges were divided into three layers along their thickness.

Table 3.
Global mesh sizes of members (mm).
Before loading the horizontal cyclic load, two 300 kN axial loads, representing the gravity loads transmitted from the upper stories, were applied to the top face of each column. The introduction of geometric initial imperfections into a model with frictional contacts renders convergence difficult; therefore, the initial imperfections were not considered in the model. The steps undertaken for analysis and the corresponding loads set were in the following order.
- (1)
- Apply corresponding pre-tightening loads to each bolt.
- (2)
- Apply two axial loads on the top of the two columns.
- (3)
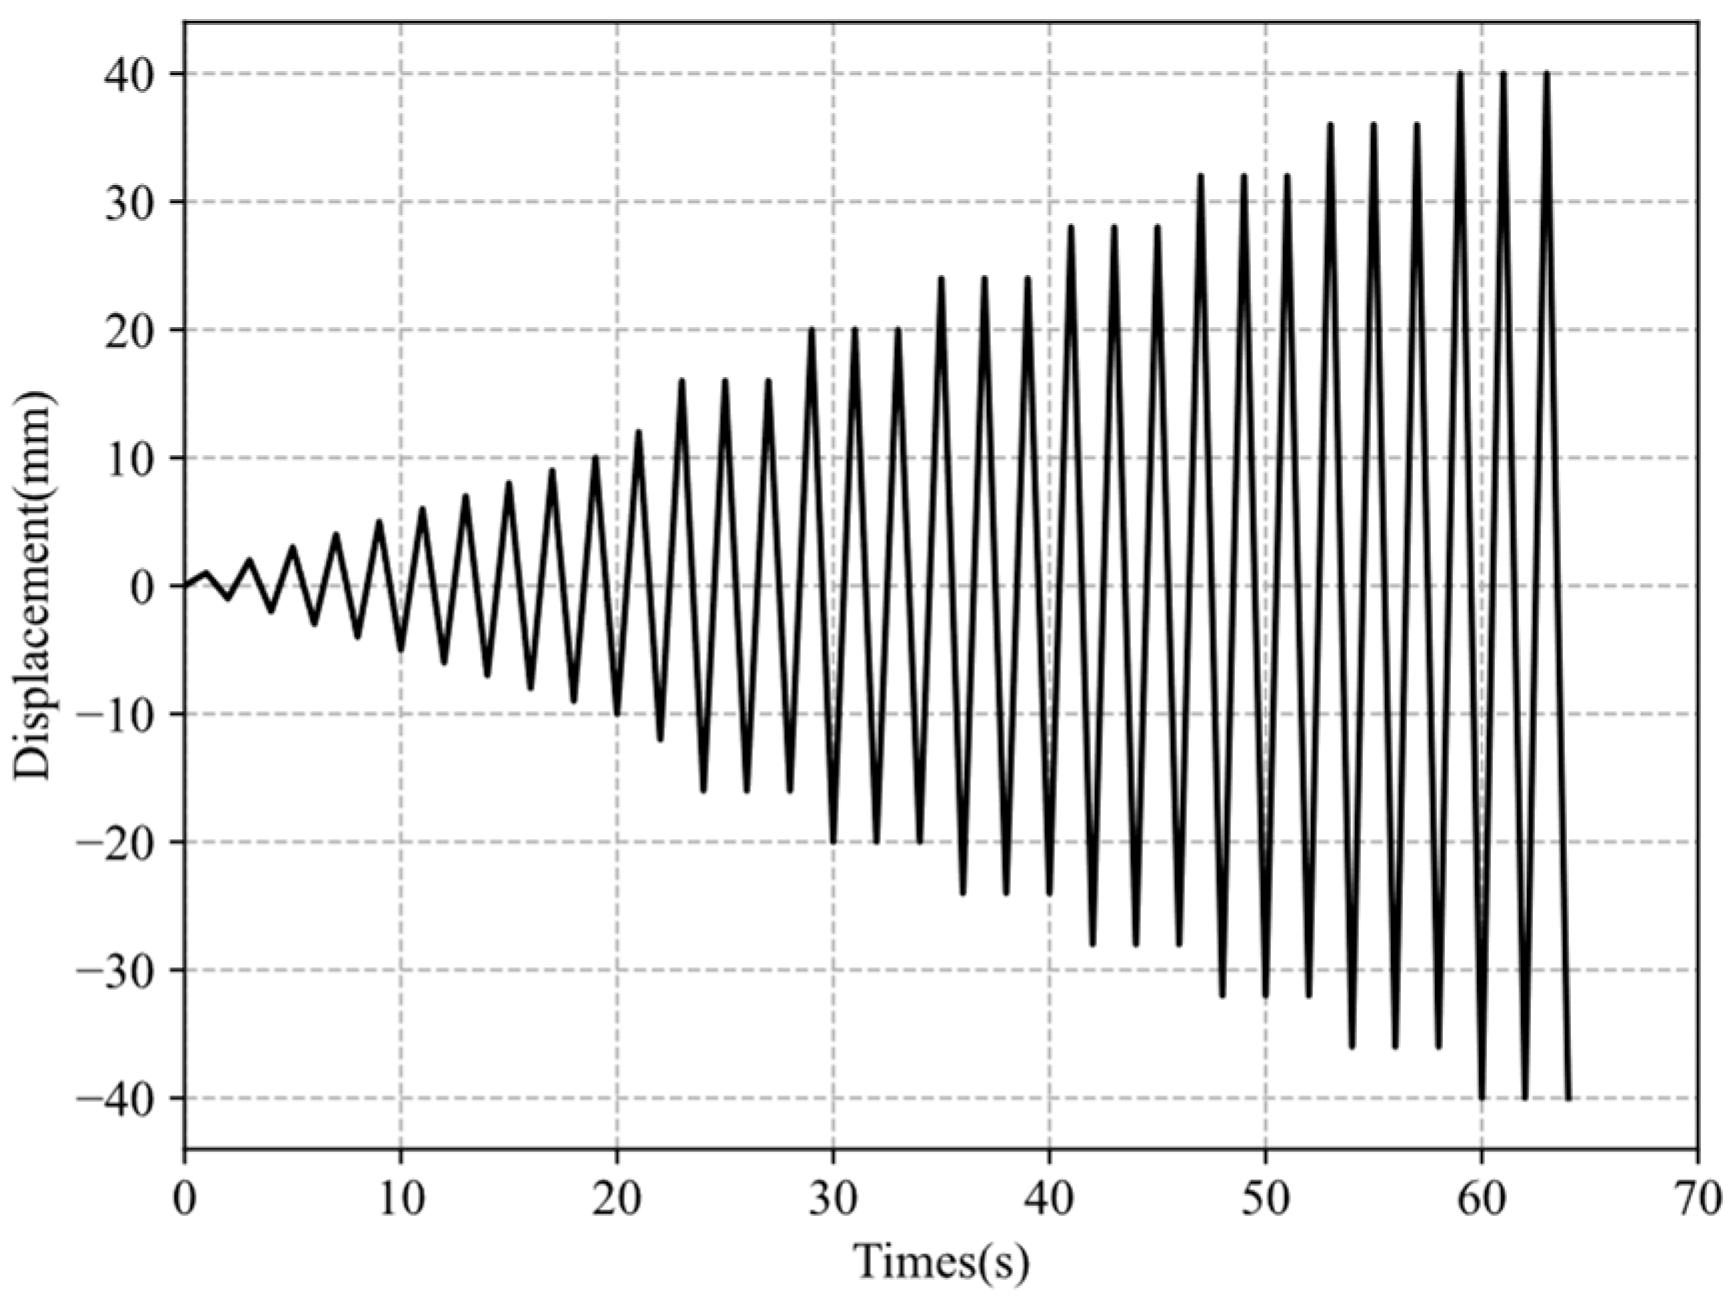
- Apply displacement-controlled horizontal cyclic load at the reference point, coupling the loading end. In the elastic stage, increase the displacement by 1 mm per cycle. In the elastic-plastic stage, increase each lateral displacement by 4 mm. Apply each displacement periodically three times (Figure 5).
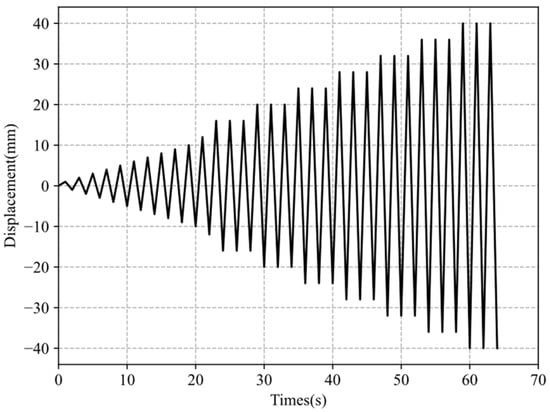 Figure 5. Horizontal cyclic load.
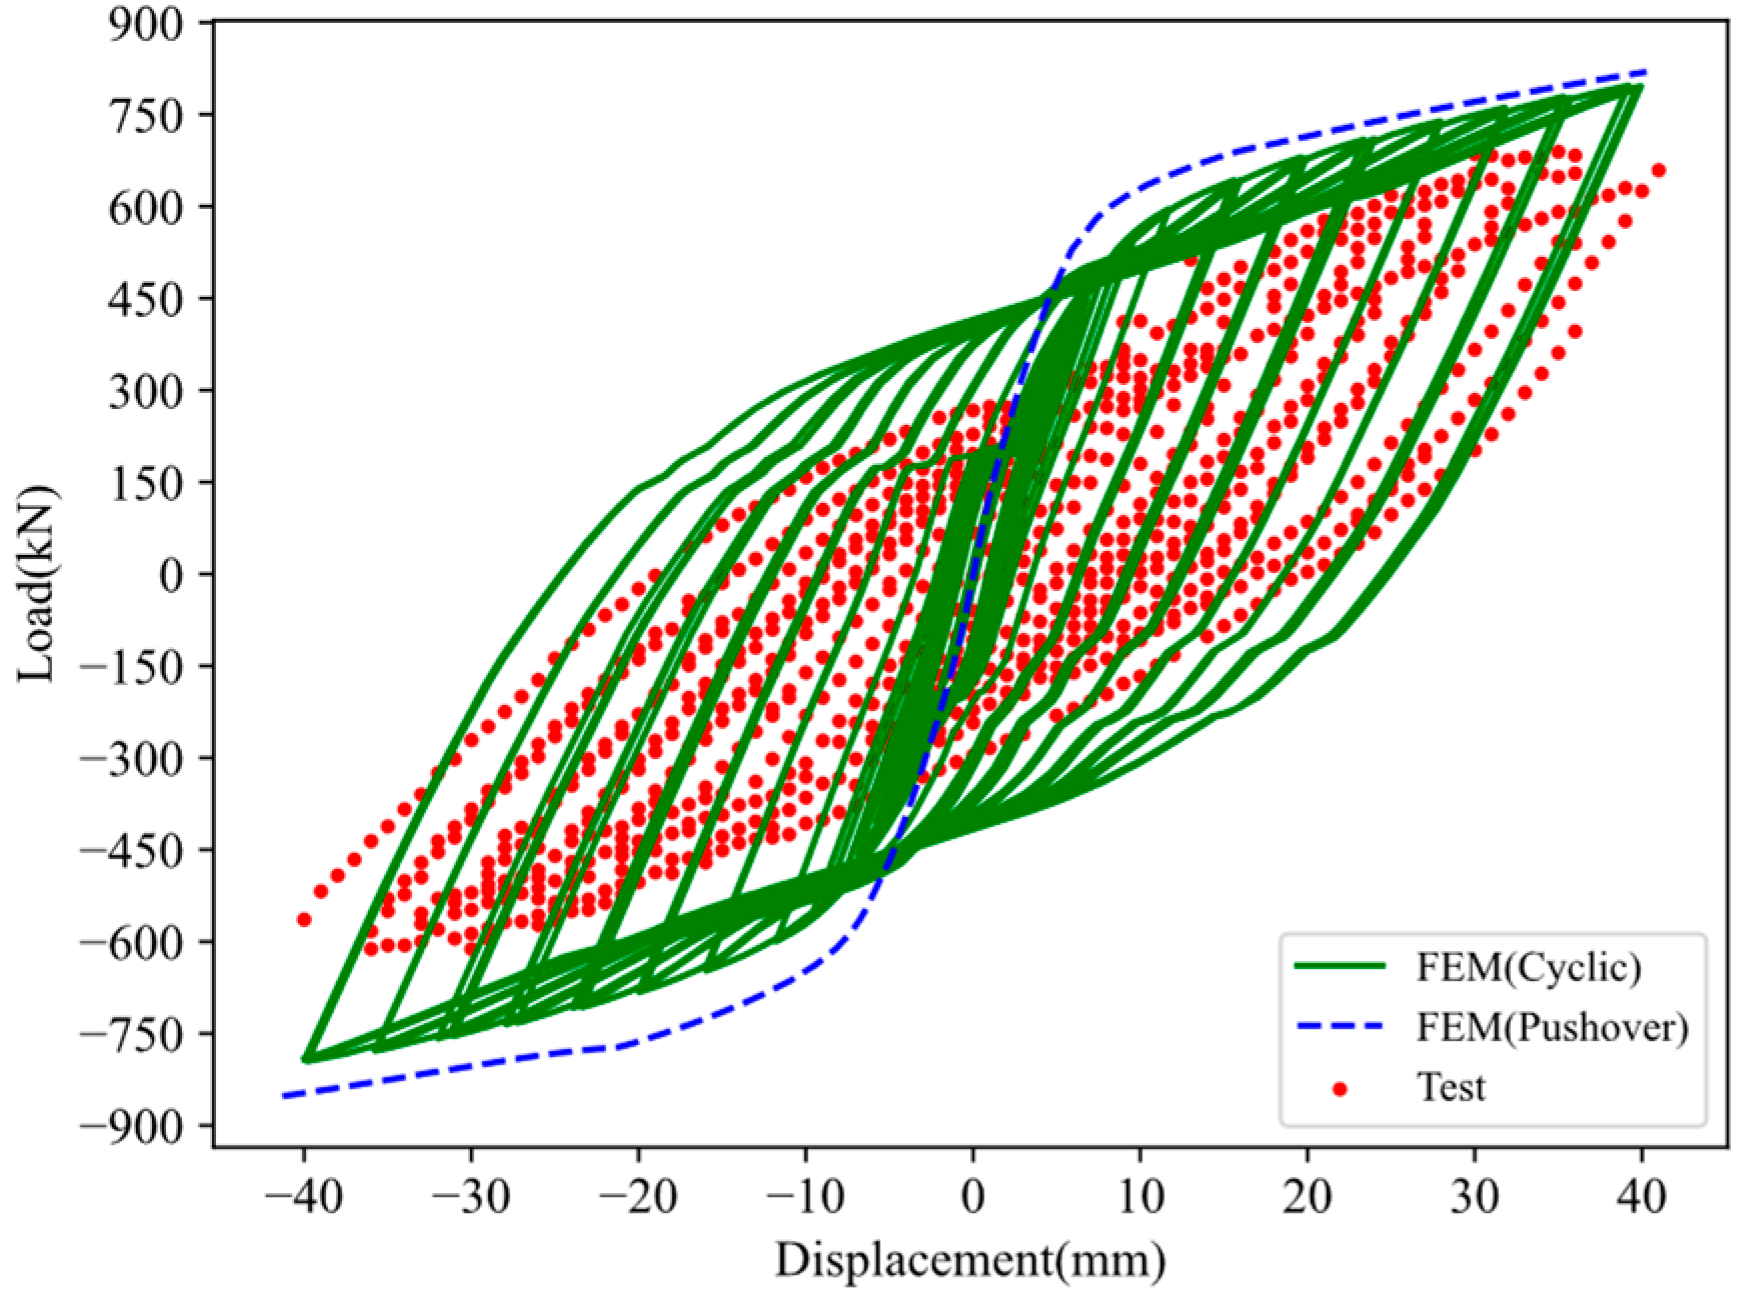
The hysteretic curves obtained from the FEM model and Jiang’s study are shown in Figure 6. The overall trends displayed by the two hysteresis curves are consistent, although the magnitudes of the forces on the FEM model were always higher than the test data under the same cyclic peak displacement. This phenomenon was attributed to the following. (1) In FEM model, the anchor bolt connections between the base beam and the ground were simplified as a rigid constraint applied to the upper flange of the base beam. (2) The model did not consider the initial imperfection of the steel plate wall or frame members. (3) Weld cracking was not considered in the FEM model. The simulated hysteresis curves exhibited slight pinches owing to the slipping of some bolts in the later stages of cyclic loading. The forces corresponding to the positive and negative displacements of 10 mm and 40 mm in the FEM model and the model from the literature are listed in Table 4.
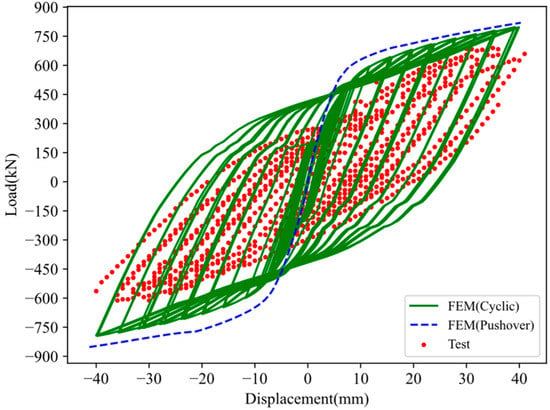
Figure 6.
Hysteretic curves of FEM model and test model.

Table 4.
Some data from cyclic loading of FEM model and literature test.
As can be observed, the solid element model simulates the behaviors of the forces and displacements of the SPSW model with relative accuracy.
2.2. Design of FEM Model for Performance Analysis
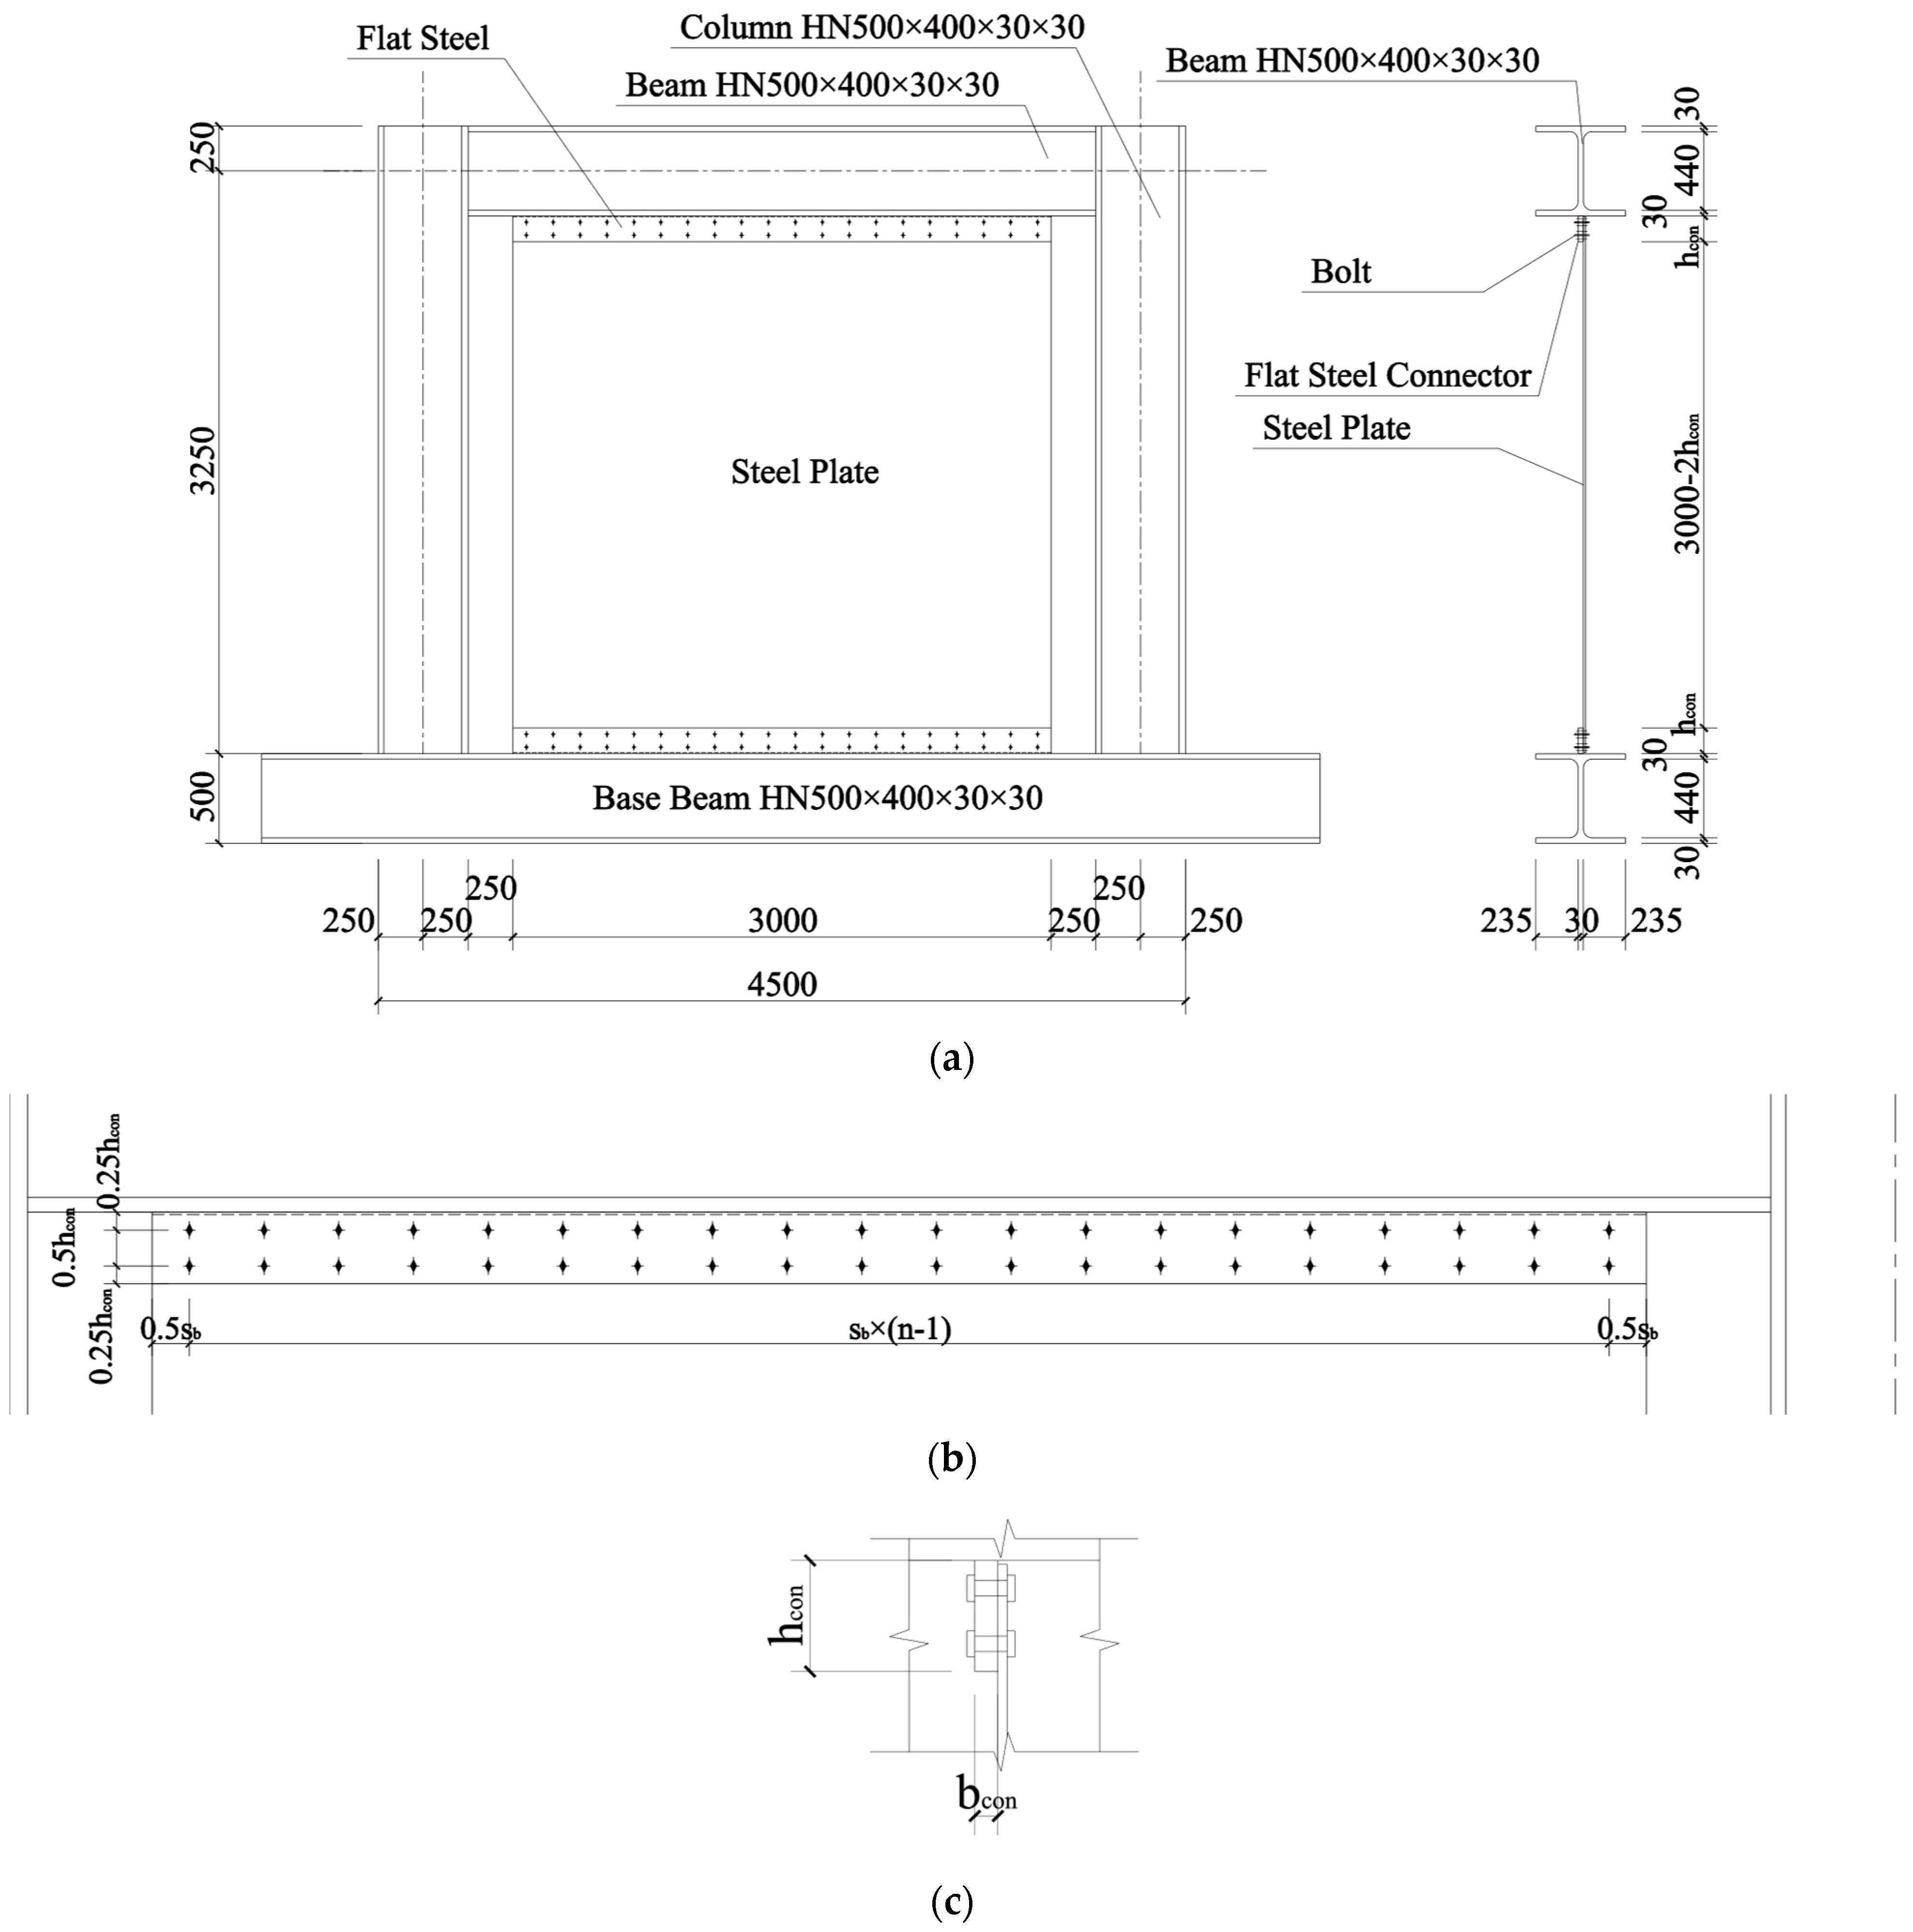
The overall sizes of the numerical analysis models used in this section are shown in Figure 7a. Both the frame beam and columns were welded using I-shaped steel (500 mm × 400 mm × 30 mm × 30 mm; overall depth × flange width × web thickness × flange × thickness). The thickness of the steel plate, tw, was 6 mm. The steel plate was connected using two connections to the upper and lower frame beams at the upper and lower edges, and each edge connection of the steel plate consisted of two lines of bolts and a flat steel connector. Welding connections were applied to connect the flat steel connectors and the flanges of the frame beams. The length of the flat steel lcon was the same as that of the steel plate. However, the height and thickness of the flat steel were different: hcon = 198 mm and tcon = 10 mm. For each edge connection, the bolts were arranged in two rows along the width of the steel plate. For different models, 8, 14 and 20 bolts (n) were arranged in each row according to the rectangular array; the spacing between two adjacent bolts was the same in all rows, and the spacing between two adjacent rows of bolts was the same (Figure 7b,c); sb is the bolt spacing along the horizontal direction. The diameter (d) and hole diameter (d0) of the bolts were 30 mm and 33 mm, respectively. The pre-tension force applied to each bolt was 355 kN [33]. The bolt-nut size was defined according to GB/T 1229-2006 [34].
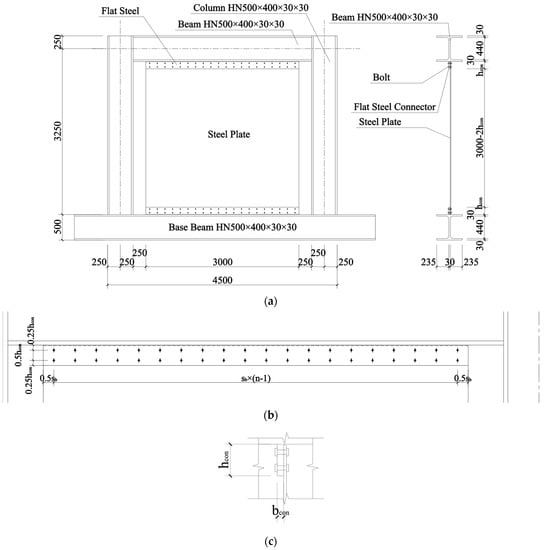
Figure 7.
Sizes of FEM models for performance analysis.
FEM SPSW models with different numbers of bolts per row in the connections were established as described in Figure 7. They were labeled “SPSW-N8”, “SPSW-N14” and “SPSW-N20”; the number succeeding the letter “N” represents the number of bolts per row. In addition, an SPSW model with two-side fixed connections (named “SPSW-T”) and a frame (named “FRAME”), whose steel plates and frames had the same sizes as those of the models with bolt connections, were established to compare the performance of SPSWs with different types of connections. The trilinear and bilinear models (Figure 4) were used to define the material properties of the bolts and other components in all the FEM models. The material properties of the 10.9 grade high-strength bolt were defined. In addition, the stress and strain values of the other components were similar to those reported by Jiang et al. [29] (Table 1). The density of all the steel materials for all the components is 7850 kg/m3, the elastic modulus is 2.06 × 10⁵ MPa and the Poisson’s ratio is 0.3. Other data on the material properties of the bolts and other components are presented in Table 5.

Table 5.
Material properties of the components.
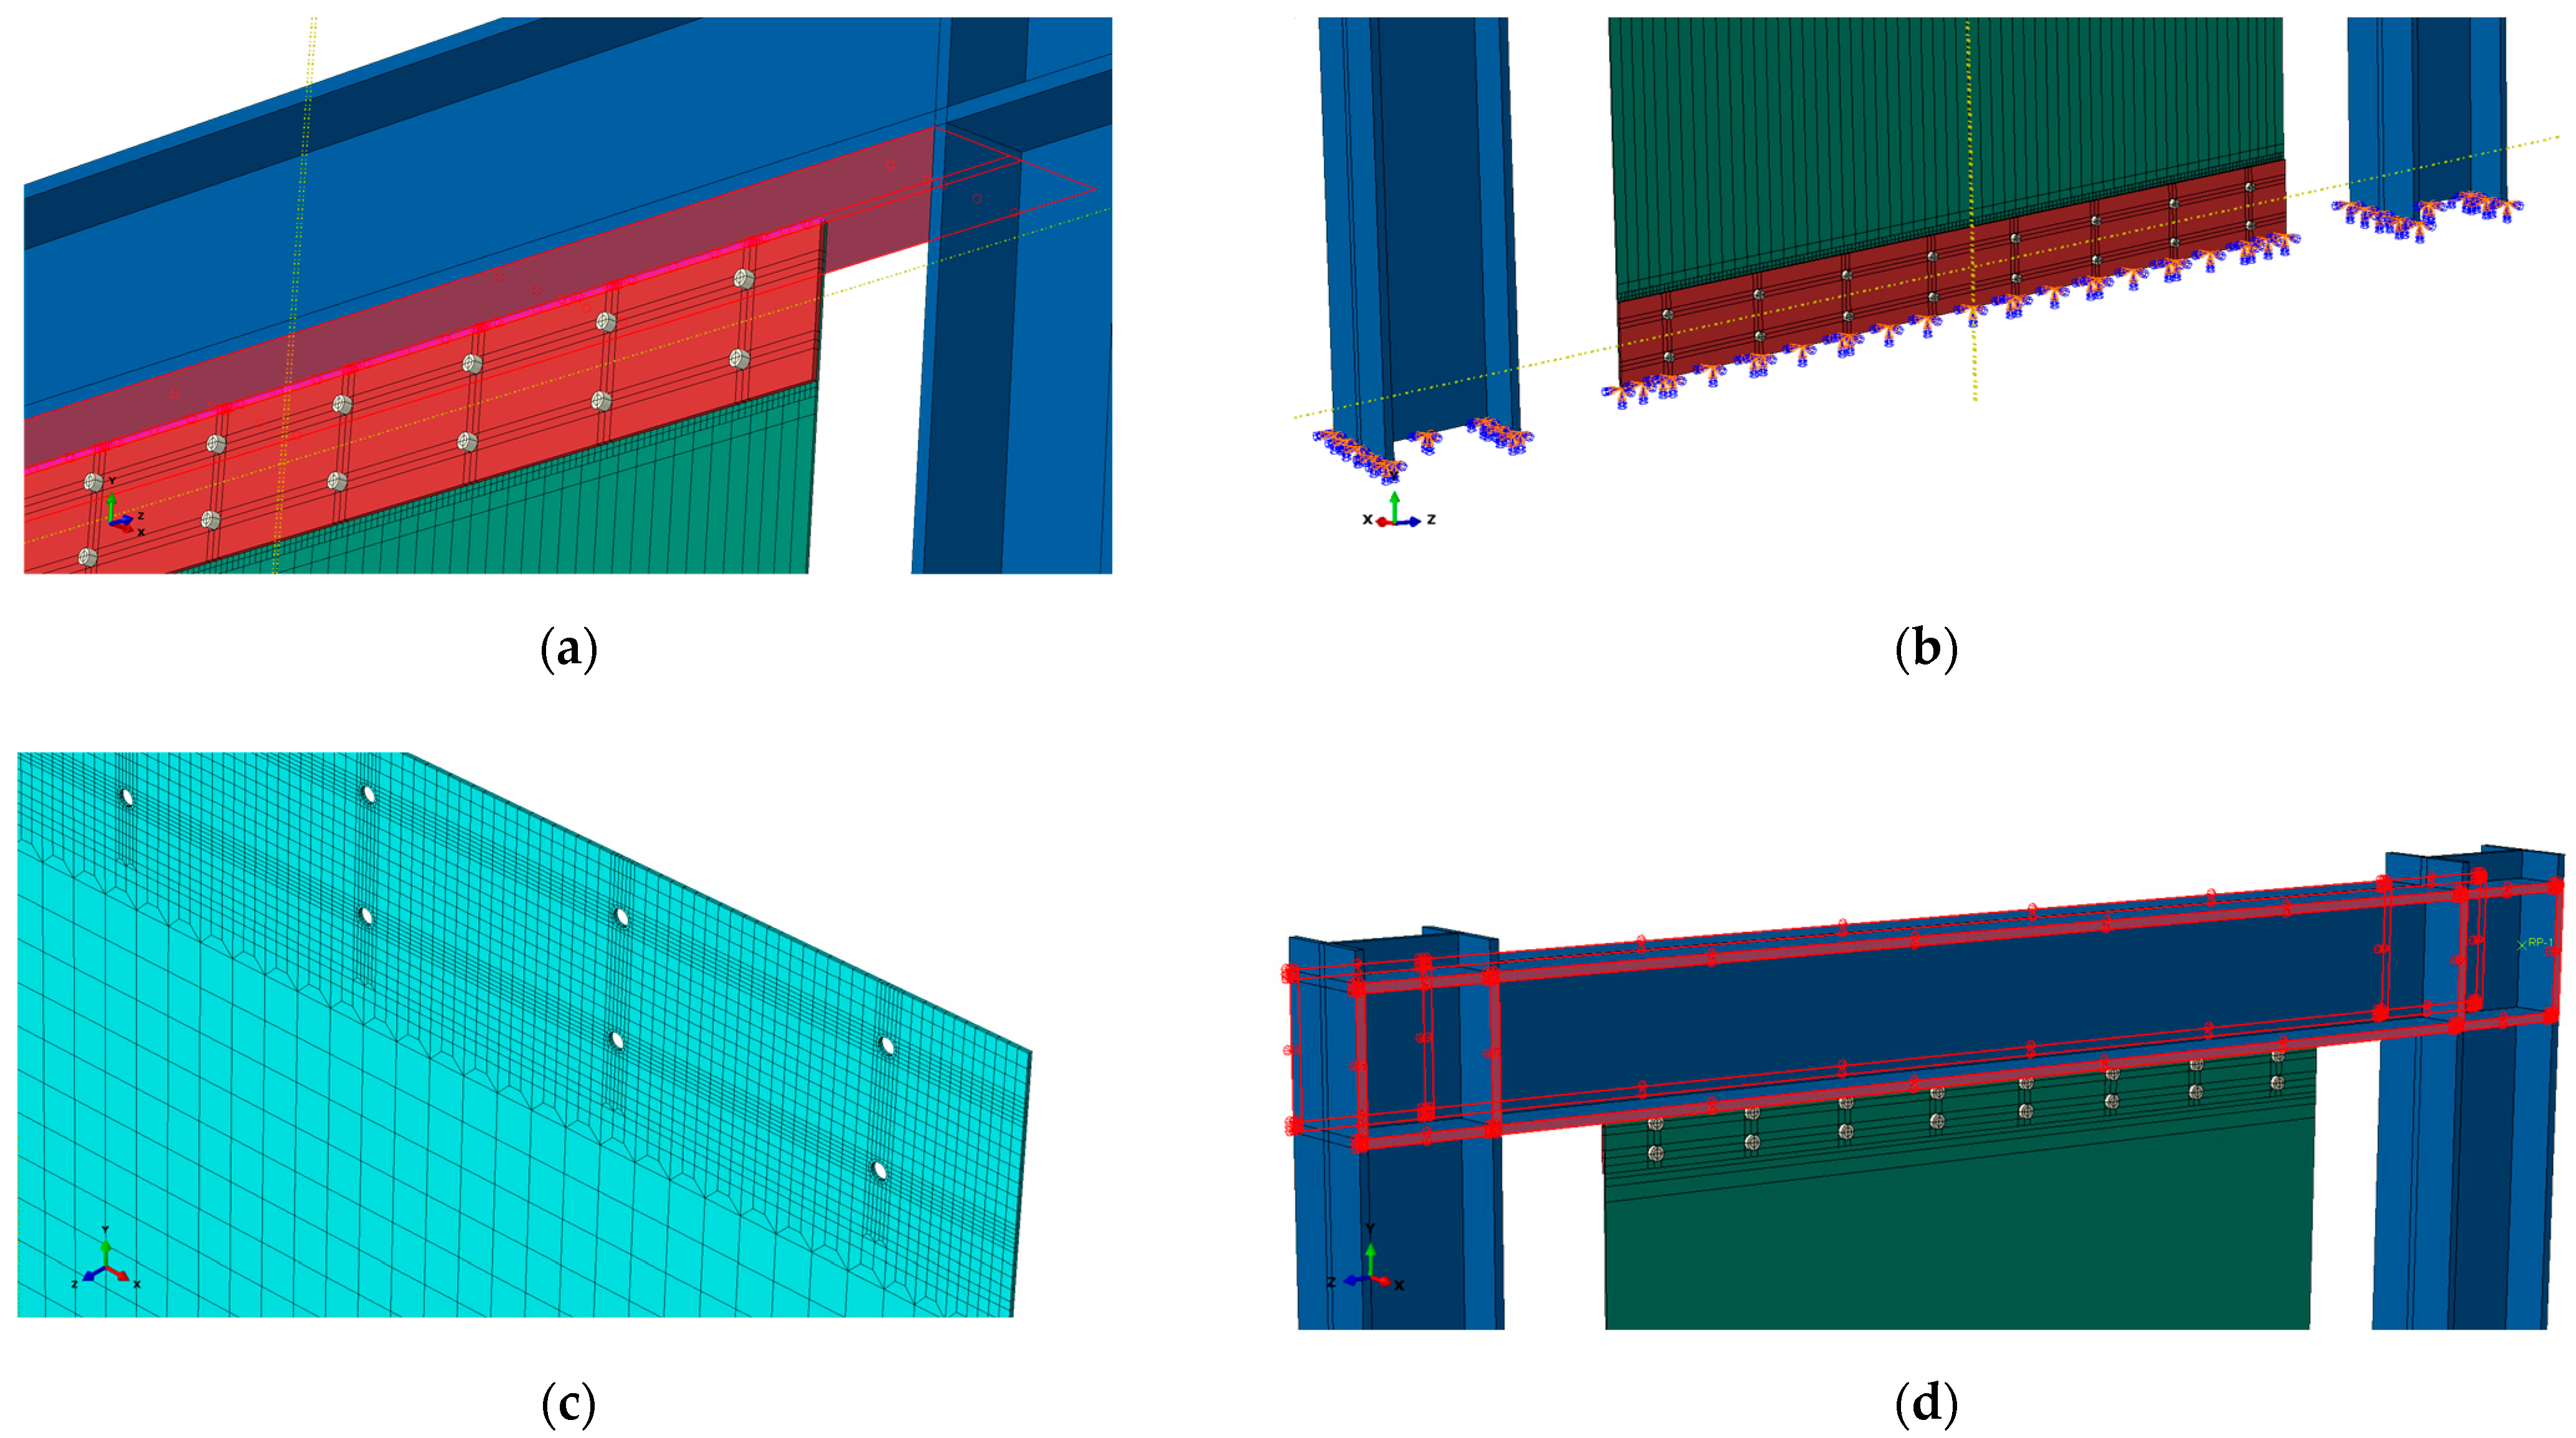
No models were established using base beams. Instead, for models with bolt connections, the lower end face of the lower connector and the bottom of the column were fixed with a boundary condition named “ENCASTRE,” while the upper connector and the frame beam were fixed using a “Tie” constraint (Figure 8a,b). For the model “SPSW-T,” the lower end face of the steel plate and the bottom of the column were fixed (the same treatment method applied to models with bolt connections), while the upper end face of the steel plate and the frame beam were fixed using a “Tie” constraint (also the same treatment). The meshes between the bolted region and middle of the bolt-connected steel plates were generated using the transitional mesh shown in Figure 8c. In addition, to explore the influence of frame conditions on each model, the models were established with and without the frame beam flange constraints. The frame beam flanges were constrained in the out-of-plane direction of the steel plate. An “X” suffix in the model’s name indicates that the frame beam flanges of the model were constrained (Figure 8d); otherwise, the model did not include these constraints. The names of and differences between the models are listed in Table 6. None of the models considered initial imperfections.
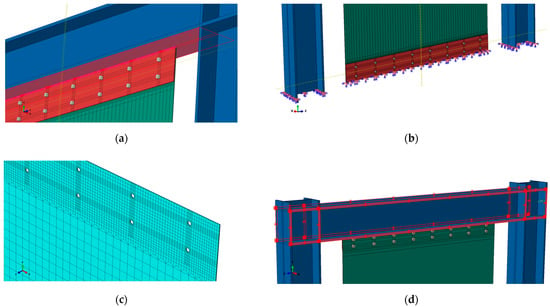
Figure 8.
Construction details of the models used for performance analysis: (a) upper part of the bolt connection of the steel plate; (b) lower part of the bolt connection of the steel plate; (c) transitional meshes of the steel plate; (d) out-of-plane constraints for frame beams.

Table 6.
FEM models used for performance analysis.
All models were prepared for monotonic loading and hysteretic loading. Similar to FEM model verification, for each model, the corresponding pre-tightening force was applied first. Subsequently, horizontal loading was performed at the reference point, coupling the loading end. For each model under monotonic loading, the displacement angle was 0.025 (corresponding to an 87.5 mm horizontal displacement of the column top). For each model, cyclic loading was applied at the reference point, coupling the loading end; the cyclic loading mechanisms are summarized in Table 7.

Table 7.
Cyclic loading mechanism.
Some models used for performance analysis are shown in Figure 9a–c.

Figure 9.
Partial models: (a) SPSW-N8; (b) SPSW-T; (c) FRAME.
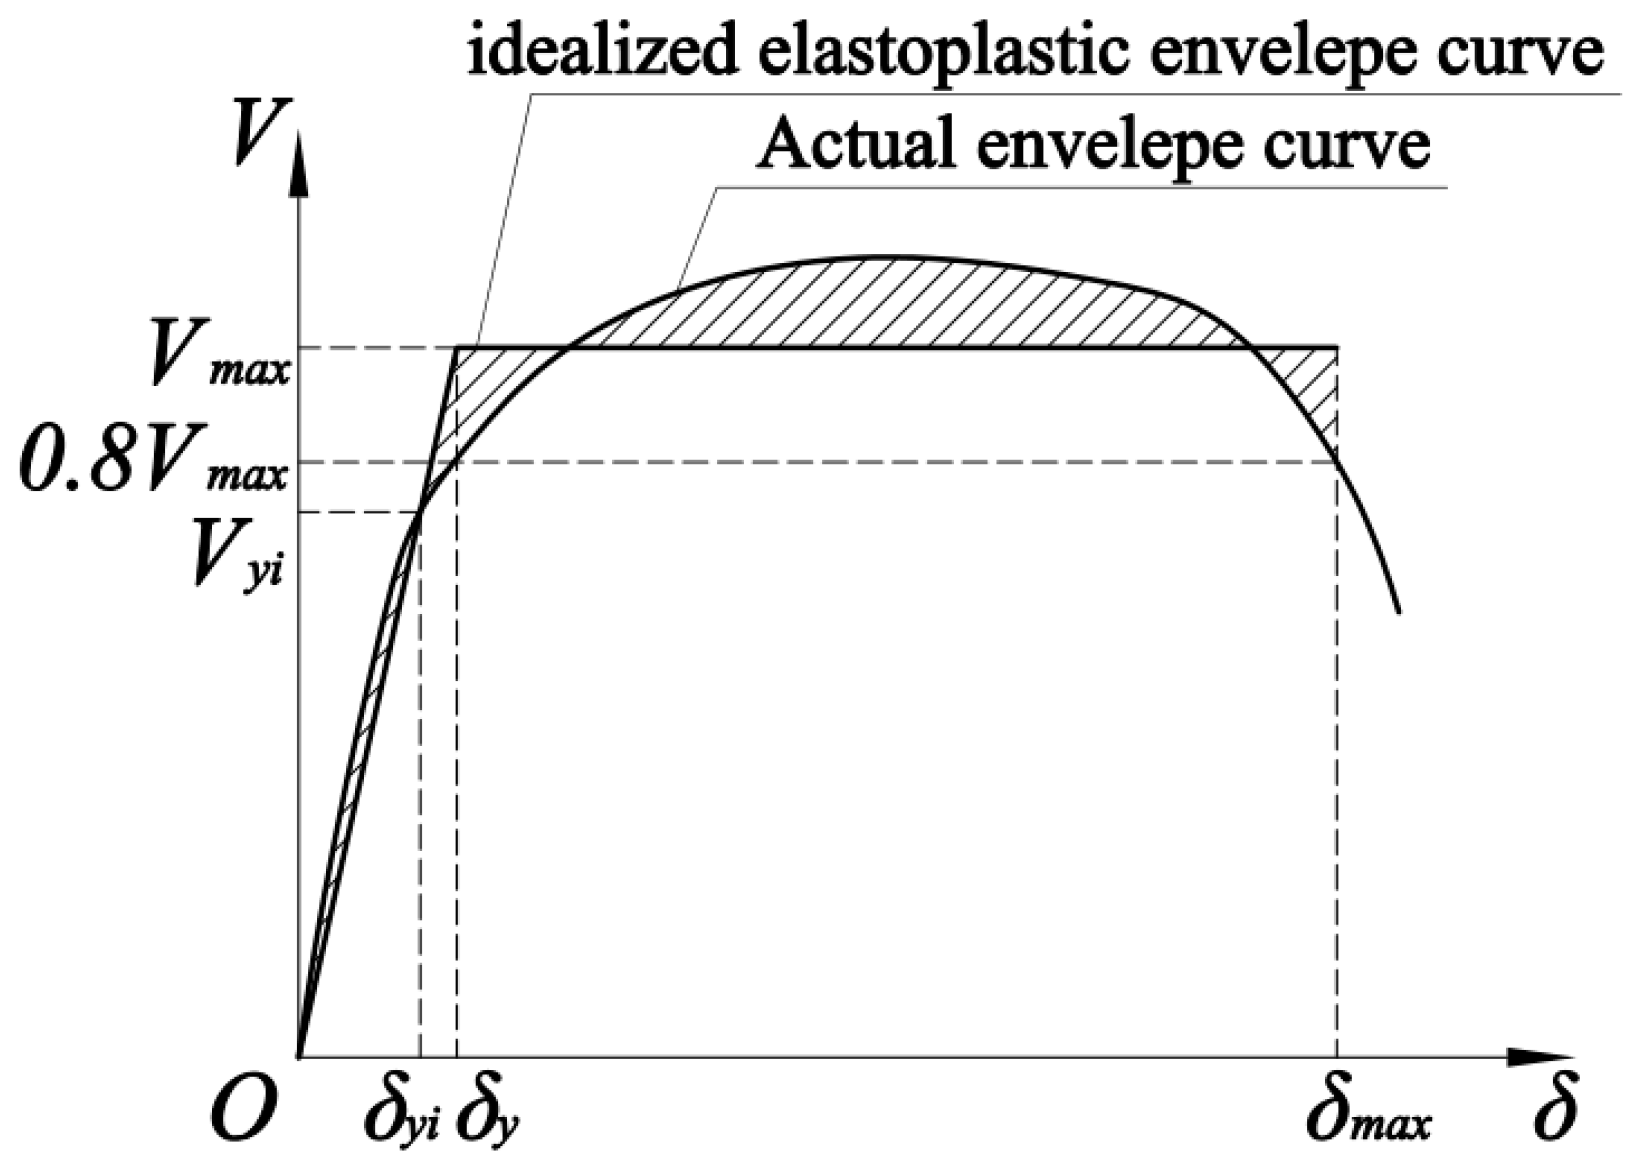
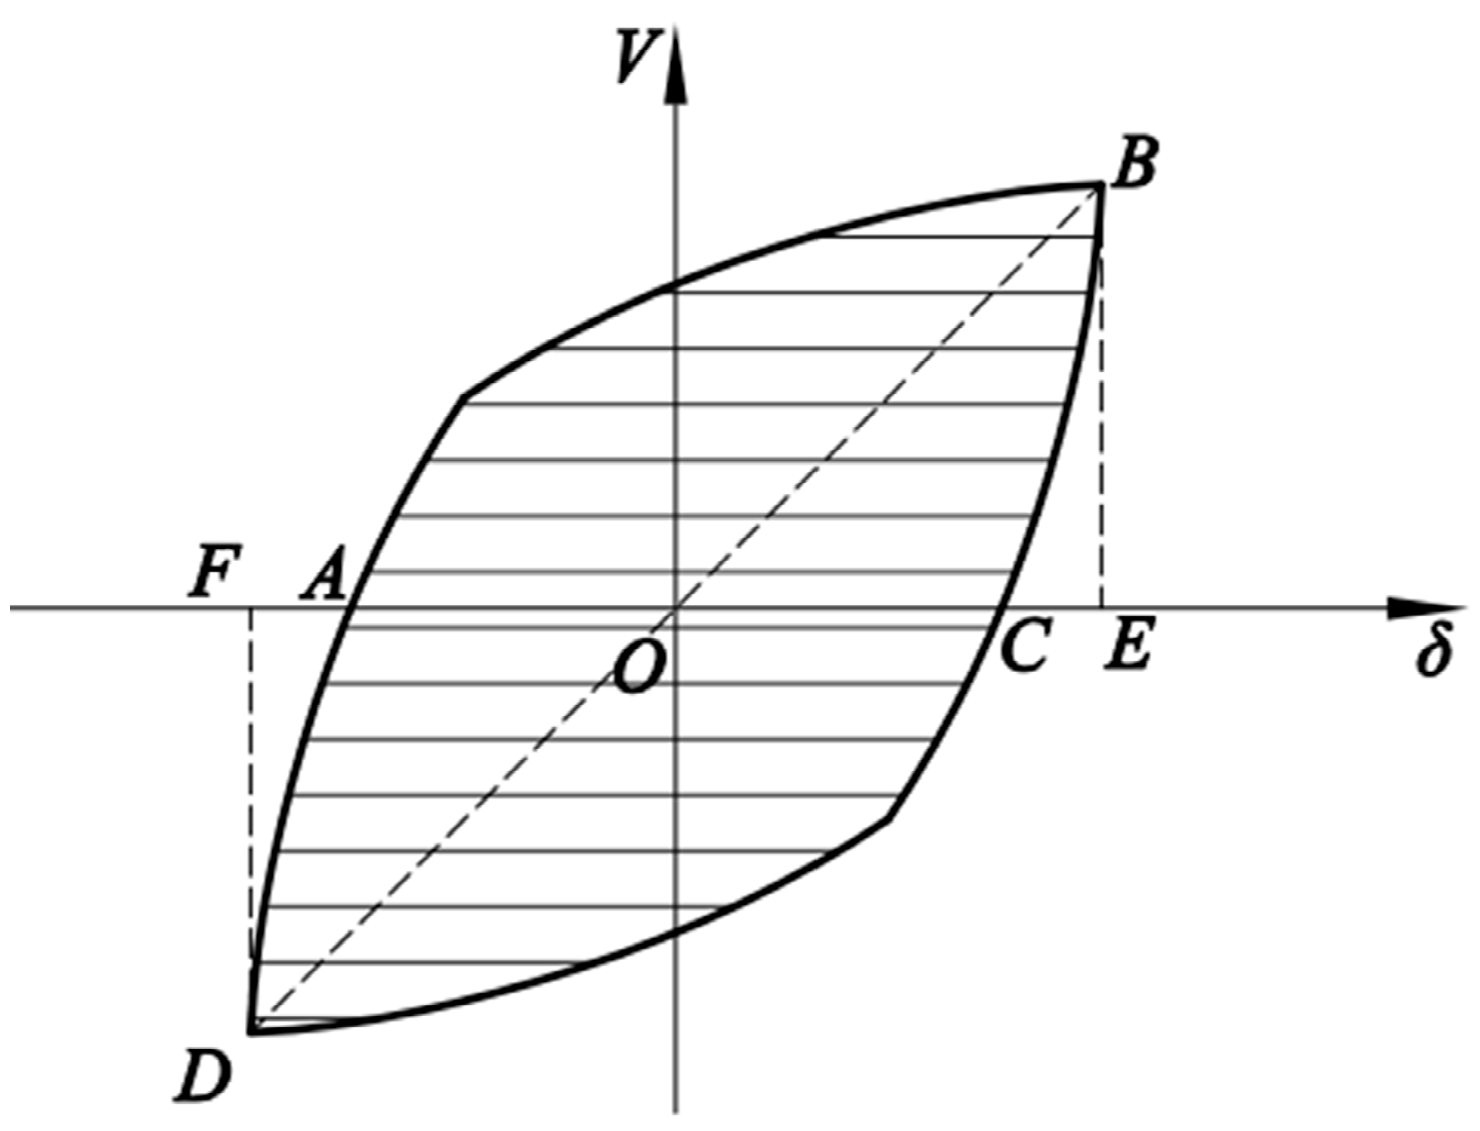
An equal energy method was used to determine the yield point and calculate the related mechanical property parameters (Figure 10) [35,36]. In this method, the yield displacement () and yield bearing capacity () are determined using an idealized elastoplastic envelope curve. Maximum displacement () is defined using two methods. If softening behavior occurs in the envelope curve, is equal to 0.8 times the ultimate strength during the softening stage in the force–displacement curve. However, if softening does not occur, is determined as the maximum displacement of the envelope curve. Then, the yield point () is defined such that the yield displacement () is equal to the displacement at the turning point of elasticity and the ideal plasticity of the idealized elastoplastic envelope curve. The elastic stage of the idealized elastoplastic envelope curve must pass through the initial yield point (), which is the point at which permanent residual deformation develops for the first time under cyclic loading. Moreover, based on equal plastic energy, the area enclosed by the idealized elastoplastic envelope curve from 0 to is equal to that enclosed by the actual envelope curve. The yield displacement () was calculated using Equation (3), where is a function that describes the force at a displacement from the actual envelope curve. The formula for calculating the ductility ratio is given in Equation (4). The energy dissipation capacity of SPSWs can be evaluated using the energy dissipation coefficient from Equation (3) [37]. In Equation (5), is the area of the hysteresis curve and represents the corresponding triangular areas (Figure 11).
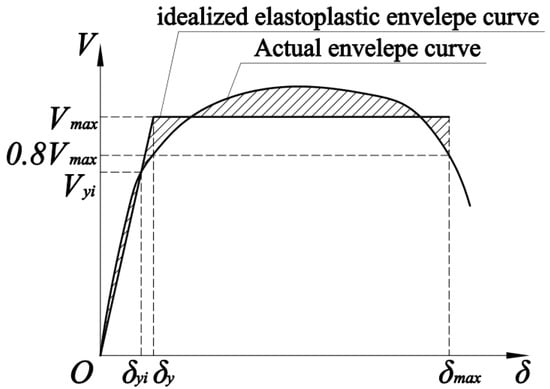
Figure 10.
Definition of the idealized elastoplastic envelope curve.
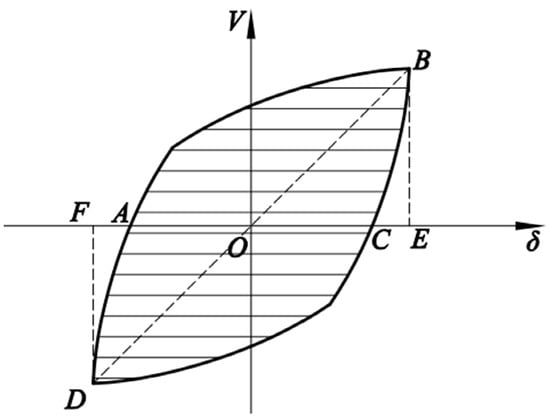
Figure 11.
Definition of the energy dissipation coefficient.
3. Result Analysis
3.1. Hysteretic Curves
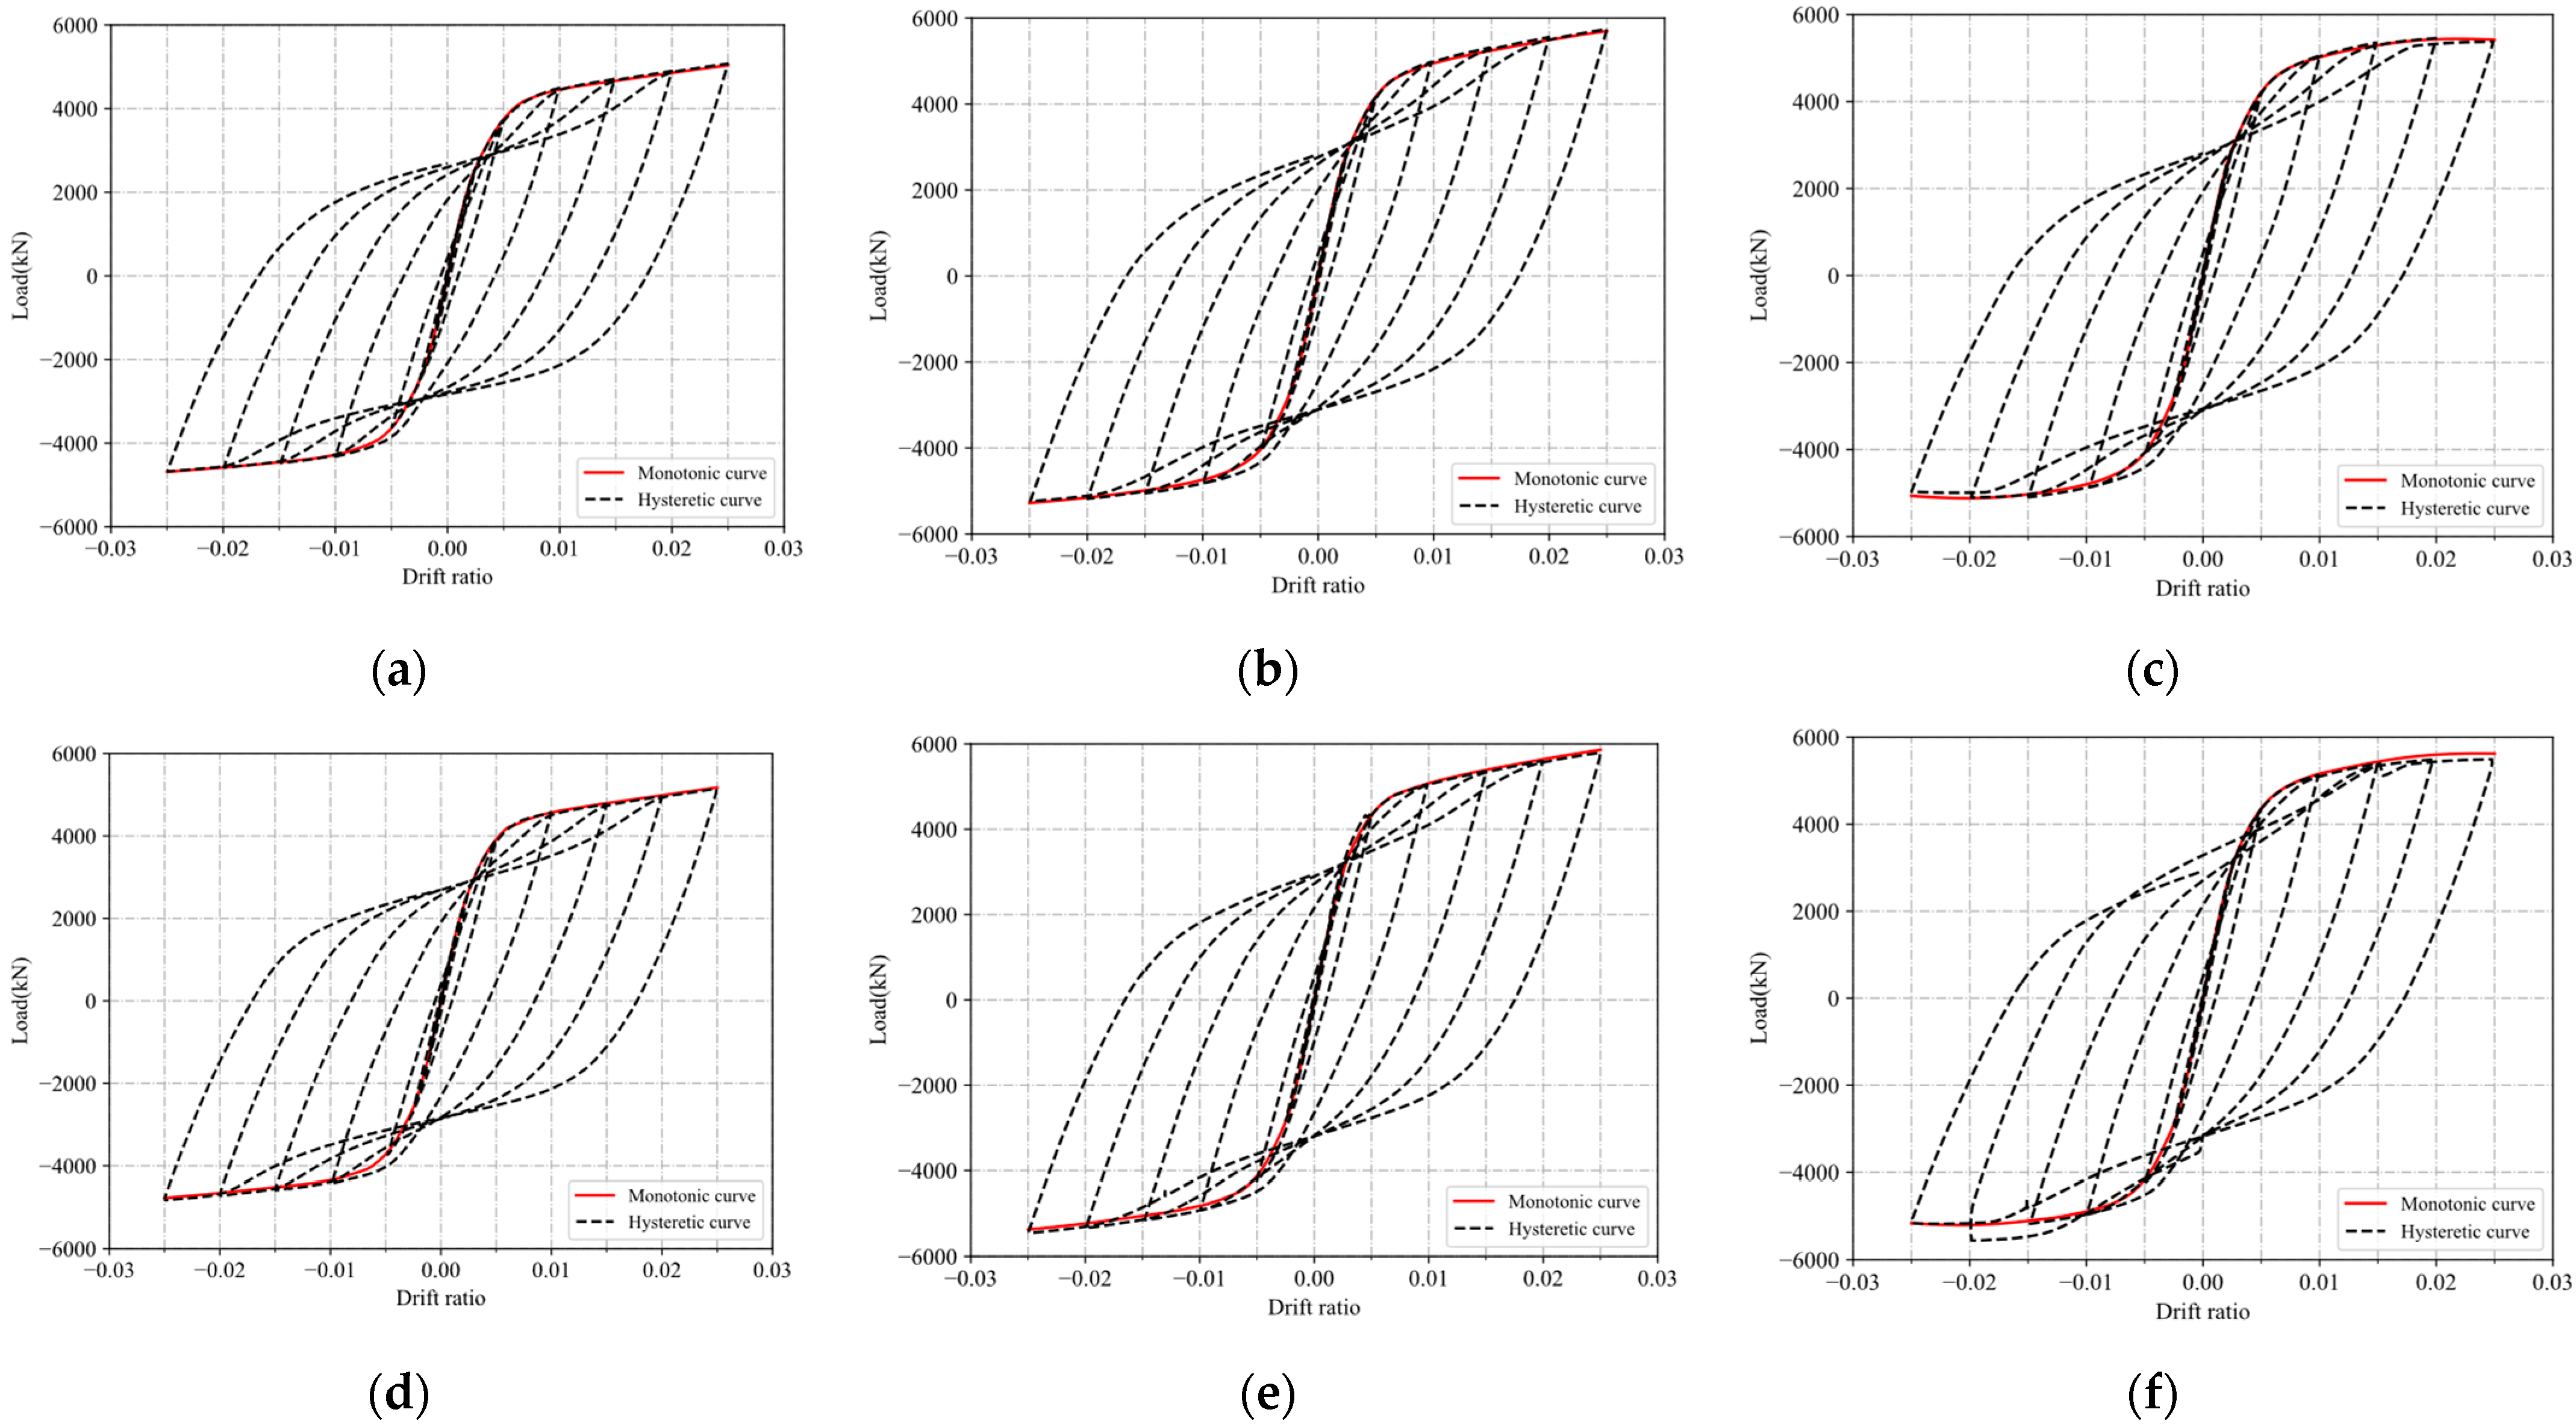
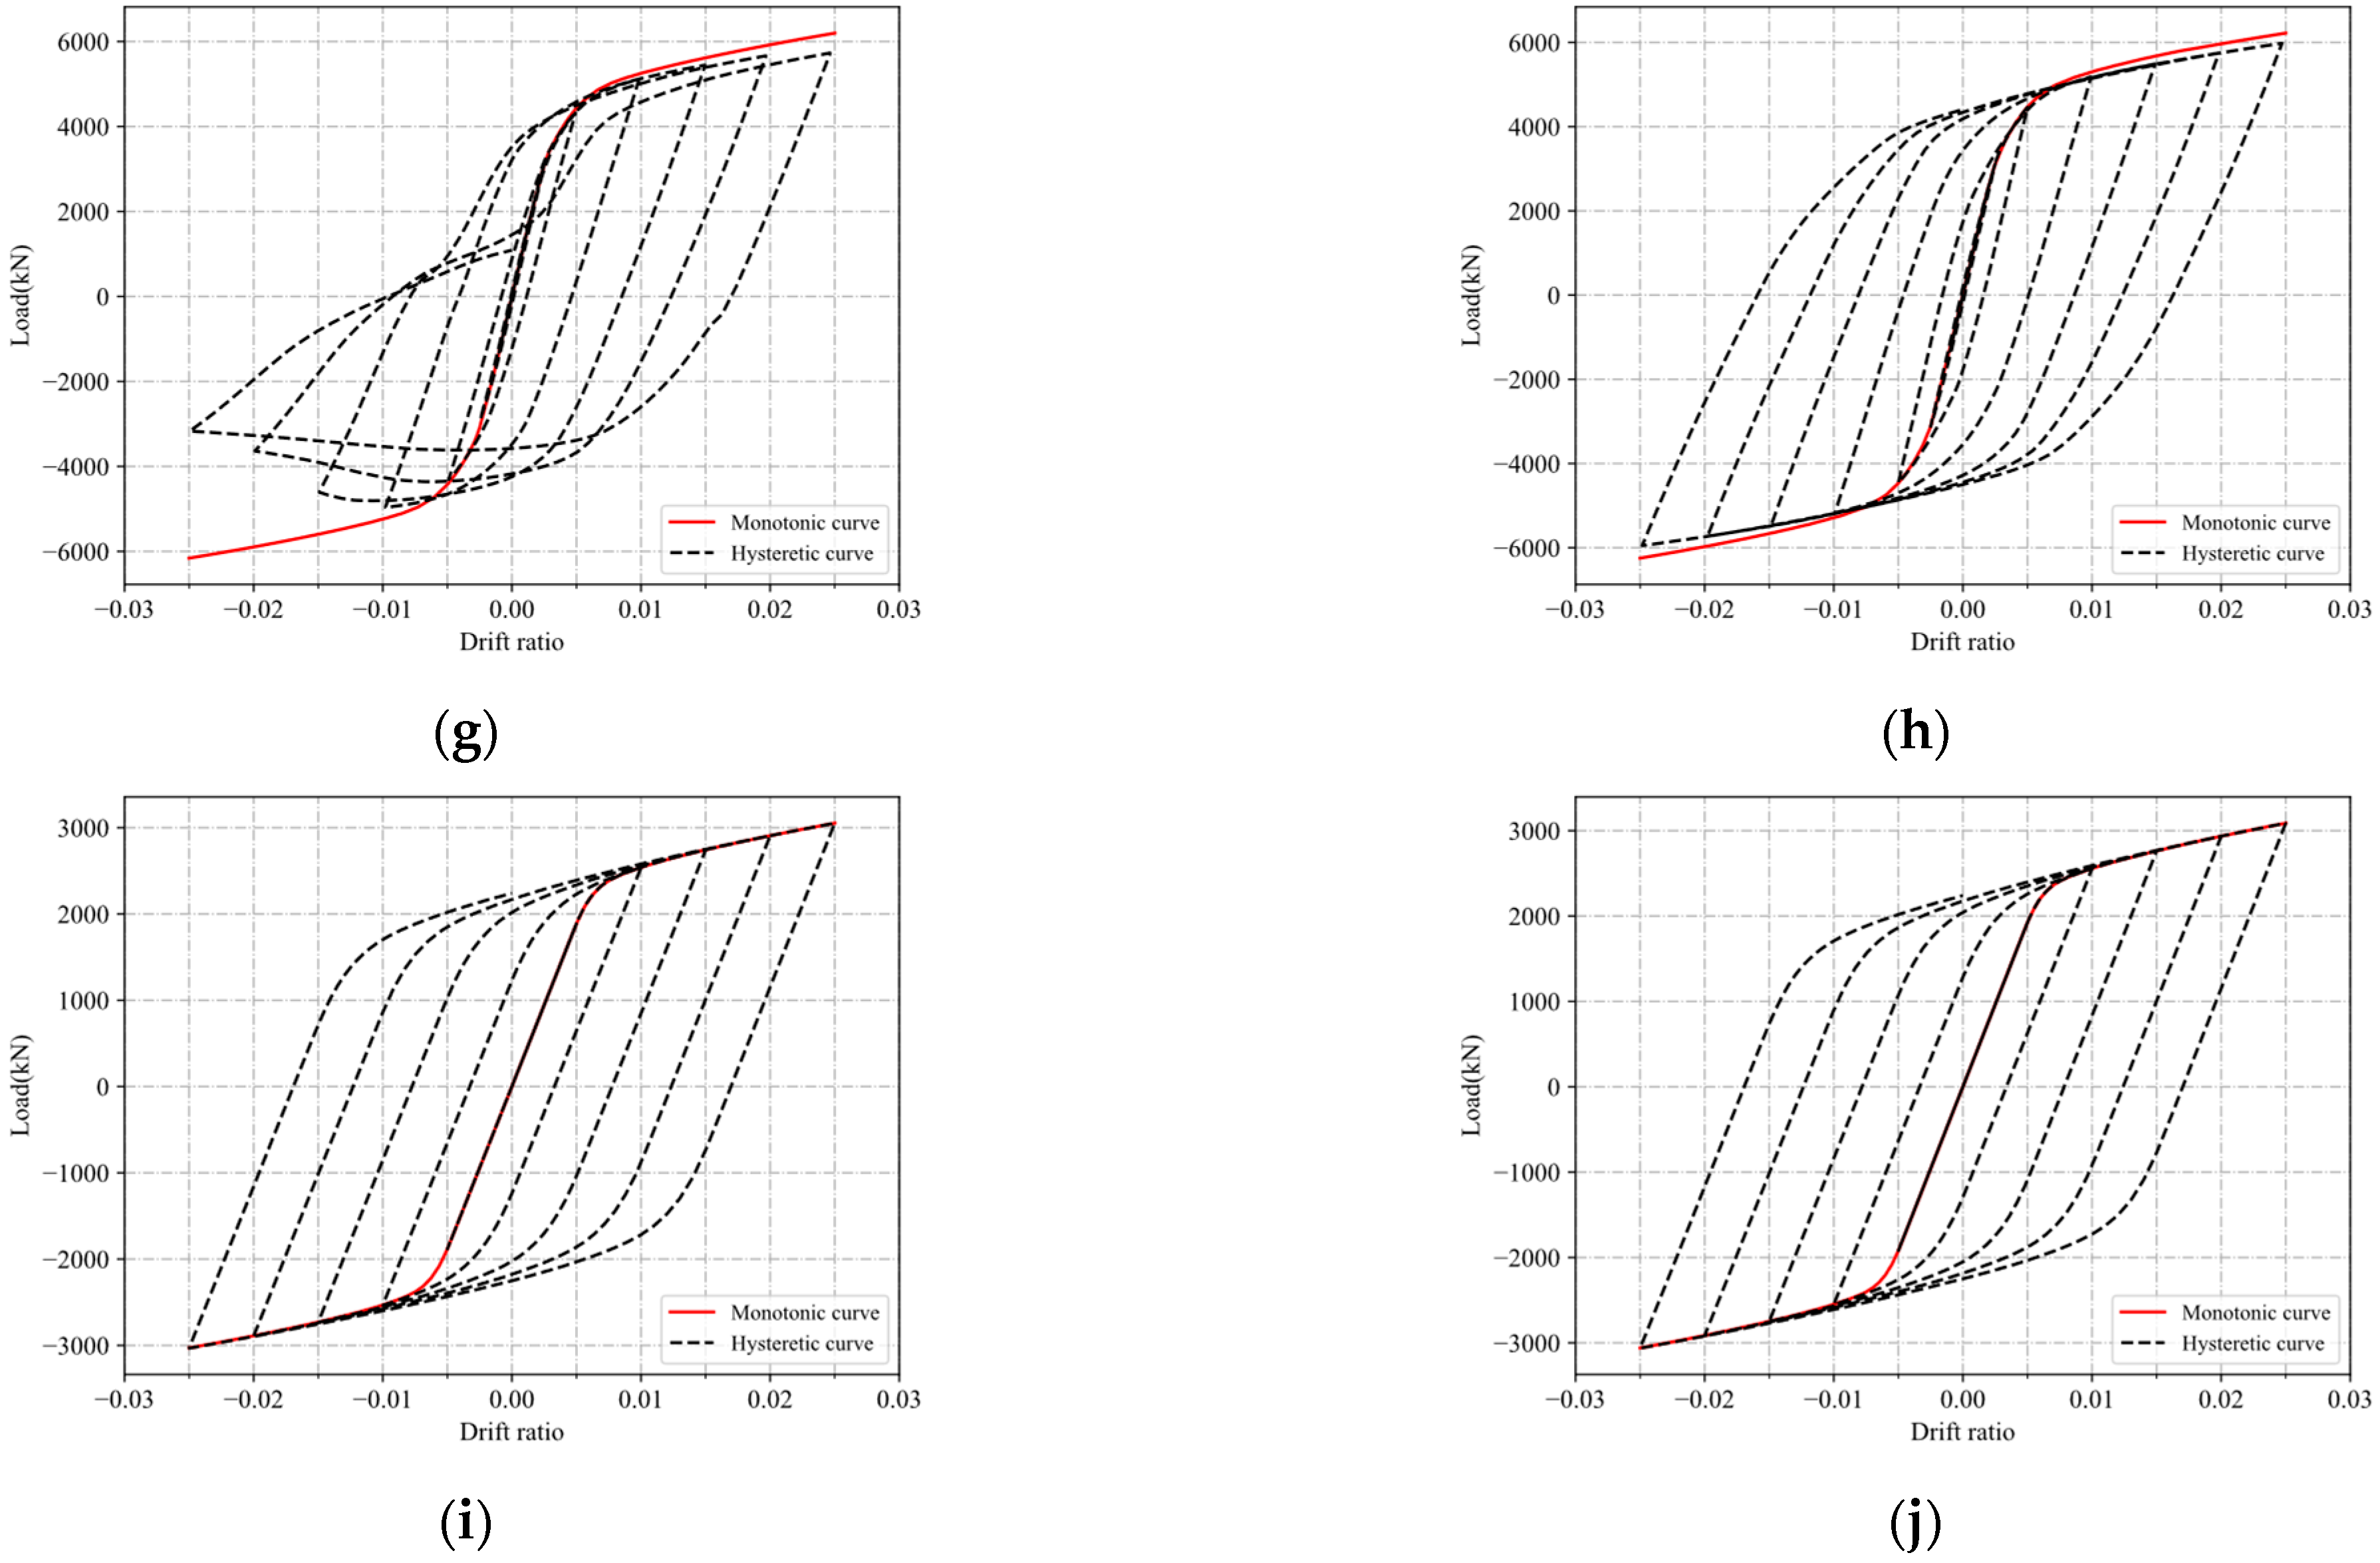
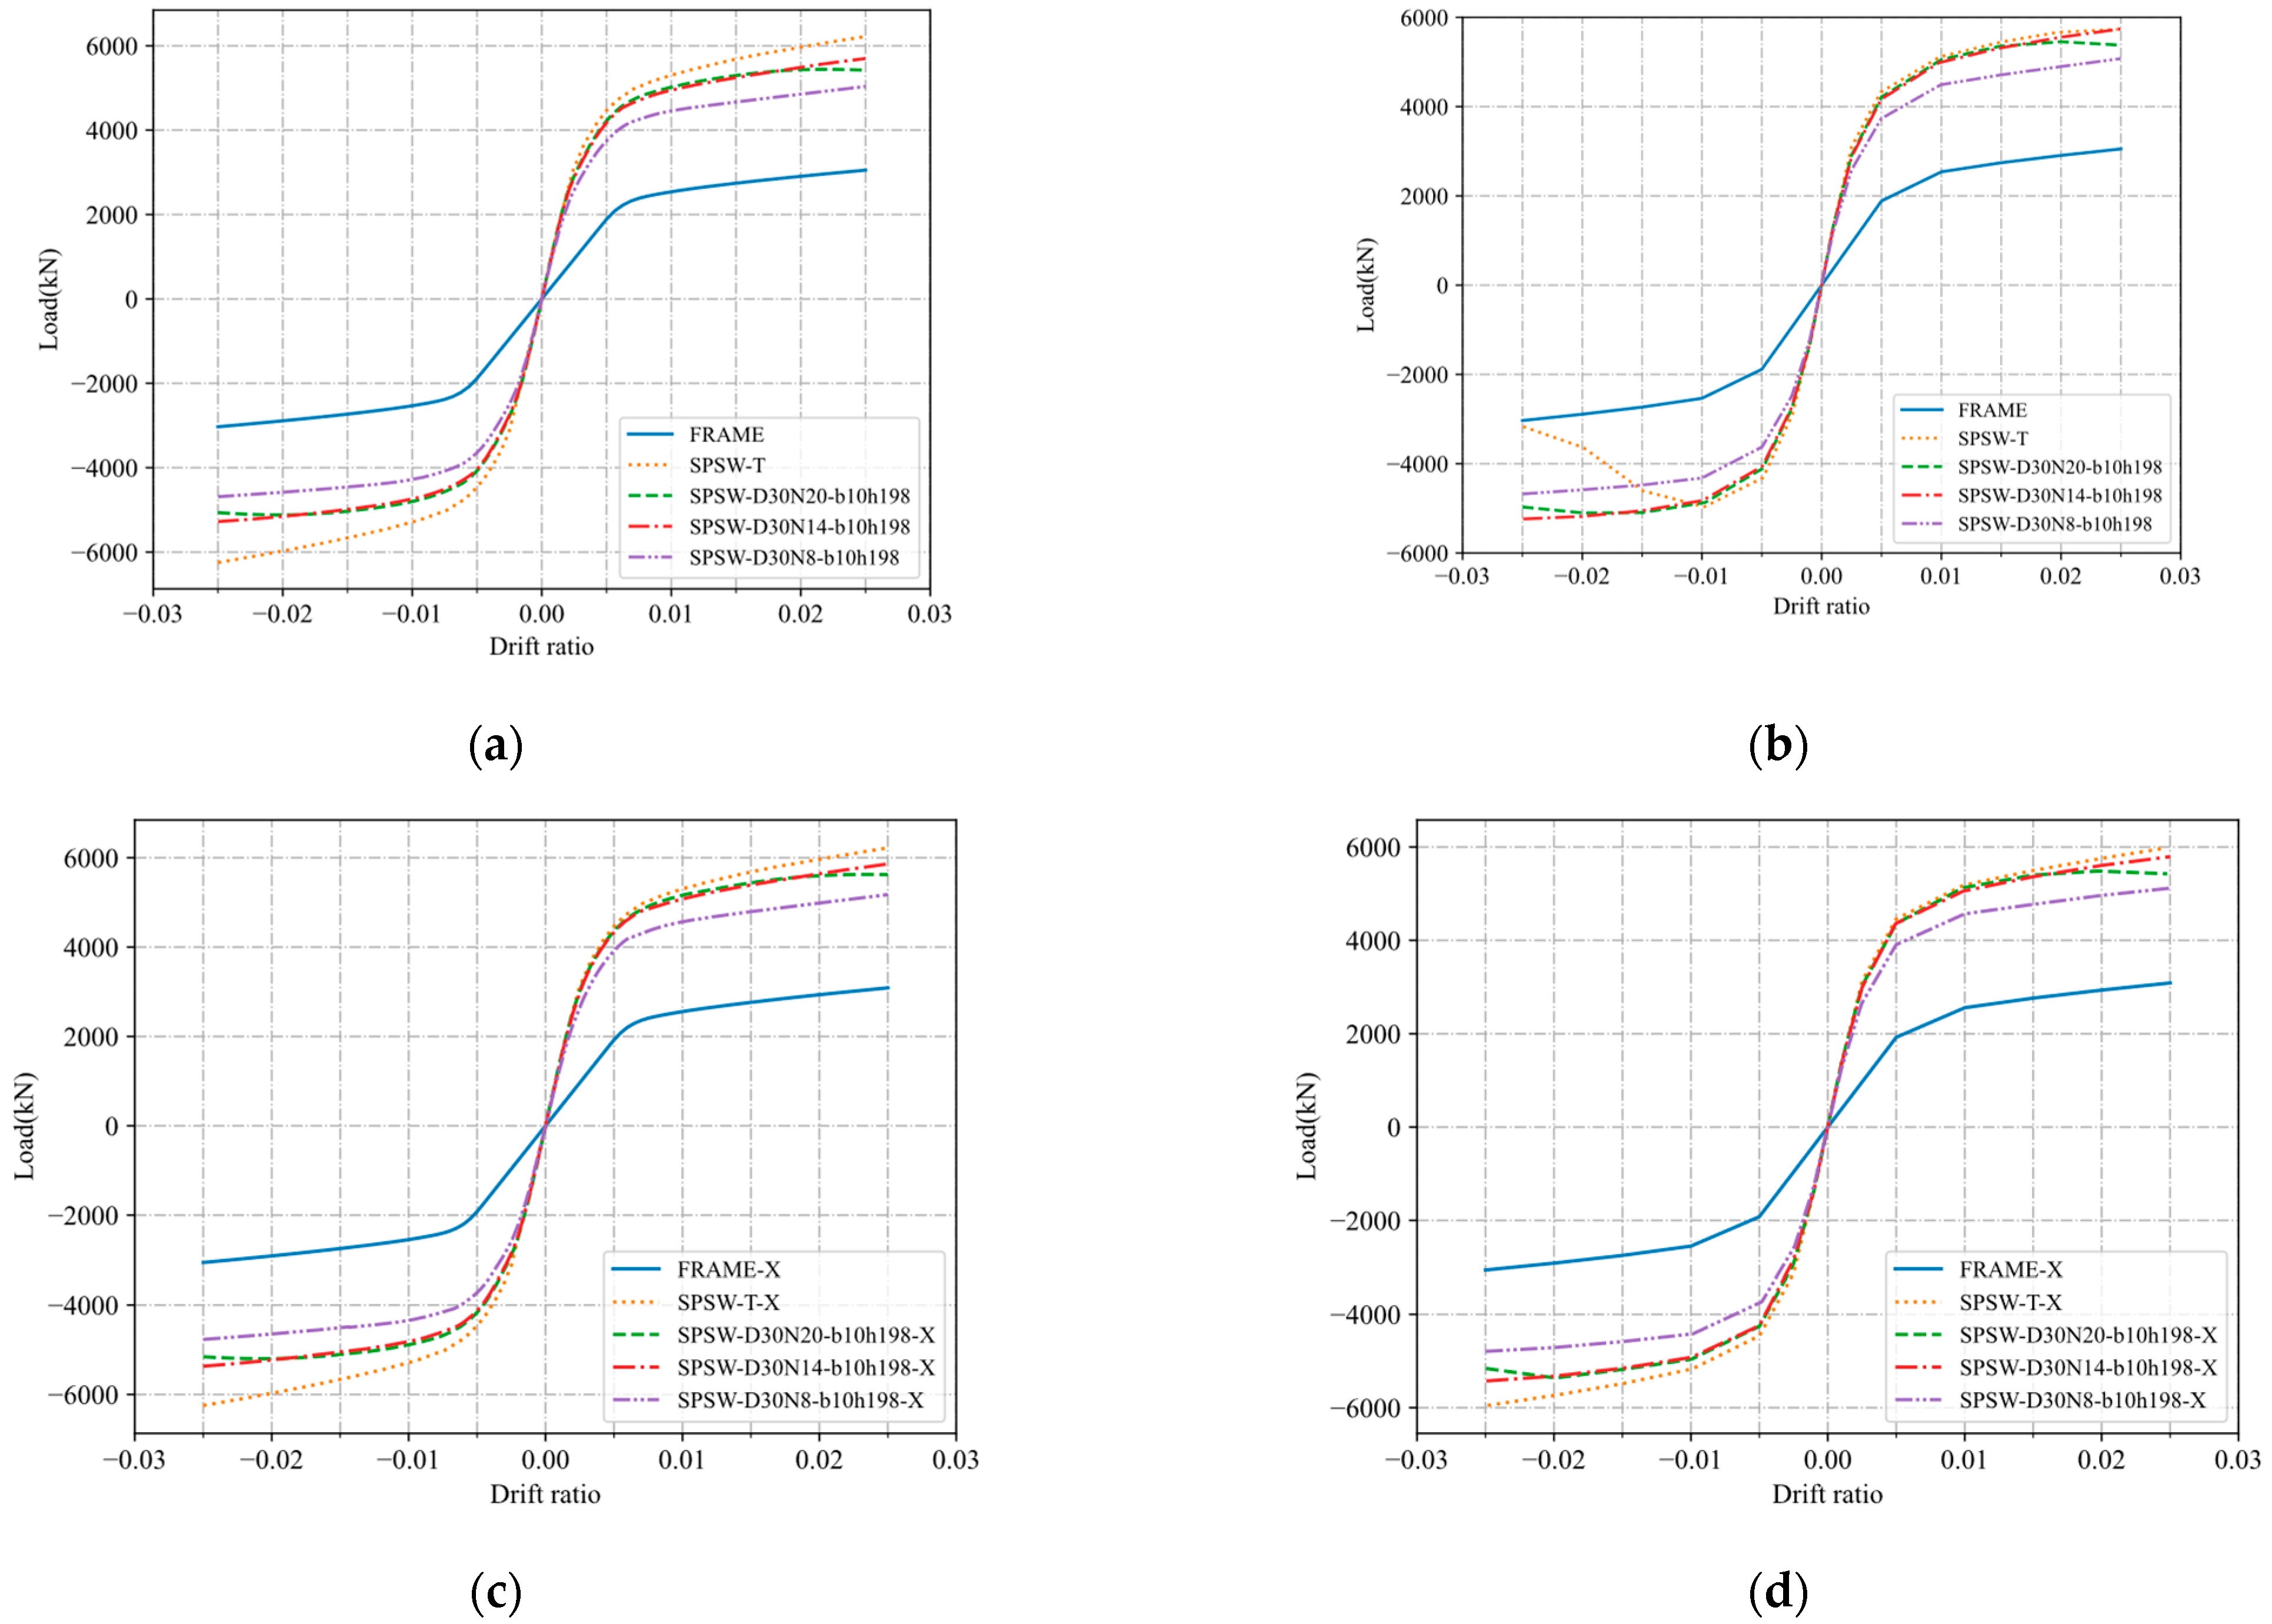
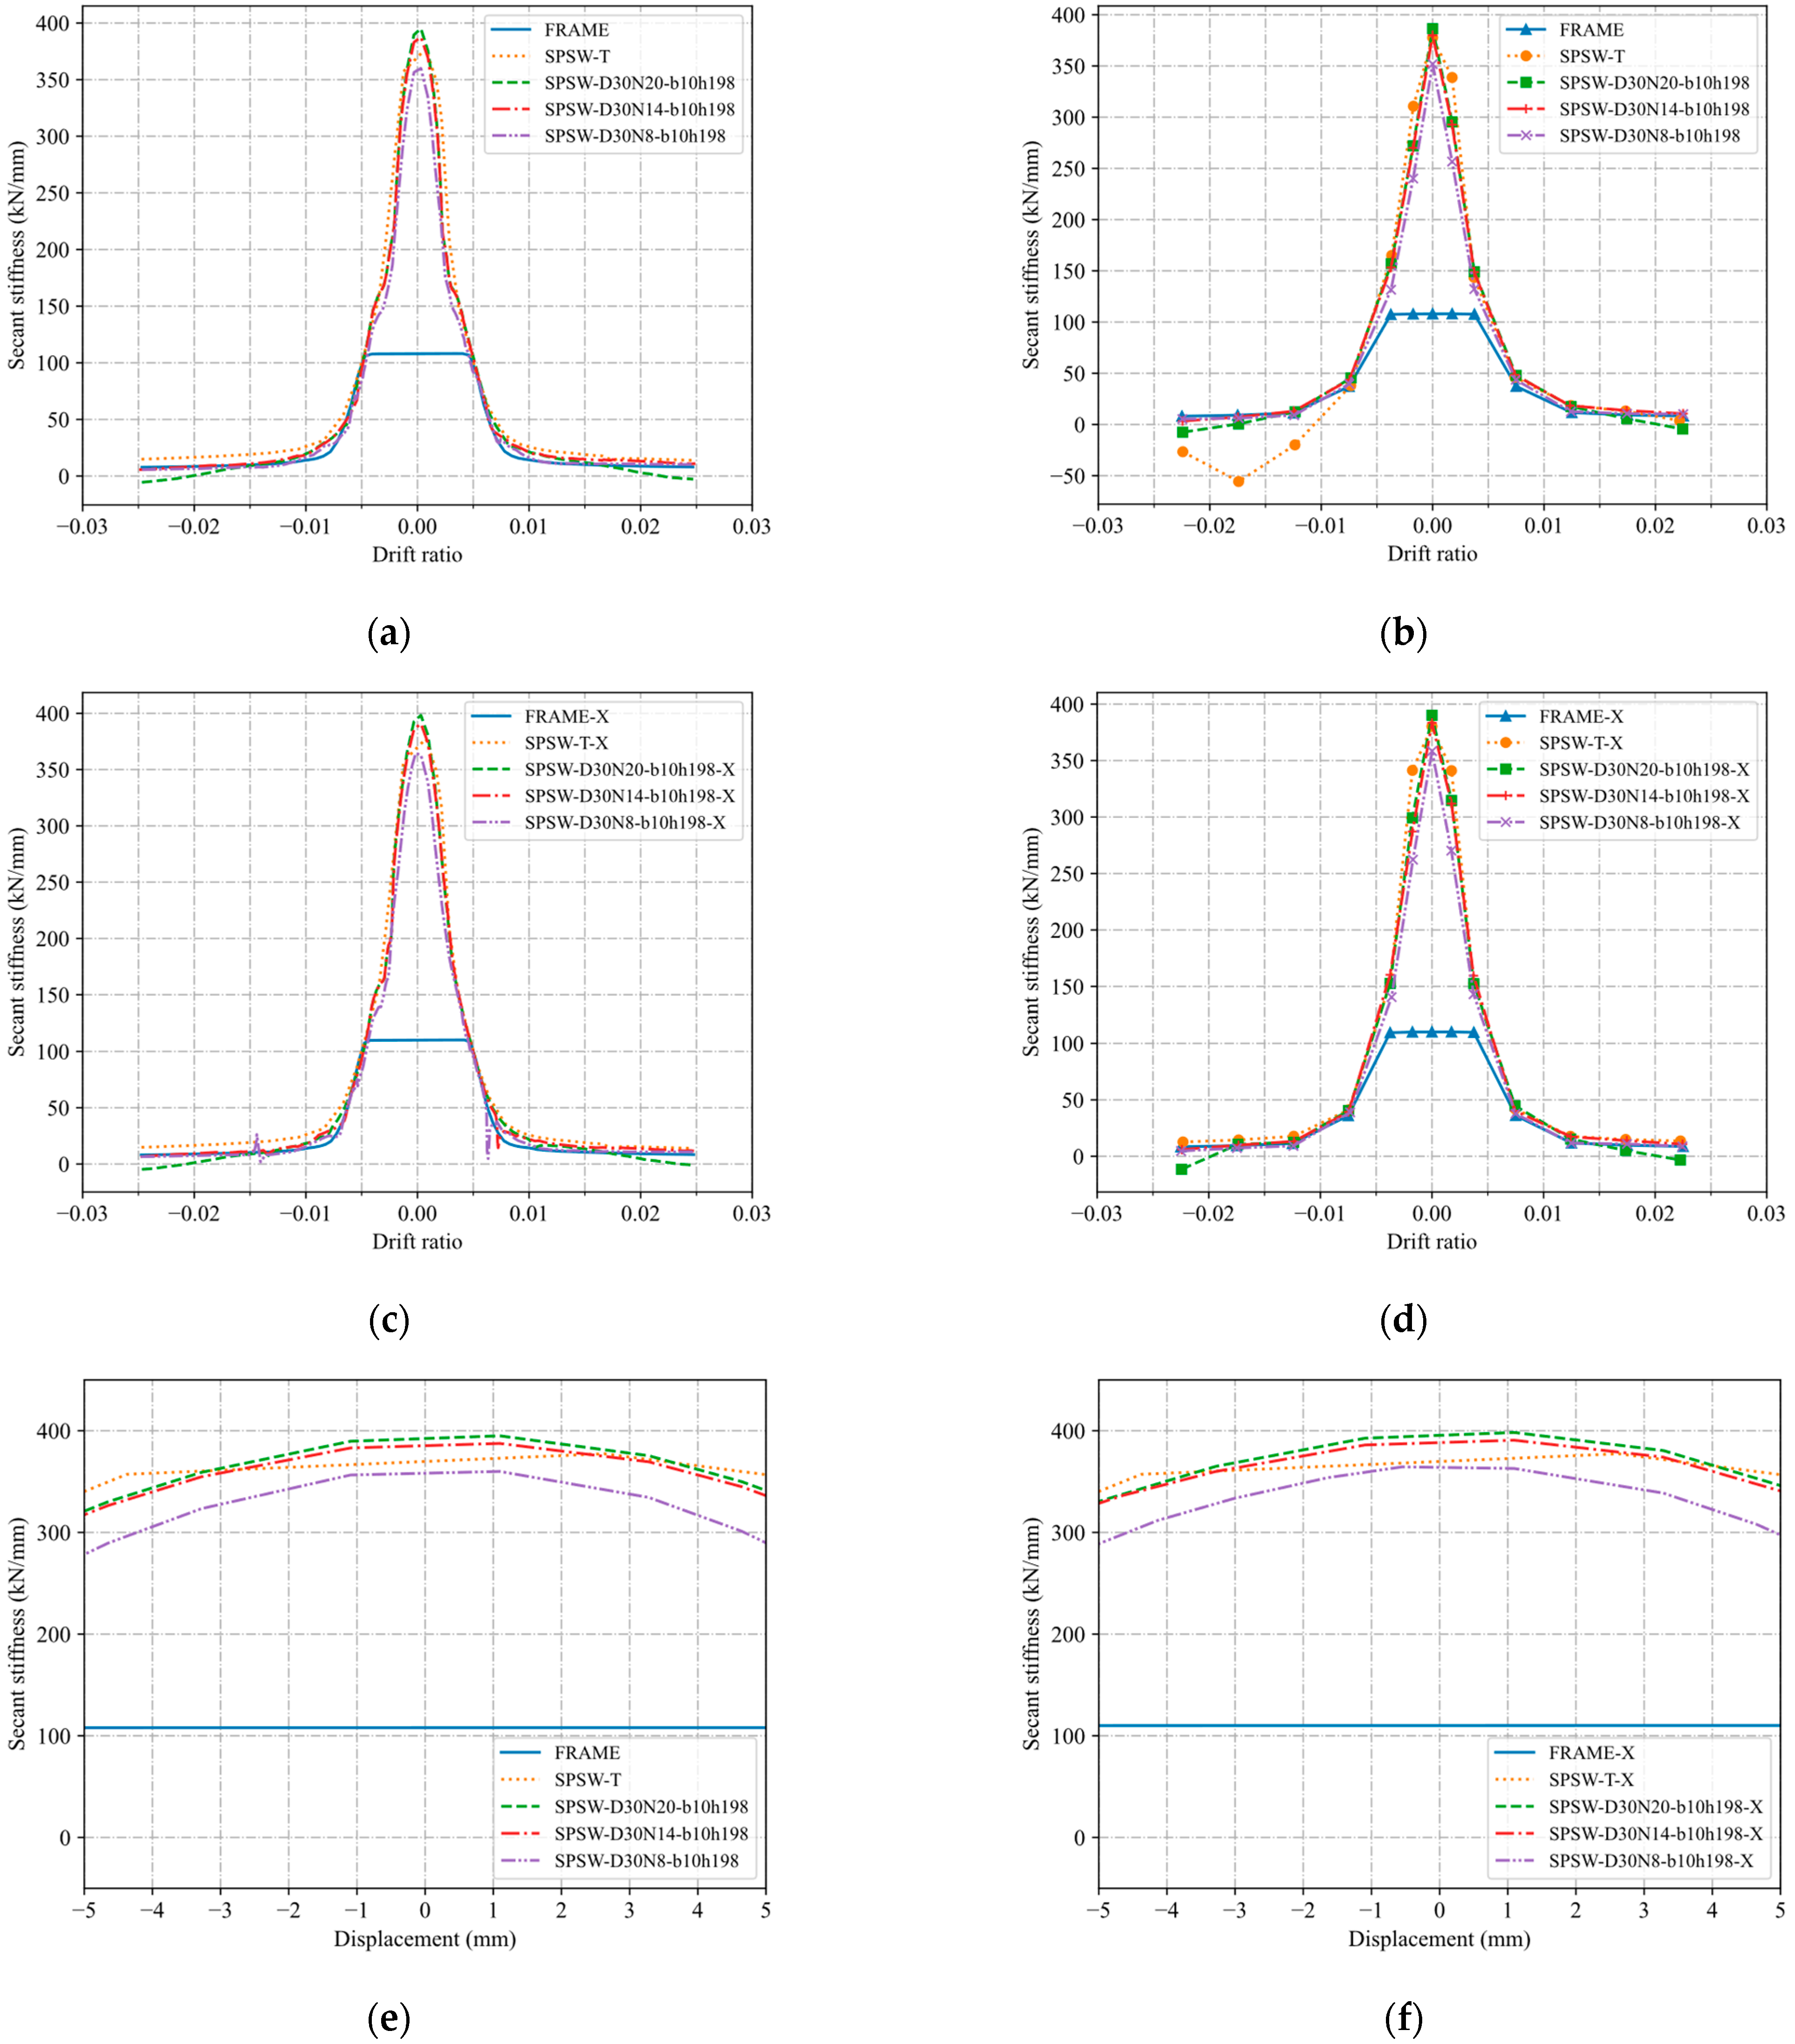
The hysteretic and pushover curves of each model are shown in Figure 12, and Figure 13 shows a comparison between the hysteresis envelope and pushover curves of the models with and without constraints on the frame beam flange. Figure 14 shows a comparison between the secant stiffness reduction curves of the different models separately. The related parameters such as the initial stiffness, deformation, load of the initial yield point and ductility ratio are presented in Table 8. The hysteretic and pushover curves of these models displayed the following characteristics:
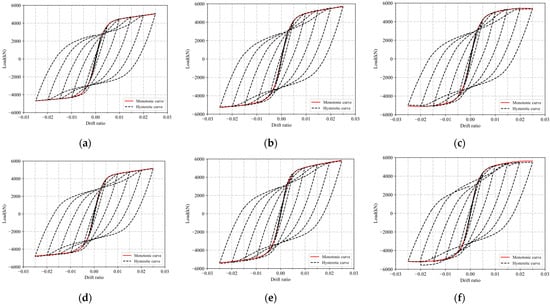
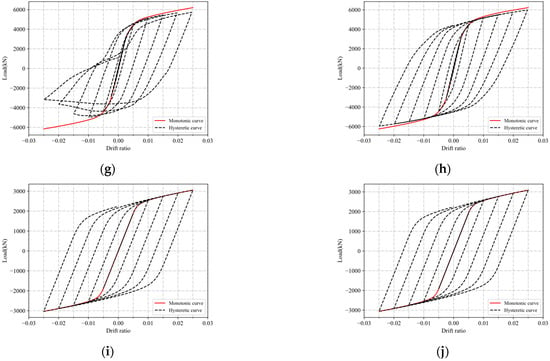
Figure 12.
Comparison between hysteretic curves and pushover curves of SPSWs with different numbers of bolts, SPSWs with two-side fixed connections and frames: (a) SPSW-N8; (b) SPSW-N14; (c) SPSW-N20; (d) SPSW-N8-X; (e) SPSW-N14-X; (f) SPSW-N20-X; (g) SPSW-T; (h) SPSW-T-X; (i) FRAME; (j) FRAME-X.
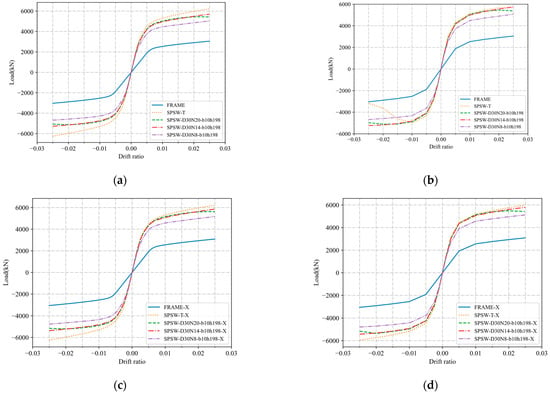
Figure 13.
Comparison between the pushover and envelope curves of different models with and without frame beam flange constraints: (a) pushover curves (models without frame beam flange constraints); (b) envelope curves (models without frame beam flange constraints); (c) pushover curves (models with frame beam flange constraints); (d) envelope curves (models with frame beam flange constraints).
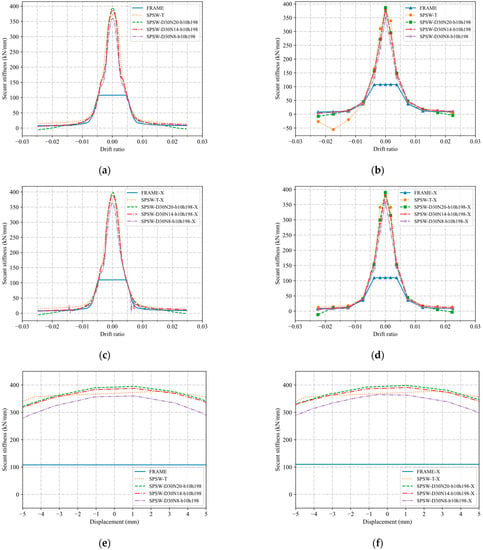
Figure 14.
Comparison between the secant stiffness reduction curves of different models separately with and without frame beam flange constraints: (a) without frame beam flange constraints under monotonic loading; (b) without frame beam flange constraints under cyclic loading; (c) with frame beam flange constraints under monotonic loading; (d) with frame beam flange constraints under cyclic loading; (e) without frame beam flange constraints within the range of 0: ±5 mm of monotonic loading; (f) with frame beam flange constraints within the range of 0: ±5 mm of monotonic loading.

Table 8.
Analysis results for SPSWs with different numbers of bolts, SPSWs with two-side fixed connections and frames 1.
- For all bolt-connected models, the hysteretic loops gradually opened and formed an increasingly pronounced “S shape” after the initial yield points. However, the fullness of the curves was inferior to that of the model “SPSW-T-X.” The stiffness degradation of these models slowed, and the hysteretic curves exhibited a discernible pinching phenomenon during the later stages of the cyclic loading.
- For the model with two-side fixed connections without frame beam flange constraints, the load at the loading end in the push direction decreased in advance because of the out-of-plane displacement of the beam-column joint. However, the frame beam flange constraints had a negligible effect on the hysteretic curves of the bolt-connected model.
- The number of bolts did not significantly influence the hysteretic curves of the bolt-connected models. However, the load on the models using the highest number of bolts (SPSW-N20 and SPSW-N20-X) decreased in the later stages of the monotonic loading or cyclic loading.
As can be observed from Table 8 and Figure 13 and Figure 14, the initial stiffness of each SPSW model is more than three times that of the frame. However, the yielding displacement of each SPSW is half that of the frame. Therefore, a steel plate could greatly improve the lateral stiffness of the frame in the elastic stage and decrease the yield displacement of the frame. However, the secant stiffness of these models (except for SPSW-T) in the elastic-plastic stage showed negligible differences. The improvement in the bearing capacity of the SPSWs benefits from the contribution of the steel plate to the elastic lateral stiffness of the members. In addition, the improvement in the ductility ratio of the SPSWs benefits from the early yield of the steel plate. The ductility ratios of the SPSW models were in the range 5.6–5.9, which indicated that the connection types and number of bolts had little influence on the ductility ratio of the bolt-connected SPSW models. As evident from the secant stiffness reduction curves shown in Figure 14, (1) the decrease in stiffness in each SPSW model is significantly higher than that of the frame model and (2) the slope of the stiffness degradation curve of the bolt-connected SPSW models is higher than that of the SPSW models with two-side fixed connections (SPSW-T or SPSW-T-X) within the range of 0–±5 mm of the monotonic loading (Figure 14e,f). In other words, the bolt-connected SPSW models exhibited a nonlinearity more apparent than that of the SPSW models with two-sided fixed connections before yielding in the initial stage of the loading.
For the SPSW models without frame beam flange constraints, the initial stiffnesses of SPSW-N8, SPSW-N14 and SPSW-N20 were 6.43% lower, 1.31% higher and 3.10% higher, respectively, than that of SPSW-T, and the ultimate bearing capacities of SPSW-N8, SPSW-N14 and SPSW-N20 were 11.42% lower, 0.20% higher and 4.81% lower, respectively, than that of SPSW-T. For the SPSW models with frame beam flange constraints, the initial stiffnesses of SPSW-N8-X, SPSW-N14-X and SPSW-N20-X were 5.63% lower, 0.90% higher and 3.37% higher, respectively, than that of SPSW-T-X, and the ultimate bearing capacity of SPSW-N8-X, SPSW-N14-X and SPSW-N20-X was 14.46% lower, 3.14% lower and 8.29% lower, respectively, than that of SPSW-T-X. These data indicate that increasing the number of bolts slightly increases the initial stiffness of the SPSWs with bolt connections; however, the effect is limited. In other words, the conclusion obtained from the experiment on four-side connected SPSWs by Choi et al. [17] was consistent with the numerical analysis results on the two-side connected SPSWs obtained in this study. However, to improve the ultimate bearing capacity, the number of bolts should be appropriately selected rather than randomly increased. For any bolt-connected SPSW model with a constant number of bolts, the initial stiffness, yield bearing capacity and ultimate bearing capacity of an SPSW model with frame beam flange constraints were all higher by 2%, 4% and 1%, respectively, than those of the model without the constraints.
The energy dissipation area (i.e., , shown in Figure 11) and energy dissipation coefficient of each model under all levels of the loading displacement of the cyclic loading are listed in Table 9.

Table 9.
Energy dissipation and energy dissipation coefficient of each model under all levels of cyclic loading displacements.
The ratios, and , shown in Table 9, indicate that the energy dissipation metrics of the two-side fixed SPSW models with frame beam flange constraints (SPSW-T-X) were much higher than those of the SPSW model without the constraints (SPSW-T). For all the bolt-connected SPSW models, except SPSW-N8 at a drift ratio of 0.005, the energy dissipation metrics were slightly improved after applying the frame beam flange constraints.
The ratios, ③/②, ④/② and ⑤/②, are listed in Table 9. During the later stages of the cyclic loading (drift ratio more than 0.01), these ratios were in the range of 0.7–1.3 when the frame beam flange constraints were absent, while these ratios were in the range of 0.6–1 when these constraints were applied. In other words, the energy dissipation capacity of all the bolt-connected SPSW models without frame beam flange constraints in the late stages of cyclic loading was comparable to that of SPSW-T. However, the capacity of SPSW-T-X was noticeably higher than that of any bolt-connected SPSW model with frame beam flange constraints.
In other words, the data in Table 9 indicate that restricting the out-of-plane deformation of the frame can significantly improve the energy dissipation of the two-side connected SPSW in the elastic-plastic stage but does not affect the bolt-connected SPSW.
3.2. Out-of-Plane Deformation of Steel Plate
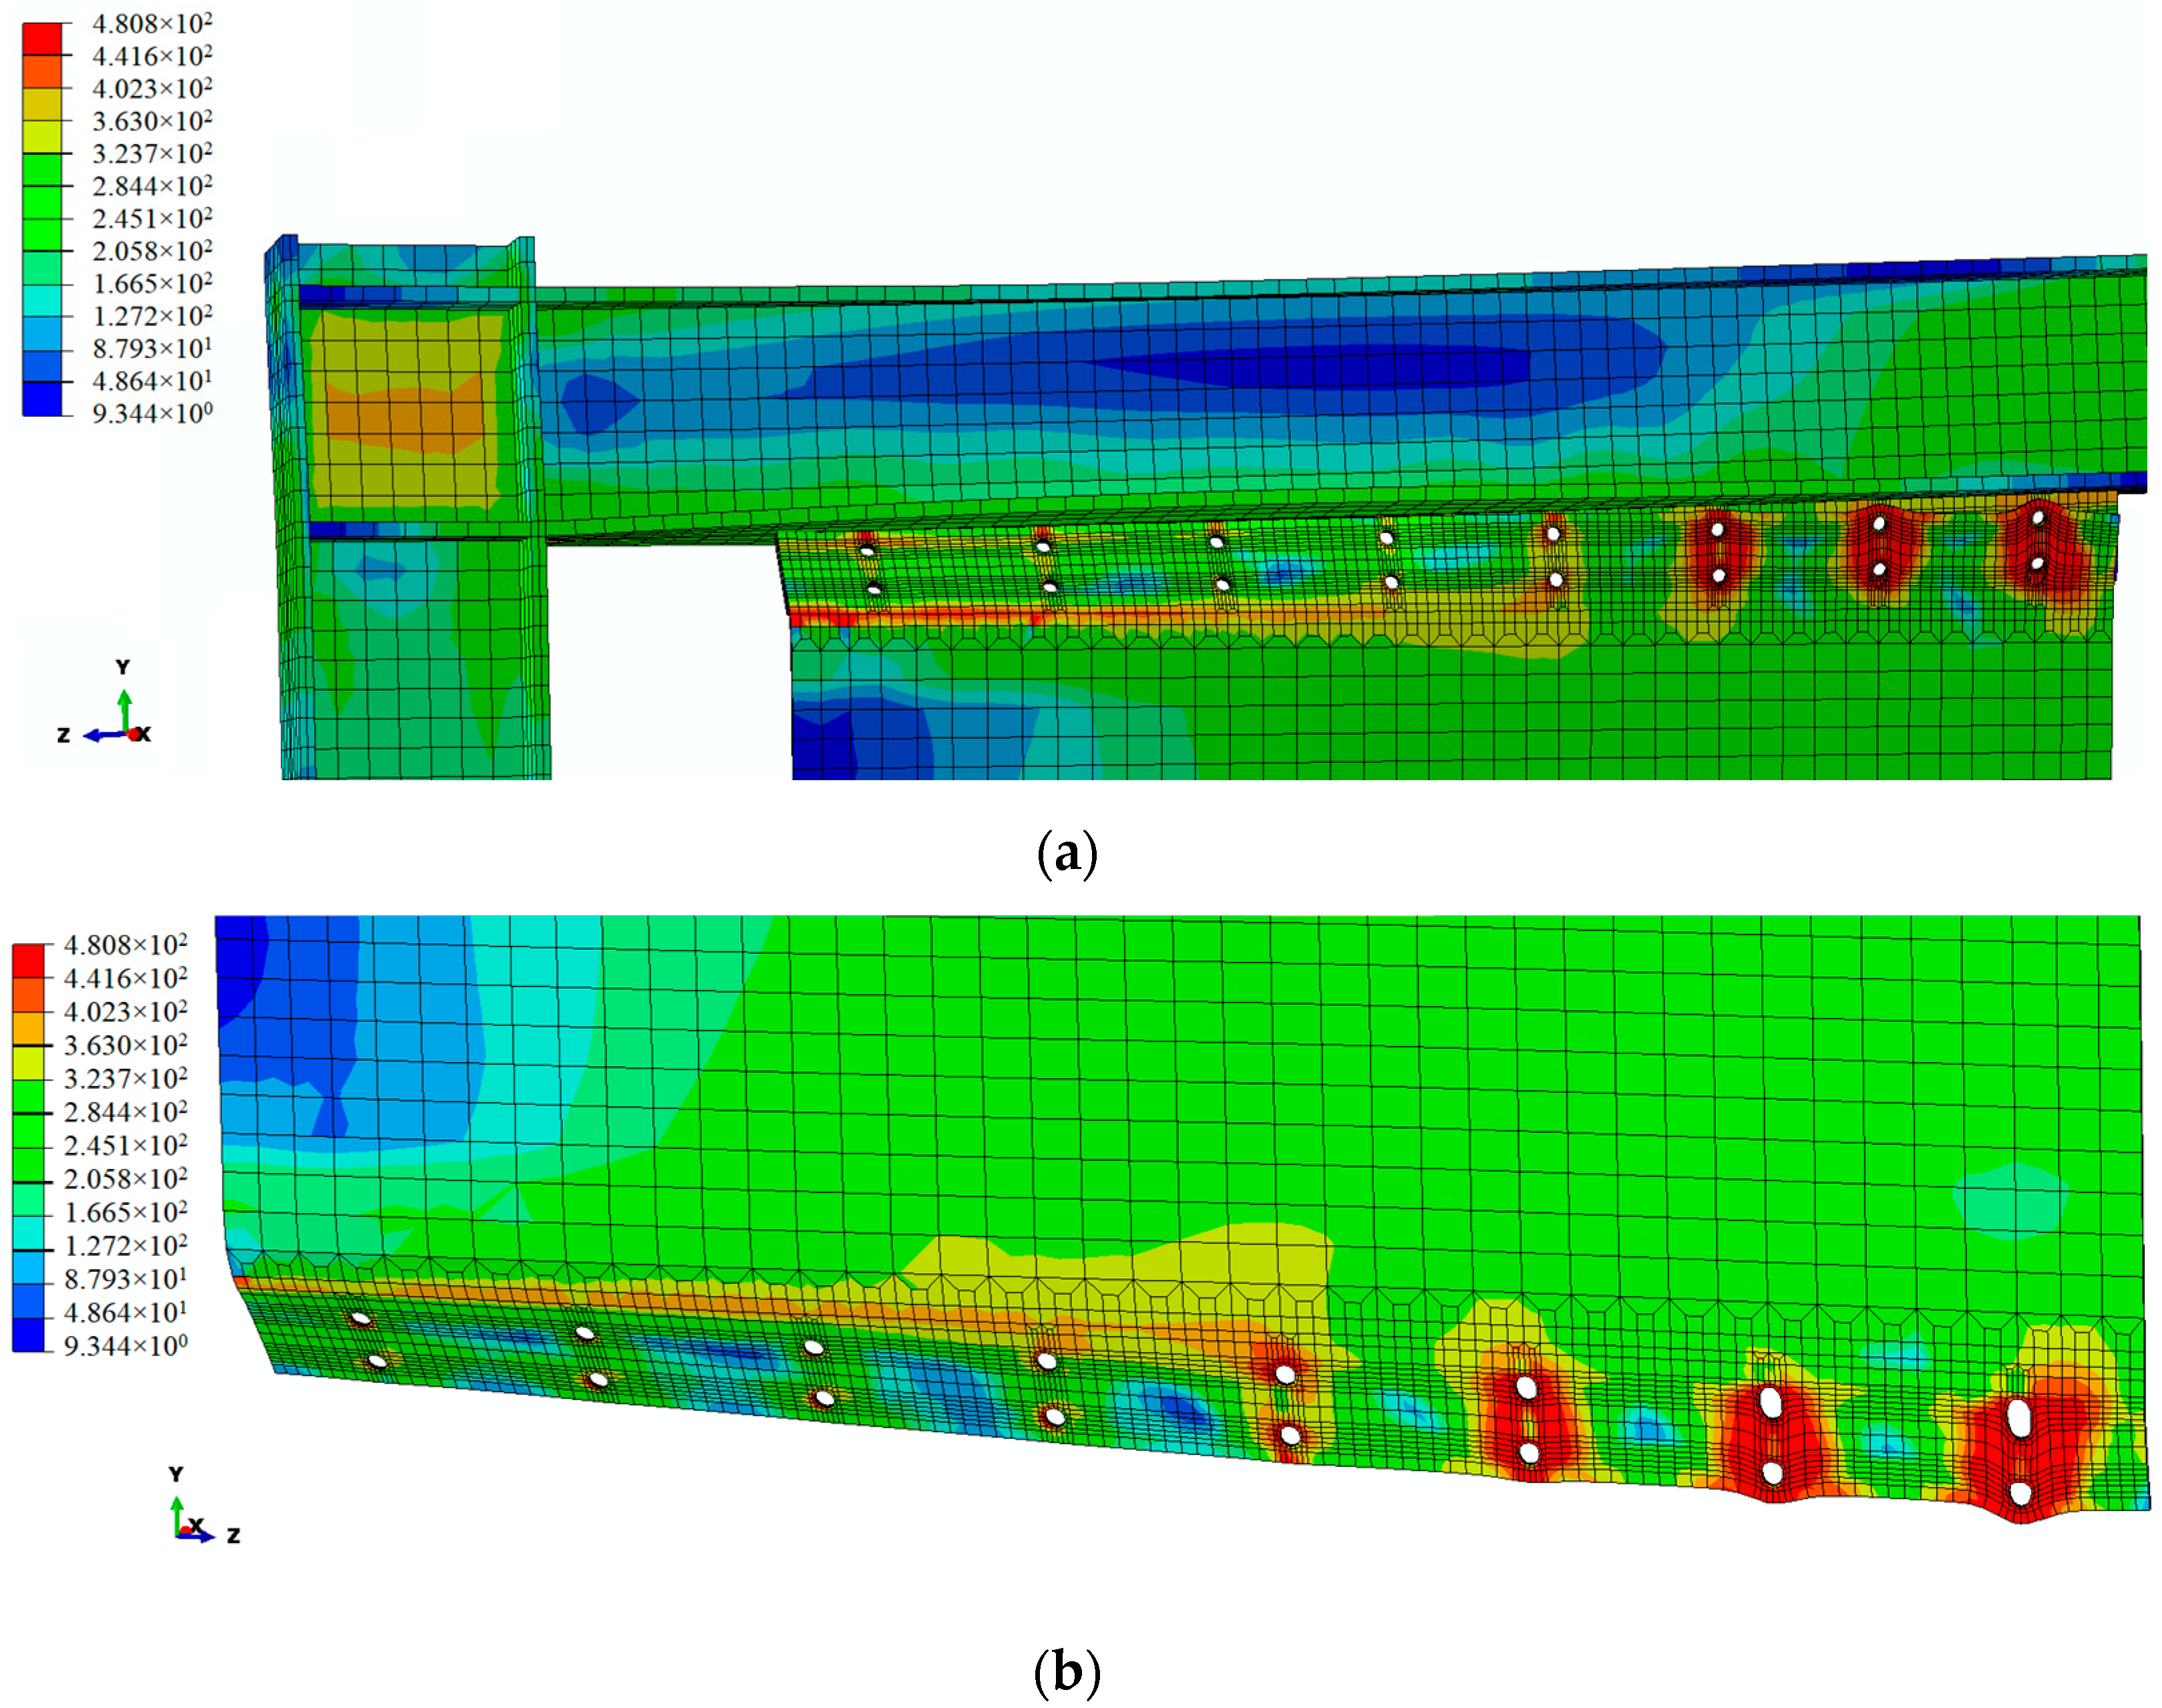
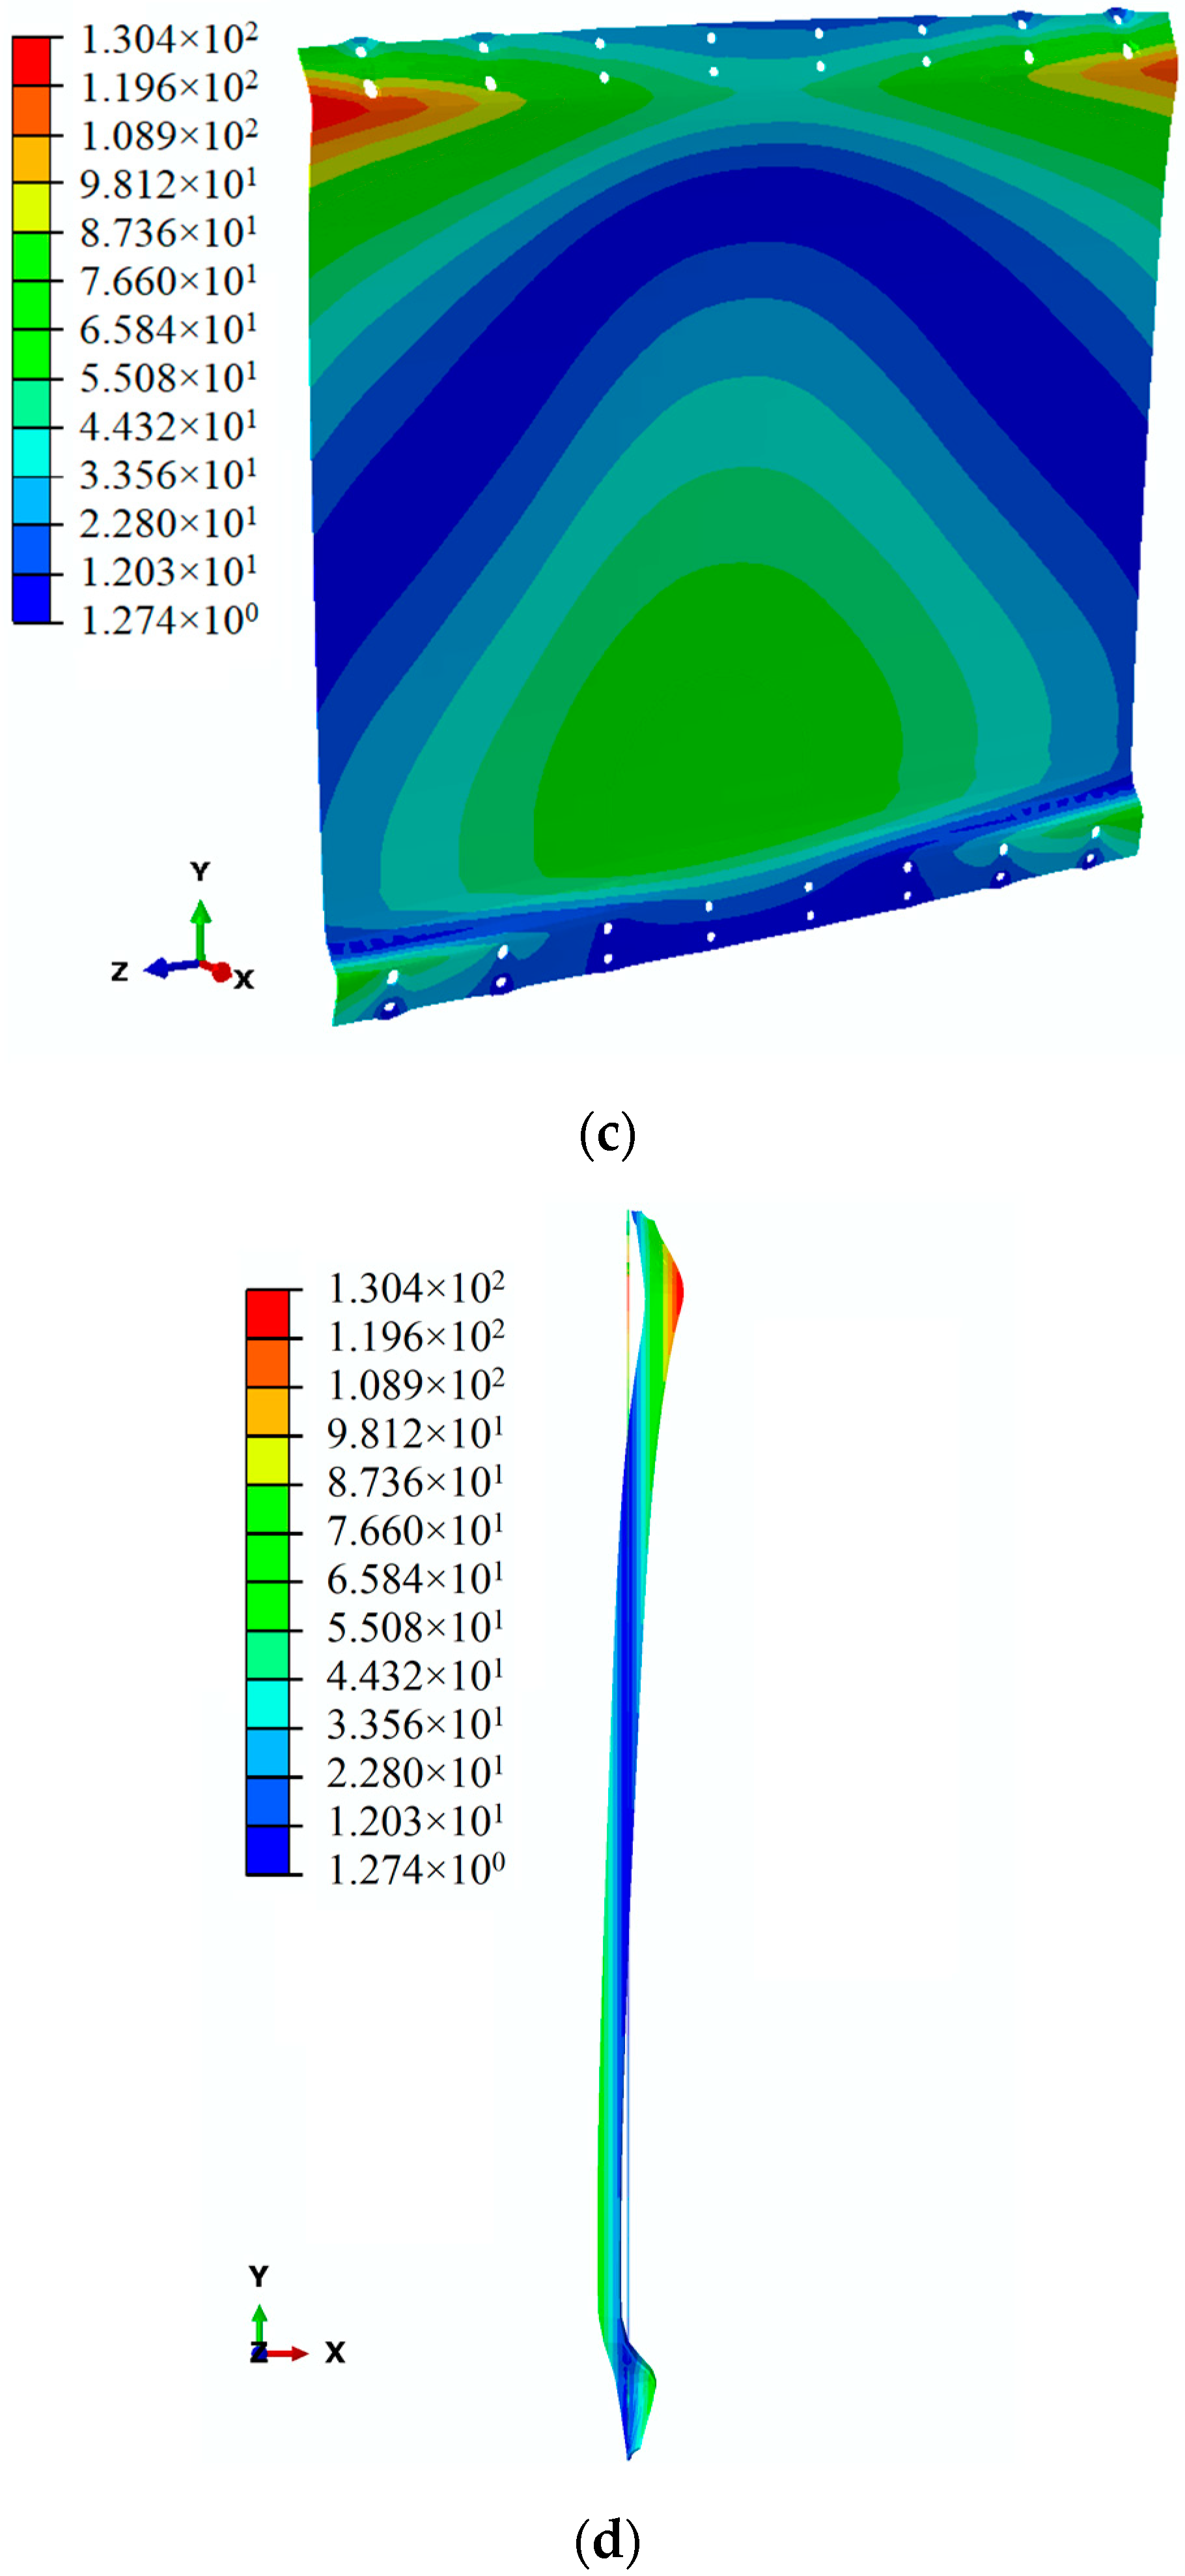
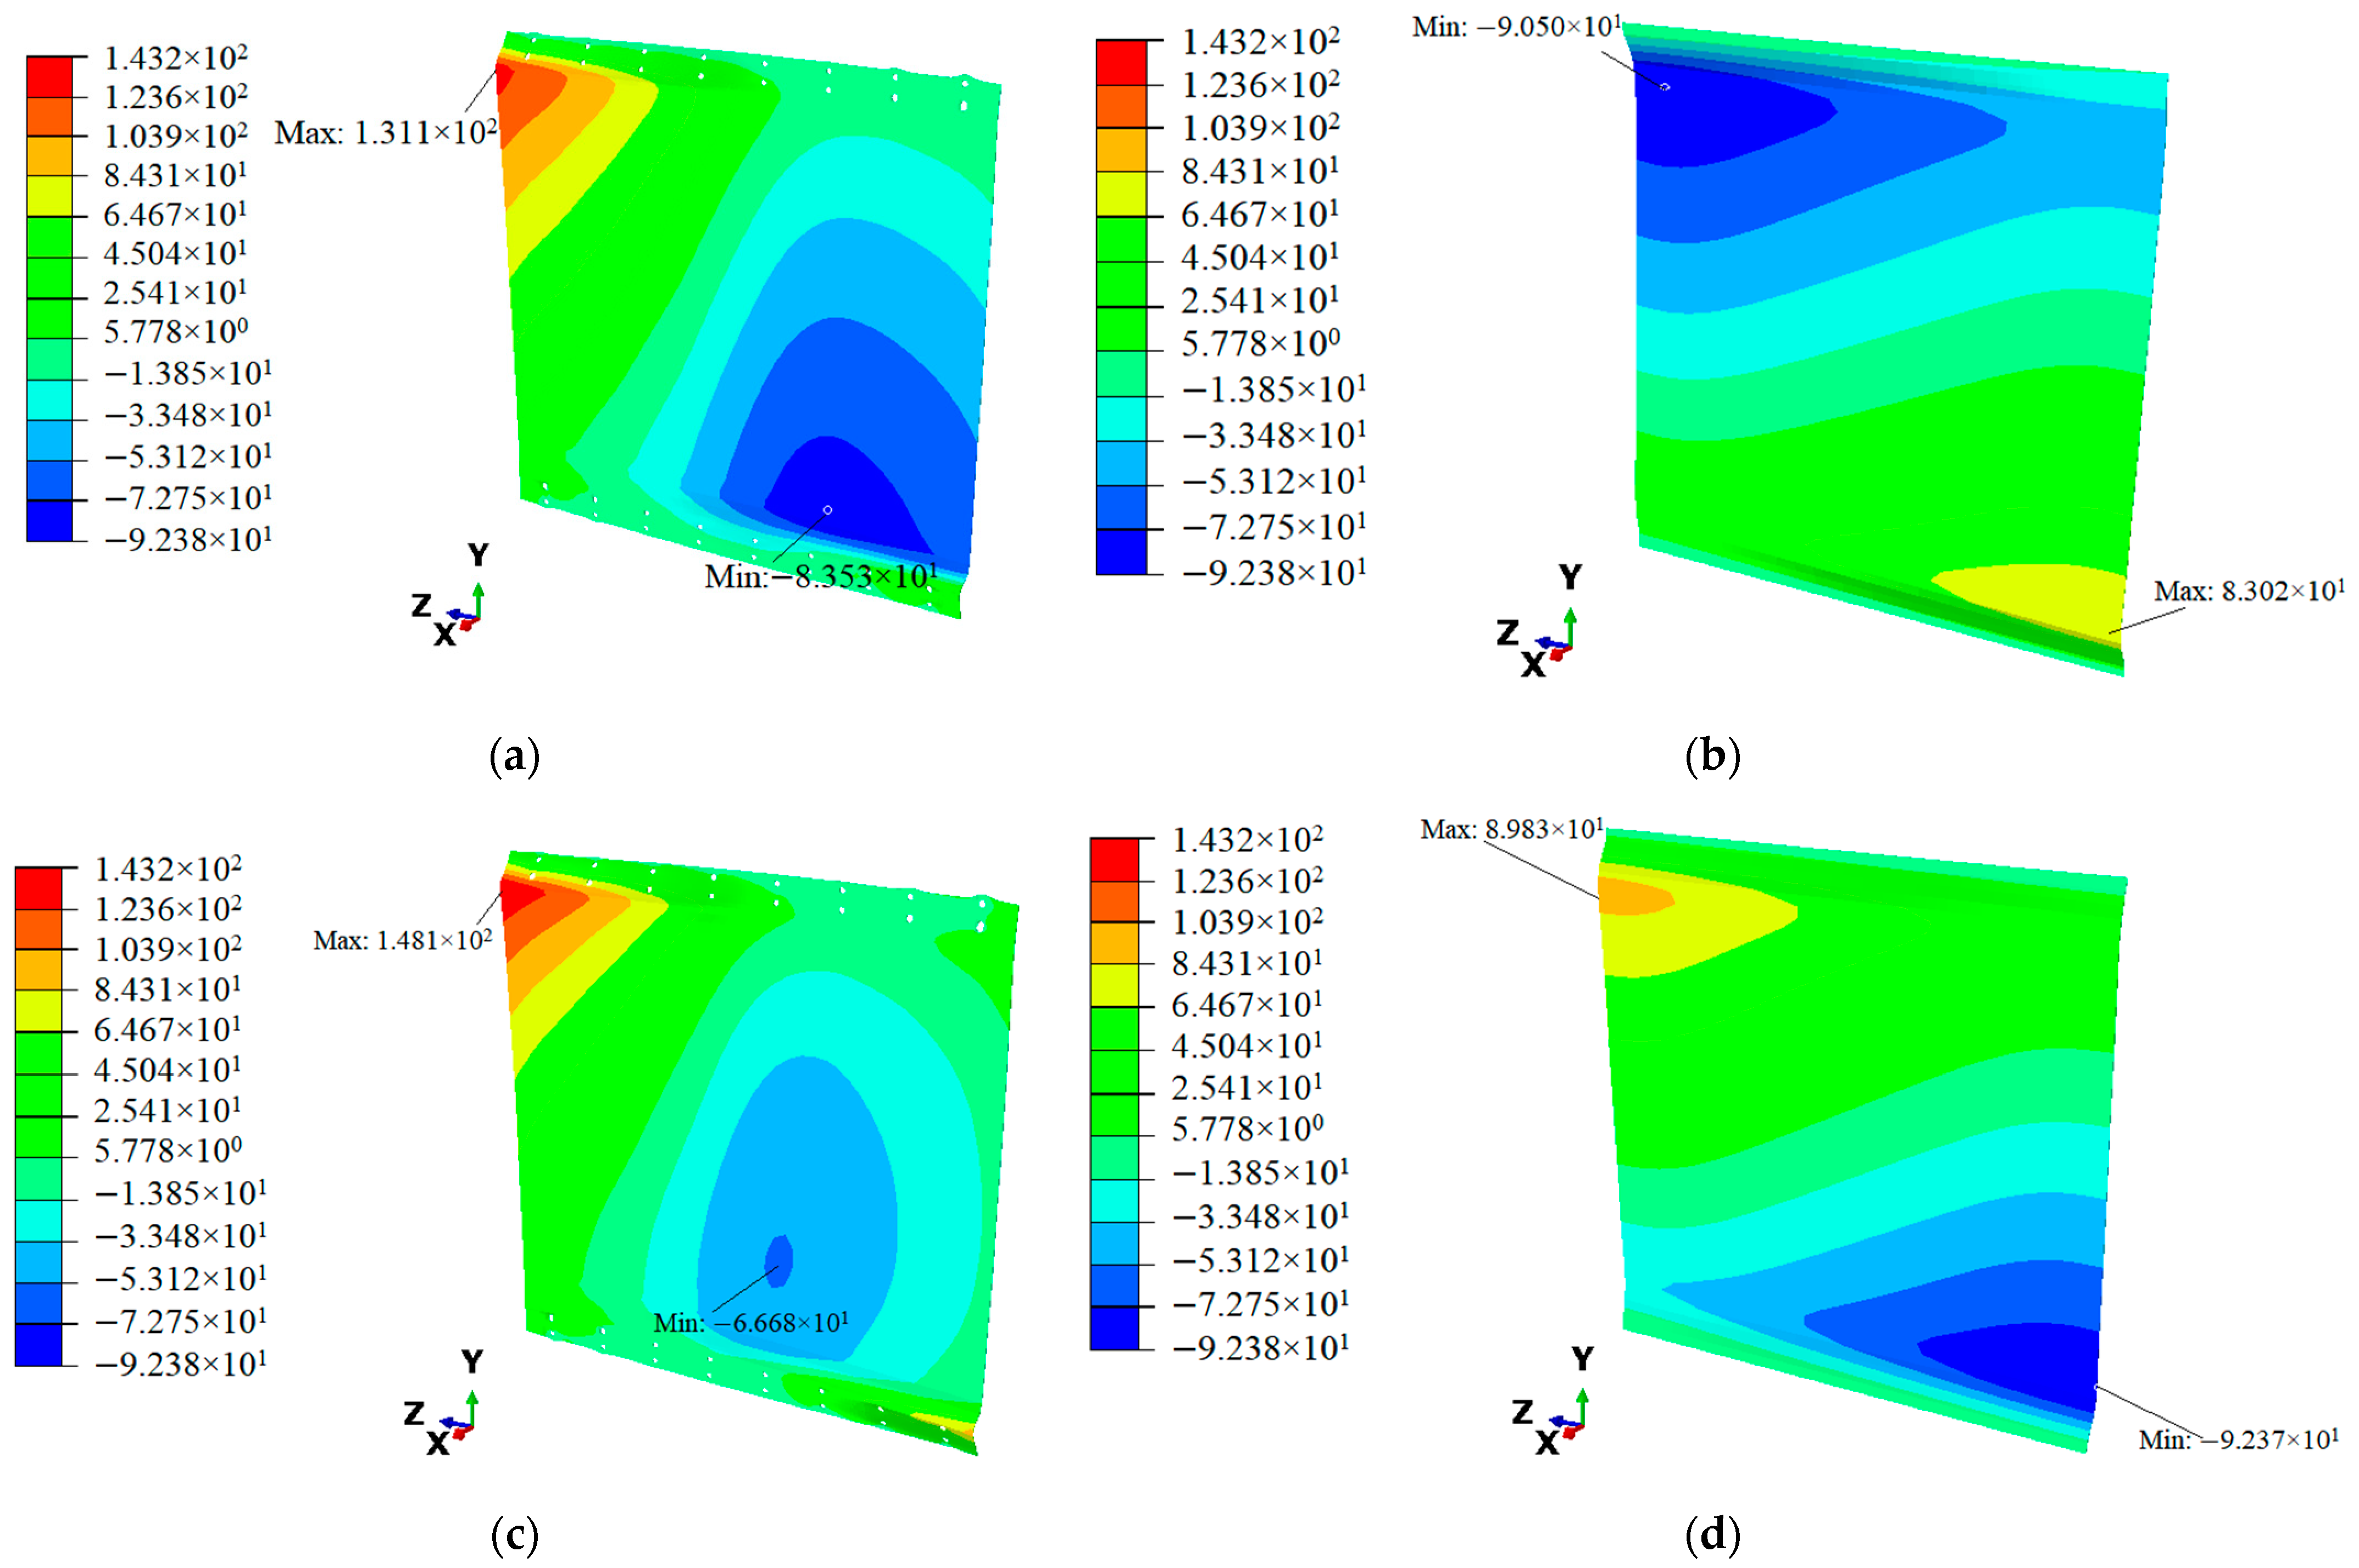
During the process of pull monotonic loading of the bolt-connected SPSWs, out-of-plane bending occurred in two regions: at the corner of the upper end of the steel plate far from the side of the loading end and the side of the upper connector near it (Figure 15a), and at the corner of the lower end of the steel plate near the side of the loading end and the side of the lower connector near it (Figure 15b). However, during the process of push monotonic loading, bending occurred at the other two corners of the steel plate. During the cyclic loading of the bolt-connected SPSWs, the steel plate sagged downward along the lower connectors, and drastic tensile deformation occurred at the bolt holes next to the left and right sides of the steel plate, as shown in Figure 15c,d.
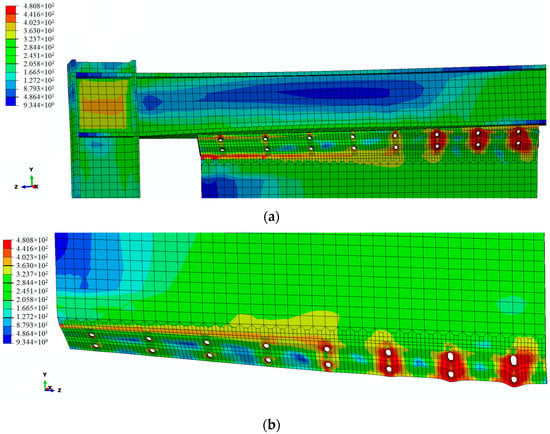
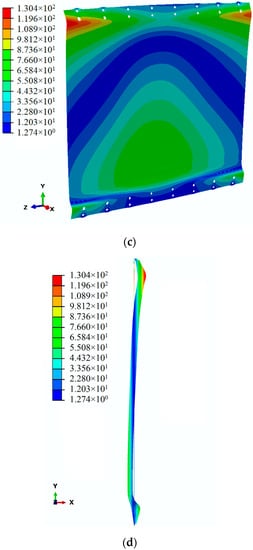
Figure 15.
Stress and deformation cloud diagrams of model SPSW-N8: (a) stress cloud of bolt holes at the upper end of steel plate under pull monotonic loading (unit: MPa); (b) stress cloud of bolt holes at the lower end of steel plate under pull monotonic loading (unit: MPa); (c) deformation cloud of steel plate at the end of cyclic loading (unit: mm); (d) left-view cloud of deformed and undeformed steel plate at the end of cyclic loading (unit: mm).
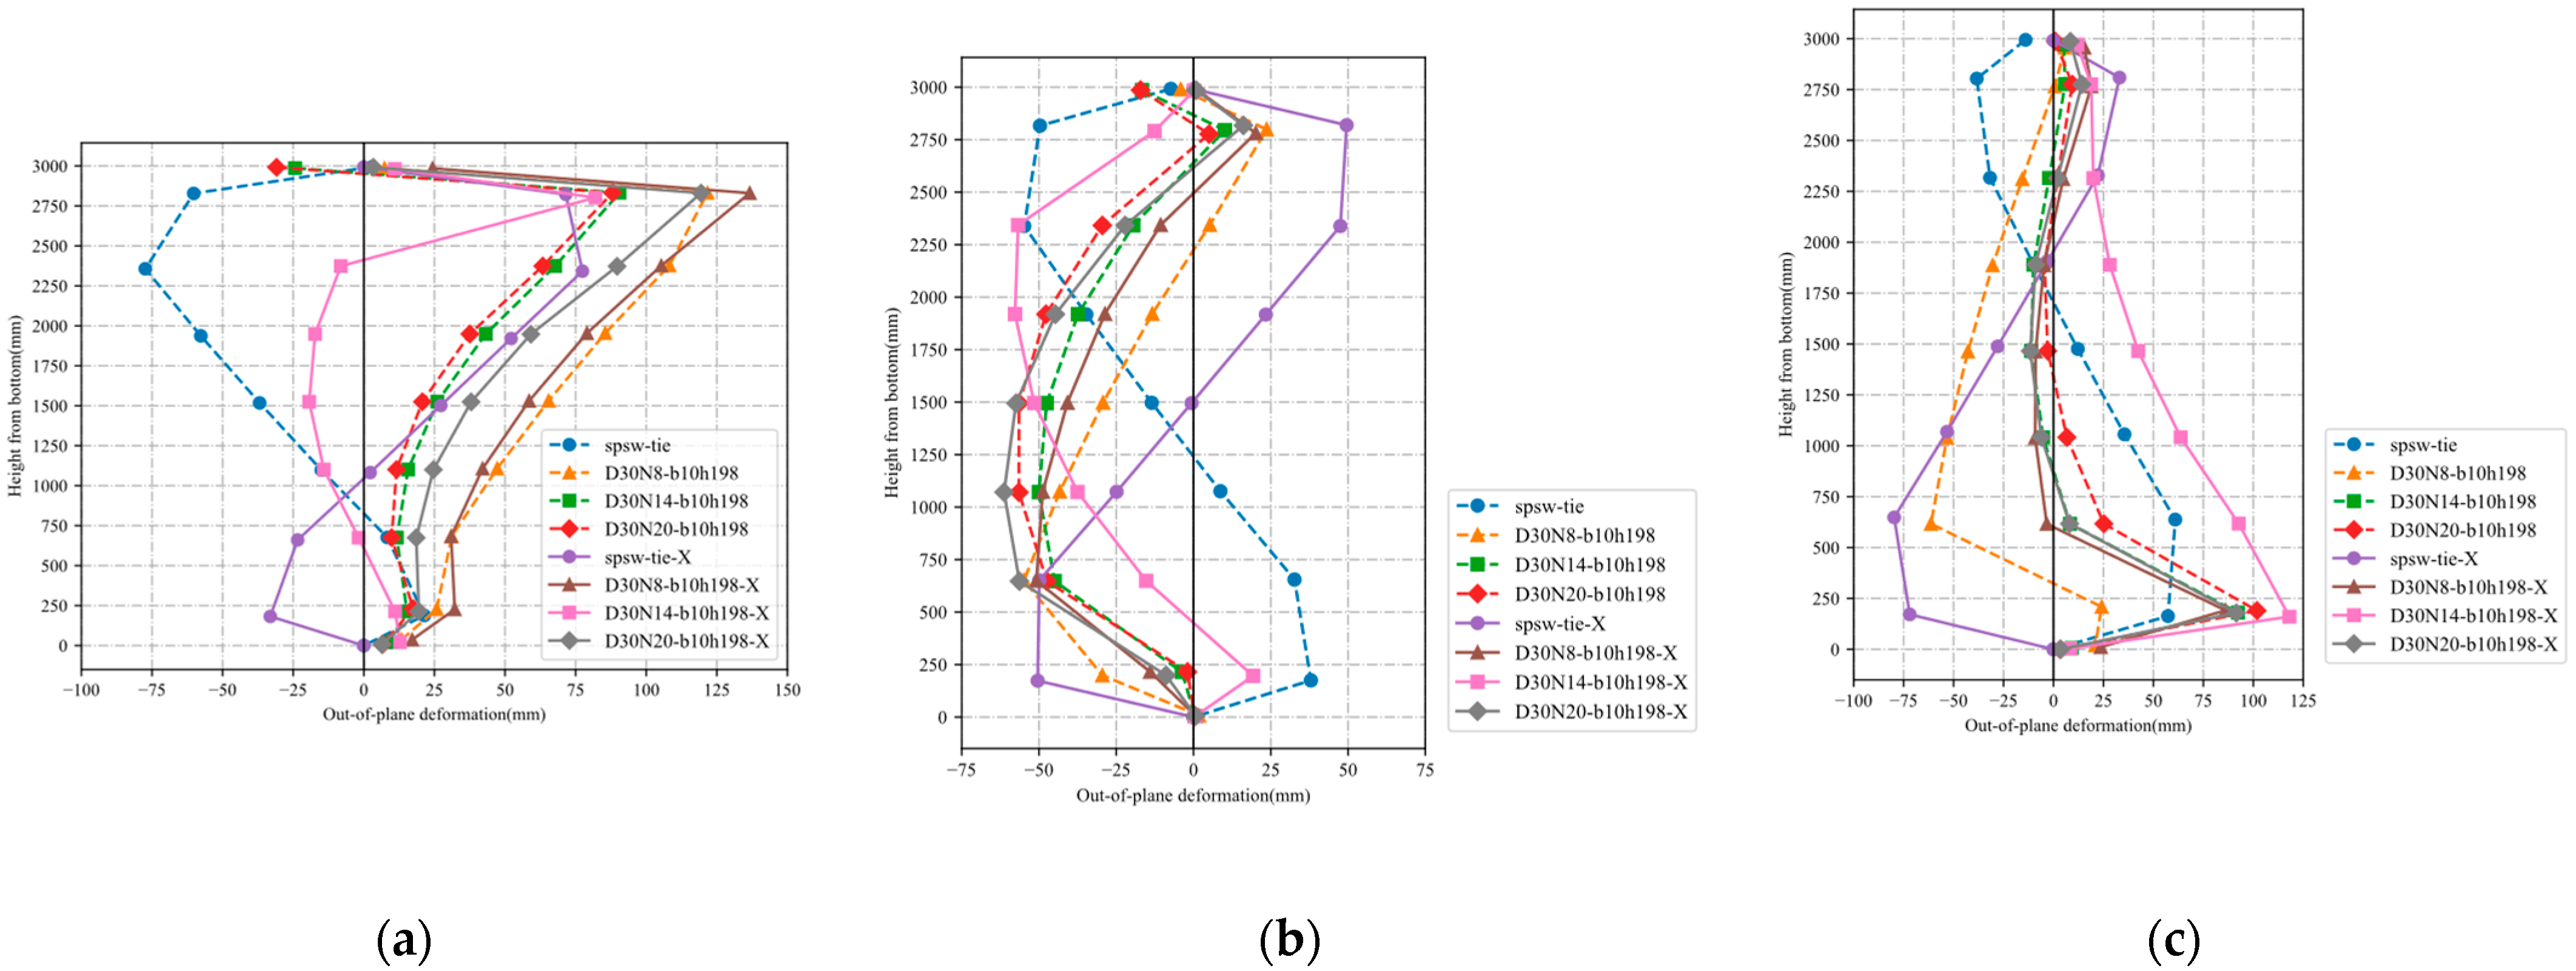
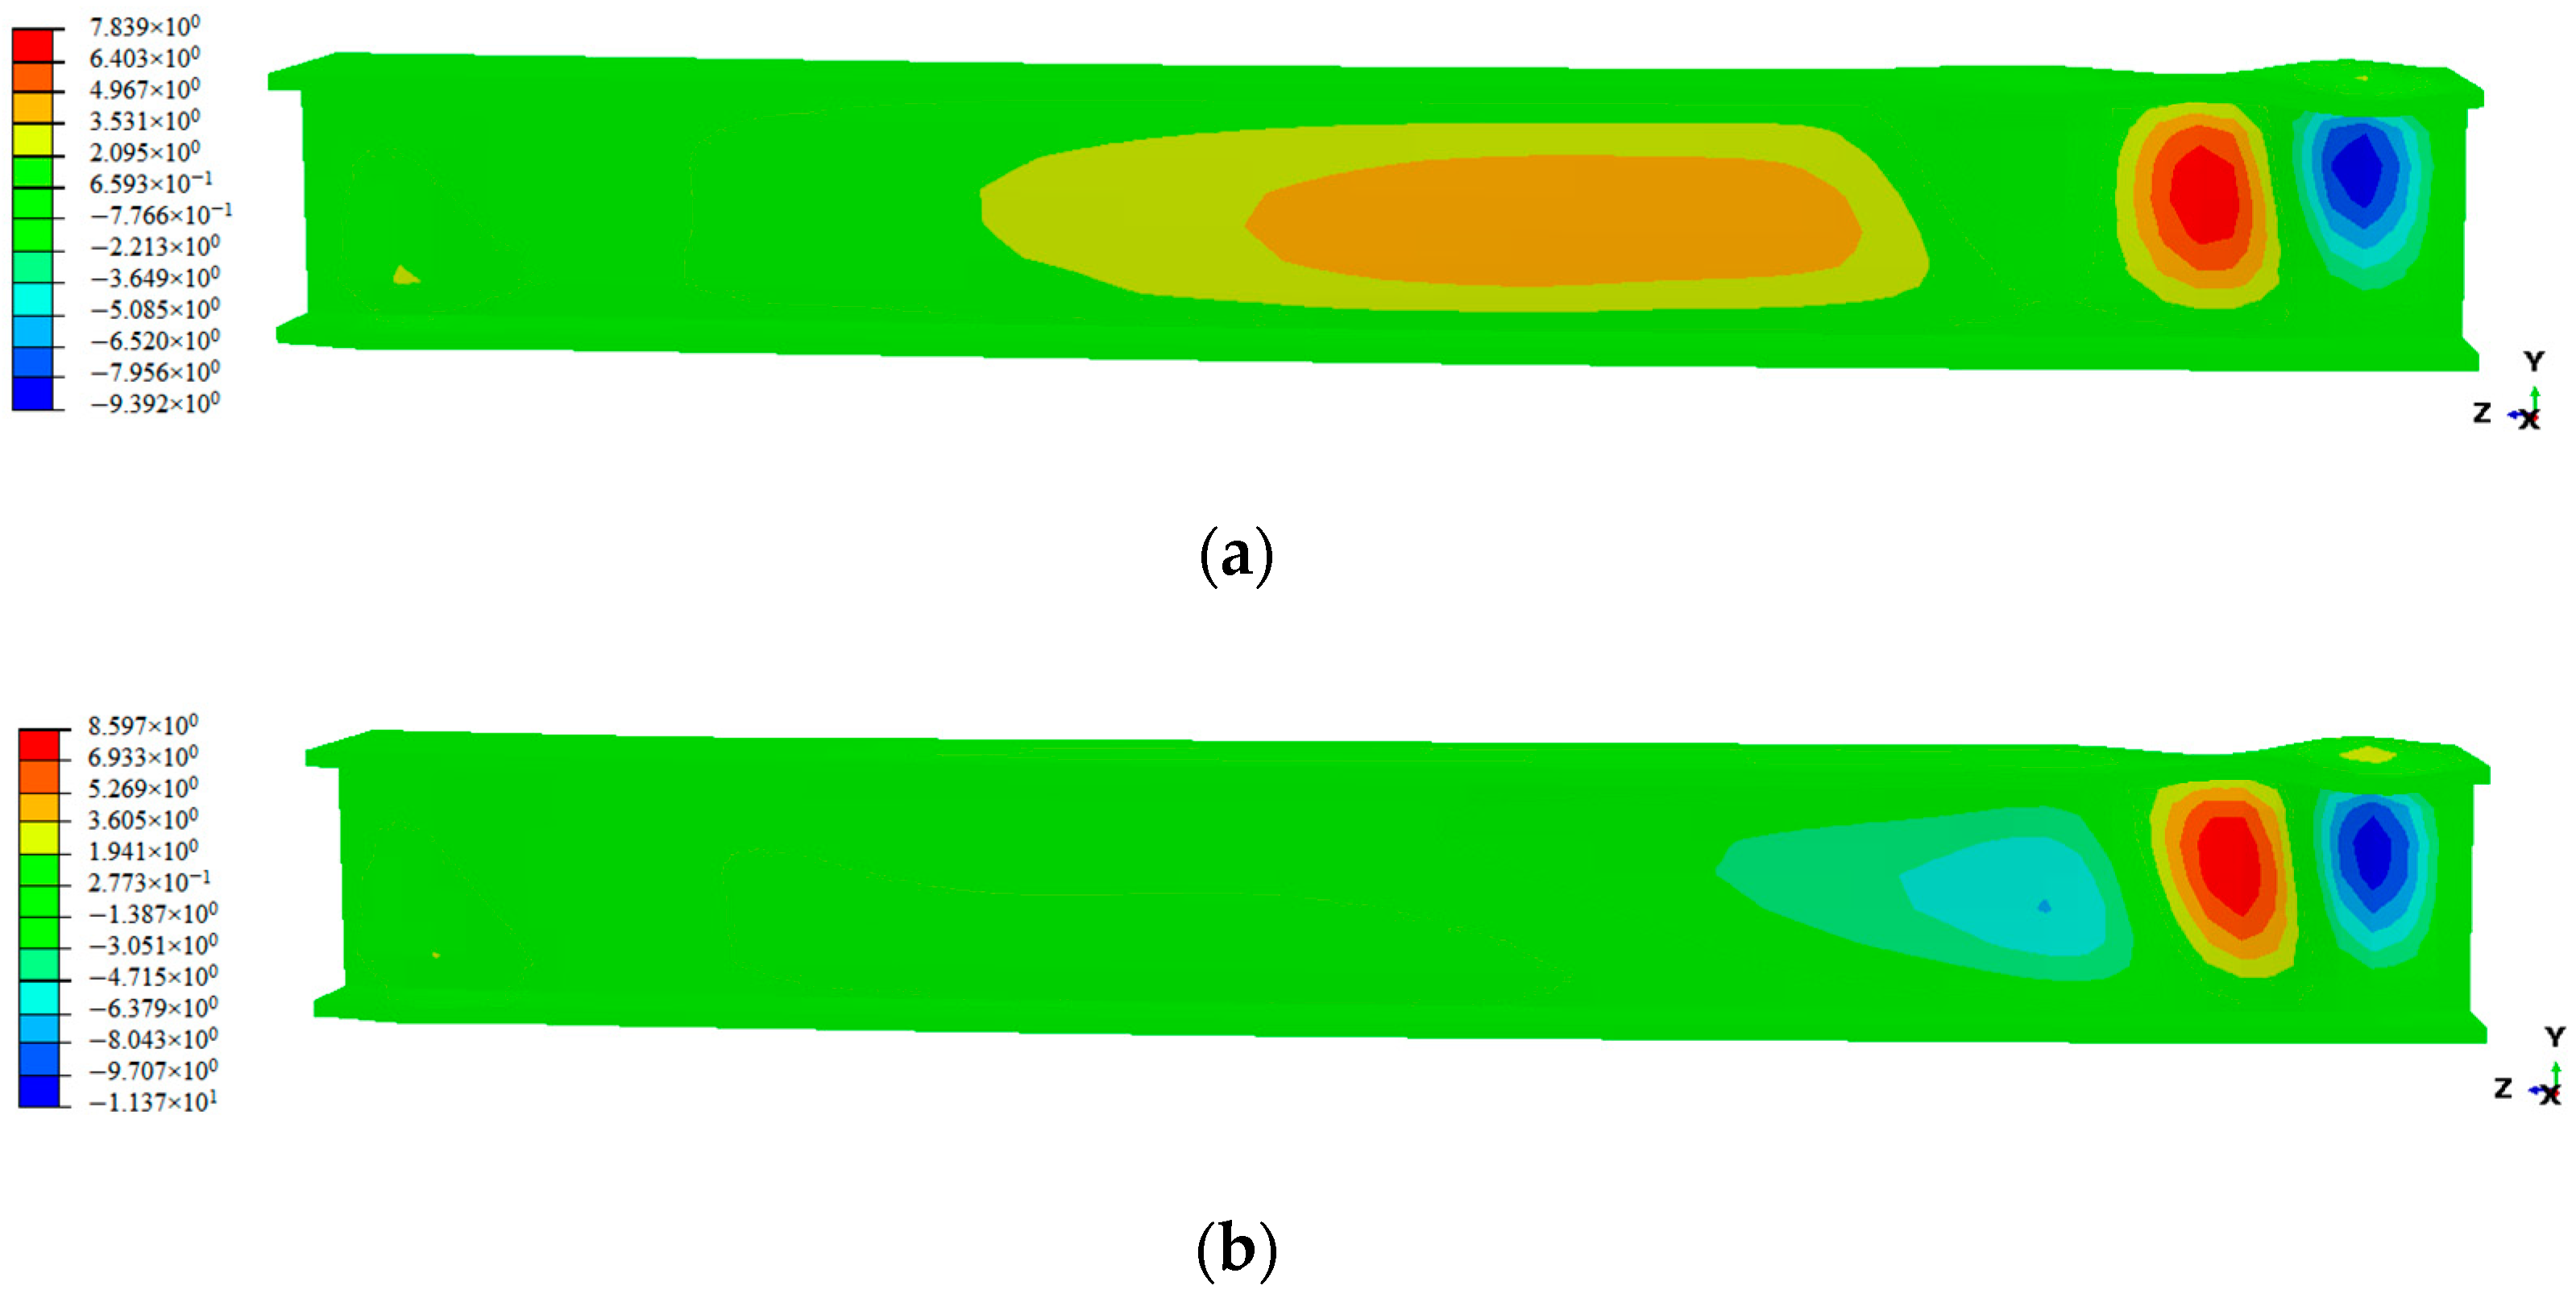
The out-of-plane deformation cloud diagrams of the two bolt-connected SPSW models (SPSW-N8 and SPSW-N8-X), SPSW-T and SPSW-T-X at a drift ratio of 0.02 under cyclic loading are displayed in Figure 16. The out-of-plane deformations of the left edge, right edge and middle region of the steel plate of each SPSW model at a drift ratio of 0.02 under cyclic loading were determined and are displayed in Figure 17. As can be observed, for the bolt-connected SPSW models, the largest out-of-plane deformation easily appeared at the region of the steel plate aligned with the length edge of the connectors under cyclic loading.
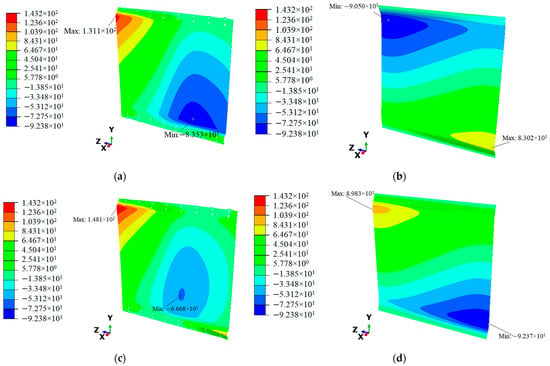
Figure 16.
Out-of-plane deformation cloud of partial models at the drift ratio of 0.02 under cyclic loading (unit: mm): (a) SPSW-N8; (b) SPSW-T; (c) SPSW-N8-X; (d) SPSW-T-X.
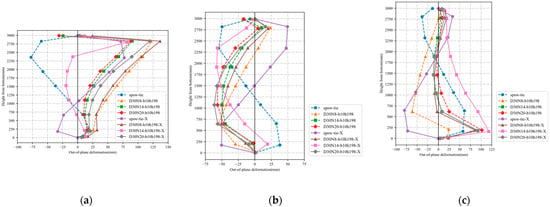
Figure 17.
Out-of-plane deformation of steel plate of each model at the drift ratio of 0.02 under cyclic loading (in the tension direction of loading ends): (a) edge far from the loading end of steel plate; (b) center along the height direction of steel plate; (c) edge near the loading end of steel plate.
In other words, measures must be taken for SPSWs with two-sided connections with bolts and flat steels (such as adding stiffening ribs, adding connectors, increasing bolt distribution density, etc.) to strengthen the corners of the steel plate to prevent excessive deformation of the steel plate.
3.3. Out-of-Plane Deformation of Frame
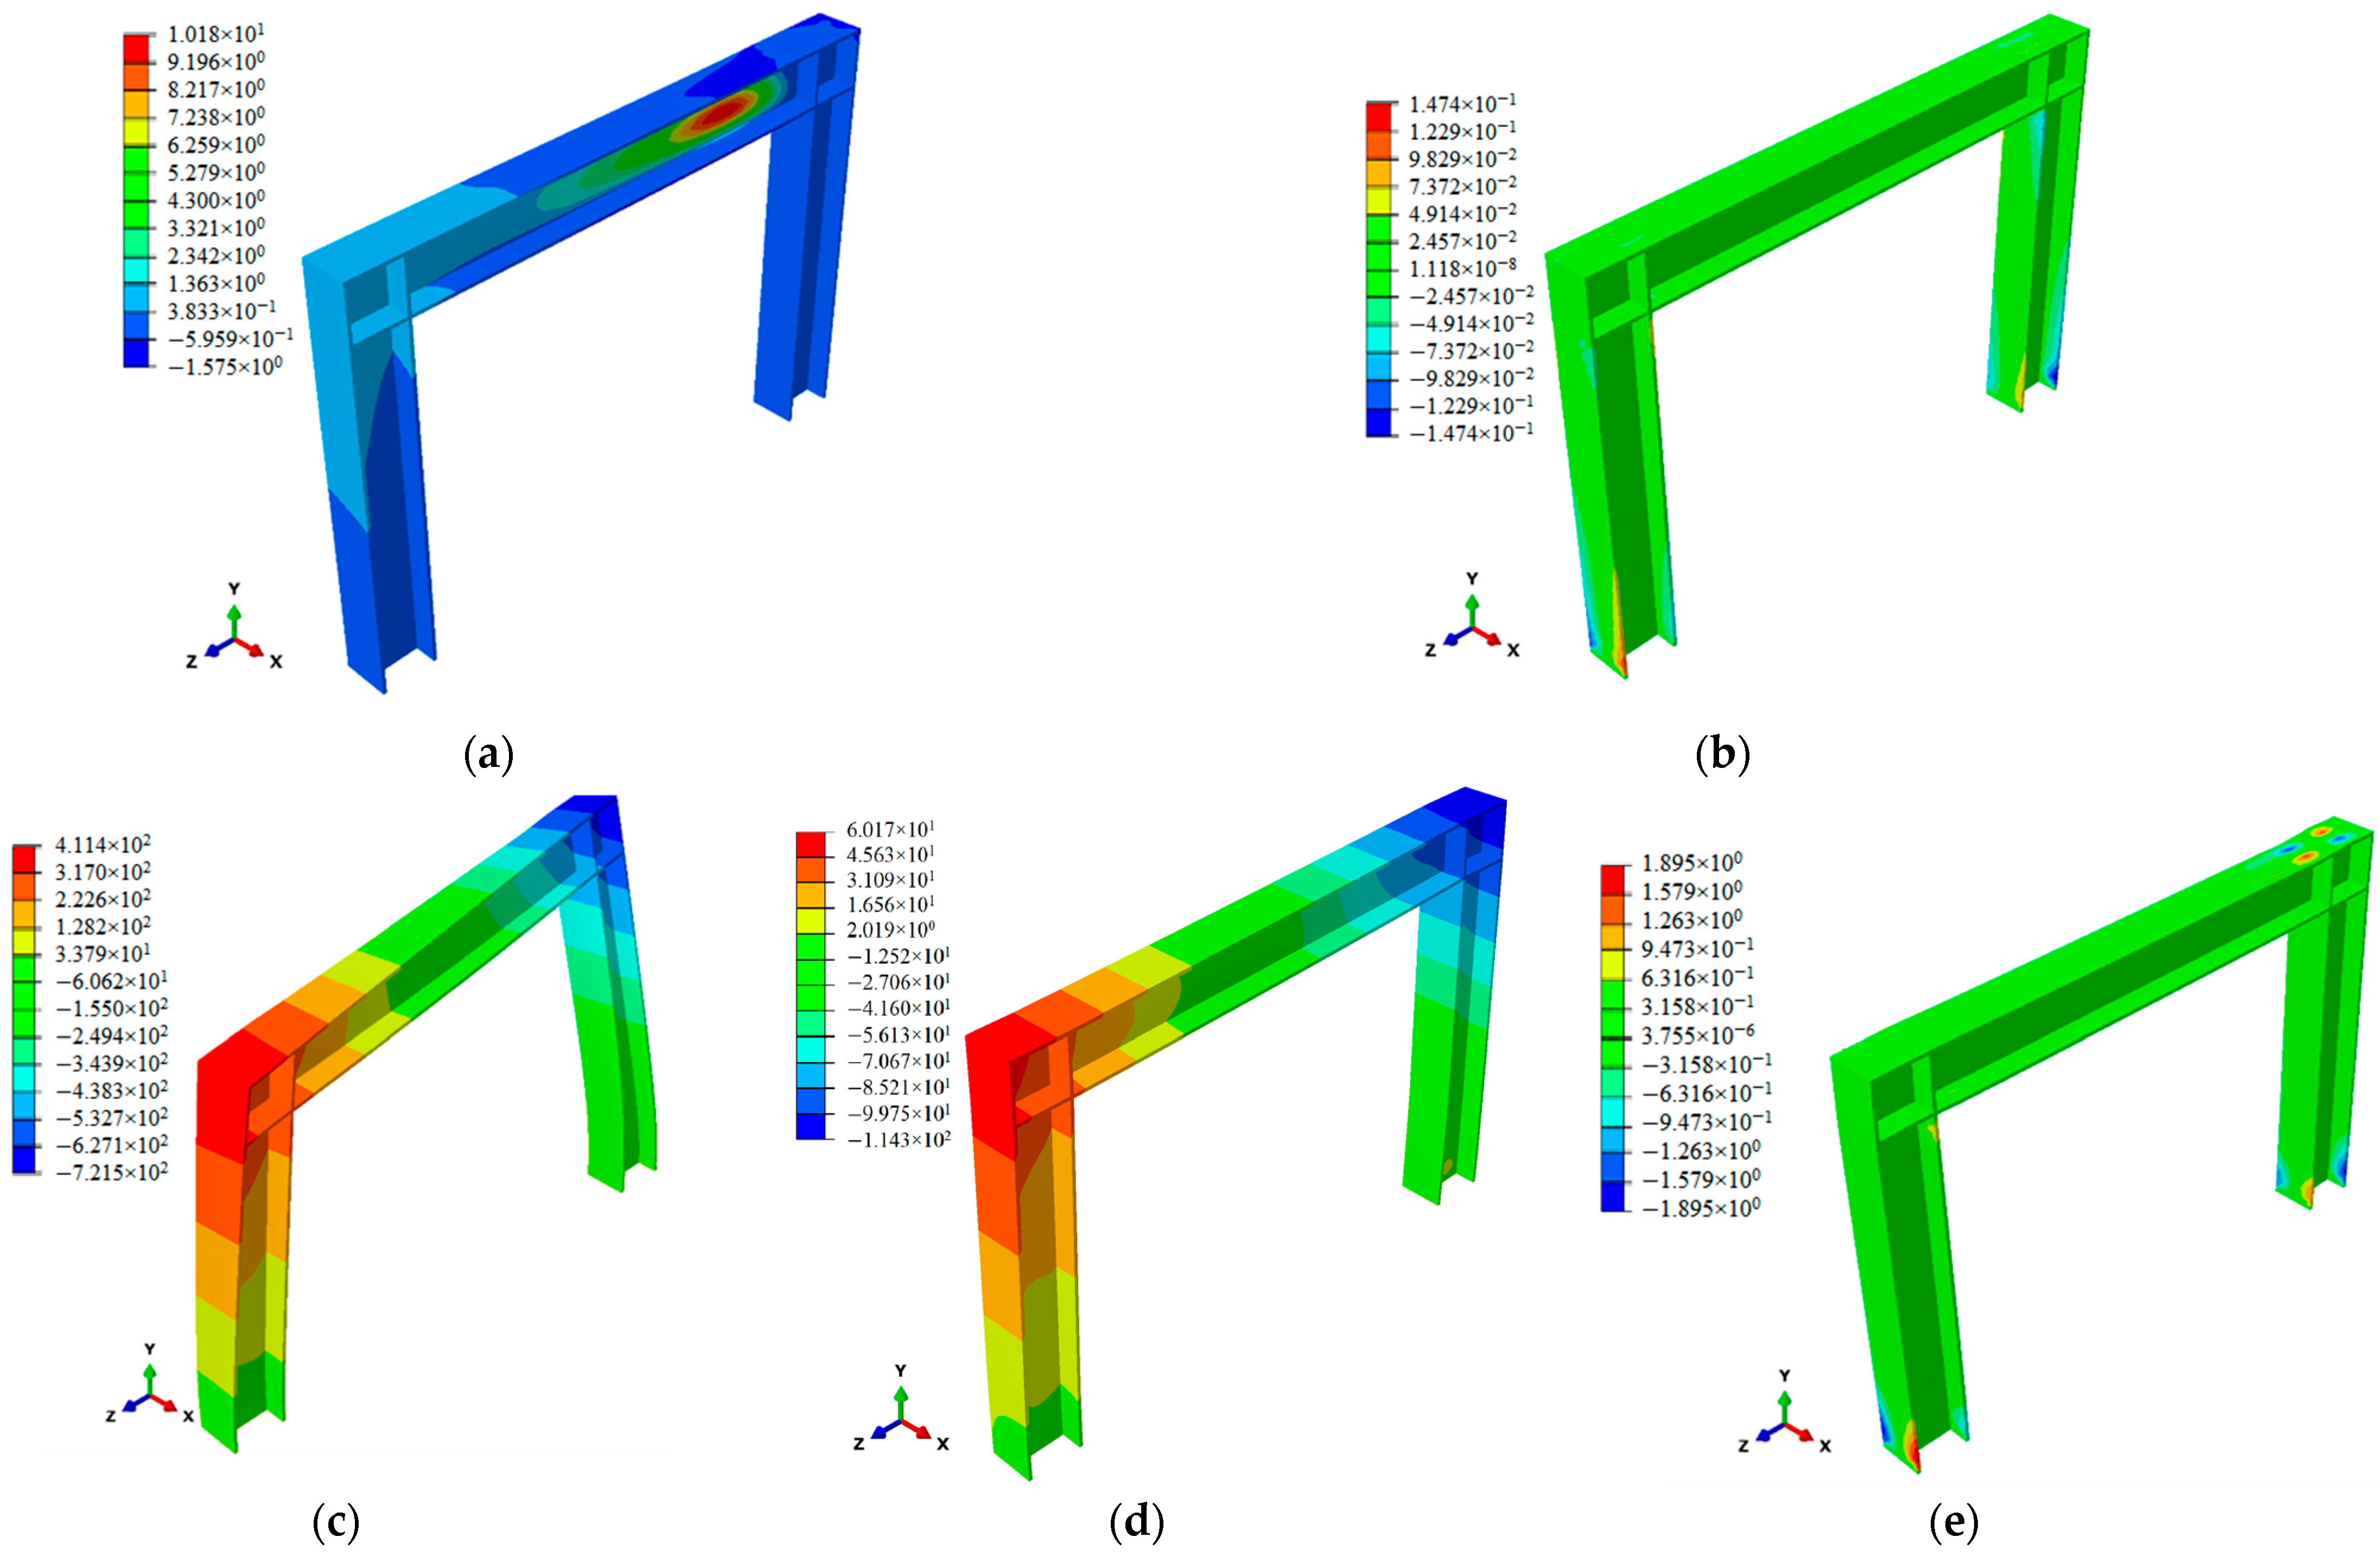
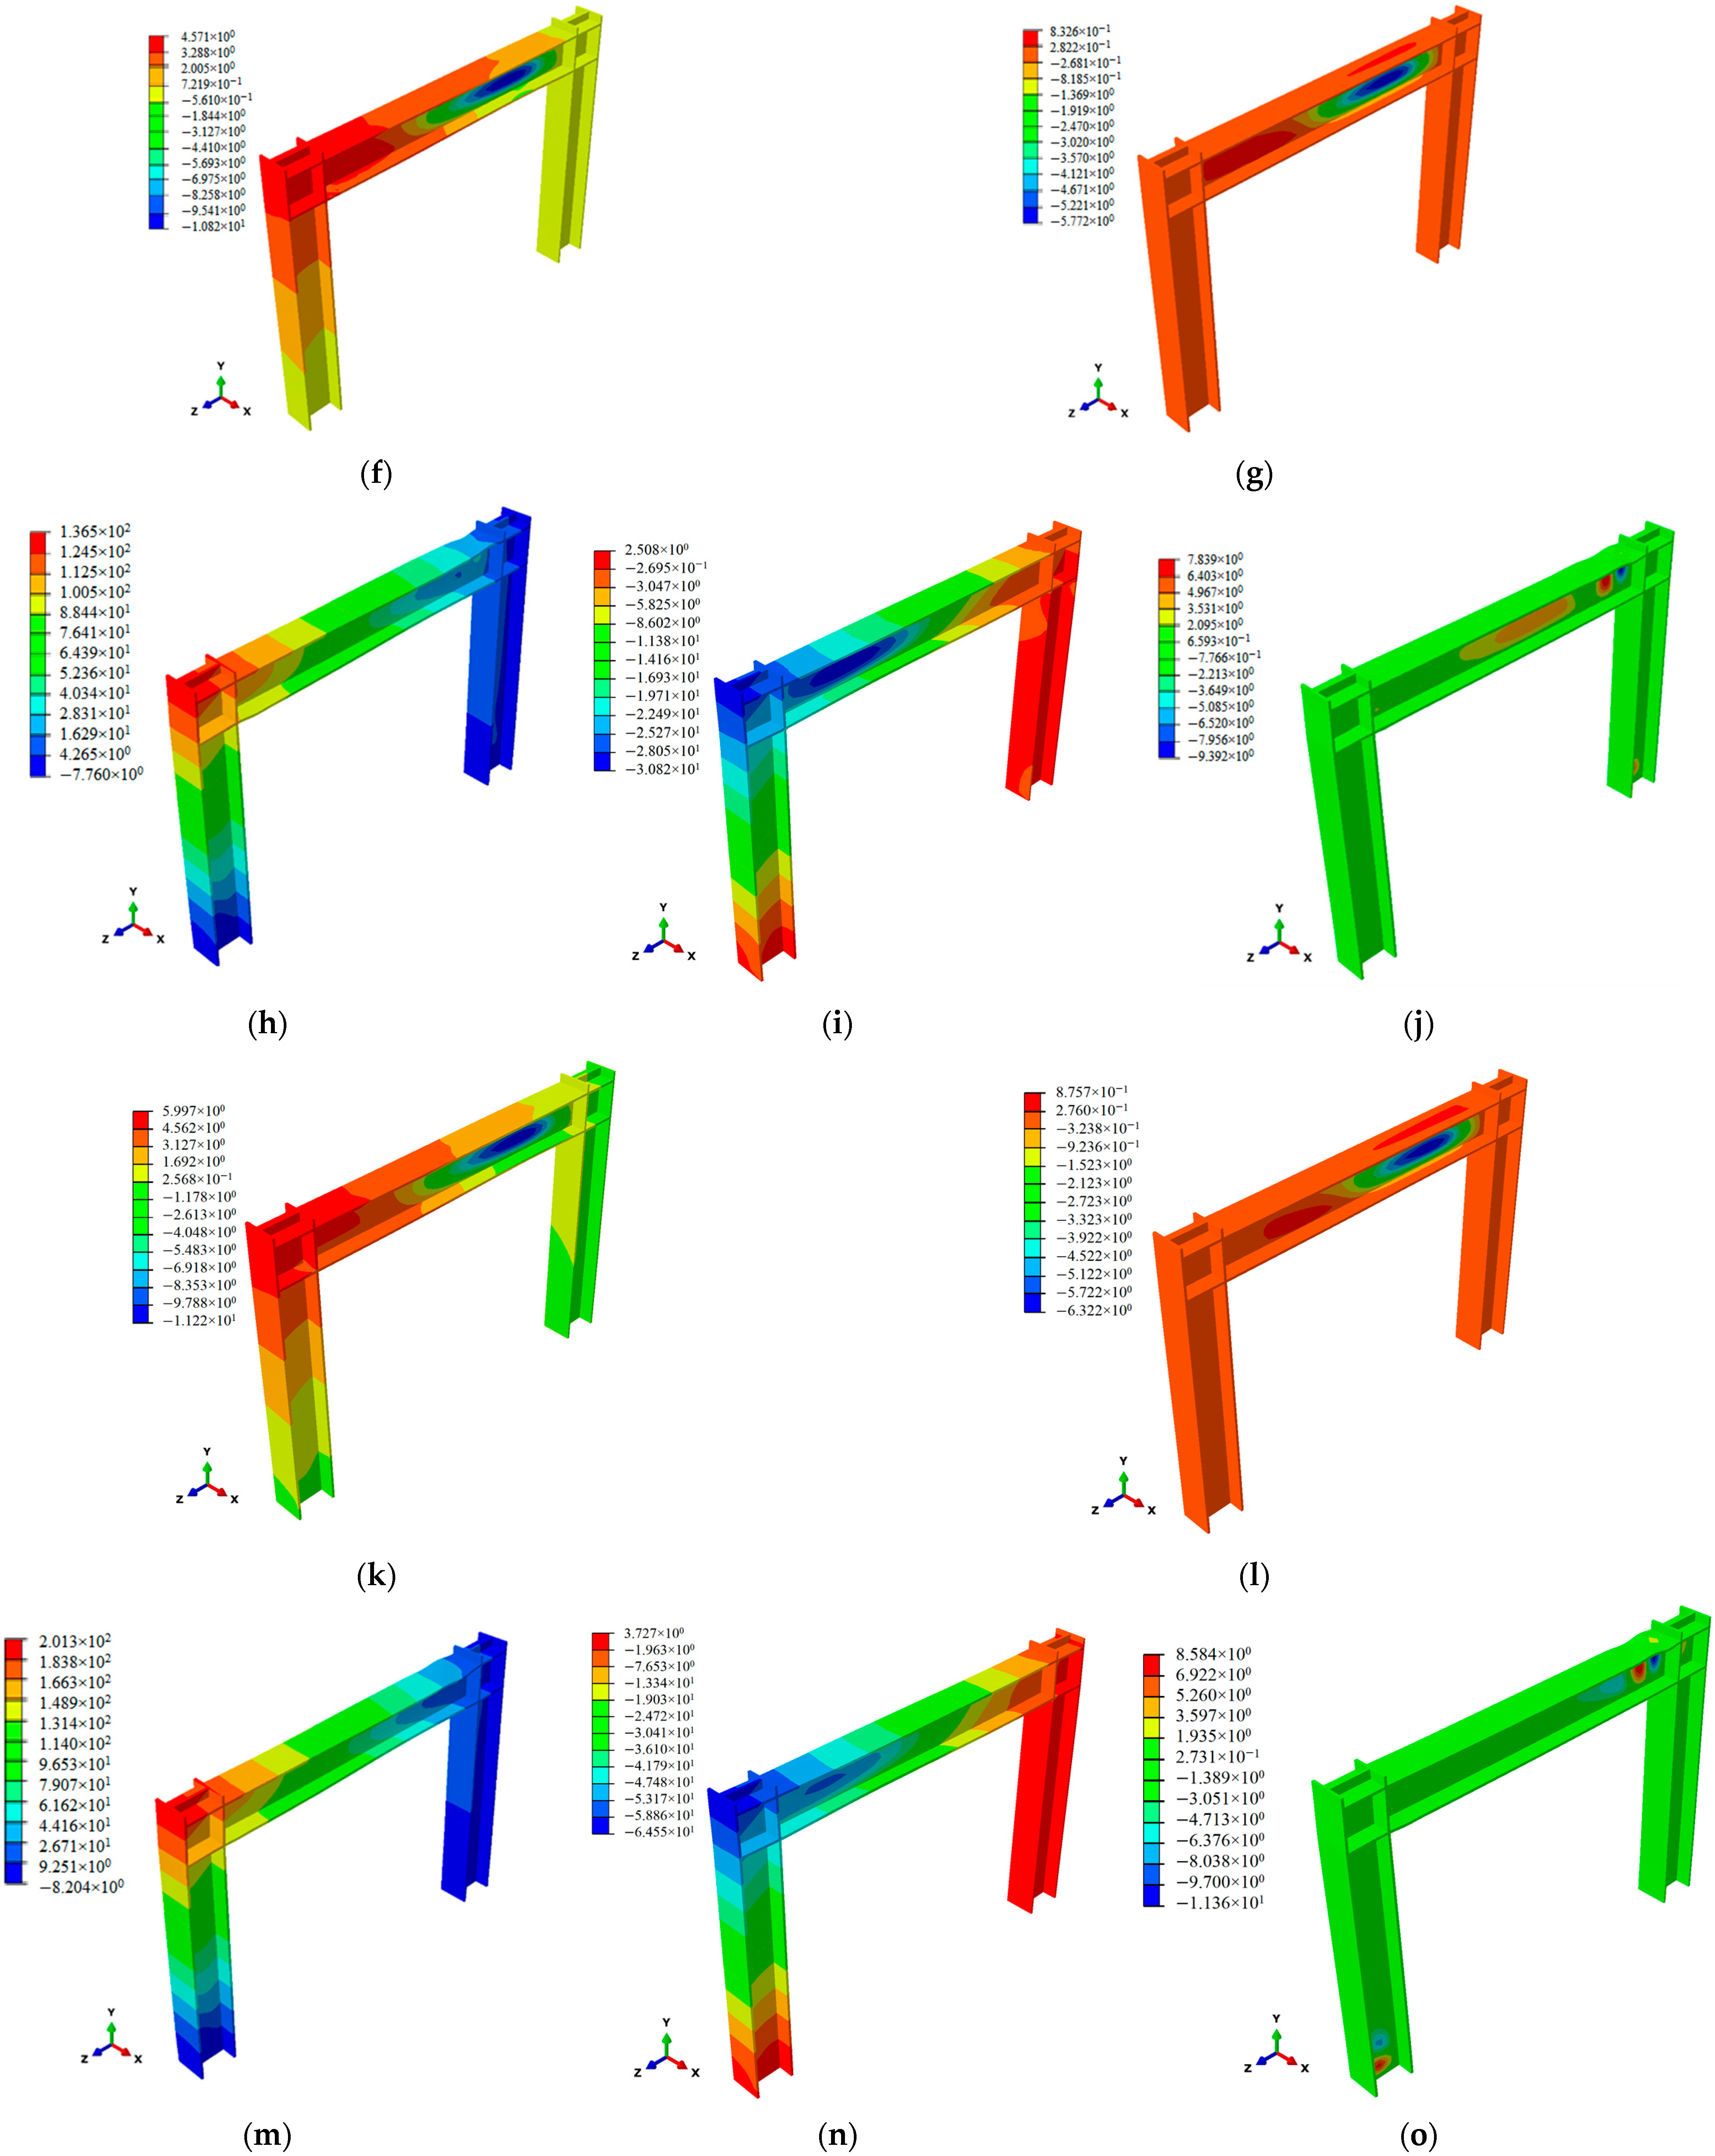
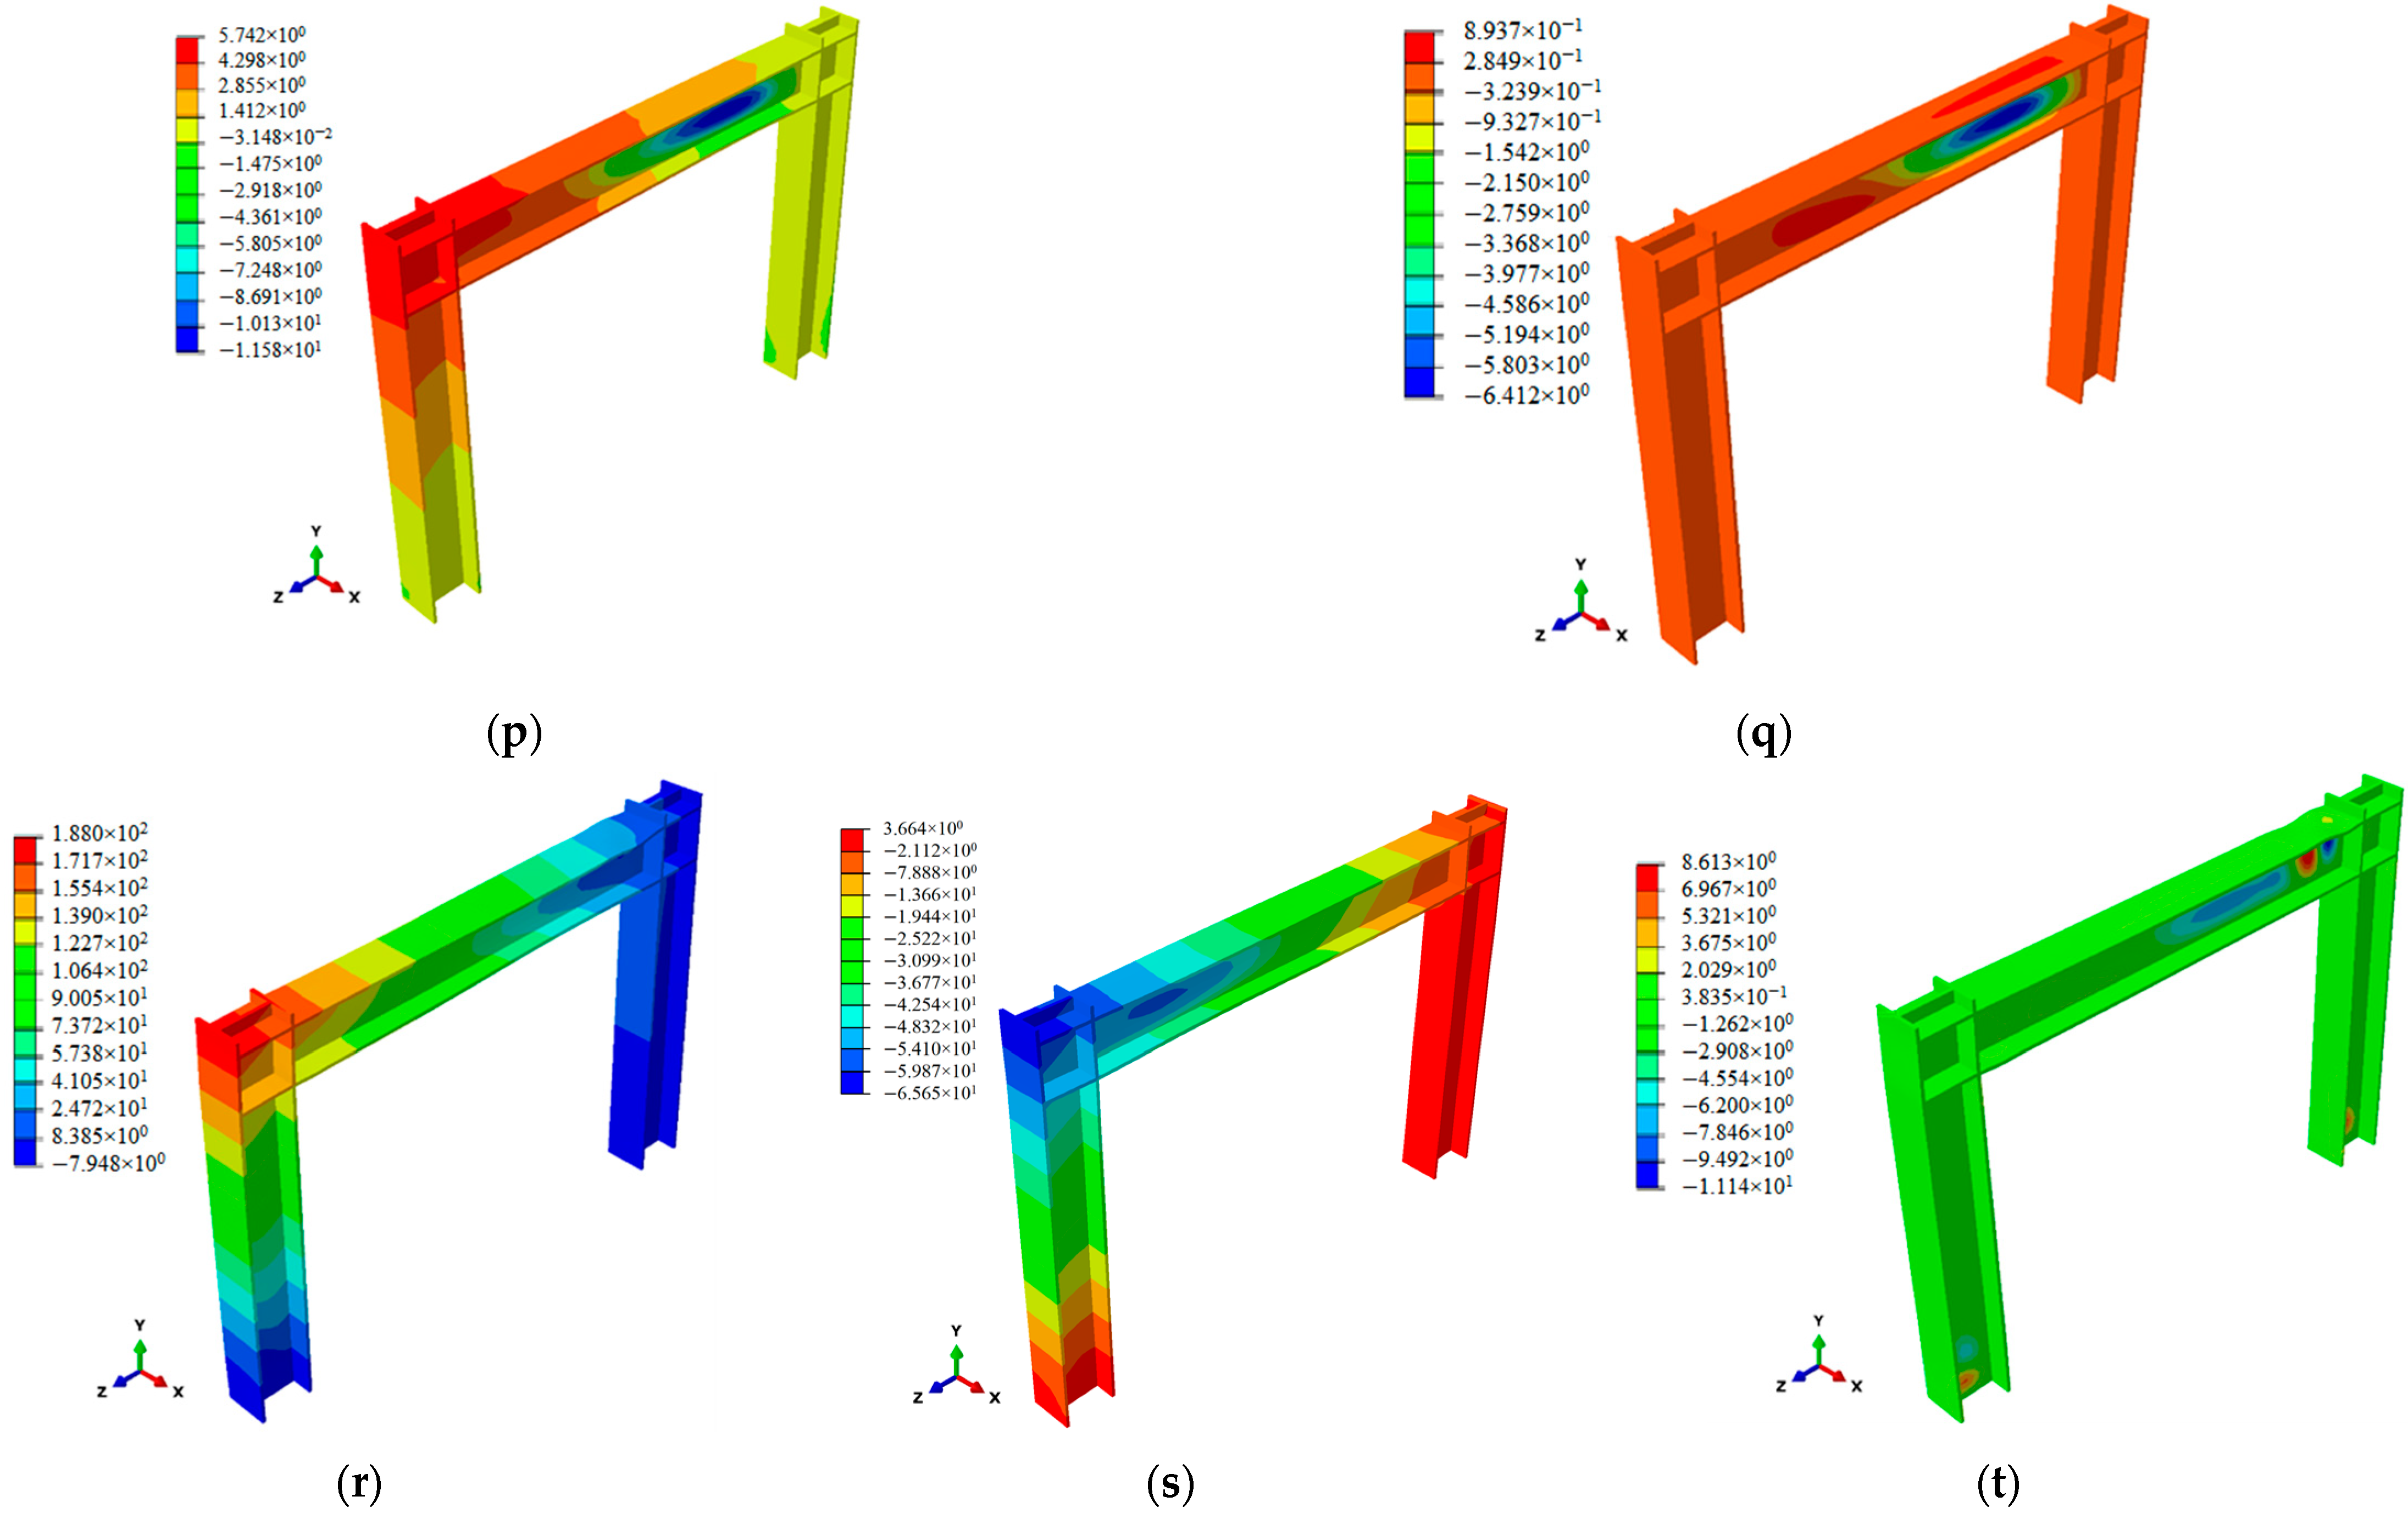
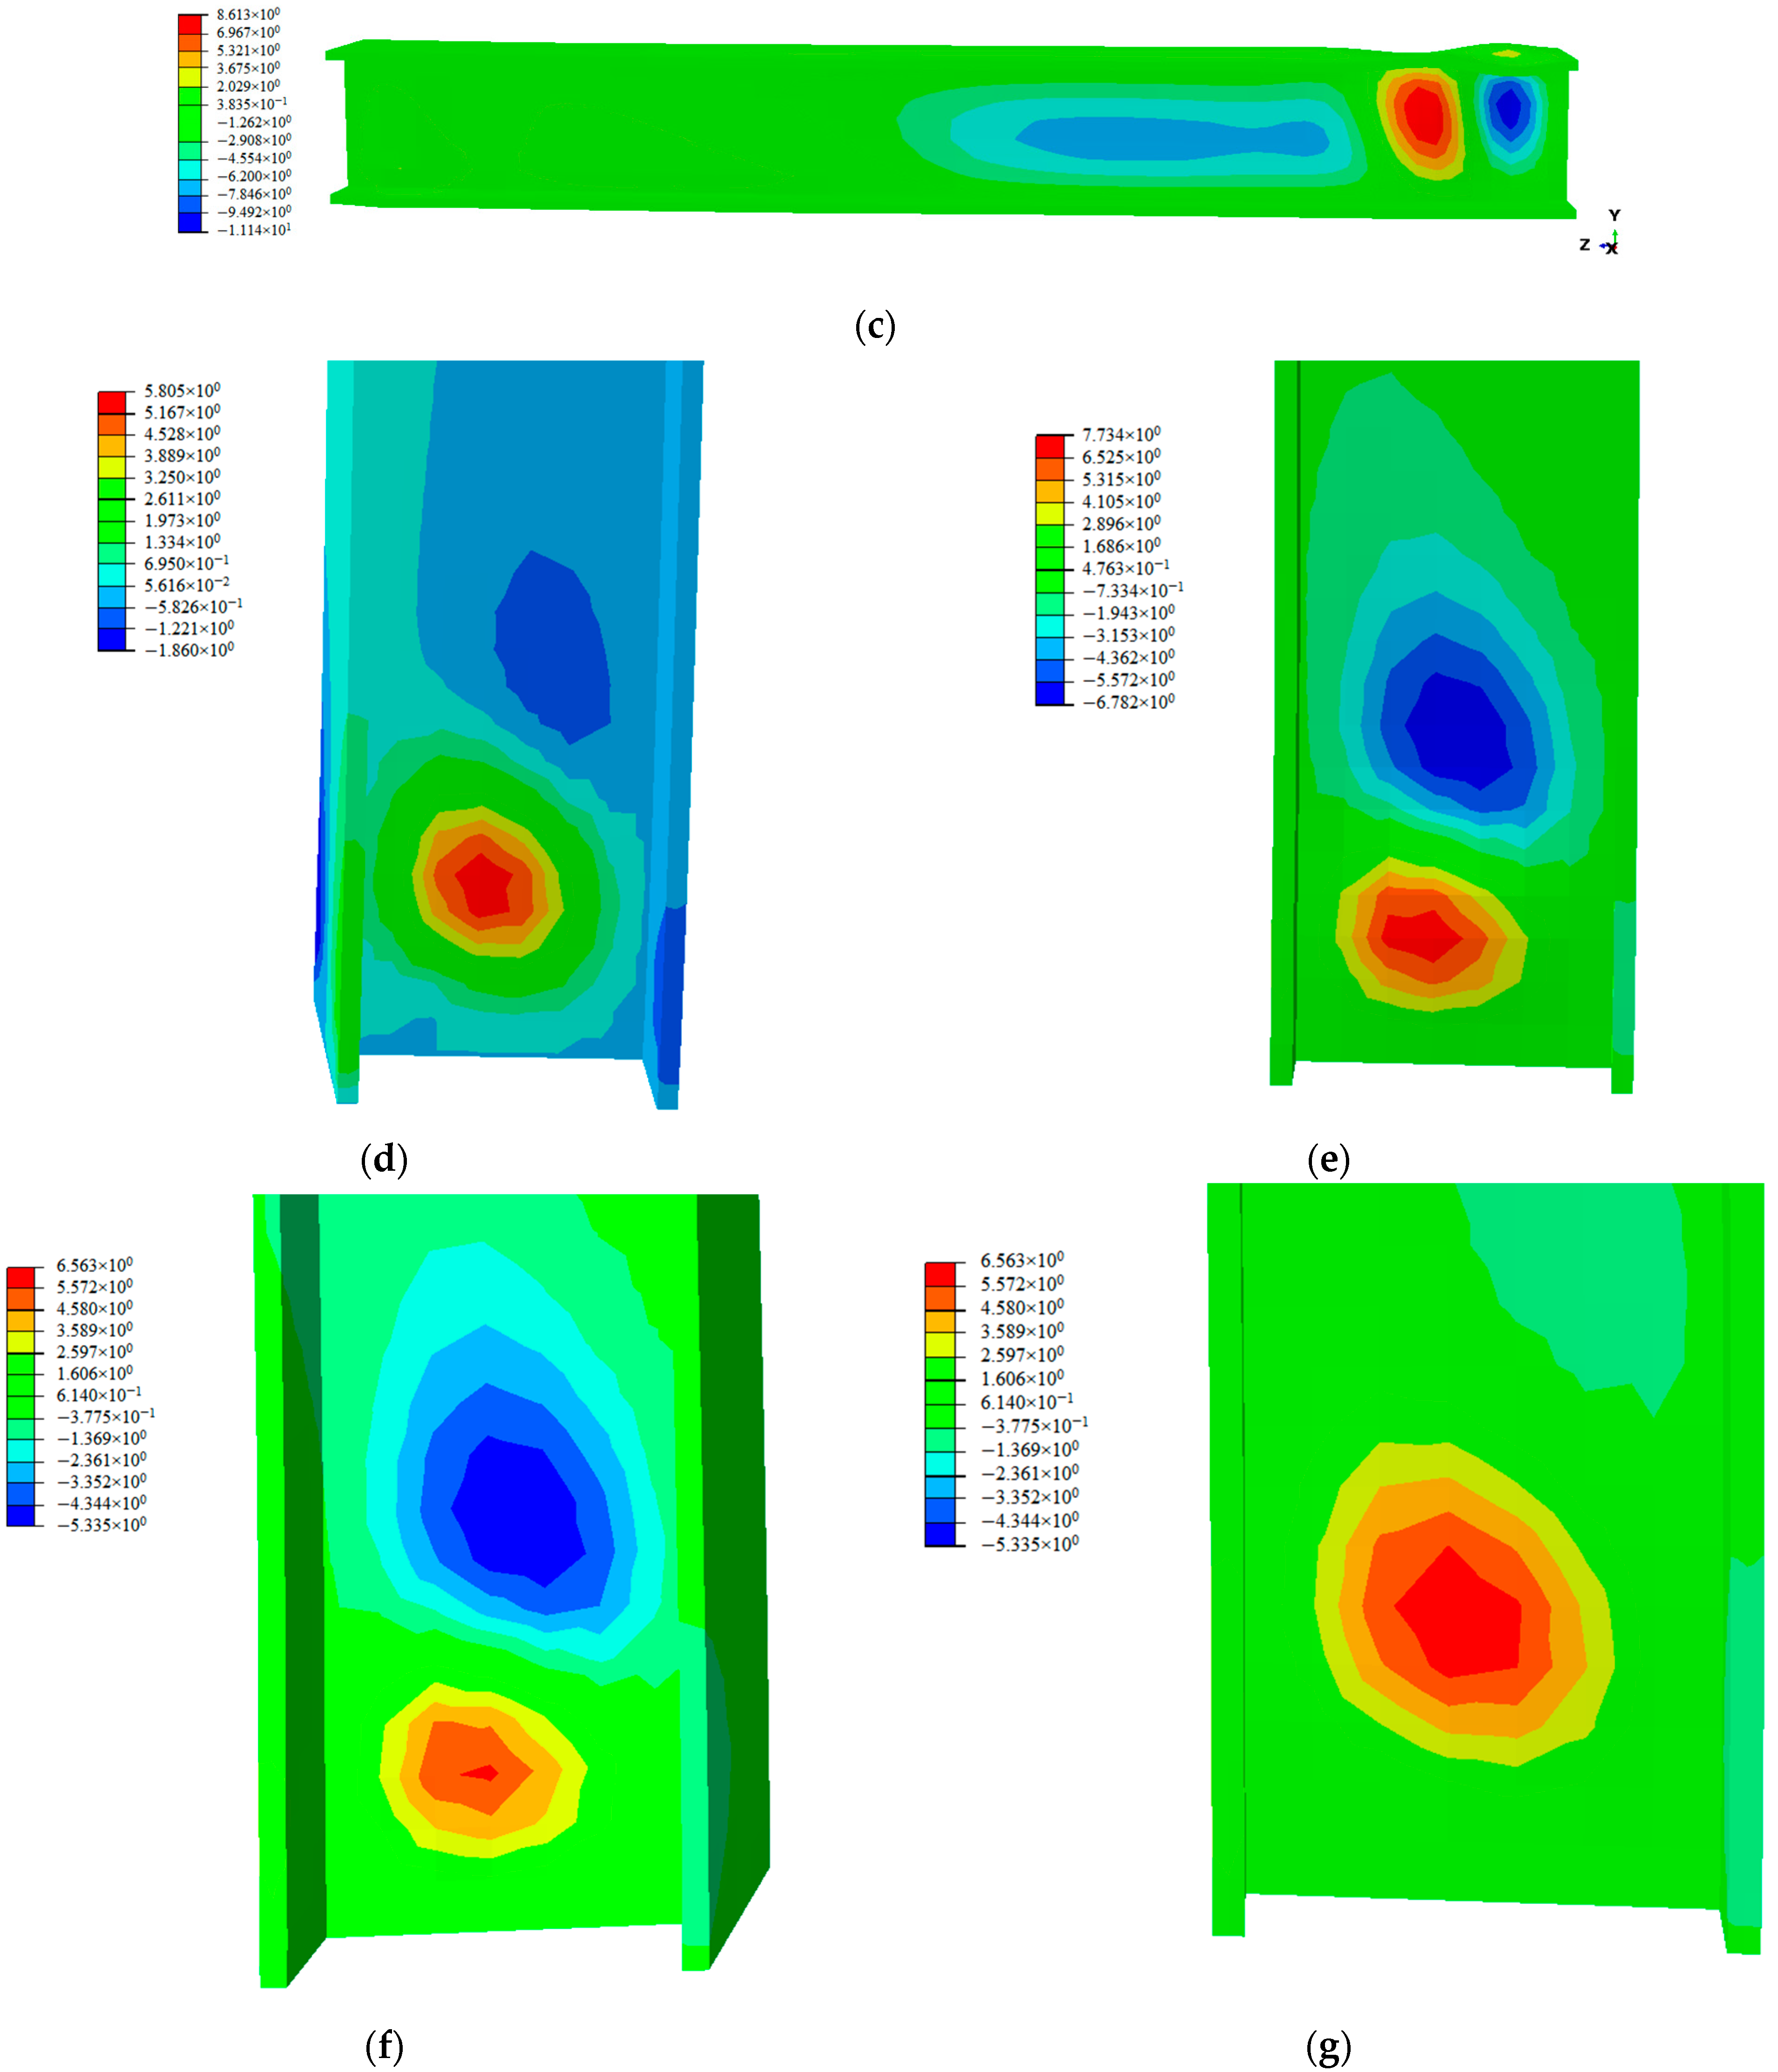
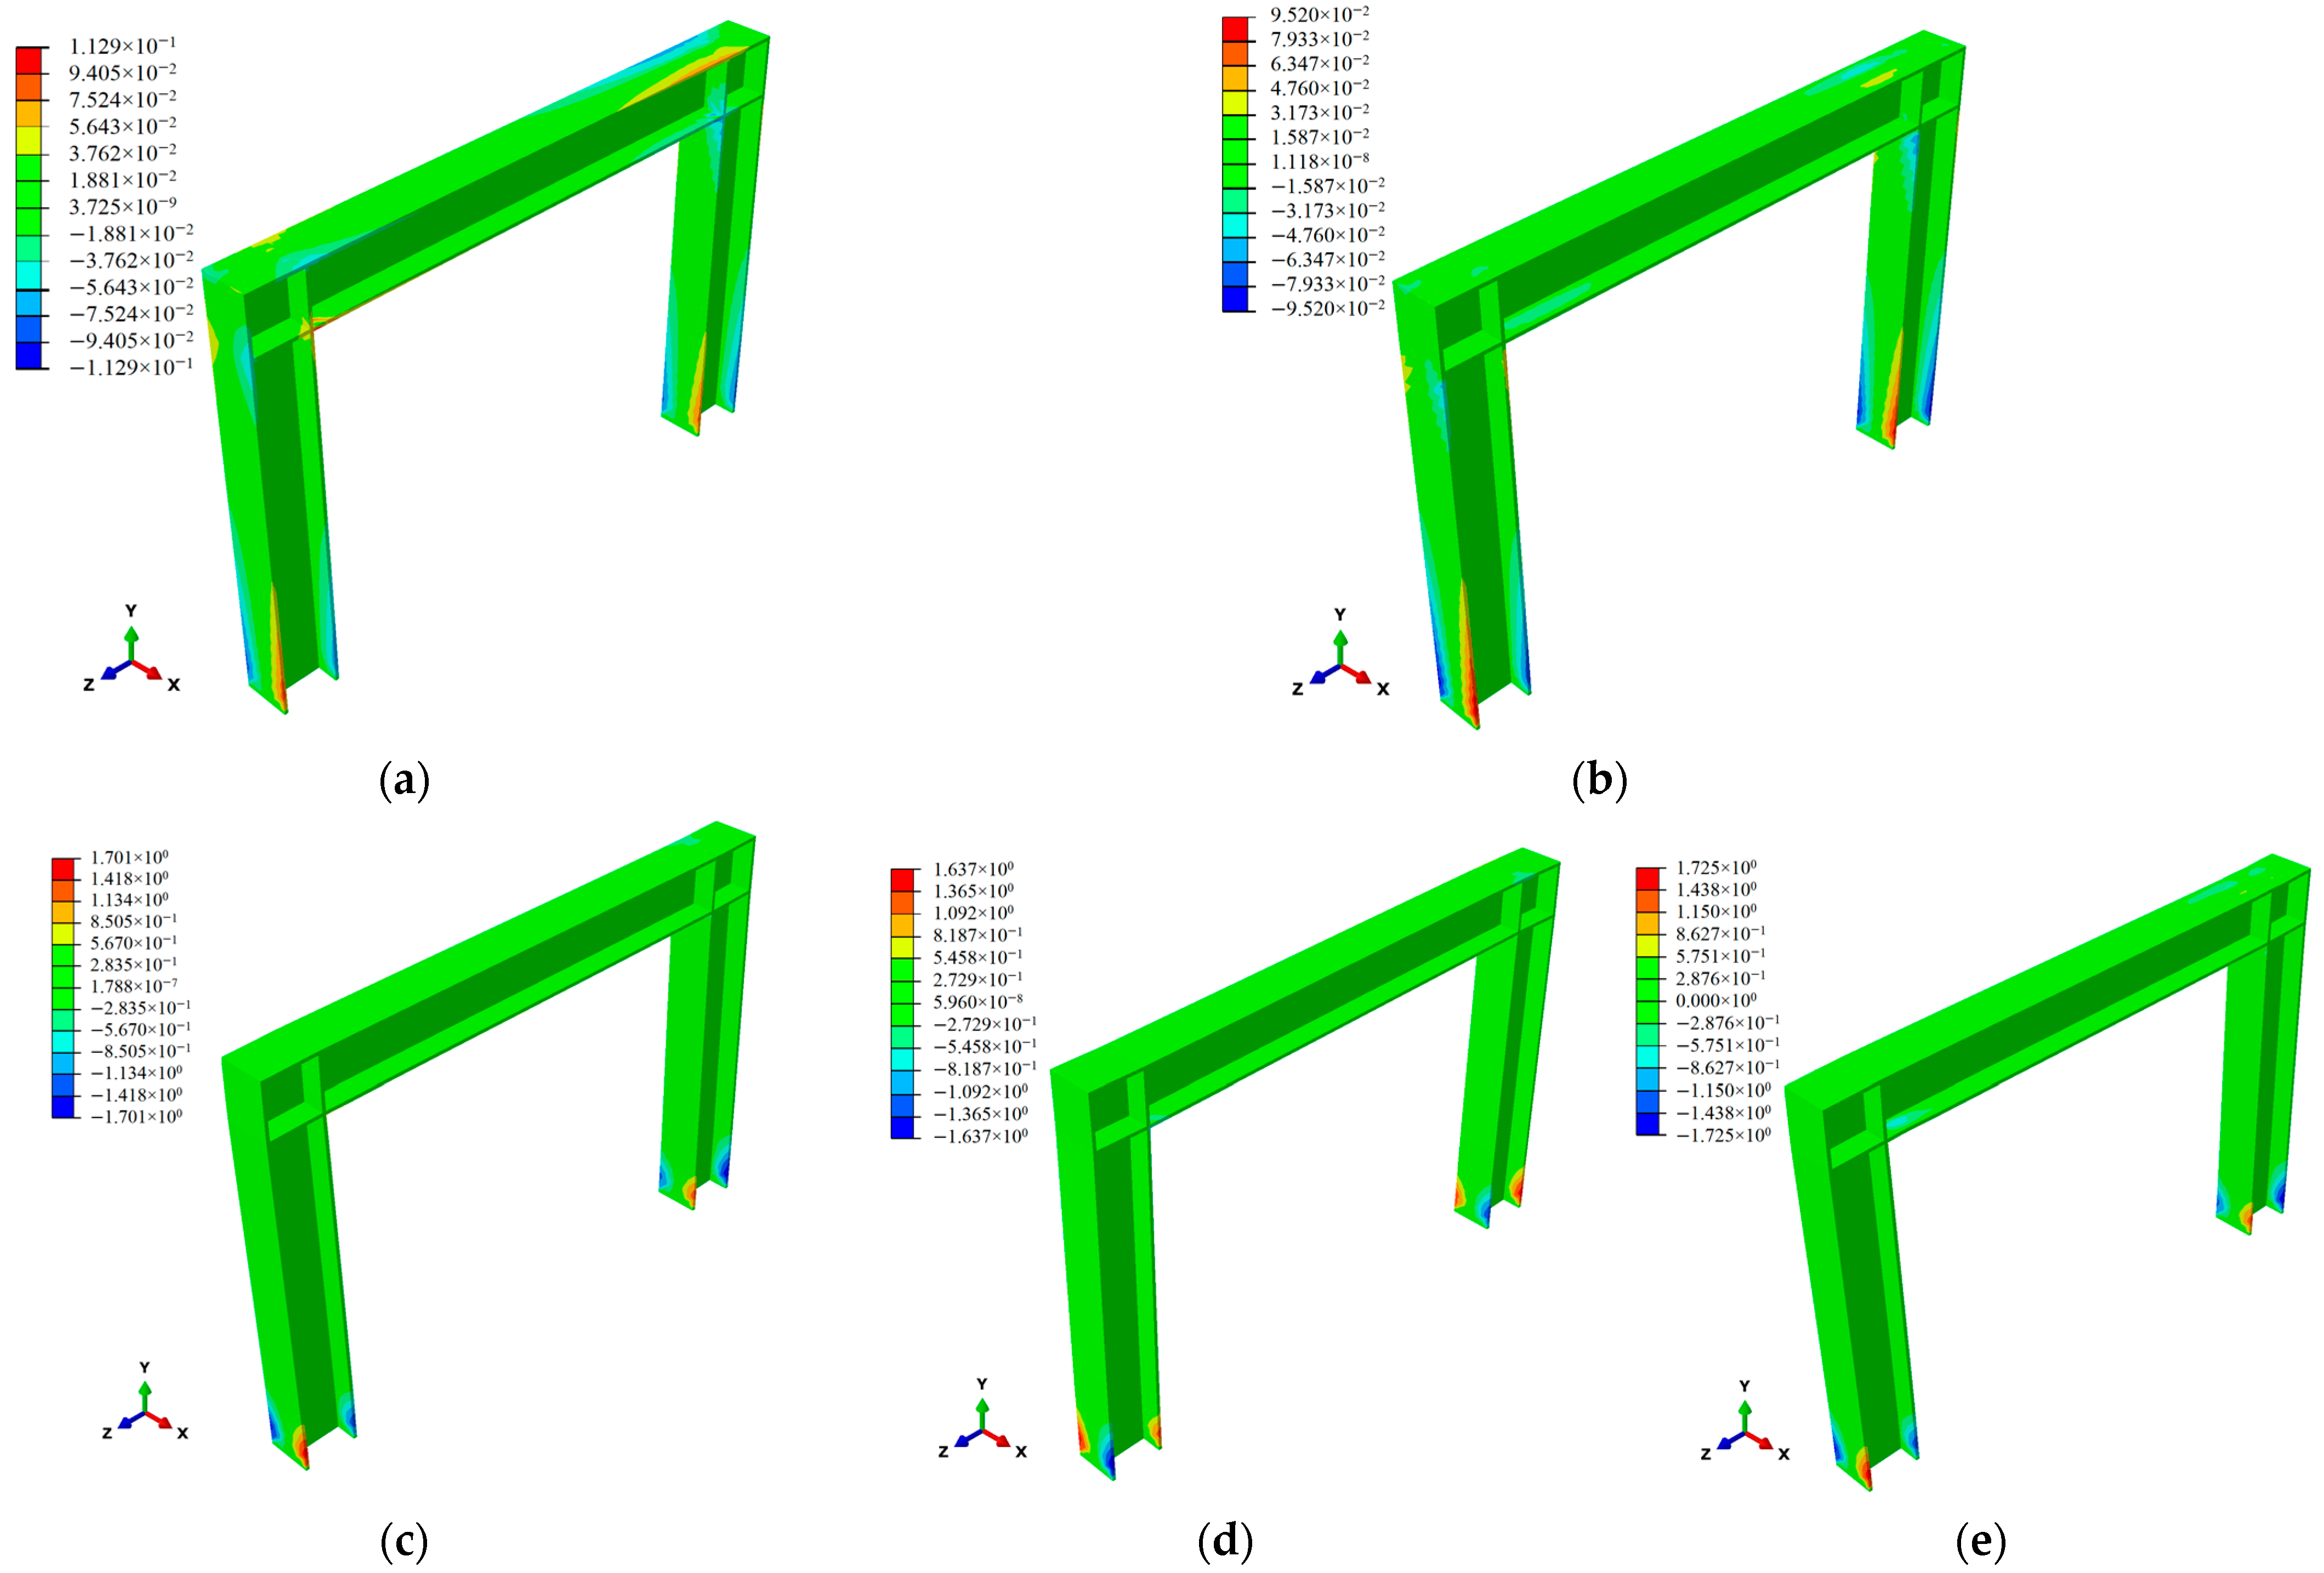
At a drift ratio of 0.005 under cyclic loading, local buckling occurred at the frame beam web of SPSW-T (Figure 18a). At a drift ratio of 0.025 in the push direction under cyclic loading, the upper part of the frame was flipped approximately in the vertical direction (Figure 18c). However, the out-of-plane deformation was smaller at the same drift ratio in the pull direction (Figure 18d). The out-of-plane deformation of SPSW-X-T at the peak displacements in the tension or push directions during the elastic-plastic stage was quite lower than that of SPSW-T, and only larger frame out-of-plane deformation (also x-direction deformation) relative to itself occurred at the flanges near the bottom of the columns (Figure 18b,e). At a drift ratio of 0.005 under cyclic loading, pronounced local buckling occurred at the frame beam webs of both SPSW-N8 and SPSW-N8-X (Figure 18f,g). At a drift ratio of 0.025 under cyclic loading, the most severe x-direction deformation occurred in the SPSW-N8 frame. However, the extent of the deformation was smaller than that in SPSW-T in both the pull and push directions of the loading ends (Figure 18h,i). For SPSW-N8-X, the local buckling at the frame beam web at a drift ratio of 0.025 was higher than that at a drift ratio of 0.005, and this buckling also occurred at the web near the bottom of the frame column where the loading end was located (Figure 19d). For models SPSW-N14 and SPSW-N20, and the corresponding models with frame beam flange constraints, the distribution trends of their frame deformation in the x-direction at each moment were similar to those of SPSW-N8 and SPSW-N8-X but with different values (Figure 18k–t and Figure 19b,c,e–g). However, for FRAME and FRAME-X, the out-of-plane deformation at each moment under cyclic loading was quite small (within 2 mm). In addition, the maximum out-of-plane deformation of SPSW-T at any time point was higher than that of SPSW-T-X but always within 20% (Figure 20). The effect of the frame beam flange constraints on the pure frame models was small.
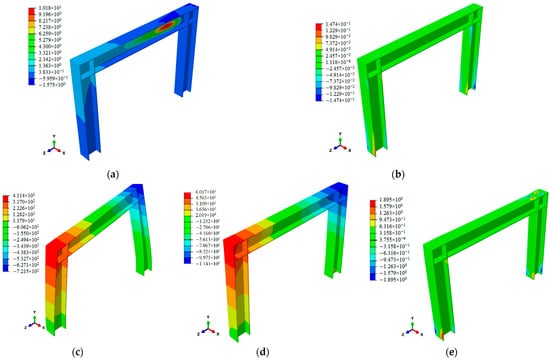
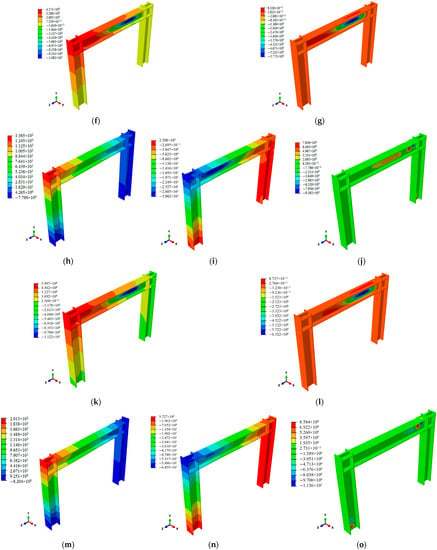
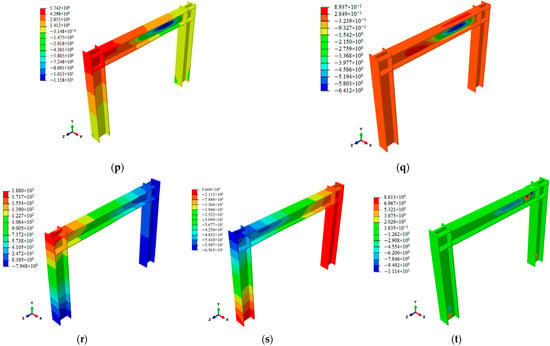
Figure 18.
Out-of-plane deformation of steel plate of each SPSW model under cyclic loading: (a) SPSW-T at a drift ratio of 0.005; (b) SPSW-T-X at a drift ratio of 0.005; (c) SPSW-T at a drift ratio of 0.025 in push direction of the loading end; (d) SPSW-T at a drift ratio of 0.025 in pull direction of the loading end; (e) SPSW-T-X at a drift ratio of 0.025; (f) SPSW-N8 at a drift ratio of 0.005; (g) SPSW-N8-X at a drift ratio of 0.005; (h) SPSW-N8 at a drift ratio of 0.025 in push direction of the loading end; (i) SPSW-N8 at a drift ratio of 0.025 in pull direction of the loading end; (j) SPSW-N8-X at a drift ratio of 0.025; (k) SPSW-N14 at a drift ratio of 0.005; (l) SPSW-N14-X at a drift ratio of 0.005; (m) SPSW-N14 at a drift ratio of 0.025 in push direction of the loading end; (n) SPSW-N14 at a drift ratio of 0.025 in pull direction of the loading end; (o) SPSW-N14-X at a drift ratio of 0.025; (p) SPSW-N20 at a drift ratio of 0.005; (q) SPSW-N20-X at a drift ratio of 0.005; (r) SPSW-N20 at a drift ratio of 0.025 in push direction of the loading end; (s) SPSW-N20 at a drift ratio of 0.025 in pull direction of the loading end; (t) SPSW-N20-X at a drift ratio of 0.025.
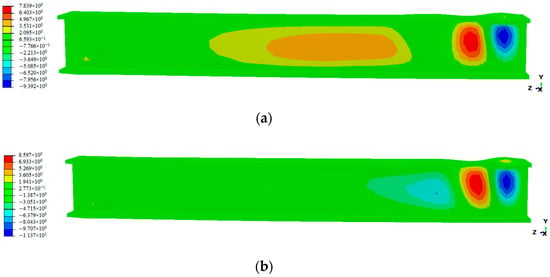
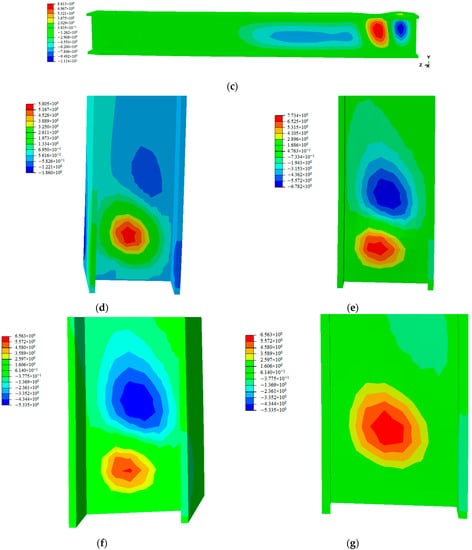
Figure 19.
Local buckling at frame beams and columns of SPSWs with bolt connection at the drift ratio of 0.025: (a) frame beam web of SPSW-N8; (b) frame beam web of SPSW-N14; (c) frame beam web of SPSW-N20; (d) column web near column bottom of SPSW-N8; (e) column web near column bottom of SPSW-N14; (f) column web near left column bottom of SPSW-N20; (g) column web near right column bottom of SPSW-N20.
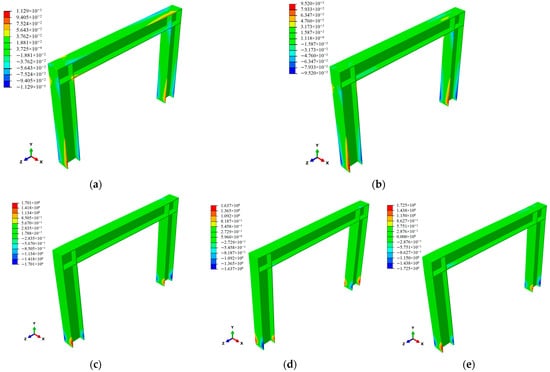
Figure 20.
Out-of-plane deformation of steel plate of FRAME and FRAME-X under cyclic loading: (a) FRAME at a drift ratio of 0.005; (b) FRAME-X at a drift ratio of 0.005; (c) FRAME at a drift ratio of 0.025 in push direction of the loading end; (d) FRAME at a drift ratio of 0.025 in pull direction of the loading end; (e) FRAME-X at a drift ratio of 0.025.
The maximum out-of-plane displacement values of each model without frame beam flange constraints at a drift ratio of 0.025 were determined and are listed in Table 10. As shown in Figure 18 and Table 10, without frame beam flange constraints, the out-of-plane displacement of the steel plate of the SPSW with two-sided fixed connections is noticeably larger than that of the steel plate bolt-connected SPSWs. The minimum difference was more than two times, and the maximum difference was approximately one hundred times. In other words, the bolt connections between the steel plate and frame components in two-side connected SPSWs can avoid the excessive deformation of the frame members.

Table 10.
Maximum out-of-plane displacement of the frame of each model without frame beam flange constraints at a drift ratio of 0.025 (unit: mm).
4. Conclusions
In this study, to investigate the mechanical performance of unstiffened SPSWs with two-side bolt connections and different numbers of bolts with or without frame beam flange constraints in the out-of-plane direction, ten models were established and analyzed using FEM technology. Numerous analysis results on the behavior of the models under monotonic loading and cyclic loading were obtained, such as hysteretic curves, energy dissipation, data and charts for the out-of-plane deformation of each component. By comparing the results from each model, the characteristics of the two-side bolt-connected SPSWs and two-side fixed SPSWs under lateral loading were determined. The conclusions of this study are as follows.
- For unstiffened SPSWs with two-side bolt connections, an increase in the number of bolts by a factor of 2.5 increases the initial stiffness by approximately 10%. This shows that increasing the number of bolts can improve the initial stiffness of the unstiffened two-side bolted SPSWs slightly. However, this method is not necessarily helpful in improving the ultimate bearing capacity: too many bolts reduce the ultimate bearing capacity of the unstiffened two-side bolted SPSWs.
- For any bolt-connected SPSW model having a constant number of bolts, the initial stiffness, yield bearing capacity and ultimate bearing capacity can only increase by 5% if the out-of-plate frame beam flange constraints are implemented. For two-side bolted SPSWs, the energy dissipation area and energy dissipation coefficient can improve by 10% at most when the drift ratio is more than 0.01. This indicates that the out-of-plane frame constraints have a negligible influence on the cyclic loading performance of the two-sided bolt-connected SPSWs.
- For an SPSW model with any type of connection between the steel plate and frame beam, when the upper frame beam does not have out-of-plane constraints, cyclic loading to a displacement angle exceeding 0.02 causes an out-of-plane deformation of the steel plate greater than 30 mm. However, this phenomenon is more significant for the two-sided fixed SPSWs.
- The most severe deformation develops rapidly in the region of the steel plate aligned with the length edge of the flat steel connectors at a large drift ratio (0.02) in two-side bolted SPSWs. This region should be strengthened to prevent the excessive deformation of the steel plate and an overall performance reduction in the SPSWs.
In general, the out-of-plane constraints of the frame beam flange slightly affect the performance indices of the two-side bolted steel plate shear wall. In the elastic-plastic stage, the constraint has different effects on the deformation of the steel plate. However, it exerts a significant influence on the out-of-plane deformation of the frame and should be considered by designers. Research on the influence of the different out-of-plane frame restraint stiffness values on two-side bolted SPSWs and on the corresponding multi-story and multi-span SPSW system can be carried out in the future.
Author Contributions
Conceptualization, J.H. (Jianian He); methodology, L.F. and Y.L. (Yicheng Li); formal analysis, J.H. (Jie Hu) and Y.L. (Yicheng Li); data curation, Y.L. (Yanwei Lv); writing—original draft preparation, Y.L. (Yicheng Li); writing—review and editing, Y.L. (Yicheng Li) and S.C.; visualization, Y.L. (Yicheng Li), L.F. and J.H. (Jie Hu); supervision, J.H. (Jianian He); project administration, J.H. (Jianian He) and S.C.; funding acquisition, J.H. (Jianian He). All authors have read and agreed to the published version of the manuscript.
Funding
This study was supported by the National Natural Science Foundation of China (Grant Nos. 51708226, 51638009 and 51808357).
Institutional Review Board Statement
Not applicable.
Informed Consent Statement
Not applicable.
Data Availability Statement
Not applicable.
Conflicts of Interest
The authors declare no conflict of interest.
References
- Fan, Z.; Li, Y.; Li, W.; Tian, Y. Influence of Frame Stiffness on Performance of Buckling Restrained Steel Plate Shear Walls. Eng. Mech. 2020, 37, 30. [Google Scholar]
- Zhou, M. Studies on Design Method of Unstiffened or Buckling-Restrained Steel Plate Shear Wall Structures. Doctoral Dissertation, Tsinghua University, Beijing, China, 2009. [Google Scholar]
- Guo, Y.; Dong, Q.; Zhou, M. Elastic Behavior and Minimum Restraining Stiffness of Buckling-Restrained Steel Plate Shear Wall. J. Build. Struct. 2009, 30, 40–47. [Google Scholar] [CrossRef]
- Thorburn, L.J.; Kulak, G.L.; Montgomery, C.J. Analysis of Steel Plate Shear Walls; Structural Engineering Report No. 107; Department of Civil Engineering, University of Alberta: Edmonton, AB, Canada, 1983. [Google Scholar]
- Shishkin, J.J.; Driver, R.G.; Grondin, G.Y.; Ackermann, K. Analysis of Steel Plate Shear Walls Using the Modified Strip Model. J. Struct. Eng. 2009, 135, 1357–1366. [Google Scholar] [CrossRef]
- Sabelli, R.; Bruneau, M. Design Guide 20: Steel Plate Shear Walls; American Institute of Steel Construction: Chicago, IL, USA, 2007. [Google Scholar]
- Reazi, M. Seismic Behaviour of Steel Plate Shear Walls by Shake Table Testing; The University of British Columbia: Vancouver, CB, Canada, 1999. [Google Scholar]
- Guo, L.; Jia, M.; Li, R.; Zhang, S. Hysteretic Analysis of Thin Steel Plate Shear Walls. Int. J. Steel Struct. 2013, 13, 163–174. [Google Scholar] [CrossRef]
- Guo, Y.; Zhou, M. Research on Analytical Models for Unstiffened Steel Plate Shear Walls. Eng. Mech. 2011, 28, 63–75. [Google Scholar]
- Elgaaly, M.; Liu, Y. Analysis of Thin-Steel-Plate Shear Walls. J. Struct. Eng. 1997, 123. [Google Scholar] [CrossRef]
- Fan, C.; Hao, J.; Tian, W. Experimental Study and Simplified Model Analysis of Thin Steel Plate Shear Wall Structures. Eng. Mech. 2016, 33, 34–45. [Google Scholar] [CrossRef]
- Elgaaly, M. Thin Steel Plate Shear Walls Behavior and Analysis. Thin-Walled Struct. 1998, 32, 151–180. [Google Scholar] [CrossRef]
- Ma, X. Seismic Behavior of Steel Plate Shear Walls and Composite Shear Walls with Two-Side Connections. Doctoral Dissertation, Harbin Institute of Technology, Harbin, China, 2009. [Google Scholar]
- JGJ/T 380-2015; Technical Specification for Steel Plate Shear Walls. China Architecture and Building Press: Beijing, China, 2015.
- Schumacher, A.; Grondin, G.Y.; Kulak, G.L. Connection of Infill Panels in Steel Plate Shear Walls. Can. J. Civ. Eng. 1997, 26, 549–563. [Google Scholar] [CrossRef]
- Paslar, N.; Farzampour, A.; Hatami, F. Infill Plate Interconnection Effects on the Structural Behavior of Steel Plate Shear Walls. Thin-Walled Struct. 2020, 149, 106621. [Google Scholar] [CrossRef]
- Choi, I.-R.; Park, H.-G. Steel Plate Shear Walls with Various Infill Plate Designs. J. Struct. Eng. 2009, 135, 785–796. [Google Scholar] [CrossRef]
- Wang, Y.C.; Hao, J.P.; Cao, C.H.; Sun, T. Experimental Studies on Steel Plate Shear Walls with Welded-Bolted Connection. Prog. Steel Build. Struct. 2009, 11, 16–20. [Google Scholar]
- Yu, J.; Huang, J.; Li, B.; Feng, X. Experimental Study on Steel Plate Shear Walls with Novel Plate-Frame Connection. J. Constr. Steel Res. 2021, 180, 106601. [Google Scholar] [CrossRef]
- Li, G.; Wang, Y.; Yang, Z.; Fang, C. Shear Behaviour of Novel T-Stub Connection between Steel Frames and Precast Reinforced Concrete Shear Walls. Int. J. Steel Struct. 2018, 18, 115–126. [Google Scholar] [CrossRef]
- Xue, M.; Lu, L. Monotonic and Cyclic Behavior of Infilled Steel Shear Panels. In Proceedings of the 17th Czech and Slovak International Conference on Steel Structures and Bridges, Bratislava, Slovakia, 9 July–9 September 1994. [Google Scholar]
- Miu, Y. The Investigation to Structural Behavior of Steel Plate Shear Wall Slotted at Two Edges. Master’s Dissertation, Tsinghua University, Beijing, China, 2004. [Google Scholar]
- Xu, M.; Wang, Y.; Zhang, S. Shera Resistance Behavior of Two-Side Connected Steel-Plate Shear Wall (SPSW). Ind. Constr. 2009, 39, 107–111. [Google Scholar]
- Nam, V.H.; Nam, N.H.; Vinh, P.V.; Khoa, D.N.; Thom, D.V.; Minh, P.V. A New Efficient Modified First-Order Shear Model for Static Bending and Vibration Behaviors of Two-Layer Composite Plate. Adv. Civ. Eng. 2019, 2019, 6814367. [Google Scholar] [CrossRef]
- Nguyen Thai, D.; Minh, P.V.; Phan Hoang, C.; Ta Duc, T.; Nguyen Thi Cam, N.; Nguyen Thi, D. Bending of Symmetric Sandwich FGM Beams with Shear Connectors. Math. Probl. Eng. 2021, 2021, 7596300. [Google Scholar] [CrossRef]
- Chi Tho, N.; Van Thom, D.; Hong Cong, P.; Zenkour, A.M.; Hong Doan, D.; Van Minh, P. Finite Element Modeling of the Bending and Vibration Behavior of Three-Layer Composite Plates with a Crack in the Core Layer. Compos. Struct. 2023, 305, 116529. [Google Scholar] [CrossRef]
- Thai, L.M.; Luat, D.T.; Ke, T.V.; Van, M.P. Finite-Element Modeling for Static Bending Analysis of Rotating Two-Layer FGM Beams with Shear Connectors Resting on Imperfect Elastic Foundations. J. Aerosp. Eng. 2023, 36, 04023013. [Google Scholar] [CrossRef]
- Phung, M.V.; Nguyen, D.T.; Doan, L.T.; Nguyen, D.V.; Duong, T.V. Numerical Investigation on Static Bending and Free Vibration Responses of Two-Layer Variable Thickness Plates with Shear Connectors. Iran. J. Sci. Technol. Trans. Mech. Eng. 2022, 46, 1047–1065. [Google Scholar] [CrossRef]
- Jiang, L.; Zheng, H.; Hu, Y. Experimental Seismic Performance of Steel- and Composite Steel-Panel Wall Strengthened Steel Frames. Arch. Civ. Mech. Eng. 2017, 17, 520–534. [Google Scholar] [CrossRef]
- Jiang, L.; Zheng, H.; Hu, Y. Effects of Configuration Parameters on Seismic Performance of Steel Frames Equipped with Composite Steel Panel Wall. Struct. Des. Tall Spec. Build. 2018, 27, e1542. [Google Scholar] [CrossRef]
- Simulia Corp. Abaqus 2020. Dassault Systèmes; Simulia Corp.: Providence, RI, USA, 2020. [Google Scholar]
- GB/T 3098.1-2010; Mechanical Properties of Fasteners-Bolts, Screws and Studs. Standards Press of China: Beijing, China, 2010.
- GB 50017-2018; Standard for Design of Steel Structures. China Architecture and Building Press: Beijing, China, 2018.
- GB/T 1229-2006; High Strength Large Hexagon Nuts for Steel Structures. Standards Press of China: Beijing, China, 2006.
- Curkovic, I.; Skejic, D.; Dzeba, I. Seismic Performance of Steel Plate Shear Walls with Variable Column Flexural Stiffness. Steel Compos. Struct. 2019, 33, 1–18. [Google Scholar] [CrossRef]
- Applied Technology Council. ATC (2010), PEER/ATC-72-1: Modelling and Acceptance Criteria for Seismic Design and Analysis of Tall Buildings; Applied Technology Council: Redwood City, CA, USA, 2010. [Google Scholar]
- Jacobsen, L.S. Steady Forced Vibrations as Influenced by Damping: An Approximate Solution of the Steady Forced Vibration of a System of One Degree of Freedom Under the Influence of Various Types of Damping. Bull. Seismol. Soc. Am. 1930, 20, 196–223. [Google Scholar] [CrossRef]
Disclaimer/Publisher’s Note: The statements, opinions and data contained in all publications are solely those of the individual author(s) and contributor(s) and not of MDPI and/or the editor(s). MDPI and/or the editor(s) disclaim responsibility for any injury to people or property resulting from any ideas, methods, instructions or products referred to in the content. |
© 2023 by the authors. Licensee MDPI, Basel, Switzerland. This article is an open access article distributed under the terms and conditions of the Creative Commons Attribution (CC BY) license (https://creativecommons.org/licenses/by/4.0/).

