Article

Characteristics and Energy Distribution of Blast-Induced Ground Vibration in Deep-Hole Blasting

School of Civil Engineering, Liaoning Technical University, Fuxin 123000, China
*
Author to whom correspondence should be addressed.
Buildings 2023, 13(4), 899; https://doi.org/10.3390/buildings13040899
Submission received: 31 December 2022 / Revised: 21 March 2023 / Accepted: 24 March 2023 / Published: 29 March 2023
(This article belongs to the Special Issue Dynamic Response of Structures)

Abstract

:
This study proposes an incremental extreme extraction method based on the waveform characteristics of ground vibration signals obtained from open-pit mines to investigate the distribution and characteristics of ground vibration from deep-hole blasting. Firstly, an incremental extreme extraction method is proposed based on the waveform characteristics of borehole blasting vibration signals in open-pit mines. The proposed method could extract and screen the extreme values of blasting vibration signals and effectively improve the utilization rate of the data. The space vector of particle vibration is introduced to analyze the angle change between the particle velocity vector and the ground surface when the extreme value increases. Finally, the relation between the particle velocity vector and the angle between the ground plane and the increasing extremum position of several sets of measured signals is studied. Based on the statistical analysis, the results show that the particle velocity in the vertical direction has a significant advantage over that of the other two directions, and the angle between the extreme particle velocity vector direction and the ground plane is primarily distributed in the range of 60°~90°. After an unstable distribution of particle velocities in the transition zone, the particle velocities in each direction gradually attain a relatively balanced and stable attenuation condition as the distance increases. This proves the reliability of the proposed vector analysis of particle velocity in understanding the mechanism of rock blasting.

1. Introduction

The characteristics of surface vibration induced by deep-hole blasting serve as the basis for studying the generation and propagation of stress waves. A blast-induced ground vibration is a form of transient energy with high intensity. Due to its large-scale operation, open-pit deep-hole blasting has a long-term impact on adjacent structures and media. Deep-hole blasting is generally a multi-hole blasting design with a large initial charge, a wide range of blasting energy, and a long duration of blast-induced ground vibration, which can cause damage to adjacent structures [1]. As shown in Figure 1, the damage to the buildings was caused by blast-induced ground vibration. It is necessary to investigate the energy distribution of deep-hole blasting to analyze the characteristics of blasting energy and optimize the scheme of vibration reduction.
For many years, the academic community has focused on engineering problems caused by the energy release and transfer of explosion energy to rock masses. Tian et al. [2] investigated the propagation law of tunnel blasting vibration waves on the surface. The original blasting scheme was optimized to reduce the demolition quantity on houses and the impact on the buildings in the blasting safety zone. The test data showed that the particle vibration velocity in the vertical direction was larger than that in the horizontal direction. Wang et al. [3] analyzed the attenuation law of Peak Particle Velocity (PPV) of ground vibration produced by oil pipeline blasting and concluded that the attenuation amplitude of PPV in the vertical direction was more important for horizontal structures such as pipelines. Kumar [4] studied the adverse effect of blast-induced ground vibration on adjacent buildings, focusing on the damage effect of PPV on buildings. They also noted that it was impractical to take PPV as a sole criterion for evaluation and that the structural response must be considered. The structural response, such as interstorey drift and damage level and locations, must be taken into account. Jiang et al. [5] used PPV as an index to analyze vibration attenuation law in their study on the influence of underground blasting on slope stability. Aldas et al. [6] considered the delay time series of hole initiation and proposed the optimal delay time for vibration reduction design based on waveform analysis. Gou et al. [7] investigated the influence of underground blasting on surface structures and compared the attenuation of surface peak particle velocity (PPV) with that in underground rock. They also compared the horizontal and vertical PPV and conducted tests at distances ranging from 700 to 1400 m. Despite the difficulty in establishing a relationship between the ratio and increasing distance, the authors found that PPVH (horizontal PPV)was predominantly greater than PPVV(vertical PPV. However, they believe that the ratio between the two is related to the properties of the rock. Chen et al. [8] proposed a modified equation for predicting PPV considering the characteristics of cylindrical explosive and introduced the influencing effect of charge length on predicting PPV. Ainalis et al. [9] proposed a new and improved continuous wavelet analysis method to estimate the local dominant frequency and PPV using time-frequency distribution. This technique can be used to accurately identify the time-dependent ground particle velocity and frequency, as well as the number of times the damage threshold limit value is exceeded. Zhou et al. [10] studied the vibration propagation down the slope in a real-time blasting operation and used empirical equations to perform regression analysis on the prediction model of explosion particle velocity. The magnification of the PPV along the negative slope was introduced, and the results showed that the amplification effect of the negative slope occurred at the specific height difference, which was more pronounced in the vertical direction. Matidza et al. [11] proposed a prediction model based on Sadowski’s equation for predicting ground vibrations caused by open-pit mine explosions. The performance indices of Sadovsky’s equation were superior to those of other equations (the United States Bureau of Mines (USBM), the Bureau of Indian Standards (BIS), and the Central Mining Research Institute (CRMI), etc.) based on the correlation coefficient (R2), mean square error (MSE), root mean square error (RMSE), mean absolute percentage error (MAPE), and median absolute error (MEDAE). Roy et al. [12] analyzed the effect of the total explosive weight on the magnitude of the blast vibration through a large number of blast vibration PPVs. The results showed that the magnitude of ground vibration induced by explosions is influenced by the total amount of explosive material detonated within each delayed time interval over a short distance, regardless of the maximum charge of an individual borehole. Yan et al. [13] performed a nonlinear fitting analysis on the measured PPV and derived empirical equations considering elevation factors. Additionally, they fitted the particle velocities in three distinct directions on different steps and concluded that the vertical particle velocity was more significantly affected than the horizontal particle velocities. Sadovsky’s equation is a preferable option compared to equations based on elevation for the prediction of blast-induced ground vibration in flat areas.
In recent years, researchers have introduced machine learning methods to predict blast-induced ground vibration intensity and to analyze the influential factors [14].
Yu et al. [15] used an artificial neural network (ANN) to establish an accurate prediction model and applied a metaheuristic algorithm called the equilibrium optimizer (EO) algorithm to determine the optimal combination of hyperparameters. A linear model and a nonlinear regression model analysis were performed for the comparative study. The results showed that EO–ANN performed better than other predictive models. Nguyen et al. [16] studied three optimization algorithms and deep neural network (DNN) hybrid models (Harris hawks optimization algorithm–deep neural network (HHOA–DNN), whale optimization algorithm–deep neural network (WOA–DNN), and particle swarm optimization algorithm–deep neural network (PSOA–DNN)) for ground vibration prediction. After analyzing the blast-induced ground vibration data of the open-pit mine, it was concluded that the HHOA–DNN model provided the highest performance.
Considering various blasting forms and scenarios, the PPV has been predicted by fuzzy C-means clustering, quantile regression neural network (FCM-QRNN) [17], support vector machine (SVM) [18,19,20], classification and regression tree (CART) [21,22], and other intelligent algorithms, and the predictive accuracy of intelligent algorithms showed better performance than that of empirical equations when considering more than two parameters.
The study of vibration attenuation law usually adopts the method of combining test and empirical equation. Generally, the fitting coefficient can be used to predict the blast-induced ground vibration intensity or guide the vibration reduction design by fitting the empirical equation to the field test data. Parametric regression requires a large number of measured data to improve the credibility of regression parameters. With the advantage of fast computation, the intelligent algorithm can introduce more influencing factors to analyze the blast-induced ground vibration law. Despite the recent rapid development of models for PPV prediction by intelligent algorithms, these models are still applied to specific geological conditions and necessitate a large amount of measurable data to increase the prediction accuracy. Furthermore, due to the inadequacy of in-depth analysis of a blasting mechanism, certain subjective judgment is needed to identify the factors that influence blast-induced ground vibrations. When using an intelligent algorithm to calculate blast-induced ground vibration in various blasting engineering applications, the selection method of algorithm and factors is often not mature, and the application research of blasting scheme optimization is relatively lacking. Compared with the intelligent algorithm, the empirical equation method is a more established method used to analyze the blast-induced ground vibration law that focuses on mechanism analysis and is convenient to use in practical engineering. Although the empirical equations cannot reflect the complex nonlinear relationship as an intelligent algorithm can, it is more intuitive and diverse in its presentation of the influencing factors, which aids in the formation of an intuitive assessment of the influencing factors at the project site. Combining blast-induced ground vibration theory with the empirical equation technique has obvious advantages and combining it with engineering practice can further help promote theory development and implementation.
Past studies considered PPV as a quantitative measurement of vibration intensity in data analysis. They neglected the fact that complex blasting is a continuous process and paid no attention to how vibration develops to the magnitude of PPV. Therefore, this research focuses on the extraction of multiple groups of valid velocity and the law of valid velocity via time or space from a vibration signal. If multiple groups of valid data can be extracted from a single vibration signal with certain regularity in time or space, then the basic data can be expanded in the study of related problems. The effect of blasting on surface vibration appears to vary depending on the space distance, showing extreme values and peaks in the vibration signal. The extreme value and peak value of vibration are the key data reflecting the impact of blast-induced ground vibration on the surface. With the decrease in the distance, the increasing extreme value will reflect the increase in vibration intensity. The extracted data are used as the effective data of the surface vibration induced by the hole initiation based on the increasing extremum of the vibration signal corresponding to the spatial distance and the particle velocity of the other two directions at the same time. A method of data acquisition and analysis is proposed, following which the generation and propagation characteristics of deep-hole blast-induced ground vibration are analyzed from the spatial perspective.

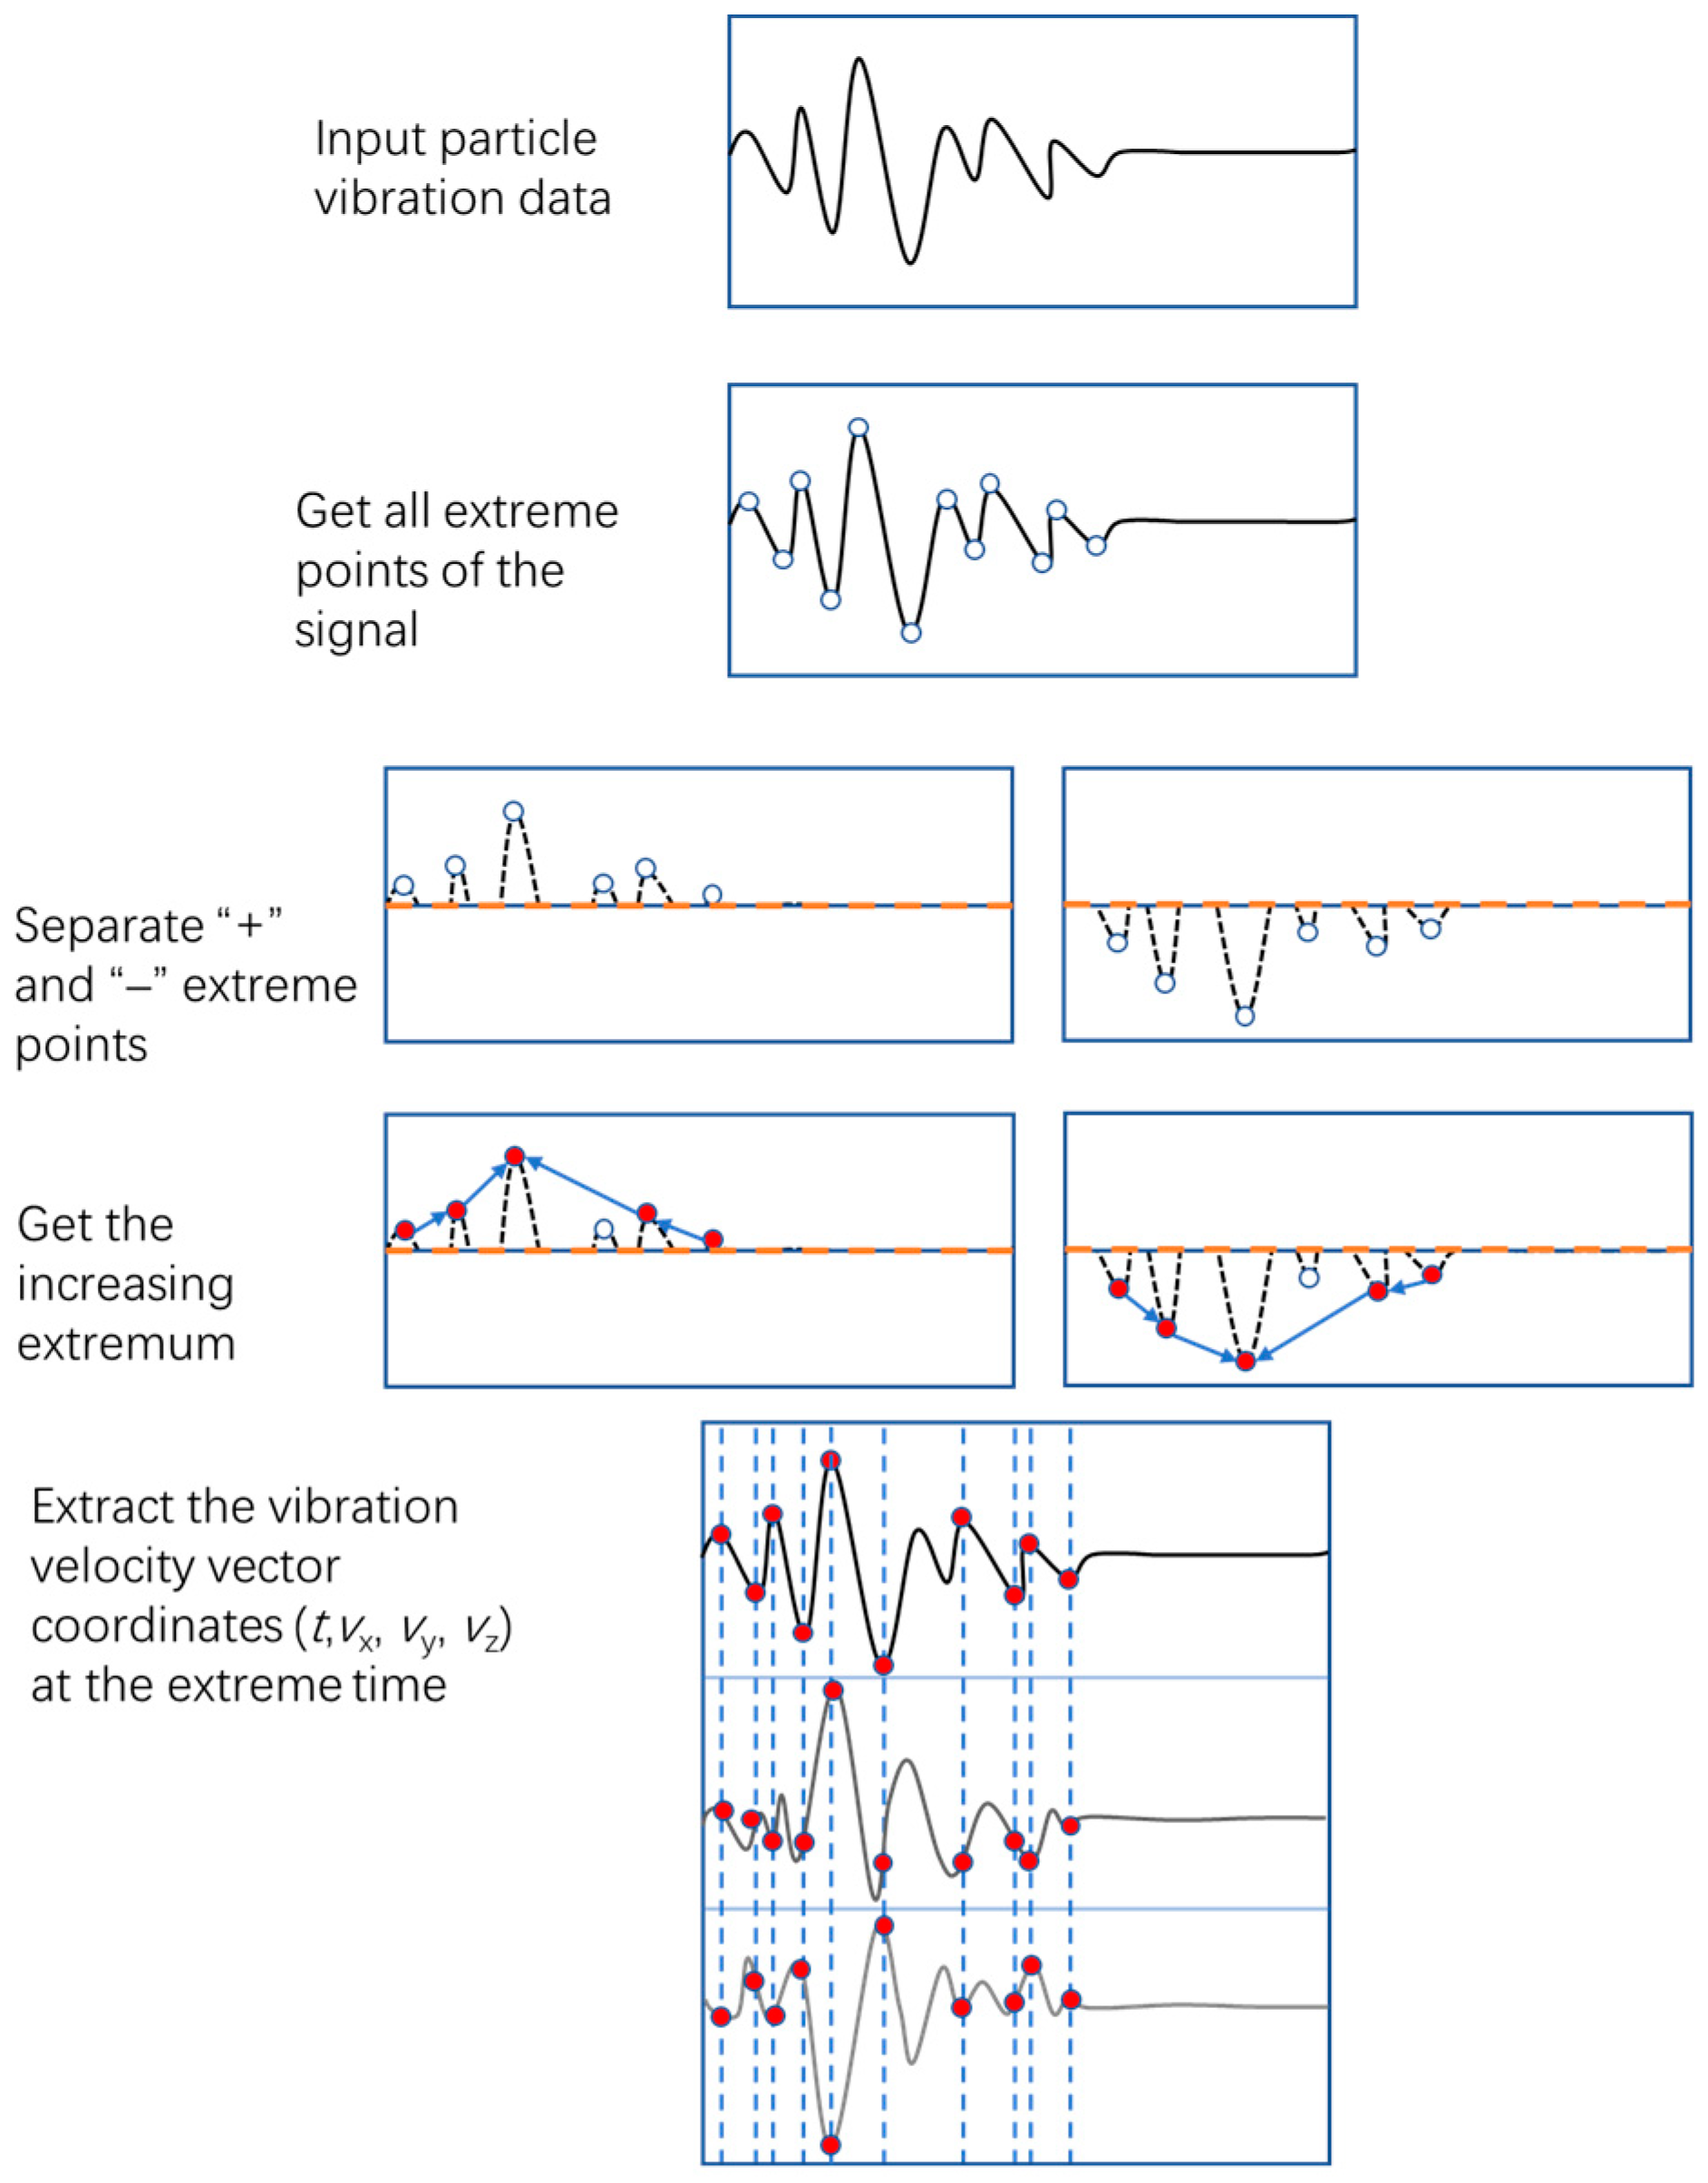
2. Increasing Extreme Value of Blast-Induced Ground Vibration Signal

In order to avoid the adverse effect of blast-induced ground vibration on adjacent structures, open-pit deep-hole blasting is often carried out hole by hole. The blasting parameters in a single blasting area, such as hole diameter, spacing, row spacing, single hole charge, the delay between holes, and delay time between rows, are often the same, whereas variables affecting blast-induced ground vibration are controllable. Despite this, the influence range is still greater due to characteristics of large explosive charges in open-air blasting. Compared with tunneling blasting, the vibration of deep-hole blasting generally lasts longer, and the distance between the monitoring point and the blasting hole varies greatly. As shown in Figure 2, the fluctuation of vibration signal is inevitably caused by that change in the distance. Under normal circumstances, the blasting parameters remain constant, whereas particle velocity decreases with an increase in the propagation distance. As shown in Figure 2, the extreme value of the vibration signal increases initially and then decreases, reflecting the dynamic change process of the distance between the blasting hole and monitoring point from far to near, and from near to far, thus forming the “olive shape” vibration signal.

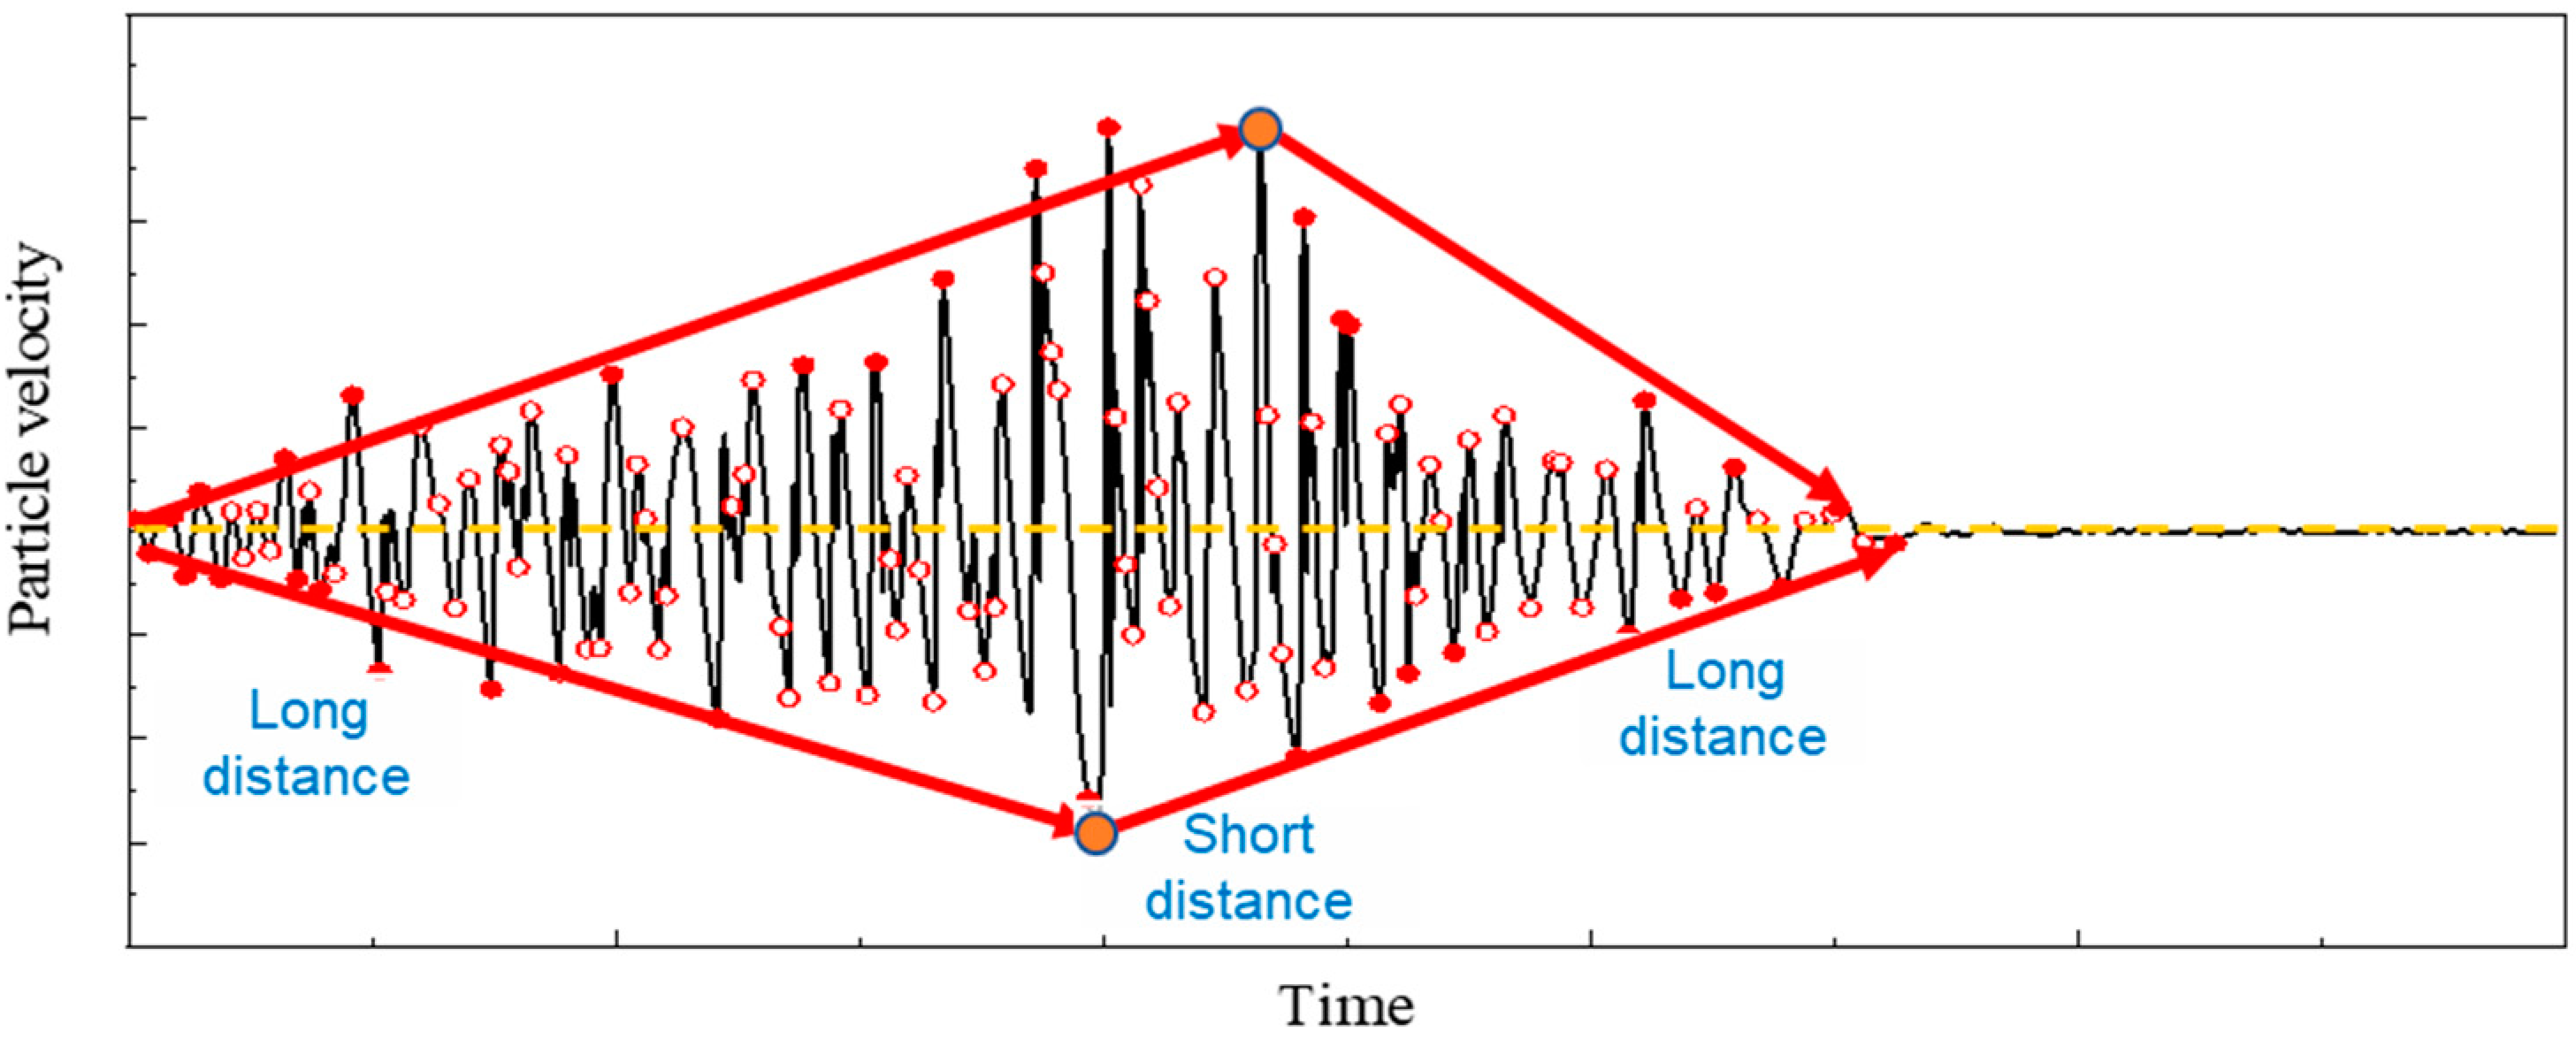
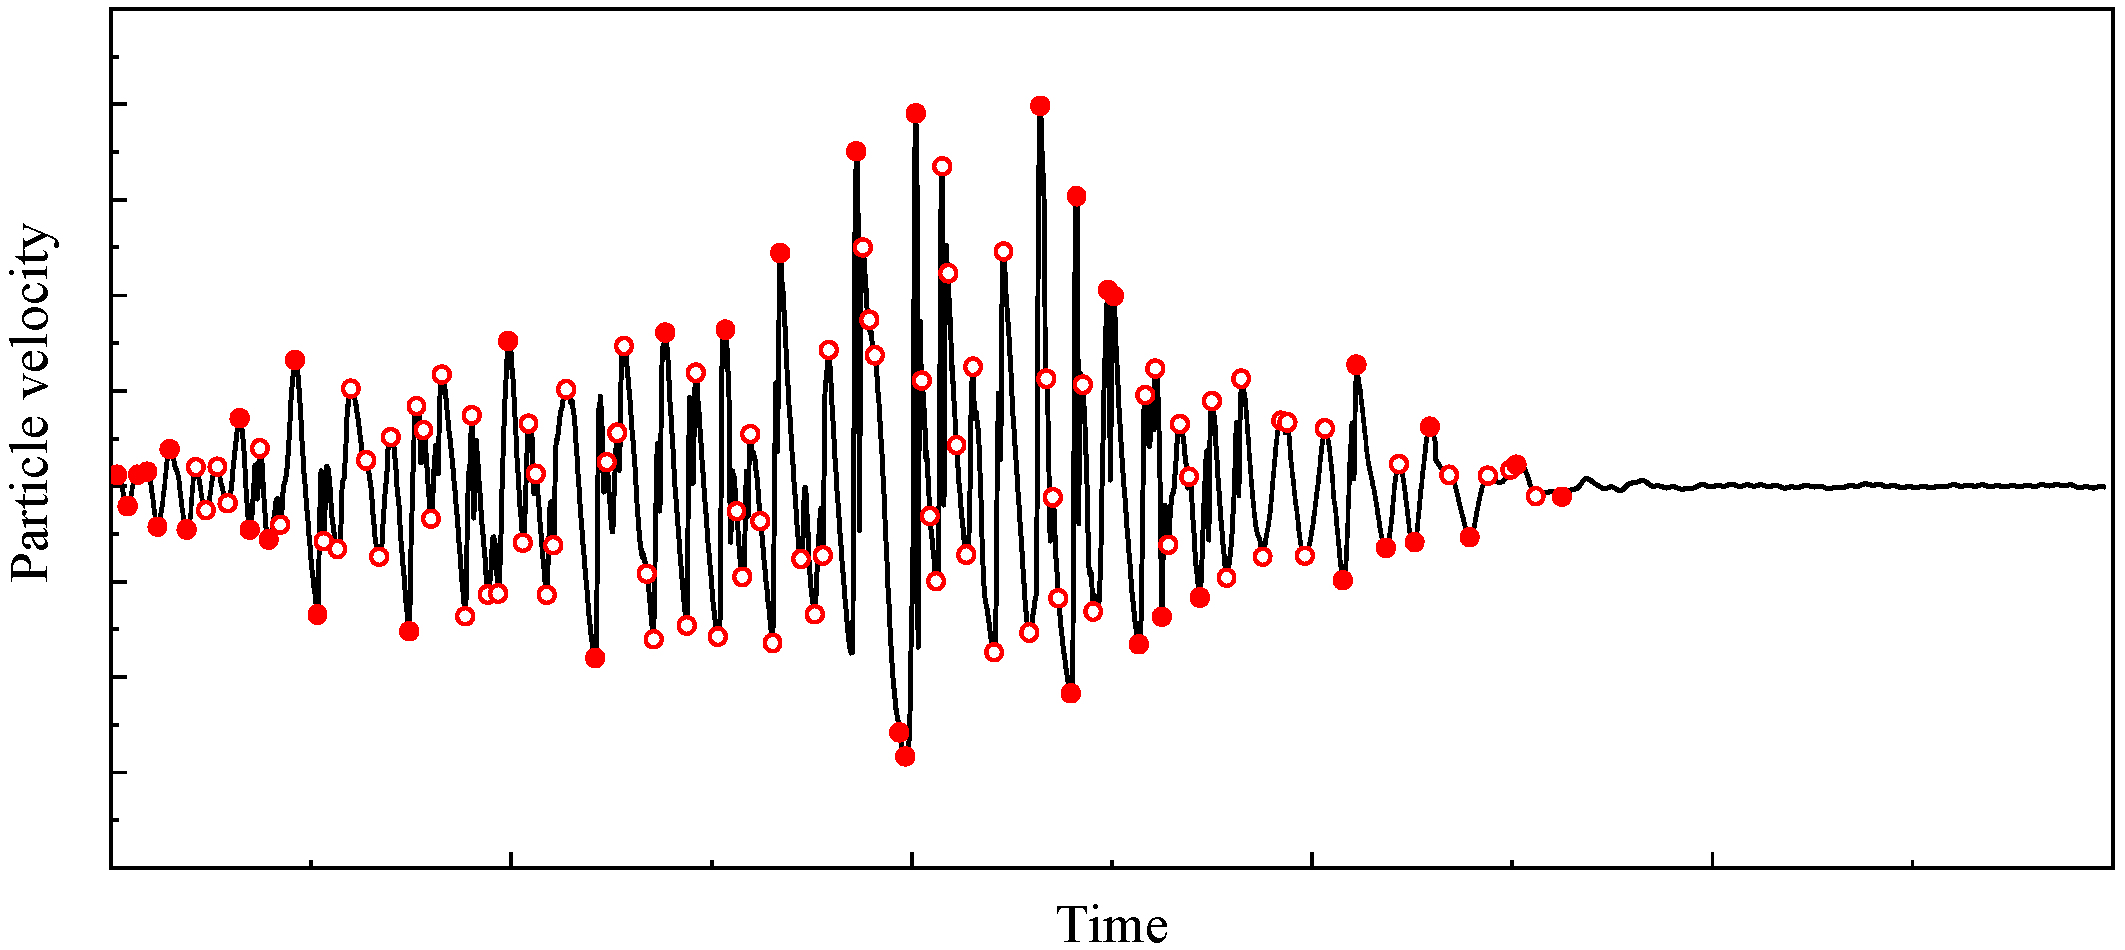
2.1. Incremental Extremum Extraction

2.1.1. Threshold Function

Theoretically, the extreme value of the vibration signal associated with each borehole initiation corresponds to the number of boreholes. However, due to the mutual interference of the stress waves and the influence of the local geological conditions, this is not always the case.
The components of measured vibration signals are complex, and effective vibration signals are intercepted based on the total blasting time provided by the blasting scheme. The invalid extreme value is excluded through the time threshold function, and the function expression is as follows:
v p i = v p x , v py , v pz i t i t b t i > t b
where v p i is the extreme value of vibration signal, cm/s, where i = 1,2,3,…… n; ti represents the time corresponding to v p i , s; and tb is the total delay time of blasting, s.
It is well-known that the higher the particle velocity, the greater the threat to the stability of neighboring structures. The hollow red extreme points in Figure 2 are invalid extreme points. These extreme points are produced as a result of mutual interference between stress waves and the mechanical properties of the propagation medium. In order to eliminate invalid extremum points, only PPV at different distances are obtained, and a gradient extremum tracking method for unsteady vibration signals is proposed.

2.1.2. Incremental Extremum Extraction Algorithm

The increasing extremum extraction method is a monotone increasing value process, wherein the value function is:
v p i = v p 1 i = 1 max v p i , v p i + 1 1 < i n
Similarly, the value of the decreasing process can be regarded as a reverse increasing process, and the value function is:
v p i = v p n i = n max v p i 1 , v p i 1 i n 1
v p i = v p x , v py , v pz i
where n is the number of extreme values. When the particle vibration velocity is negative, we take the absolute value for the vibration velocity value and then calculate according to Equations (2)–(4), Figure 3 illustrates this process.
After importing single-direction blast-induced ground vibration signals into MATLAB, the maximum and minimum values are determined, and invalid extreme values are filtered using the threshold function. Then, Equations (2) and (3) are applied to incrementing values. Finally, increasing extreme values are extracted from signals in each direction, followed by the extraction of the particle velocity vector coordinates at the time of extreme values.
The effective extreme values obtained through the above process are shown in Figure 4.
Figure 4 shows the effective data that can be extracted from the signal, which is characterized by all incremental extremum points. This significantly increases test efficiency and allows for reflection of the vibration intensity characteristics of a single signal. The two broken lines in the figure connect the extreme values of increasing and decreasing, respectively, illustrating the relationship between the strength of blast-induced ground vibration signal changing with time. The relationship between an extreme value and a distance to the blast center can be described after conversion since explosion time and distance to the blast center are essentially corresponding variables.

3. Analysis of Particle Velocity Extremum

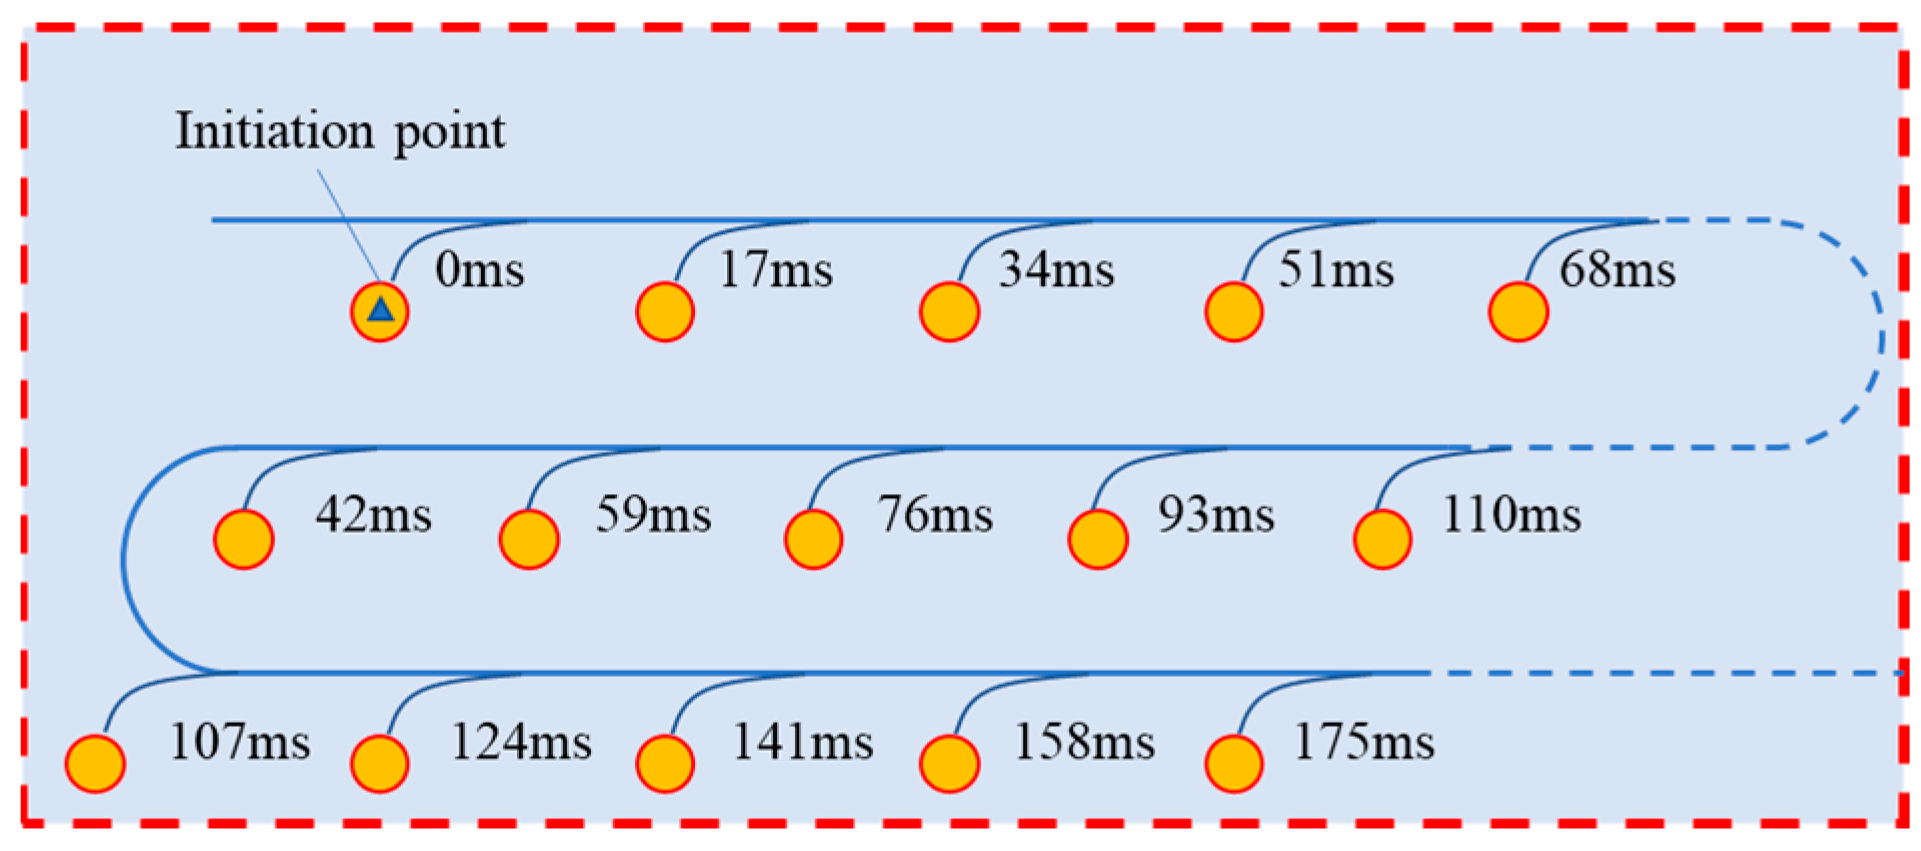
3.1. Site Conditions and Blasting Parameters

The test site is located in the Wujiata open-pit coal mine in Wulan Mulun Town, Ordos City. The rock in the explosion area is silty sandstone; there is no large fault structural plane in the site, and the surface of the mining platform is relatively smooth.
The coal mine uses ammonium nitrate/fuel oil (ANFO) as explosive with a charging weight of 200 kg in each hole. The initiation charge package is 2 kg 2# rock emulsion explosive. The blast hole diameter is 170 mm; the bench height is 16 m, and the hole depth is 18 m. The spacing between adjacent holes is 7 m, whereas the row spacing is 5 m. The intra-row delay time is set as 17 ms, and the inter-row delay time is set as 42 ms and 65 ms. The industrial electronic detonator adopted by the detonator has a high accuracy compared with the blasting detonator, and it is not easy to cause vibration superposition due to the deviation of the detonation time. The schematic diagram of the initiation network is shown in Figure 5.

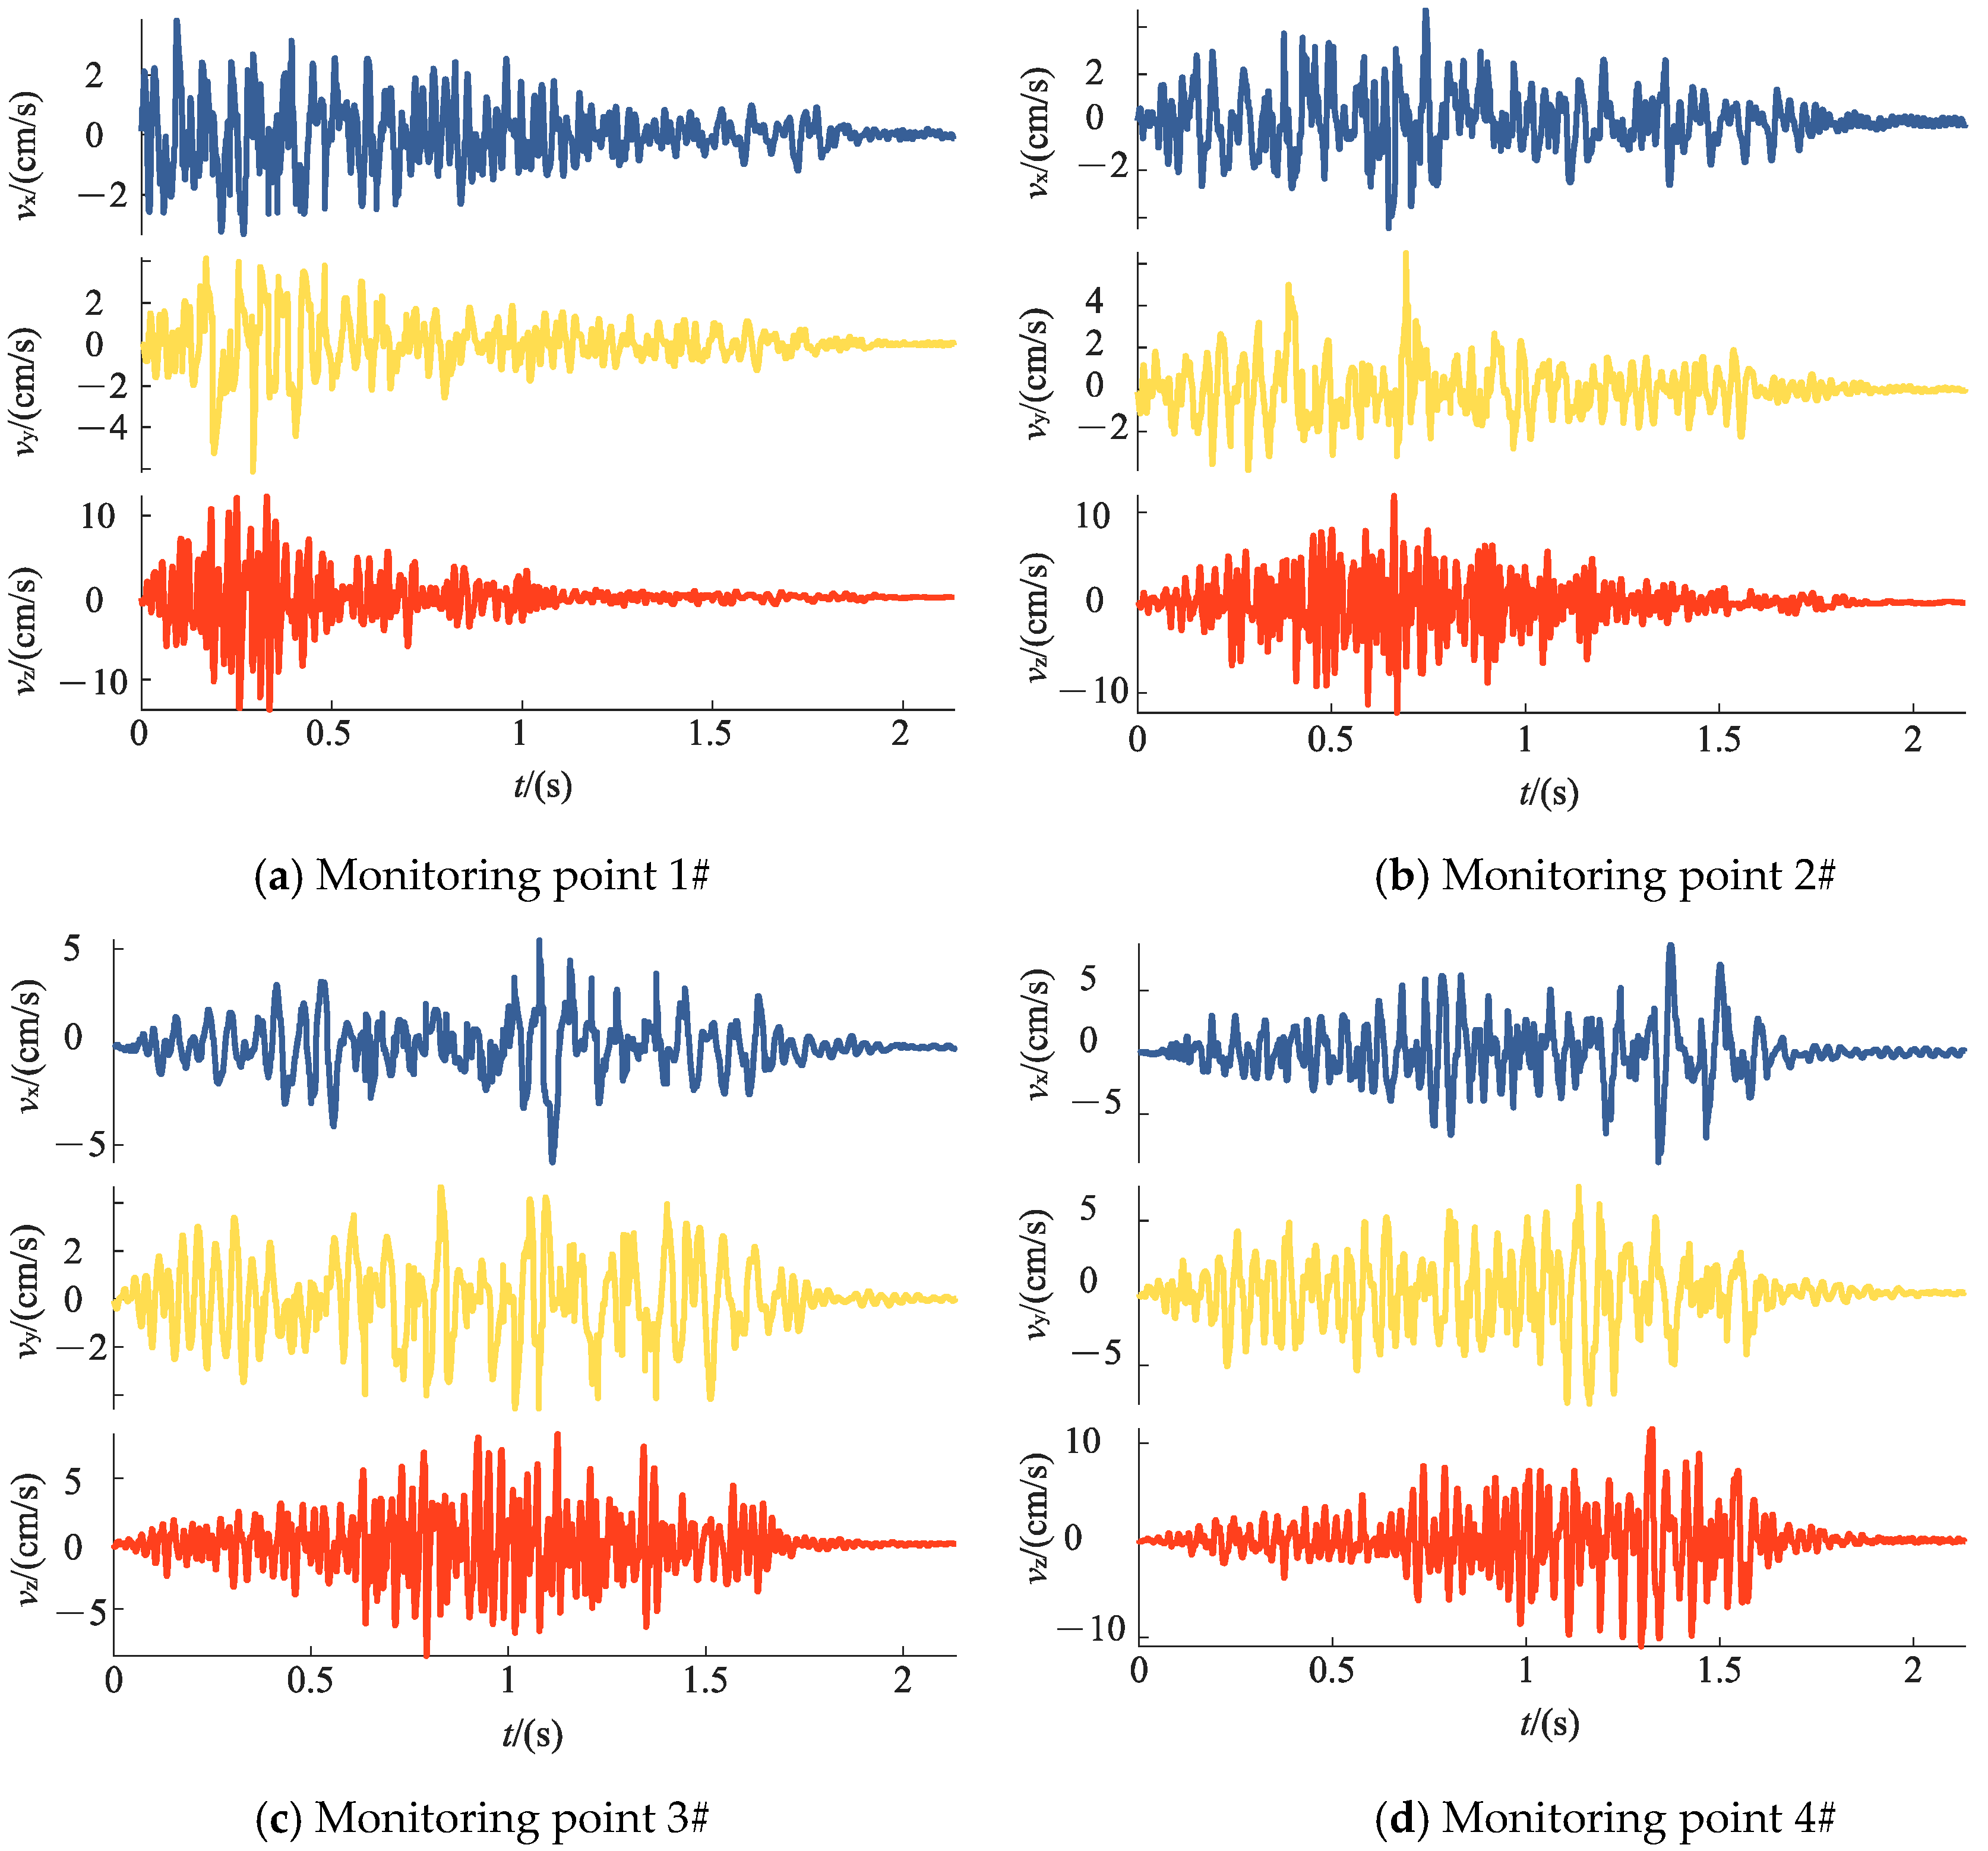
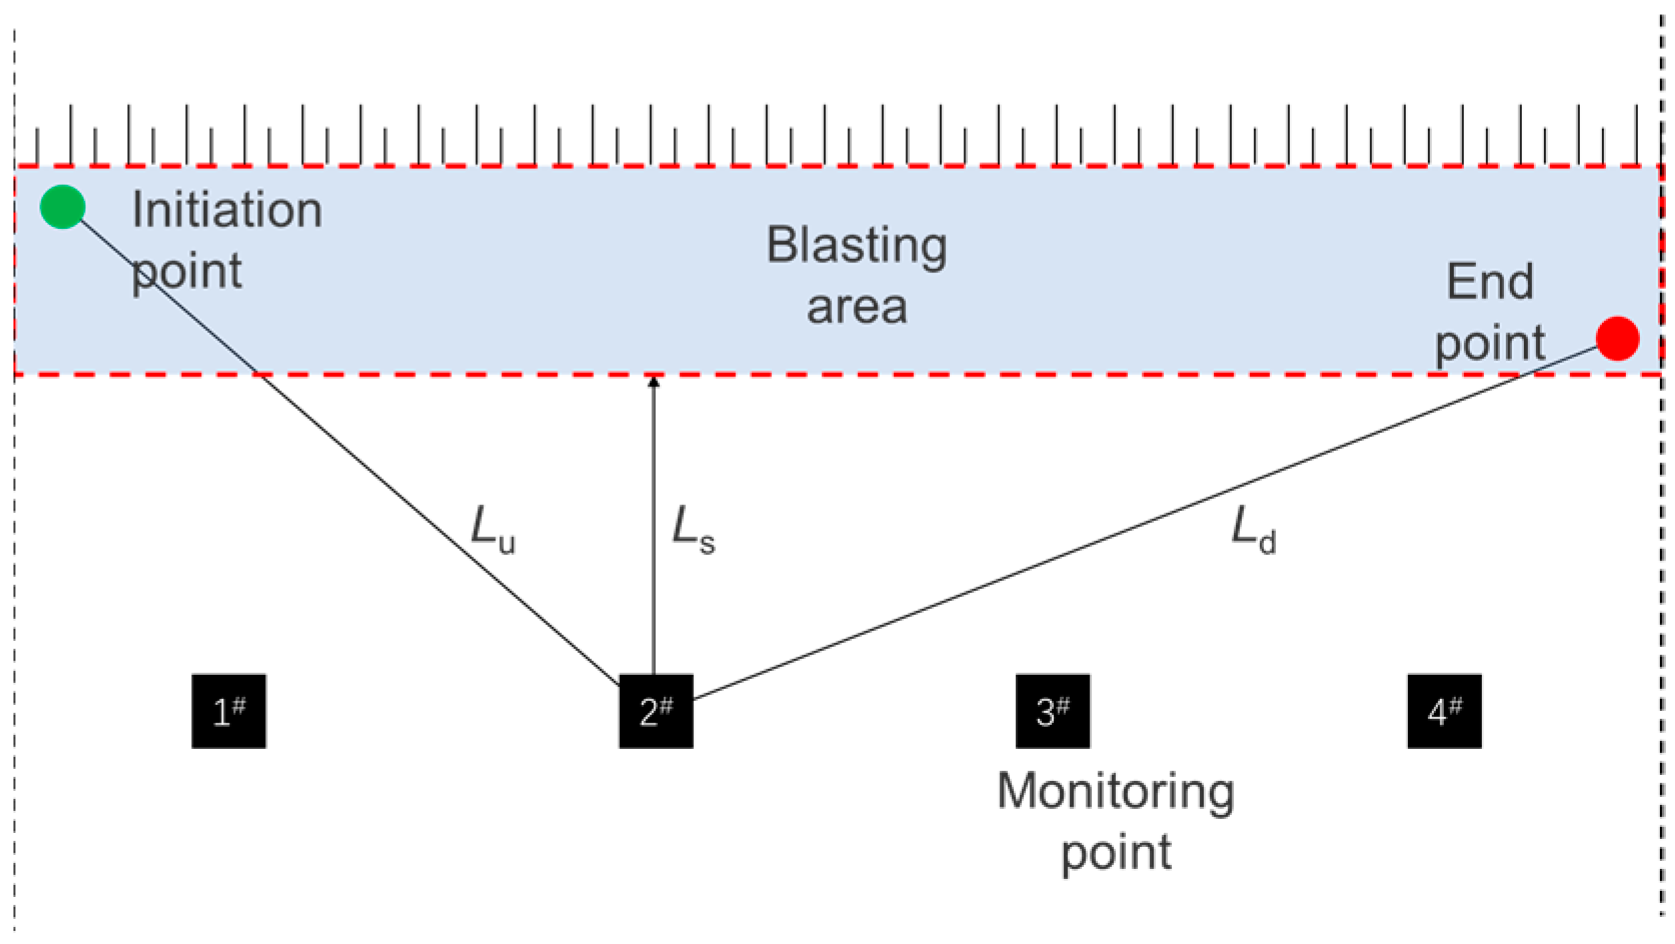
3.2. Ground Vibration Monitoring

In accordance with the site conditions of the open-pit mine, the three-direction vector sensors are arranged in the opposite direction of flyrocks. Figure 6 depicts the vector direction of sensors and the position of the explosion area. The horizontal distance between the monitoring point and the explosion area should be controlled within 30~60 m. However, due to the limitation of site factors on the mining platform, the distance between each monitoring point and the explosion zone is not equal. The positions of monitoring points are shown in Figure 6. Four monitoring points are arranged for each monitoring test.
Lu is the distance between the monitoring point and the initiation point; Ls is the distance between the monitoring point and the nearest point; Ld is the distance between the monitoring point and the end point.
Data are collected twice on-site, and the obtained signals are passed through Equations (2)–(4). After processing, the main information is extracted, as presented in Table 1.
Figure 7 displays the vibration waveforms of 4 monitoring points in 3 directions for Test 1.
Increased extremum has an obvious linear relationship with time in both waveforms with growing and decreasing particle velocity, as can be observed from the distribution pattern of increasing extremum points of waveform and statistics. Based on the spatial relationship between the explosion area and the monitoring point, time can be related to the distance between explosion centers. In other words, it is assumed that the borehole explosion closest to the monitoring point corresponds to the PPVs, whereas the first and last two extreme values of particle velocity correspond to the initiation point and the end point, respectively. The time and distance between explosion centers can be mapped. Using the aforementioned method, data of the maximum values of detonation center distance and increasing particle velocity are collated, and linear fitting is carried out for the maximum values of increasing particle velocity and detonation center distance in the rising section and the attenuation section, respectively. The fitting images of measurement points 1#~4# in Test 1 are shown in Figure 8.
The R2 in the Z direction is the highest among the three directions, with a value greater than 0.75. The correlation is the highest among all three directions, indicating that data in the Z direction has the strongest regularity, and the attenuation propagation of particle velocity at the surface is relatively stable. The R2 of the measurement point 1# in the horizontal direction is found to be 0.444 and 0.450 in two tests. The vibration of the particle in the horizontal direction is severely restricted, affecting the stability of propagation.
As can be seen in Figure 8, when the single hole charge quantity is constant, the extreme value of particle velocity has a linear relationship with the distance to the center of the explosion, which seems to be inconsistent with the attenuation law of PPV. This is exactly when the analysis object is the extreme value of particle vibration velocity and the distance between explosion centers, and the analysis object is the vibration signal of a single monitoring point, which is different from the PPV of single-hole blasting or hole-by-hole initiation. The slope of the fitting straight line corresponding to the growing segment and the weakening segment of the vibration signal changes when the distance between the monitoring point and the detonation point varies. Sadovsky’s equation, which is based on the premise of a single blasting unit or mutually non-interfering blasting units, discusses the superposition effect of different blasting units on the surrounding medium when multiple holes are blasted. This form of superposition effect is highly complex in the rock–soil medium. Therefore, after carefully observing and monitoring the waveform of the signal, the increasing extrema in the signal can be obtained and arranged according to the regularity of different distances, which is closer to a linear relationship. This is indeed inconsistent with the attenuation law of PPV between different distance measurement points, which is also the intrinsic law of single signal elucidated in the article. In addition, Sadovsky’s equation and similar nonlinear equations used in deep-hole blasting vibration fitting analysis are different from the data used in this paper. Sadovsky’s equation uses the peak value of the signal, which is generated by the superposition of multiple holes after blasting. Different measurement points will produce similar superposition effects, but the generation of internal extrema of a single signal is affected by the number of holes close to the blasting direction and blasting time. This is the superimposed effect of multi-row hole-by-hole blasting scheme, whereas the effect of single-row hole-by-hole blasting is not significant. The fitted results show that there is a high linear correlation between incremental extreme values and distance. However, this does not indicate a linear relationship between the amount of explosive charge at each delay time and the particle vibration velocity. In reality, due to the fixed direction of the vibration sensor, the components of the distance between different boreholes and measurement points in the three directions of XYZ are nonlinearly changing. This is the hidden nonlinear relationship. If the size of the blasting area is relatively small compared to the testing distance and the blasting direction of different boreholes is approximately the same as that of the sensor, it is reasonable that the incremental extreme value of a single signal shows a nonlinear relationship with distance.
Monitoring point 2# is located between the middle and back of the explosion zone, L1L2. The two fitting lines are approximately parallel, but the fitting line of the increasing segment is slightly higher than that of the weakening segment. When the initiation hole gets gradually closer to the monitoring site, a growing signal is produced, and when it is farther away from the monitoring point, a weakening signal is observed. The corresponding monitoring point of the increasing signal is in the isochron propagation direction, and the particle velocity is high. The angle between the two lines decreases initially before growing as the slope of the increasing segment gradually decreases and the slope of the fitting line of the weakening segment increases.
The slope of the fitting line can reflect the decay rate of particle velocity extremum with the increase in the distance from the blast center. According to the data presented in Table 2, it can be noted that slope a in the Z direction is larger than that in the X and Y directions, but there is little difference between the X and Y directions. After calculation and comparison, it is found that a in the Z direction is 1.3~4.3 times that in the X direction (ignoring the increasing segment of measurement point 1# in Test 1; slope a in the Z direction is 12.7 times that in the X direction, which is abnormal data). The value of a in the Z direction is 1.3~2.8 times that in the Y direction, and most of the ratio is about 2 times.

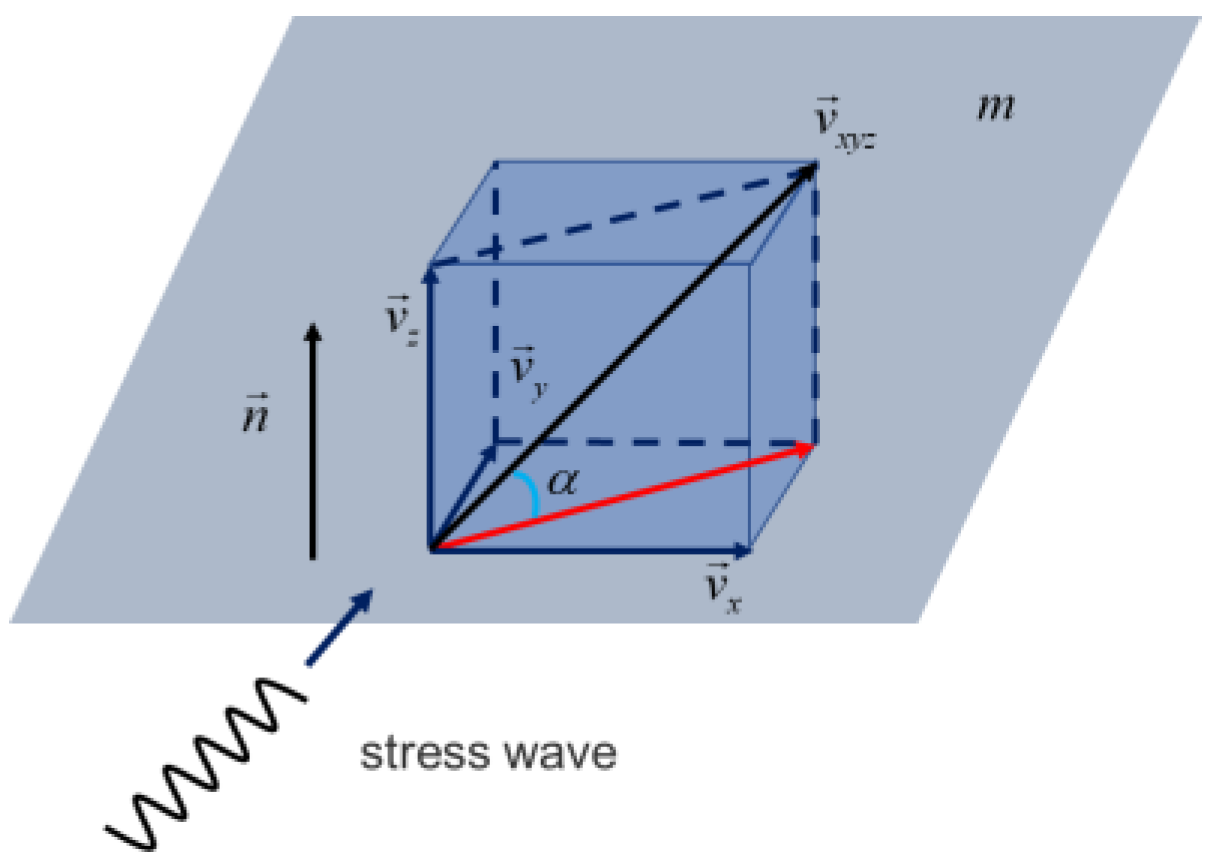
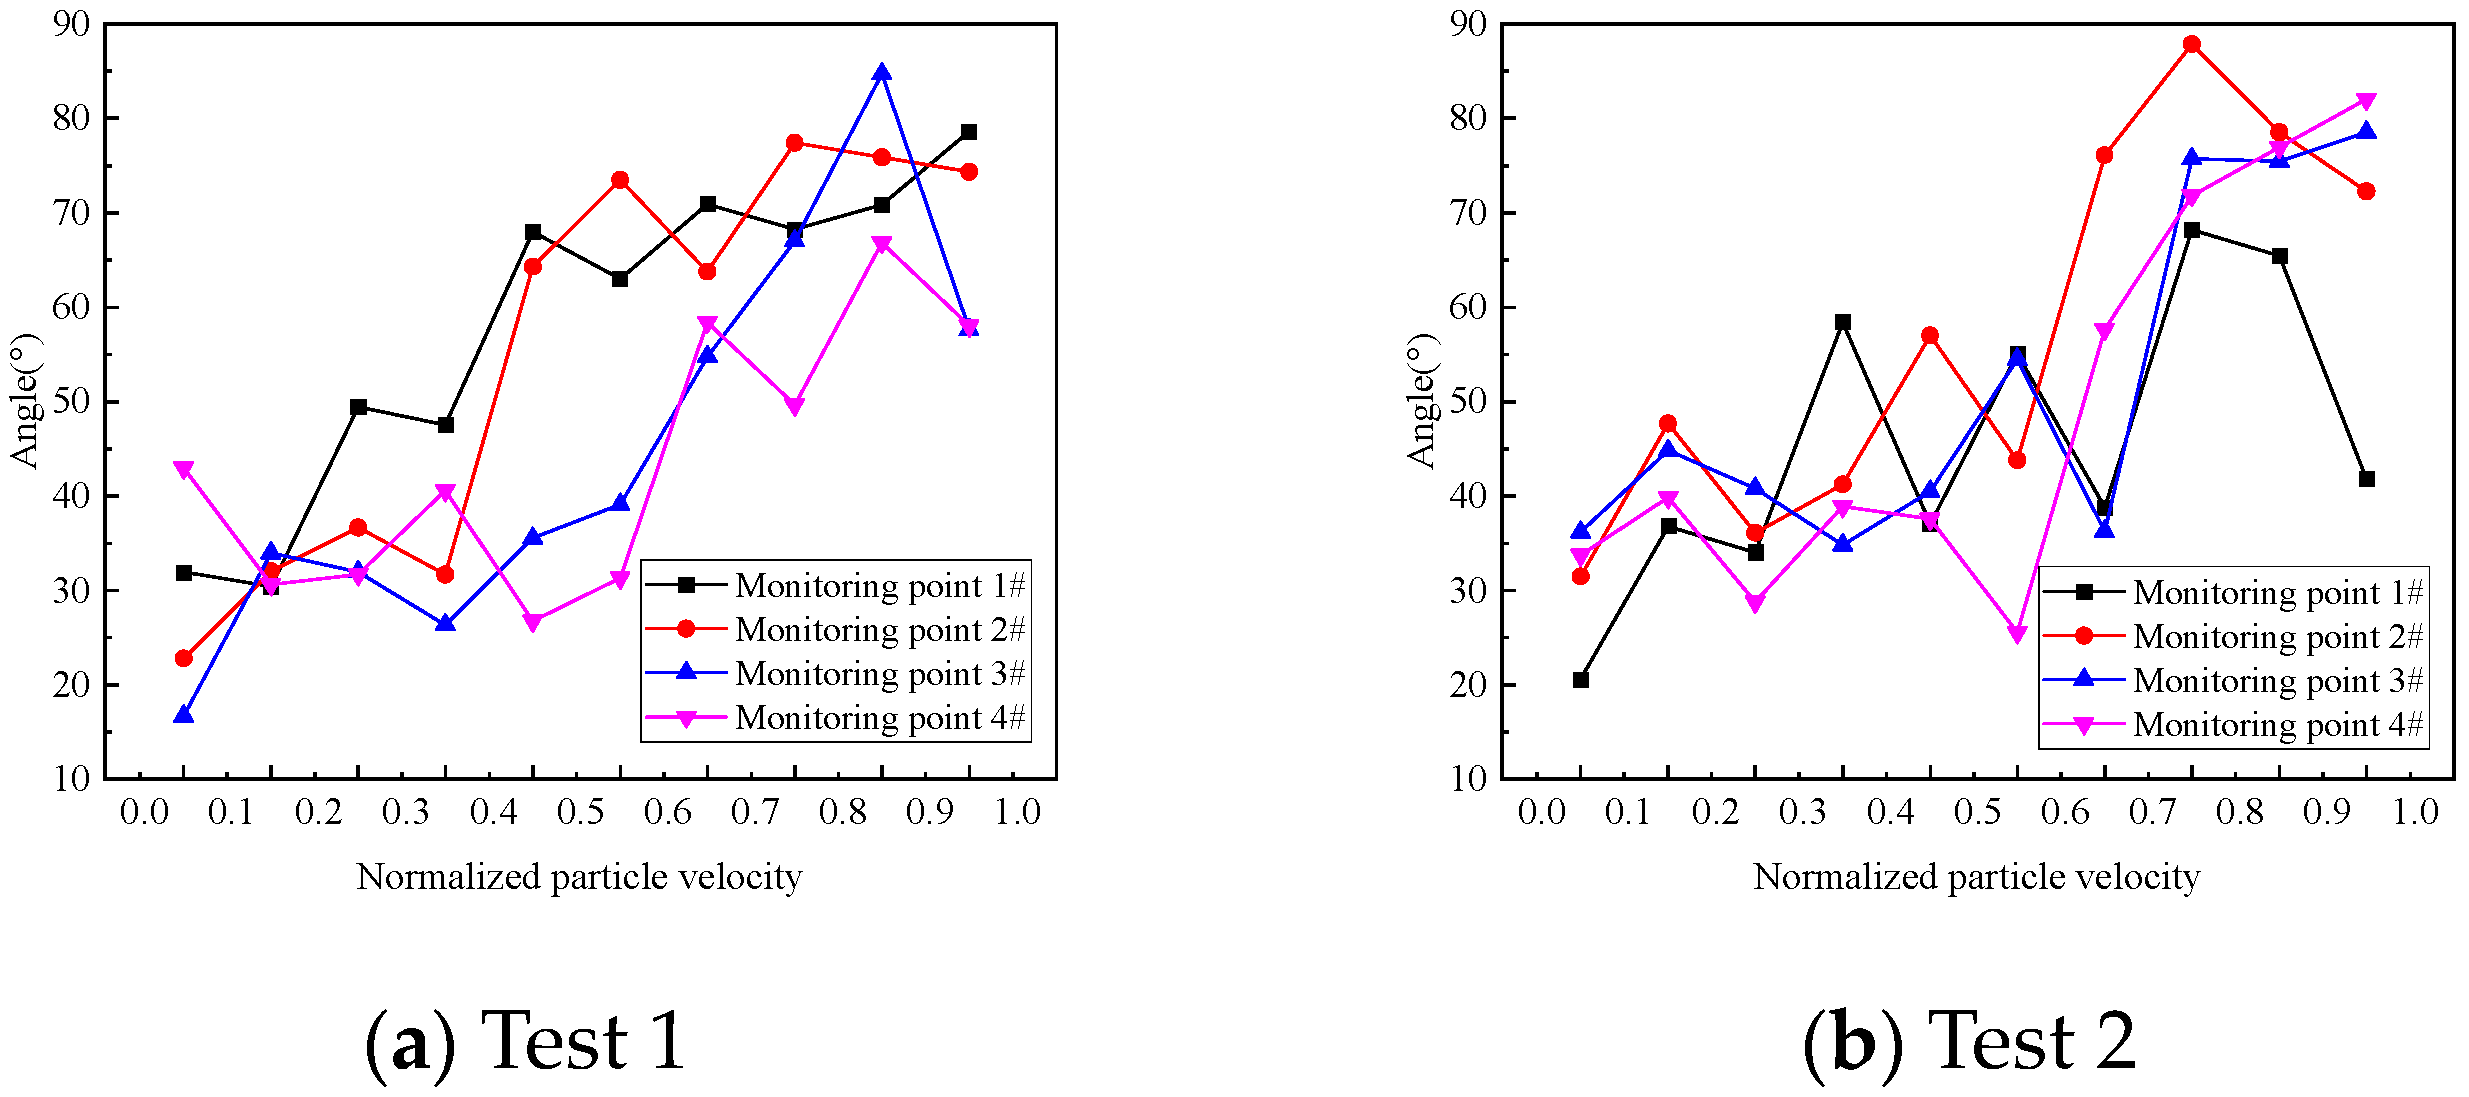
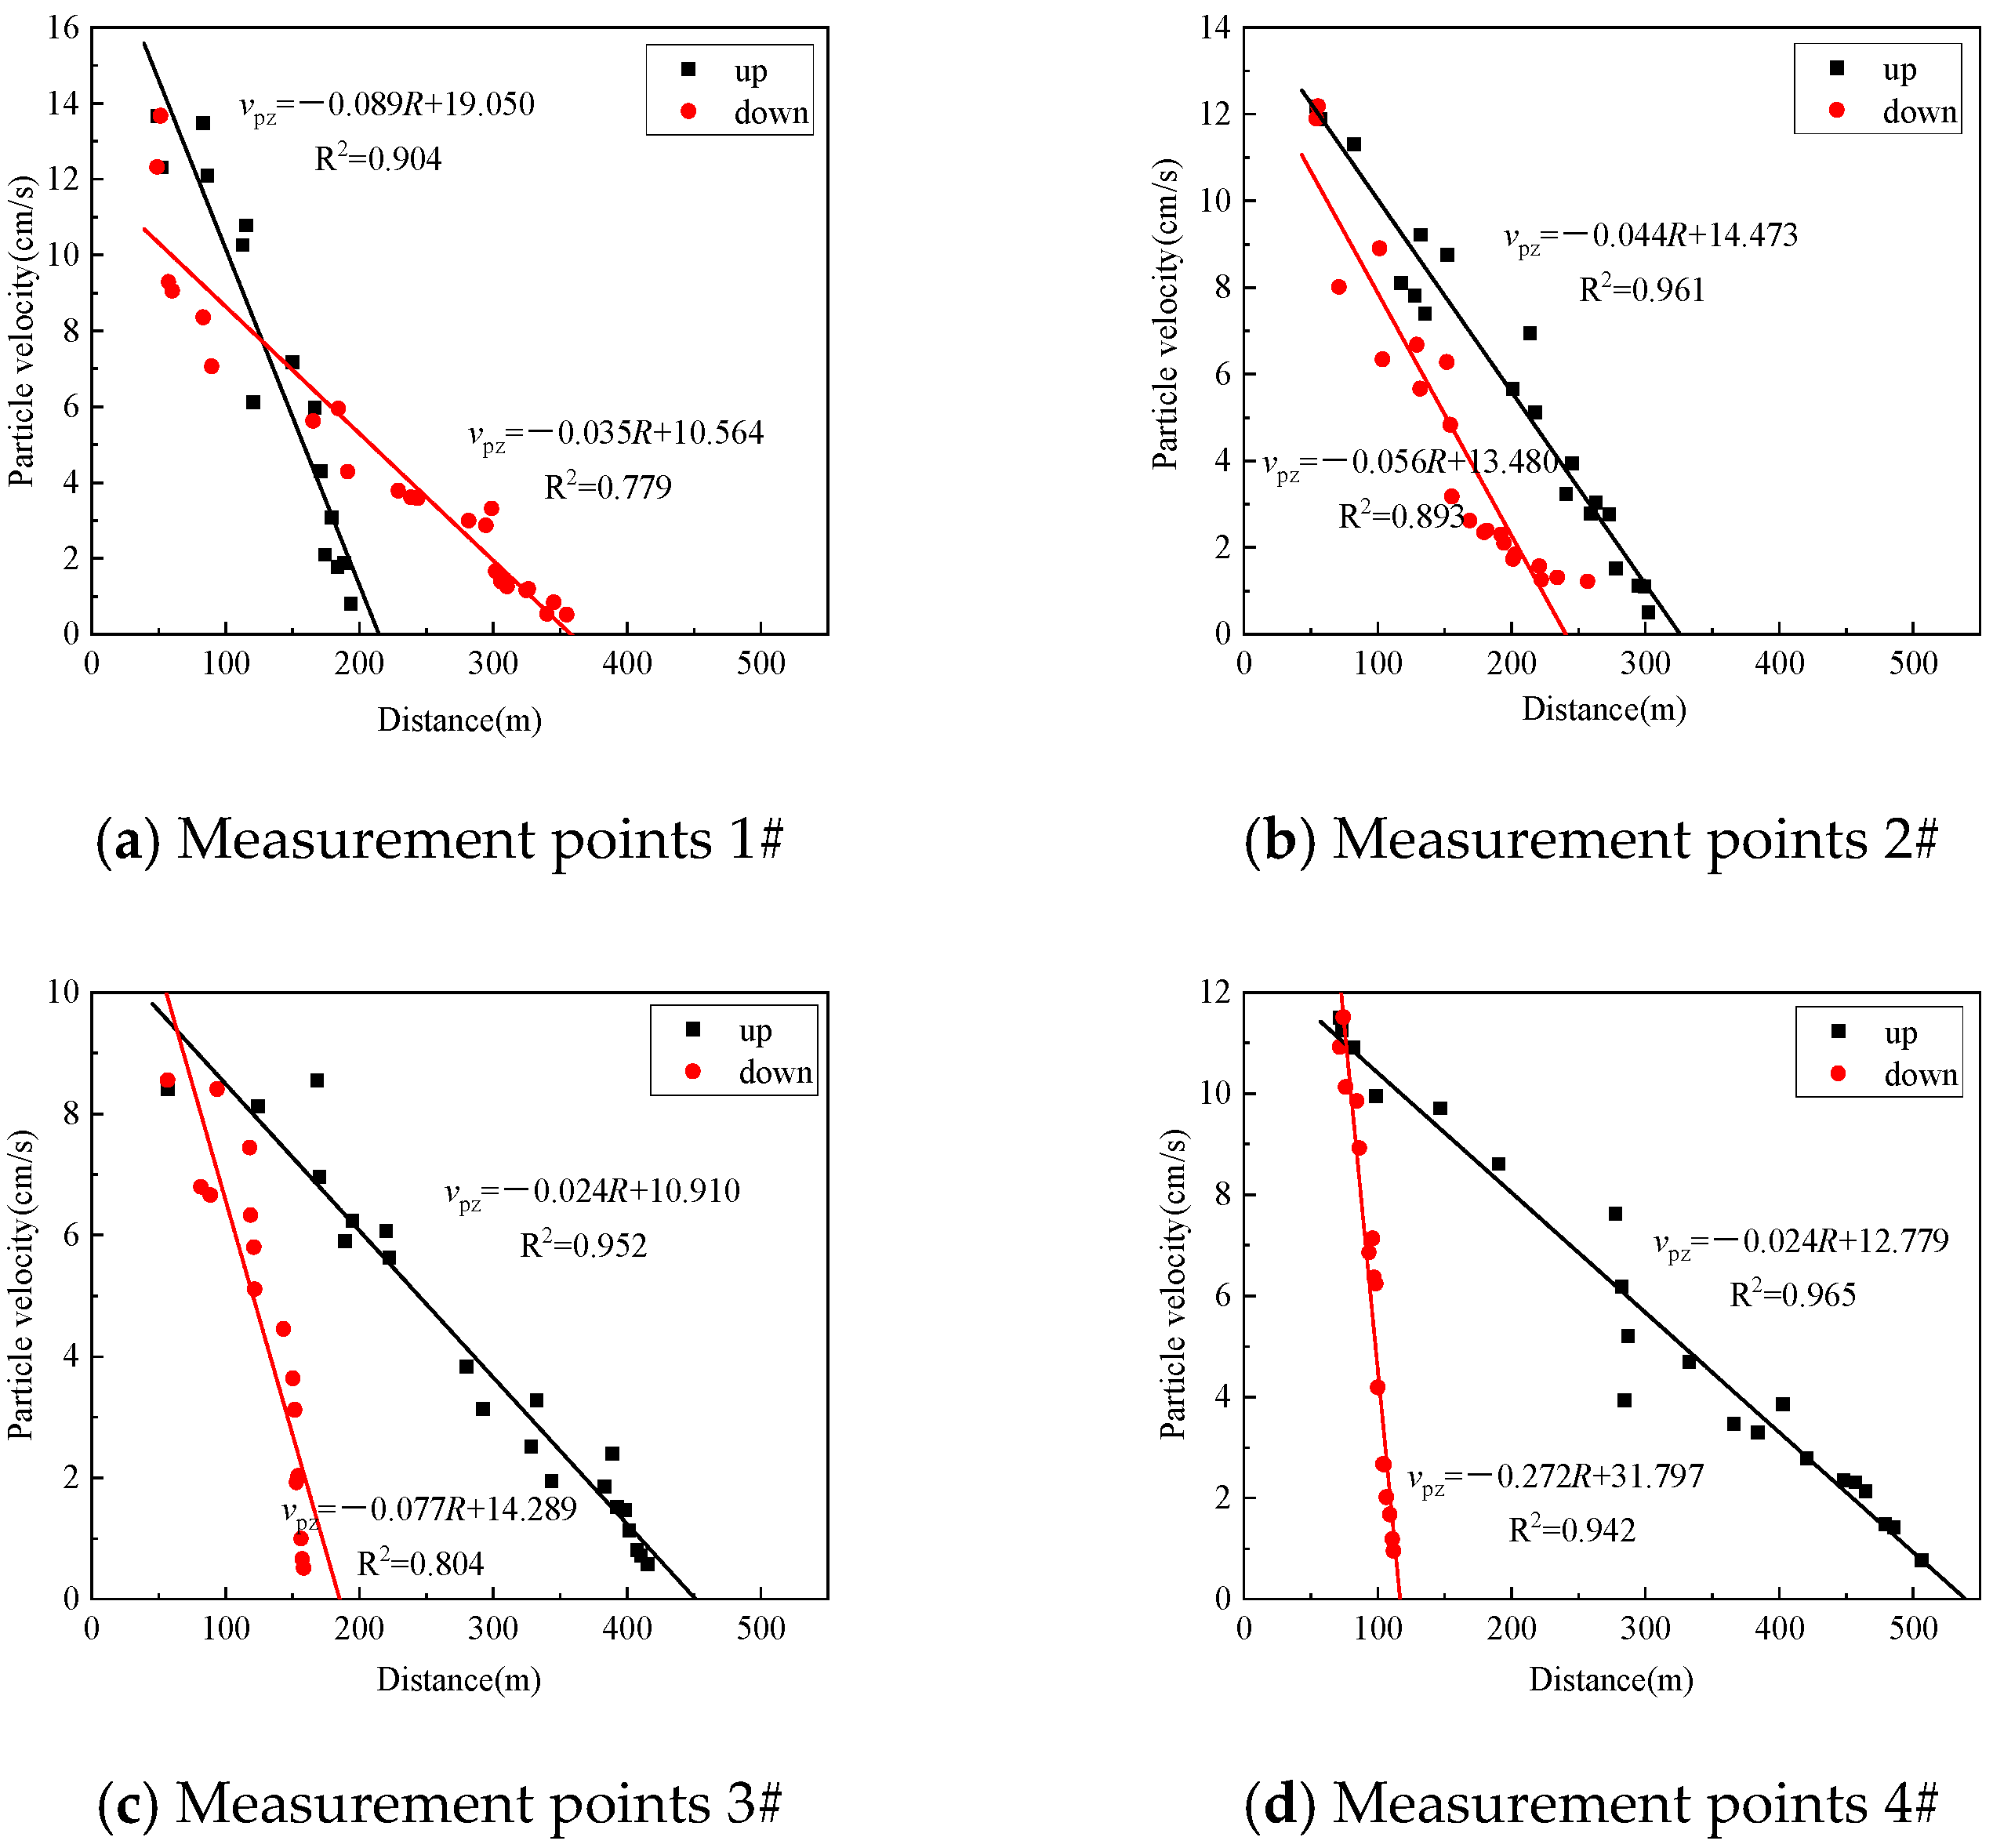
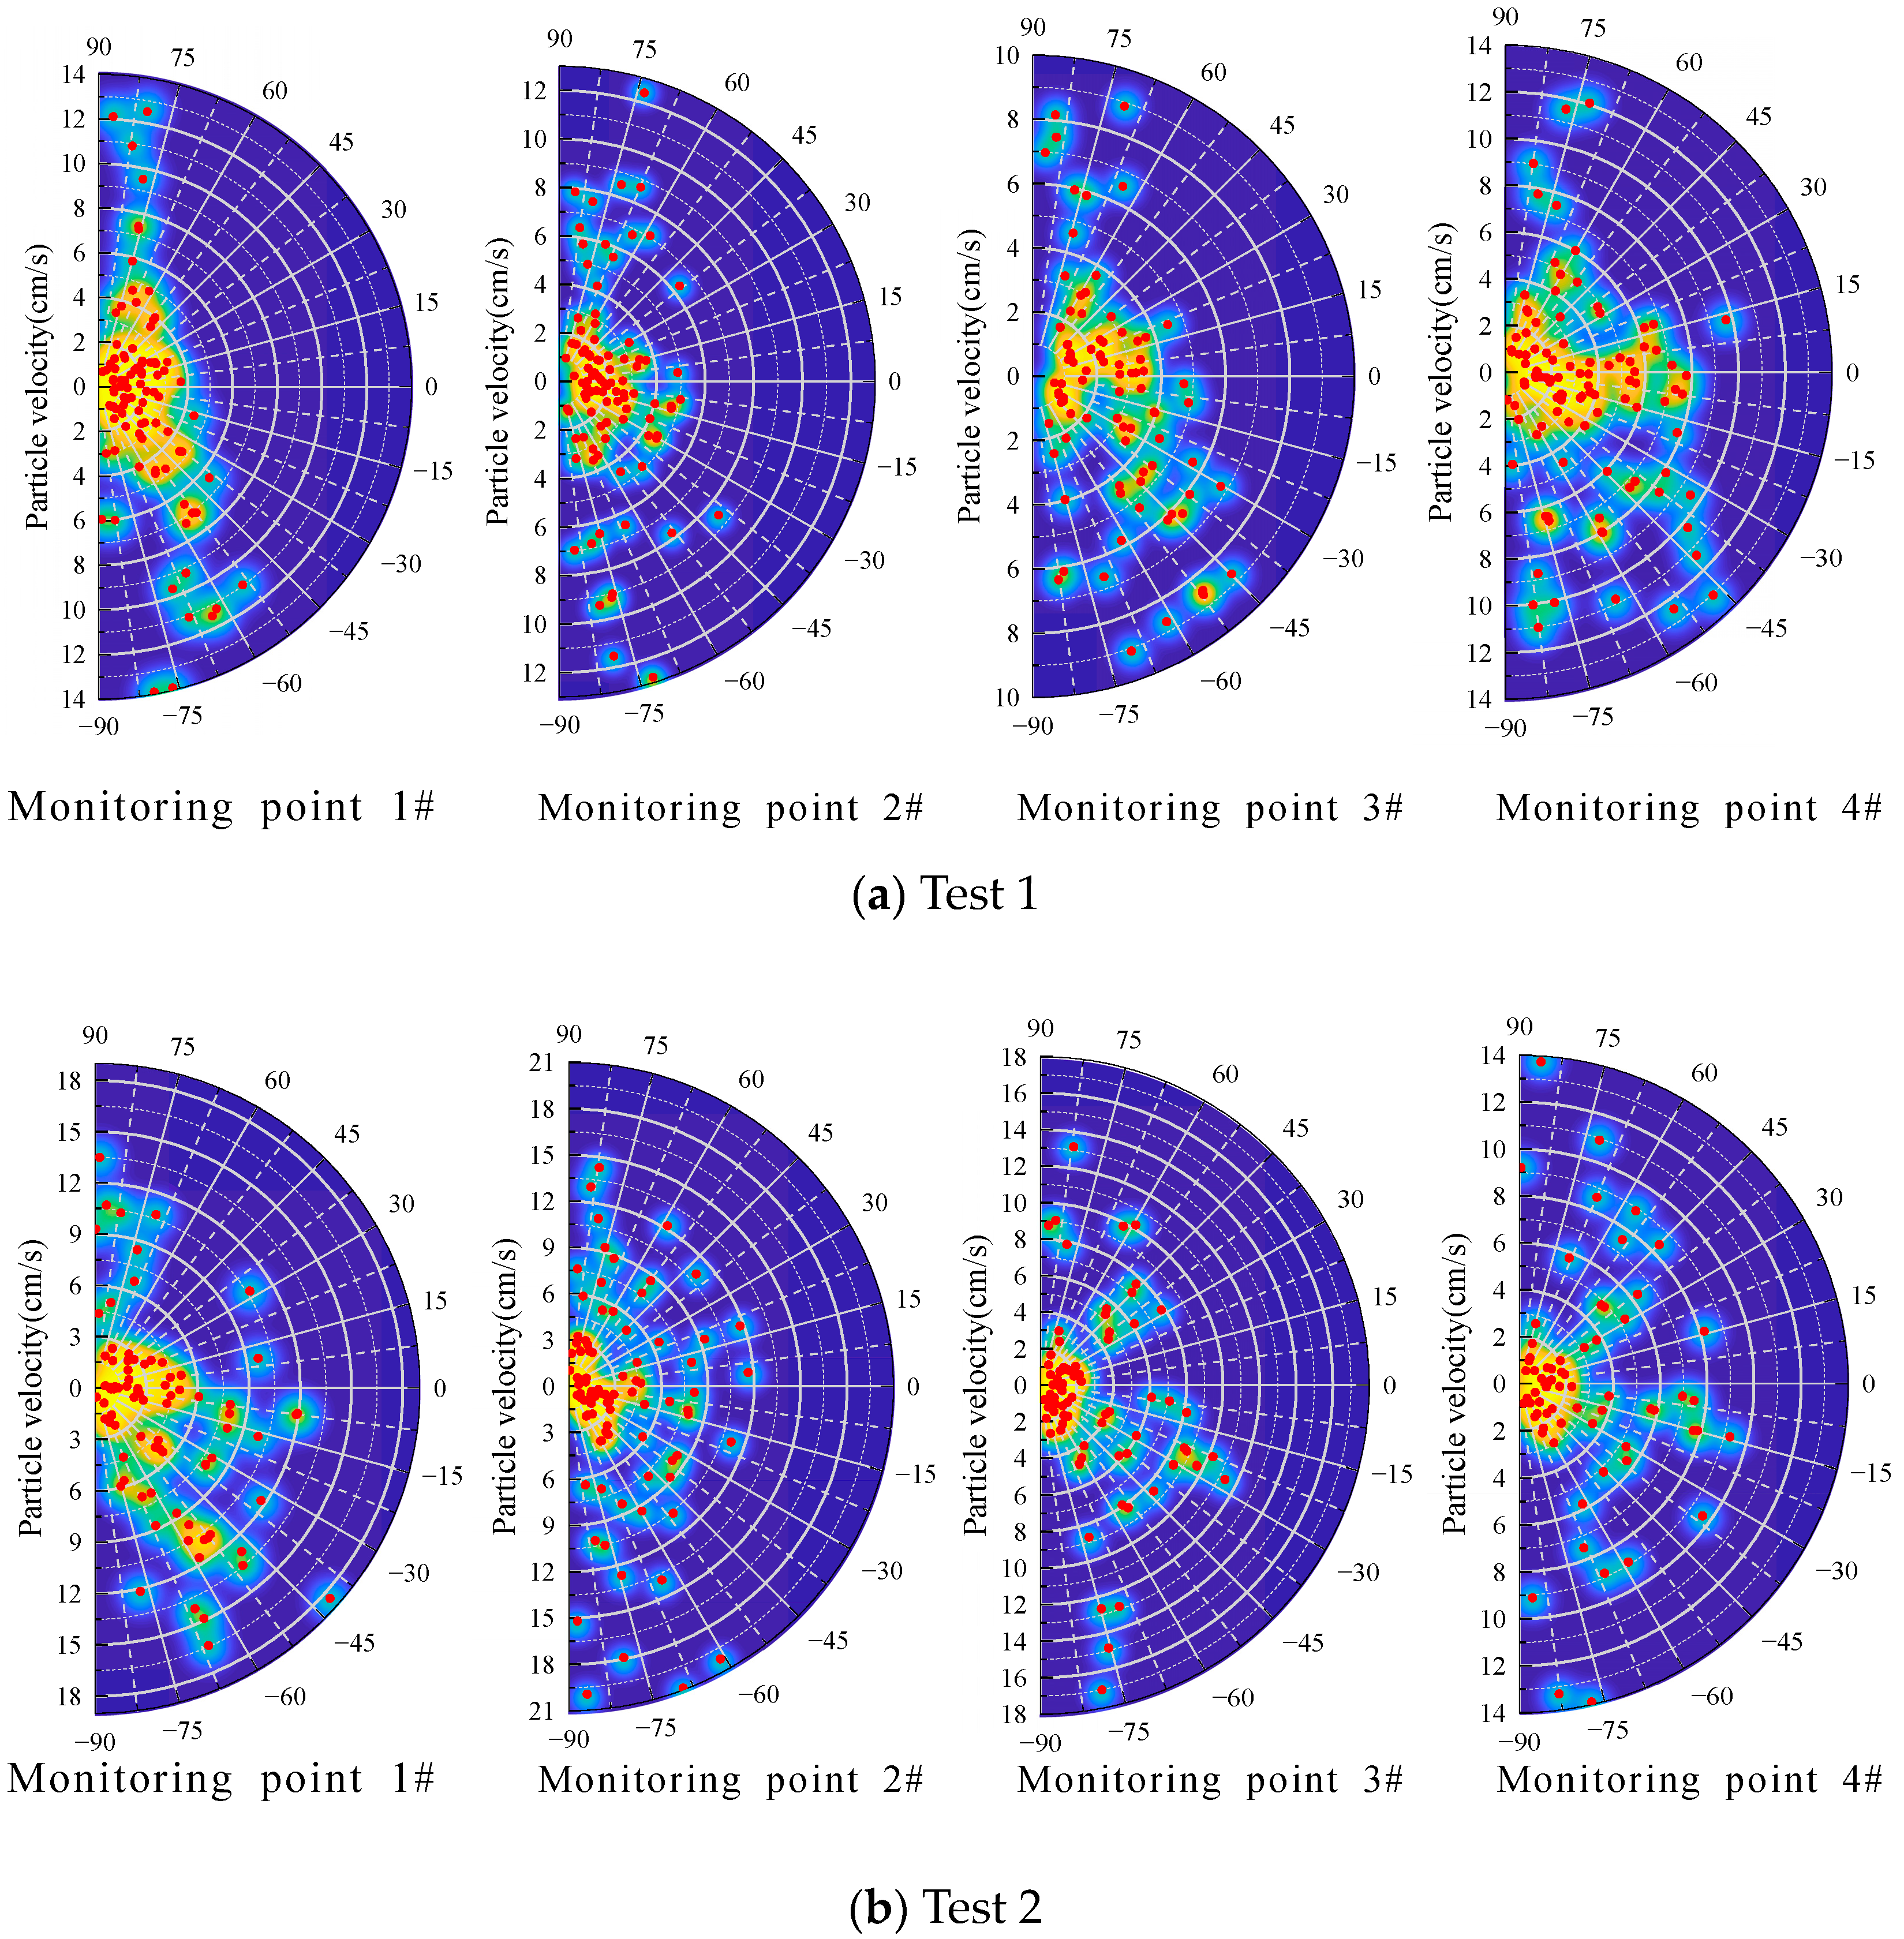
3.3. Surface Particle Velocity Vector Analysis

The stress wave generated by the explosion spreads to the surface through rock mass, causing surface vibration. The cube in Figure 9 represents the vibration sensor, and the m plane represents the surface plane where the measurement point is located. The disturbance of the stress wave can be recorded using a vibration sensor. The recorded data are the particle velocity vectors of the particle in three directions at each time. Assuming that the particle velocity vectors corresponding to the extreme value of the signal in any direction are v x , v y , and v z , the sum of the three vectors is the resultant velocity vector v x y z .
The particle velocity is a three-dimensional space vector and forms a certain angle with the ground plane. Suppose the angle is α, when v x = v y = v z , α = 35.3°. The quantity value of the vector sum is v x y z . The ground plane is taken as the reference plane, and n is the normal vector of the m plane. Herein, n = (0,0,1) is calculated. The included angle between the direction of the grain center pointing towards the monitoring point and ground surface is β.
The extreme value of particle velocity obtained by solving Equation (4) represents the blast-induced ground vibration intensity. The v x y z α images are drawn. Figure 10 shows the vector of particle velocity at the extreme point and the scatter point thermal diagram at the angle included with the ground plane of the measurement points 1#~4# in the second test, that is, the distribution of the extreme value of v x y z in the v x y z α plane.
The closer α is to the ±90° axis, the more dominant v z becomes in the 3 directions. Hotspot maps are drawn on a semicircle plane of polar coordinates based on the dispersion distribution of particle velocity extremum, and then the distribution characteristics of particle velocity extremum are analyzed. The thermal diagram shows that the scatter points near the origin are randomly distributed on the angle interval, while the scatter points near the edge of the arc are more in the large angle interval, resulting in the overall distribution of the image strip.
The scatter points of each image are distributed in the interval of (−90°, 90°), wherein the negative angle represents the downward direction of the particle velocity vector. Analyzing Figure 10 shows that scatter points are radially distributed in the interval of (−90°, 90°). The scatter points are concentrated in a smaller range of v x y z . With the increase in particle velocity, the scatter points become gradually sparse. In the larger range of v x y z , the scatter points are more distributed in the larger range of α. The larger the angle between the v x y z vector direction and the ground plane, the more dominant v z is in the particle velocity in the three directions. Furthermore, the size of v x y z is related to the distance from the explosion center to the monitoring point. The smaller the distance from the explosion center, the larger the v x y z is. It can be seen that the surface vibration in three directions caused by a close-in deep-hole explosion has a particle velocity in the vertical direction that is noticeably higher than that in the horizontal direction. Further analysis of the local scatter distribution image, that is, the scatter distribution with smaller v x y z , which corresponds to a larger distance from the blast center, as can be seen from the image on the right of each figure, the distribution of scatter points in the fan-shaped domain of (−90°, 90°) has no discernable rule, exhibiting a disorderly random distribution on the whole. Therefore, when the distance from the blast center is large, the included angle α between the v x y z vector direction and the ground plane is approximately evenly distributed in the whole region. The particle velocity vector direction is random, indicating that the particle velocity in the three directions (X, Y, and Z) has no absolute advantage.
Observing the axial direction of particle velocity increasing from the origin along the hotspot graph pole, it can be seen that scatter points are distributed in the range of 0°~75° in the small region of particle velocity. However, the distribution in the range of 75°~90° is small, whereas the distribution in the range of 0°~45° is large. This indicates that the advantage of v z in the three directions is not obvious in the position with a large distance from the blast center, and the combined velocity of v x and v y is greater than v z . Further outward observation shows that the scatter points distribution in the particle velocity interval is different when the particle velocity increases. The distribution is unstable throughout a wide range of α, with a high proportion of small included angle, high proportion of large included angle, and an even distribution. The distribution of scatter points near the outside of the circle is absolutely dominant in the range greater than 45°. Herein, the distance from the explosion center is small, and v z is the largest in the three directions.
As well-established, when an explosive explosion occurs inside a rock, the energy it produces diffuses outward to create stress waves, which are accompanied by energy attenuation in the process of diffusion and propagation in the rock medium. Based on the above statistical analysis and in combination with the principle of explosive detonation and stress wave propagation, it can be seen that the explosion energy is more obviously transferred to the side of the free surface. Therefore, the free surface area near the explosion center fluctuates greatly in the vertical direction for the form of the upward output of the deep-hole explosion energy. With the increase in the distance between the blast hole and the monitoring point, the vibration energy is continuously redistributed in the rock mass, and the particle velocity tends to decrease steadily in dynamic equilibrium. Therefore, in the absence of other external factors, such as topographic relief, lithology change, or medium discontinuity, the particle velocity cannot form an advantage in any direction.
Thus, as the distance increases, the attenuation degree of surface particle velocity varies inconsistently in different directions. The fundamental reason is that the particle velocities in different directions are redistributed during propagation.
The scatter distribution in Figure 10 is statistically analyzed, v x y z is normalized, and the maximum value of v x y z in each set of data is set as one.
v N = v x y z v m
where v N is the normalized particle velocity, cm/s; and v m is the maximum value of the sum of particle velocity vectors, cm/s.
The normalized v N is evenly divided into 10 intervals, and the average value of the scatter α component in each interval is calculated. The mean α value of the extreme particle velocity scatter point in different normalized particle velocity intervals is shown in Figure 11.
As can be seen from Figure 11, with the increase in the normalized particle velocity, the overall α increases. The α is mainly distributed in the range of 30°~40° for the segment with small normalized particle velocity and in the range of 60°~90° for the segment with small normalized particle velocity. This increase and change are related to vibration intensity, indicating that the particle vibration direction has a larger angle with the ground when the distance from the deep-hole blasting to the surface is closer to the explosion zone. Therefore, when nearby buildings are subjected to this kind of vibration, the vertical fluctuation is large, accompanied by tilting vibration, which adversely affects the stability of the structure.
Cylindrical charge initiation transmits energy in the form of P and S waves inside the rock mass and generates R waves on the surface [23]. It can be seen from the waveform diagram of measured signals that the vibration of group hole blasting is complicated, and it is difficult to determine the waveform component at a certain time by using the method in the reference [23]. P waves are known to be expansion and contraction waves generated by the extrusion of rock by explosive products, and the angle β approximately reflects the action direction of P waves on the surface. It can be seen from Section 3.1 that the distribution range of β is 1.3°~17.2° and the included angle α between the particle velocity vector and the surface in Figure 11 is 16.7°~87.9°. There is an apparent difference between them, indicating that the P wave is not dominant among the three types of surface vibration. It is common knowledge that the R wave decays rapidly. The analysis results of the extreme attenuation law of particle velocity presented in Section 3.2 show that the particle velocity in the Z direction is the fastest, which reflects that the R wave occupies a large proportion of the vibration in the Z direction.

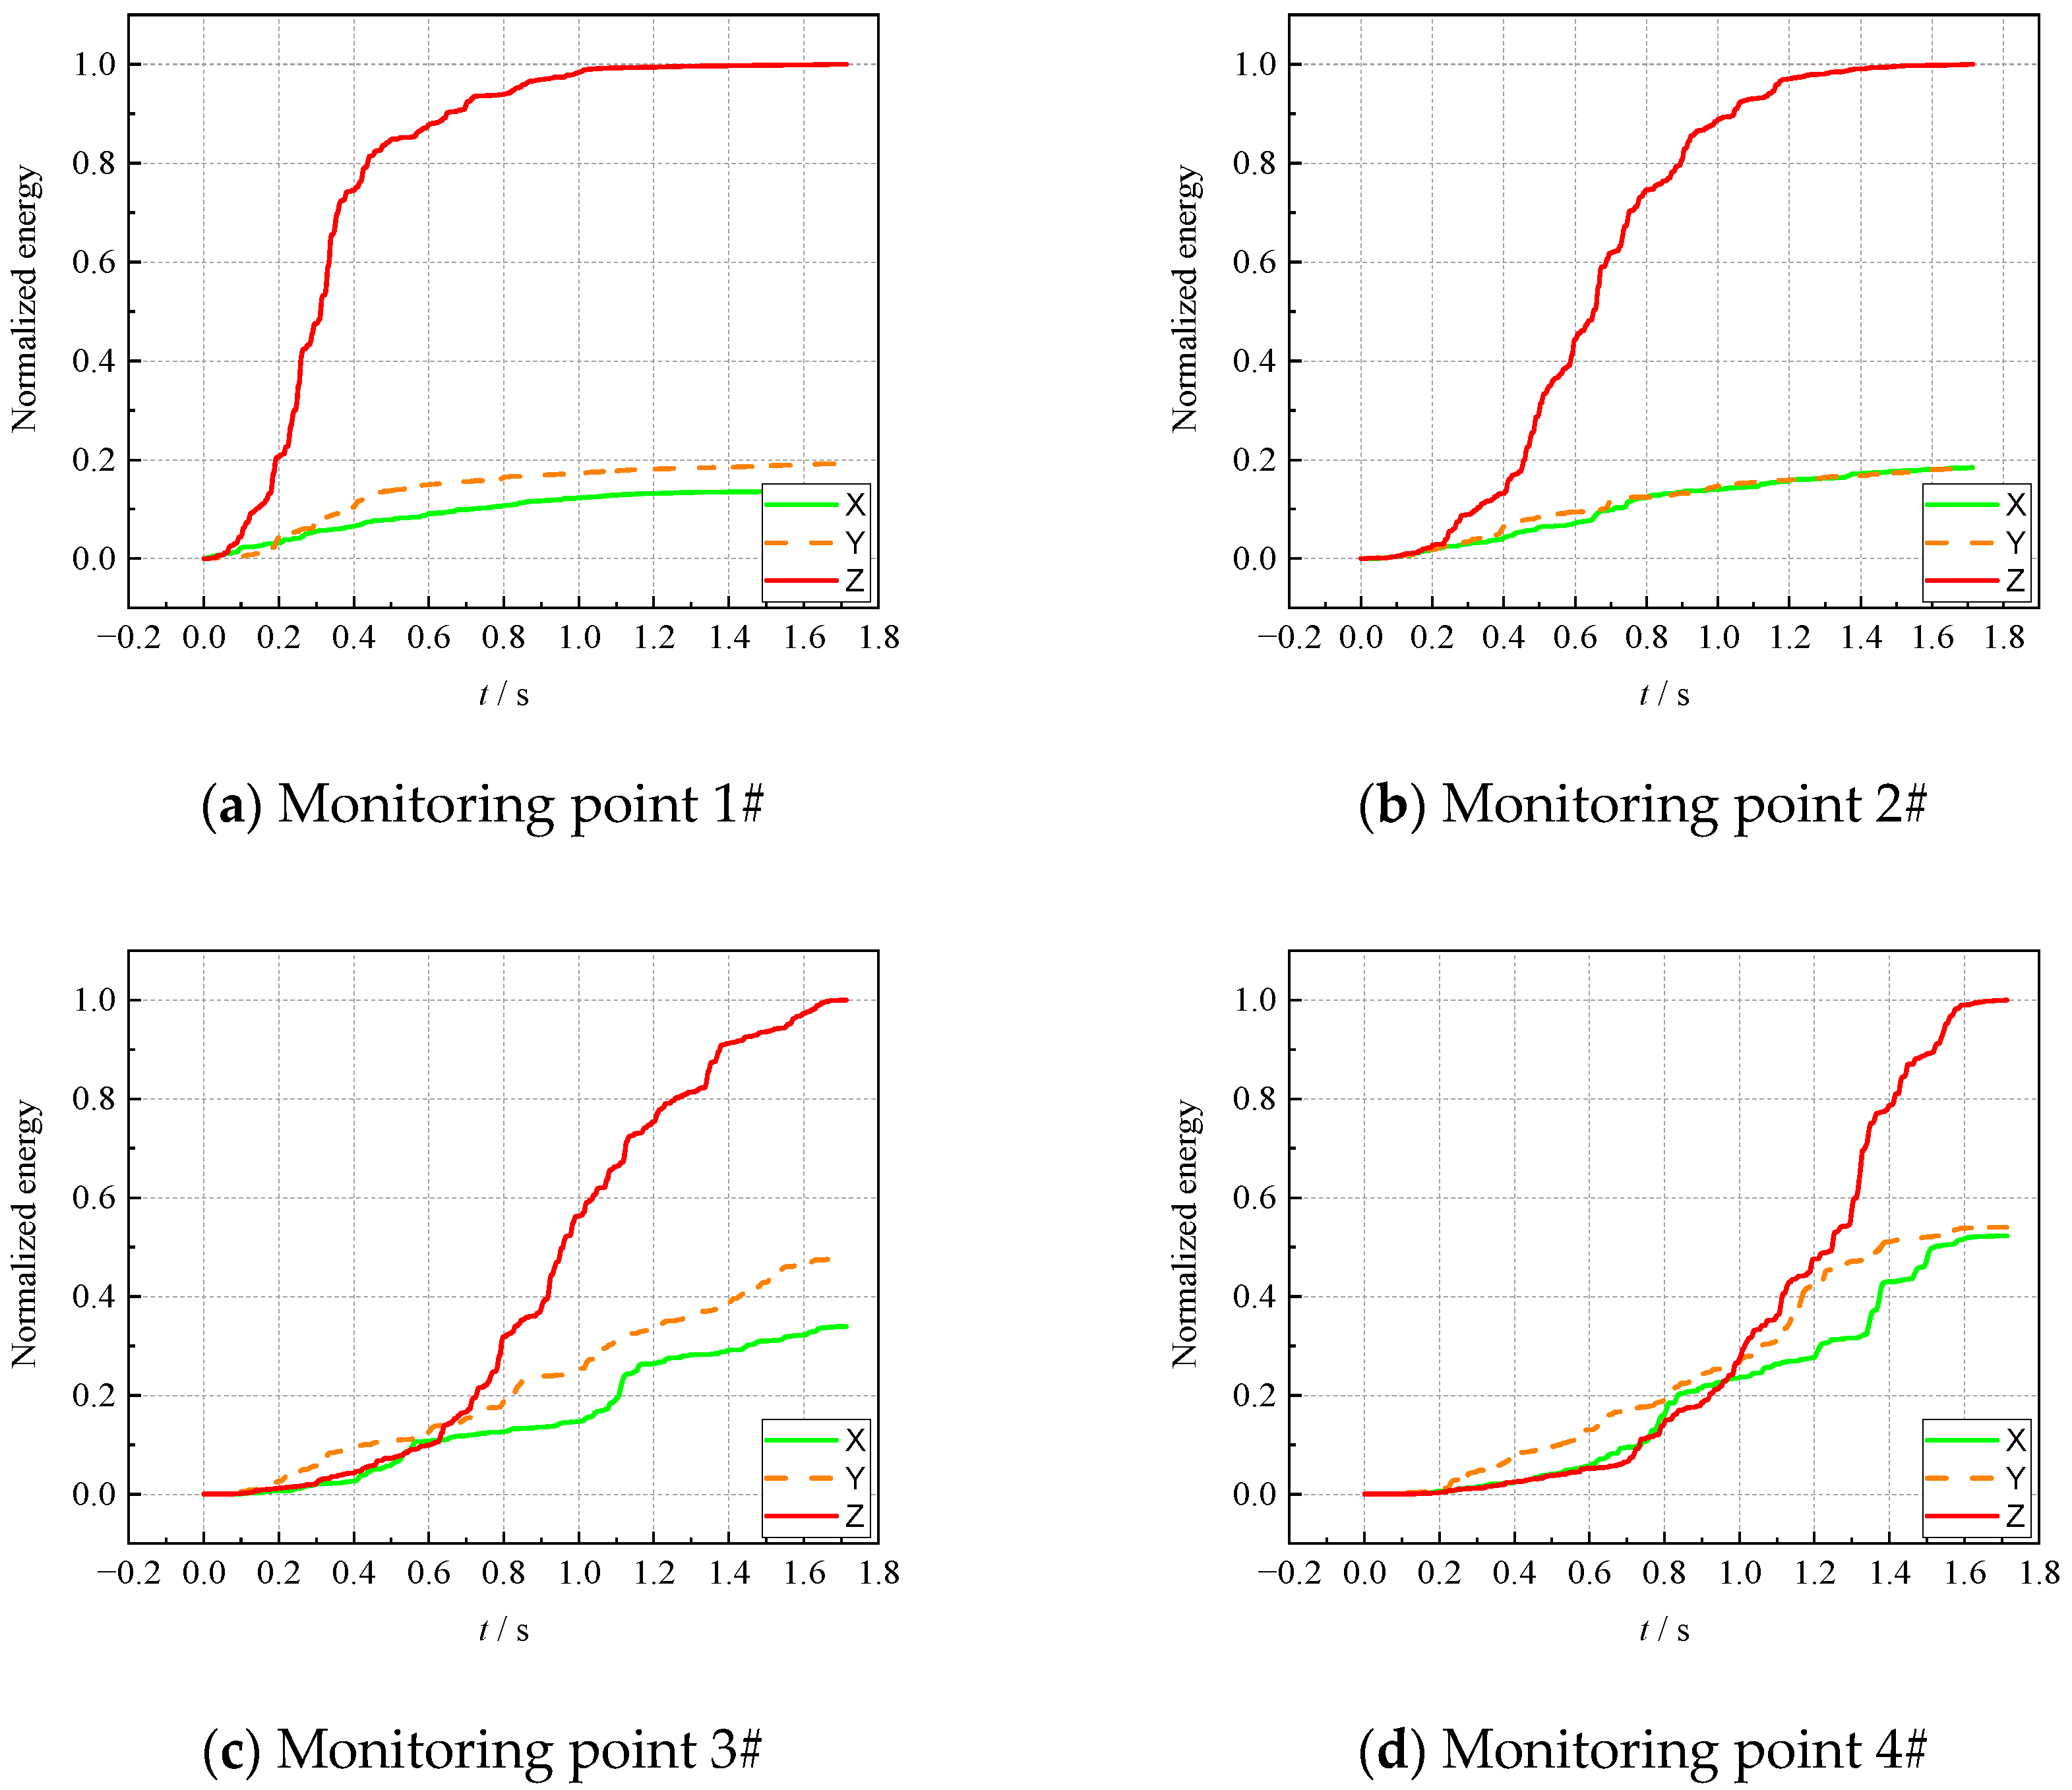
4. Analysis of Cumulative Energy of Blast-Induced Ground Vibration

The vector characteristics and attenuation law of the extreme value of particle velocity analyzed in previous sections reflect the difference of surface particle velocity in different directions. Particle velocity reflects the instantaneous action of blast-induced ground vibration at the location of the measurement point. For large-scale group hole blasting, it is necessary to understand the energy change at the measurement point during the blasting process. Since the surface-blast-induced ground vibration basically does not change the spatial position of the measurement point, v i 2 is taken as the kinetic energy Ek of the unit mass rock mass at the measurement point position, and the cumulative kinetic energy Σ E k represents the total energy passing through the measurement point position in the blasting process, and the value function is:
Σ E k = i = 0 s v i 2
Σ E kn = Σ E k i Σ E k
where Σ E kn is normalized kinetic energy, Σ E k i is the cumulative kinetic energy of the first i particle velocity values, and s is the total number of particle velocity values.
For the convenience of analysis, Σ E k is normalized to obtain the normalized energy. The initial kinetic energy Ek0 (assuming no surface vibration before blasting, i.e., Ek0 = 0) and the maximum value of accumulated kinetic energy ( Σ E k ) in the three directions are mapped with the interval of [0,1], and the time history curve of normalized accumulated kinetic energy is obtained, as shown in Figure 12.
As observed from Figure 12 for the cumulative energy curves, the curves are in the shape of “S”. The energy growth rate in the initial stage and the end stage of blasting is relatively slow, and the accumulated energy in the three directions is close. As time changes, the closer the blasting area is to the measurement point, the energy growth rate accelerates. At this point, the cumulative energy gap in the three directions widens, the kinetic energy advantage in the Z direction increases significantly, and the kinetic energy in different positions in the plane becomes close to each other. The energy curve has little variation in its growth tendency in the three directions at the monitoring location far from the detonation source., and the final total energy is also relatively close. This also proves the vibration distribution law presented in Section 3.2. The closer the blasting hole is to the surface, the stronger the vibration is in the Z direction, and the greater the proportion in the three directions is. Additionally, it can be seen that the Z direction is dominant not only in the extreme value of particle velocity but also in the energy proportion. With the increase in the distance from the blast center, the extreme value of particle velocity and energy growth rate in the Z direction decrease and gradually match those in the X and Y directions.
By observing the 4 figures, it can be concluded that the final accumulated energy in the Z direction is the largest, which is 2–5 times the final accumulated kinetic energy in the X and Y directions. The period during which the energy differential between the horizontal (X and Y directions) and the vertical (Z direction) increases differs with the expansion of the energy curve. As the distance between the measurement points 1#~4# and the explosion point gradually increases, the time is gradually delayed. The growth rate slows down before the end of blasting, but the energy is still higher than in the X and Y directions. The cumulative energy growth curve validates the consistency between the increasing peak amplitude process and the energy variation. The occurrence of increasing peak amplitude is accidental, while the energy variation is continuous. The variation of increasing peak amplitude is not a random event. The significant increase in the cumulative energy growth rate in the Z direction compared to the XY direction corresponds to the moments when the distance is closer. The law of increasing peak amplitude variation corresponds to this phenomenon, indicating that the vibration velocity of the particle is mainly dominated by the Z direction when the distance is closer.
When comparing Figure 12c,d, it is observed that the measured points 3# and 4# are far from the initiation point and that there is no significant difference in the growth rate of the accumulated kinetic energy in the 3 directions at the initial moment. The growth rate of the cumulative kinetic energy curve in the middle and rear section of the Z direction suddenly increases, widening the gap with the curve in the X and Y directions and extending to the end of blasting.

5. Conclusions

We consider that the direction of ground vibration is the key factor affecting building structures, combined with the characteristics of blasting vibration signals in open-pit mines. Based on the mapping relationship between the signal extreme value and the spatial position of the blast hole, a data acquisition method of increasing extreme value is proposed. Through space vector analysis, regression analysis of increasing extreme value and distance between explosion centers, and analysis of cumulative energy change characteristics, the following conclusions are obtained:
(1)
Based on the characteristics of open-pit deep-hole blasting and vibration signals of the same horizontal step, an increasing extremum extraction method was proposed which can obtain multiple particle velocity extrema corresponding to different blast center distances from a set of signals. This method forms the basis for statistics and analysis of the vibration signal.
(2)
The particle velocity was linearly proportional to the distance from the blasting center to the monitoring point when multiple rows of explosives in deep holes were detonated under the condition of a certain mass of charge in a single hole. Furthermore, the linear law of increasing and decreasing velocity was inconsistent, and particle velocity in the increasing stage was higher than that in the decreasing stage.
(3)
The method for assessing the vector of extreme particle velocity was proposed to study the relationship between the distance from the blast center to the monitoring site and particle velocity. The numerical value and vector relationship were combined for analysis based on the characteristics of the vector describing the spatial position relationship of physical quantities. The extreme particle velocity and the angle with the ground plane were expressed and statistically analyzed, which was distinct from the traditional digital signal processing method to explain the spatial dynamic problem. The kinetic energy in the vertical direction accumulates at a greater rate in positions closer to the epicenter, and the increase in kinetic energy at more distant positions is very similar to that in the horizontal (X and Y) direction.

Author Contributions

Conceptualization, S.B. and H.F.; methodology, S.B. and G.H.; software, S.B.; validation, S.B.; formal analysis, S.B.; investigation, S.B.; resources, H.F.; data curation, H.F.; writing—original draft preparation, S.B.; writing—review and editing, H.F.; visualization, H.F.; supervision, H.F.; project administration, H.F.; funding acquisition, H.F. All authors have read and agreed to the published version of the manuscript.

Funding

This research received no external funding.

Institutional Review Board Statement

Not applicable.

Informed Consent Statement

Not applicable.

Data Availability Statement

The data presented in this study are available on request from the corresponding author. The data are not publicly available as the data contain confidential information which cannot be publicly disclosed.

Conflicts of Interest

The authors declare no conflict of interest.

References

  1. Zhou, J.; Qiu, Y.; Khandelwal, M.; Zhu, S.; Zhang, X. Developing a Hybrid Model of Jaya Algorithm-Based Extreme Gradient Boosting Machine to Estimate Blast-Induced Ground Vibrations. Int. J. Rock Mech. Min. Sci. 2021, 145, 104856. [Google Scholar] [CrossRef]
  2. Wang, K.; Qian, X.; Liu, Z. Experimental and Numerical Investigations on Predictor Equations for Determining Parameters of Blasting-Vibration on Underground Gas Pipe Networks. Process Saf. Environ. Prot. 2020, 133, 315–331. [Google Scholar] [CrossRef]
  3. Tian, X.; Song, Z.; Wang, J. Study on the Propagation Law of Tunnel Blasting Vibration in Stratum and Blasting Vibration Reduction Technology. Soil Dyn. Earthq. Eng. 2019, 126, 105813. [Google Scholar] [CrossRef]
  4. Kumar, S.; Chandra Dutta, S.; Goswami, K.; Mandal, P. Vulnerability Assessment of Building Structures Due to Underground Blasts Using ANN and Non-Linear Dynamic Analysis. J. Build. Eng. 2021, 44, 102674. [Google Scholar] [CrossRef]
  5. Jiang, N.; Zhou, C.; Lu, S.; Zhang, Z. Propagation and Prediction of Blasting Vibration on Slope in an Open Pit during Underground Mining. Tunn. Undergr. Space Technol. 2017, 70, 409–421. [Google Scholar] [CrossRef]
  6. Aldas, G.G.U.; Ecevitoglu, B. Waveform Analysis in Mitigation of Blast-Induced Vibrations. J. Appl. Geophys. 2008, 66, 25–30. [Google Scholar] [CrossRef]
  7. Gou, Y.; Shi, X.; Yu, Z.; Huo, X.; Qiu, X. Evaluation of Underground Blast-Induced Ground Motions through near-Surface Low-Velocity Geological Layers. J. Rock Mech. Geotech. Eng. 2022, 15, 600–617. [Google Scholar] [CrossRef]
  8. Chen, S.; Wu, J.; Zhang, Z. Blasting Vibration Characteristics and PPV Calculation Formula Considering Cylindrical Charge Length. Environ. Earth Sci. 2017, 76, 674. [Google Scholar] [CrossRef]
  9. Ainalis, D.; Ducarne, L.; Kaufmann, O.; Tshibangu, J.-P.; Verlinden, O.; Kouroussis, G. Improved Analysis of Ground Vibrations Produced by Man-Made Sources. Sci. Total Environ. 2018, 616, 517–530. [Google Scholar] [CrossRef]
  10. Zhou, J.; Asteris, P.G.; Armaghani, D.J.; Pham, B.T. Prediction of Ground Vibration Induced by Blasting Operations through the Use of the Bayesian Network and Random Forest Models. Soil Dyn. Earthq. Eng. 2020, 139, 106390. [Google Scholar] [CrossRef]
  11. Matidza, M.I.; Jianhua, Z.; Gang, H.; Mwangi, A.D. Assessment of Blast-Induced Ground Vibration at Jinduicheng Molybdenum Open Pit Mine. Nat. Resour. Res. 2020, 29, 831–841. [Google Scholar] [CrossRef]
  12. Roy, M.P.; Mishra, A.K.; Agrawal, H.; Singh, P.K. Blast Vibration Dependence on Total Explosives Weight in Open-Pit Blasting. Arab. J. Geosci. 2020, 13, 531. [Google Scholar] [CrossRef]
  13. Yan, B.; Liu, M.; Meng, Q.; Li, Y.; Deng, S.; Liu, T. Study on the Vibration Variation of Rock Slope Based on Numerical Simulation and Fitting Analysis. Appl. Sci. 2022, 12, 4208. [Google Scholar] [CrossRef]
  14. Yan, Y.; Hou, X.; Fei, H. Review of predicting the blast-induced ground vibrations to reduce impacts on ambient urban communities. J. Clean. Prod. 2020, 260, 121135. [Google Scholar] [CrossRef]
  15. Yu, Z.; Shi, X.; Miao, X.; Zhou, J.; Khandelwal, M.; Chen, X.; Qiu, Y. Intelligent Modeling of Blast-Induced Rock Movement Prediction Using Dimensional Analysis and Optimized Artificial Neural Network Technique. Int. J. Rock Mech. Min. Sci. 2021, 143, 104794. [Google Scholar] [CrossRef]
  16. Nguyen, H.; Bui, X.N.; Tran, Q.H.; Nguyen, D.A.; Hoa, L.T.T.; Le, Q.T.; Giang, L.T.H. Predicting Blast-Induced Ground Vibration in Open-Pit Mines Using Different Nature-Inspired Optimization Algorithms and Deep Neural Network. Nat. Resour. Res. 2021, 30, 4695–4717. [Google Scholar] [CrossRef]
  17. Bui, X.N.; Nguyen, H.; Tran, Q.H.; Nguyen, D.A.; Bui, H.B. Predicting Blast-Induced Ground Vibration in Quarries Using Adaptive Fuzzy Inference Neural Network and Moth–Flame Optimization. Nat. Resour. Res. 2021, 30, 4719–4734. [Google Scholar] [CrossRef]
  18. Temeng, V.A.; Arthur, C.K.; Ziggah, Y.Y. Suitability Assessment of Different Vector Machine Regression Techniques for Blast-Induced Ground Vibration Prediction in Ghana. Model. Earth Syst. Environ. 2022, 8, 897–909. [Google Scholar] [CrossRef]
  19. Verma, A.K.; Singh, T.N. Comparative Study of Cognitive Systems for Ground Vibration Measurements. Neural Comput. Appl. 2013, 22, 341–350. [Google Scholar] [CrossRef]
  20. Hasanipanah, M.; Monjezi, M.; Shahnazar, A.; Jahed Armaghani, D.; Farazmand, A. Feasibility of Indirect Determination of Blast Induced Ground Vibration Based on Support Vector Machine. Measurement 2015, 75, 289–297. [Google Scholar] [CrossRef]
  21. Hasanipanah, M.; Faradonbeh, R.S.; Amnieh, H.B.; Armaghani, D.J.; Monjezi, M. Forecasting Blast-Induced Ground Vibration Developing a CART Model. Eng. Comput. 2017, 33, 307–316. [Google Scholar] [CrossRef]
  22. Khandelwal, M.; Armaghani, D.J.; Faradonbeh, R.S.; Yellishetty, M.; Majid, M.Z.A.; Monjezi, M. Classification and Regression Tree Technique in Estimating Peak Particle Velocity Caused by Blasting. Eng. Comput. 2017, 33, 45–53. [Google Scholar] [CrossRef]
  23. Gao, Q.; Lu, W.; Hu, Y.; Yang, Z.; Yan, P.; Chen, M. An evaluation of numerical approaches for S-wave component simulation in rock blasting. J. Rock Mech. Geotech. Eng. 2017, 9, 830–842. [Google Scholar] [CrossRef]
Figure 1. The damage to buildings caused by blast-induced ground vibration.
Buildings 13 00899 g001
Figure 2. Vibration signal of open-pit deep-hole blasting.
Buildings 13 00899 g002
Figure 3. Process of point acquisition of extreme values of increasing particle velocity.
Buildings 13 00899 g003
Figure 4. Typical waveform of open-pit deep-hole blasting.
Buildings 13 00899 g004
Figure 5. Diagram of initiation network.
Buildings 13 00899 g005
Figure 6. Schematic diagram of monitoring point layout.
Buildings 13 00899 g006
Figure 7. Particle velocity waveform of Test 1.
Buildings 13 00899 g007
Figure 8. Fitting line between particle velocity and distance in the Z direction.
Buildings 13 00899 g008
Figure 9. Particle velocity vector.
Buildings 13 00899 g009
Figure 10. The νxyz − α distribution hotspot diagram of particle velocity extremum.
Buildings 13 00899 g010
Figure 11. The mean value of α varies with the normalized particle velocity.
Buildings 13 00899 g011
Figure 12. Cumulative energy curve.
Buildings 13 00899 g012
Table 1. Monitoring point and distance data.
TestMonitoring PointDistance/m
LuLsLd
11#193.448.9354.8
2#301.854.0256.8
3#415.356.6158.4
4#506.071.5111.8
21#74.138.9209.8
2#152.149.7138.8
3#234.143.955.5
4#249.749.557.0
Table 2. Linear regression coefficients and R2.
Velocity
Direction
Measurement Point
1#
Measurement Point
2#
Measurement Point
3#
Measurement Point
4#
abR2abR2abR2abR2
Test
1
X
(↗)
−0.0073.9110.444−0.0155.8410.846−0.0126.0810.875−0.01910.7430.937
X
(↘)
−0.0103.9770.893−0.0134.6160.829−0.0407.4910.853−0.19923.1690.912
Y
(↗)
−0.0367.8310.863−0.0227.8950.909−0.0095.6130.791−0.0148.9540.865
Y
(↘)
−0.0135.1020.826−0.0195.7700.673−0.0347.2780.711−0.16719.6210.917
Z
(↗)
−0.08919.0500.904−0.04414.4730.961−0.02410.9100.952−0.02412.7790.965
Z
(↘)
−0.03510.5460.779−0.05613.4800.893−0.07714.2890.804−0.27231.7970.942
Test
2
X
(↗)
−0.21016.4550.733−0.10516.3410.927−0.04310.6520.935−0.04110.4640.862
X
(↘)
−0.05010.0490.756−0.10914.8360.905−0.76341.8810.884−1.22170.4270.690
Y
(↗)
−0.23319.6950.450−0.07412.6610.757−0.0357.6040.655−0.0378.7840.762
Y
(↘)
−0.06613.3780.889−0.08012.1140.889−0.71740.6810.831−0.75945.4870.733
Z
(↗)
−0.32027.5250.856−0.16826.3390.908−0.07417.0670.757−0.06215.1240.938
Z
(↘)
−0.08616.8850.888−0.18325.1460.796−1.73596.9050.786−2.097117.4750.844
Note: In Table 2, a represents the coefficient of the first term of linear fitting, and b represents the constant term.
Disclaimer/Publisher’s Note: The statements, opinions and data contained in all publications are solely those of the individual author(s) and contributor(s) and not of MDPI and/or the editor(s). MDPI and/or the editor(s) disclaim responsibility for any injury to people or property resulting from any ideas, methods, instructions or products referred to in the content.

