Article

Carbon Emission Evaluation Method and Comparison Study of Transformer Substations Using Different Data Sources

1
Construction Branch of State Grid Xinjiang Electric Power Co., Ltd., Urumqi 830002, China
2
School of Highway, Chang’an University, Xi’an 710064, China
3
China Energy Engineering Group Xinjiang Electric Power Design Institute Co., Ltd., Urumqi 830002, China
4
China Electric Power Research Institute, Beijing 100085, China
*
Author to whom correspondence should be addressed.
Buildings 2023, 13(4), 1106; https://doi.org/10.3390/buildings13041106
Submission received: 22 March 2023 / Revised: 16 April 2023 / Accepted: 19 April 2023 / Published: 21 April 2023

Abstract

:
The construction of transformer substations in transmission lines is a systematic, technical, and complex project with the need for numerous materials and resources. Under the development of the green economy, the requirements for energy conservation and carbon reduction have improved; hence, an assessment of carbon emissions in transformer substations is urgently needed. A calculation method was proposed in the present study to analyze the carbon emissions of transformer substations with different kinds of data sources, which were collected from several practical projects in the west-to-east power transmission project. In this study, a detailed comparison and discussion regarding the differences in carbon emissions of 750 kV transformer substations caused by hydrology, geology, engineering quantity, and other factors were conducted. The mean value, standard deviation, and 90% confidence interval of carbon emissions were obtained by Monte Carlo simulation through MATLAB. Results show that the total carbon emissions of the selected 750 kV transformer substations are between [56,000, 68,000] t CO2 eq. Construction engineering accounts for more than 50% of carbon emissions, followed by installation engineering and additional services. In terms of input items, electricity distribution buildings contribute more than 39% of total carbon emissions, followed by cable/earthing systems, which account for 14% of total carbon emissions. Gas insulated switchgear (GIS) and air insulated switchgear (AIS) could adopt different types of equipment foundations, and GIS equipment foundations would generate fewer carbon emissions due to the smaller land area and input materials. This study can provide experience and reference for similar projects and further guide the substation carbon emission reduction work.

1. Introduction

With the rapid growth of the economy, China’s demand for electricity has recently soared from 5.56 × 10³ TW h to 6.80 × 10⁴ TW h [1,2]. The Eastern part of China is densely populated and has a large demand for industrial and residential electricity, while the Western region is rich in resources. The uneven distribution of energy sources promotes the construction of efficient and economical transmission channels [3,4]. West-to-east electricity power transmission is one of the national projects with the largest investment and engineering volume in China; the cumulative power transmission reached about 270 million kW [5]. In this circumstance, Xinjiang launched power-grid construction projects in 2012, but the 750 kV main transmission channel and ring network have not been completed yet. As the central hub of the power grid, the charging power generated in a 750 kV transmission line is 2–3 times greater than that of a 500 kV line of the same length, and as the key facility for power transmission, the transformer substation plays an important role in the power supply system.
With the constant consumption of energy and the emission of greenhouse gases, global climate change has become one of the most severe environmental challenges. The carbon dioxide (CO2) emissions related to the construction industry have been a global concern [6,7,8,9,10]. Chau et al. state that the building sector contributes 40% to the total energy consumption and 36% to the global CO2 emissions [11]. The construction process of a transformer substation involves energy and carbon-intensive products. Researchers have paid more attention to the impact of transformer substation construction on the environment in recent years. Yamagata et al. studied the ultra-high-voltage AC substation and its influence on the environment in Japan [12]. Tan et al. established optimization models to study the impact of clean energy and carbon emission mechanisms on the inter-regional energy exchange [13]. Daniels et al. used investment and asset data for the GB system for 2015–2023 to calculate the carbon impacts on electricity networks [14]. Garcia et al. assessed the environmental life cycle impacts of electricity generation and supply in Portugal [15].
A newly built 750 kV transformer substation would induce a lot of energy and material consumption; hence, it is urgent to evaluate the carbon emissions to guide the related projects. In previous studies, researchers calculated carbon emissions from power transmission infrastructure in Europe [16,17]. However, there are shortcomings in these studies. First, only primary materials, including concrete, steel, and gravel, are taken into account in construction engineering [18]. Materials for installation, including switch plants, reactors, filters, and reactive compensation equipment, require large amounts of metal and building materials, and the process of installation also needs manpower and machinery [19]. In addition, additional services for construction such as survey, design, project supervision, and staff training will all generate corresponding carbon emissions that cannot be ignored in the calculation. Therefore, ignoring the carbon emissions generated by installation materials, office equipment, vehicles, and labor will lead to a significant underestimation of the calculation results. Moreover, European data are of less reference value to developing countries due to differences in construction scale and technology. Thus, a calculation method that can comprehensively evaluate carbon emissions from newly built substations in Xinjiang province is urgently needed.
On account of the impact of engineering quantity and terrain, the scale of each substation is different, resulting in differences in carbon emissions. Therefore, it is essential to do a comparison of the carbon emissions of different substations and conduct stochastic analysis on this basis. Generally, parameter, scenario, and model are the three basic factors of stochastic analysis [20]. For the large amount of data involved, parameter stochastic has the greatest influence on calculation results [21,22,23]. Kang et al. used statistical analysis to describe the characteristics of construction materials [24]. Wang et al. proposed a combined data quality indicator method for stochastic analysis of carbon emissions [25]. Chou et al. used Monte Carlo simulation to research the distribution of carbon emissions during construction engineering [26]. Although numerous researchers have focused on the stochastic analysis of carbon emissions, studies on newly built transformer substations are still rarely seen. Due to the special geographical environment in Xinjiang, more consideration should be given to the impact of the construction process on the environment compared to other regions.
Currently, there is no research on the reasonable interval of carbon emissions, which may impede the development of low-carbon technology in substations. The quantification and analysis of carbon emissions in this paper would fill this gap, and it would provide technical support and a reference for similar projects.
Due to the excessive consumption of electricity in large cities in China, a large number of electricity infrastructures have been built to transfer electricity from west China to east China, especially in Xinjiang province. In addition, more electricity infrastructure is to be built soon to meet the rapid increase in demand for electric power in the Eastern part of China. Power transmission lines involve a large number of items, and the workload of different processes could be different types, such as bills of engineering quantities or final account lists of projects. Therefore, it is important and necessary to find an appropriate way that is suitable for the calculation and evaluation of carbon emissions in power transmission lines and related facilities, such as transformer substations. Therefore, 750 kV transformer substations were selected to study the calculation and evaluation method for the carbon emissions of power transmission lines in the present study. A mass of data from several real projects of west-to-east power transmission project was collected for the analysis. Based on the mass data collected from design, construction, and maintenance organizations that took part in the construction processes of 750 kV transformer substations, this study aims to achieve the following goals: (1) propose a feasible and adoptable method to calculate the carbon emissions of newly built transformer substations; (2) analyze the differences in carbon emissions of each substation according to the hydrological and geological conditions; (3) adopt parameter stochastic analysis to determine the distribution and confidence interval of carbon emissions in Xinjiang province and find key influencing factors; and (4) compare the influence of different types of switchgear foundations on carbon emissions. Results of this study would facilitate references for the low-carbon construction of similar projects for power transmission lines, thereby promoting the development of the ecological environment.

2. Data Resources and Methods
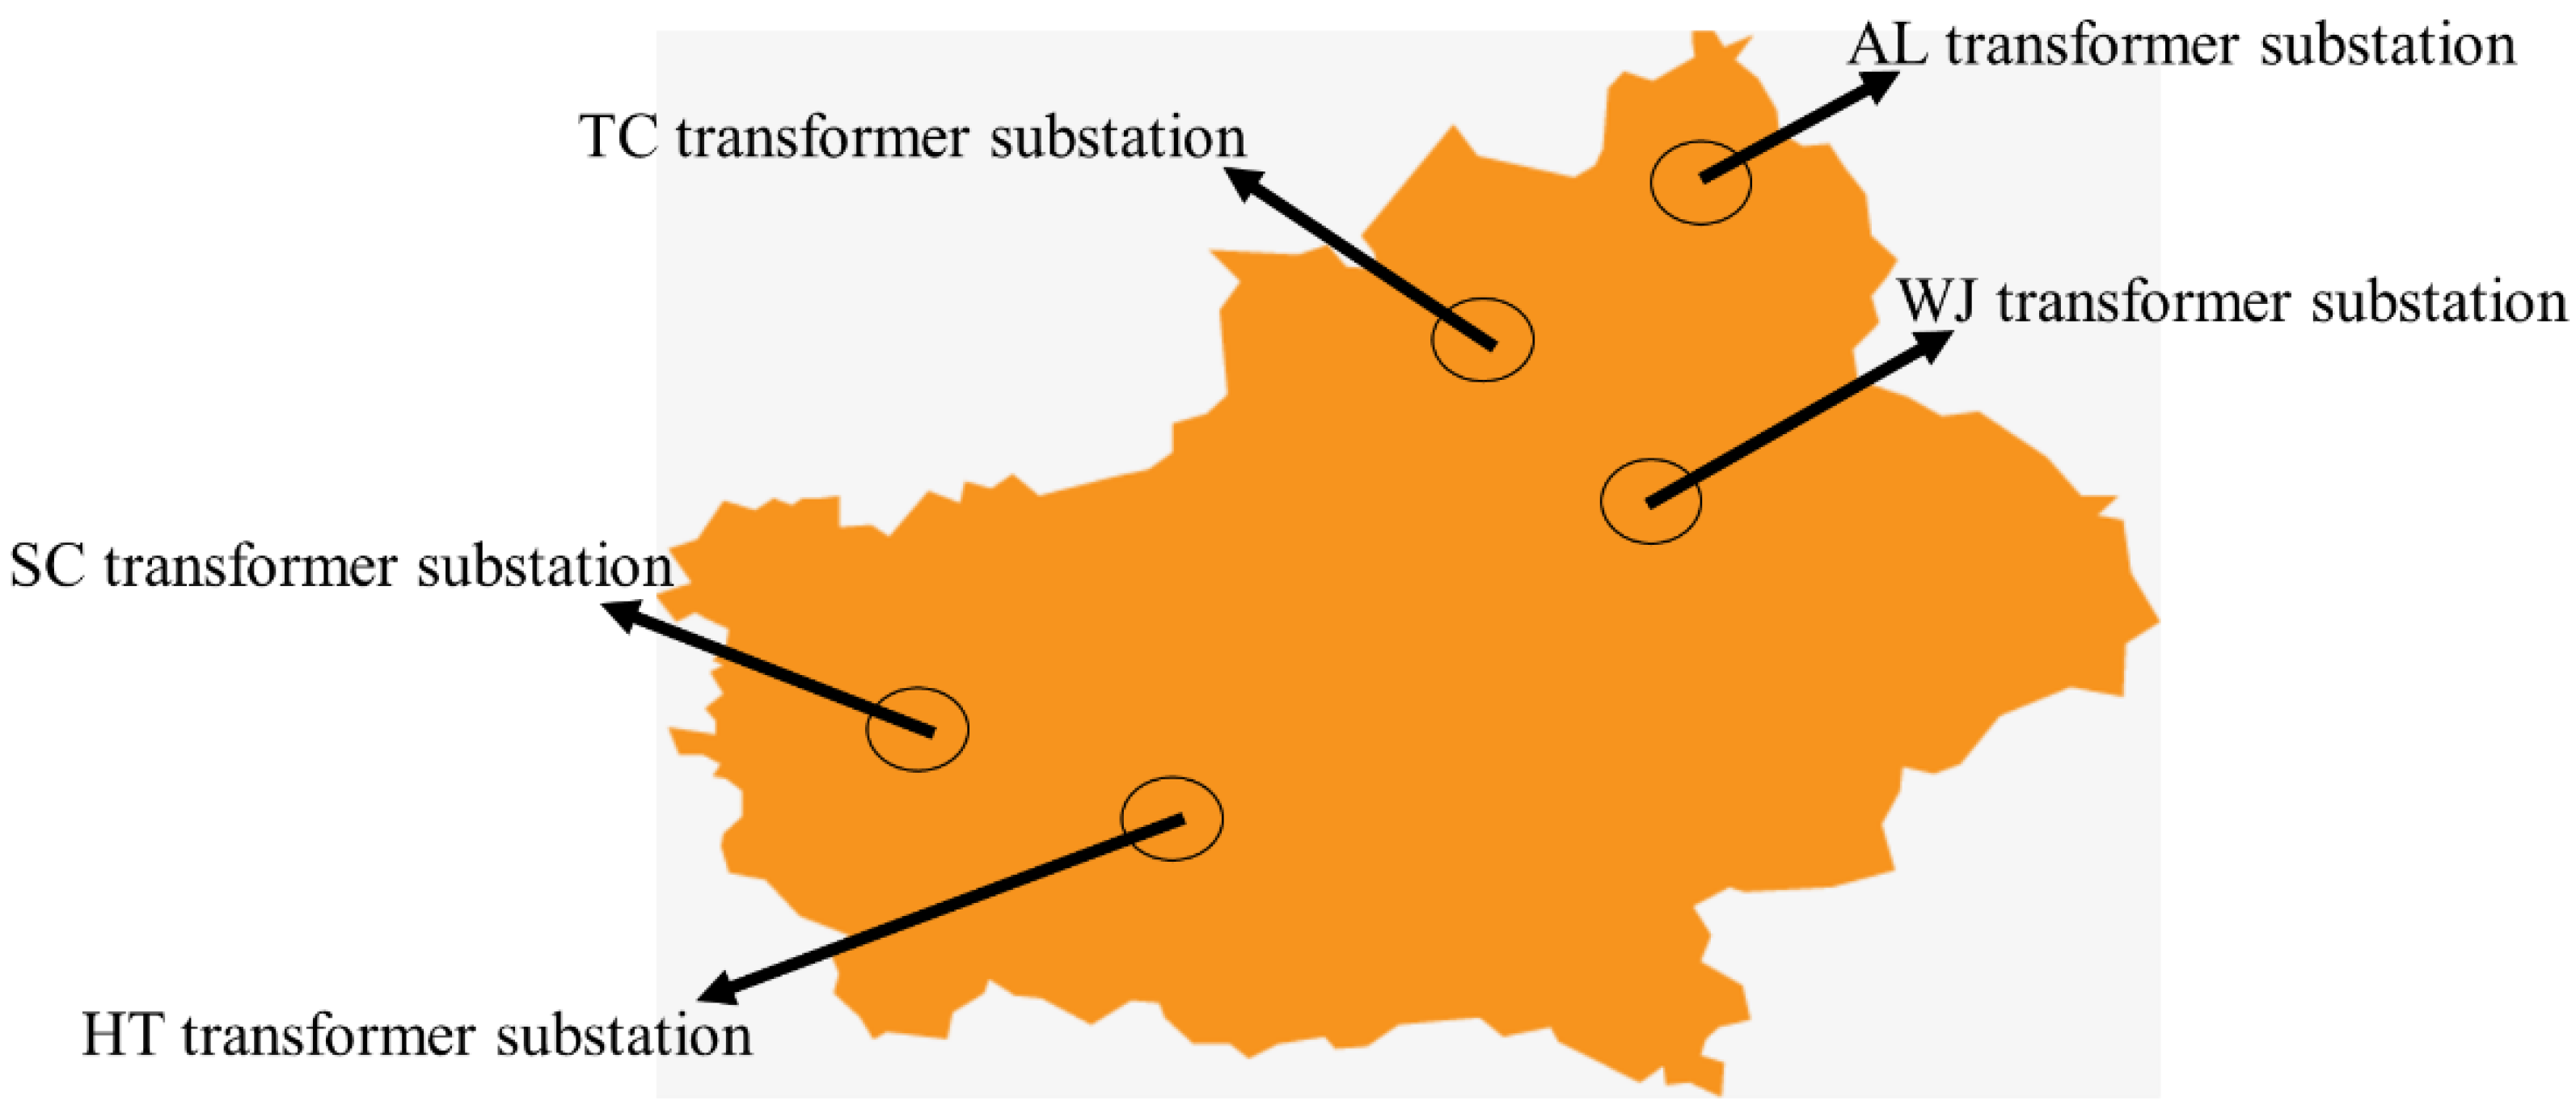
2.1. Data Resource

As the starting point of the “West-to-east power transmission project” in China, Xinjiang plays the most significant role in ensuring the power supply for east China. Therefore, 5 regionally representative 750 kV transformer substations of power transmission lines in Xinjiang were selected for analysis in this study. To reveal the carbon emissions of newly built 750 kV transformer substations, detailed data were collected from design, construction, management, and finance organizations that were involved in the life of transformer substations on power transmission lines. Costs, construction materials, and engineering quantities at each stage all came from the summary table of the financial department, which is detailed and reliable. The items of installation engineering were collected and counted by the State Grid Corporation of China during the installation process.
The location of the selected 750 kV transformer substations is shown in Figure 1. The TC 750 kV transformer substation is located in northwestern Xinjiang province, near Karamay. The total area of land expropriated reaches 14.27 hm2, with two sets of main transformers (1500 MVA), a two-circuit 750 kV overhead line, and a ten-circuit 220 kV overhead line. The AL 750 kV transformer substation is located in Altay, Northern Xinjiang. The total area of land expropriated reaches 14.88 hm2, with two sets of main transformers (1500 MVA), a two-circuit 750 kV overhead line, and an eleven-circuit 220 kV overhead line. The HT 750 kV transformer substation is located in Southern Xinjiang; the total area of land expropriated reaches 13.56 hm2, with two sets of main transformers (1500 MVA), one-circuit current-period 750 kV overhead line, and ten-circuit current-period 220 kV overhead line, but six-circuit 750 kV and fourteen-circuit 220 kV in the long term. The SC 750 kV transformer substation is located in southwest Xinjiang; the total area of land expropriated reaches 12.80 hm2, with two sets of main transformers (1500 MVA), a three-circuit 750 kV overhead line, and an eleven-circuit 220 kV overhead line. The WJ 750 kV transformer substation is near Urumqi, with three sets of main transformers (1500 MVA) in its design but built with only two sets of current transformers. The 750 kV and 220 kV distribution devices are set with GIS, a four-circuit 750 kV overhead line, and a twelve-circuit 220 kV overhead line.

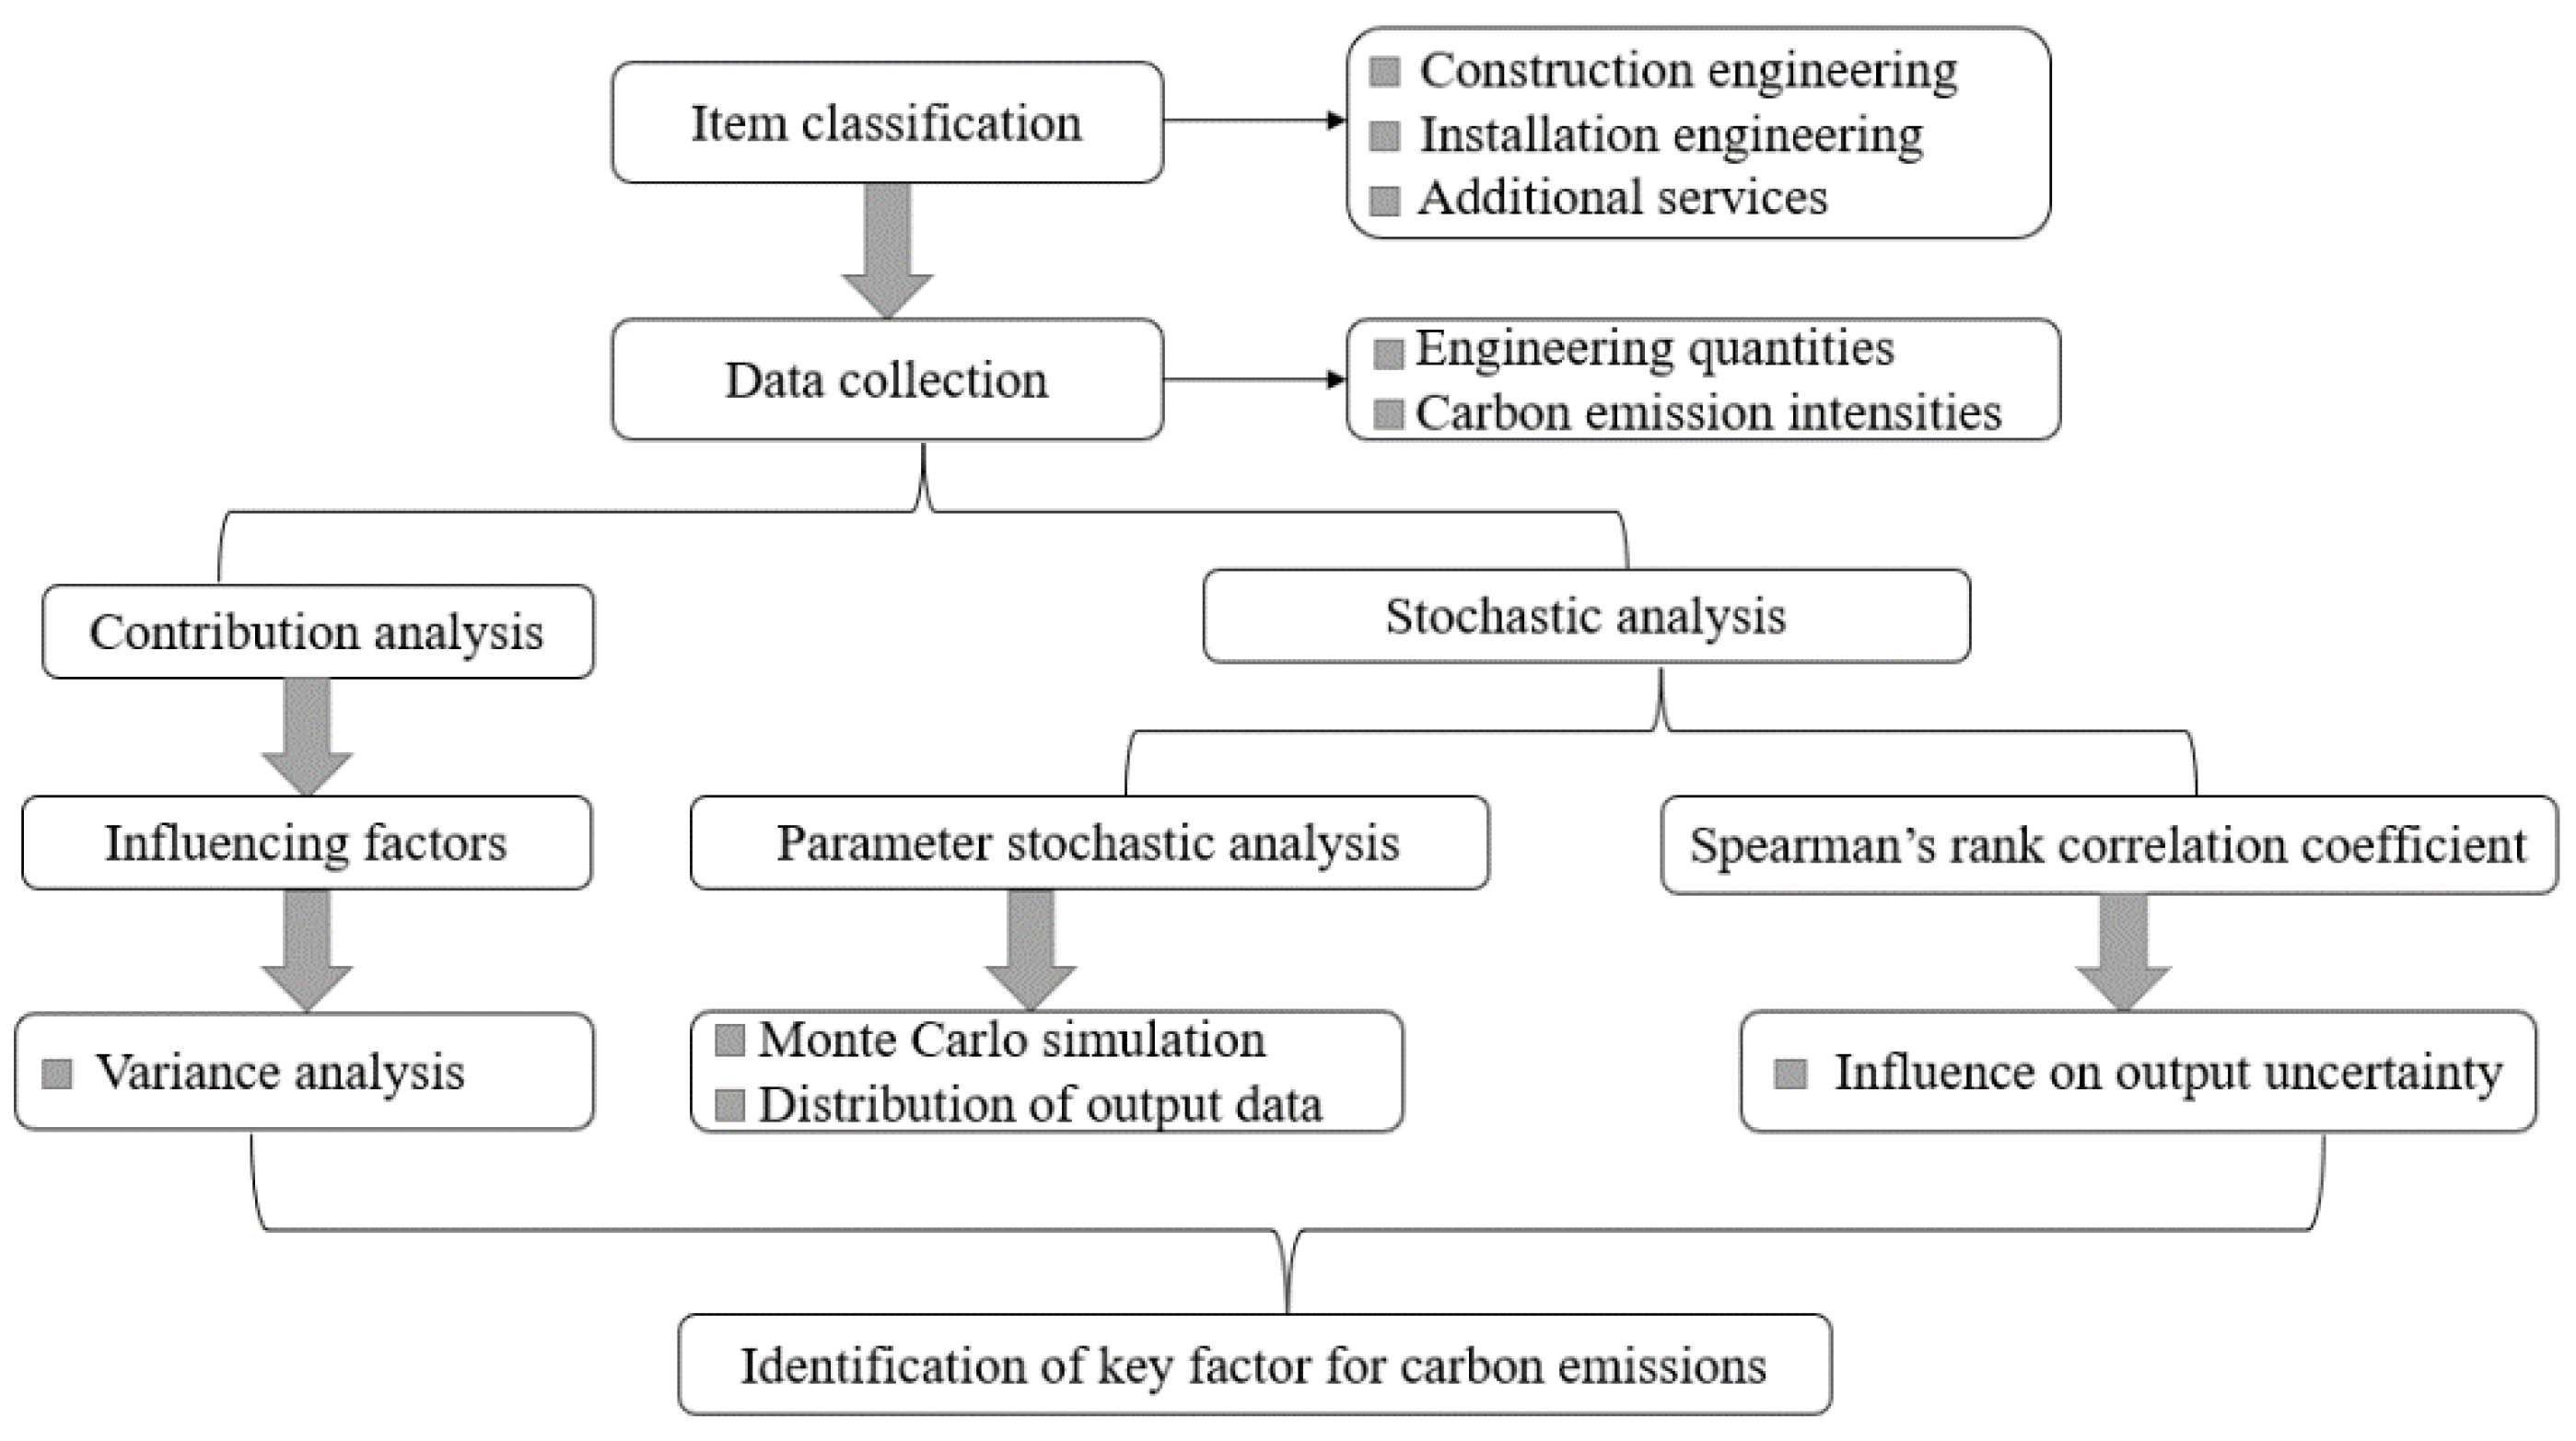
2.2. Proposed Method

Conventional carbon emission calculation methods can be divided into process analysis methods and input-output methods [27]. The former method starts from the life cycle of the buildings, realizing detailed calculations and analysis based on carbon emission coefficient and quantity. The latter method uses sectoral carbon intensity and input-output models to trace the carbon footprint, which is more suitable for macro-level calculation. Both methods have their advantages and have been widely used. Jones et al. used life-cycle assessment (LCA) to compare the carbon emissions of five power cables during the production and operation processes [28]. Harrison et al. utilized LCA to calculate emissions generated by transmission networks and found the majority of carbon emissions are caused by energy loss [29]. Acquaye et al. used input-output analysis as the model and used Monte Carlo simulation to analyze the solidified carbon emissions of buildings [30]. The results obtained by process analysis are more accurate, but there are truncation errors due to the limitation of the system boundary, while input-output analysis is more complete at the macro level but is less accurate. Further, in the installation engineering of the substation, most of the equipment has been prefabricated in the factory, so it is impossible to calculate the carbon emissions from raw materials to completion through the LCA method, and it is not possible to count the consumption of metals and building materials. The consumptions of energies and machinery are hard to count directly in additional service as well. Bullard proposed a hybrid method that incorporated the advantages of process analysis and input-output analysis, which provided a unified idea for calculating resource consumption and gas emissions [31]. With the development of the method, according to the different structures of the calculation model, the hybrid method can be divided into tiered hybrid analysis (TH), input-output-based hybrid analysis (IOH), and integrated hybrid analysis (IH) [32]. TH uses process analysis to study the main production process while using input-output data to estimate other processes; the sum is used as the total carbon emissions. TH has a small amount of calculation and extends the system boundary of process analysis to a certain extent. However, the internal connection between process analysis and input-output analysis cannot be considered, and the unclear boundary division will lead to major errors. IH uses process analysis to calculate total carbon emissions while using input-output data for upstream and downstream additional analysis and defining an error matrix. The internal structure and system boundaries of this model are more complete, but the additional assumptions make the calculation process more complicated. IOH uses detailed production and consumption data to split the sectors in the input-output table, which has strong pertinence. Since IOH is highly dependent on the degree of detail and accuracy of the data, this model is not suitable in the case of insufficient data or unknown accuracy. On this basis, Liu et al. found process analysis can generate a comprehensive input list, and input-output analysis can determine the energy and carbon cost per unit of products [33]. When there is sufficient data available, the items in the list constructed by IOH can be assigned a corresponding economic sector. Researchers have established a carbon intensity database due to the economic sector and environmental factors [34], from which the emissions can be calculated. With further research, IOH has been used to calculate the energy cost and greenhouse gas emissions in electricity systems and power grids [35,36,37,38]. To find a feasible and adoptable way to do carbon emission calculation and evaluation for complicated conditions such as transformer substations, the calculating and evaluating model in the present paper is shown in Figure 2.
Based on IOH, a preliminary calculation of carbon emissions can be obtained, and the specific steps are as follows: First, a detailed bill of quantities for the transformer substations, including construction, installation, and additional service, should be established, and all the items are measured in monetary units. Second, an appropriate database containing carbon emission intensities in different fields should be chosen. A 135-sector embodied carbon intensities database is adopted in this paper to study the carbon emissions in transformer substations [18,34]. A sector code can be found for each input item. For example, the code for the construction of the main production building is 95; the code for control cables in installation engineering corresponds to the manufacture of cable, wire, and electrical appliances, which is 79. Finally, multiply the monetary costs by the carbon emission intensities related to the economic sector, and then you can obtain the carbon emissions. The calculation can be obtained by Equation (1), where E t o t a l represents the total carbon emissions, E F i is the input’s carbon intensity, k is the type of item, and C is the monetary cost.
E t o t a l   = i = 1 k C × E F i
The construction project will always have a budget in the bidding process, while the engineering quantity, comprehensive unit price, and labor costs will be adjusted after the approval and modification of the contract. Therefore, the file types collected from different data sources may be different, and the discrepancy between the engineering quantities and the unit price in the budget file and the actual project will lead to a large error in the carbon emission calculation according to Equation (1). To find a feasible and adoptable multi-data source carbon emission calculation method, the undetermined coefficient formula method is proposed based on Equation (1). As shown in Equation (2), E t o t a l means total carbon emissions, E b and E f corresponds to the carbon emissions calculated by Equation (1) using the budget file and final account file, respectively. Parameters a and b are undetermined coefficients. Since the final account file can reflect the actual engineering quantity and costs more accurately, carbon emissions are calculated according to the relevant data. When all of the data in the final account file is available, set b as 1 and a as 0. When part of the data can be obtained only through the budget file, undetermined coefficients can be set according to the proportion of the relevant part in the whole project or similar projects. To make the proposed calculation method more intuitive, the detailed carbon emissions generated by each item of the SC 750 kV transformer substation are listed in Appendix A.
E t o t a l   = ( a E b + b E f )

2.3. Parameter Stochastic Analysis

The result of the carbon emissions of a transformer substation is usually a single, definite value. Due to the impact of engineering quantity, terrain, and other factors, the carbon emissions of different transformer substations are quite different, and it is difficult for a single definite value to represent the impact of the environment on data due to the lack of an uncertainty range. Thus, it is essential to construct a model to analyze the uncertainty of carbon emissions based on a probability distribution [39,40]. Monte Carlo simulation is widely used in all stochastic modeling methods, which are based on probability and statistical distribution theory and used to generate random numbers for a certain kind of probability model. After generating the model and operating it enough times, the simulation results can be statistically analyzed. Monte Carlo simulation is less constrained by geometric conditions, and the probability of convergence is independent of dimension. Thus, Monte Carlo simulation is adopted in this paper to evaluate the influence of parameter stochastic on results. The beta distribution, which has upper and lower limits, represents the probability of a random variable in a closed interval. Moreover, beta distribution is flexible and may exist in various shapes; whether it is symmetrical or not depends on data distribution, so it is the most consistent with the substation carbon emission distribution [41,42]. However, beta distribution requires that the variables be in the interval [0, 1]. Therefore, beta-pert distribution, a special case of beta distribution, is considered in this paper. The maximum value, minimum value, and most optimistic values of carbon emissions are required to complete the estimation of probability distribution parameters. The probability density function, distribution function, and shape parameters are shown as follows:
f ( r ; α , β ) = Γ ( α + β ) Γ ( α ) Γ ( β ) r ( α 1 ) ( 1 r ) β 1
F ( r ; α , β ) = Γ ( α + β ) Γ ( α ) Γ ( β ) 0 r y α 1 ( 1 y ) β 1 d y
r = r r 0 r 1 r 0
μ = r 0 + 4 r m + r 1 6
α = ( μ r 0 ) ( 2 r m r 0 r 1 ) ( r m μ ) ( r 1 r 0 )
β = α ( r 1 μ ) ( μ r 0 )
where the density function is shown in Equation (3) and the cumulative distribution function is shown in Equation (4), α and β are the shape parameters, r 0 , r 1 and r m represent the maximum value, minimum value, and most optimistic value, respectively, and r is the variable.
In this paper, the Monte Carlo simulation of a probability density function based on the beta-pert distribution was carried out by the MATLAB software. The input sample determines the accuracy of the calculation, and the calculated carbon emissions are within a certain range. A total of 10,000 sets of carbon emission samples are generated and analyzed in the research [13,14]. The simulated results, including the mean value, standard deviation, coefficient of variation, and confidence interval, can be used to characterize the carbon emissions of the 750 kV substation in Xinjiang.
The construction of the newly built transformer substations Involves a variety of items, and the impact of carbon emissions on the uncertainty of the results varies from one to another. Therefore, the normalized Spearman’s rank correlation coefficient is used to express the influence of output data on the uncertainty (IU) through MATLAB [20]. The formula for the calculation is shown as follows:
C E i = E i / E t
I U i = r h o p 2 / i = 1 t r h o p 2
r h o p = 1 6 s ( s 2 1 ) × r = 1 s [ r g ( X i , r ) r g ( Y r ) ] 2
E i is the simulation result of item i , and E t is the result of carbon emissions from total engineering. s represents the total number of simulations, X i , r and Y r are the input and output of the simulation r, respectively, and r g ( X i , r ) and r g ( Y r ) represent the rank of X i , r and Y r in all simulations. r h o p represents the rank correlation coefficient among the input i and the output results. I U i is the influence of item i on carbon emissions.

3. Results and Discussion

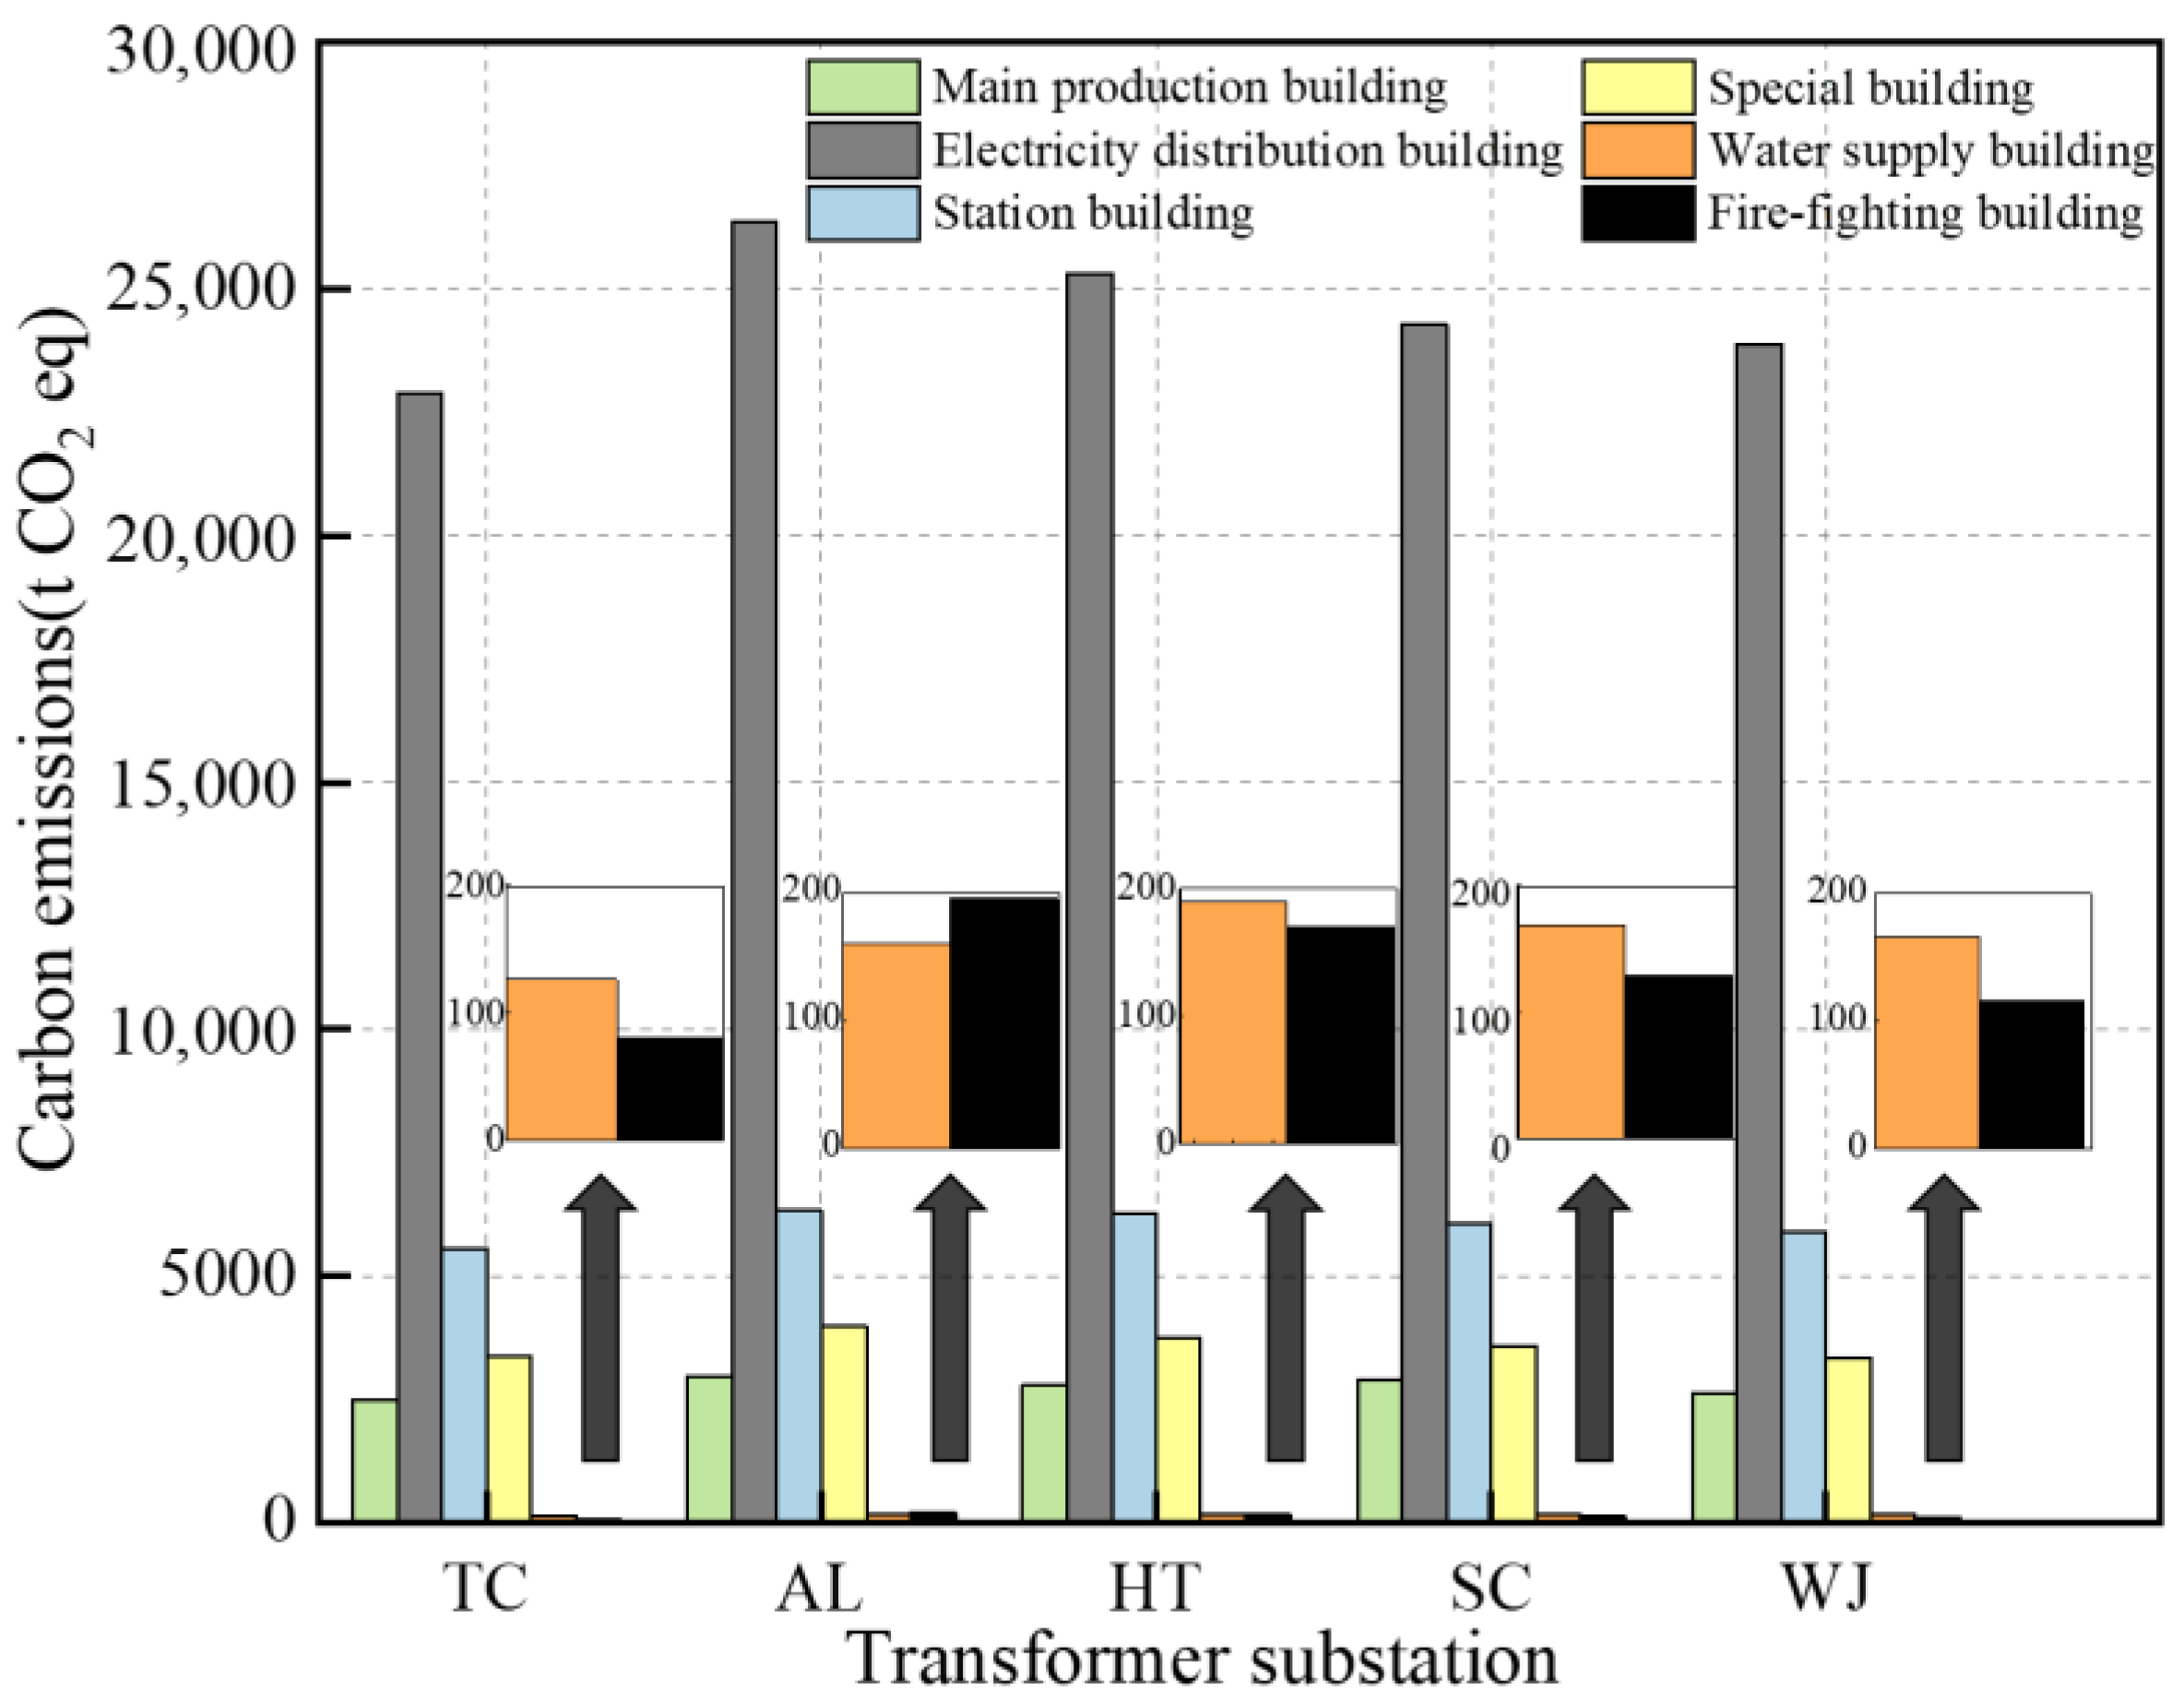
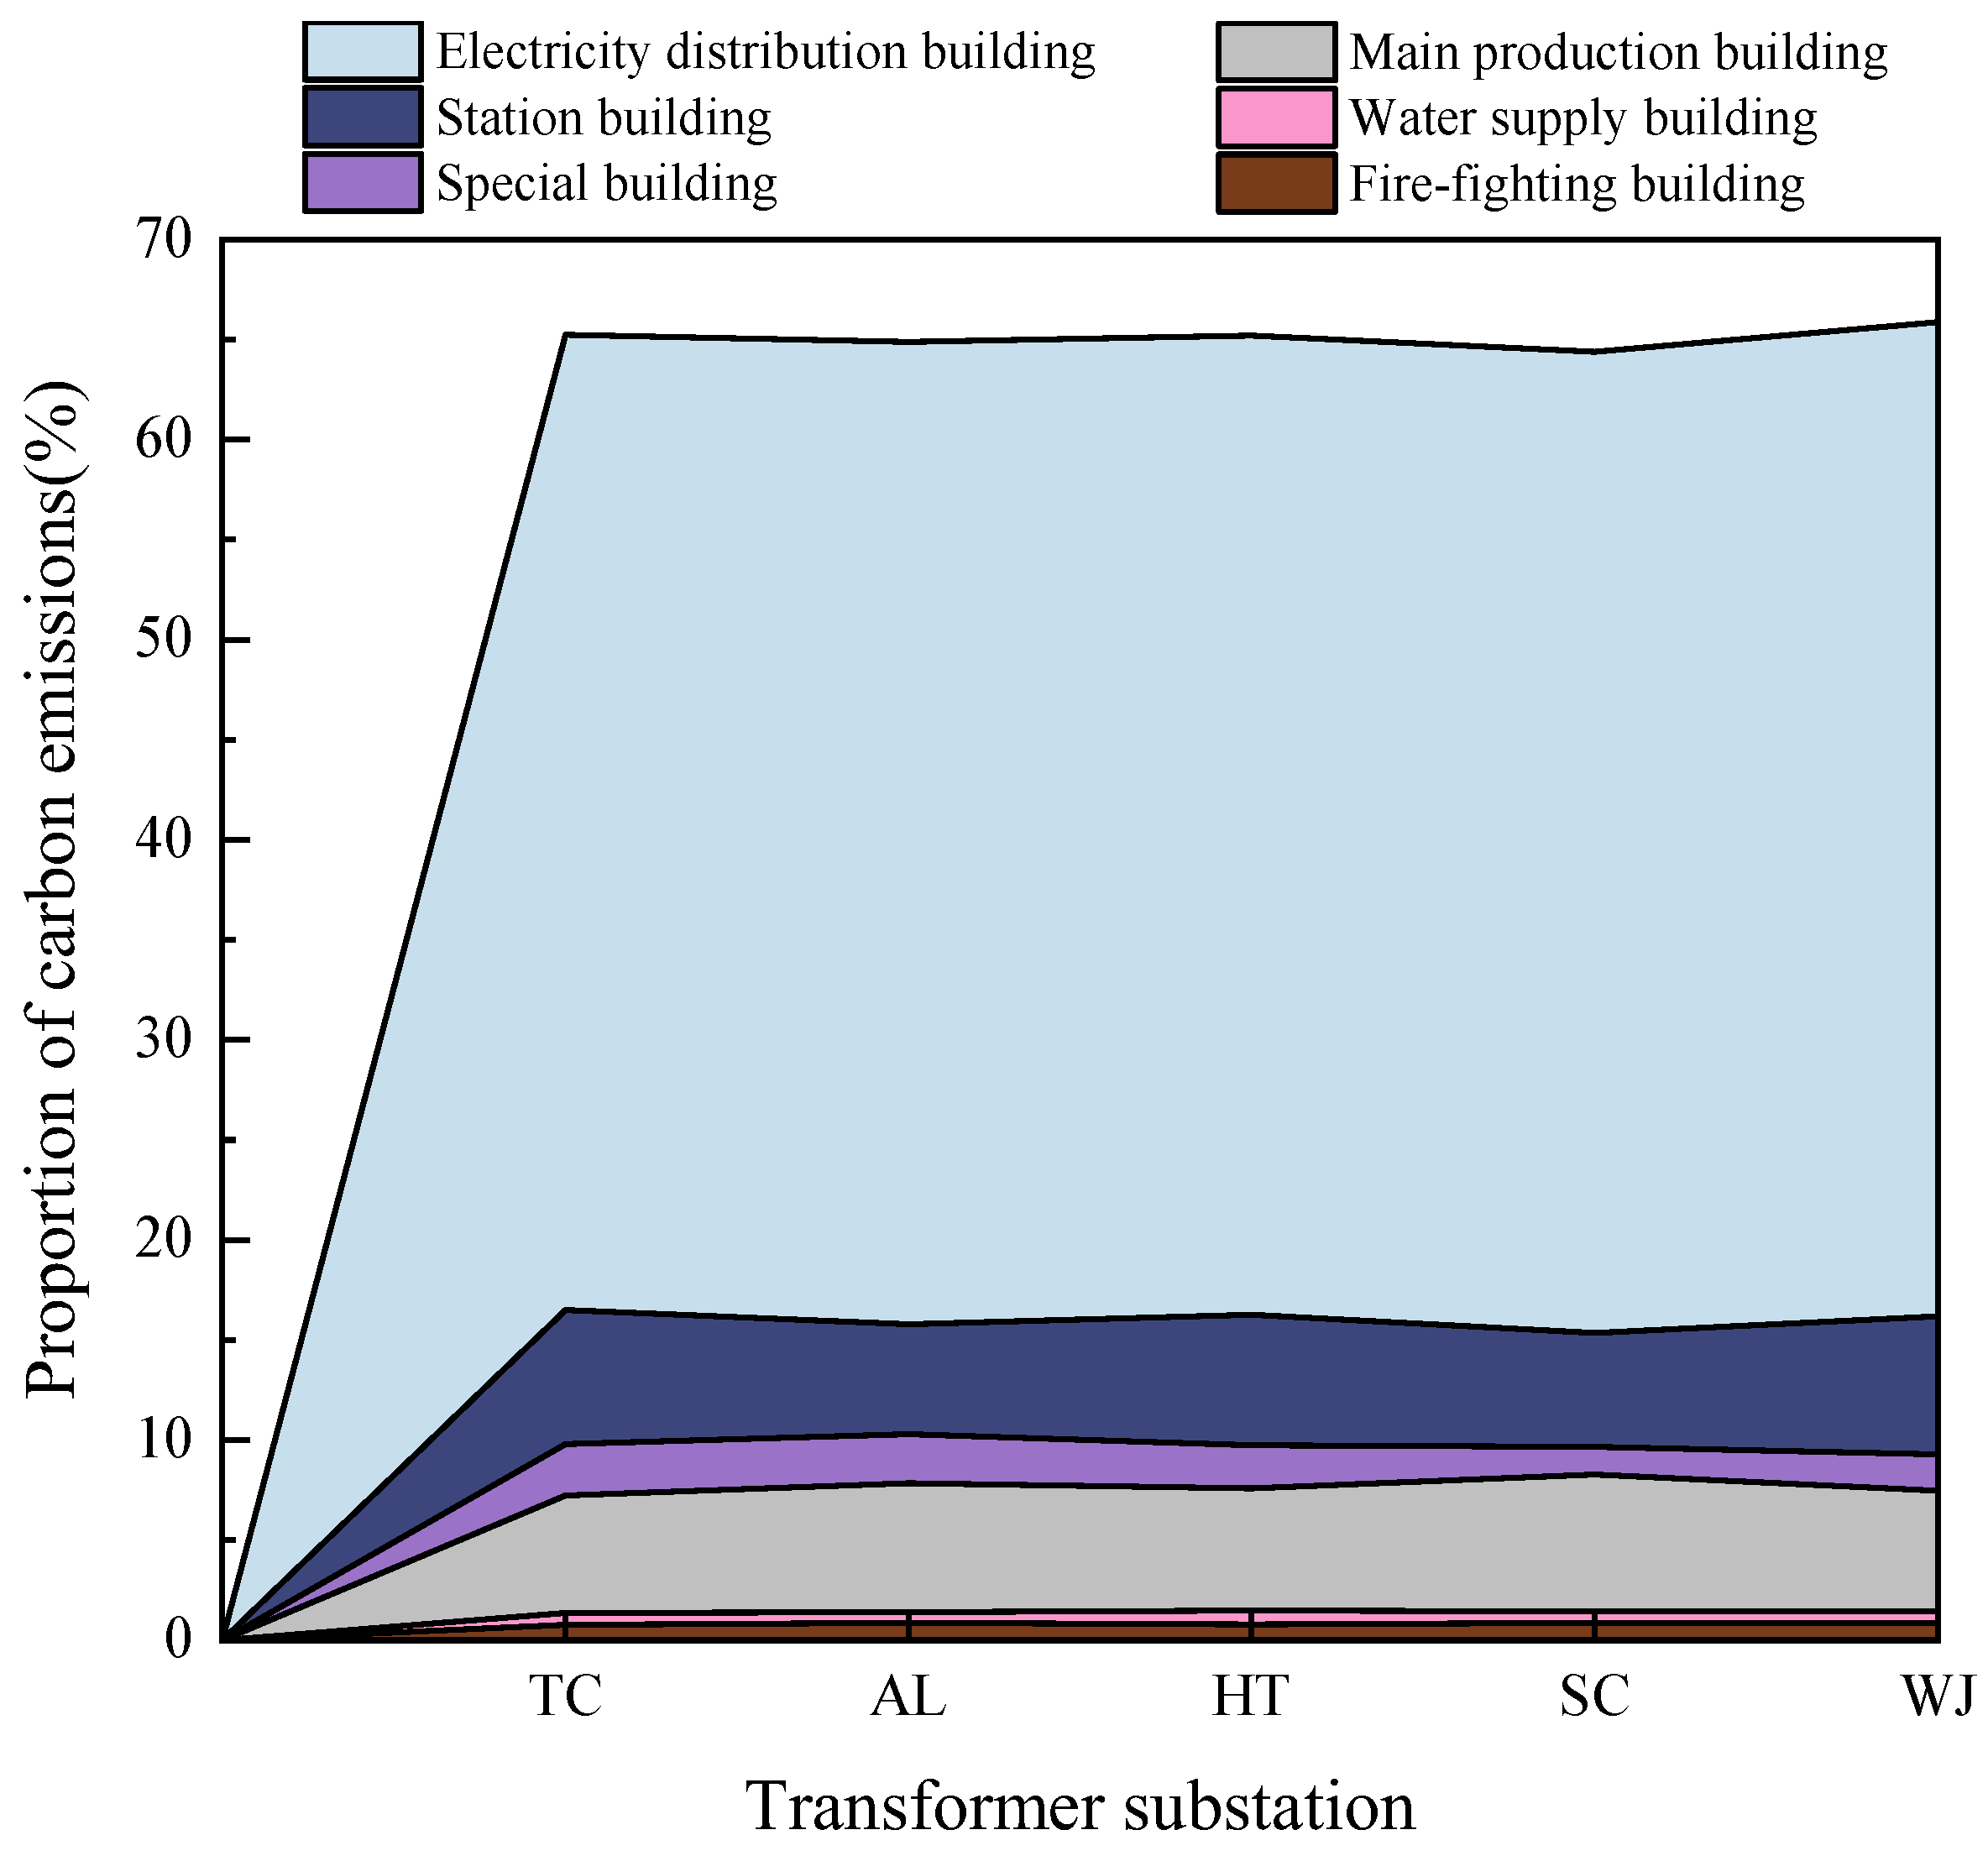
3.1. Transformer Substation Carbon Emission Results

3.1.1. Carbon Emissions from Construction Engineering

The construction engineering of a 750 kV transformer substation can be divided into main production buildings, electricity distribution buildings, water supply buildings, fire-fighting buildings, station buildings, and special buildings. In this paper, five groups of real substation projects are selected, and the carbon emissions of construction engineering are presented in Figure 3.
The main production building is the core of the transformer substation, responsible for operation, management, logistics, and other functions. It includes a main control and communication building, multiple relay rooms (750 kV, 220 kV, and 66 kV), a distribution room, an equipment room, a guardhouse, etc. The construction of the main production building mainly includes earthwork excavation, formwork erection, concrete spouting, masonry works, roof waterproofing, etc. Construction materials consist of reinforced concrete slabs, beams, columns, lump materials, and wall decoration. Carbon emissions generated by earthwork excavation and foundation engineering account for a considerable proportion, and soil quality is the main influencing factor. According to the geological report, the foundation soil of the TC transformer substation is mainly gravelly sand, and the mineral composition includes quartz and feldspar. The favorable soil condition facilitates earthwork excavation, resulting in low construction costs. Therefore, carbon emissions related to the main production building in the TC transformer substation are the lowest, accounting for 2500.18 t CO2 eq. The foundation soil of the WJ and SC transformer substations is mainly silt and silty clay, which belongs to saline soil and has frost-heaving properties. Hence, part of the foundations should be treated with dynamic compaction or use gravel piles. The foundation soil of the HT and AL substations is mainly solid soil with a high content of gravel and crushed stone; excavation requires more manpower and machinery. In addition, there is severe salinization around the AL substation, which is on medium-saline soil. Sulfate-resistant cement is used in the concrete, and it is mixed with fly ash to reduce the sulfate corrosion of the foundation. Therefore, AL substation has the largest investment in the main production building, generating the most carbon emissions, reaching 2977.48 t CO2 eq. Figure 4 shows the proportion of carbon emissions related to each item in the substations. In general, carbon emissions from the main production building account for 7.3% of construction engineering.
The electricity distribution building is an important part of the transformer substation; it includes the main transformer system, frames and equipment foundations, high-voltage reactor system, station transformer system, lighting rod tower, conduit line, and barrier. Carbon emissions related to electricity distribution buildings account for 65.7% of construction engineering. Among them, the TC transformer substation produces the least, accounting for 22,288.31 t CO2 eq, while the AL transformer substation generates the most, accounting for 26,369.47 t CO2 eq. As the main structure of the transformer substation, the frames cover more than 50% of the area. The carbon emissions are closely related to the amount of steel and concrete used in the construction process. Based on the geological report, the TC substation is located in a favorable area for earthquake resistance; it has better formation stability, and the seismic intensity is 6 degrees. The seismic intensity of other substations is 7 degrees, belonging to the general area of earthquake resistance, which needs to apply the lattice frame, resulting in an increased cost. Furthermore, the horizontal tension caused by lateral wind pressure and the load caused by the ice-covering of wires and insulators should be considered in the construction of the frames. The AL transformer substation is located in the valley tuyere area of Northern Xinjiang province, with high wind speeds and low temperatures in winter. Therefore, the frame structure of the AL substation is more complex, covers a larger area, and generates more carbon emissions than other projects. In addition, carbon emissions from conduit lines and barriers are mainly associated with the land area.
Station buildings consist of site formation, station road and square, drainage pipeline, walls, and gate. Carbon emissions are responsible for about 16.2% of the construction engineering, and they are closely related to the size of the substation. Special buildings include foundation treatment, the construction of road and drainage outside the station, and the retaining wall. They are closely associated with soil quality, accounting for about 10% of carbon emissions. Furthermore, water supply buildings and fire-fighting buildings are responsible for 0.48% and 0.32% of carbon emissions in construction engineering, respectively.

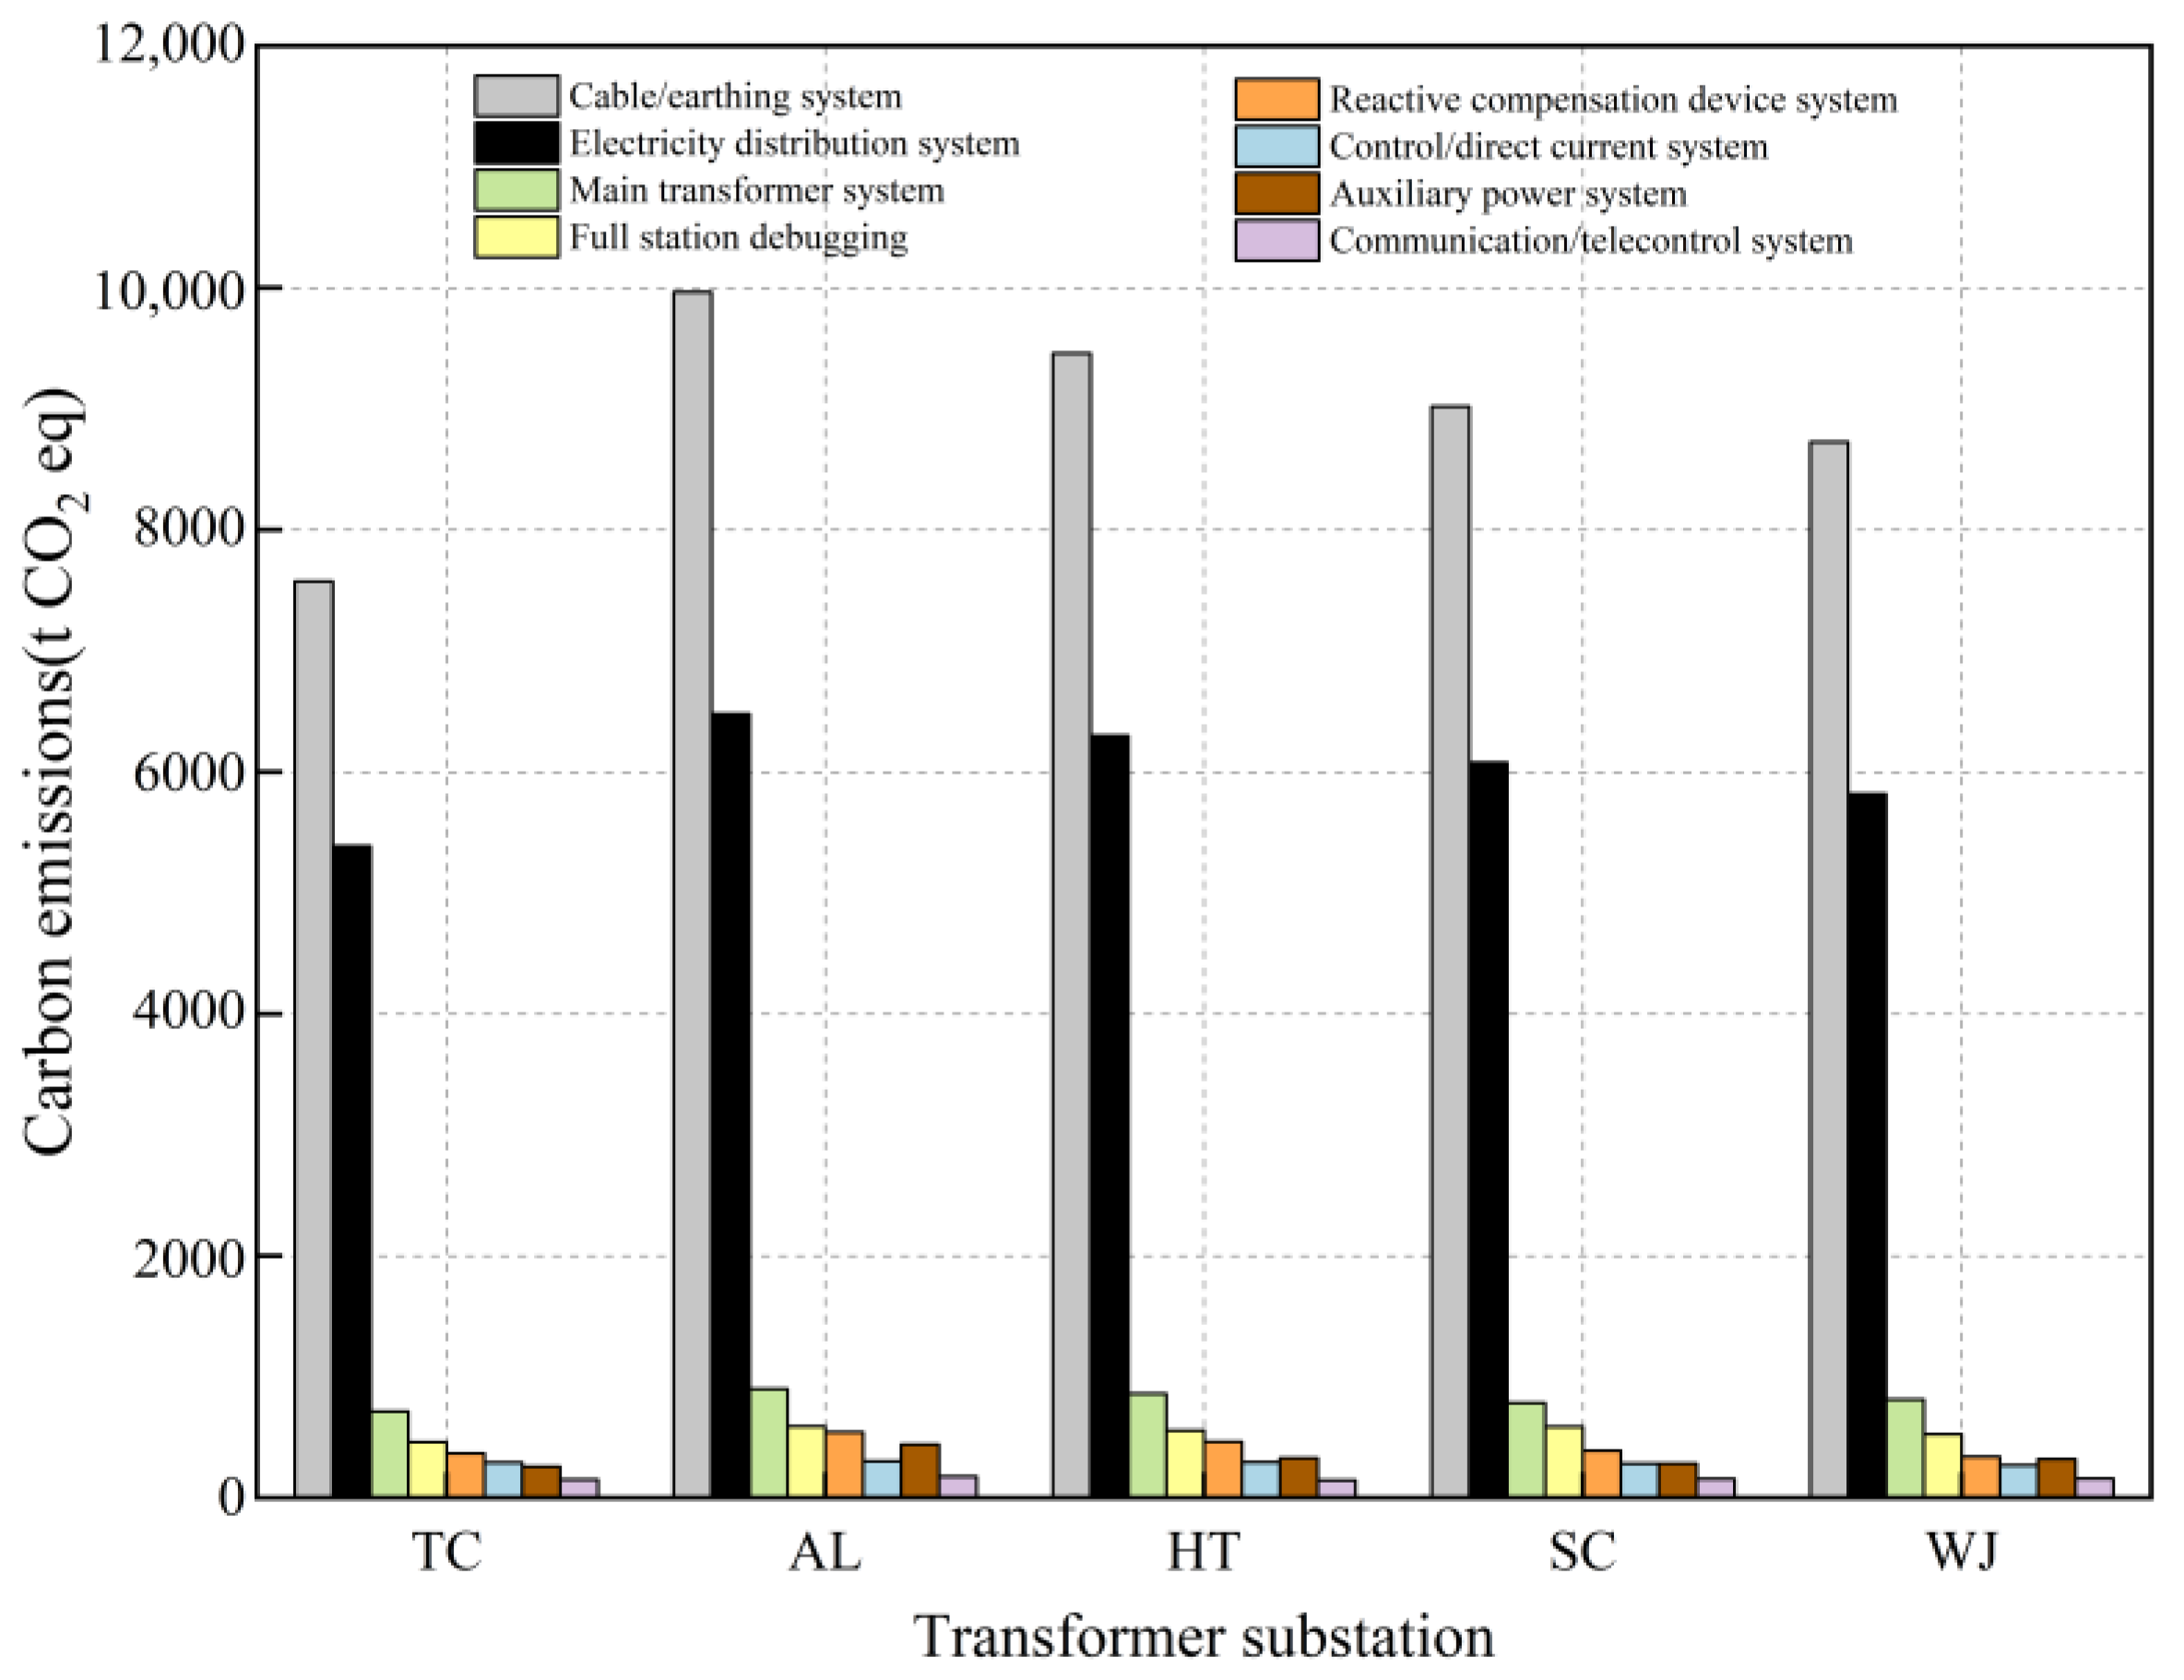
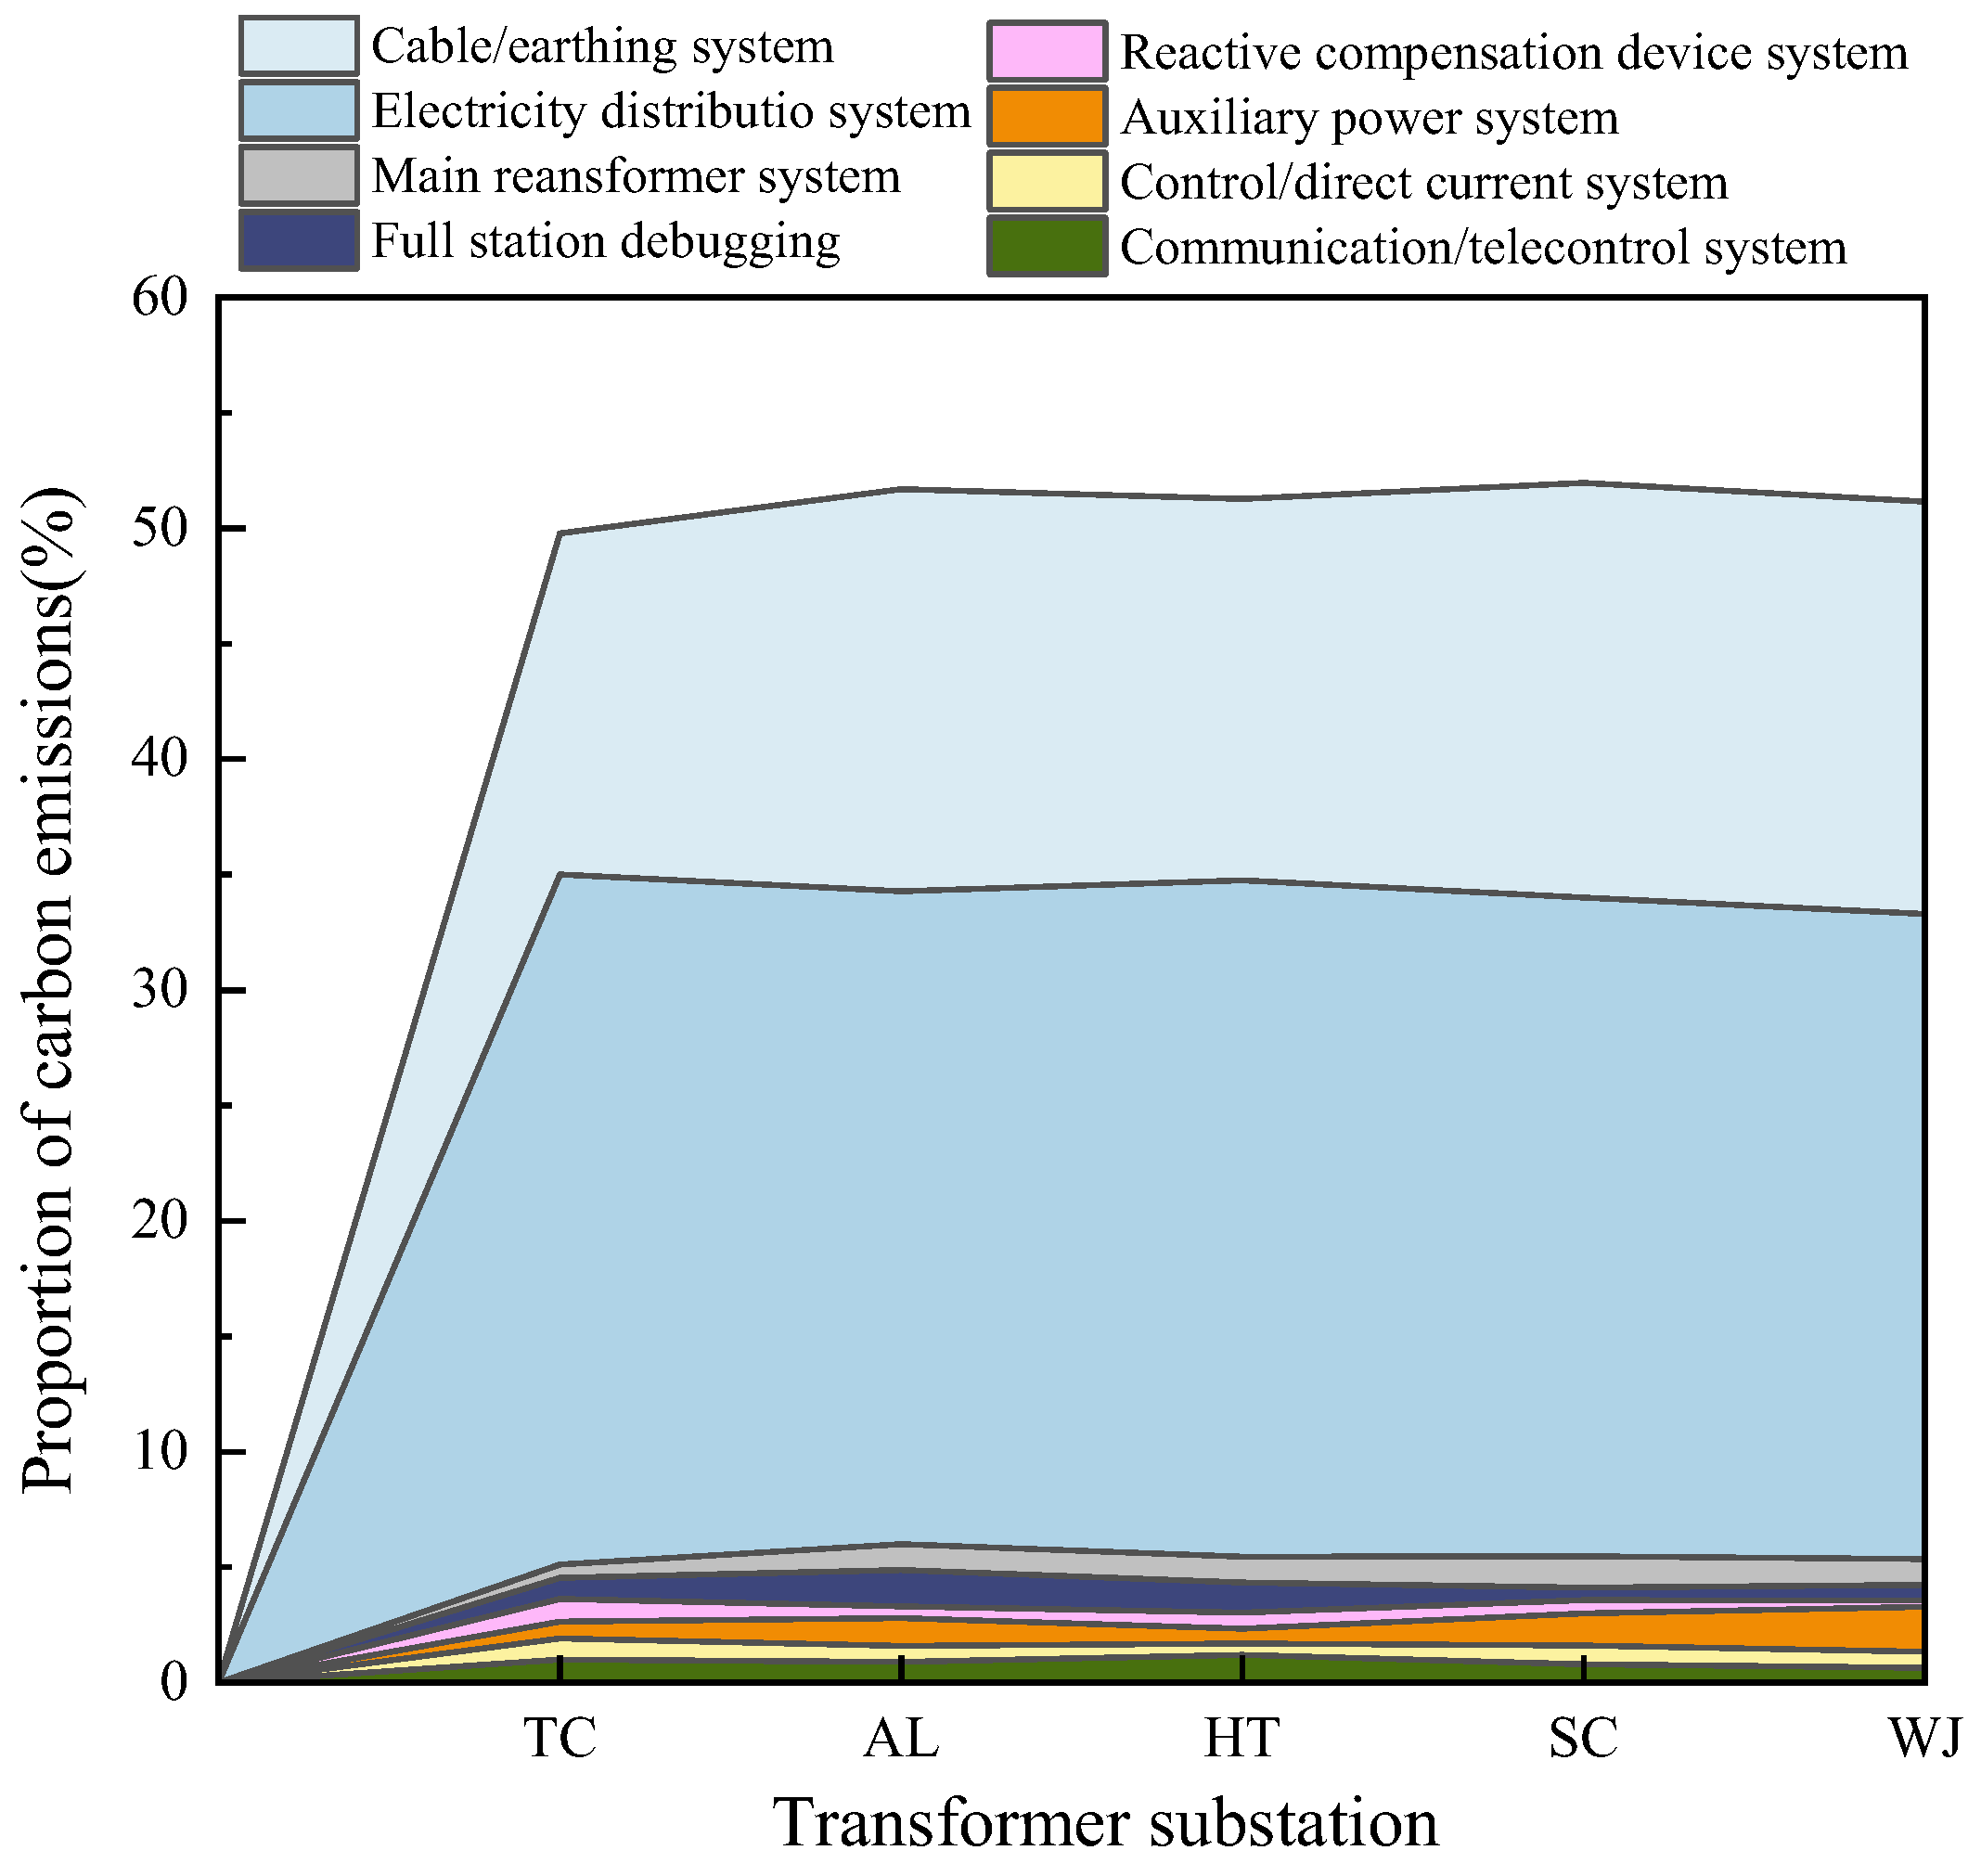
3.1.2. Carbon Emissions from Installation Engineering

The installation engineering can be divided into the main transformer system, electricity distribution equipment, reactive compensation device system, control/direct current system, auxiliary power system, full station debugging, cable/earthing system, and communication/telecontrol system. Carbon emissions from installation engineering in each transformer substation are listed in Figure 5.
In a cable/earthing system, a large amount of power cables is used to transmit and distribute electrical energy, and control cables connect each electrical equipment and transmit the internal signals to implement the control and detection of transformer substations. In addition, cable auxiliary facilities, fire protection facilities, and earth grounding require a large number of materials and manpower, making carbon emissions related to cable/earthing systems responsible for more than 50% of installation engineering. The investment in the cable/earthing system is closely related to the station area and distribution equipment. Based on Figure 6, the TC transformer substation produced the least carbon emissions corresponding to the cable/earthing system, accounting for 7577.04 t CO2 eq, while the AL substation produced the most emissions, amounting to 9967.36 t CO2 eq. About 34% of the carbon emissions from installation engineering are generated by electricity distribution equipment. Carbon-intensive products, including switch plants, arresters, and voltage transformers, contain a large amount of metal and building materials. Due to geographical location and station area, the cost of distribution equipment in each substation is different, leading to the discrepancy in carbon emissions. The main transformer system is the core of the substation; it is the key device to ensure the safe and stable operation of the power supply. The transport and installation costs of transformers account for the largest proportion of this part. The AL transformer substation is located in Altay, Northern Xinjiang, with the most inconvenient traffic conditions and the longest transportation distance among the selected substations. The HT transformer substation is located in Southern Xinjiang, which is far away from the city, increasing the cost of transportation as well. The rest of the substations are relatively close to cities, resulting in lower transport costs and associated carbon emissions. Full station debugging consists of equipment debugging and gas trials; numerous amounts of energy and materials will be consumed during the process of debugging. As the carbon emission intensity of the relevant test is 1.33, which is lower than other items, the difference in carbon emissions among the substations is not obvious. The rest of the systems play a significant role in the transformer substation as well. On account of the limited quantities of relevant carbon-intensive products, carbon emissions generated by these systems amount to a relatively low proportion in the installation engineering.

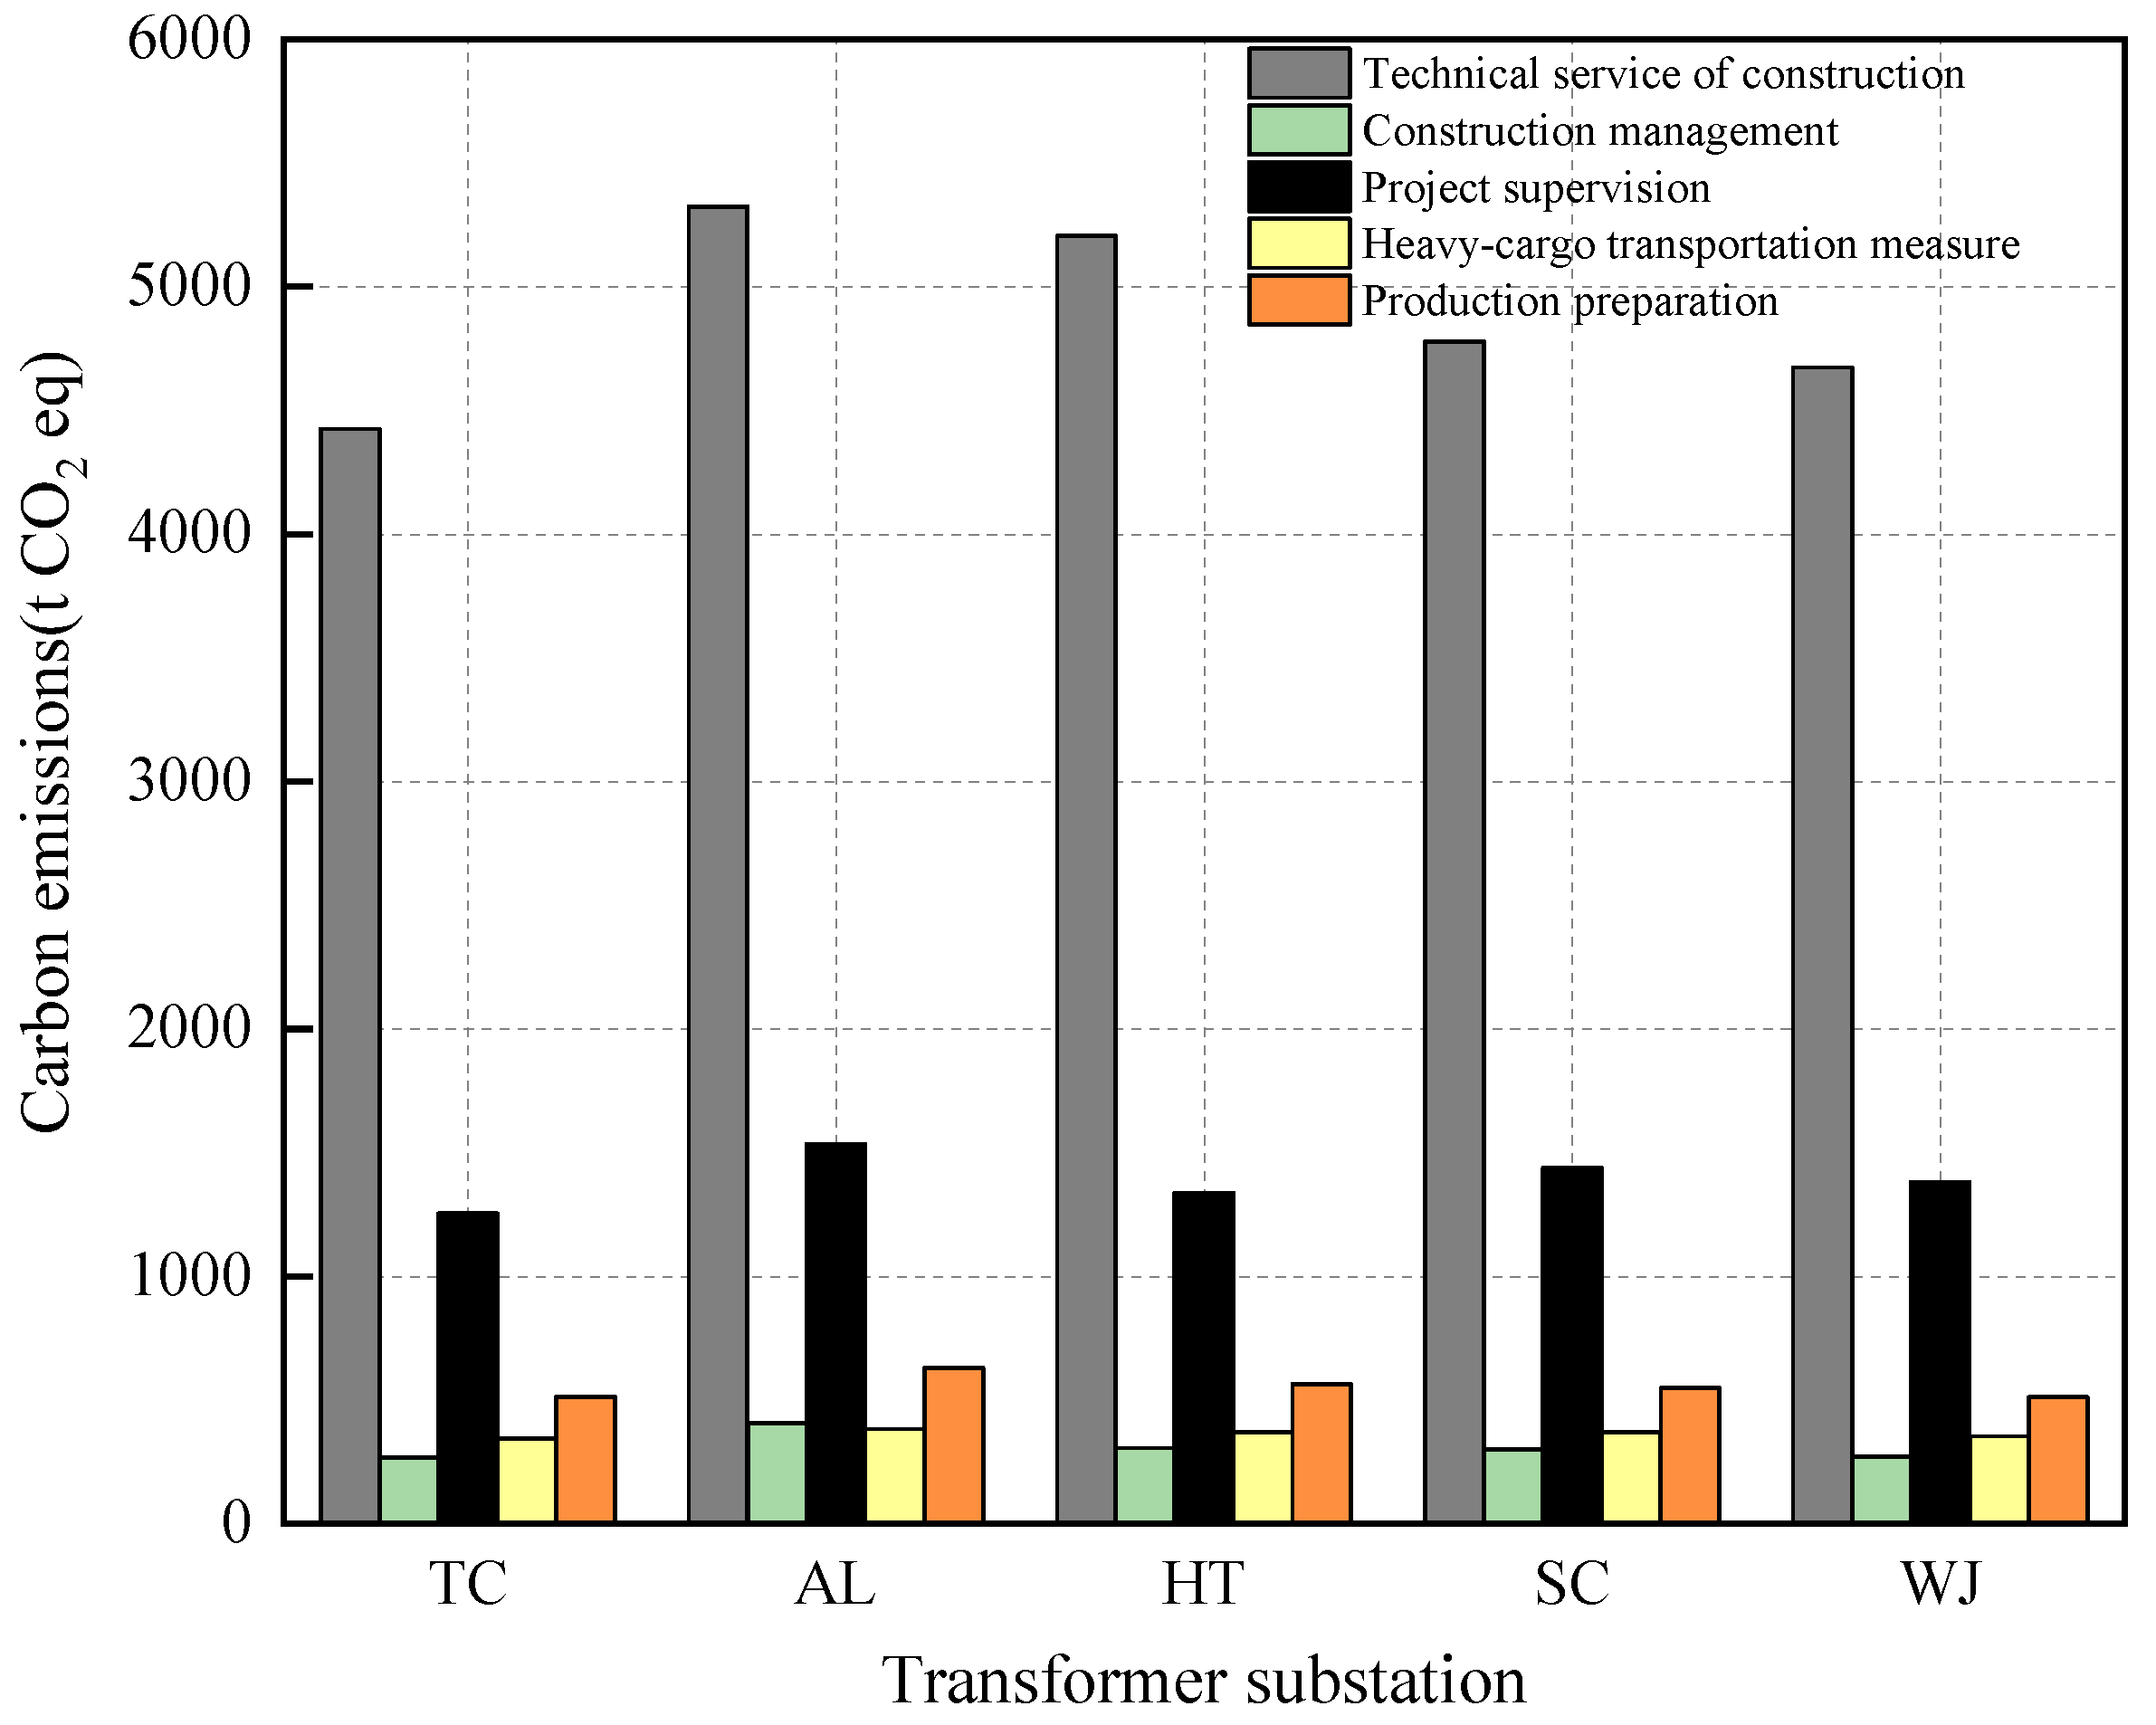
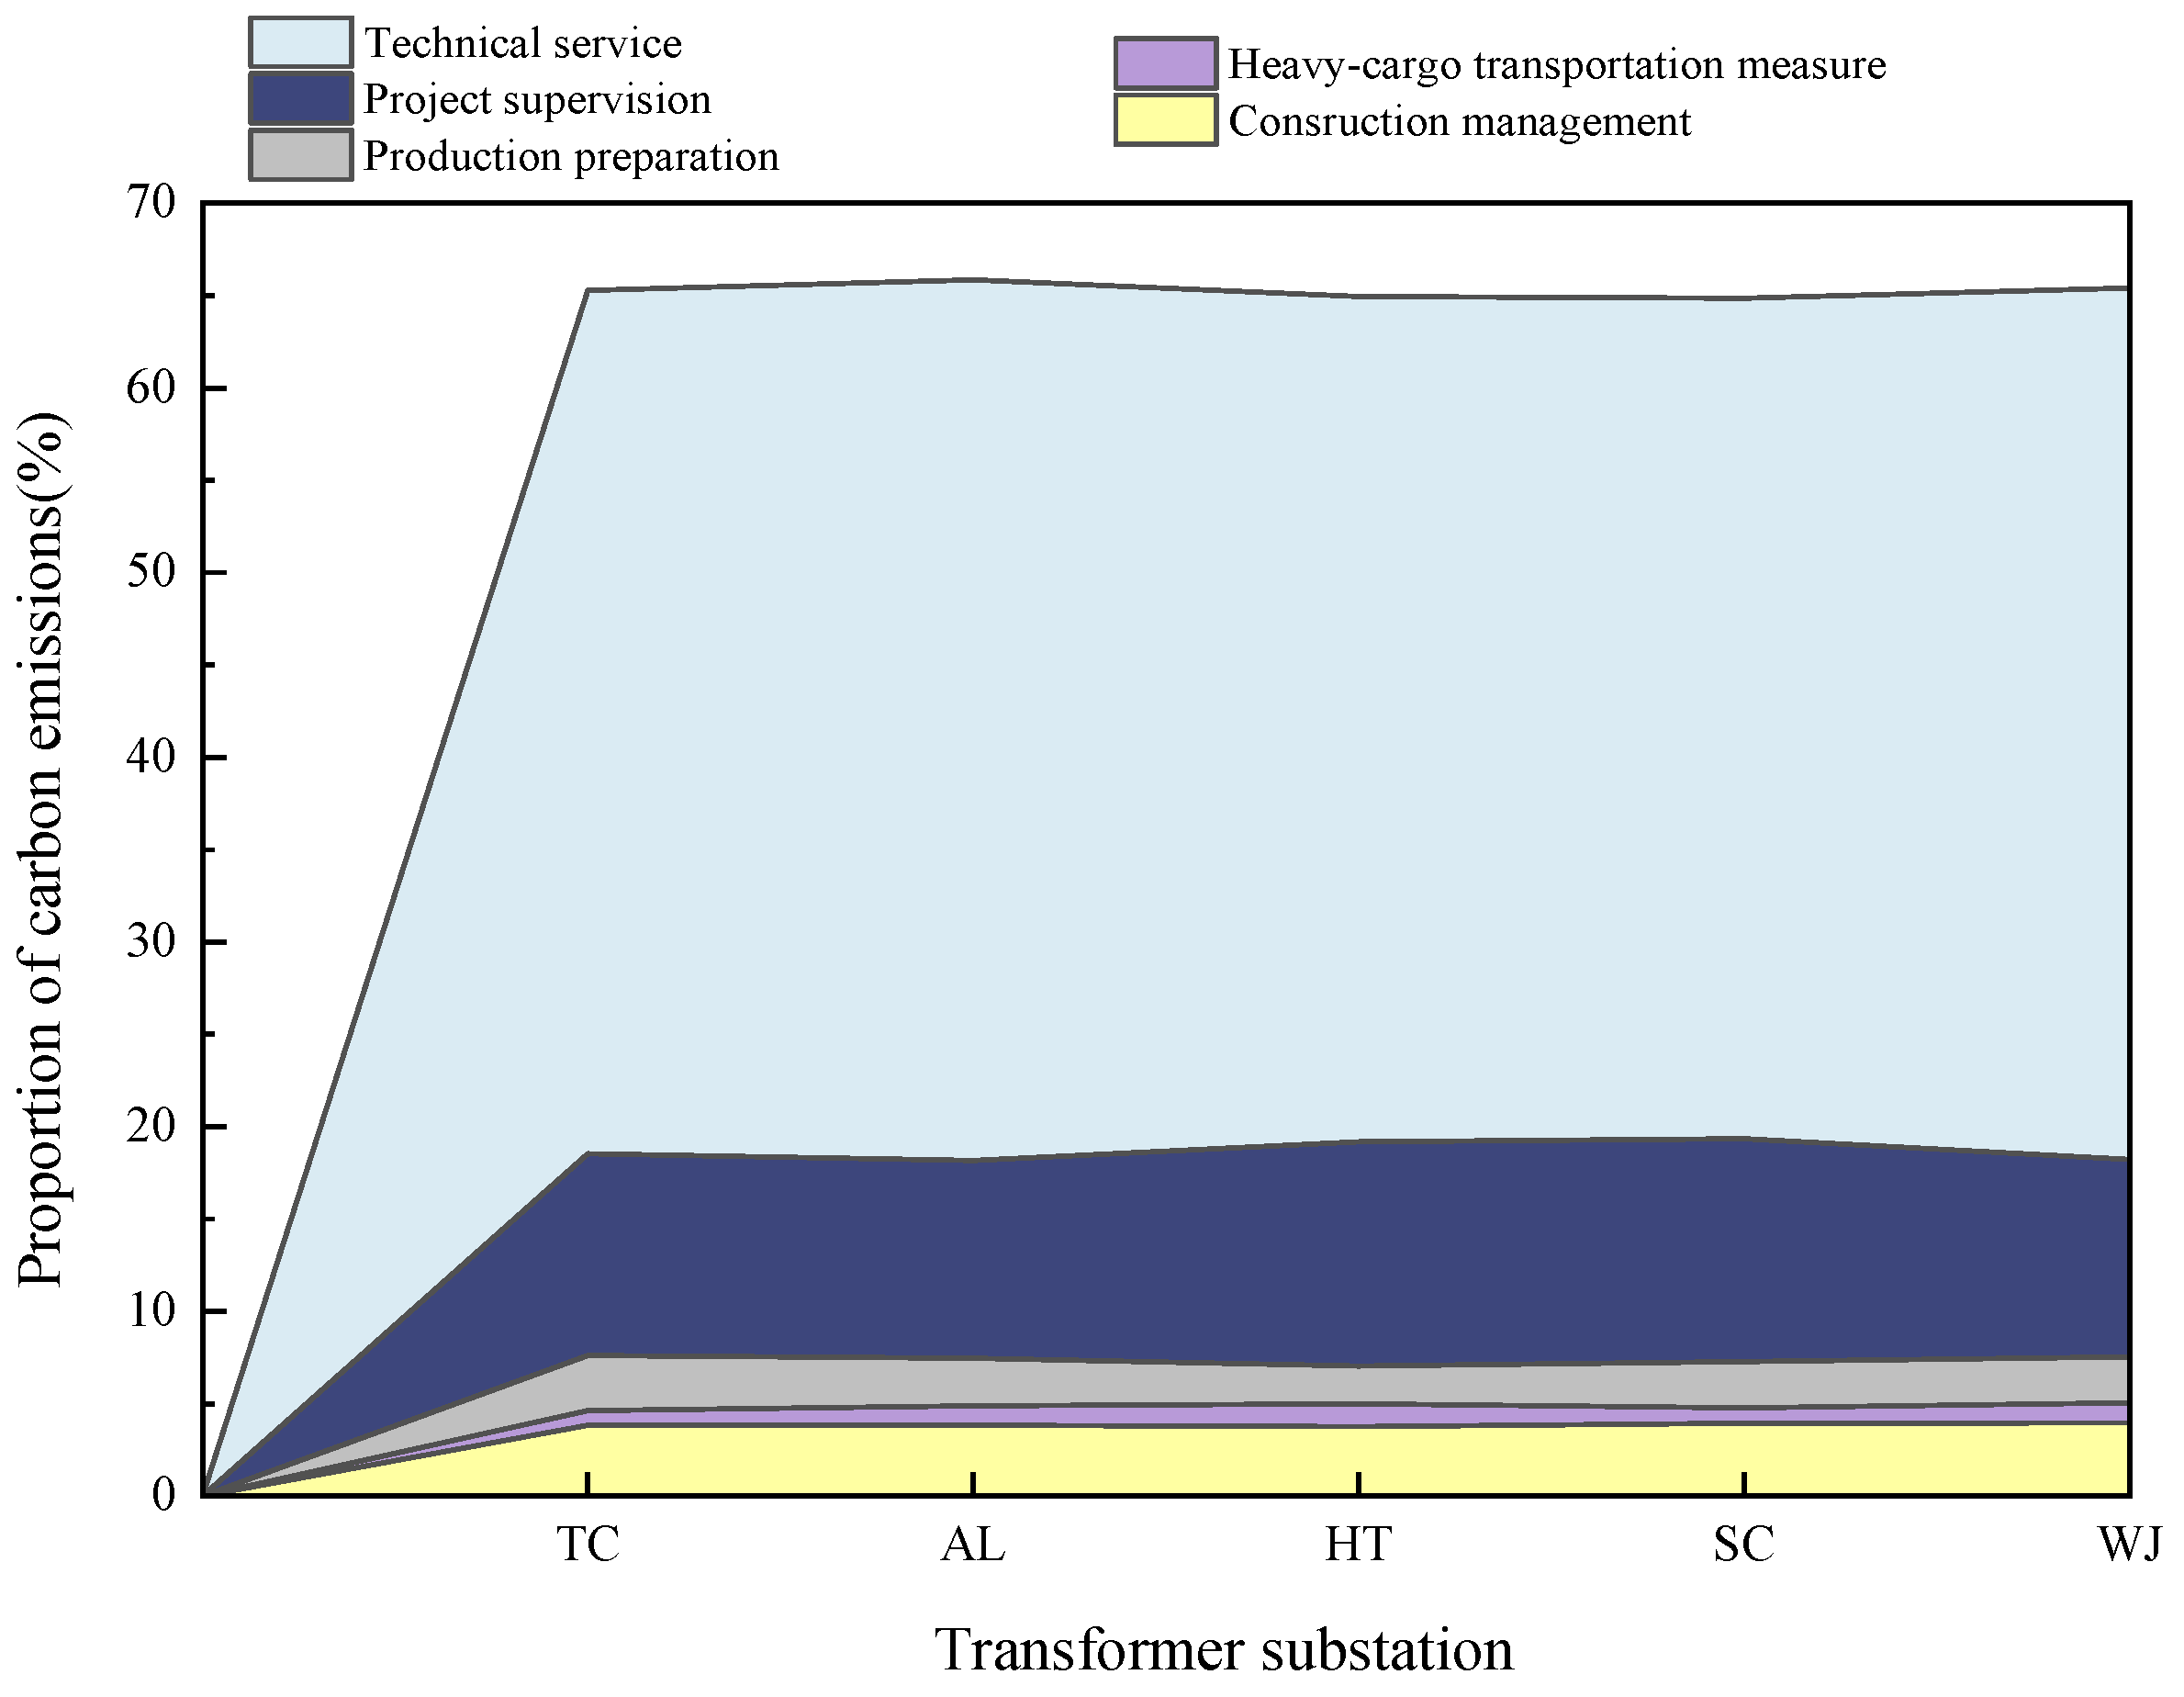
3.1.3. Carbon Emissions of Additional Service

In the calculation of carbon emissions in newly built transformer substations, besides the construction and installation engineering, carbon emissions related to additional services cannot be ignored. Carbon emissions from additional service in each transformer substation are listed in Figure 7, and the proportion is shown in Figure 8. The cost of additional services incorporates technical service fees, construction management fees, project supervision fees, heavy cargo transportation measure fees, and production preparation fees. As the most significant part of the early stages of construction, the technical services can be categorized into feasibility study, survey, design, review, soil and water conservation study, pile test and inspection, etc. In the process of a feasibility study and survey, researchers will travel to the preselected site to conduct geotechnical experiments. Transportation and testing will produce numerous carbon emissions, which are easily overlooked. Carbon emissions in the process of design and review mainly considered the consumption of electricity caused by office equipment. Emissions related to environmental assessment and pile tests are associated with transportation and equipment as well. Carbon emissions of technical services that are not easy to calculate can be well estimated after using the calculation method illustrated in this paper and account for about 60% of the emissions of the additional services. The construction management fees are mainly composed of transportation fees, tool usage fees, bidding fees, cost consulting fees, etc. These items have low investment and carbon emission intensity. Thus, they generate fewer carbon emissions, only accounting for 4% of the additional services. The project supervision fees consist of construction supervision and equipment supervision. Due to the long cycle and largely involved contents, carbon emissions generated in the supervision amount to 18.5% of the additional services. Transportation costs for construction materials and electrical equipment have been accounted for in the related items. So, the costs of the remaining goods, such as office appliances and furniture, are attributed to heavy-cargo transportation measure fees, which generate about 5% of the carbon emissions. Furthermore, production preparation fees include vehicle purchase expenses and staff training fees, which produce about 7% of the carbon emissions. In general, each substation has a different proportion of carbon emissions from additional services due to its geographical location and design requirements, but the gap is not large.

3.1.4. Discussion about the Proposed Method and Carbon Emissions

The proposed method in the paper is capable of giving a comprehensive and accurate calculation of carbon emissions for 750 kV transformer substations. First, the energy structure of China is different from that of European countries; the carbon intensities used in this paper correspond to the economic sector of China, which is more in line with the actual situation [18]. Second, this paper has established a detailed construction list, which has a wider accounting scope, is not limited to a specific process or device, and can provide a reference for the same type of transformer substation. In addition, previous studies used the LCA method to calculate carbon emissions, which was based on the carbon emission factor of the base year. With the progress of technology and the change in energy structure, there is a lag in updating the relevant data, which results in poor accuracy of the calculation results [43]. While the hybrid method used in the paper is based on the economic sector, which has higher reliability.
The results of the carbon emissions are based on the construction lists of the newly built substations. However, in the actual engineering, part of the project will be reserved for future expansion or renovation due to the limitation of funds or materials. Furthermore, due to the long construction period of the expansion, there is a lag between engineering quantities and investment funds, resulting in calculation results that may be inconsistent with the actual situation. In addition, the distribution equipment and main transformer system of the ultra-high voltage (UHV) substation are different from the conventional substation, and the investment in the UHV substation includes dispatch costs and interface costs for different regions [16]. Further research should focus on establishing the substations’ construction lists and comparing carbon emissions at different voltage levels.

3.2. Parameter Stochastic Analysis

Based on the data calculated in Section 3.1, due to the geographical location, soil quality, climatic conditions, land area, and other factors, the investment cost of each newly built 750 kV transformer substation is quite different, resulting in associated carbon emissions that differ from each other. Therefore, it is necessary to research the interval and distribution trend of carbon emissions from substations in Xinjiang and find possible carbon reduction methods to provide references for similar projects.
In order to evaluate the impact of input parameters and give the interval of carbon emissions, Monte Carlo simulation and analysis are conducted in the present paper. Due to the influence of geographical location, the selected transformer substations have certain regional representations in soil quality, foundation types, transportation cost, and other aspects. Beta-pert distribution requires the maximum, minimum, and most optimistic values, so the data of the selected transformer substations in Xinjiang Province, which were provided by construction organizations, were calculated and classified. After completing the data statistics, 10,000 sets of Monte Carlo simulations based on the beta-pert distribution were generated. It should be noted that the minimum and maximum values of carbon emissions are the sum of the minimum and maximum of each item in the substations, representing the theoretical range. While the most optimistic value is the average of several substations that are close in the data.
The results of the Monte Carlo simulation are shown in Figure 9. Interval [61,500, 63,000] has the largest frequency; the mean value and standard deviation are 62,317.59 t CO2 eq and 2096.59 t CO2 eq, respectively. The 90% confidence interval of the carbon emissions in the Monte Carlo simulation is [58,871.04, 65,759.34] t CO2 eq, and the discreteness of the uncertainty analysis, which can be expressed by the coefficient of variation, is 0.034. The data obtained through Monte Carlo simulation has less discreteness, and the 90% confidence interval can be used to represent the carbon emission interval of the newly built 750 kV transformer substations in Xinjiang province or similar terrain.
Various items are involved in the calculation of carbon emissions, which can affect the results of the simulation. Therefore, it is necessary to evaluate the contribution of each item to the uncertainty of the results and explore appropriate carbon reduction schemes.
As shown in Figure 10, the electricity distribution building accounts for the largest proportion of total carbon emissions; the larger range of emissions has a more significant influence on IU. The cable/earthing system is another factor that contributes more than 15% to IU in substations. The contribution to carbon emissions and IU of most items is concentrated in the range of [0%, 5%], which is shown in Figure 10b. Generally, items with larger carbon emissions contain more carbon-intensive products; the uncertainty of the quantity will make the change in IU more obvious. Carbon-intensive products such as steel reinforcement, cement, masonry, and cables should be emphasized in carbon reduction. According to the calculated data and available technology, some carbon reduction measures have been proposed in this paper. Using environmentally friendly building materials, such as low-clinker content cement or low-carbon gel materials to substitute Portland cement in construction engineering, is an effective measure for carbon reduction. The newly built transformer substations under the existing technology are mainly cast-in-situ. However, building industrialization is considered one of the most effective ways of fostering sustainable development, and prefabricated buildings have been extensively promoted in China. With the advancement of related technology, the application of prefabricated assembly structures in transformer substations will become more extensive and have a more positive impact on carbon emission reduction. Buildings can use steel structures that can be dismantled for recycling after reaching their service life. Likewise, cable trenches and walls can be prefabricated to save on concrete. Moreover, using local materials as much as possible can save a large amount of carbon emissions from transportation.

3.3. Influence of Different Types of Foundations on Carbon Emissions

Currently, the construction and development of China’s power grid have made a qualitative leap. With the development of a low-carbon economy and smart power grid, the construction of the power grid has been evolving in the direction of resource-saving and environment-friendly practices under the premise of ensuring safe operation. Carbon emissions related to the construction engineering of newly built transformer substations account for more than 50% of them, and the types of foundations have a significant impact. Therefore, it is necessary to investigate the foundation types and related carbon emissions, which is helpful to explore possible carbon reduction measures.
The main production building (main control communication building, relay rooms, distribution rooms, equipment rooms, and guardhouse) is framed, and the foundations are mostly independent foundations. However, due to the soft foundation soil, the partial equipment room and guardhouse also use strip foundation. Foundation types, engineering quantities, and costs of the electricity distribution building are closely related to switchgear in selected substations. The selection of switchgear and device types is an important part of the design of transformer substations. At present, gas-insulated switchgear (GIS) and air insulated switchgear (AIS) are two ubiquitous distribution types [44]. GIS is an optimized combination of primary equipment except for transformers, which include circuit breakers, isolation switches, voltage transformers, arresters, and bus bars, which are all enclosed in a metal grounded shell and filled with SF6 gas under a certain pressure. AIS is a traditional power distribution device that uses ceramic as the equipment shell and makes its primary equipment contact with the air directly. GIS has the advantages of a compact structure, a small occupied area, high reliability, and strong adaptability to the environment. The life of the design is up to 30 years, resulting in less work for maintenance. However, the disadvantage is that GIS is a completely closed piece of equipment with a high cost, and it cannot be quickly removed by external observation when a fault occurs. Compared to GIS, the overall structure for AIS is simple, it is conducive for daily overhaul and maintenance, and the clear equipment layout makes the expansion of the substation more convenient. However, the disadvantage of AIS is that it covers a wider area, and the exposed electrical components are easily affected by the environment. Moisture in the air attached to the surface may cause resistance reduction, breakdown of the insulation layer, or other failures that are not conducive to the safe operation of the substation. GIS has many advantages; however, due to the much higher purchase expenses of devices and relatively lower land acquisition costs in Xinjiang province, AIS has been widely used as well. Both of the switchgears will be taken into consideration in the substation design, and the most economical scheme will be selected.
Switchgear will lead to differences in foundation types and input costs, resulting in discrepancies in carbon emissions. As shown in Table 1, through the investigation of the selected substations, AIS has been adopted in the TC, AL, SC, and HT 750 kV transformer substations, and GIS has been adopted in the WJ substation. In order to compare the differences between substations that adopt GIS, the present paper analyzes the data of 750 kV transformer substation RQ, which is under construction. RQ 750 kV transformer substation is located in the southeast Gobi area of Tarim Basin. The type of foundation soil is hard soil, mainly composed of breccia, and saline foundation soil is highly corrosive to the concrete structure. According to the design, there are two sets of main transformers (1500 MVA), a four-circuit 750 kV overhead line, and a ten-circuit 220 kV overhead line.
There is no difference between GIS and AIS in the main transformer and secondary systems. The main transformer frames, 750 kV frames, 220 kV frames, and 66 kV frames, and the lightning rod tower of the two schemes all have independent foundations. When adopting the AIS scheme, the foundations of the main transformer, distribution equipment, HV reactor, and LV capacitor are built with slab foundations. While using the GIS scheme, distribution equipment (750 kV, 220 kV, and 66 kV) uses raft foundations with buttresses, and the foundations of the main transformer, HV reactor, and LV capacitor are built with block foundations. Furthermore, the firewall and enclosure inside the transformer substation all adopt strip foundation. As shown in Figure 11, carbon emissions related to the foundations are calculated through the final account document. When using the AIS scheme, due to the construction of a large number of independent foundations, related carbon emissions are responsible for the biggest proportion. Among them, the 750 kV frame is the most critical factor because of its high height and large load. Slab foundations and strip foundations have relatively less impact on carbon emissions. When using the GIS scheme, the small floor space and compact structure make the engineering quantity of distribution frames drop significantly, especially for 220 kV frames. Meanwhile, a large amount of construction and the higher cost of the raft foundations make the related carbon emissions almost equal to those of the independent foundations. When the equipment uses a slab foundation, it is always necessary to overlay the strip foundation. During the construction of the block foundation, the construction joint is set between the base slab and the superstructure, and the cost is lower. On the whole, the equipment foundation uses block foundations, which generate fewer carbon emissions. Generally speaking, the procurement and transportation costs of GIS are much higher than AIS, but it covers a smaller area and has a lower land acquisition cost. The investment in equipment foundations and related materials is also lower. GIS is convenient for installation and reliable for operation, and it generates fewer carbon emissions. With the continuous increase in land costs, GIS will be adopted more in the newly built transformer substation, which is more in line with the development direction of the green power grid.

4. Conclusions

To deal with different kinds of data sources and types feedbacked by different organizations involved in the construction process, when calculating and evaluating the carbon emissions in power transmission lines, the construction list and calculating method was proposed. Data were collected from a real project of west-to-east power transmission project to reveal and compare the actual situation of the emissions. Through the collection and analysis of field data from 750 kV transformer substations in Xinjiang, China, the confidence interval of carbon emissions in different transformer substations is calculated and revealed in detail. By identifying the key factors that affect the results through stochastic analysis and analyzing the influences of different types of foundations on carbon emissions, researchers can use them to guide carbon reduction efforts. The following conclusions are drawn according to the results:
  • The proposed method is capable of giving a comprehensive and accurate calculation of carbon emissions for transformer substations. The carbon emissions of the selected representative 750 kV substations are between 56,000 and 68,000 t CO2 eq. In terms of item category, construction engineering generates the most carbon emissions, followed by installation engineering and additional services. From the economic sector, the manufacture of equipment for power transmission (code 78) and construction (code 95) have the most significant impact on carbon emissions.
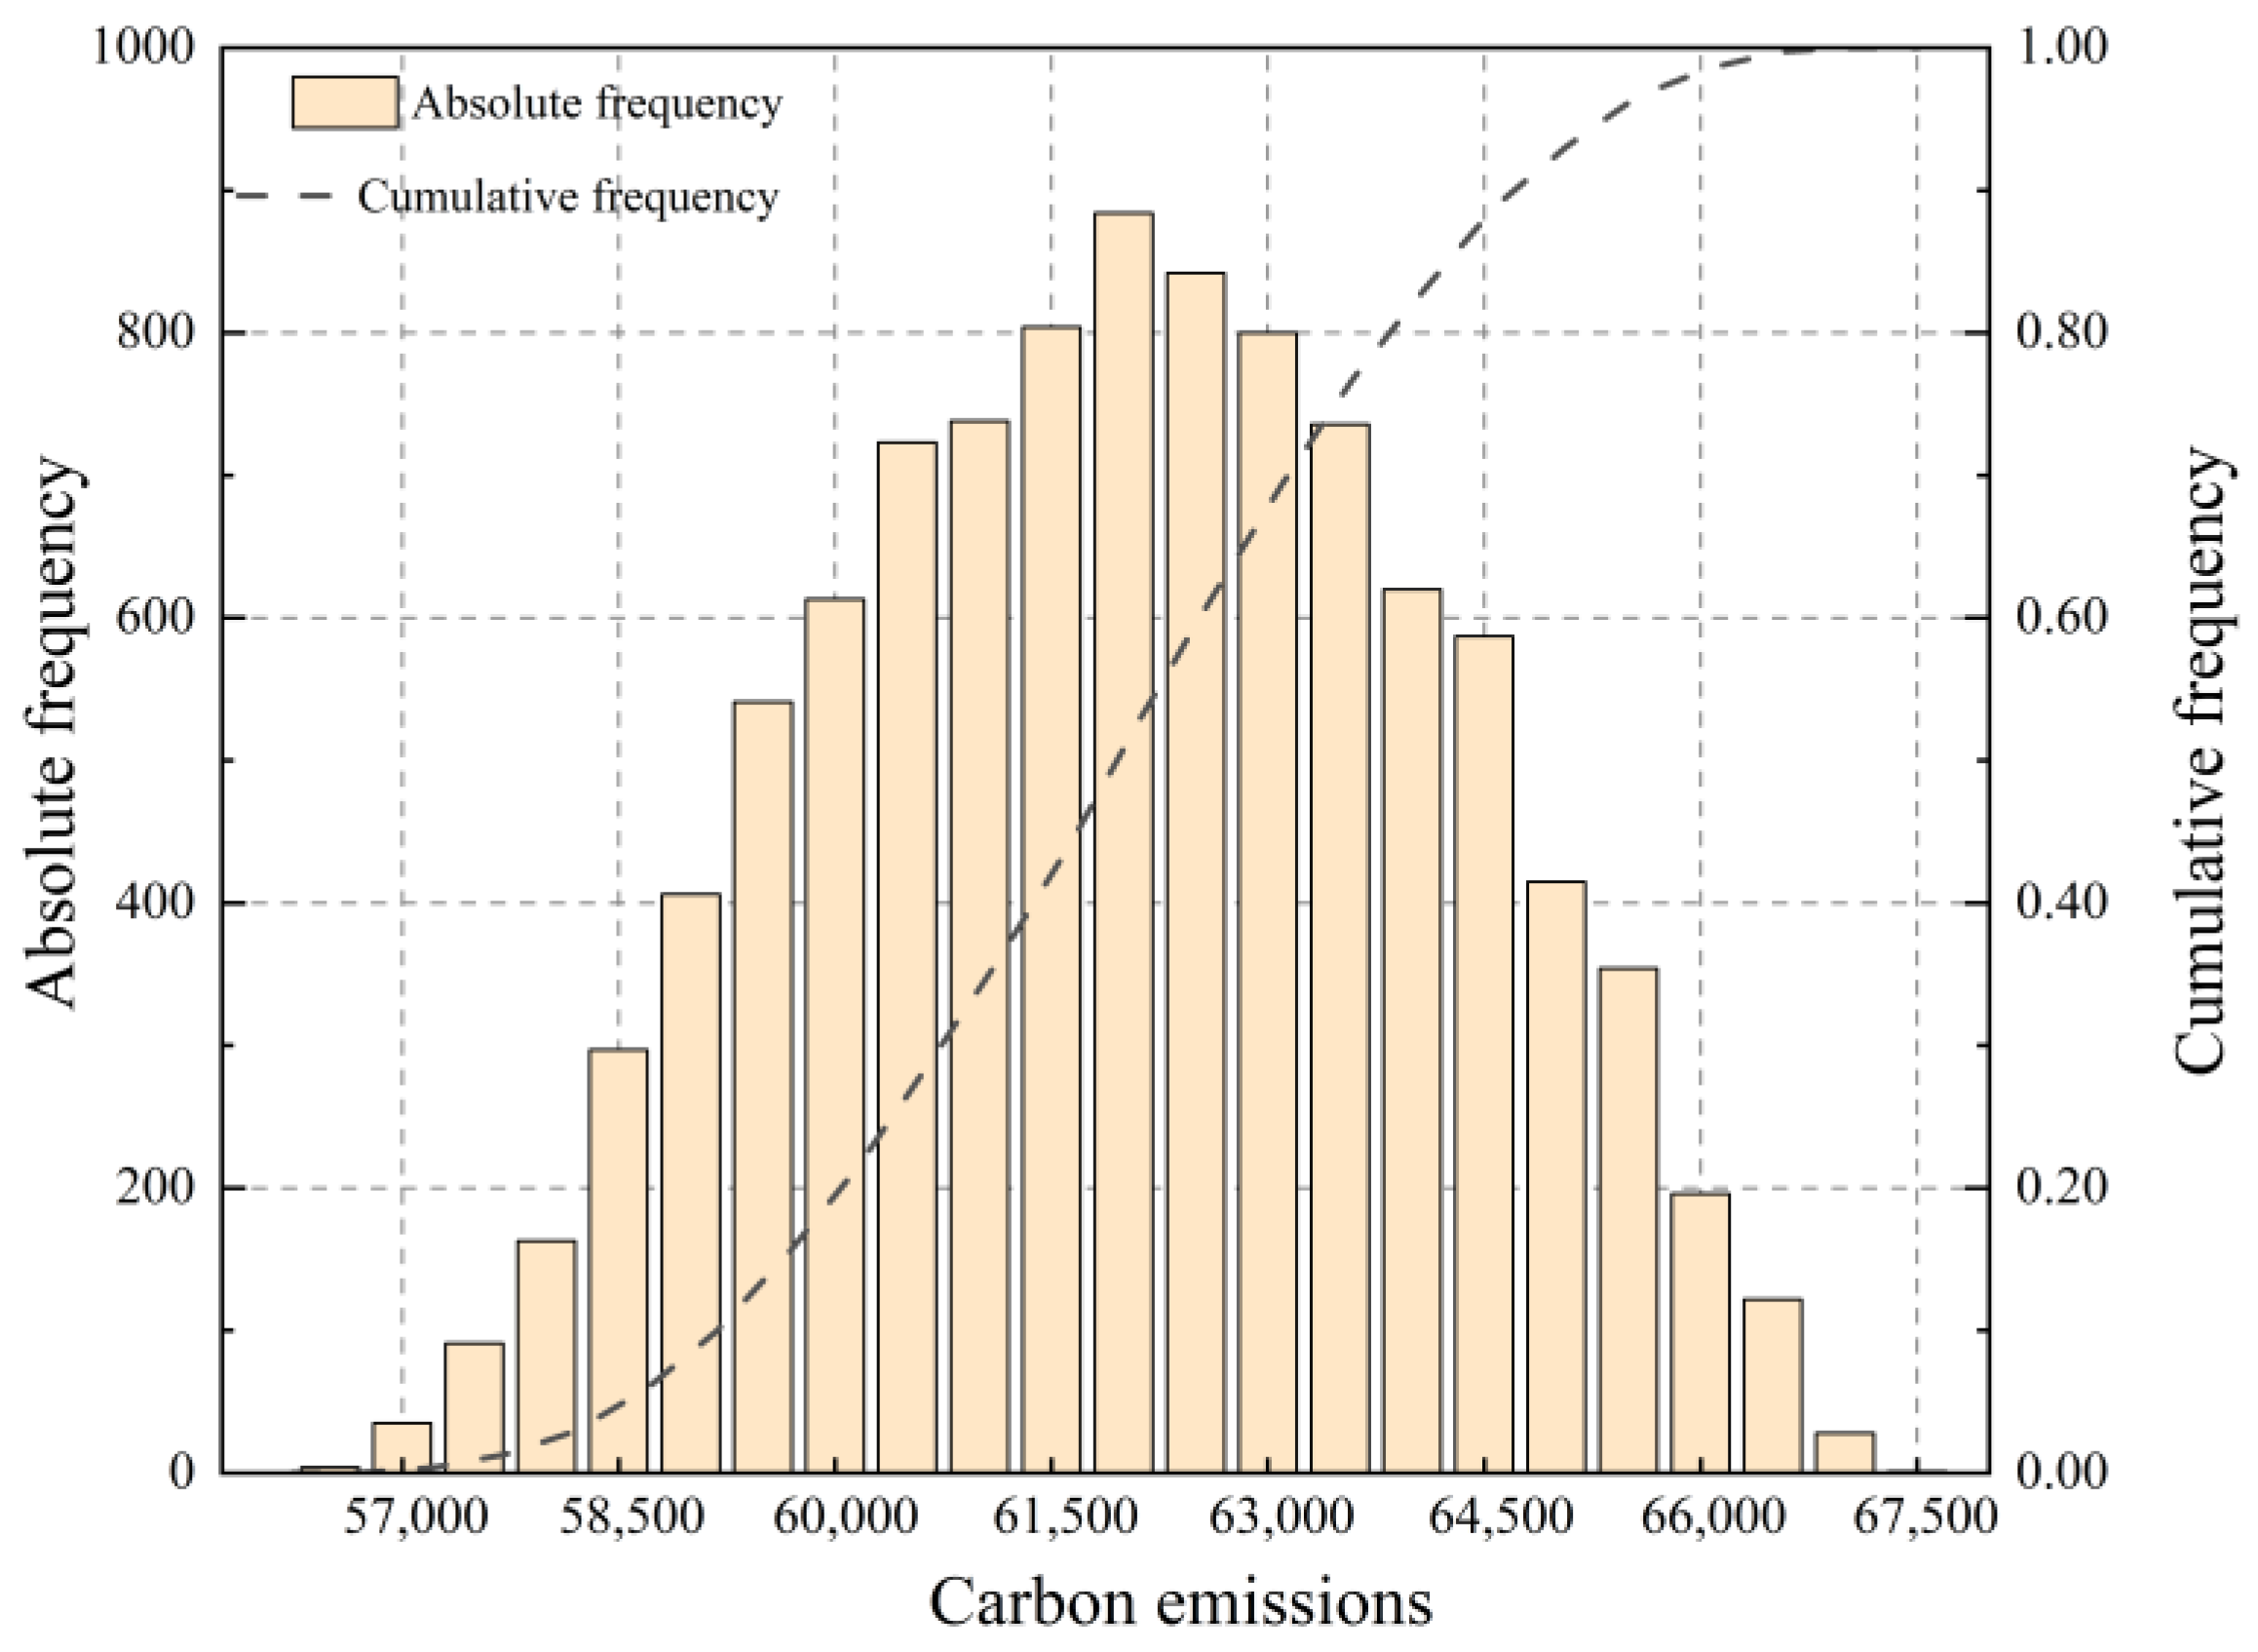
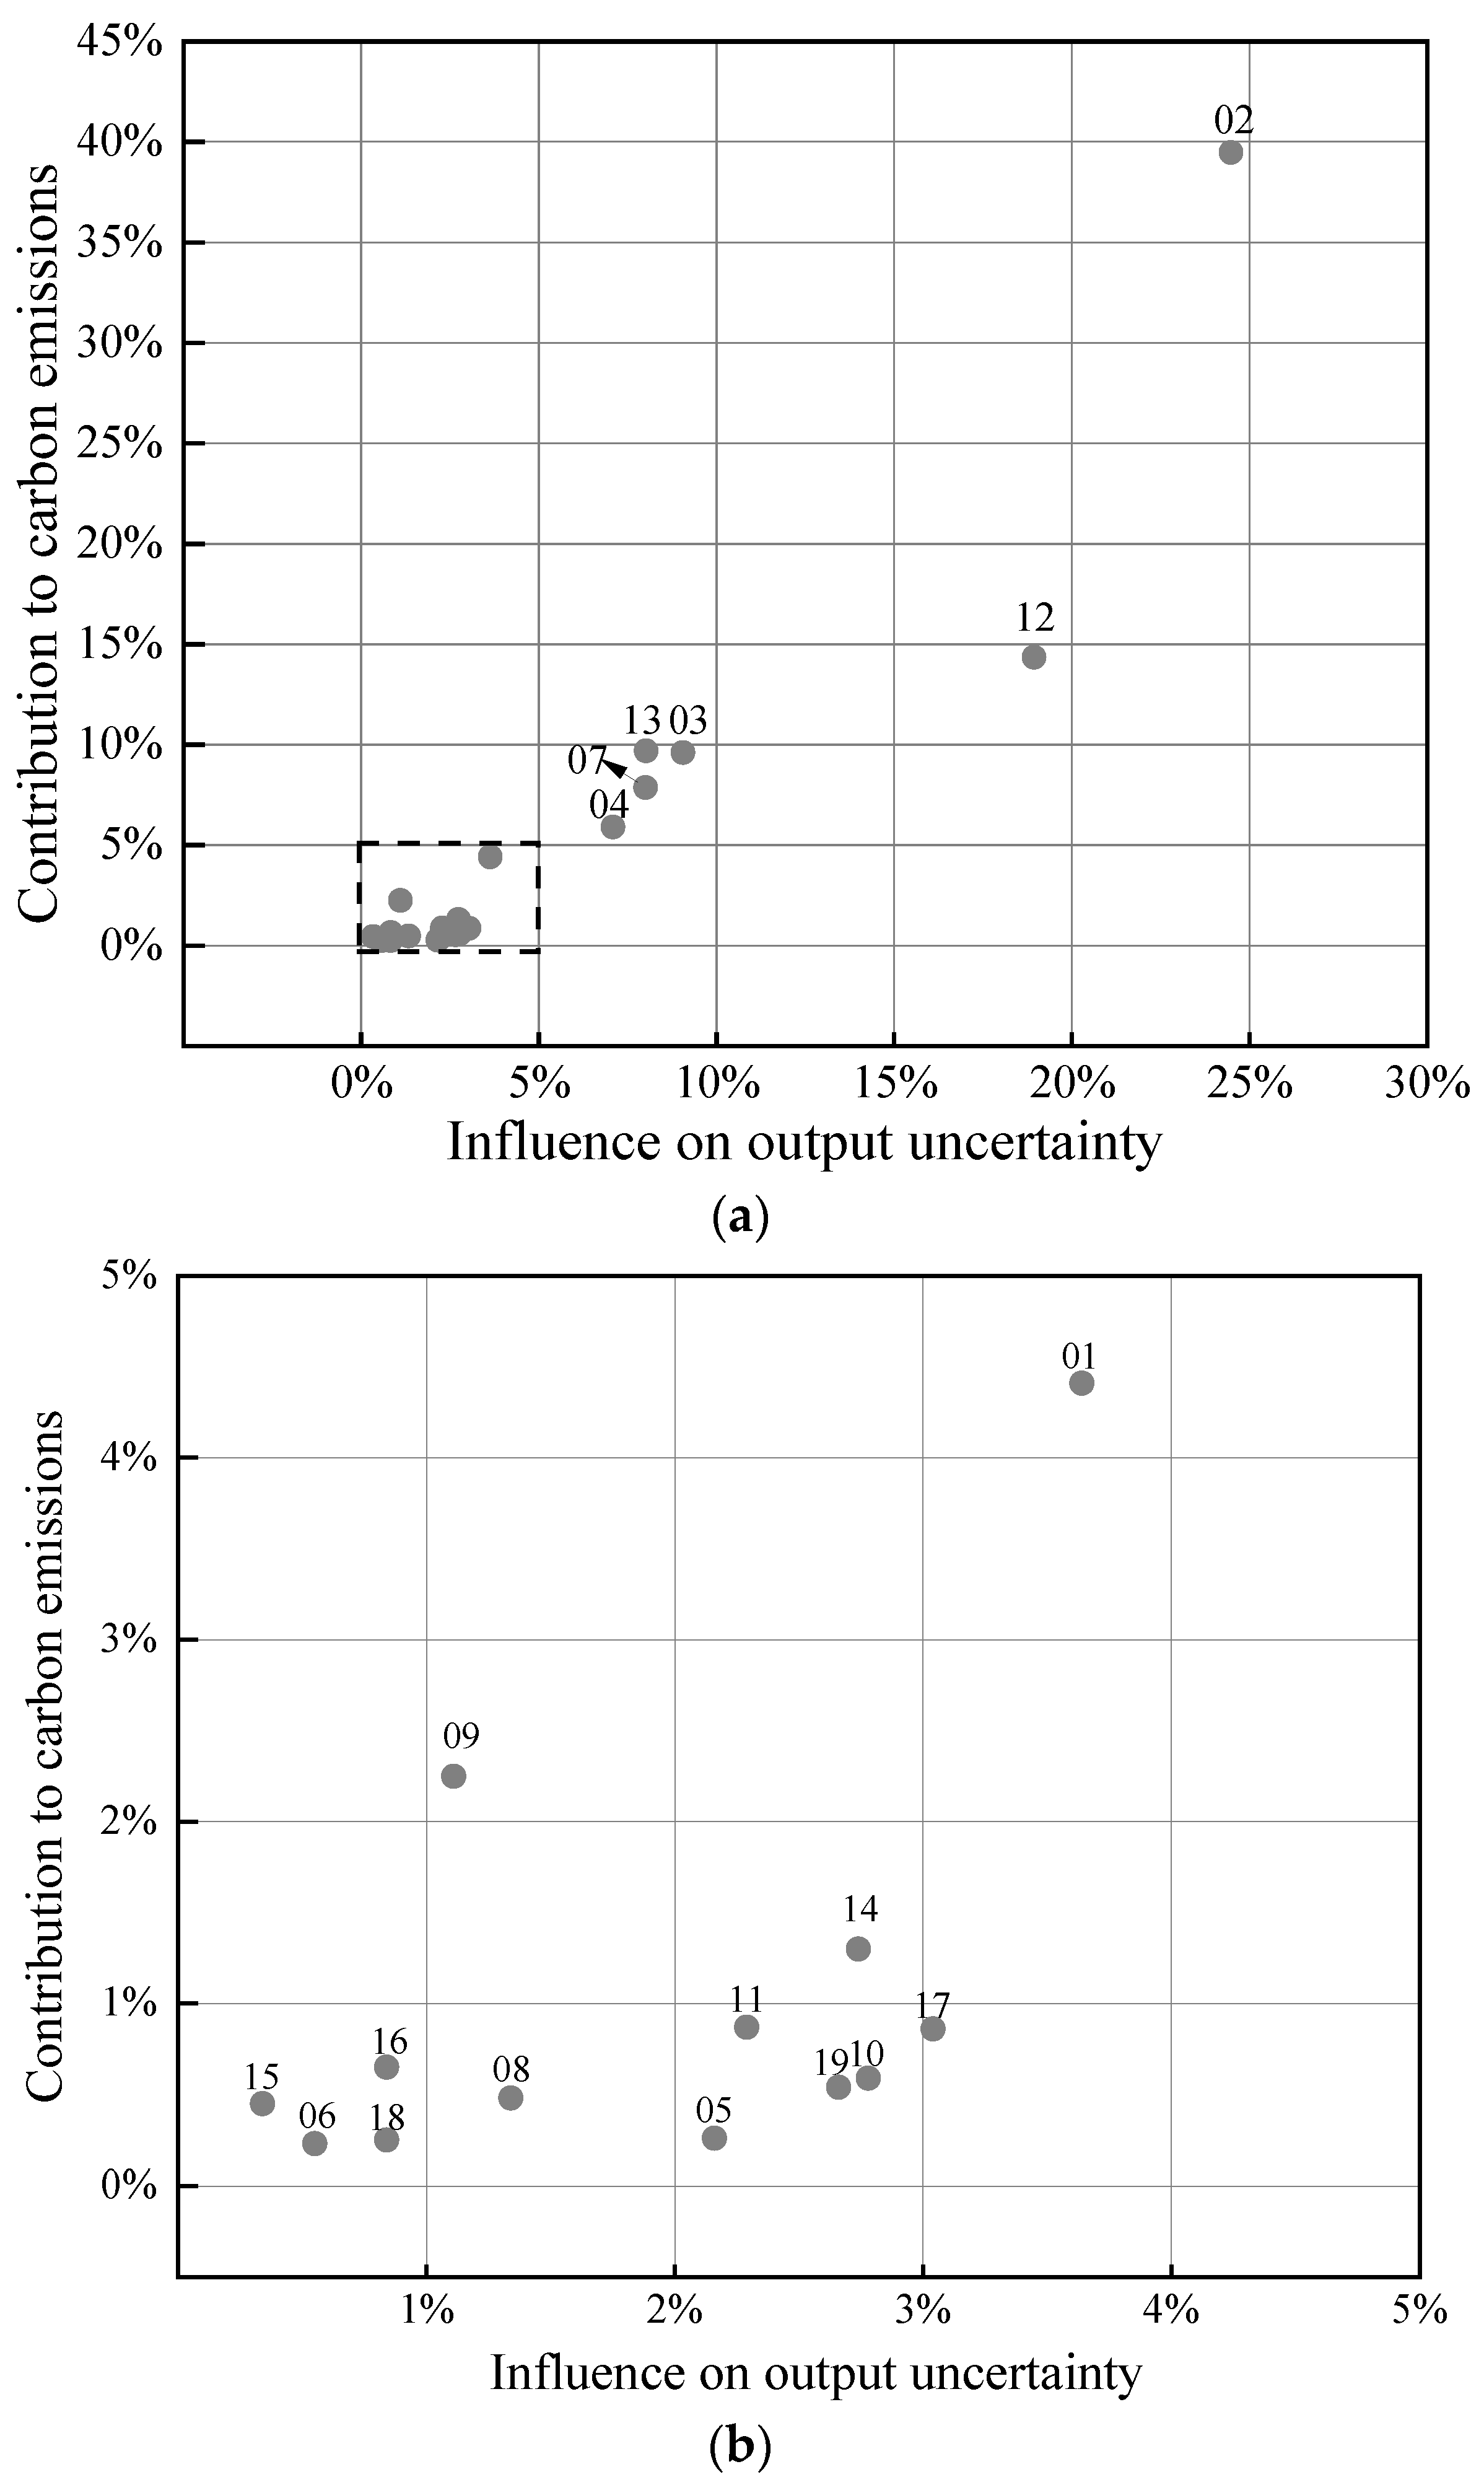
  • Through Monte Carlo simulation, the mean value and the standard deviation of carbon emissions for a newly built 750 kV transformer substation in Xinjiang are 62,317.59 t CO2 eq and 2096.59 t CO2 eq, respectively. The 90% confidence interval is [58,871.04, 65,759.34] t CO2 eq. The simulation results can be used to describe the distribution of carbon emissions from 750 kV substations in Xinjiang or similar terrain, and the influence of output data on the uncertainty is determined by studying the key factors of carbon emissions.
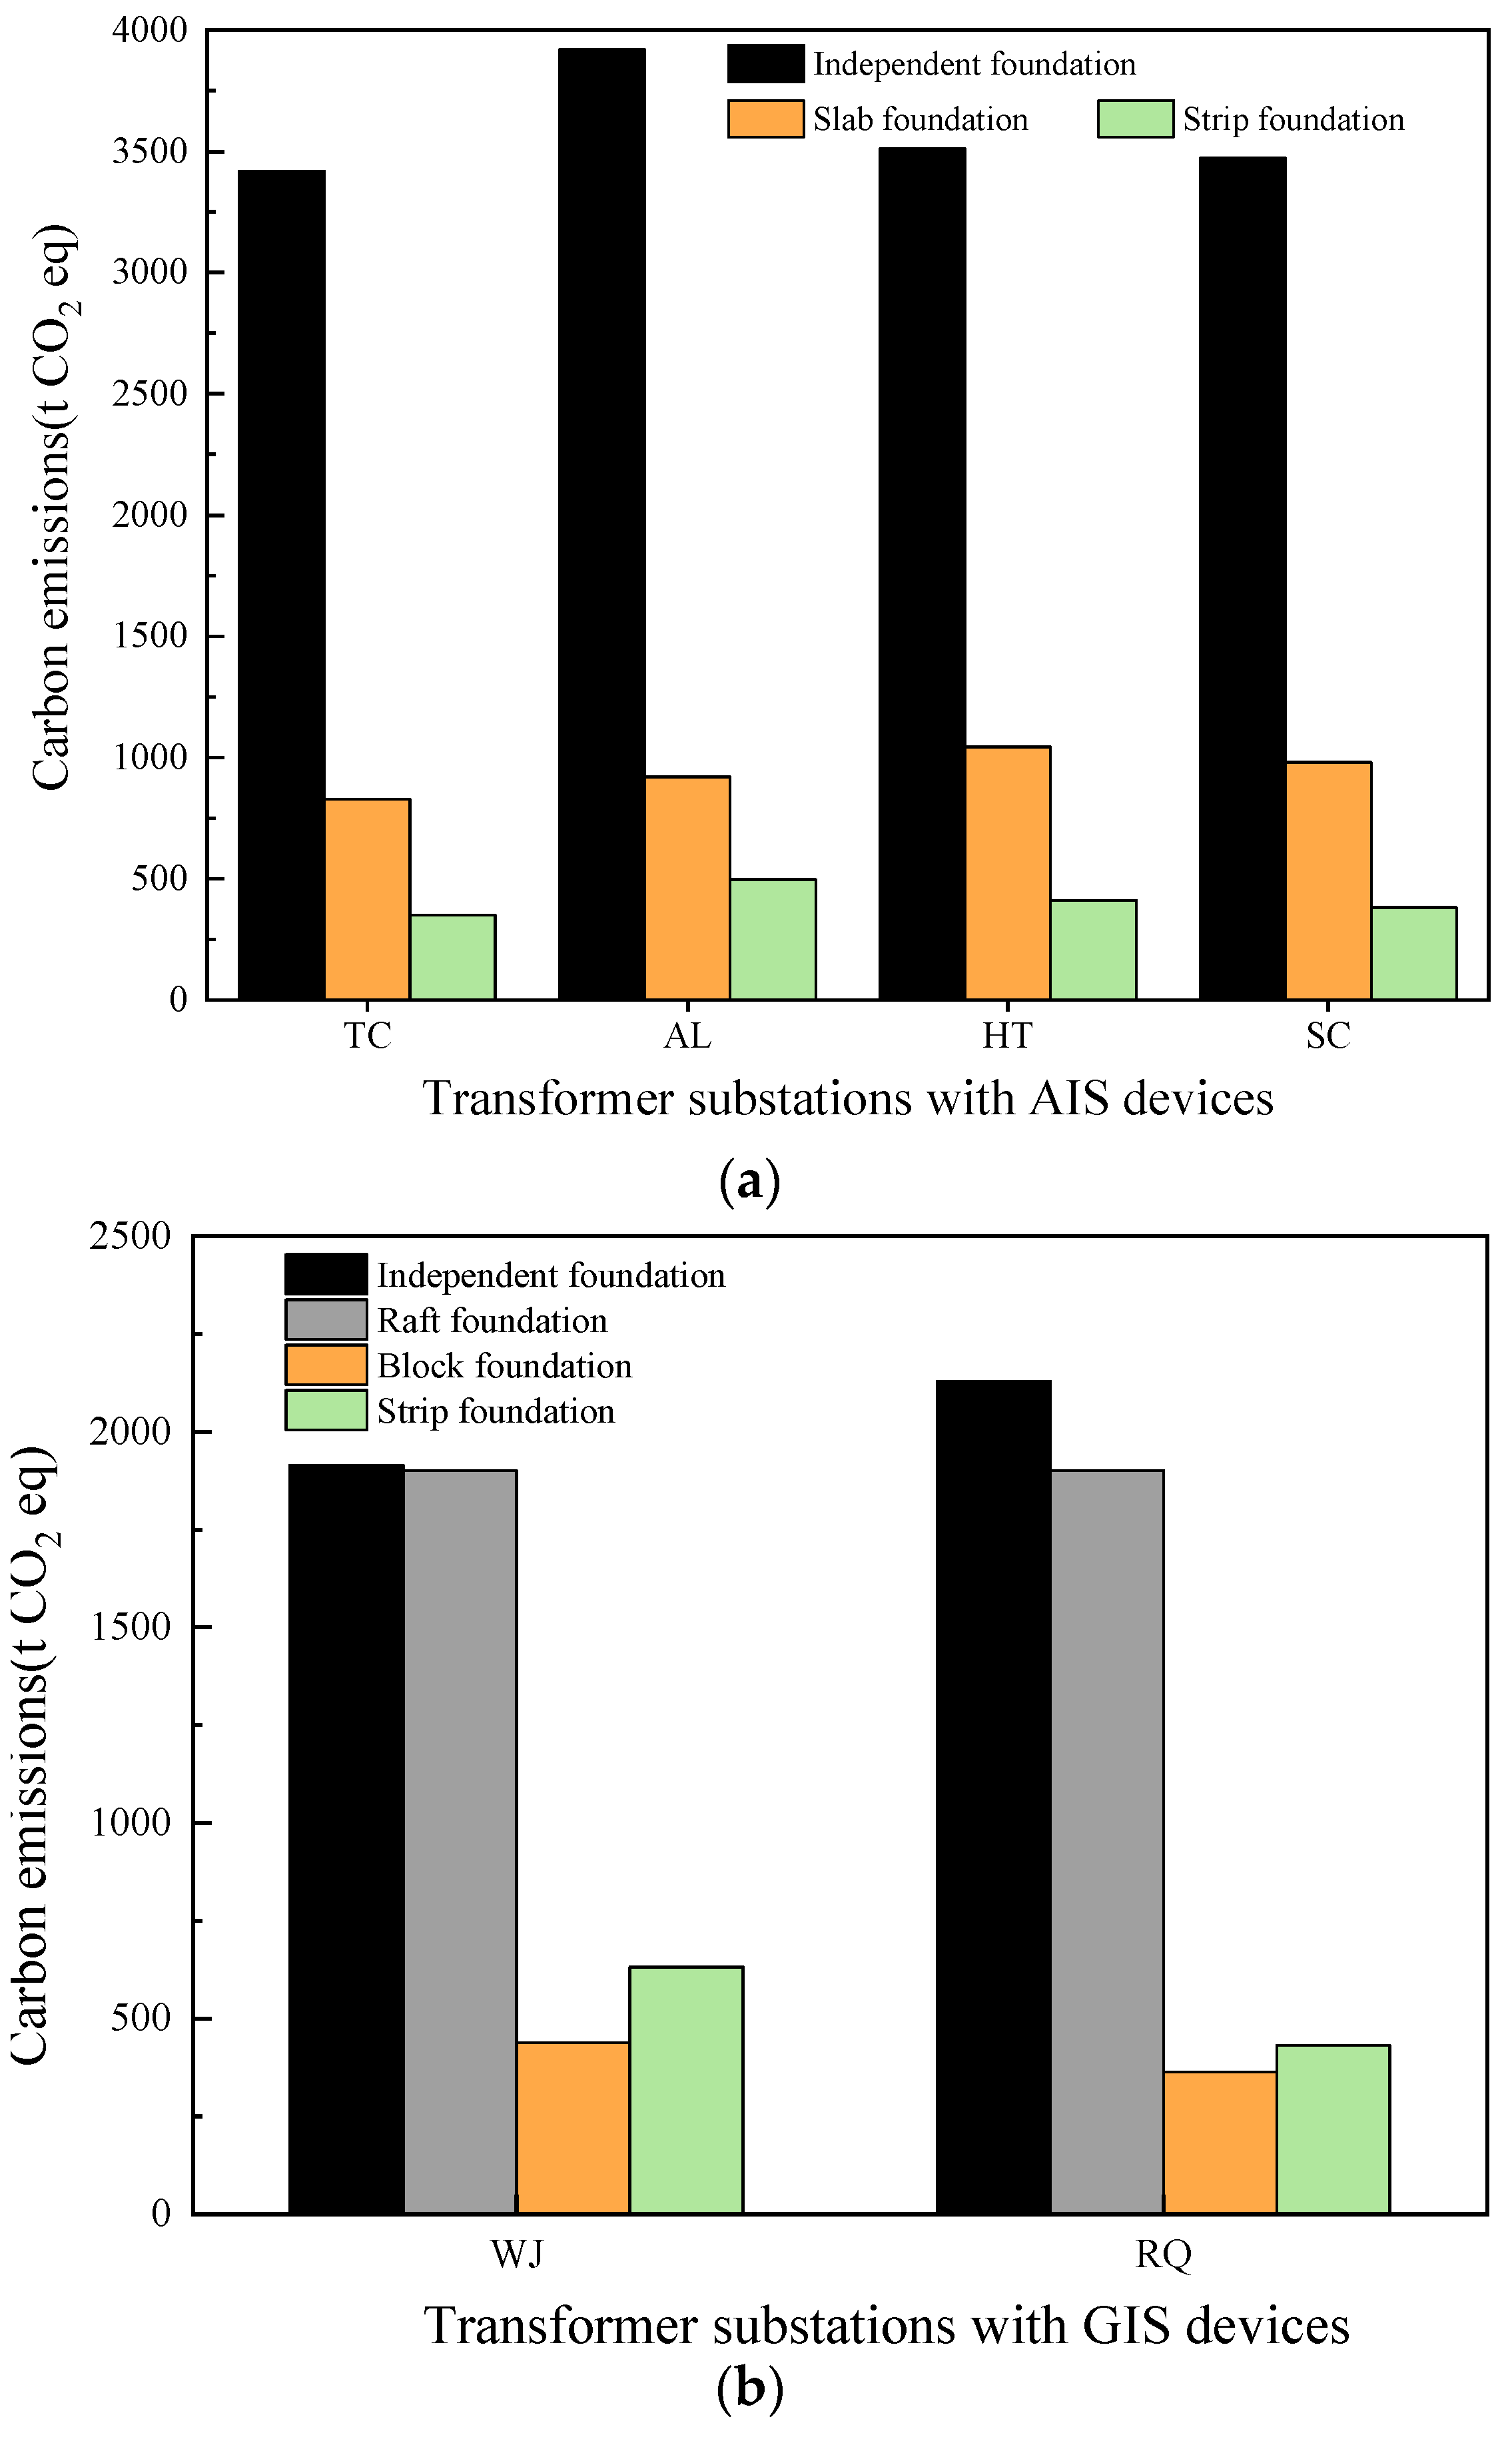
  • Due to the differences between AIS and GIS equipment, different types of foundations will be built. When arranged with AIS, the equipment foundation is mostly a slab foundation. While arranging with GIS, mostly use the raft foundation for electricity distribution equipment and the block foundation for the HV reactor, LV capacitor, and main transformer. Through the calculation, AIS has no obvious advantage on carbon emissions, while GIS covers a small area and has high reliability in operation, which is more in accord with the development direction of smart grids and low-carbon economies.
  • The expansion or renovation of substations will cause a change in carbon emissions, so the accuracy and timeliness of construction lists and investments are significant. Due to the differences in different voltage levels of substations, further research will focus on the establishment of construction lists and a comparison of carbon emissions at different voltage levels.

Author Contributions

X.L.: Conceptualization, Methodology, Writing—review and editing; J.Z.: Resources, Writing—original draft; Y.H.: Formal analysis, Investigation; J.L. (Jiao Liu): Formal analysis, Investigation; S.D.: Writing—review and editing; G.Z.: Supervision, Methodology, Investigation; Y.Z.: Formal analysis, Visualization; J.L. (Jiawei Li): Formal analysis, Investigation; Z.N.: Formal analysis, Investigation. All authors have read and agreed to the published version of the manuscript.

Funding

This work was supported by the Research Project of the State Grid Xinjiang Electric Power Corporation (No. 5230JK220001).

Data Availability Statement

The data presented in this study are available on request from the corresponding author.

Conflicts of Interest

The authors declare no conflict of interest.

Appendix A

Table A1. (Carbon Emission Calculation of SC 750 kV Transformer Substation).
Item ComponentSector CodeMonetary Cost
(1 × 10⁴ CNY)
Carbon Intensity
(t CO2/1 × 104 CNY)
Carbon Emission
(t CO2 eq)
1 Construction engineering
1.1 Main production building
1.1.1 Main control communication building
 Construction engineering cost95189.954.88926.96
 Installation materials cost9533.814.88164.99
1.1.2 750 kV relay chamber
 Construction engineering cost9596.414.88470.48
 Installation materials cost9518.414.8889.84
1.1.3 Main transformer and 220 kV, 66 kV relay chamber No. 1
 Construction engineering cost9543.904.88214.23
 Installation materials cost957.894.8838.50
1.1.4 Main transformer and 220 kV, 66 kV relay chamber No. 2
 Construction engineering cost9543.914.88214.28
 Installation materials cost957.884.8838.45
1.1.5 Substation power chamber
 Construction engineering cost9568.914.88336.28
 Installation materials cost9512.254.8859.78
1.1.6 Security equipment room
 Construction engineering cost9530.024.88146.50
 Installation materials cost955.974.8829.13
1.1.7 Guardhouse
 Construction engineering cost9528.714.88140.10
 Installation materials cost955.264.8825.67
1.2 Electricity distribution building
1.2.1 Frames and foundation
 Construction engineering cost95111.324.88543.24
1.2.2 Foundation of main transformer
 Construction engineering cost9529.774.88145.27
1.2.3 Main transformer oil pit and pebbles
 Construction engineering cost9566.804.88325.98
1.2.4 Main transformer system firewall
 Construction engineering cost9557.574.88280.92
1.2.5 Emergency oil pond
 Construction engineering cost9525.924.88126.51
1.2.6 750 kV frames and foundation
 Construction engineering cost952464.564.8812,027.04
1.2.7 750 kV equipment support and foundation
 Construction engineering cost95401.924.881961.39
1.2.8 220 kV frames and foundation
 Construction engineering cost95652.864.883185.95
1.2.9 220 kV equipment support and foundation
 Construction engineering cost95181.324.88884.86
1.2.10 66 kV frames and foundation
 Construction engineering cost9549.884.88243.41
1.2.11 66 kV equipment support and foundation
 Construction engineering cost9528.684.88139.96
1.2.12 HV shunt reactor foundation
 Construction engineering cost9576.414.88372.87
1.2.13 HV shunt reactor oil pit and pebbles
 Construction engineering cost9599.084.88483.51
1.2.14 HV shunt reactor firewall
 Construction engineering cost95148.564.88724.97
1.2.15 Substation transformer
 Construction engineering cost9554.564.88266.23
1.2.16 LV capacitor
 Construction engineering cost957.884.8838.45
1.2.17 LV reactor
 Construction engineering cost9524.674.88120.39
1.2.18 Independent lighting rod tower
 Construction engineering cost9549.614.88242.11
1.2.19 Conduit line
 Construction engineering cost95344.074.881679.05
1.2.20 Barrier and floor
 Construction engineering cost95102.354.88499.45
1.3 Water supply building
1.3.1 Substation water pipe
 Construction engineering cost950.264.881.27
1.3.2 Integrated pumped house
 Construction engineering cost9518.584.8890.67
 Installation materials cost9515.524.8876.74
1.4 Fire-fighting building
1.4.1 Foam equipment chamber
 Construction engineering cost9524.304.88118.58
1.4.2 Fire protection, alarm and detection
 Equipment purchasing721.793.796.78
1.4.3 Special fire protection system
 Equipment purchasing841.082.722.93
1.5 Station building
1.5.1 Site formation
 Construction engineering cost95275.934.881346.54
1.5.2 Station road and square
 Construction engineering cost95500.374.882441.81
1.5.3 Drainage pipeline
 Construction engineering cost95188.884.88921.73
1.5.4 Walls and gate
 Construction engineering cost95271.754.881326.14
1.5.5 Sewage pool
 Construction engineering cost958.034.8839.19
1.6 Special building
1.6.1 Foundation treatment
 Construction engineering cost95129.014.88629.57
1.6.2 Offsite roadway
 Construction engineering cost95247.614.881208.34
1.6.4 Offsite water supply and drainage
 Construction engineering cost9576.384.88372.73
1.6.5 Retaining wall
 Construction engineering cost95282.574.881378.94
Subtotal 37,148.71
2 Installation engineering
2.1 Main transformer system
2.1.1 Main transformer
 Installation materials cost7988.453.84339.65
 Installation engineering cost9591.324.88445.64
2.2 Electricity distribution equipment
2.2.1 750 kV distribution device
 Installation materials cost79538.613.842068.26
 Installation engineering cost95314.774.881536.08
2.2.2 220 kV distribution equipment
 Installation materials cost79485.753.841865.27
 Installation engineering cost9582.144.88400.84
2.2.3 66 kV distribution equipment
 Installation materials cost7938.783.84148.91
 Installation engineering cost9512.144.8859.24
2.3 Reactive compensation device system
2.3.1 750 kV HV shunt reactor
 Installation materials cost7921.283.8481.71
 Installation engineering cost9532.944.88160.75
2.3.2 66 kV capacitor
 Installation materials cost790.933.843.57
 Installation engineering cost954.394.8821.42
2.3.3 66 kV reactor
 Installation materials cost796.033.8423.15
 Installation engineering cost9520.714.88101.06
2.4 Control/direct current system
2.4.1 Control system
 Installation engineering cost9519.674.8895.99
2.4.2 Relay protection
 Installation engineering cost9515.974.8877.93
2.4.3 Direct current system
 Installation engineering cost9522.854.88111.51
2.5 Auxiliary power system
2.5.1 Station transformer substation
 Installation engineering cost9511.514.8856.17
2.5.2 Substation power distribution
 Installation engineering cost950.924.884.49
2.5.3 Substation lighting
 Installation materials cost8152.903.70195.73
 Installation engineering cost955.574.8827.18
2.6 Cable/earthing system
2.6.1 Power cable
 Installation materials cost79443.723.841703.88
 Installation engineering cost9515.664.8876.42
2.6.2 Control cable
 Installation materials cost79359.293.841379.67
 Installation engineering cost95179.274.88874.84
2.6.3 Cable auxiliary device
 Installation materials cost78365.213.571303.80
 Installation engineering cost9572.724.88354.87
2.6.4 Cable fire protection
 Installation materials cost72153.123.79580.32
 Installation engineering cost9527.234.88132.88
2.6.5 Substation earthing
 Installation materials cost79533.873.842050.06
 Installation engineering cost95115.344.88562.86
2.7 Communication and motor system
 Installation materials cost7920.433.8478.45
 Installation engineering cost9516.294.8879.49
2.8 Full station debugging
 Debugging118441.881.33587.70
Subtotal 17,589.79
3 Additional service
3.1 Technical service of construction
3.1.1 Survey expenses118725.001.33964.25
3.1.2 Design fees1181891.001.332515.03
3.1.3 Feasibility study and design11830.001.3339.90
3.1.4 Inspection of the electric power device118124.001.33164.92
3.1.5 Environmental monitor and inspection118330.001.33438.90
3.1.6 Pile test, inspection and settlement118255.001.33339.15
3.1.7 Inspection of soil and water conservation12220.002.5551.00
3.1.8 Supervision of special equipment safety118200.001.33266.00
3.2 Construction management
3.2.1 Construction management fees118226.711.33301.52
3.3 Project supervision
3.3.1 Project supervision fee1181082.161.331439.27
3.4 Heavy-cargo transportation measure
3.4.1Heavy-cargo transportation fees97150.702.45369.21
3.5 Production preparation
3.5.1 Vehicle purchase fees74102.303.26333.50
3.5.2 Staff training and advance fees126128.381.68215.68
Subtotal 7438.33
Total 62,176.83

References

  1. National Bureau of Statistics of China (NBSC). 2015 China Statistical Yearbook; China Statistics Press: Beijing, China, 2015; pp. 251–252. ISBN 9787503776380. (In Chinese) [Google Scholar]
  2. NEA. Power Grid Construction Budget and Calculation Rules; China Electric Power Press: Beijing, China, 2013; ISBN 978-7-5123-8866-6. [Google Scholar]
  3. Yuan, J.; Shen, J.; Pan, L.; Zhao, C.; Kang, J. Smart grids in China. Renew. Sustain. Energy Rev. 2014, 37, 896–906. [Google Scholar] [CrossRef]
  4. Wei, W.; Wu, X.; Wu, X.; Xi, Q.; Ji, X.; Li, G. Regional study on investment for transmission infrastructure in China based on the State Grid data. Front. Earth Sci. 2017, 11, 162–183. [Google Scholar] [CrossRef]
  5. Liu, X.L.; Cui, L.L.; Ge, Q.; Jiang, L.L. New ideas for the energy development strategy of central and eastern China. China Popul. Resour. Environ. 2019, 29, 1–9. [Google Scholar]
  6. Wang, Z.; Zhou, Y.; Zhao, N.; Wang, T.; Zhang, Z. Spatial Correlation Network and Driving Effect of Carbon Emission Intensity in China’s Construction Industry. Buildings 2022, 12, 201. [Google Scholar] [CrossRef]
  7. Yuan, D.; Jiang, W.; Sha, A.; Xiao, J.; Wu, W.; Wang, T. Technology method and functional characteristics of road thermoelectric generator system based on Seebeck effect. Appl. Energy 2023, 331, 120459. [Google Scholar] [CrossRef]
  8. Liu, H.; Yang, C.; Chen, Z. Differentiated Improvement Path of Carbon Emission Efficiency of China’s Provincial Construction Industry: A Fuzzy-Set Qualitative Comparative Analysis Approach. Buildings 2023, 13, 543. [Google Scholar] [CrossRef]
  9. Zhao, G.; Wu, T.; Ren, G.; Zhu, Z.; Gao, Y.; Shi, M.; Ding, S.; Fan, H. Reusing waste coal gangue to improve the dispersivity and mechanical properties of dispersive soil. J. Clean. Prod. 2023, 404, 136993. [Google Scholar] [CrossRef]
  10. Salama, A.; Farag, A.A.; Eraky, A.; El-Sisi, A.A.; Samir, R. Embodied Carbon Minimization for Single-Story Steel Gable Frames. Buildings 2023, 13, 739. [Google Scholar] [CrossRef]
  11. Chau, C.K.; Hui, W.K.; Ng, W.Y.; Powell, G. Assessment of CO2 emissions reduction in high-rise concrete office buildings using different material use options. Resour. Conserv. Recycl. 2012, 61, 22–34. [Google Scholar] [CrossRef]
  12. Yamagata, Y.; Ono, M.; Sasamori, K.; Uehara, K. Important technologies applied for UHV AC substations in Japan. Eur. Trans. Electr. Power 2011, 22, 33–48. [Google Scholar] [CrossRef]
  13. Tan, Z.F. An Optimization-Based Study to Analyze the Impacts of Clean Energy and Carbon Emission Mechanisms on Inter-Regional Energy Exchange. J. Environ. Inform. 2013, 22, 123–130. [Google Scholar] [CrossRef]
  14. Daniels, L.; Coker, P.; Gunn, A.; Potter, B. Using proxies to calculate the carbon impact of investment into electricity network assets. Appl. Energy 2016, 162, 551–560. [Google Scholar] [CrossRef]
  15. Garcia, R.; Marques, P.; Freire, F. Life-cycle assessment of electricity in Portugal. Appl. Energy 2014, 134, 563–572. [Google Scholar] [CrossRef]
  16. Arvesen, A.; Hauan, I.B.; Bolsøy, B.M.; Hertwich, E.G. Life cycle assessment of transport of electricity via different voltage levels: A case study for Nord-Trøndelag county in Norway. Appl. Energy 2015, 157, 144–151. [Google Scholar] [CrossRef]
  17. Jorge, R.S.; Hertwich, E.G. Grid infrastructure for renewable power in Europe: The environmental cost. Energy 2014, 69, 760–768. [Google Scholar] [CrossRef]
  18. Wei, W.; Wu, X.; Li, J.; Jiang, X.; Zhang, P.; Zhou, S.; Zhu, H.; Liu, H.; Chen, H.; Guo, J.; et al. Ultra-high voltage network induced energy cost and carbon emissions. J. Clean. Prod. 2018, 178, 276–292. [Google Scholar] [CrossRef]
  19. Wei, W.; Wang, M.; Zhang, P.; Chen, B.; Guan, D.; Shao, S.; Li, J. A 2015 inventory of embodied carbon emissions for Chinese power transmission infrastructure projects. Sci. Data 2020, 7, 318. [Google Scholar] [CrossRef] [PubMed]
  20. Zhang, X.; Wang, F. Stochastic analysis of embodied emissions of building construction: A comparative case study in China. Energy Build. 2017, 151, 574–584. [Google Scholar] [CrossRef]
  21. Hong, J.; Shen, G.Q.; Peng, Y.; Feng, Y.; Mao, C. Uncertainty analysis for measuring greenhouse gas emissions in the building construction phase: A case study in China. J. Clean. Prod. 2016, 129, 183–195. [Google Scholar] [CrossRef]
  22. Kong, G.; Hu, S.; Yang, Q. Uncertainty method and sensitivity analysis for assessment of energy consumption of underground metro station. Sustain. Cities Soc. 2023, 92, 104504. [Google Scholar] [CrossRef]
  23. Shao, W.; Sun, Q.; Xu, X.; Yue, W.; Shi, D. Durability life prediction and horizontal bearing characteristics of CFRP composite piles in marine environments. Constr. Build. Mater. 2023, 367, 130116. [Google Scholar] [CrossRef]
  24. Kang, G.; Kim, T.; Kim, Y.-W.; Cho, H.; Kang, K.-I. Statistical analysis of embodied carbon emission for building construction. Energy Build. 2015, 105, 326–333. [Google Scholar] [CrossRef]
  25. Wang, E.; Shen, Z. A hybrid Data Quality Indicator and statistical method for improving uncertainty analysis in LCA of complex system—Application to the whole-building embodied energy analysis. J. Clean. Prod. 2013, 43, 166–173. [Google Scholar] [CrossRef]
  26. Chou, J.S.; Yeh, K.C. Life cycle carbon dioxide emissions simulation and environmental cost analysis for building construction. J. Clean. Prod. 2015, 101, 137–147. [Google Scholar] [CrossRef]
  27. Schwartz, Y.; Raslan, R.; Mumovic, D. The life cycle carbon footprint of refurbished and new buildings—A systematic review of case studies. Renew. Sustain. Energy Rev. 2018, 81, 231–241. [Google Scholar] [CrossRef]
  28. Jones, C.I.; McManus, M.C. Life-cycle assessment of 11kV electrical overhead lines and underground cables. J. Clean. Prod. 2010, 18, 1464–1477. [Google Scholar] [CrossRef]
  29. Harrison, G.P.; Maclean, E.J.; Karamanlis, S.; Ochoa, L.F. Life cycle assessment of the transmission network in Great Britain. Energy Policy 2010, 38, 3622–3631. [Google Scholar] [CrossRef]
  30. Acquaye, A.; Duffy, A.; Basu, B. Embodied emissions abatement—A policy assessment using stochastic analysis. Energy Policy 2011, 39, 429–441. [Google Scholar] [CrossRef]
  31. Bullard, C.W.; Penner, P.S.; Pilati, D.A. Net energy analysis: Handbook for combining process and input-output analysis. Resour. Energy 1978, 1, 267–313. [Google Scholar] [CrossRef]
  32. Suh, S.; Huppes, G. Methods for Life Cycle Inventory of a product. J. Clean. Prod. 2005, 13, 687–697. [Google Scholar] [CrossRef]
  33. Liu, S.; Han, M.; Wu, X.; Wu, X.; Li, Z.; Xia, X.; Ji, X. Embodied water analysis for Hebei Province, China by input-output modelling. Front. Earth Sci. 2016, 12, 72–85. [Google Scholar] [CrossRef]
  34. Chen, G.; Chen, Z. Carbon emissions and resources use by Chinese economy 2007: A 135-sector inventory and input–output embodiment. Commun. Nonlinear Sci. Numer. Simul. 2010, 15, 3647–3732. [Google Scholar] [CrossRef]
  35. Wu, X.; Xia, X.; Chen, G.; Chen, B. Embodied energy analysis for coal-based power generation system-highlighting the role of indirect energy cost. Appl. Energy 2016, 184, 936–950. [Google Scholar] [CrossRef]
  36. Wu, X.; Yang, Q.; Chen, G.; Hayat, T.; Alsaedi, A. Progress and prospect of CCS in China: Using learning curve to assess the cost-viability of a 2 × 600 MW retrofitted oxyfuel power plant as a case study. Renew. Sustain. Energy Rev. 2016, 60, 1274–1285. [Google Scholar] [CrossRef]
  37. Wei, W.; Wang, X.; Zhu, H.; Li, J.; Zhou, S.; Zou, Z. Carbon emissions of urban power grid in Jing-Jin-Ji region: Characteristics and influential factors. J. Clean. Prod. 2017, 168, 428–440. [Google Scholar] [CrossRef]
  38. Chen, G.; Guo, S.; Shao, L.; Li, J.; Chen, Z.-M. Three-scale input–output modeling for urban economy: Carbon emission by Beijing 2007. Commun. Nonlinear Sci. Numer. Simul. 2013, 18, 2493–2506. [Google Scholar] [CrossRef]
  39. Cellura, M.; Longo, S.; Mistretta, M. Sensitivity analysis to quantify uncertainty in Life Cycle Assessment: The case study of an Italian tile. Renew. Sustain. Energy Rev. 2011, 15, 4697–4705. [Google Scholar] [CrossRef]
  40. May, J.R.; Brennan, D.J. Application of data quality assessment methods to an LCA of electricity generation. Int. J. Life Cycle Assess. 2003, 8, 215–225. [Google Scholar] [CrossRef]
  41. Navarro, I.J.; Yepes, V.; Martí, J.V. Social life cycle assessment of concrete bridge decks exposed to aggressive environments. Environ. Impact Assess. Rev. 2018, 72, 50–63. [Google Scholar] [CrossRef]
  42. van Dorp, J.R. A dependent project evaluation and review technique: A Bayesian network approach. Eur. J. Oper. Res. 2020, 280, 689–706. [Google Scholar] [CrossRef]
  43. Ge, Z.; Geng, Y.; Wei, W.; Jiang, M.; Chen, B.; Li, J. Embodied carbon emissions induced by the construction of hydropower infrastructure in China. Energy Policy 2023, 173, 113404. [Google Scholar] [CrossRef]
  44. Nagarsheth, R.; Singh, S. Study of gas insulated substation and its comparison with air insulated substation. Int. J. Electr. Power Energy Syst. 2014, 55, 481–485. [Google Scholar] [CrossRef]
Figure 1. Location of the selected 750 kV transformer substation in Xinjiang province.
Buildings 13 01106 g001
Figure 2. Calculating and evaluating the model of the present study.
Buildings 13 01106 g002
Figure 3. Carbon emissions of construction engineering in each transformer substation.
Buildings 13 01106 g003
Figure 4. Carbon emissions proportion of each item in construction engineering.
Buildings 13 01106 g004
Figure 5. Carbon emissions of installation engineering in each transformer substation.
Buildings 13 01106 g005
Figure 6. Carbon emissions proportion of each item in installation engineering.
Buildings 13 01106 g006
Figure 7. Carbon emissions of additional service in each transformer substation.
Buildings 13 01106 g007
Figure 8. Carbon emissions proportion of each item in additional services.
Buildings 13 01106 g008
Figure 9. Results of Monte Carlo simulation in 750 kV transformer substations.
Buildings 13 01106 g009
Figure 10. Influence of each item on output uncertainty. (b) is a partial enlargement of (a) within the range of [0%, 0%] to [5%, 5%]. Bubbles 01 to 19 represent the main production building, electricity distribution building, station building, special building, water supply building, fire-fighting building, technical service of construction, construction management, project supervision, heavy-cargo transportation measure, production preparation, cable/earthing system, electricity distribution system, main transformer system, full station debugging, reactive compensation device system, control/direct current system, auxiliary power system, and communication/telecontrol system, respectively.
Buildings 13 01106 g010
Figure 11. Carbon emissions related to the foundations of the 750 kV transformer substations. (a) is the carbon emission distribution of each type of foundation in substations adopting AIS devices. (b) is the carbon emission distribution of each type of foundation in substations adopting GIS devices.
Buildings 13 01106 g011
Table 1. Form of switchgear in selected 750 kV transformer substations.
Form of SwitchgearTransformer Substation
AISTC, AL, SC, HT
GISWJ, RQ
Disclaimer/Publisher’s Note: The statements, opinions and data contained in all publications are solely those of the individual author(s) and contributor(s) and not of MDPI and/or the editor(s). MDPI and/or the editor(s) disclaim responsibility for any injury to people or property resulting from any ideas, methods, instructions or products referred to in the content.

