Abstract
Southern and southeastern Kazakhstan is a region of intraplate seismicity characterized by several destructive earthquakes. Almaty, the largest metropolis in this region, has many structures with different construction materials and seismic-resistant systems. Among them, residential buildings constructed in the Soviet Union era (before the 1990s) may possess low seismic resisting capacities due to limited seismic design and detailing provisions. Therefore, it is essential to assess seismic risks for these buildings. This paper collected information from a government agency (i.e., KazNIISA), including construction materials, lateral force-resisting systems, and structural ductility capacities for residential buildings constructed in this era. These buildings were then categorized in terms of their seismic vulnerabilities following the European Macro-seismic Scale (EMS-98). Vulnerability curves and probability of damages were developed under different earthquake intensities and peak ground accelerations. The likelihood of varying levels of damage was established for the design basis and maximum considered earthquakes in the Almaty region. It was found that unreinforced masonry and wood buildings tend to be very heavily damaged and even collapse under the maximum considered earthquake. The reinforced and precast concrete buildings have a high probability of heavy to very heavy damage, which may require further analytical assessment since the structure at this damage level will undergo a significant nonlinear response and has a high uncertainty in the seismic performance.
1. Introduction
Southern and southeastern Kazakhstan is a region of intraplate seismicity characterized by several destructive earthquakes. The seismic activity in the region is a consequence of the collision between India and Asia that propagate northwards to Central Asia [1]. High seismic zones cover around 42.9 percent of the land area in Kazakhstan. Within this area, there are over 7 million people, more than 40% of the country’s industrial capacity, and over 400 communities, including the major industrial and cultural hub, Almaty, with a population of more than 2 million [2]. Almaty and the surrounding region lie at the intersection of many faults. In the 19th century and at the beginning of the 20th century, several destructive earthquakes occurred in this territory, including the Belovodskoe (Ms 6.9) Earthquakes, the 1887 Verny Earthquake (Ms 7.3), 1889 Chilik Earthquake (Ms 8.3), and 1911 Chon-Kemin Earthquake (Ms 8.2) [3,4]. However, large earthquakes (Ms > 7) have not been recorded because of the long-dormant nature of seismic cycles. According to the Institute of Seismology of Kazakhstan, this long-dormant nature implies a high likelihood of large earthquakes near the Almaty region [2,5].
On the other hand, Almaty city, the largest metropolis in Kazakhstan, has many building structures with different construction materials and seismic-resistant systems. Among them, residential buildings constructed in the Soviet Union era (before the 1990s) may have low seismic resisting capacities due to limited seismic design and detailing provisions. At the same time, the recognition of the earthquake disaster is low among the society since the closest large earthquake in the region was more than 100 years ago. Therefore, assessing the seismic risks for these buildings becomes important for government decision-makers to develop a proper disaster risk-reduction system.
There are various ways to evaluate seismic vulnerability for buildings. Depending on the study purpose, available data, building characteristics, and data collection system, these methodologies can be divided into two main categories: analytical and empirical methods [6]. Analytical methods simulate building performance using finite element methods, as used by D’Angela [7] and Dabaghi [8], while empirical methods use statistical observation of earthquake damage to buildings [9], as implemented by Saretta [10] in central Italy, Lantada [11] in Spain, Maio [12] and Vicente [13] in Faro, and Cavaleri [14] on Lampedusa Island, an island in southern Italy. Comprehensive seismic risk assessment is a technically challenging and costly operation that incorporates many buildings, their geometrical properties, and heterogeneity in terms of the structural design and seismic behavior characteristics within metropolitan regions [15]. Since the residential buildings investigated in this paper have a large variety and quantity, conducting a detailed analytical assessment is impractical. Therefore, an empirical approach based on the European Macro-seismic Scale (EMS-98) was used for the seismic assessment at a macro-level. Giovinazzi and Lagomarsino initially devised the macro-seismic approach [16]. Due to its usability, it was used worldwide, including Annaba in Algeria [17], Tunis in Tunisia [18], Banja Luka, and Sarajevo in Bosnia and Herzegovina [9].
This paper collected information on construction materials, lateral force-resisting systems, and structural ductility capacities for residential buildings constructed in Almaty from the government agency (Kazakh Research and Design Institute of Construction and Architecture (KazNIISA)). These buildings were divided into different seismic vulnerability categories by matching them to the EMS-98. The construction materials, later force-resisting systems, and structural ductility capacities were used as matching criteria. Vulnerability curves and probability of damage were developed for building structures in Almaty under different earthquake intensities and peak ground accelerations. The probability at different levels of damage was established for the design basis and maximum considered earthquakes in the Almaty region, as there has been no significant earthquake in the last century in Almaty. The absence of recent earthquakes often leads to the erroneous conclusion that earthquakes do not influence the territory. In addition, though there were several studies on designing shallow and deep foundations in Kazakhstan [19,20,21,22], little work has been done on accessing the vulnerability of the buildings constructed in the Soviet Union era. Therefore, it becomes very important to evaluate the seismic vulnerability of the already constructed structures to prevent economic and human loss. This information could be essential for government decision-makers on future earthquake disaster prevention.
2. European Macro-Seismic Scale (EMS-98)
The macro-seismic framework enables the assessment of vulnerability for various building ensemble sizes, from evaluating a single structure to a large set of buildings. A vulnerability index, “V”, and a ductility index, “Q”, are used to assess a building’s vulnerability/susceptibility to earthquakes. These indices consider the specific type of building and its construction details (i.e., construction materials, lateral forces resisting systems, etc.). The macro-seismic methodology used in EMS-98 is based on building typology classifications, divided into six vulnerability classes (A to F), ranging from most vulnerable to least vulnerable for defining physical damages to structural and nonstructural components. In the EMS-98, building structures are assigned various vulnerability classes according to their construction materials and the lateral force-resisting system, as shown in Table 1. The assignment is based on the general seismic performance of different construction materials and lateral force-resisting systems, where steel and reinforced concrete structures have higher classes than masonry and wood structures. On the other hand, the extent of structural damage is graded from mild damage to complete collapse with a range of five levels (D1 to D5) [23]. Based on the assessment of the structural damage from previous earthquakes, an implicit Damage Probability Matrix (DPM) using descriptive language (“Few”, “Many”, “Most”) is developed to link the damage level into earthquake intensities for different vulnerability classes as summarized in Table 2.

Table 1.
Vulnerability class for different structures (EMS-98).

Table 2.
Damage level mapping for different vulnerability classes (EMS-98).
As a further development of the EMS-98, the implicit DPM was converted into numerical quantities by combining fuzzy sets and probability theories in the context of the RISK-UE project [24]. Using the fuzzy set theory, the language expressions “Few”, “Many”, and “Most” were converted into their quantitative equivalents on a scale of 1 to 100 as a percentage of probability of damage (p), using a membership function (Figure 1 and Table 3). A binomial density function of probabilities is introduced for the probability at each damage level:
where k is the damage level ranging from 1 to 5 representing D1 to D5, respectively. μD is the mean damage value.
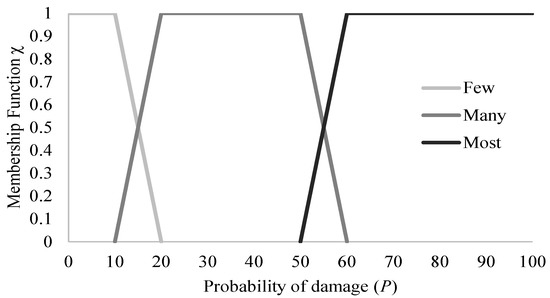
Figure 1.
Membership function for descriptive language.

Table 3.
Membership function for translation of qualitative terms to quantitative.
For the density function, four possible sub-classes (++, +, −, − −) are introduced for each vulnerability class under a specific earthquake intensity and a damage level. Based on the membership function, the corresponding probability of damage (p) for the four possible sub-classes is mapped to the descriptive language, as shown in Figure 1 and Table 3. This probability of damage (p) can then be mapped to the DPM (Refer to Table 2) using the values in Table 3.
For example, Table 4 shows the mapped probability of damage (p) for the vulnerability class A. For intensity level 5, the DPM indicates “Few” for damage level 1 (D1). The corresponding probability of damage (p) at D1 can be taken as 20%, 10%, 0%, and 0% for four possible sub-classes (++, +, −, − −), respectively. For intensity level 6, the DPM indicates “Many” for D1 and “Few” for D2. In this case, the corresponding probability of damage (p) at D1 is taken as 20% for sub-class (−) and as 10% for sub-class (− −), while it is taken as 20% for sub-class (++) and as 10% for sub-class (+) at D2. Similar calculations can be followed for other intensities to obtain values k and p(k) for each possible outcome. By inserting k and p(k) values into Equation (1), the mean damage value (µD) can be calculated for each vulnerability class at different intensities and possible sub-classes, shown as discrete data points in Figure 2. Following this approach, the mean damage value (µD) can only be calculated at discrete points. For a continuous evaluation, an empirical equation proposed by Masi et al. [15] is used to link the earthquake intensity (I) and the mean damage value (µD) using the vulnerability (V) and ductility index (Q):

Table 4.
Mapped probability of damage (p) for the vulnerability class A.
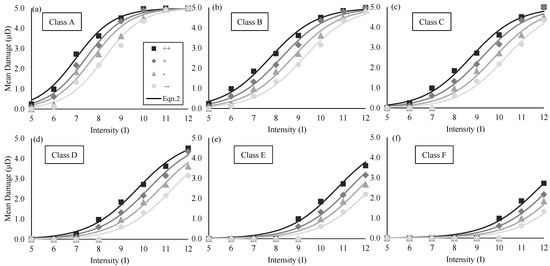
Figure 2.
Mean damage vs. earthquake intensity for each vulnerability class and sub-class: (a) class A; (b) class B; (c) class C; (d) class D; (e) class E; (f) class F.
The term “mean damage” describes the typical extent of damage observed at a certain EMS intensity. In the context of the EMS, the physical relevance of mean damage is that it offers a quantifiable estimate of the impact of an earthquake on structures. This can be helpful for determining locations that may be particularly vulnerable to earthquake damage, evaluating how resilient buildings and infrastructure are to seismic hazards, and assisting in decisions regarding earthquake-resistant design and construction techniques.
This paper uses curve-fitting to match the mean damage-intensity curves obtained from Equation (2) to the discrete points shown in Figure 2. By using the curve-fitting, the vulnerability (V) and ductility index (Q) can be calibrated for each vulnerability sub-class. The R square values were controlled to be more than 0.95 for the curve fitting. The vulnerability index (V) for each vulnerability class is then calculated from the average values of vulnerability sub-classes. The calibrated V and Q values from the curve-fitting are shown in Table 5.

Table 5.
Vulnerability and ductility index for each vulnerability class and sub-class.
3. Residential Buildings in Almaty
Based on information from the government agency (KazNIISA), approximately 8171 multi-story residential buildings were constructed in the Soviet Union era from the 1960s to the 1990s. These buildings were categorized according to the construction materials, lateral force-resisting systems, and ductility capacities. The construction materials include masonry, reinforced concrete, precast concrete, wood, and steel. The lateral force-resisting system consists of a bearing wall, wall panels, emulated moment frame, moment frame, and shear wall. According to the construction materials, year of build, and design code provision, the building was also categorized with medium and low types of ductility capacities. In general, the buildings designed and constructed before 1980 do not have sufficient seismic design considerations, which are categorized as low ductility [25]. The buildings designed and constructed after 1980 have generally adopted seismic design requirements, categorized as medium ductility [26]. Figure 3a shows the number of residential buildings grouped into several categories, while Figure 3b depicts the location of these residential buildings on the map of Almaty. Furthermore, the photos of each category are provided in Appendix A. The majority of residential buildings were constructed with precast and reinforced concrete. There are also significant amounts of masonry and wood buildings.
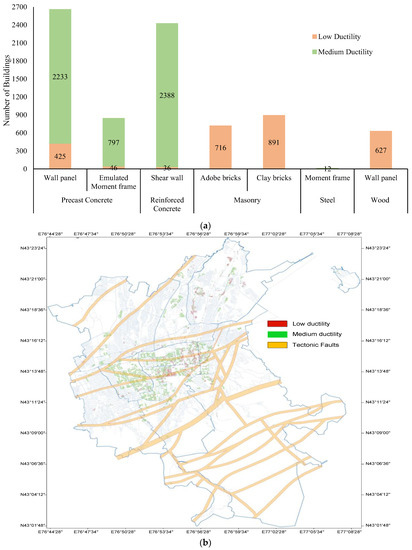
Figure 3.
(a) Number of residential buildings in each category and (b) Map of Almaty with locations of the residential buildings.
Based on the information on these residential buildings, the next step was to map them to the vulnerability class and sub-class in the EMS-98 scale. Table 6 shows the mapping between the residential buildings in Almaty and EMS-98 scale. These buildings were first matched to structure types in the EMS-98 according to construction materials, lateral force-resisting systems, and ductility capacities. Since each type of structure in the EMS-98 has a range of vulnerability classes, as shown in Table 1, the following procedure was used for the mapping: 1. Masonry and wood were assigned to the highest vulnerability within the EMS-98 range since these buildings typically have a low ductility without proper structural seismic detailing; 2. Concrete structures with low ductility were assigned to a higher vulnerability in the range; 3. Reinforced concrete and steel structures with medium ductility were assigned to a medium vulnerability in the range; 4. Precast wall panel and emulated moment frame structures with medium ductility were assigned to a high-medium vulnerability in the range. After assigning the vulnerability class/sub-class to the residential building, the corresponding vulnerability (V) and ductility (Q) index for each residential building category can be taken from Table 5.

Table 6.
Mapping of residential buildings in Almaty to the EMS-98 scale.
4. Mean Damage and Probability of Damage
After obtaining the vulnerability (V) and ductility (Q) index for each group of residential buildings in Almaty, the mean damage (µD) was obtained using Equation (2). Figure 4 shows the mean damage (µD) vs. earthquake intensity (I) for different groups of residential buildings. Consistent with the assigned vulnerability class/sub-class and vulnerability index, masonry and wood buildings had the highest mean damage value due to their relatively low seismic resistant capacities. The precast and reinforced concrete buildings have medium to high mean damage values depending on the lateral force resisting systems and ductility capacities. The steel buildings showed the lowest mean damage values, consistent with their superior seismic performance.
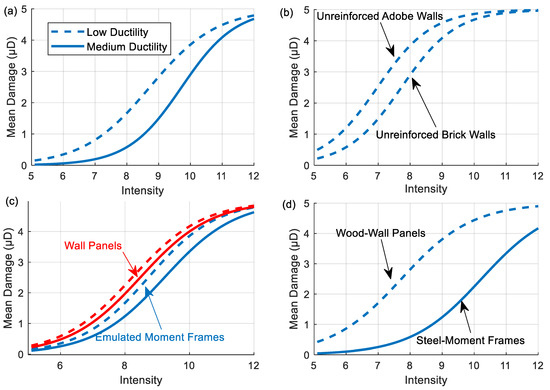
Figure 4.
Mean damage vs. intensity for different groups of residential buildings: (a) reinforced concrete shear wall; (b) masonry; (c) precast concrete; and (d) steel and wood.
Although the mean damage curves shown in Figure 4 indicate the damage level at different earthquake intensity levels, it is important to know which intensity level properly represents possible earthquakes in the Almaty region. The seismic design code in Kazakhstan [27] has mapped the peak ground acceleration in its territory at two different earthquake levels: design basis earthquake (DBE) level corresponding to a return period of 475 years and maximum considered earthquake (MCE) level with a return period of 2475 years. Therefore, assessing the seismic vulnerability of the residential buildings at these two levels is important. Consequently, it was necessary to link the earthquake intensity level to the peak ground acceleration (PGA) demand since the PGA for the DBE and MCE levels can be found in the design code for the Almaty region. This paper adopted an empirical equation developed by Masi et al. [28] to identify the relationship between the earthquake intensity and the peak ground acceleration as follow:
By solving I in Equation (3) and inserting it into Equation (2), the relationship between the mean damage (µD) and the PGA can be established. Figure 5 presents this relationship for different groups of residential buildings. The PGAs corresponding to the DBE (return period of 475 years) and MCE (return period of 2475 years) in the Almaty region are indicated in Figure 5 as vertical dashed and dash–dot trend lines, respectively. For a direct assessment at the two earthquake levels (DBE and MCE) in the Almaty, the expected mean damage (µD) has also been plotted in Figure 6 at these two levels by finding intersections between the mean damage curves and the vertical trend lines.
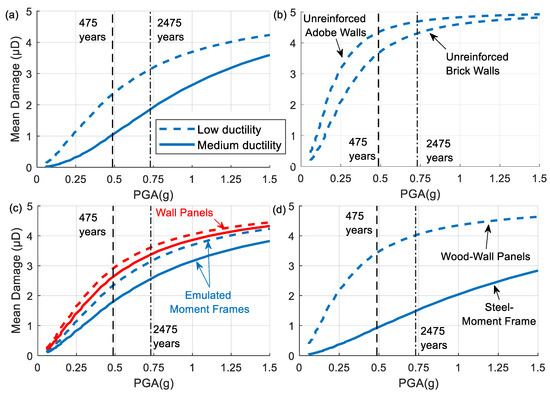
Figure 5.
Mean damage vs. PGA for different groups of residential buildings: (a) reinforced concrete shear wall; (b) masonry; (c) precast concrete; and (d) steel and wood.

Figure 6.
Mean damage for different groups of residential buildings at (a) DBE (return period of 475 years); and (b) MCE (return period of 2475 years).
As seen in Figure 5 and Figure 6, the unreinforced masonry and wood buildings are expected to incur a level of D4–D5 (very heavy to destruction) damage under the MCE and a D3–D4 (heavy to very heavy) damage under DBE. The expected damage for reinforced and precast concrete buildings ranged from D2 (moderate) to close to D4 (very heavy), depending on the lateral force-resisting system and ductility capacity. It might be necessary to conduct analytical assessments since structures at these damage levels will behave nonlinearly and have high uncertainties in the seismic demand, as observed in the following studies [29,30]. The steel buildings only expected a D1 (slight)−D2 (moderate) damage at the DBE and MCE.
After investigating the mean damage level for the residential buildings, it was also worthwhile to evaluate the probabilities of the damage. The probability of the damage at each damage level can be obtained by inserting the mean damage value for each residential building group into Equation (1). Since the mean damage (µD) is related to the PGA, the relationship between the probability of damage and PGA can be developed for each residential building group. As an example, Figure 7 shows the density probability of damage (p) vs. PGA for two groups of buildings: (a) masonry with brick walls; and (b) reinforced concrete shear walls with low ductility. The PGAs corresponding to the DBE and MCE in the Almaty region are indicated in Figure 7 as vertical dashed and dash–dot trend lines, respectively. As seen in Figure 7, the probability of damage for D5 increases with the increase of the GPAs, while the probability for low damage level (D1 and D2) was high at low GPAs. The masonry buildings with low earthquake-resistant capacity tended to have a high probability of damage at high damage levels. The reinforced concrete buildings with higher seismic capacities had a high probability of damage at moderate damage levels.
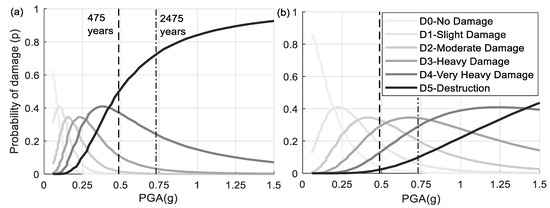
Figure 7.
Density probabilities of the damage vs. PGA for (a) masonry with brick walls; and (b) reinforced concrete shear wall with low ductility.
The density probabilities of damage at the two earthquake levels can be identified using the intersections between probability curves and vertical trendlines in Figure 7. Similar calculations can be applied to other groups of residential buildings. Figure 8 plots the probability of damage for different groups of residential buildings for a direct assessment at the two earthquake levels (DBE and MCE) in Almaty. As seen in Figure 8, the probability of destruction for masonry and wood buildings was high under DBE (more than 20%) and MCE (more than 40%), indicating a necessity for strengthening these types of buildings to resist future large earthquakes. Reinforced and precast concrete buildings with medium ductility had a high probability (more than 50%) at D2 (moderate damage) to D3 (heavy damage) level under DBE and a high probability at D3 (heave damage) to D4 (very heavy damage) level under MCE. On the other hand, these buildings with low ductility had a higher probability of more severe damage with a considerable probability of destruction under MCE (more than 15%). Since the probability of the damage spreads from moderate to very heavy levels where the structure response is highly nonlinear, it is necessary to conduct an analytical assessment for the reinforced and precast concrete buildings. For steel buildings, the probability of damage was dominated at the slight (D1) level under DBE and the moderate (D2) level under MCE.
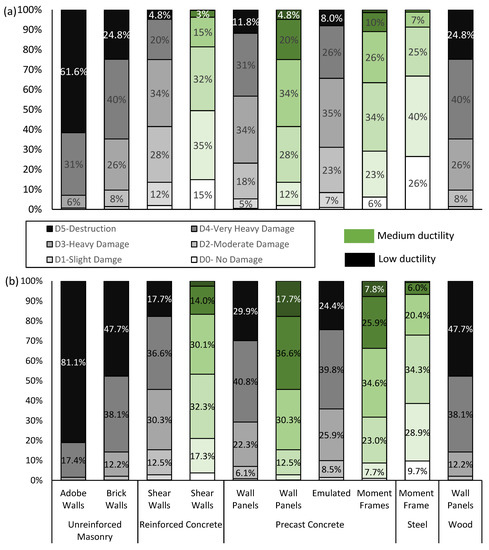
Figure 8.
Probability of the damage for different groups of residential buildings at (a) DBE (return period of 475 years); and (b) MCE (return period of 2475 years).
The results obtained in this study have several practical implications. It can be used to produce seismic hazard maps that depict the potential structural damage for a future large earthquake event in the Almaty region. It can also be useful for risk assessment and emergency response planning. Furthermore, by linking the probability of damage shown in Figure 8 to a detailed economic analysis, the potential economic loss under future large earthquake events can be estimated, which is beyond the scope of this paper.
5. Conclusions
This paper investigated the seismic vulnerability of the residential buildings constructed in the Soviet Union era (before the 1990s) in Almaty, Kazakhstan. A macro-seismic assessment approach was adopted following the EMS-98 scale to qualitatively assess 8171 multi-story residential buildings with a wide range of construction materials. The residential buildings were first categorized according to their construction materials, lateral force-resisting systems, and ductility capacities. Then they were mapped into the EMS-98 vulnerability class/sub-class. The expected mean damage and probability of the damage at the different levels were developed for different earthquake intensities and PGAs. The mean and probability damages were also evaluated under the expected earthquakes in Almaty under the DBE (return period of 475 years) and MCE (return period of 2475 years). These assessment results can be further used by government decisionmakers for future earthquake disaster prevention. The following conclusions can be made:
- The majority of residential buildings constructed in Almaty in the Soviet Union era were made from unreinforced masonry or concrete (precast and cast-in-place) with low ductility.
- For the unreinforced masonry and wood buildings, the expected mean damage is very heavy to destruction under both DBE and MCE. At the same time, the probability of destruction is high (more than 20% under DBE) and (more than 40% under MCE). Therefore, it is recommended to significantly strengthen or tear down these buildings depending on further cost analyses.
- The expected mean damage for reinforced and precast concrete buildings with medium ductility shows slight and moderate levels under both DBE and MCE. The probability of damage is also dominated in these levels from 50% to 60%.
- The expected mean damage for reinforced and precast concrete buildings with low ductility shows moderate and heavy levels under both DBE and MCE. The probability of damage is also dominated in these levels from 60% to 70%.
- The reinforced and precast concrete buildings have a more comprehensive range of expected mean damage values and a spread-out probability of damage from moderate to heavy damages. Considering that the structure under these damage levels is expected to incur a highly nonlinear response, it might result in high uncertainties for the seismic demand and expected damage. Therefore, it is recommended to conduct analytical assessments for these buildings.
- Although the steel buildings have a very low quantity, they indicate a slight to moderate damage level (more than 60% probability).
As both unreinforced and wooden structures are expected to have the highest mean damage resulting in very have damage or collapse of the structure, it is advisable to tear down these structures in order to avoid any human causality or loss during future seismic events or strengthen these buildings after additional cost analyses wherever it is possible. Similarly, reinforced and precast concrete buildings are expected to sustain nonlinear behavior during a seismic event which might cause serious harm or perhaps collapse if the building is not well-designed and maintained. Therefore, a more detailed analytical assessment of these buildings is proposed to determine necessary retrofit actions to improve their seismic resistance.
This paper focused on the safety of investigated structures under large earthquakes at the design basis and maximum considered levels, whose peak accelerations are available in the seismic design code of Kazakhstan. As a future study, it would be interesting to investigate the serviceability of these buildings if detailed probabilistic seismic hazard analyses for Almaty regions become available. This study adopted an empirical seismic assessment method. The obtained probability of damage for the investigated buildings had a lower accuracy as compared to the analytical and numerical methods, particularly for the reinforced concrete building. The scope of the study was also limited to residential buildings.
Author Contributions
Conceptualization, D.Z., S.-W.M. and J.K.; Data curation, M.S.R. and D.S.; Formal analysis, M.S.R. and D.S.; Funding acquisition, S.-W.M.; Investigation, M.S.R., D.Z. and D.S.; Methodology, D.Z.; Project administration, S.-W.M., Y.S. and J.K.; Resources, S.-W.M., Y.S. and J.K.; Supervision, D.Z., S.-W.M. and J.K.; Validation, M.S.R. and D.Z.; Visualization, M.S.R., D.Z. and D.S.; Writing—original draft, M.S.R.; Writing—review and editing, D.Z. and S.-W.M. All authors have read and agreed to the published version of the manuscript.
Funding
This research was funded by the Nazarbayev University, Collaborative Research Project (CRP), Grant No. 11022021CRP1508 and Faculty Development Competitive Research Grant Program (FDCRGP) Grant No. 20122022FD4115. Any opinions, findings, conclusions, or recommendations expressed in this material are those of the author(s) and do not necessarily reflect the views of Nazarbayev University.
Data Availability Statement
Data used for this research can be shared upon reasonable request.
Acknowledgments
This research was supported by Nazarbayev University. Any opinions, findings, conclusions, or recommendations expressed in this material are those of the author(s) and do not necessarily reflect the views of Nazarbayev University.
Conflicts of Interest
The authors declare no conflict of interest.
Abbreviations
| DBE | Design Basis Earthquake |
| DPM | Damage Probability Matrix |
| D1 | Damage grade 1 (slight damage) |
| D2 | Damage grade 2 (moderate damage) |
| D3 | Damage grade 3 (heavy damage) |
| D4 | Damage grade 4 (very heavy damage) |
| D5 | Damage grade 5 (destruction) |
| EMS | European Macro-seismic Scale |
| ERD | Earthquake Resistant Design |
| I | Earthquake Intensity |
| MCE | Maximum Considered Earthquake |
| p | Probability of damage |
| PGA | Peak Ground Acceleration |
| Q | Ductility Index |
| RC | Reinforced Concrete |
| V | Vulnerability Index |
| µD | Mean damage |
Appendix A
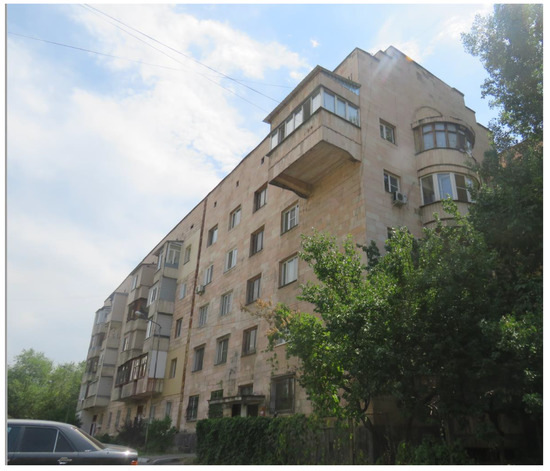
Figure A1.
Precast concrete emulated frame.

Figure A2.
Precast concrete wall panel.
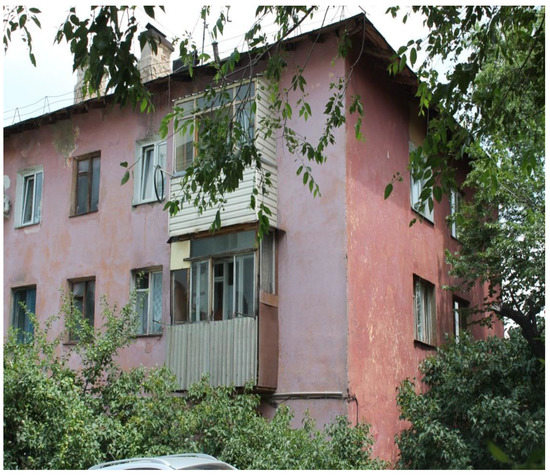
Figure A3.
Unreinforced masonry with adobe bricks.
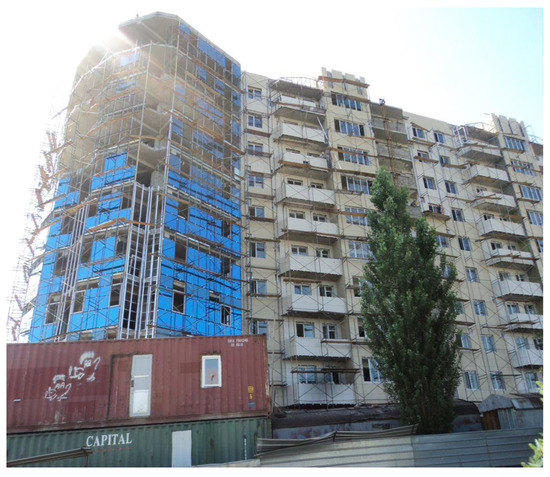
Figure A4.
Reinforced Concrete.
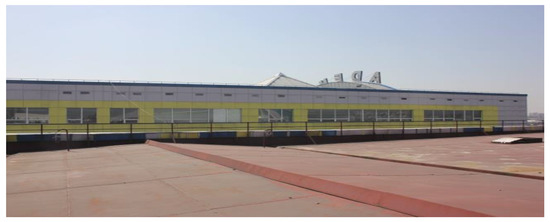
Figure A5.
Steel with Wall Panels.
References
- DeMets, C.; Gordon, R.G.; Argus, D.F.; Stein, S. Current plate motions. Geophys. J. Int. 1990, 101, 425–478. [Google Scholar] [CrossRef]
- Silacheva, N.; Kulbayeva, U.; Kravchenko, N. Probabilistic seismic hazard assessment of Kazakhstan and Almaty city in peak ground accelerations. Geodesy Geodyn. 2018, 9, 131–141. [Google Scholar] [CrossRef]
- Henni, P.H.O.; Fyfe, C.J.; Marrow, P.C. The BGS World Seismicity Database; Technical Report WL/98/13; BGS: Nottingham, UK, 1998. [Google Scholar]
- Bondár, I.; Storchak, D. Improved location procedures at the International Seismological Centre. Geophys. J. Int. 2011, 186, 1220–1244. [Google Scholar] [CrossRef]
- Tectonic Structures. Available online: http://activetectonics.la.asu.edu/N_tien_shan/N_tien_shan.html (accessed on 10 October 2015).
- Preciado, A.; Ramirez-Gaytan, A.; Salido-Ruiz, R.A.; Caro-Becerra, J.L.; Lujan-Godinez, R. Earthquake risk assessment methods of unreinforced masonry structures: Hazard and vulnerability. Earthq. Struct. 2015, 9, 719–733. [Google Scholar] [CrossRef]
- D’Angela, D.; Magliulo, G.; Celano, F.; Cosenza, E. Characterization of local and global capacity criteria for collapse assessment of code-conforming RC buildings. Bull. Earthq. Eng. 2021, 19, 3701–3743. [Google Scholar] [CrossRef]
- Dabaghi, M.; Saad, G.; Allhassania, N. Seismic Collapse Fragility Analysis of Reinforced Concrete Shear Wall Buildings. Earthq. Spectra 2019, 35, 383–404. [Google Scholar] [CrossRef]
- Ademović, N.; Hadzima-Nyarko, M.; Zagora, N. Seismic vulnerability assessment of masonry buildings in Banja Luka and Sarajevo (Bosnia and Herzegovina) using the macroseismic model. Bull. Earthq. Eng. 2020, 18, 3897–3933. [Google Scholar] [CrossRef]
- Saretta, Y.; Sbrogiò, L.; Valluzzi, M.R. Assigning the macroseismic vulnerability classes to strengthened ordinary masonry buildings: An update from extensive data of the 2016 Central Italy earthquake. Int. J. Disaster Risk Reduct. 2021, 62, 102318. [Google Scholar] [CrossRef]
- Lantada, N.; Irizarry, J.; Barbat, A.H.; Goula, X.; Roca, A.; Susagna, T.; Pujades, L.G. Seismic hazard and risk scenarios for Barcelona, Spain, using the Risk-UE vulnerability index method. Bull. Earthq. Eng. 2009, 8, 201–229. [Google Scholar] [CrossRef]
- Maio, R.; Ferreira, T.M.; Vicente, R.; Estêvão, J. Seismic vulnerability assessment of historical urban centres: Case study of the old city centre of Faro, Portugal. J. Risk Res. 2015, 19, 551–580. [Google Scholar] [CrossRef]
- Vicente, R.; Ferreira, T.; Maio, R. Seismic Risk at the Urban Scale: Assessment, Mapping and Planning. Procedia Econ. Financ. 2014, 18, 71–80. [Google Scholar] [CrossRef]
- Cavaleri, L.; Di Trapani, F.; Ferrotto, M.F. A new hybrid procedure for the definition of seismic vulnerability in Mediterranean cross-border urban areas. Nat. Hazards 2016, 86, 517–541. [Google Scholar] [CrossRef]
- Guettiche, A.; Guéguen, P.; Mimoune, M. Seismic vulnerability assessment using association rule learning: Application to the city of Constantine, Algeria. Nat. Hazards 2017, 86, 1223–1245. [Google Scholar] [CrossRef]
- Giovinazzi, S.; Lagomarsino, S. A Macroseismic Method for the Vulnerability Assessment of Buildings. In Proceedings of the 13th World Conference on Earthquake Engineering, Vancouver, BC, Canada, 1–6 August 2004. [Google Scholar]
- Athmani, A.E.; Gouasmia, A.; Ferreira, T.M.; Vicente, R.; Khemis, A. Seismic vulnerability assessment of historical masonry buildings located in Annaba city (Algeria) using non ad-hoc data survey. Bull. Earthq. Eng. 2014, 13, 2283–2307. [Google Scholar] [CrossRef]
- Mansour, A.K.; Romdhane, N.B.; Boukadi, N. An inventory of buildings in the city of Tunis and an assessment of their vulnerability. Bull. Earthq. Eng. 2013, 11, 1563–1583. [Google Scholar] [CrossRef]
- Zhanabayeva, A.; Moon, S.W.; Ocheme, J.I.; Yeraly, S.; Khomyakov, V.A.; Kim, J.; Satyanaga, A. Comparative analysis of seismic design codes adhering to the Kazakhstani and European approaches. Sustainability 2023, 15, 615. [Google Scholar] [CrossRef]
- Zhanabayeva, A.; Abdialim, S.; Satyanaga, A.; Kim, J.; Moon, S.W. Comparative Analysis of International Codes of Practice for Pile Foundation Design Considering Negative Skin Friction. Int. J. Geo-Eng. 2022, 13, 11. [Google Scholar] [CrossRef]
- Zhanabayeva, A.; Sagidullina, N.; Kim, J.; Satyanaga, A.; Lee, D.; Moon, S.-W. Comparative Analysis of Kazakhstani and European Design Specifications: Raft Foundation, Pile Foundation, and Piled Raft Foundation. Appl. Sci. 2021, 11, 3099. [Google Scholar] [CrossRef]
- Shaldykova, A.; Moon, S.W.; Kim, J.; Lee, D.; Ku, T.; Zhussupbekov, A. Comparative Analysis of Kazakhstani and European Approaches for the Design of Shallow Foundations. Appl. Sci. 2020, 10, 2920. [Google Scholar] [CrossRef]
- Grunthal, G. European Macroseismic Scale 1998; EMS-98; European Seismological Commission, Subcommission on Engineering Seismology, Working Group Macroseismic Scales: Corfu, Greece, 1998. [Google Scholar]
- Lagomarsino, S.; Giovinazzi, S. Macroseismic and mechanical models for the vulnerability and damage assessment of current buildings. Bull. Earthq. Eng. 2006, 4, 415–443. [Google Scholar] [CrossRef]
- Building Codes and Rules for Construction in Seismic Regions; Design Code: SNiP, II.-7.-81; State Committee for Construction: Moscow, Soviet Union, 1981. Available online: http://all-docs.ru/index.php?page=20&vi1=6056 (accessed on 26 February 2023).
- Construction in Seismic Areas; Design Code: SNiP v.1.2-4-98; Committee on Housing and Construction Policy of the Ministry of Energy, Industry and Trade of the Republic of Kazakhstan: Astana, Kazakhstan, 1998. Available online: http://all-docs.ru/index.php?page=20&vi1=5568 (accessed on 26 February 2023).
- Construction in Seismic Zones; Design Code: SP RK 2.03-30-2017; Kazakh Research and Design Institute of Construction and Architecture (KazNIISA): Nur-Sultan, Kazakhstan, 2017; Available online: https://www.egfntd.kz/upload/NTD/%D0%A1%D0%9F%20%D0%A0%D0%9A/211021/SP_RK_2.03-30-2017.pdf (accessed on 26 February 2023).
- Masi, A.; Chiauzzi, L.; Nicodemo, G.; Manfredi, V. Correlations between macroseismic intensity estimations and ground motion measures of seismic events. Bull. Earthq. Eng. 2020, 18, 1899–1932. [Google Scholar] [CrossRef]
- Jeon, J.-S.; Lowes, L.N.; DesRoches, R.; Brilakis, I. Fragility curves for non-ductile reinforced concrete frames that exhibit different component response mechanisms. Eng. Struct. 2015, 85, 127–143. [Google Scholar] [CrossRef]
- Gusella, F. Effect of the plastic rotation randomness on the moment redistribution in reinforced concrete structures. Eng. Struct. 2021, 252, 113652. [Google Scholar] [CrossRef]
Disclaimer/Publisher’s Note: The statements, opinions and data contained in all publications are solely those of the individual author(s) and contributor(s) and not of MDPI and/or the editor(s). MDPI and/or the editor(s) disclaim responsibility for any injury to people or property resulting from any ideas, methods, instructions or products referred to in the content. |
© 2023 by the authors. Licensee MDPI, Basel, Switzerland. This article is an open access article distributed under the terms and conditions of the Creative Commons Attribution (CC BY) license (https://creativecommons.org/licenses/by/4.0/).