Article

Influence of Friction Coefficient between Cable and Membrane on Wind-Induced Response of Air-Supported Membrane Structures with Oblique Cable Net

1
Faculty of Urban Construction, Beijing University of Technology, Beijing 100124, China
2
School of Artificial Intelligence, Beijing Technology and Business University, Beijing 100048, China
*
Author to whom correspondence should be addressed.
Buildings 2023, 13(3), 649; https://doi.org/10.3390/buildings13030649
Submission received: 30 December 2022 / Revised: 16 February 2023 / Accepted: 24 February 2023 / Published: 28 February 2023

Abstract

:
Cable-membrane constructions typically exhibit significant displacement and distortion under load action, and the cable-membrane contact results in relative sliding. In this paper, the interaction force between cable and membrane is transferred through frictional contact action, and as a result, the friction coefficient must be taken into consideration for the form-finding and load analysis of air-supported membrane structures. Eight kinds of P-type membrane materials commonly used in engineering were chosen, and the friction coefficients between the various membrane and cable materials were obtained. The connection between a cable and a membrane of an air-supported membrane structure is considered a contact problem, and its initial shape analysis and wind load response analysis are carried out. The influence of the friction coefficient of a cable membrane on the wind-induced response of an air-supported membrane structure is discussed, and the results are compared with those of the cable-membrane binding model under wind load.

1. Introduction

The air-supported membrane structure is a pneumatic structure with large internal space, good mobility, a short construction period, energy savings, environmental protection, low cost, and high architectural value. In contrast to other pneumatic structures, such as air cushions and air-inflated structures, air-supported membrane structures typically use thin membrane materials with excellent tensile strength as facades or portions of roofs fixed to a concrete foundation or the ground directly using high-mass anchors. Air-supported membrane structures have become widespread in buildings in recent years, such as stadiums, warehouses, and garbage disposal sites, which not only effectively prevent external pollution from entering the building but also prevent harmful gases or dust from contaminating the surrounding environment [1].
Air-supported membrane structures are flexible, lightweight, and have a low vibration frequency. In the majority of contemporary practical applications, steel cable frameworks are employed to maintain geometry and offer additional stiffness by enveloping the facade; installing the cable net can also efficiently minimize membrane surface stress [2]. Cable-membrane structures frequently experience large displacements and deformations under load action with a relative frictional slip between the cables and the membrane. The wind-induced responses are also quite significant, even when there is separation between the membrane and cables under strong wind action [3,4]. Some existing analyses for cable-membrane structures make the assumption that the cable and the membrane are bound together [5,6,7,8,9], omitting the fact that the membrane and cables actually make frictional contact. This simplification cannot correctly perform a form-finding and wind-induced response analysis of the cable-membrane structures.
Many studies have been conducted on cable-membrane structures, considering cable and membrane frictional contact. Mastumur T. et al. [10] developed a “bending” element method to take into account the sliding issue between the cable and the membrane. However, the integrity of the original membrane element was compromised by the cable element sliding into it, and the effect of friction was overlooked. Lshii K. [11] examined the influence of friction by adding a spring between the cable and the membrane, but the spring stiffness value is relatively difficult to obtain. The sliding issue between the cable and the membrane was solved by Song C. Y. et al. [12] using general finite element software; however, the calculation examples in the paper only take into account one cable moving in the vertical direction and one moving in the horizontal direction. Li X. and Wang C. et al. [13,14] performed a cable-membrane contact analysis on the initial form of air-supported membrane structures, considering the impacts of changes in internal pressure, membrane thickness, friction coefficient, wind load, wind direction, and wind velocity. They employed semi-ellipsoidal and spherical crown-shaped inflatable membranes as instances to achieve the use of finite element software to solve the problem of cable-membrane slip in inflatable membrane structures, but only with a small number of cable arrangements. Wang Z. et al. [15] utilized ANSYS software to conduct a cable-membrane contact analysis for a rectangular air-supported membrane structure with a few transverse cables in order to determine the structure’s shape from the initial plane. Nonetheless, the size of the air-membrane was small. Liu C. et al. [16] developed a computational algorithm to integrate the wrinkle/slack model into the ANCF thin shell elements for flexible multibody dynamics, as well as a simple contact model to prevent membrane and rigid hub penetration. Sautter K. et al. [17] discussed the proper modeling of the protective structures and sliding edge cables, the impact simulation was realized by coupling particle methods and the FEM. He Y. and Zhao Y. et al. [18,19] adopted the slow dynamics method and employed a spherical crown-shaped inflatable membrane to verify its reliability in solving the cable-membrane contact problem. Taking a semi-elliptical, spherical inflatable membrane as an example and laying the oblique cable net and the orthogonal cable net, respectively, the effect of different internal pressures on the air-supported membrane structure was considered. The cable-membrane contact analysis was carried out for its initial form and under wind load action. However, the effect of different friction coefficients on the cable-membrane contact was not considered.
According to prior research on the frictional contact and sliding between cables and the membrane, possible separation in the contact state is rarely considered, and the number of contact pairs is quite small. Thus, for air-supported membrane constructions with an oblique cable net, there is a shortage of applicable calculation models and methods that address the possible separation in contact state between cables and the membrane and a large number of contact pairs.
In previous studies on the issue of friction between cable and membrane, the friction coefficient has been discussed in relatively little detail. Tsuchiya M. et al. [10] mentioned that a friction coefficient of 0.6 is appropriate, but this coefficient is not based on rigorous testing, and its value is no longer universal. Li Z. et al. [20] gave a range of suggested values for the friction coefficient between cables and membrane materials of 0.2–0.4 through the friction coefficient test between cables and membrane materials, where the friction coefficient between the PVC membrane material front and the PE sheath of the cable was 0.17–0.23, and a suggested value of 0.25 was given as HDPE and was used instead of PE sheath in the test.
In view of the paucity of available test data on the friction coefficient between membrane materials and cables and the large discrepancy between the data provided by various scholars. A few scholars have studied the influence of the friction coefficient between the cable and the membrane on the initial shape and load response of an air-supported membrane structure adopting the contact model. Thus, this paper conducted tests on the friction coefficient between various membrane materials and PE sheathing materials by adopting the membrane materials and PE cables commonly used in existing air-supported membrane structures in actual projects. Current research primarily adopt numerical simulation to investigate this issue; therefore, as the research parameter for this work, three dynamic friction coefficients were chosen based on the test data results. Then, this study established the contact pair model between the cable net and the membrane for an air-supported membrane structure with an oblique cable net and employed the slow dynamics method to solve the initial form and wind load response of the air-supported membrane structure with different friction coefficients and to compare the effects of different friction coefficients on the form-finding and wind vibration responses.

2. Coefficients of Friction Test between Cable and Membrane Materials

The collaborative work between the cables and the membrane is accomplished by the interaction force between the cables and the membrane in frictional contact. Therefore, the friction force should be regarded as the main factor impacting collaborative work, which also inevitably involves the friction coefficient μ. In prior research on friction between cables and membranes, reference or recommended friction coefficient values were limited and no longer universal. Consequently, based on the application of cables and membrane materials in the current engineering practice of air-supported membrane structures, steel cable in the form of granular HDPE plastic material wrapped by direct mechanical extrusion, which is employed in the actual project, and some representative membrane materials were chosen for the coefficients of friction test between cable and membrane materials in this paper. Regarding the selection of membrane materials, eight kinds of P-type membrane materials with a polyester fabric substrate were selected based on the membrane material manufacturers and the different surface treatment layers.
The coefficients of friction test shall be performed in accordance with the Chinese standard “Plastics—Film and sheeting—Determination of the coefficients of friction” (GB/T 10006-2021) (PFD for short) [21] for the determination of the static and dynamic friction coefficients when sliding between the material surface and the cable. According to the PFD, the membrane material and PE sheeting slider were selected as the friction pair for the test. The membrane material should be cut into a specimen with dimensions of 80 mm × 200 mm. Furthermore, cable sleeve material should be fashioned into a square PE sheeting with an area of 40 cm2 (side length is 63 mm) which is pasted on the same side-length flat sheeting so that the total sheeting mass is (200 ± 2) g.
The coefficient of friction test was conducted in the laboratory of the Testing Centre of the Institute of Plastics Processing and Application in the Light Industry of Beijing Technology and Business University (China National Centre for Quality Supervision and Test of Plastics Products, Beijing) at a room temperature of 23 °C and a relative humidity of 45%. The coefficients of friction test should be performed three times between the positive surface of each membrane material sample and PE sheeting (as shown in Figure 1). The test results were recorded, and the average of the three test results was taken as the final friction coefficient of this membrane, as shown in Table 1.
Table 1 demonstrates that the friction coefficients of membrane materials and cables from different manufacturers vary significantly. The static friction coefficient ranges from 0.27 to 0.73; meanwhile, the dynamic friction coefficient goes from 0.24 to 0.71, whereas the coefficient of static friction is greater than the dynamic friction coefficient. Considering that cable-membrane structures are subjected to different loads in real-time during functioning, this study adopted the dynamic friction coefficient and selected 0.2 and a median of 0.44 and 0.68, as a set of research parameters.

3. Model and Methods

3.1. Model Establishment

Based on an existing project example, this paper established a semi-elliptical air-supported membrane structure with dimensions of 389 m long, 101 m wide, and 36 m high, above which a diagonal cable net with a spacing of 4.8 m lies, as shown in Figure 2. The thickness of the membrane material is 1 mm, the density is 1500 kg/m3, the elastic modulus in the warp and weft directions is Ex = Ey = 9.43 × 10⁸ N/m2, and the Poisson’s ratio is νx = νy = 0.31; the cross-section size of the steel cable is 707 mm2, the density is 7850 kg/m3, the elastic modulus of the cable is E = 1.1 × 10¹¹ N/m2, and the Poisson’s ratio is ν = 0.30.
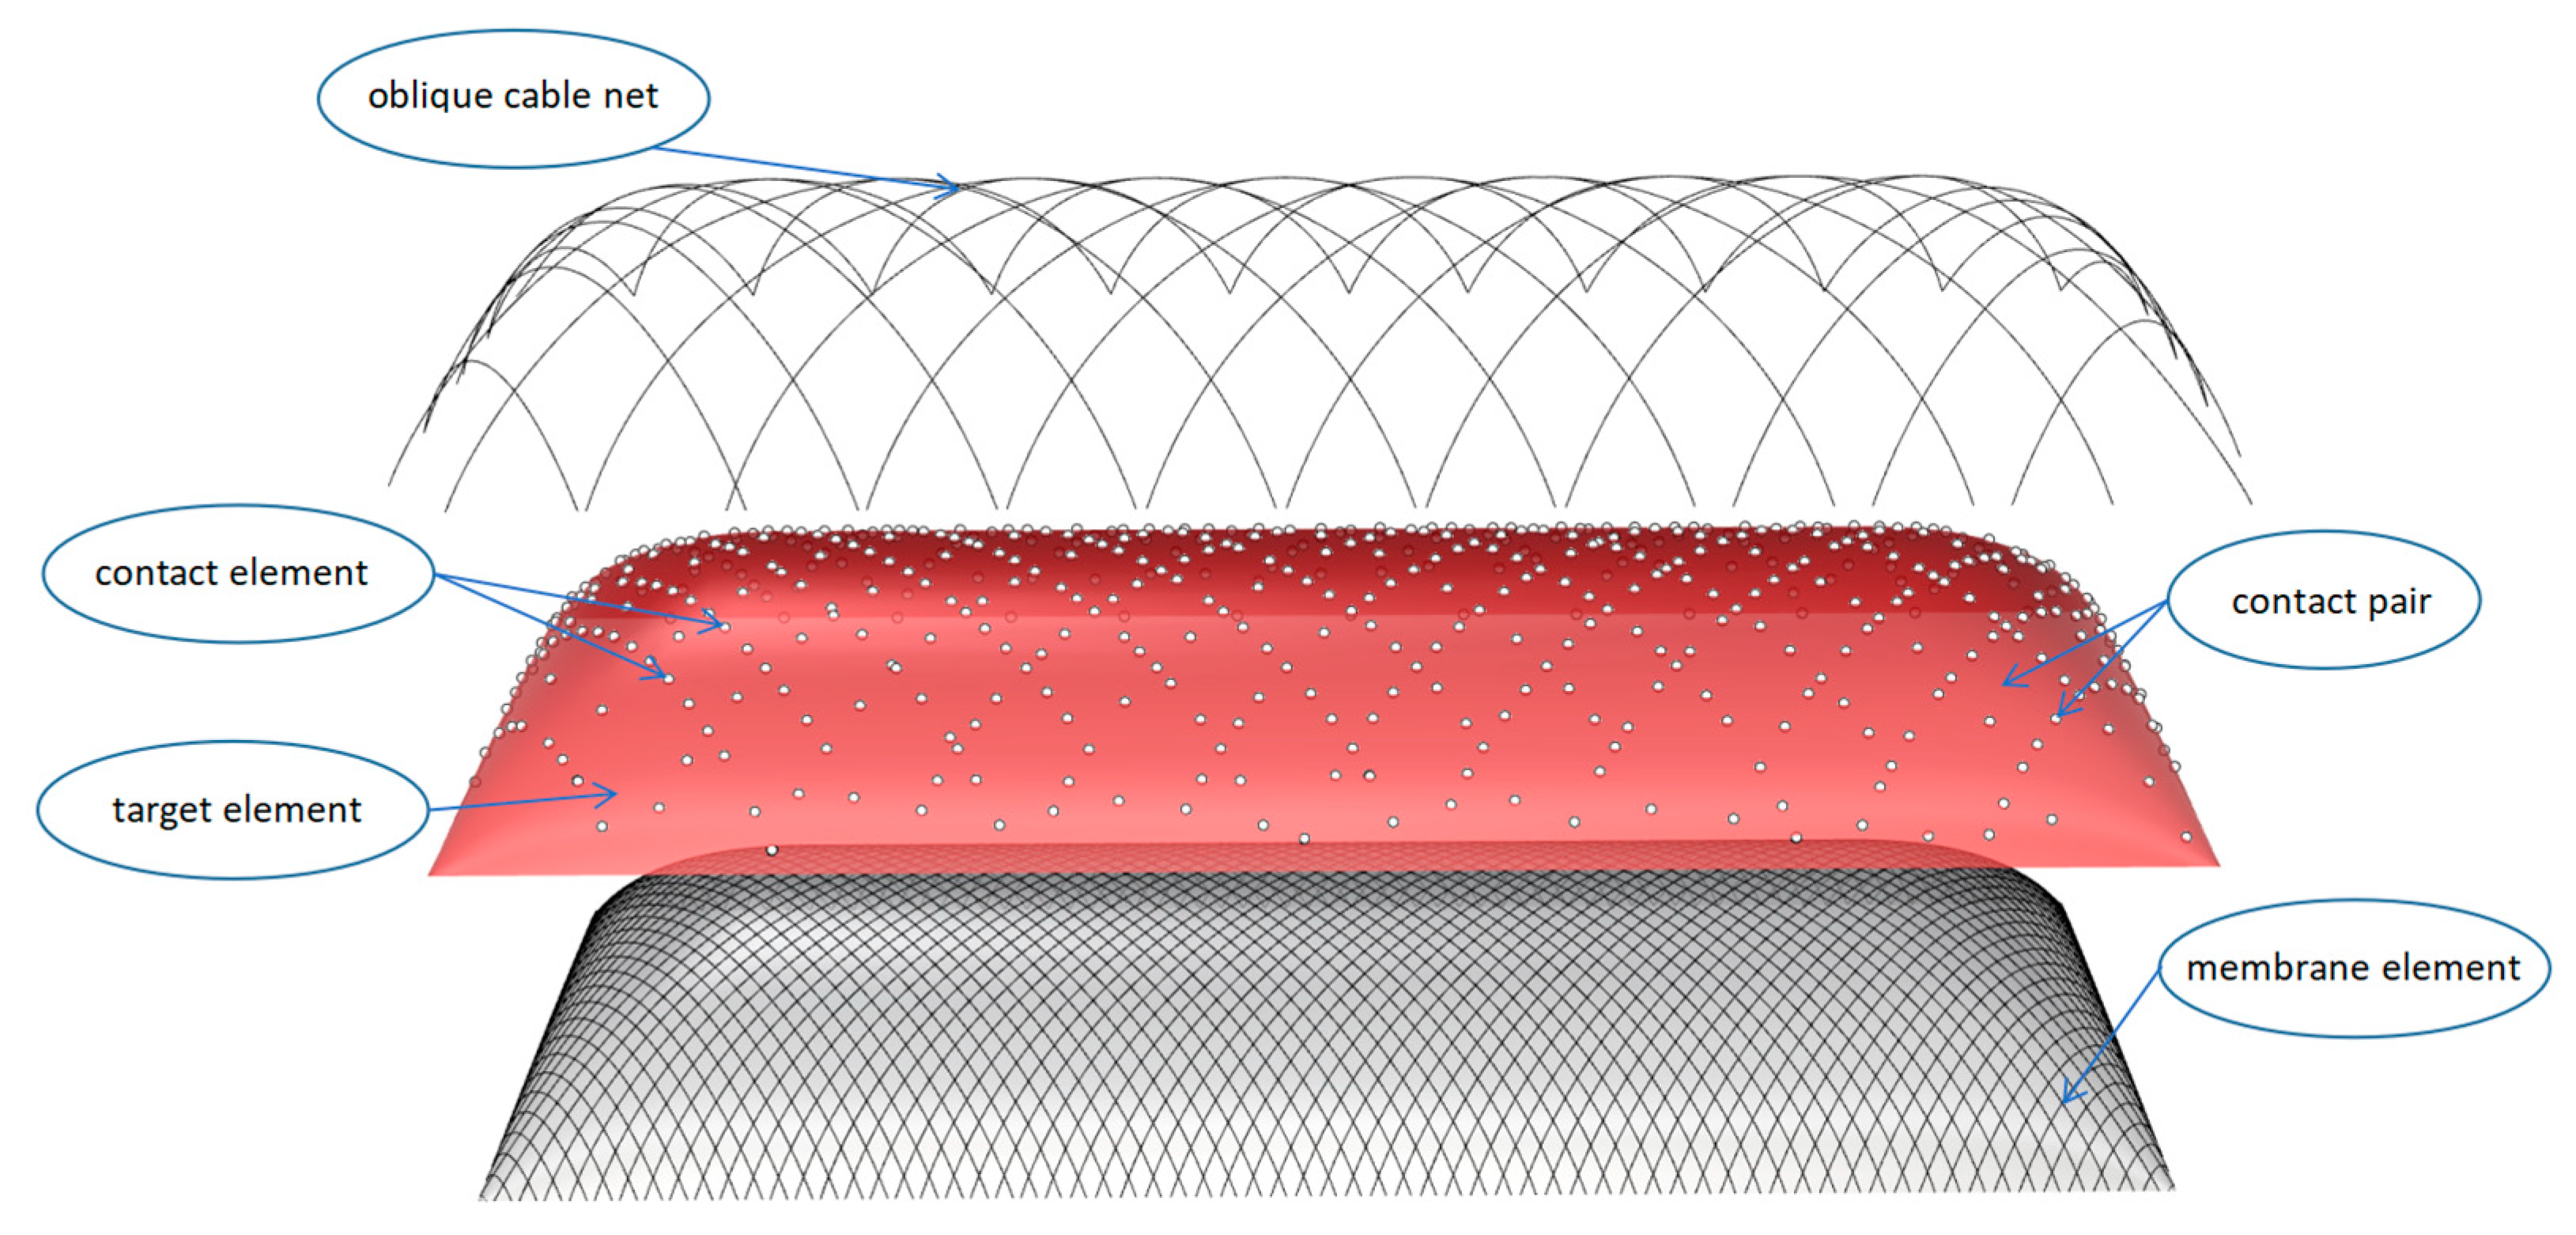
Moreover, this paper uses the finite element program ANSYS to establish the contact model and conduct numerical simulations. The cable is discretized into “Link10” elements and the membrane into “Shell41” elements. “Link10” is a three-dimensional pure tension or compression element. This work models a cable without bending stiffness in three dimensions using the pure tension element. “Shell41” is a membrane element with three nodes. It has no bending stiffness out of plane and just in-plane stiffness. Many tiny cable segments constitute the cable network of an air-supported membrane structure. All cable segment nodes make point-to-surface contact with elements on the membrane’s surface. The contact node (CONTA175) is positioned on the cable element below, while the target element (TARGE 170) is positioned on the membrane element [19]. Figure 3 depicts the contact model of the air-supported membrane structure with an oblique cable net.
The standard contact mode is chosen, which permits both sliding and contact separation between the cables and membrane. Setting the pinball region in the program distinguishes the separation, with the ball (3D) centered on the integral point of the contact element and the pinball radius set to twice the thickness of the underlying element by default. The state of the contact unit is determined by the motion and position of the contact element in relation to the target surface. The program identifies each contact element’s state (SATA = 0, 1, 2, or 3). When the target surface is outside of the pinball region, the contact state is far-field separation (SATA = 0). When the target surface enters the pinball region, the contact element is regarded as a near-field contact (SATA = 1), and the near-field contact element must then determine whether the contact is in a sliding (SATA = 2) or bonding (SATA = 3) state based on the position and stiffness.

3.2. Methods

Contact is a highly nonlinear behavior. In order to simplify the process of contact analysis, the following primary hypotheses are used in this paper [22]:
  • The contact surface is smooth and continuous.
  • Friction on contact surfaces obeys Coulomb’s law of friction.
  • The membrane material is an orthotropic elastic material, and the warp and weft directions of the material are always perpendicular before and after deformation.
The practice has demonstrated that many contact problems in engineering can be solved using the above assumptions while satisfying engineering accuracy [23,24,25].
The equilibrium equation can be determined from two objects in contact with each other:
K 1 0 0 K 2 U 1 U 2 = P 1 + R 1 P 2 + R 2
where subscript i = 1 represents the membrane surface and subscript i = 2 represents the cable net; Ki is the global mass matrix of object i; Pi is the global external load vector of object i; Ri is the contact force vector of object i; Ui is the node displacement vector of object i.
The contact force adopting the extended Lagrange algorithm [26] that combines the pure Lagrange multiplier method with the penalty function method and satisfies the contact coordination condition is defined as:
R = 0 , when u n > 0 , k n u n + λ k + 1 , when u n 0 .
λ k + 1 = λ k + k n u n , when u n > ε , λ k , when u n < ε .
where kn is the normal contact stiffness; un is the contact gap size; ε is the intrusion tolerance; λk is the component of the Lagrange multiplier at the kth iteration step.
When contact is considered, the equilibrium equation exhibits a high degree of nonlinearity. With the increasing number of contact pairs, the computational stability becomes particularly precarious and difficult to converge if the static solution method is used. In order to solve this problem, this paper introduces the slow dynamic method [27], where a transient solver is used to solve the static problem by applying all constant loads and large virtual damping, and then using a certain analysis time so that the effect of the dynamic response of the structure under the load will gradually decrease until it is stable. Thus, Equation (1) can be modified as follows:
M 1 0 0 M 2 U ¨ 1 U ¨ 2 + C 1 0 0 C 2 U ˙ 1 U ˙ 2 + K 1 0 0 K 2 U 1 U 2 = P 1 + R 1 P 2 + R 2
where Mi and Ci are the global mass matrix and the global damping matrix of object i, respectively; U ¨ i   a n d   U ˙ i are the node acceleration vector and the node velocity vector of object i, respectively.
Since large virtual damping is assumed to exist, the acceleration and velocity of the structure decrease and moves closer to zero after a certain analysis time, namely, M i U ¨ i and C i U ˙ i terms converge to 0. Consequently, the calculation result of Equation (4) will converge to that of Equation (1). Therefore, the problem of poor stability of calculation and nonconvergence of results by using the static calculation method has been solved, and the correctness and reliability of its results have been verified [18].

4. Results and Discussion

4.1. Initial Form Analysis

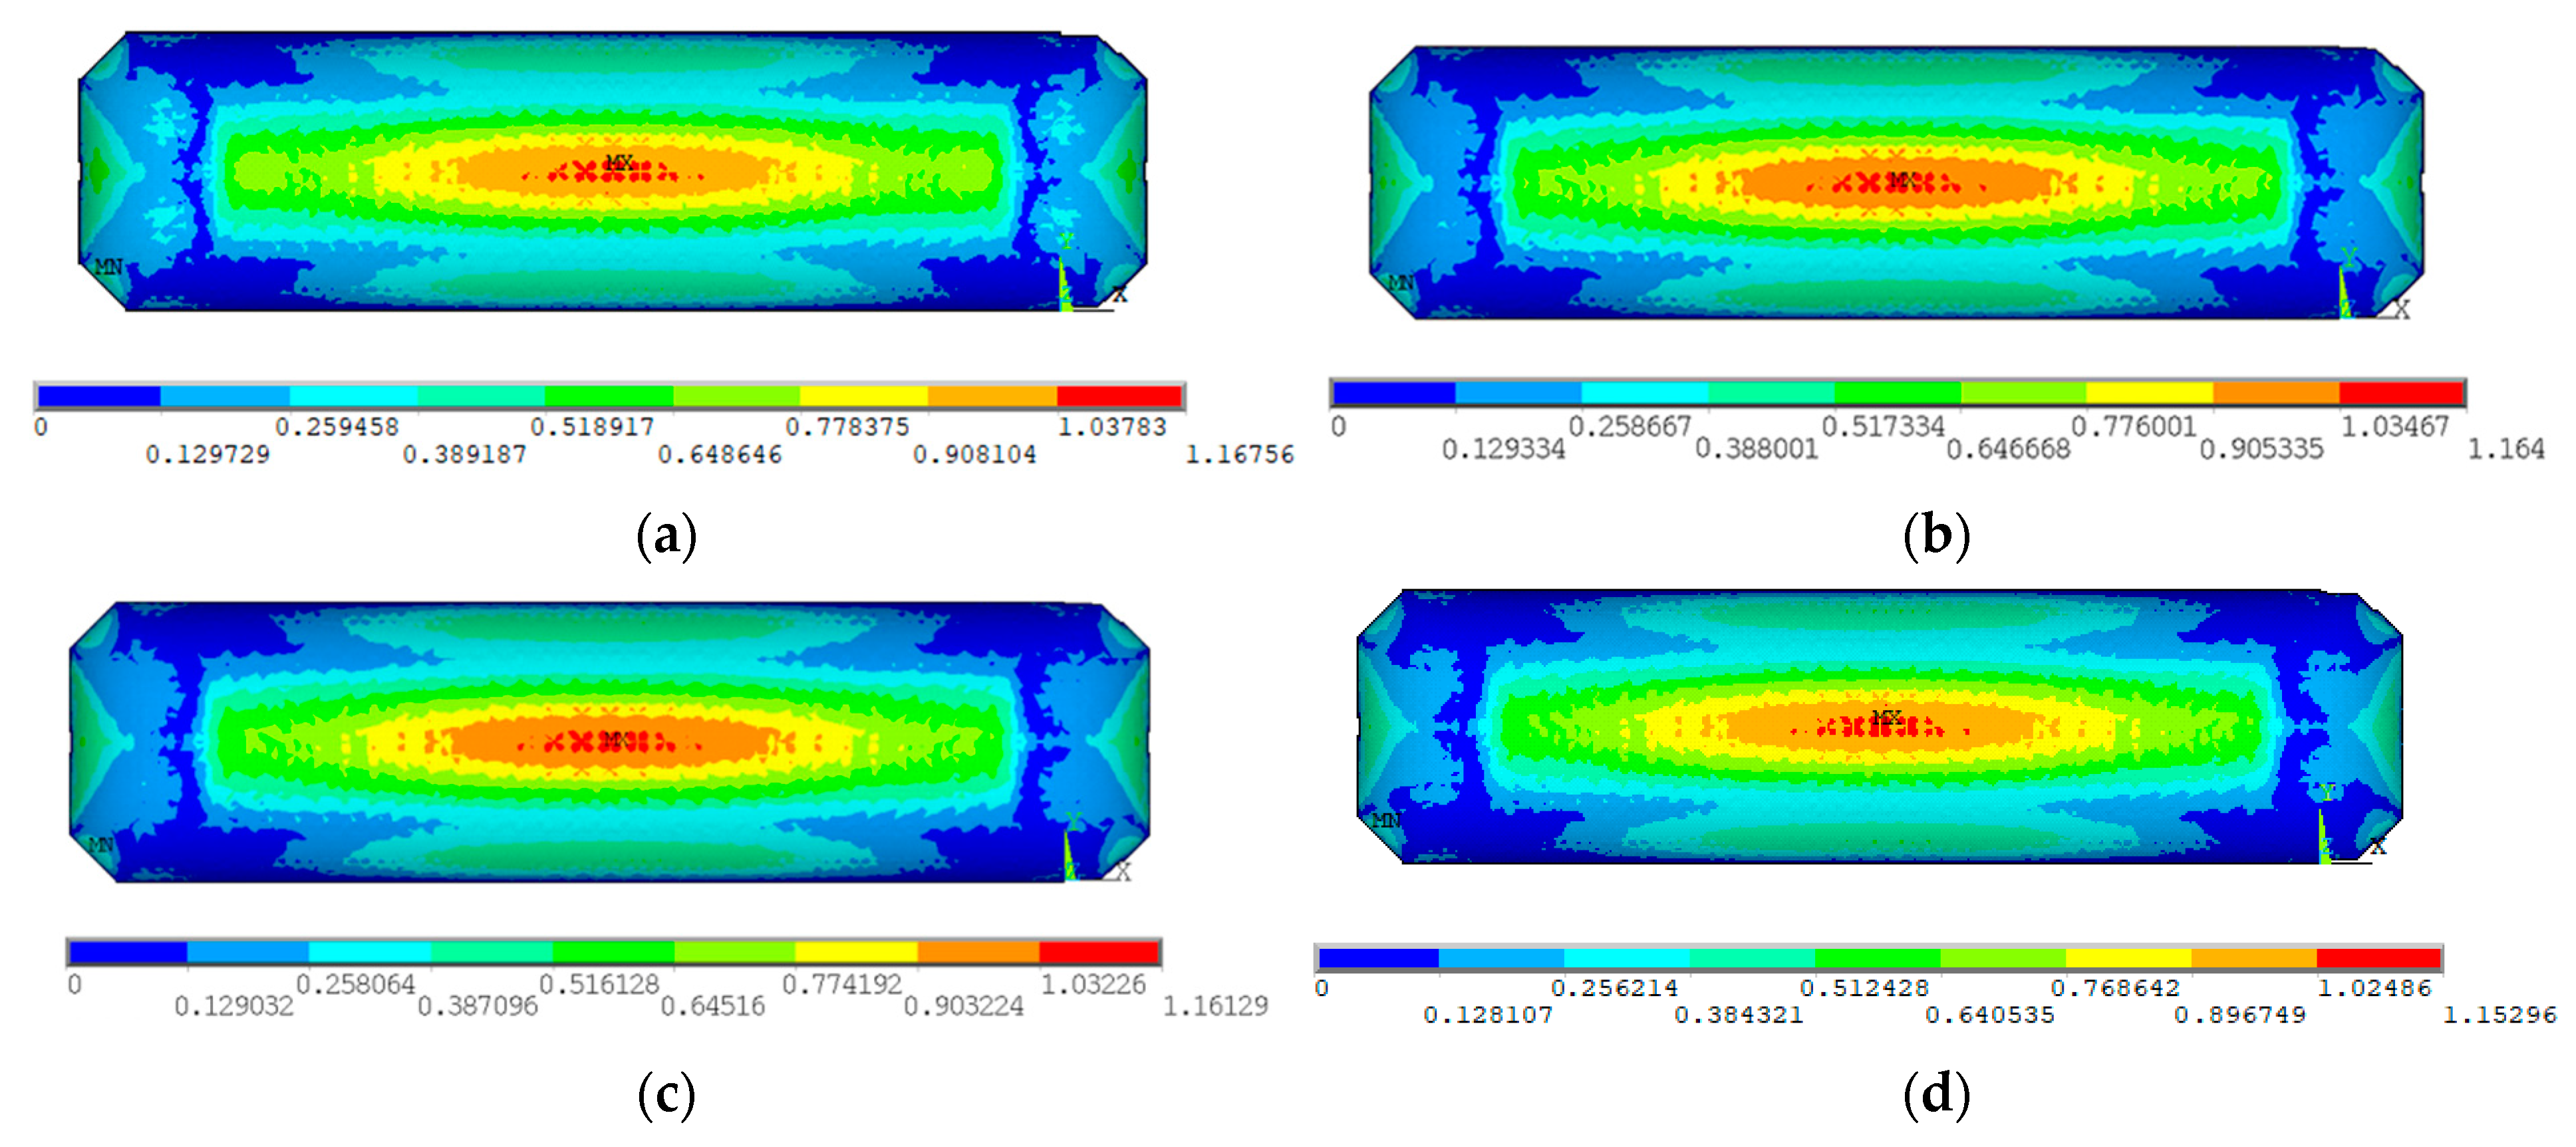
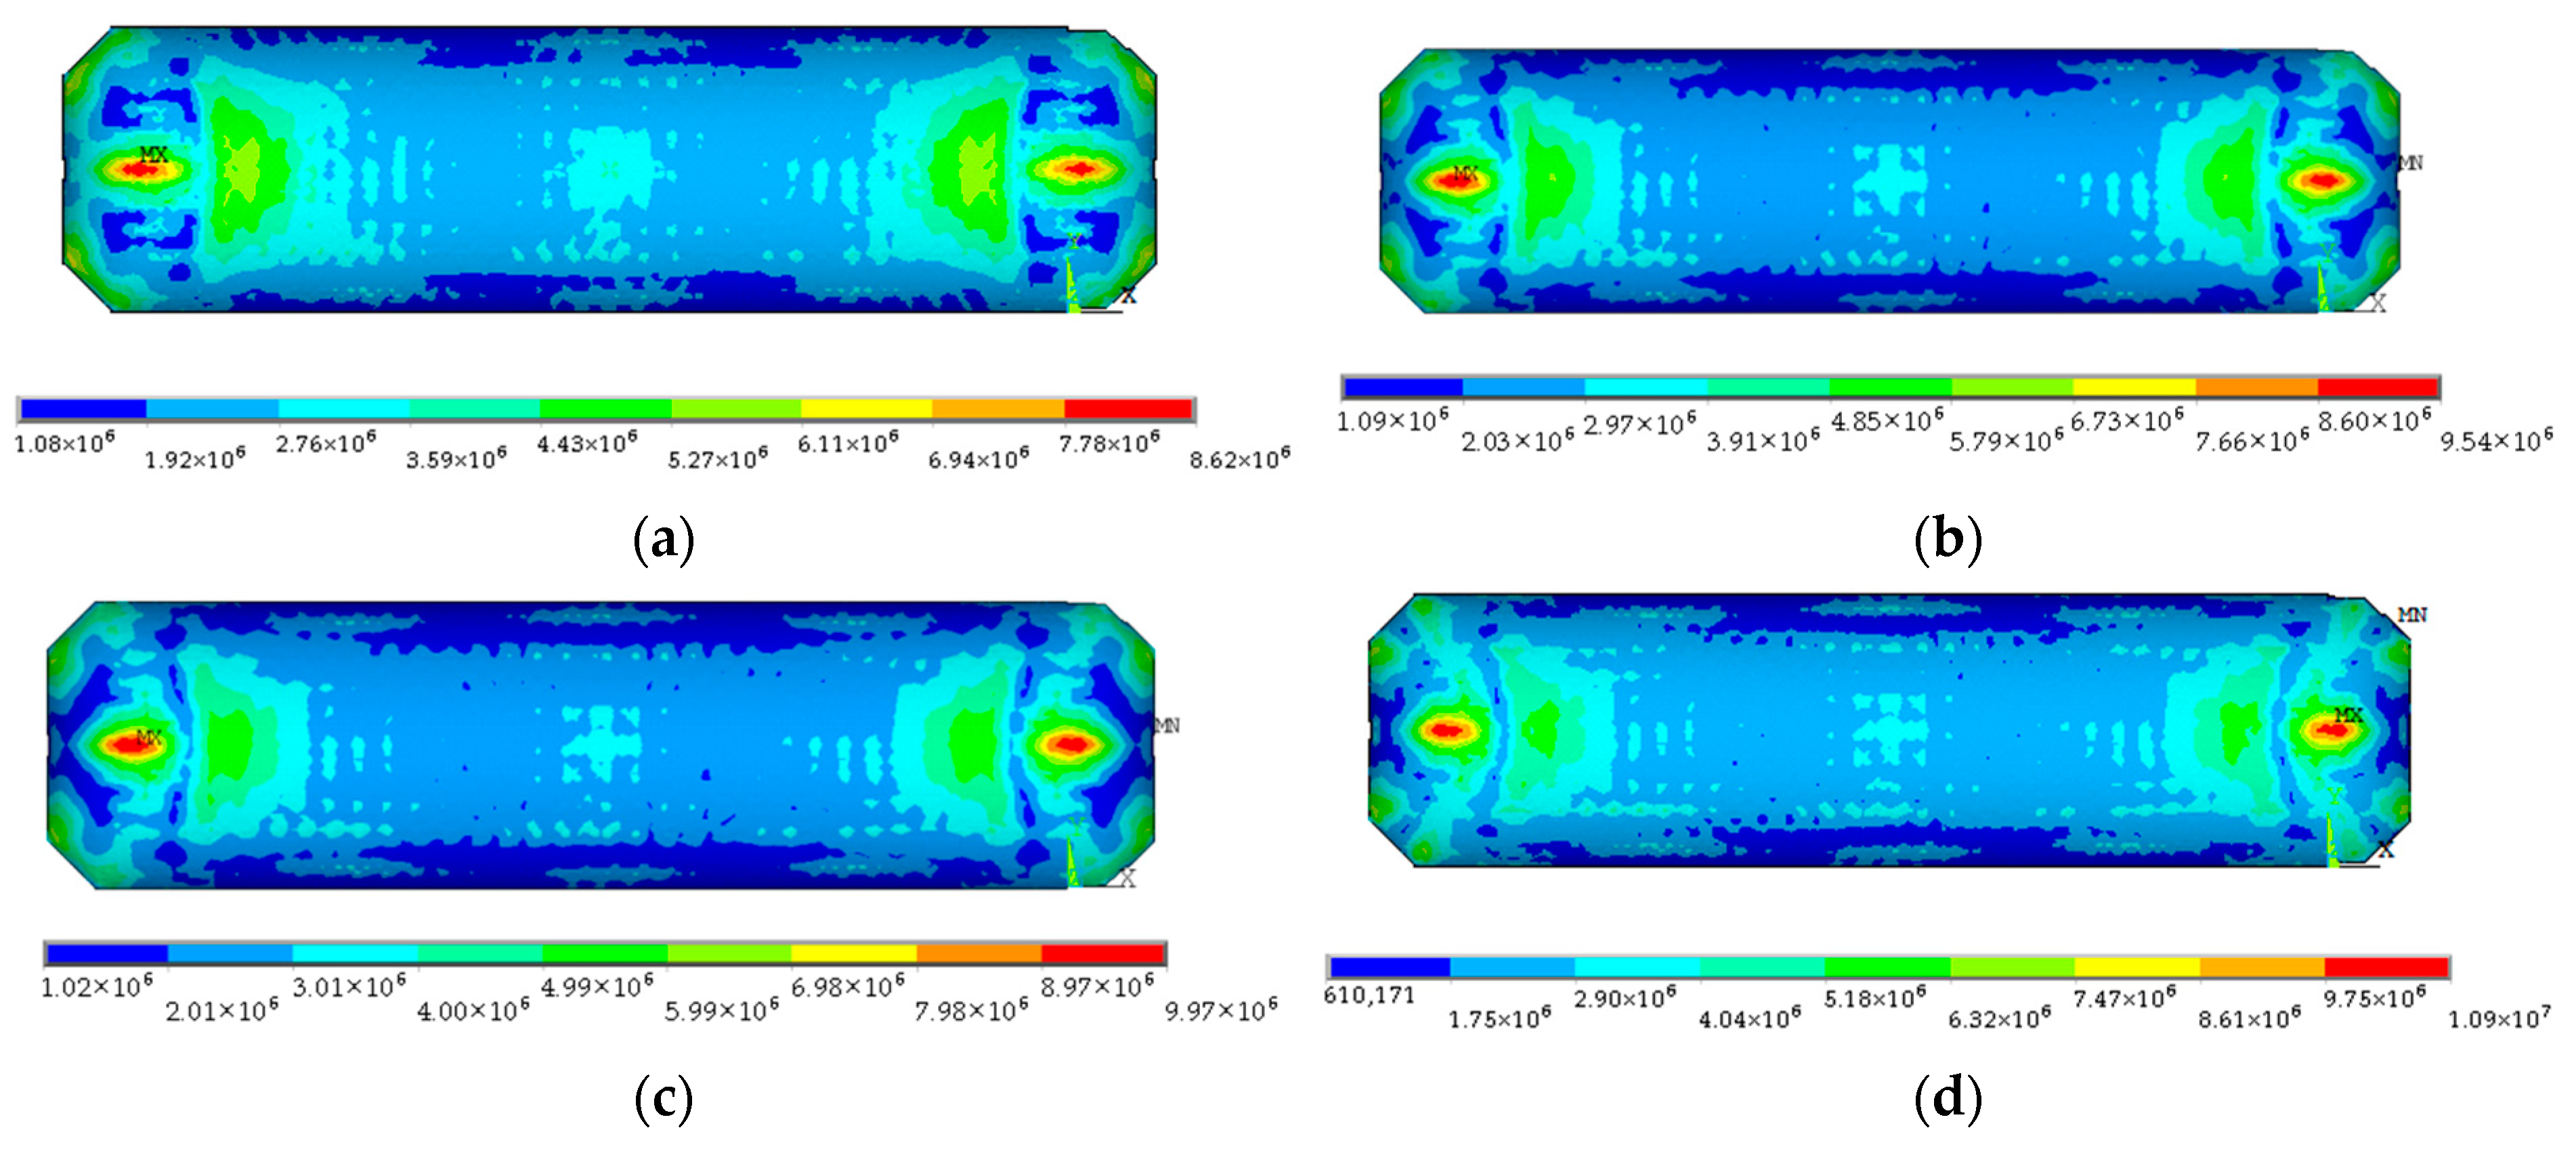
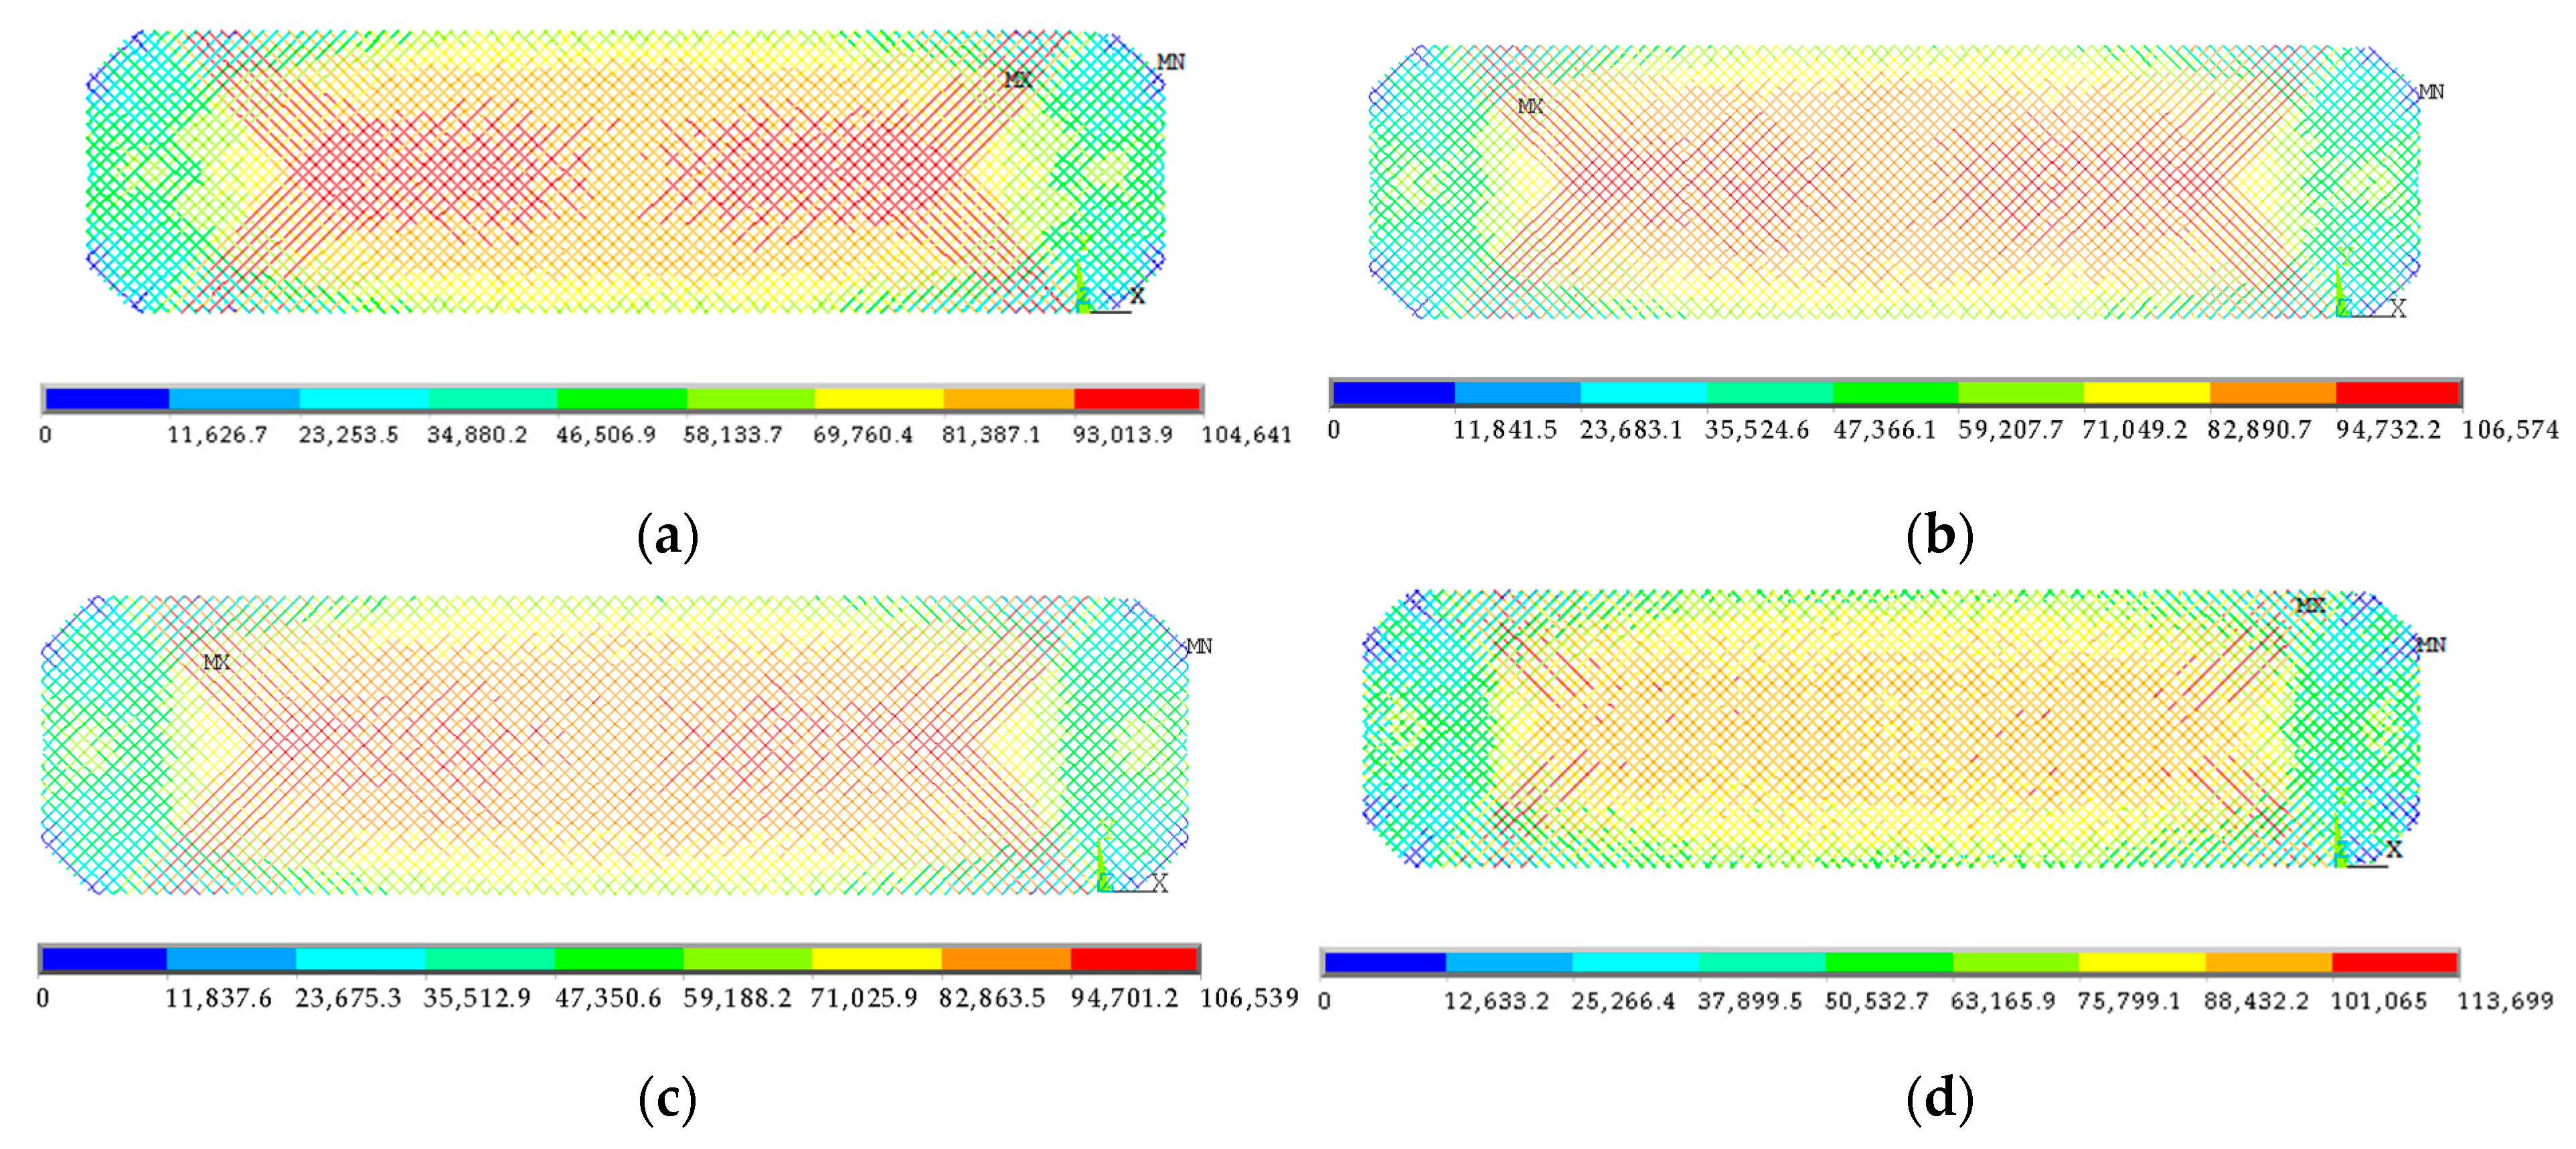
The air-supported membrane structure is anchored to the ground, and internal pressure is set at 600 Pa. The membrane coefficients are taken as 0.2, 0.44, and 0.68 for the initial form analysis and comparison, expressed as μ = 0.2, 0.44, and 0.68, respectively; the binding model means that the cable and membrane can neither slide nor separate (expressed in μ = ∞*). The results of the initial form analysis of the air-supported membrane structure with different friction coefficients are shown in Figure 4, Figure 5 and Figure 6.
As observed in the cloud chart of the computed results, the maximum membrane surface displacement when considering the cable and membrane contact reduces slightly as the friction coefficient increases, and the findings do not differ considerably from those of the binding model. In terms of membrane stress, membrane stress for μ = 0.2 is more uniform than membrane stress for μ = 0.44, μ = 0.68, and the binding model. When the friction coefficient ranges from 0.2 to 0.68, the maximum membrane surface displacement only decreases by 1.2%, the maximum membrane surface stress increases by 15.0%, and the maximum cable axial force only increases by 1.8%. The amount of the cable axial force drops significantly when considering the cable-membrane contact in comparison to the binding model, and it increases as the friction coefficient increases.

4.2. Cable-Membrane Contact under Equivalent Static Wind Load Action

The wind-induced response analysis of the structure adopted the equivalent static wind load method. The Chinese Code for Load code for the design of building structures (GB 50009-2012) [28] stipulates the following formula for calculating the standard value of wind loads perpendicular to the surface of a building.
w k = β z μ s μ z w 0
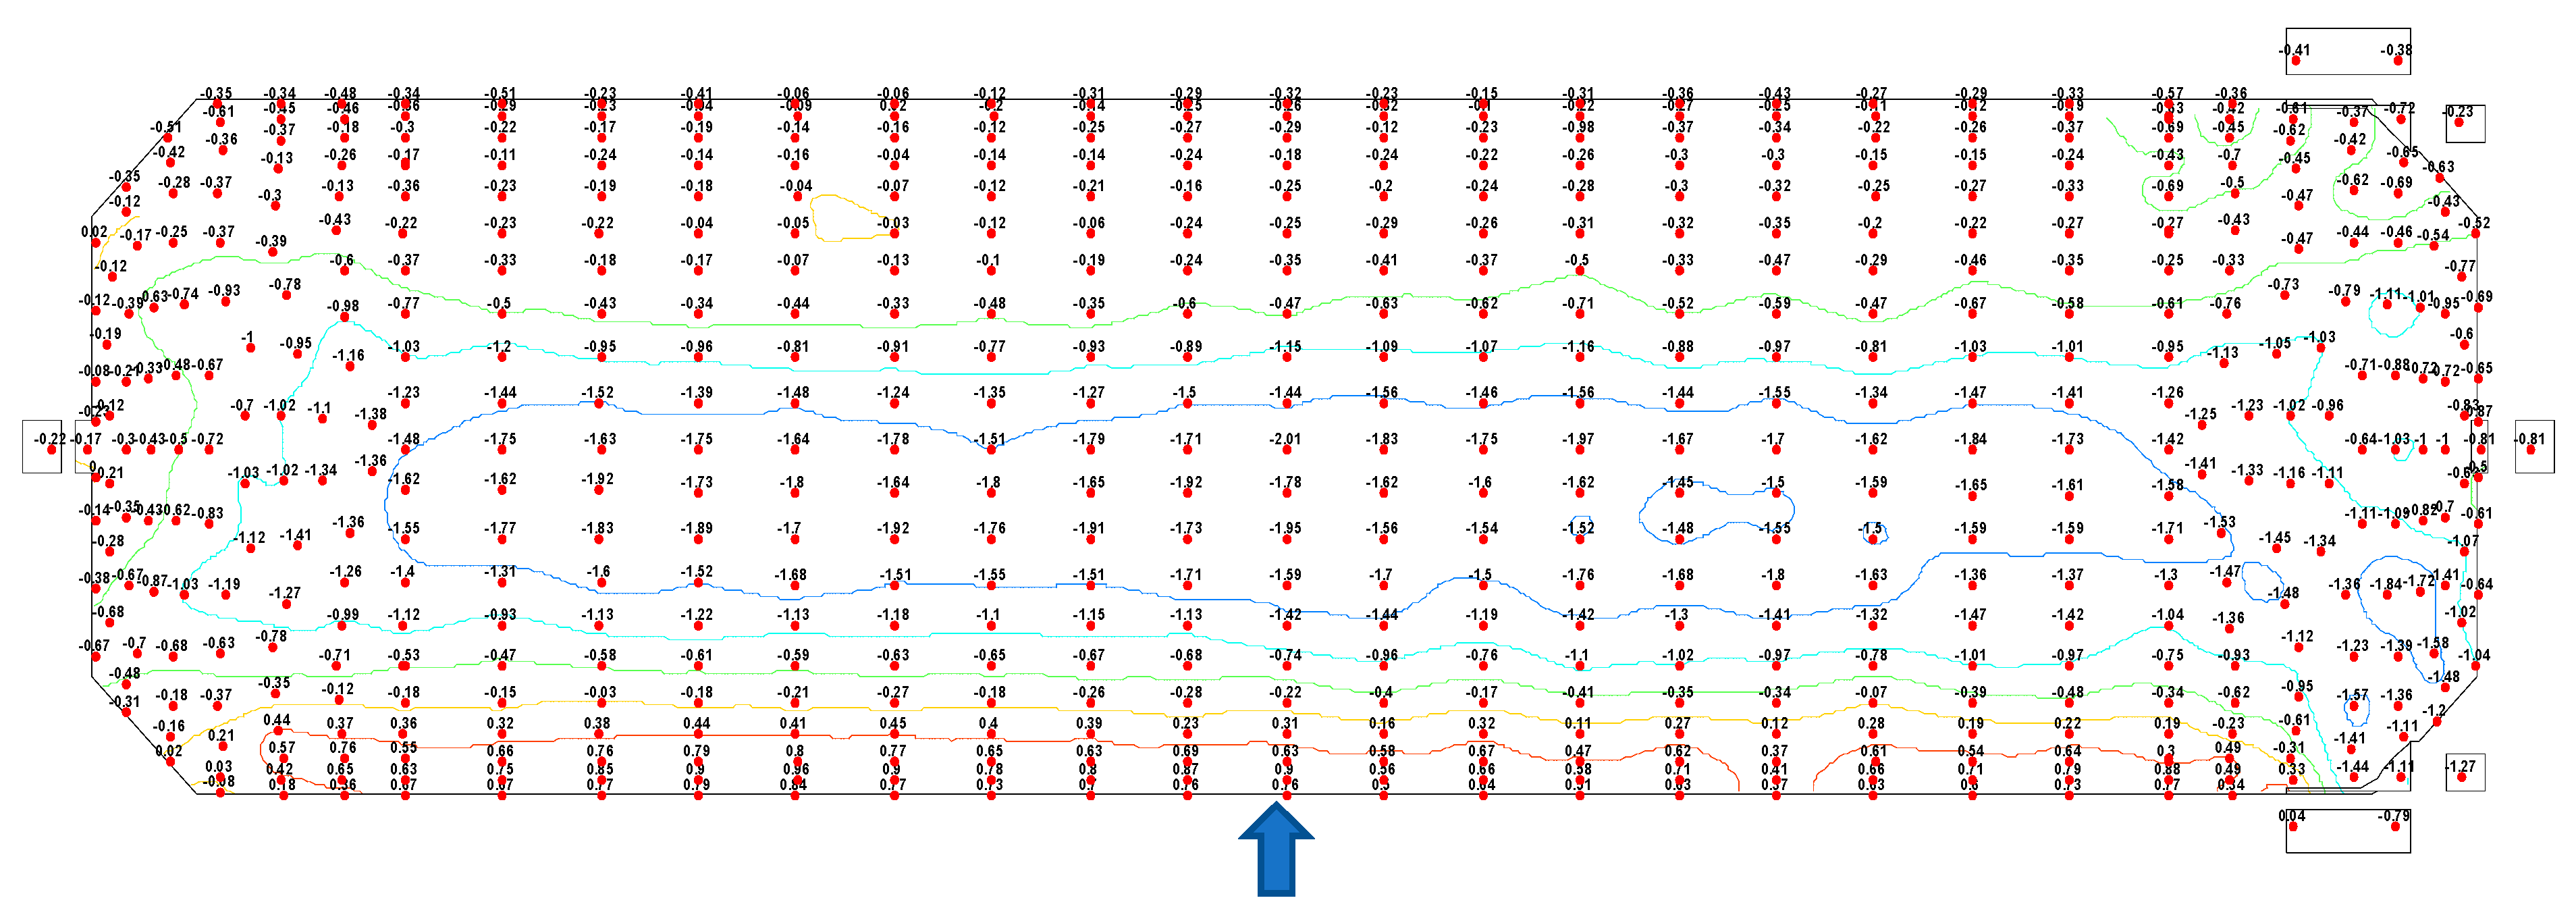
where βz is the wind vibration coefficient at height z, according to the technical specification for membrane structures (CECS 158-2015) [29]. The recommended value of the wind vibration coefficient for air-supported membrane structures is 1.2–1.6, and 1.5 is assumed as the wind vibration coefficient in this paper; μs is the volume factor of the structure; μz is the wind pressure height factor; μsμz is the average wind pressure coefficient; the average wind pressure coefficient in this paper is obtained from the wind tunnel test at 180° wind angle [18], the results of which are shown in Figure 7; w0 is the reference wind pressure.

4.2.1. Membrane Surface

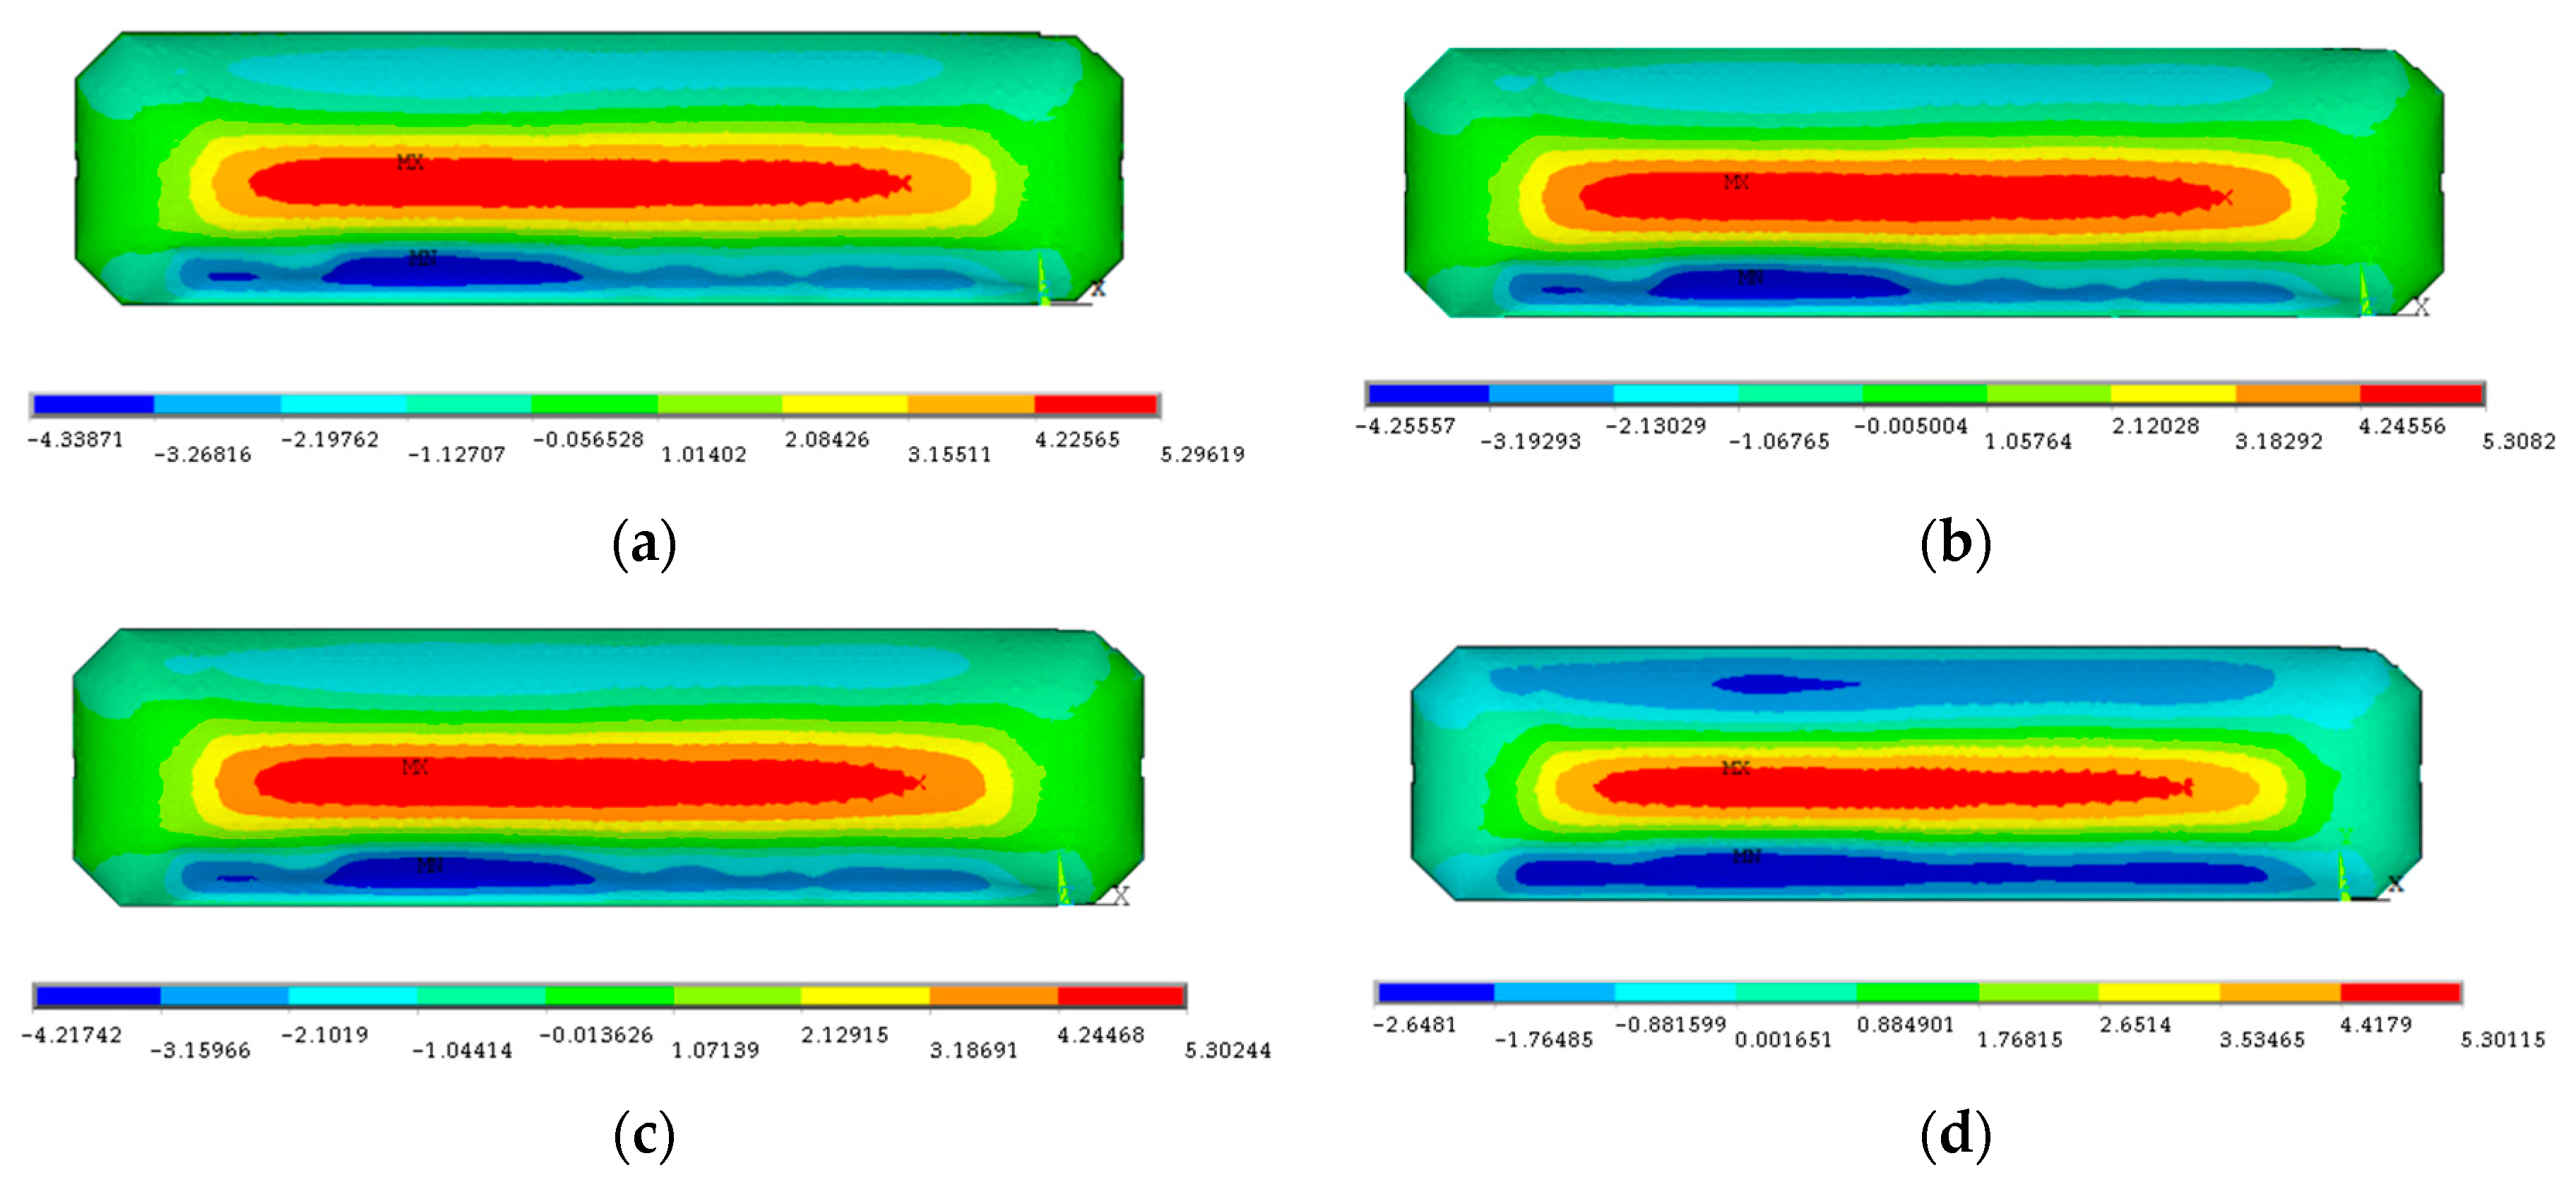
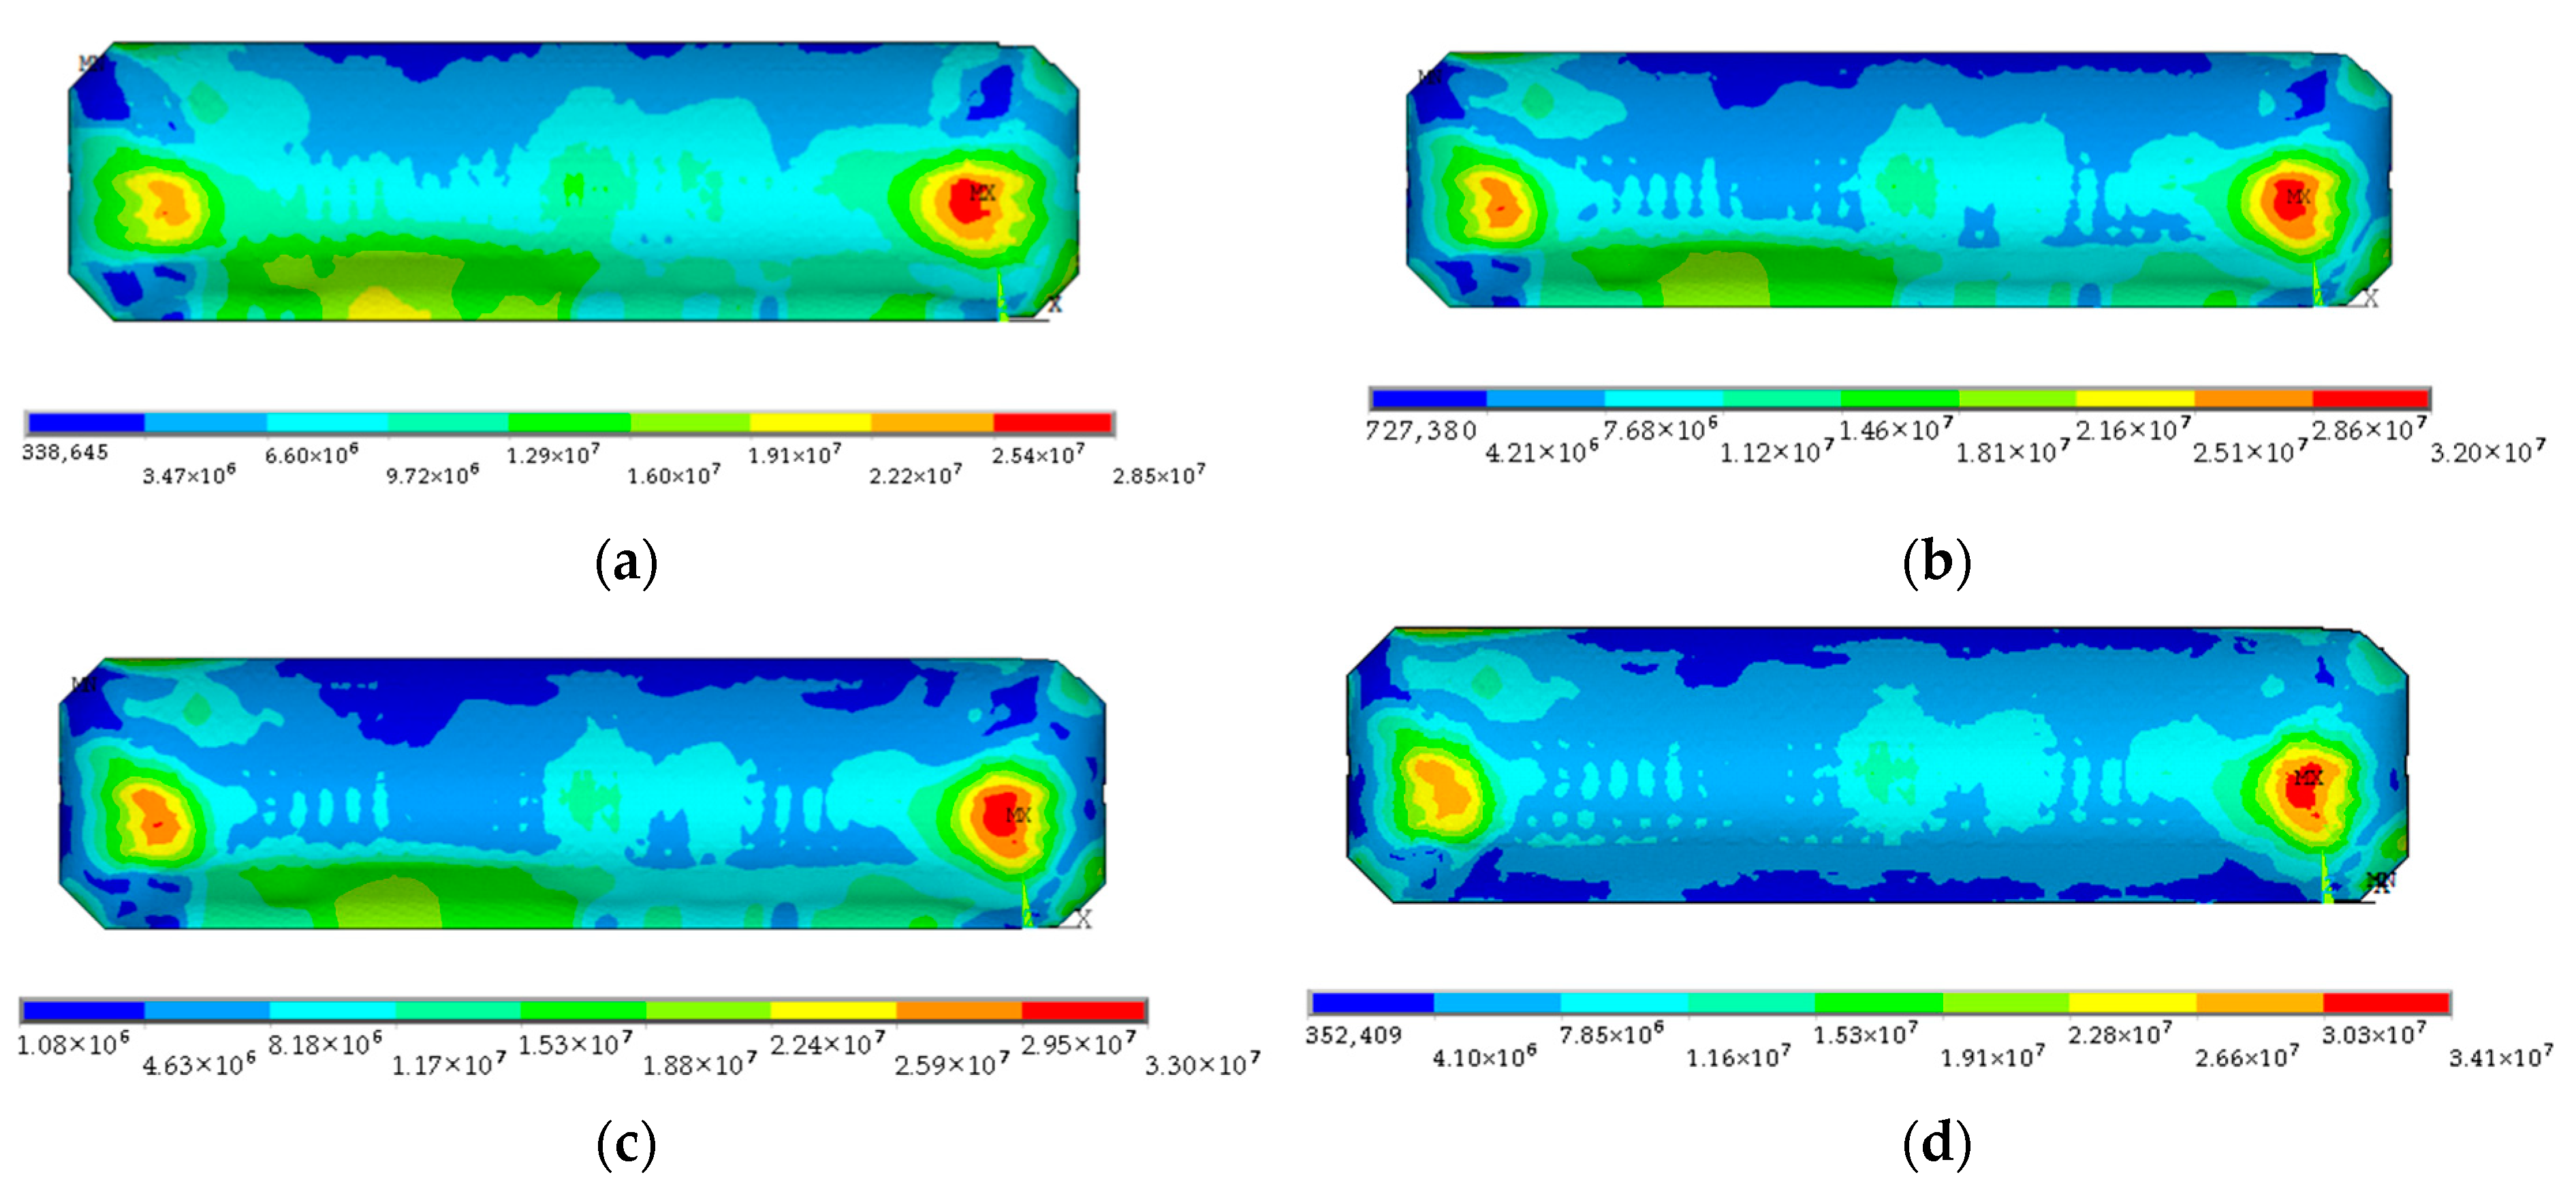
In this paper, a wind-induced response analysis is carried out for an air-supported membrane structure under a reference wind pressure (RWP) of 830 Pa, considering cable membrane contact slippage, comparing the structure under different friction coefficients, and considering the binding model. The membrane surface displacement and stress results are shown in Figure 8, Figure 9, Figure 10 and Figure 11.
Figure 8, Figure 9 and Figure 10 depict the displacement cloud charts of the x, y, and z components of the membrane surface. From the calculations, the membrane surface displacements for any component considering the cable-membrane contact are more significant than those for the binding model. In comparison to the x and z components, the membrane surface displacement in the y component, which accounts for the cable-membrane contact, differs by a maximum of 1.61 m from the estimated results of the binding model. As the coefficient of friction increases, the membrane surface displacement on the x and y components decreases, while the membrane surface displacement on the z component increases, but their degree of fluctuation is minor.
Figure 11 depicts the membrane surface stress cloud chart for the air-supported membrane structure. From the results, the membrane surface stress distribution when considering the cable-membrane contact is different from that calculated for the binding model, and as the friction coefficient increases, the membrane surface stress increases significantly, particularly at the membrane poles, and the membrane surface stress distribution gradually converges on the binding model stress distribution. When the friction coefficient is between 0.2 and 0.68, the maximum displacement of the membrane surface falls by 2.8%, and the maximum stress of the membrane surface increases by 15.8%.
As seen in Figure 10 and Figure 11, when employing the binding model, the displacement and von Mises stress on the windward region of the membrane are overestimated by 26.9% and 19.6%, respectively.

4.2.2. Cable Net

Figure 12 illustrates the axial force cloud diagram for the cable net of the air-supported membrane construction. The numerical findings indicate that the cable axial force increases with an increasing friction coefficient when the cable-membrane contact is considered; however, the computed results of the contact model are always less than those of the binding model. The stress distribution cloud chart reveals that the increase in the friction coefficient has no significant effect on the stress distribution of the cable axial force when the cable and membrane are in contact, and when the stress concentration occurs in the axial force of the cable net of the binding model. Combining these two aspects, when using the binding model, in the process of deforming and displacing the membrane, due to the cable-membrane common nodes and the difficulty of free movement of the cable net, the degree of mutual compression between the cable and the membrane is severe, thereby easily generating stress concentration, and the axial force increases. However, when using the cable membrane contact model, because the cable net can slip under the influence of the wind, the degree of mutual compression between the cable and the membrane is less, so the cable net stress is more uniform, and the structural forces are closer to their actual values. When the binding model is employed, the axial force of the restrained cable elements is overestimated by approximately 26%.
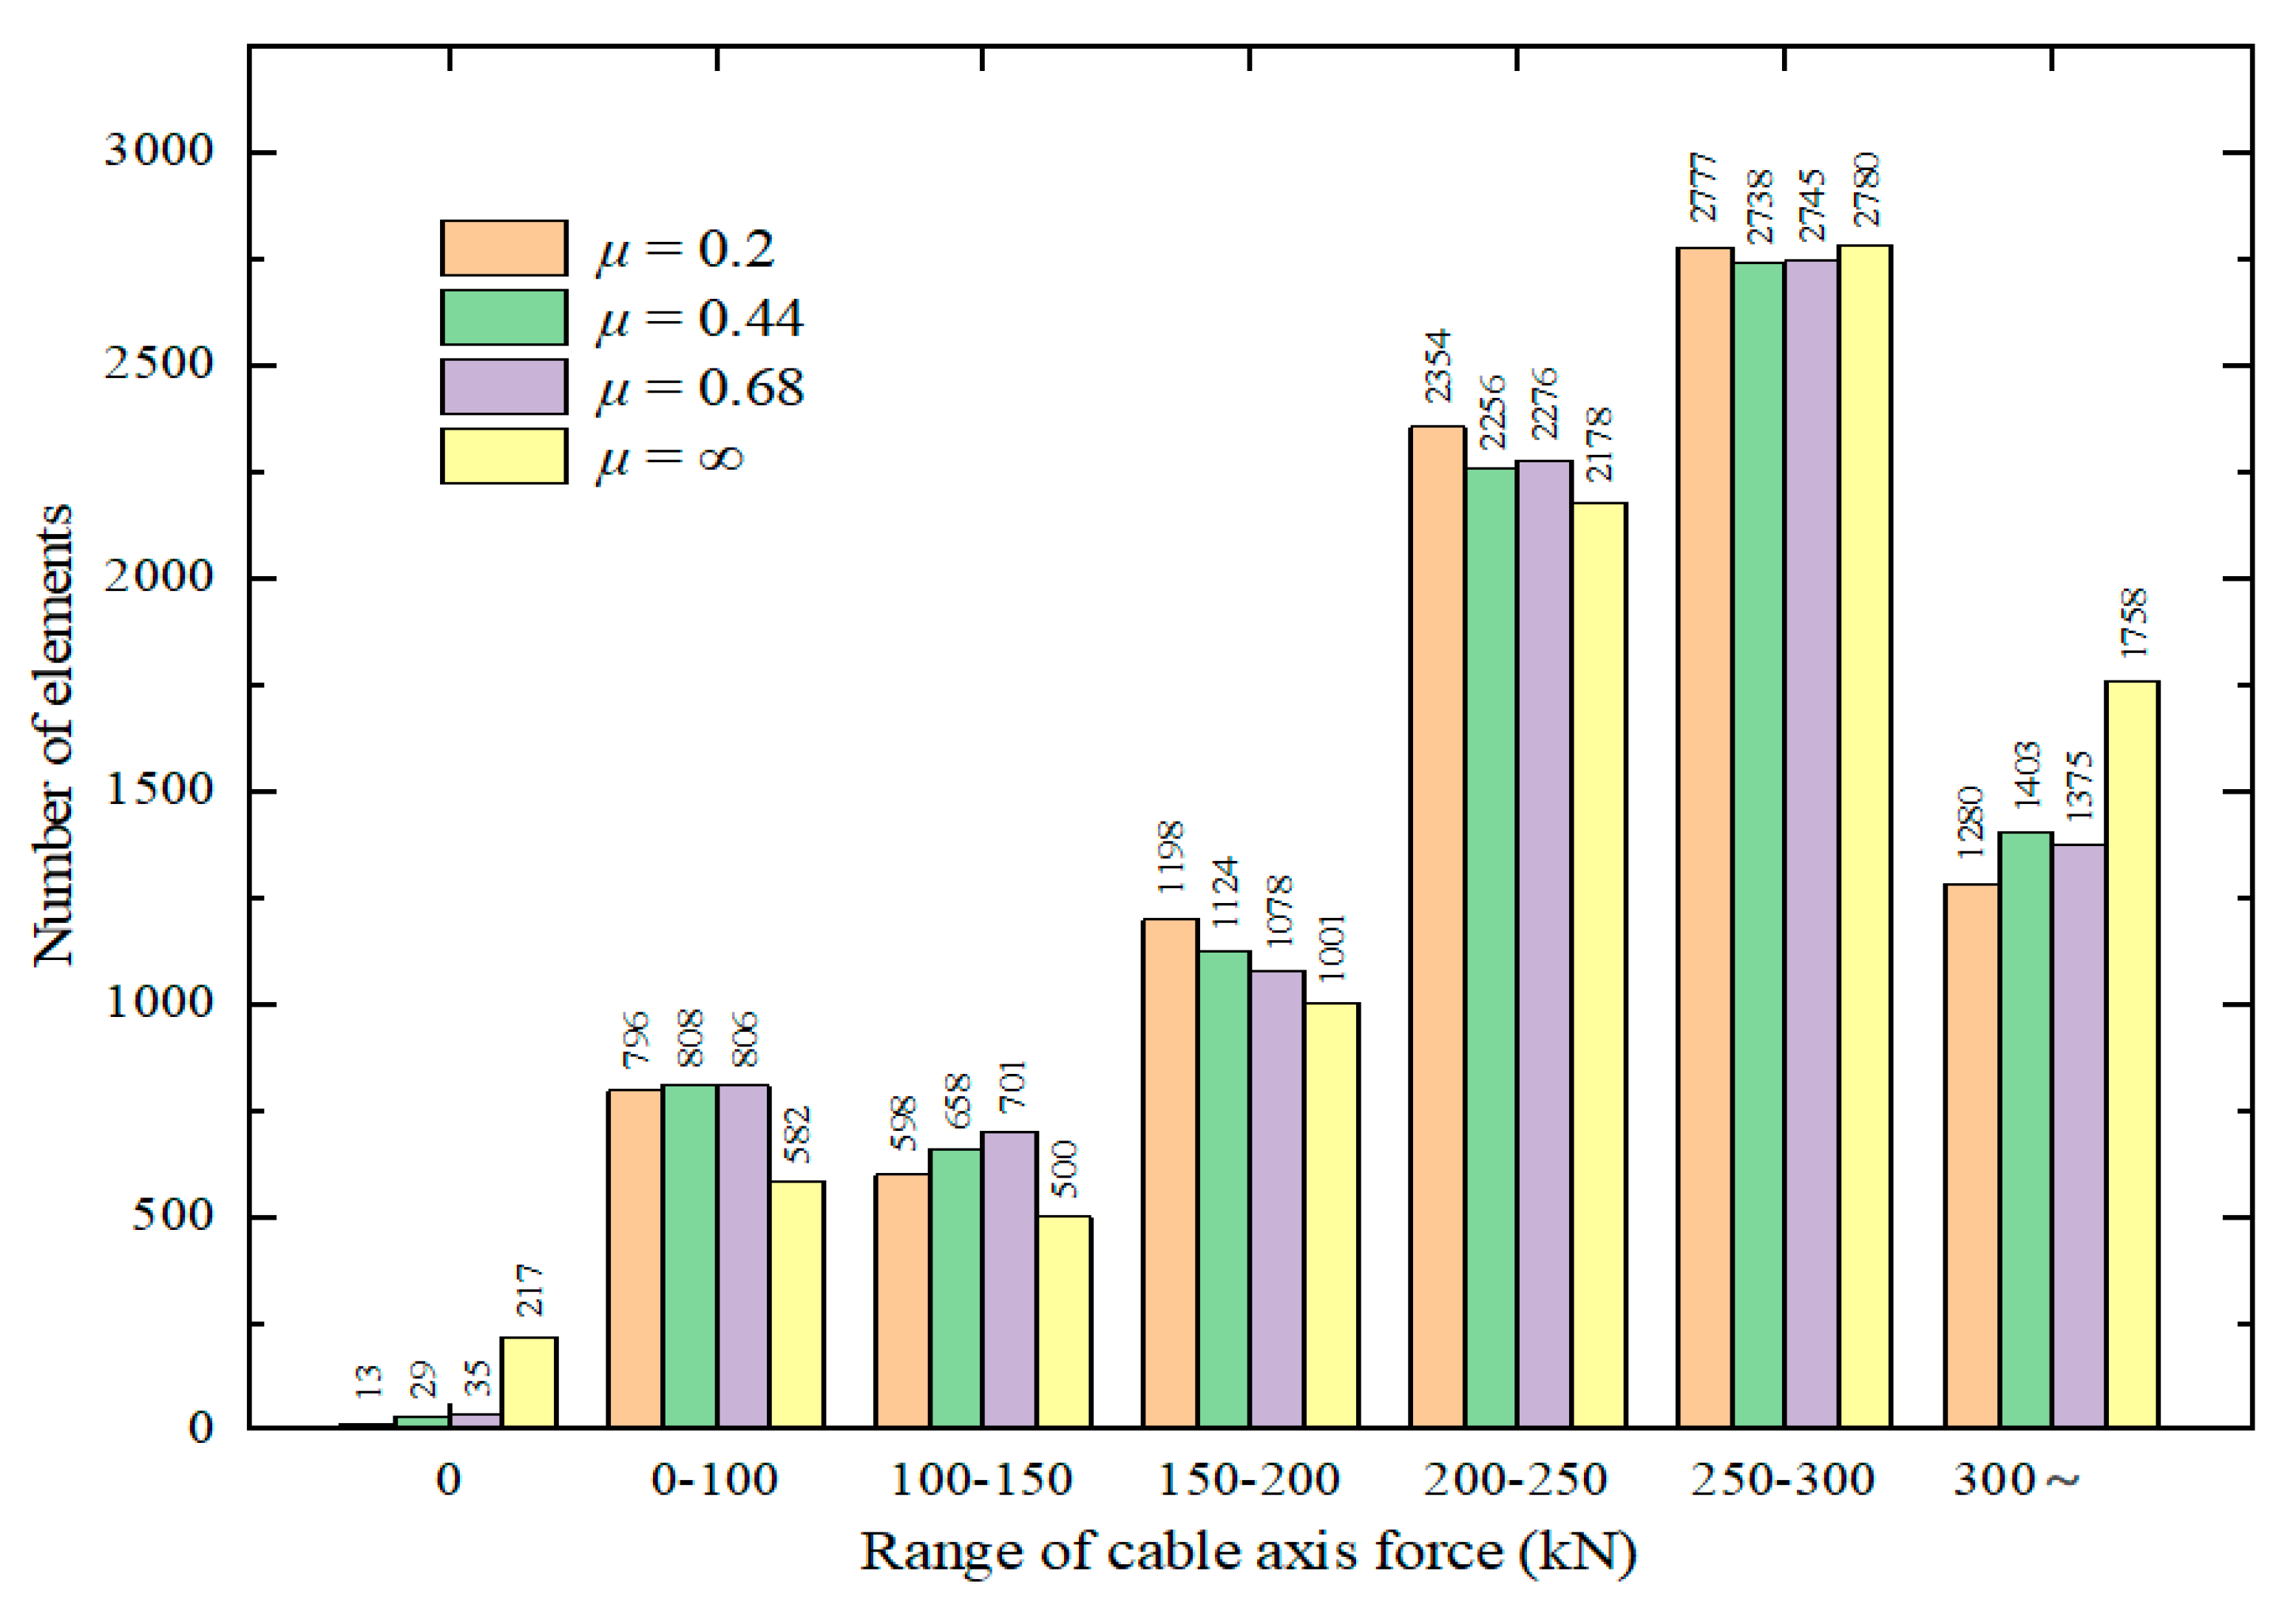
Figure 13 provides a histogram of the cable axial force statistics to corroborate the above findings. When the effect of contact slip of the cable membrane is not taken into account, the percentage of cable axial force in the interval of 200–300 kN is approximately 55%, above 300 kN it is approximately 19.5%, and the rest is approximately 25.5%. Furthermore, the number of cable elements with zero axial force is 217, which is greater than that of the contact model. The above discussion demonstrates that the distribution of cable force is not uniform, and the stress concentration is evident. However, when the contact and slip of the cable membrane are taken into account, the proportion of the cable axial force between 200 and 300 kN is approximately 56%, above 300 kN it is approximately 15%, and the remainder is approximately 28%. Moreover, the number of cable elements with zero axial force is significantly lower than that of the binding model. Consequently, the above discussion demonstrates that the distribution of cable force is more uniform.

4.2.3. Separated Region, Slip Region, and Contacted Region between Cables and Membranes

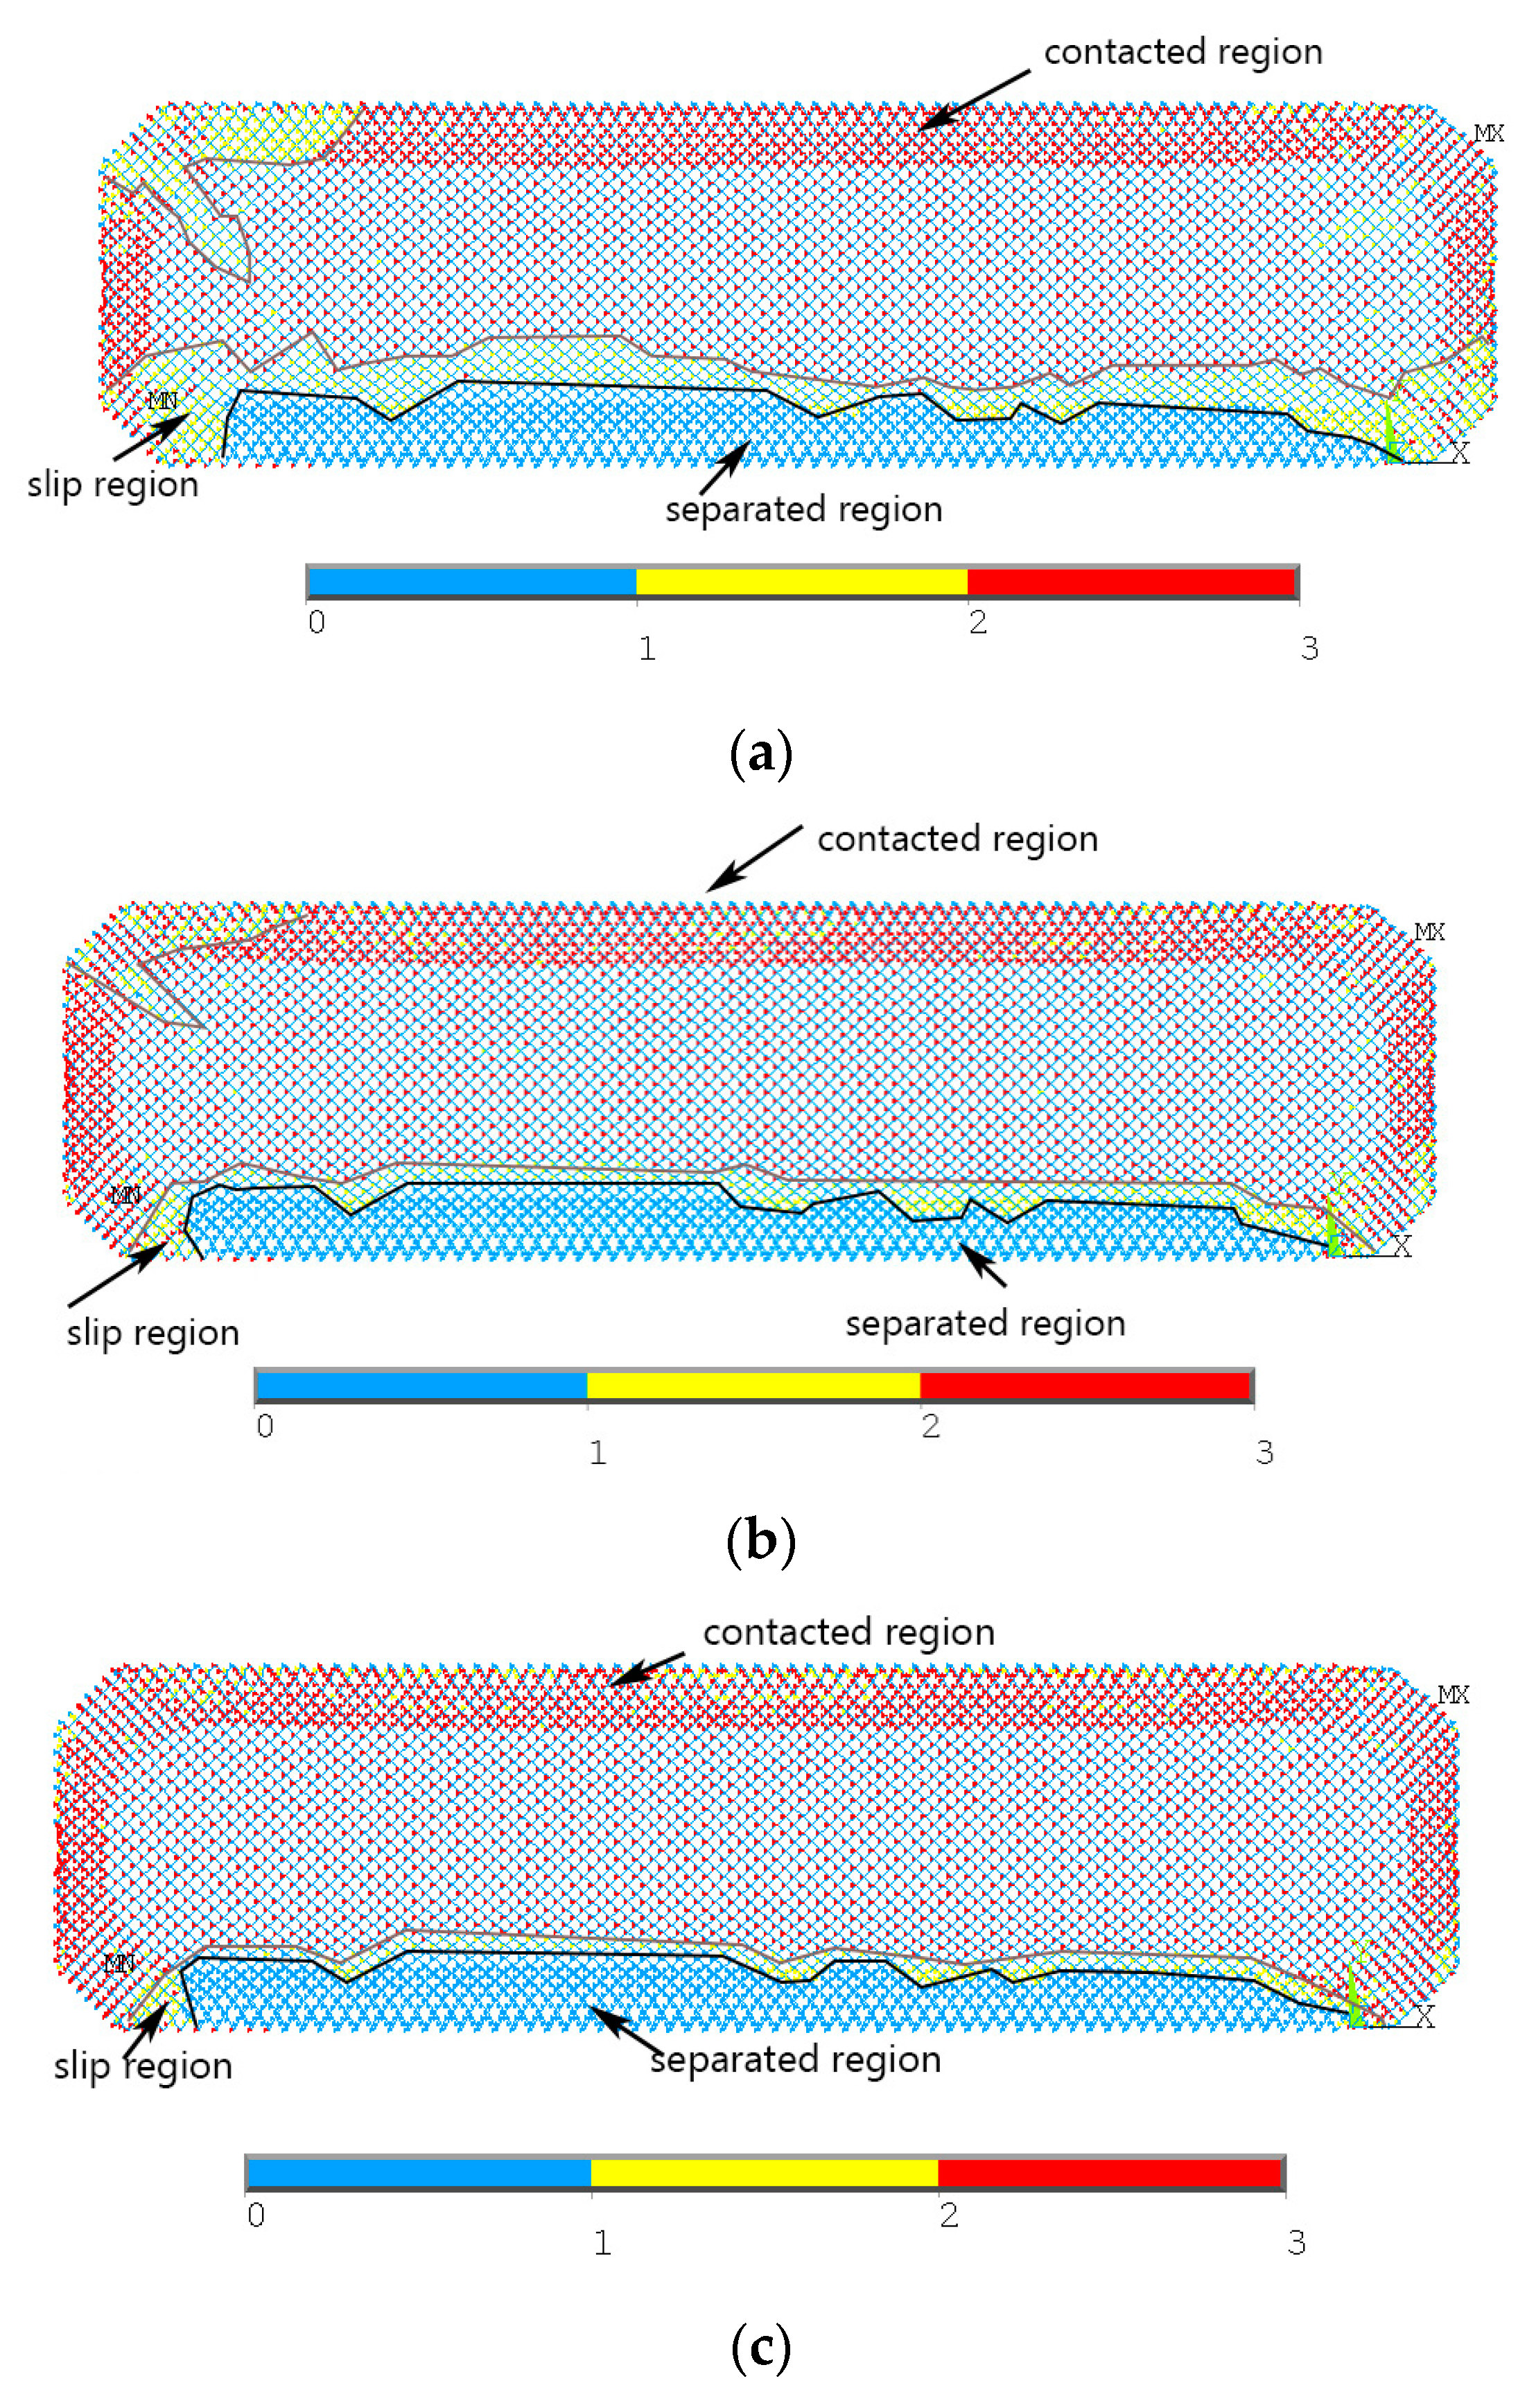
The contact state of the cable and membrane is evaluated in this research by querying the elements’ contact state (STAT). Figure 13 depicts the contact state of cables and membranes in air-supported membrane structures with varying friction coefficients. The separated region (blue area, STAT = 0) represents the point-surface contact pairs that are separated in this area. The contacted region (red area, STAT = 3) is where the point-surface contact pairs are in an extrusion state under the load action. Furthermore, the slip region (yellow area, STAT = 2) consists of point-surface contact pairs that generate relative displacement and are in a state of contact and subextrusion.
As demonstrated in Figure 14, under the same wind pressure, the separated region changes very little for various friction coefficients, indicating that the separation area is unaffected by the friction coefficient. However, the slip region and the contact region are different. When the friction coefficient is small (μ = 0.2), the slip region is significant, whereas as the friction coefficient increases (μ = 0.44, μ = 0.68), the area of the slip region gradually decreases, which denotes that an increase in the friction coefficient reduces the slip of some cables, as they must overcome greater friction forces to slip. Correspondingly, with an increase in friction coefficient, the number of contact pairs in the contact state increases, causing a larger contact region.

5. Conclusions

In this paper, the friction coefficient test between eight kinds of P-type membrane materials and cables was carried out. The impact of the friction coefficient between the membrane and cable on the initial shape and wind-reduced responses to the air-supported membrane structure with an oblique cable net was discussed, and the results were compared with that of the binding model. The following conclusions were reached:
  • The test method adopted in this paper can effectively measure the friction coefficient between the cable and the membrane. The static friction coefficient between the cable and the membrane observed in this study ranges from 0.27 to 0.73, while the dynamic friction coefficient ranges from 0.24 to 0.71. Static friction coefficients are greater than dynamic friction coefficients.
  • The contact relationship between the membrane and the cable net is established by utilizing contact pairs and adopting the ANSYS software; the calculation results indicate that this contact model can accurately simulate the sliding and separation between the membrane and the cable net of air-supported membrane structures with an oblique cable net.
  • The conventional binding model is incapable of accurately simulating the actual connection state between the cable net and the membrane. For an air-supported membrane structure with an oblique cable net, when employing the binding model, the axial force of the restrained cable elements is overestimated by approximately 26%. Furthermore, the displacement and von Mises stress on the membrane’s windward region are underestimated by approximately 26.9% and 19.6%, respectively, when the binding model is considered.
When the contact model is adopted, the maximum membrane surface stress is increased by 15.8%, the maximum axial force of the cable is reduced by 5.5%, and the coefficient of friction is increased from 0.2 to 0.68.
A constant friction coefficient was adopted in this paper, which is the limitation of the study; further studies should focus on examining variation in the friction coefficient for better practical application.

Author Contributions

Conceptualization, Y.H. and Y.Z.; methodology, Y.Z.; software, G.L. and Y.Z.; validation, G.L., Y.H., and Y.Z.; formal analysis, G.L.; investigation, Y.Z.; resources, Y.H. and L.Z.; data curation, L.Z.; writing—original draft preparation, G.L.; writing—review and editing, G.L and Y.H.; visualization, G.L.; supervision, Y.H.; project administration, Y.H.; funding acquisition, Y.H. All authors have read and agreed to the published version of the manuscript.

Funding

This study was funded by the National Natural Science Foundation of China (grant number: 52078005).

Data Availability Statement

Not applicable.

Acknowledgments

Thank you Beijing Z&J Fabric Architecture Technology Co., Ltd. and Beijing Jinshengjie Membrane Structure Technology Co., Ltd. for providing membrane samples for the friction coefficient test.

Conflicts of Interest

The authors declare that they do not have any commercial or associative interests that represents a conflict of interest in connection with the work submitted.

References

  1. Wang, X.; Luo, J.; Jiang, B.; He, Y. Optimization analysis of cable membrane contact under wind-induced vibration response of air-supported membrane structure. Shanxi Archit. 2022, 48, 5. [Google Scholar]
  2. Zhao, Y. Analysis of Air-Supported Membrane Structure Based on Cable Membrane Contact Cooperative Work. Master’s Thesis, Beijing University of Technology, Beijing, China, 2021. [Google Scholar]
  3. Wood, J.; Breuer, M.; De Nayer, G. Experimental studies on the instantaneous fluid–structure interaction of an air-inflated flexible membrane in turbulent flow. J. Fluids Struct. 2018, 80, 405–440. [Google Scholar] [CrossRef] [Green Version]
  4. Shen, S.; Wu, Y. Research progress on fluid-solid interaction effect of wind induced vibration response of membrane strcture. J. Archit. Civ. Eng. 2006, 23, 1–9. [Google Scholar]
  5. Yokosuka, Y.; Honma, T. Form-finding of cable-reinforced membrane structures formalized by discrete differential form. J. Struct. Constr. Eng. 2018, 83, 1801–1809. [Google Scholar] [CrossRef]
  6. Luo, J.; Han, D. 3D wind-induced response analysis of a cable-membrane structure. J. Zhejiang Univ. Sci. A 2009, 10, 337–344. [Google Scholar] [CrossRef]
  7. Zhou, X.; Han, Z.; Gu, M.; Zhang, A.-A.; Zhang, W.; Fang, W. Research on wind-induced responses of a large-scale membrane structure. Earthq. Eng. Eng. Vib. 2013, 12, 297–305. [Google Scholar] [CrossRef]
  8. Zhang, L.; Chen, W.; Dong, S. Natural vibration and wind-induced response analysis of the non-fully symmetric Geiger cable dome. J. Vibroeng. 2014, 16, 31–41. [Google Scholar]
  9. Sun, G.; Wu, M.; He, Y.; Xue, S.; Zhan, P. Influence of a stiffening cable net on performance of large-span air-supported membrane Structure. J. Tianjin Univ. Sci. Technol. 2019, 52, 54–59. [Google Scholar]
  10. Tsuchiya, M.; Oda, K.; Tachibana, E. Finite element analysis of cable reinforced membrane structures with the use of bendable-element. Shell and Spatial Structures from Models to Realization. In Proceedings of the IASS Annual Symposium 1997, Singapore, 10–13 November 1997. [Google Scholar]
  11. Lshii, K. Form finding analysis in consideration of cutting patterns of membrane structures. Int. J. Space Struct. 1999, 14, 105–119. [Google Scholar]
  12. Song, C. Analysis of tensioned membrane structures considering cable sliding. J. Zhejiang Univ. Sci. 2003, 4, 672–682. [Google Scholar] [CrossRef] [PubMed]
  13. Li, X.; Zhou, H.; Wang, C. Cable-membrane contact analysis of air-supported membrane structures in the initial form. Spat. Struct. 2014, 20, 48–55+74. [Google Scholar]
  14. Wang, C.; Zhou, H.; Li, X. Cable-membrane contact analysis of air-supported membrane structure under wind loads. Spec. Struct. 2014, 31, 38–43. [Google Scholar]
  15. Wang, Z. Deformation Control and Load Analysis of Cable-Membrane Inflatable Tube. Master’s Thesis, Harbin Institute of Technology, Harbin, China, 2017. [Google Scholar]
  16. Liu, C.; Tian, Q.; Yan, D.; Hu, H. Dynamic analysis of membrane systems undergoing overall motions, large deformations and wrinkles via thin shell elements of ANCF. Comput. Methods Appl. Mech. Eng. 2013, 258, 81–95. [Google Scholar] [CrossRef]
  17. Sautter, K.; Hofmann, H.; Wendeler, C.; Angel, M. Finite element models to simulate lightweight Rockfall protection structures. In Proceedings of the Structural Membranes 2021—10th International Conference on Textile Composites and Inflatable Structures, Online, 13–15 September 2021. [Google Scholar]
  18. Zhao, Y.; He, Y. Influence of cable and membrane contact on wind-induced response of air-supported membrane structures. J. Build. Struct. 2021, 43, 31–40. [Google Scholar]
  19. He, Y.; Zhu, M.; Zhao, Y.; Li, Y. Influence of different cable-membrane connection models on wind-induced responses of an air supported membrane structure with orthogonal cable net. Thin Walled Struct. 2022, 180, 109840. [Google Scholar] [CrossRef]
  20. Li, Z.; Zhang, Y.; Zhang, Y.; Xiang, Y. Experimental study on friction coefficients between membranes and cables. Build. Struct. 2010, 40, 107–110. [Google Scholar]
  21. GB/T 10006-2021; Plastics—Film and Sheeting—Determination of the Coefficients of Friction. State Administration for Market Regulation, Standardization Administration of the R.P.C.: Beijing, China, 2021.
  22. Wang, J. Research on Contact and Friction in Space Structure. Ph.D. Thesis, Tongji University, Shanghai, China, 2003. [Google Scholar]
  23. Zhou, Z.; Xu, G.; Huang, G. Analysis of contact problems in cable supported structures. In Proceedings of the 9th National Conference on Spatial Structures OCT, Hangzhou, China, 13 September 2000. [Google Scholar]
  24. Quan, Y. Engineering Tribology; Zhejiang University Press: Zhejiang, China, 1994. [Google Scholar]
  25. Wen, S. Principles of Tribology; Tsinghua University Press: Beijing, China, 1990. [Google Scholar]
  26. Wang, X.; Li, Y.; Xu, H. ANSYS Structural Analysis Unit and Its Application; People’s Communications Press: Beijing, China, 2011. [Google Scholar]
  27. Wang, X. Structural Dynamicanalysis and Application with ANSYS.; People’s Communications Press: Beijing, China, 2014. [Google Scholar]
  28. GB 50009; Load Code for the Design of Building Structures. China Association for Engineering Construction Standardization: Beijing, China; China Architecture & Building Press: Beijing, China, 2012.
  29. CECS 158; Technical Specification for Membrane Structures—2015. Association for Spatial Structures, China Steel Construction Society: Beijing, China; China Planning Press: Beijing, China, 2016.
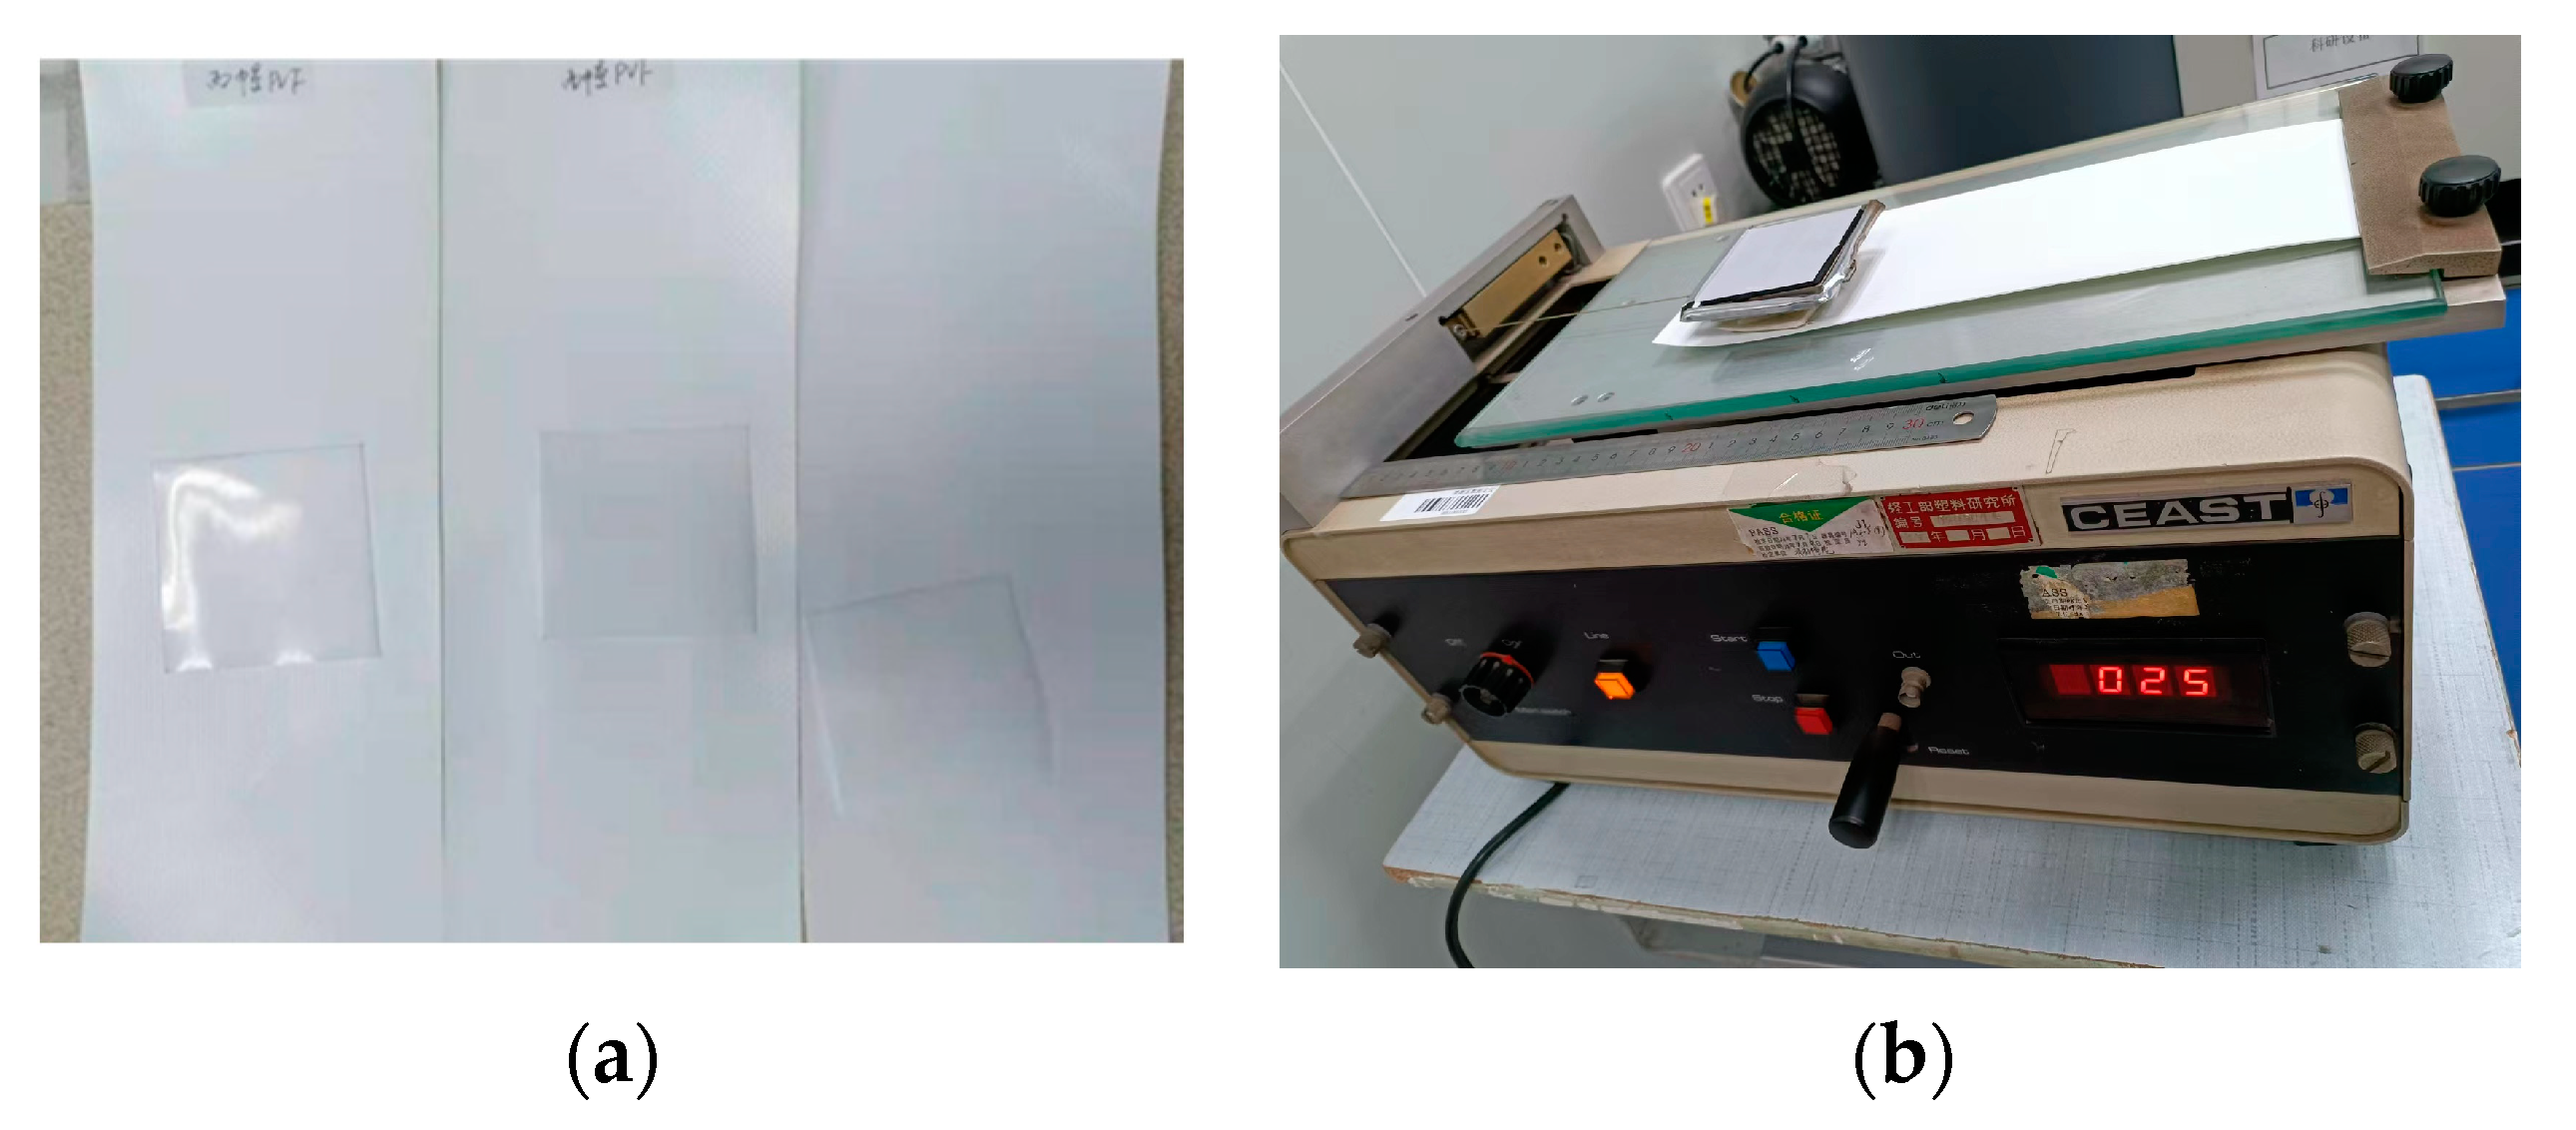
Figure 1. Coefficient of friction test between cable and membrane materials: (a) Membrane materials; (b) Test instrument.
Buildings 13 00649 g001
Figure 2. Schematic diagram of cable net layout.
Buildings 13 00649 g002
Figure 3. Three-dimensional layered display of contact model with an oblique cable net.
Buildings 13 00649 g003
Figure 4. Cloud chart of membrane surface displacement (unit: m): (a) μ = 0.2; (b) μ = 0.44; (c) μ = 0.68; and (d) μ = ∞*.
Buildings 13 00649 g004
Figure 5. Stress cloud chart of membrane surface of initial form (unit: Pa): (a) μ = 0.2; (b) μ = 0.44; (c) μ = 0.68; and (d) μ = ∞*.
Buildings 13 00649 g005
Figure 6. Cloud chart of cable net axial force (unit: N): (a) μ = 0.2; (b) μ = 0.44; (c) μ = 0.68; and (d) μ = μ = ∞*.
Buildings 13 00649 g006
Figure 7. Average wind pressure coefficient of film surface at an 180° wind angle.
Buildings 13 00649 g007
Figure 8. Cloud chart of x-component membrane surface displacement (unit: m): (a) μ = 0.2; (b) μ = 0.44; (c) μ = 0.68; and (d) μ = ∞*.
Buildings 13 00649 g008aBuildings 13 00649 g008b
Figure 9. Cloud chart of y-component membrane surface displacement (unit: m): (a) μ = 0.2; (b) μ = 0.44; (c) μ = 0.68; and (d) μ = ∞*.
Buildings 13 00649 g009
Figure 10. Cloud chart of z-component membrane surface displacement (unit: m): (a) μ = 0.2; (b) μ = 0.44; (c) μ = 0.68; and (d) μ = ∞*.
Buildings 13 00649 g010
Figure 11. Stress cloud chart of membrane surface under equivalent static wind load action (unit: Pa): (a) μ = 0.2; (b) μ = 0.44; (c) μ = 0.68; and (d) μ = ∞*.
Buildings 13 00649 g011
Figure 12. Cloud chart of cable net axial force (unit: N): (a) μ = 0.2; (b) μ = 0.44; (c) μ = 0.68; and (d) μ = ∞*.
Buildings 13 00649 g012
Figure 13. Histogram of axis force of cable element.
Buildings 13 00649 g013
Figure 14. The separated region, slip region, and contact region of cable and membrane under different friction coefficients: (a) μ = 0.2; (b) μ = 0.44; and (c) μ = 0.68.
Buildings 13 00649 g014
Table 1. Friction coefficient of different membrane materials.
Membrane MaterialsStatic Friction CoefficientDynamic Friction Coefficient
America Seaman BRITE membrane material Tedlar® PVF0.270.24
Duraskin PVDF69150.360.28
Kebao PVDF0.480.36
Huifeng 250PVDF0.600.44
Huifeng 450PVDF0.530.44
Xingyida PVDF0.530.44
Hongtai PVDF0.730.65
Tianjinlong PVDF0.730.71
Disclaimer/Publisher’s Note: The statements, opinions and data contained in all publications are solely those of the individual author(s) and contributor(s) and not of MDPI and/or the editor(s). MDPI and/or the editor(s) disclaim responsibility for any injury to people or property resulting from any ideas, methods, instructions or products referred to in the content.